Embed Size (px)
Citation preview

EFFECT OF COOLING RATES ON MINERALIZATION IN
PORTLAND CEMENT CLINKER
A THESIS IN Environmental and Urban Geosciences
Presented to the faculty of the University of Missouri-Kansas City in partial fulfillment of
the requirements for the degree
MASTER OF SCIENCE
by ROBERT A BULLARD
B.S., University of Missouri-Columbia, 2004
Kansas City, Missouri 2015

iii
EFFECT OF COOLING RATES ON MINERALIZATION IN
PORTLAND CEMENT CLINKER
Robert Alan Bullard, Candidate for the Master of Science Degree
University of Missouri-Kansas City, 2015
ABSTRACT
The rate at which cement clinker is cooled as it exits the kiln has long been
known to be an important factor in cement quality. Cooling rate is one of the
variables that has a significant impact on the minerals produced during the cement
making process. The goal of the industry has been to produce cement clinker
containing minerals that are highly reactive with water. Highly reactive clinker
minerals will equate to improved mortar strength and faster set times than clinker
with minerals that have a lower level of reactivity.
This study analyzed five cooling rates of Portland cement clinker produced in
a laboratory. Characteristics of clinker minerals were then analyzed with an emphasis
on silicate minerals, alite and belite. The fastest cooled sample was determined to be
the best quality sample in terms of hydraulic reactivity. Alites and belites in this
sample exhibited good crystal form. The belite minerals from this sample had higher
levels of foreign ions which yielded more highly reactive belite polymorphs. This

iv
sample had less periclase than other samples and small, more amorphous aluminate
and ferrite crystals.
With progressively slower cooling rates, less hydraulically reactive silicate
minerals with increasingly poor crystal form were observed. Periclase content
increased in slower cooled samples and aluminate and ferrite crystals were
progressively larger.
v
APPROVAL PAGE
The faculty listed below, appointed by the Dean of the College of Arts and
Sciences have examined a thesis titled “Effect of Cooling Rates on Mineralization in
Portland Cement Clinker,” presented by Robert Bullard, candidate for the Master of
Science degree, and certify that in their opinion it is worthy of acceptance.
Supervisory Committee
James B. Murowchick, Ph.D., Committee Chair Department of Geosciences
Jejung Lee, Ph.D. Department of Geosciences
John Kevern, Ph.D. Department of Engineering
vi
TABLE OF CONTENTS
ABSTRACT……………………………………………………………………….…iii
LIST OF ILLUSTRATIONS……………………………………………………..…viii
LIST OF TABLES……………………………………………………………………xi
ACKNOWLEDGEMENTS………………………………………………………….xii
Chapter
1. INTRODUCTION…………………………………………………………………1
Background……………………………………………………………………1
Burning Process……………………………………………………………….3
Clinker Minerals………………………………………………………………7
Hydration and Reactivity…………………………………………………….12
Cement Types………………………………………………………………..14
Project Overview…………………………………………………………….15
2. PREVIOUS WORK………………………………………………………………16
History of Cement Study…………………………………………………….16
Cooling Rates……………………………………………………………...…17
3. METHODS……………………………………………………………………….20
Clinker Production………………………………………………………...…20
Polished Sections…………………………………………………………….23
Reflected Light Microscopy…………………………………………………25
Phase Identification………………………………………………………..…26
Chemical Composition……………………………………………………….27
vii
Ono Method……………………………………………………………...…..29
Scanning Electron Microscopy………………………………………………32
4. RESULTS AND DISCUSSION..……………………………………………...…34
Chemical Composition……………………………………………………….34
Phase Identification………………………………………………………..…35
Mineral Characteristics………………………………………………………42
Ono Method………………………………………………………………….49
Mineral Analysis by SEM……………………………………………………53
5. CONCLUSION………………………………………………………………...…66
Appendix
A. XRF DATA…..……………………………………………………………….....69
B. ONO METHOD DATA…..……………………………………………………..75
REFERENCES……………………………………………………………………...77
VITA……………………………………………………………………………...…80

viii
LIST OF ILLUSTRATIONS
Figure Page
1. Clinker Mineral Constituents……………………………………………………..2
2. Kiln Diagram and Material Phase Changes………………………………………5
3. Clinkering Process………………………………………………………………..6
4. R Polymorph of Alite……………………………………………………………..9
5. Belite Polymorphs……………………………………………………………….11
6. Clinker Cooling Rates………………………………………………………...…22
7. Clinker Balls Before and After Burning in a Muffle Furnace…………………..23
8. Polished Section Pucks………………………………………………………….25
9. Pressed Powder Pills…………………………………………………………….29
10. Diffractogram of Kiln Feed……………………………………………………..37
11. Diffractogram Overlay of Clinker Samples………...………………………...…38
12. Diffractogram Overlay of Clinker Samples Showing an Aluminate and a Ferrite
Peak…………………………………………………………………………...…39
13. Diffractogram Overlay of Clinker Samples Showing a Ferrite Peak………...…39
14. Diffractogram Overlay of Clinker Samples Showing an Alite Peak…………....40
15. Diffractogram Overlay of Clinker Samples Showing two Alite Peaks………...40
16. Diffractogram Overlay of Clinker Samples Showing a Periclase Peak…………41
17. Alite Crystals in Fast Cooled Clinker…………………………………………...42
18. Alite Crystals in Medium Cooled Clinker………….…………………………...42
ix
19. Alite Crystals in Slow Cooled Clinker……………...…………………………...43
20. Alite Crystals in Very Slow Cooled Clinker……………..……………………...43
21. Alite Crystals in Very, Very Cooled Clinker…………….……………………...44
22. Belite Crystals in Fast Cooled Clinker……...…………………………………...44
23. Belite Crystals in Medium Cooled Clinker……………………………………...45
24. Belite Crystals in Slow Cooled Clinker…………….…………………………...45
25. Belite Crystals in Very Slow Cooled Clinker…………………………………...46
26. Belite Crystals in Very, Very Slow Cooled Clinker……………..……………...46
27. Alite and Belite Sizes……………………………………………………………48
28. Silicate Minerals in Fast Cooled Clinker………………………………………..50
29. Silicate Minerals in Slow Cooled Clinker………………………………...…….51
30. Silicate Minerals in Very, Very Slow Cooled Clinker………………………….52
31. Photomicrograph of an Alite and a Belite from Fast Cooled Clinker Viewed with
SEM…………………………………………………………………………..…54
32. Photomicrograph of an Alite and a Belite from Slow Cooled Clinker Viewed
with SEM………………………………………………………………………..55
33. Photomicrograph of an Alite and a Belite from Very, Very Slow Cooled Clinker
Viewed with SEM………………………………………………..…………...…56
34. Elemental Spectrogram of Alites in Fast Cooled Clinker………………….……57
35. Elemental Spectrogram of Belites in Fast Cooled Clinker………………….…..58
36. Elemental Spectrogram of Alites in Slow Cooled Clinker……………...………59
37. Elemental Spectrogram of Belites in Slow Cooled Clinker………………….….60
x
38. Elemental Spectrogram of Alites in Very, Very Slow Cooled Clinker…....……61
39. Elemental Spectrogram of Belites in Very, Very Slow Cooled Clinker…...……62
40. Average Inclusions of Mg, Al, and Fe in Alites……………………………...…63
41. Average Quantities of Mg, K, Na, Cr, Al, Mn, P, Fe and S in Belites………….65
xi
LIST OF TABLES
Table Page
1. Clinker Mineral’s Chemical Compositions…...………………………………….3
2. Typical Raw Material Chemical Compositions…………………………………..4
3. Burning Condition and Microscopical Character of Alite and Belite………...…32
4. CO2 Contents……………………………………………………………………34
5. Chemical Composition of Kiln Feed and Clinker Samples…………………..…35
6. Ono Method Results…………………………………………………………….49
7. Weight Percentage of Elements in Alites in Fast Cooled Clinker………………57
8. Weight Percentage of Elements in Belites in Fast Cooled Clinker…………..…58
9. Weight Percentage of Elements in Alites in Slow Cooled Clinker………..……59
10. Weight Percentage of Elements in Belites in Slow Cooled Clinker…………….60
11. Weight Percentage of Elements in Alites in Very, Very Slow Cooled Clinker...61
12. Weight Percentage of Elements in Belites in Very, Very Slow Cooled Clinker..62
13. Total Foreign Ions Alites……………………………………………………..…63
14. Total Average Foreign Ions in Belites by Weight %……..……………………..64

xii
ACKNOWLEDGEMENTS
I would like to thank Ash Grove Cement Company for providing the
opportunity to do this project. Without the materials, laboratory access and training
provided by Ash Grove, this project would not have been possible. A special thanks
to Greg Barger, Kristen Freeman and Steve Lane for the training and assistance they
provided. I would also like to thank all the members of my supervisory committee
for their guidance and input through this process.
1
CHAPTER 1
INTRODUCTION
Background
Concrete has been used in construction since the days of early civilization and
is the most abundantly used construction material in the world today. Concrete,
simply defined, is a mix of paste and aggregates. Aggregates consist of both coarse
and fine particles such as sand, gravel and crushed stone. By far, the most common
type of concrete paste used today is Portland cement. When water is added to
Portland cement it goes through a chemical reaction called hydration and forms the
rock-like substance that is used in construction of roads, bridges and buildings
(Kosmatka et al., 2002).
The process of making Portland cement varies some depending on location,
but the basic process includes burning materials like limestone, shale, clay, and iron
ore. This causes a chemical reaction in which some chemical constituents are driven
off in the form of gas and the remaining ones combine to form a new substance called
clinker. Clinker is crushed into a fine powder and usually mixed with gypsum.
Gypsum acts as an early set retarder. This combination forms Portland cement (St
John et al, 1998).
The raw materials that are used in the cement making process are mostly
quarried, typically near the site of the cement plant. Raw materials are crushed into a
fine powder called kiln feed. Kiln feed is fed into a preheater tower and works its
2
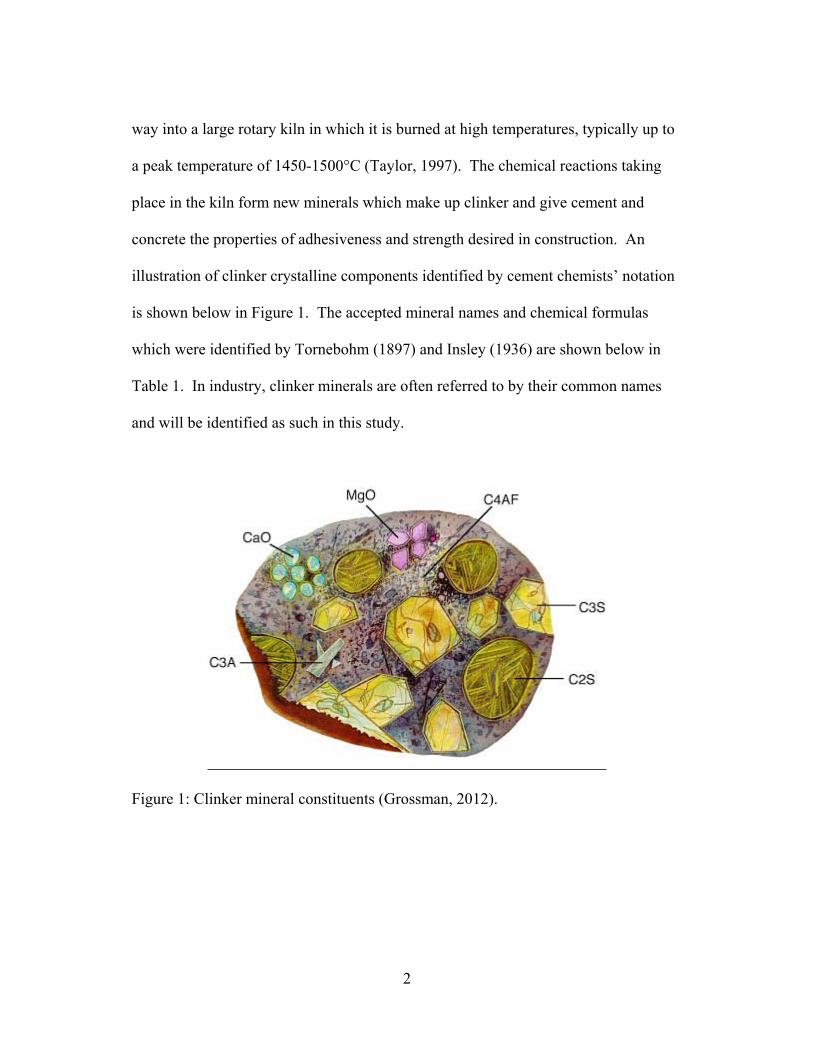
way into a large rotary kiln in which it is burned at high temperatures, typically up to
a peak temperature of 1450-1500°C (Taylor, 1997). The chemical reactions taking
place in the kiln form new minerals which make up clinker and give cement and
concrete the properties of adhesiveness and strength desired in construction. An
illustration of clinker crystalline components identified by cement chemists’ notation
is shown below in Figure 1. The accepted mineral names and chemical formulas
which were identified by Tornebohm (1897) and Insley (1936) are shown below in
Table 1. In industry, clinker minerals are often referred to by their common names
and will be identified as such in this study.
Figure 1: Clinker mineral constituents (Grossman, 2012).

3
Table 1: Clinker mineral chemical composition
Common Name Cement Chemist Notation Chemical Formula
Alite C3S Ca3SiO5
Belite C2S Ca2SiO4
Aluminate C3A 3CaO•Al2O3
Ferrite C4AF 4CaO•Al2O3•Fe2O3
Periclase MgO MgO
Free Lime CaO CaO
Burning Process
A rotary cement kiln is designed to move kiln feed from a preheater tower
through the burning process at a specific temperature and for a specific amount of
time to produce an optimal product. Kiln feed is mixed by the kiln rotation and
transitions into a partial melt during this process. The kiln feed undergoes a chemical
reaction which will change the constituent mineralogy into that represented in the
illustration in Figure 1 above. A breakdown of typical chemical composition is
shown below in Table 2.
4
Table 2: Typical raw material chemical composition (Peray and Waddell, 1972).
Primary Source Materials Chemical Composition % by Mass of Kiln Feed
Limestone, Chalk CaO 66%
Sand SiO2 23%
Shale, Clay Al2O3 5%
Iron Ore, Mill Scale Fe2O3 3%
Slag MgO 2%
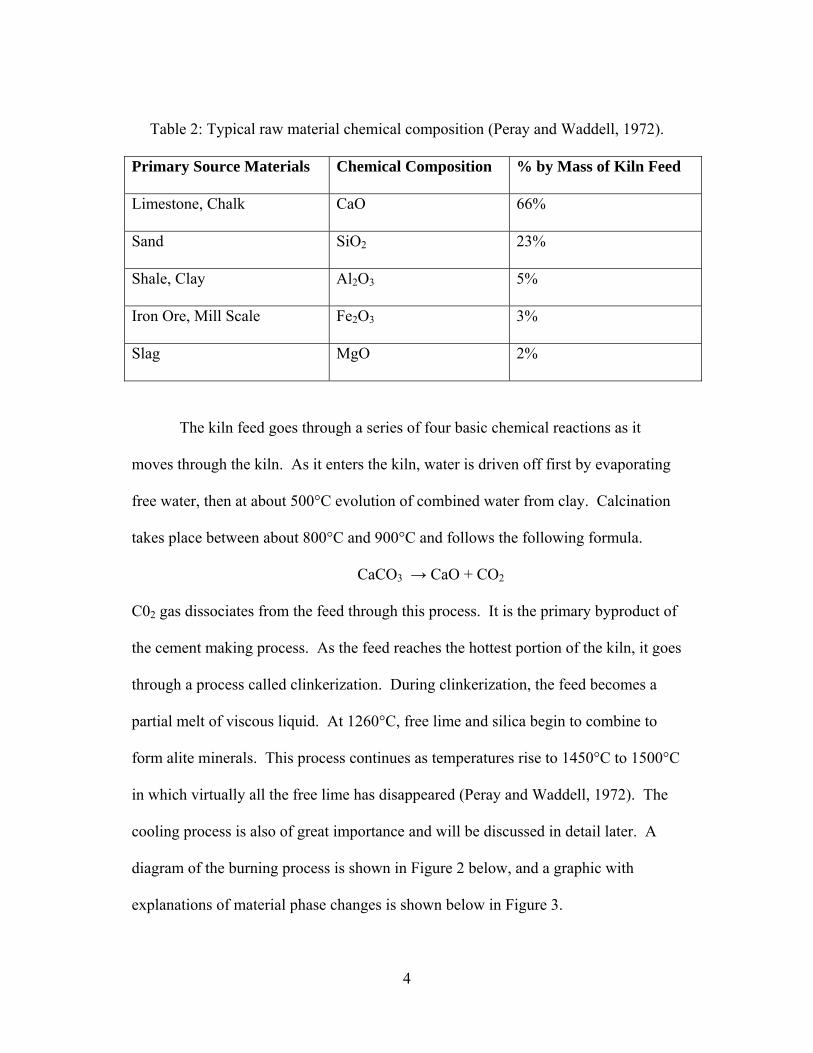
The kiln feed goes through a series of four basic chemical reactions as it
moves through the kiln. As it enters the kiln, water is driven off first by evaporating
free water, then at about 500°C evolution of combined water from clay. Calcination
takes place between about 800°C and 900°C and follows the following formula.
CaCO3 → CaO + CO2
C02 gas dissociates from the feed through this process. It is the primary byproduct of
the cement making process. As the feed reaches the hottest portion of the kiln, it goes
through a process called clinkerization. During clinkerization, the feed becomes a
partial melt of viscous liquid. At 1260°C, free lime and silica begin to combine to
form alite minerals. This process continues as temperatures rise to 1450°C to 1500°C
in which virtually all the free lime has disappeared (Peray and Waddell, 1972). The
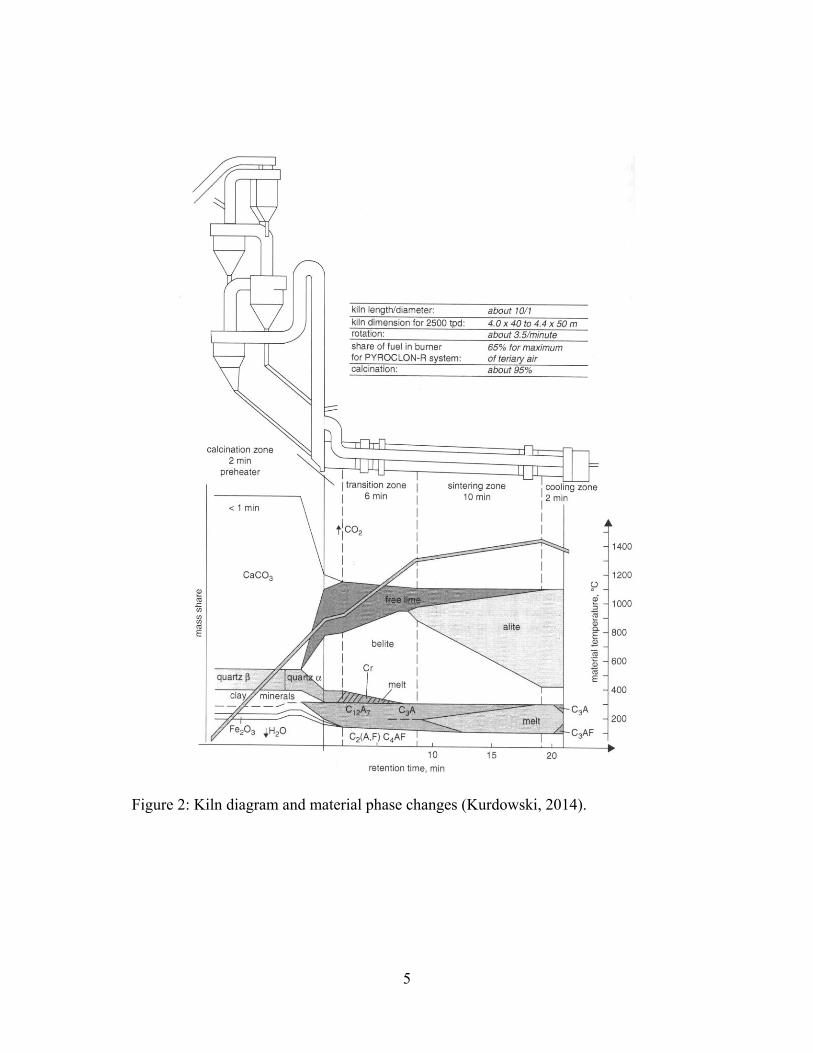
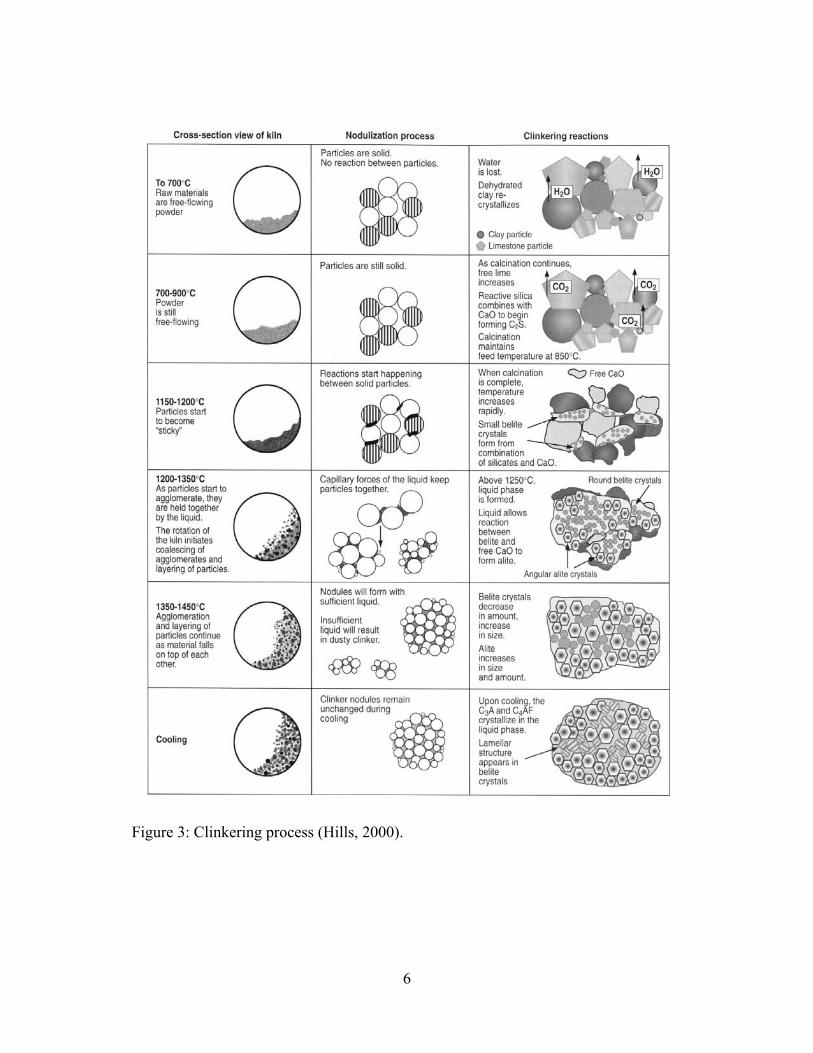
cooling process is also of great importance and will be discussed in detail later. A
diagram of the burning process is shown in Figure 2 below, and a graphic with
explanations of material phase changes is shown below in Figure 3.
5
Figure 2: Kiln diagram and material phase changes (Kurdowski, 2014).
6
Figure 3: Clinkering process (Hills, 2000).

7
Clinker Minerals
The approximate bulk mineral composition of typical clinker is: 50-70% alite,
15-30% belite, 5-10% aluminate, 5-15% ferrite, 2% free lime, 2% periclase (Taylor,
1997). Aluminate and ferrite form a matrix in which the silicate minerals reside.
These matrix minerals both react with water but do not contribute much to strength
properties. Free lime and periclase expand in the presence of water and can have a
negative impact on cement strength if present in too high a quantity due to destructive
expansion. Consequently, efforts are made to keep both of these at less than 2%.
Some industrial clinkers contain no periclase. Quantities of free lime in industrial
clinker can vary quite a bit depending on kiln conditions. Silicate minerals (alite and
belite) are the most important of the clinker phases because they provide the strength
properties of cement and they comprise approximately 80% of the bulk composition
of typical clinker (Taylor, 1997). This study will primarily be focused on alite and
belite phases.
Alite
Alite is a solid solution series of tricalcium silicate, Ca3SiO5 in its pure form.
It undergoes a series of reversible phase transitions as it is heated. Alite polymorphs
include triclinic, monoclinic and rhombohedral forms. Production clinkers are
usually a monoclinic form (Taylor, 1997). Chemical substitutions can take place in
alite up to about 4% total. Mg can replace Ca up to 2%. Si or Ca can be replaced by
Fe or Al, up to 1.0% and 1.1% respectively. These substitutions take place at higher
8
temperatures and can stabilize the higher temperature polymorphs causing them to
persist on cooling to room temperature (Hahn et al, 1969).
Alite crystalizes in the melt between 1200°C and 1450°C. Forming at higher
temperatures than belite, it crystalizes later in the burning process by converting
belite into alite (Hills, 2000). Birefringence of alite typically ranges between 0.002
and 0.010, which is an indication of ionic substitution and burning temperature (Ono
et al, 1968). Crystals are euhedral and six-sided, often showing up as perfect
hexagons in cross section depending on the angle of the cut. Twinning is very rare,
making crystals easily distinguishable from other crystal forms in clinker (Campbell,
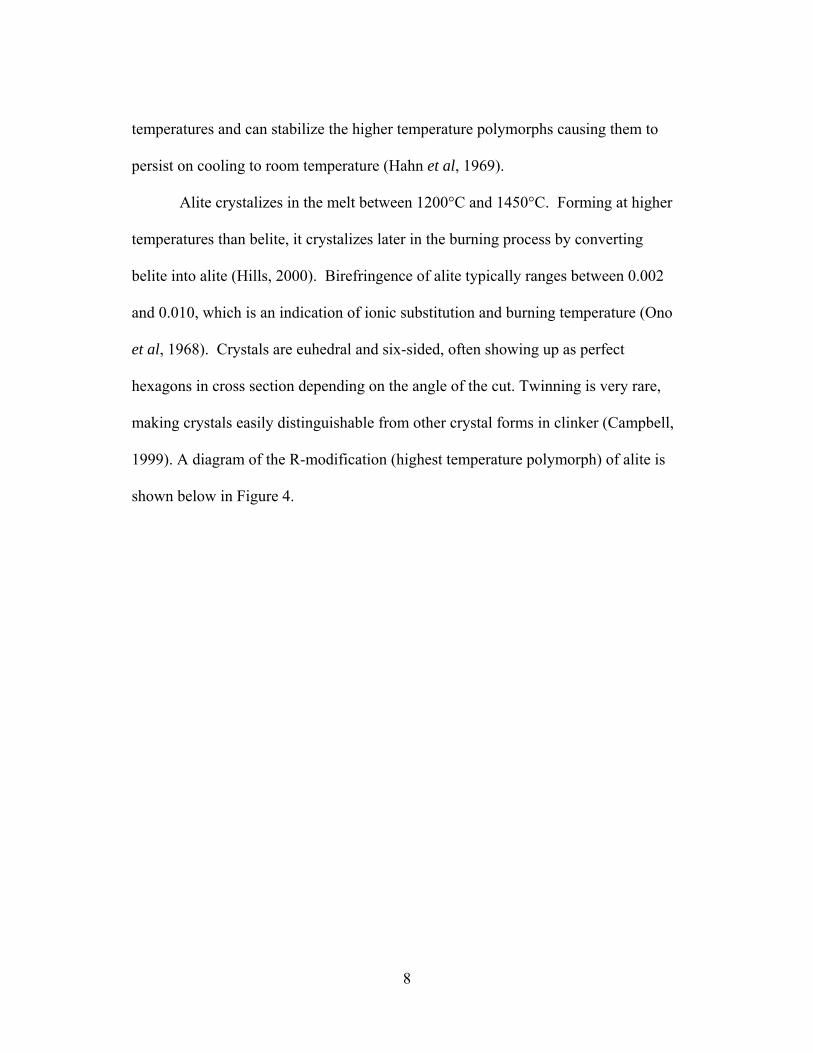
1999). A diagram of the R-modification (highest temperature polymorph) of alite is
shown below in Figure 4.
9
Figure 4: Crystal structure of the R polymorph of alite (Taylor, 1997). Calcium
atoms are shown as large open circles, Silicon atoms as small open circles, oxygen
tetrahedral as triangles and oxide ions as the large hatched circle (Taylor, 1997).
Heights of atoms are in thousandths of the cell height (c=2.5586nm).
10
Belite
Belite is a solid solution series of dicalcium silicate, Ca2SiO4 in its pure form.
It typically makes up 15%-30% of industrial clinker. Substitutions in belite can be up
to 6% and can include Mg, K, Na, Ba, Cr, Al, Mn, P, Fe and S (Ghosh, 1983). Belite
crystals are usually round to amoeboidal with a distinct intersecting lamellar structure
in part due to twinning (Yamaguchi and Takagi, 1968).
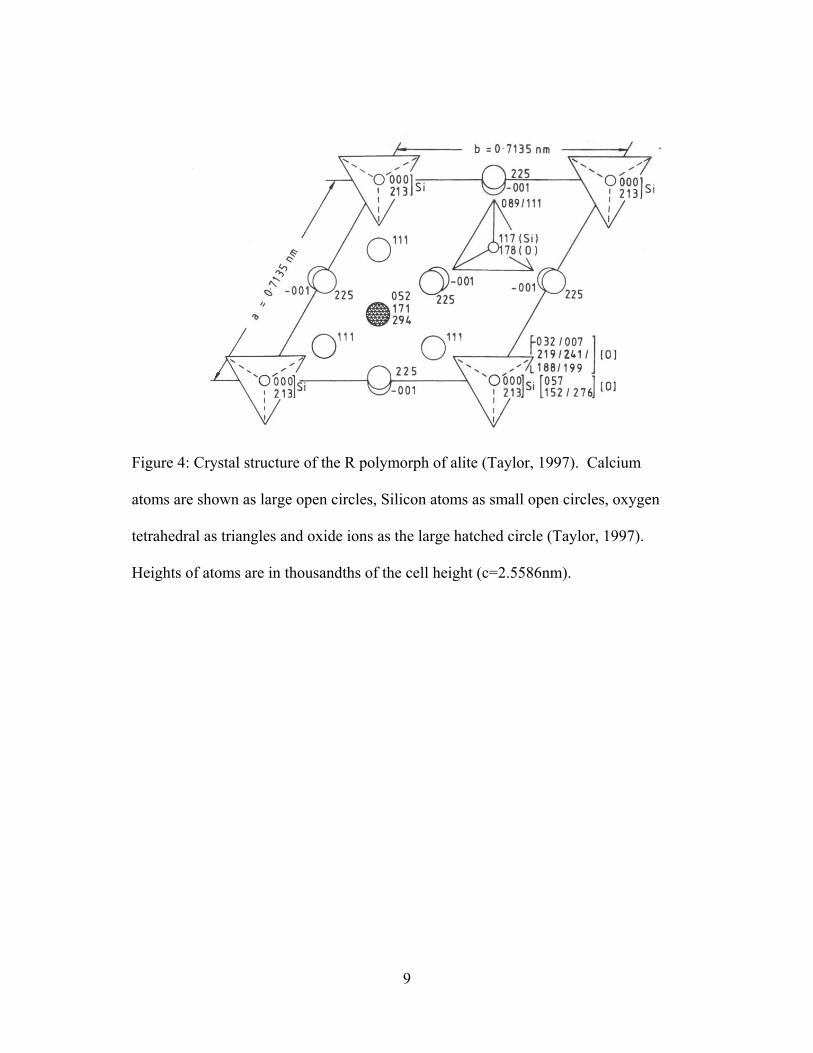
Four main types of belite polymorphs exist which are shown in Figure 5
below. Belite transitions through the polymorphs as it gets heated and cooled in the
following order. γ belite is the most stable polymorph and it forms around 830°C.
As it gets hotter, it transitions to β, α’and finally α at around 1425°C. These phases
are reversible and as clinker cools, belite reverts back to cooler forms. Substituting
ions can, however, stabilize the higher temperature α’ polymorph, though this is not
common. The atomic rearrangement to transition from β to γ is a more significant
change than the transition between other polymorphs. As such, upon cooling, most
belite in industrial clinker remains in the β form (Taylor, 1997). β belite is metastable
below 670° and monoclinic, with pronounced polysynthetic twinning (Chromy,
1970).
As shown in Figure 5 below, polymorph structures are built around Ca and
SiO4 ions. Structures in the α, α’, and β forms are similar. The γ form, however is
significantly different. γ belite is orthorhombic and often is not polysynthetically
twinned. It is stable at cooler temperatures and commonly has a splintery fracture
and microstructure (Campbell, 1999).
11
Figure 5: Crystal structure of belite polymorphs (Taylor, 1997). Large open circles
are Ca atoms, small closed circles are Si atoms, and triangles are tetrahedral of O
atoms. Heights of atoms are shown as hundredths of cell height (Taylor, 1997).
12
Hydration and Reactivity
In chemistry terms, a hydrate is a new compound formed by the reaction of an
anhydrous compound with water. In Portland cement, hydration is a complex series
of individual chemical reactions. Most of these reactions are exothermic which
allows the level of reactivity to be measured by the heat of hydration. Cement
hydration depends on a number of factors. Among them are presence of foreign ions
within the crystalline lattices of individual clinker phases, water-cement ratio,
fineness of cement particles and curing temperature (Odler, 1998).
Aluminates (C3A) react the most quickly with water forming an aluminate-
rich gel. This will then crystallize to form small crystals of ettringite. As alite comes
in contact with water, calcium, oxygen and silicate ions on the mineral surface
dissolve into solution. Alite reacts to form calcium silicate hydrate and calcium
hydroxide (or portlandite). Calcium silicate hydrate (C-S-H) does not have a set
Ca/Si ratio; it can vary dependent on chemical composition and the presence of
additives such as fly ash (Winter, 2012). C-S-H forms as needles as the liquid
solution becomes super-saturated with calcium ions. Cement begins to stiffen and set
as C-S-H fibers begin to mesh with other solids such as crystalline calcium
hydroxide. Formation of C-S-H gives off heat and accelerates other hydration
reactions. Cement gets its strength primarily from C-S-H which typically makes up
about 50% of hydrated Portland cement by mass. A simplified version of the
chemical reaction of alite with water is as follows (Kosmatka et al, 2002).
13
2 (3CaO•SiO2) + 11 H2O → 3CaO•2SiO2•8H2O + 3 (CaO•H2O) (alite) (water) (C-S-H) (calcium hydroxide) Hydration of alite happens quickly and is responsible for early cement
strength. About 70% of alite reacts within 28 days and virtually all of it reacts within
one year, assuming a proper water/cement ratio is used. Belite undergoes a similar
reaction forming the same hydration products. However, it produces less calcium
hydroxide and it reacts much slower. About 30% reacts within 28 days and about
90% within one year. Belite is responsible for late cement strength (Taylor, 1997). A
simplified version of belite hydration reaction is shown below (Kosmatka et al,
2002).
2 (2CaO•SiO2) + 9 H2O → 3CaO•2SiO2•8H2O + (CaO•H2O) (belite) (water) (C-S-H) (calcium hydroxide) Different polymorphs of belite have notably different levels of reactivity. The
highest temperature forms, α and α’, are only stable at ambient temperature if doped
with foreign ions. These are believed to be the most reactive with the α form being
slightly less reactive than α’ (Odler, 1998). As mentioned previously, β belite is the
most common in industrial clinker and generally would be less reactive than the α
form. Belite reactivity, however, varies based on factors such as doping ions and
grinding fineness. γ belite is virtually non-reactive with water at ambient temperature
(Bye, 1983).
Alite is generally much more hydraulically reactive than belite, regardless of
the polymorphic variety. Alite reactivity depends on a few factors. Crystal size plays
a role, as small crystals will react completely in the early stages of hydration. Small

14
crystals are ideal for good early cement strength. Alite crystal shape is another factor,
with sharp, “clean” edges being optimal (Taylor, 1997). As previously mentioned,
impurities in alite can preserve high temperature polymorphs upon cooling. There is
some disagreement in the literature on the role this plays, but it appears that a
generally higher level of impurities will lead to a higher level of reactivity in alite.
According to Kurdowski (2014), inclusions of foreign ions can lead to quicker
hydration and higher mortar strength.
Cement Types
Five major types of Portland cement are defined by the American Society for
Testing and Materials (ASTM). Type I is a common general purpose cement that
does not require special properties. Type II Portland cement is designed to protect
against moderate sulfate attack. It contains no more than 8% tricalcium aluminate
(C3A). Sulfates, which are common in moist soils and water in some areas, react with
aluminate causing expansion and cracking of concrete (Kosmatka et al, 2002). Type
III Portland cement is similar to type I but ground finer to speed up hydration and
improve early strength properties. Type IV is designed to minimize heat of hydration
reaction and is commonly used in very large concrete structures. Type V is designed
to resist severe sulfate attack by having less than 5% aluminate content (ASTM C
150). If a cement type meets the requirements for more than one type, it will be
labeled as such, for example, Type I/II. The cement type used for this study is a Type
I/II and any specifics in reference to the cement making process are in reference to a
Type I/II Portland cement.
15
Project Overview
As previously discussed, a high quality cement with good strength and
durability properties will have minerals that are highly reactive in the presence of
water. There are a number of variables that affect the quality and ultimately the
reactivity of minerals in clinker. Among these variables are the rate of temperature
increase in the kiln, the rate of cooling as clinker is exiting the kiln, the composition
of gaseous atmosphere in the kiln and the chemical composition of kiln feed
ingredients (Kurdowski, 2014). This current study is designed to study the effects of
cooling rates on the minerals within cement clinker. Clinker was produced in a lab
using raw kiln feed provided by a cement manufacturing plant. The lab techniques
used follow ASTM standards and industry accepted procedures.
Limitations exist for lab-produced clinker as compared to plant produced
clinker however. The primary limitation is the mixing action of the kiln versus using
a static muffle furnace for the burning process. The rotary kiln will produce more
homogenous clinker crystals than the clinker made in the lab in terms of size, shape
and distribution of crystals. The lab produced clinker should, however, provide a
good basis of comparison.
16
CHAPTER 2
PREVIOUS WORK
History of Cement Study
As cementitious materials have had important economic implications for
thousands of years, ways of studying and improving them have existed almost as long
as the materials themselves. Recent developments in technology and scientific
understanding, however, have allowed for a much more consistent product and a
much better understanding of cement chemistry and mineralogy. Some point to John
Smeaton as having completed the first scientific study of cement during the
construction of the Eddystone lighthouse in the 1750’s. He rediscovered hydraulic
lime as a concrete paste, a similar product to what the ancient Romans had used. He
also identified the compositional requirements needed to attain hydraulicity (St John
et al, 1998).
After the invention of the petrographic microscope in the 1850’s and
subsequent improvements to this technology, researchers realized the impact of
studying synthetic mineral materials, such as cement clinker. Using microscopy,
Henry Louis Le Chatelier, in 1882, identified tricalcium silicate as the principle
mineral constituent. Alfred Tornebohm (1897) followed up this work and identified
more mineral constituents of Portland cement. He named them alite, belite, celite and
an apparently isotropic residual phase. In 1915, Rankin and Wright published a phase

17
diagram of CaO-SiO2-Al2O3 which was a breakthrough for chemists in the
understanding of raw mix composition and temperatures in the production process of
Portland cement (Herfort et al, 2010). Insley (1936) furthered the understanding of
cement clinker phases. He identified the chemical constituents of the silicate phases
and differentiated belite polymorphs. He also observed that ‘celite’ was a calcium
aluminoferrite phase and the isotropic residue contains calcium aluminate and glass
(St John et al, 1998).
Cooling Rates
Cement strength qualities are correlated to the level of reactivity of clinker
minerals. As discussed, a number of variables during the cement making process will
have an effect on quality. One of the most important of these is rate of cooling (Ono,
1981). One of the earliest studies of cooling rate was by George Ward (1941). He
compared industrial clinker to lab produced clinker of various cooling rates and found
noticeably different mineral properties between the different samples. He noticed that
good alite crystal form progressively decreased with increased rates of cooling. For
belite, he pointed out that “simplicity of form, a general lack of inclusions and fewer
irregularities characterized the dicalcium silicate of quickly cooled clinkers” (Ward,
1941, p. 52).
Maki and Goto (1982) combined a variety of methods to study the
crystallization of alite. They identified factors influencing the substitution of ions in
to the crystal structure and factors affecting polymorphism. Among their findings
was the importance of cooling rates on alite structure. Rapid cooling (with sufficient
18
substituent ions) preserved the highly reactive M3 polymorph, whereas slow cooling
produced the less reactive M1 polymorph. An even less reactive T2 polymorph can
result from slow cooling if ion substitution is particularly low. According to Lea
(1972), rapid cooling will produce an overall increase in alite content under
equilibrium conditions. During slow cooling, alite surface decomposition happens,
resulting in very small belite crystallites forming on the surface. This belite
“fringing” is usually γ belite and is associated with a decrease in reactivity.
Maki (1994) studied the effects of polymorphism in belite and found that
varieties are a function of temperature, substitute ions and cooling rate. Slowly
cooled belite showed lamellar extensions, or “ragged edges” and small satellite belite
crystals. This forms from “partial melting and detachment of individual lamellae of
the original belite grain.” Polymorphic transitions of belite are a function of cooling
rate as well. Rapidly cooled belites can maintain the high energy α’ form while
slower cooled clinker contains mostly β form. The ability to maintain the highly
reactive α’ form at ambient temperature is also a function of impurities of the parent α
polymorph, especially the Al/Fe ratio (Campbell, 1999).
Other studies of cooling rates have indicated that the overall size of all clinker
crystals will be smaller with faster cooling. Smaller silicate crystals are optimal for
two reasons. First, the grindability of clinker is improved with smaller crystals which
improve the energy expenditure at a cement plant. Second, hydraulic reactivity is
improved with smaller crystals due to the increased surface area. Small aluminate
crystals are optimal as this will help with resistance to sulfate attack (Kohl, 1979).
19
Kohl (1979) showed a comparison of clinker cooling rates to physical cement
strength tests. Rapid to moderate cooling increased 28 day strength but had minimal
effects on seven day strengths. This is likely due to the importance of belite
characteristics in comparison to cooling rate and late age strength. Very slow cooling
was shown to decrease strength at all ages.
.
20
CHAPTER 3
METHODS
Clinker Production
Raw mixed kiln feed was provided by Ash Grove Cement Company for this
project. The kiln feed was prepared and mixed at the cement plant exactly as it
would be if it were going into standard production. The kiln feed consists of the
following: limestone, shale, sand, clay, mill scale and bottom ash. The bulk of the
kiln feed is limestone which makes up over 80% by mass. Kiln feed is milled at the
plant to approximately 90% passing a No. 200 sieve.
The plant kiln is powered by burning coal and, as such, coal ash gets in to the
feed in the kiln. Plant testing has found coal ash to be 0.68% by mass. Coal was
burned in the lab and added to the kiln feed later to replicate this. A thin layer of coal
was put into a platinum crucible and burned over a Bunsen burner on high for 15
minutes while stirring occasionally. The burned coal was then placed in a muffle
furnace at 950°C for 10 minutes. After cooling, coal ash was mixed into the raw kiln
feed in appropriate portions and mixed thoroughly.
Cohesive chunks of kiln feed that would later replicate pieces of clinker were
made using the following procedure (Alsop et al, 2007).
1. 180 g. of kiln feed (with coal ash already added to it) was weighed and
had 40 mL of deionized water added to it. This was mixed thoroughly and
produced a cohesive, workable mud.
21
2. The material was rolled into balls approximately 3/8 in. in diameter.
3. The kiln feed balls were placed in an oven at 100°C overnight to dry.
4. This process was repeated until about 50 of these kiln feed balls were
made in total.
Five different cooling rates were determined for study. As clinker is cooled,
mineralization happens within a window of a certain temperature range. There is still
some dispute over what the low end of that temperature window is or where
mineralization stops. Estimates range from about 1050°C to 1200°C. To be sure to
encompass the entire temperature window of mineralization, cooling rates were
measured between 1500°C to 950°C. By 950°C, all minerals in clinker would be
fixed.
According to available literature, temperatures in the burning zone of a kiln
typically range from about 1450°C to approximately 1600°C depending on the
specific operating conditions at a particular cement plant. 1500°C was chosen as the
peak burning temperature for this procedure as that is a common temperature for
laboratory procedures designed to simulate kiln conditions. Five separate runs of kiln
feed balls were put in a muffle furnace set at 1500°C for one hour then cooled at
different rates. The fastest-cooled clinker was removed from the muffle furnace and
immediately quenched at room temperature. This clinker cooled to a temperature of
950°C in less than one minute as measured using a high temperature hand held laser
infrared thermometer. Such a fast cooling rate is faster than cooling rates at a plant
but useful for a baseline of this project and for general scientific research purposes.
22
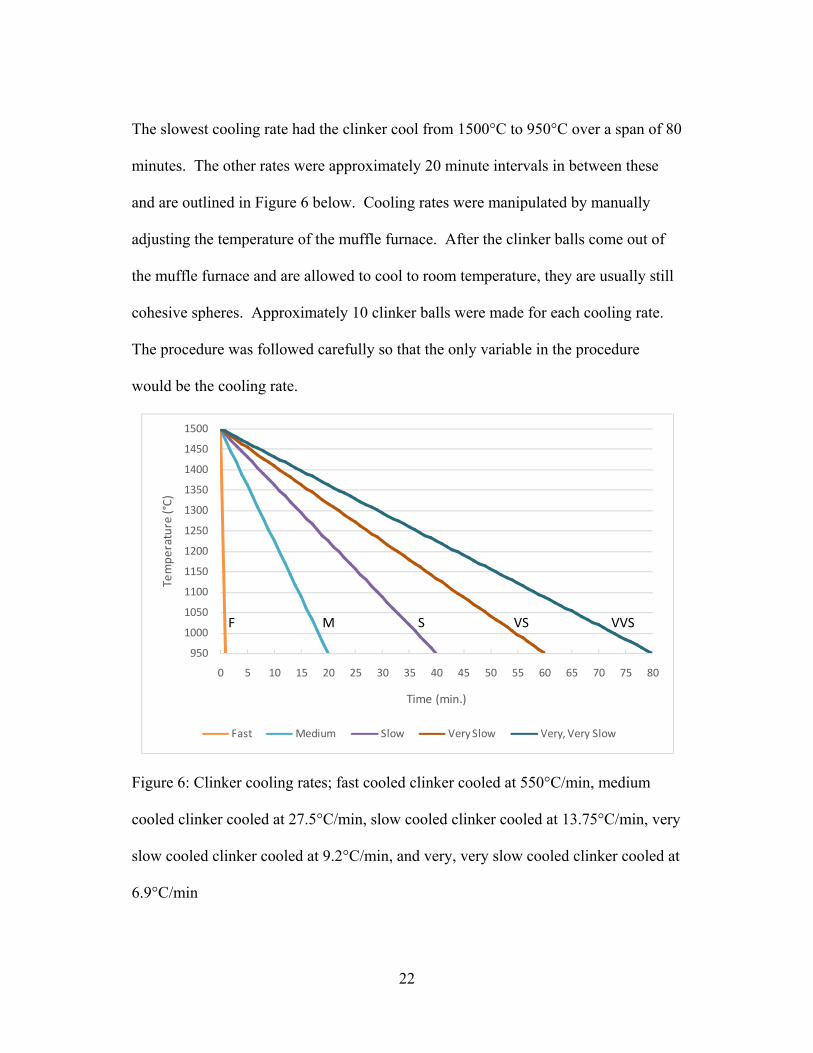
The slowest cooling rate had the clinker cool from 1500°C to 950°C over a span of 80
minutes. The other rates were approximately 20 minute intervals in between these
and are outlined in Figure 6 below. Cooling rates were manipulated by manually
adjusting the temperature of the muffle furnace. After the clinker balls come out of
the muffle furnace and are allowed to cool to room temperature, they are usually still
cohesive spheres. Approximately 10 clinker balls were made for each cooling rate.
The procedure was followed carefully so that the only variable in the procedure
would be the cooling rate.
Figure 6: Clinker cooling rates; fast cooled clinker cooled at 550°C/min, medium
cooled clinker cooled at 27.5°C/min, slow cooled clinker cooled at 13.75°C/min, very
slow cooled clinker cooled at 9.2°C/min, and very, very slow cooled clinker cooled at
6.9°C/min
950
1000
1050
1100
1150
1200
1250
1300
1350
1400
1450
1500
0 5 10 15 20 25 30 35 40 45 50 55 60 65 70 75 80
Temperature (°C)
Time (min.)
Fast Medium Slow Very Slow Very, Very Slow
F M S VS VVS
23
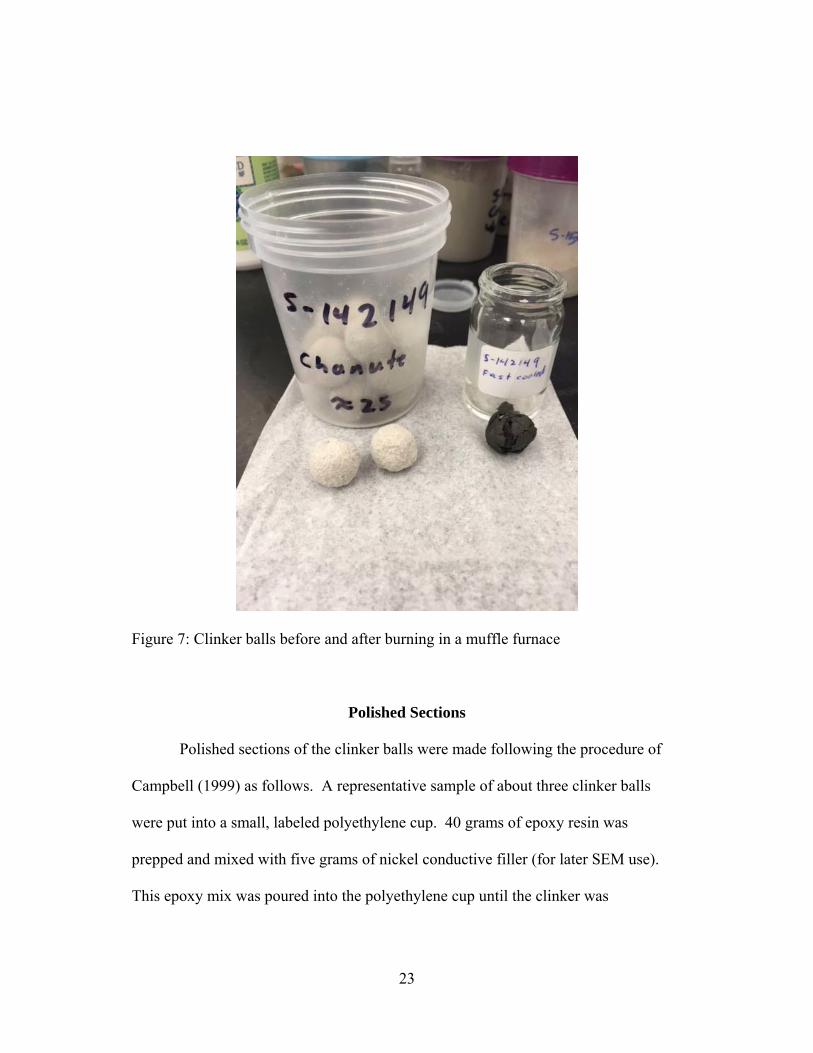
Figure 7: Clinker balls before and after burning in a muffle furnace
Polished Sections
Polished sections of the clinker balls were made following the procedure of
Campbell (1999) as follows. A representative sample of about three clinker balls
were put into a small, labeled polyethylene cup. 40 grams of epoxy resin was
prepped and mixed with five grams of nickel conductive filler (for later SEM use).
This epoxy mix was poured into the polyethylene cup until the clinker was

24
completely covered. The cup was then put in to a vacuum for 10 minutes to
impregnate the clinker fragments. This was then left out in the lab at room
temperature overnight to completely solidify.
The next day, the cup was removed from the now hardened epoxy puck and
cutting the section could begin. Approximately 1/8” was cut off the bottom of the
puck using a Buehler® Isomet™ low speed saw. This produces a cross section of
visible clinker grains but still has too rough of a surface to view under a microscope.
To polish the section into a smooth surface, the puck underwent six polishing steps.
Using a Buehler® Minimet® polisher, the puck was polished with No. 320 adhesive
backed silicone carbide abrasive paper for 10 minutes. It was then forcefully rinsed
with isopropyl alcohol in an effort to clean the surface thoroughly. This process was
repeated with No. 400 and No. 600 grit paper also.
Final polishing steps were completed with alumina polishing powder on a
chemotextile polishing cloth. 5 μm, 1 μm, and 0.3 μm polishing powder was used in
that order. In between each step, isopropyl alcohol was forcefully sprayed on the
puck to clean the surface. Also, the puck was placed in a small beaker of isopropyl
alcohol which was put in a water sonicator for two minutes for further cleaning.
After sonicating, the puck was put under forced warm air (a hand dryer) to dry.
Liquid propylene glycol was used as a lubricating fluid for all cutting and polishing
steps. Completed polished sections are shown in Figure 8 below.

25
Figure 8: Polished section “pucks” prepared for microscopy. Each puck is 1” in
diameter.
Reflected Light Microscopy
After the aforementioned pucks are polished, the surface has a smooth, glassy
finish. They were then etched with nital for eight seconds at room temperature. Nital
is a solution of 1.5 mL of nitric acid (HNO3) in 100 mL of isopropyl alcohol
(Campbell, 1999). After being dipped into the nital solution, the pucks were rinsed
thoroughly with isopropyl alcohol and dried completely under a hand dryer. This
procedure was carefully carried out with each of the five pucks to ensure consistency.

26
This solution will react with certain phases; alites will stain blue to green and
belites will stain brown to blue. Grain colors and brightness after etching give an
indication as to their level of reactivity (Ono, 1995).
After etching, the pucks were analyzed using a Nikon reflected light
microscope with magnification ranging from 50X to 600X. Crystals within the
clinker were analyzed for size, shape, morphology, color and a number of other
characteristics. Approximately 10 photographs of representative samples of clinker
minerals were taken at 400X magnification. Using Image Pro Plus 5.1 software, alite
and belite crystals were measured for length, width and diameter. An average size
could then be determined. Belite crystals specifically were analyzed for lamellae
condition and clustering (groups of belite crystals). Matrix phases (aluminate and
ferrite) were analyzed for crystal size and reflectivity. Other general noteworthy
characteristics of the clinker grains were noted such as quantity of free lime,
periclase, porosity and presence of reducing conditions.
Phase Identification
X-ray diffraction methods were used to identify the phases in the kiln feed and
in clinker balls from each of the cooling rates. All samples were randomly oriented
powder mounts and were analyzed using a PANalytical X’pert Pro X-ray
diffractometer utilizing Cu Kα (wavelength = 1.54056) radiation and operating at
45kV and 40 mA. Standard settings for all samples included a scan speed of
4.3°/min. at angles from 5° to 60° 2θ.
27
Samples for each cooling rate were prepared by obtaining about 10g worth of
burned clinker balls and crushing them to about the size of coarse sand with a mortar
and pestle. That material was then put into a ring and puck mill with a small quantity
Vertrel® specialty lubricating fluid and run for two minutes. The sample was then
removed from the mill and brushed through a No. 100 sieve. This is to ensure the
sample is thoroughly dried and to break up any clumps; the grains of the sample are
actually much finer than that. The kiln feed did not require such preparation because
it was already thoroughly mixed and of an adequate fineness. Samples were then
packed into aluminum sample holders and leveled with a glass slide. All six samples
were loaded into the sample changer and run at standard settings of 4.3°/min. from 5-
60° 2θ. The resulting diffractograms were analyzed using PANalytical High Score
Plus version 4.0 software.
Chemical Composition
Loss on Ignition
Following ASTM standard C-114, CO2 content for the kiln feed and clinker
samples was determined by loss on ignition (LOI). Approximately one gram of
sample was placed in a platinum crucible and weighed to the nearest 0.0001 gram.
The crucible was placed in a muffle furnace at 950°C for 15 minutes. The crucible
was then cooled in a desiccator to room temperature and re-weighed. A percentage of
CO2 was determined by the percentage weight difference.
28
X-Ray Fluorescence
The bulk chemical composition of all of the samples was determined using X-
ray fluorescence (XRF) on a PANalytical Axios wavelength dispersive spectrometer.
Samples were prepared by hydraulically pressing one gram of pulverized sample.
This powdered sample was carefully poured through a copper cylinder and gently
pressed with a copper rod to form a uniform, flat disk on the platform of the press.
Approximately five grams of boric acid powder was then poured on top of the
sample. The sample was pressed at 40,000 psi for one minute to form a pressed
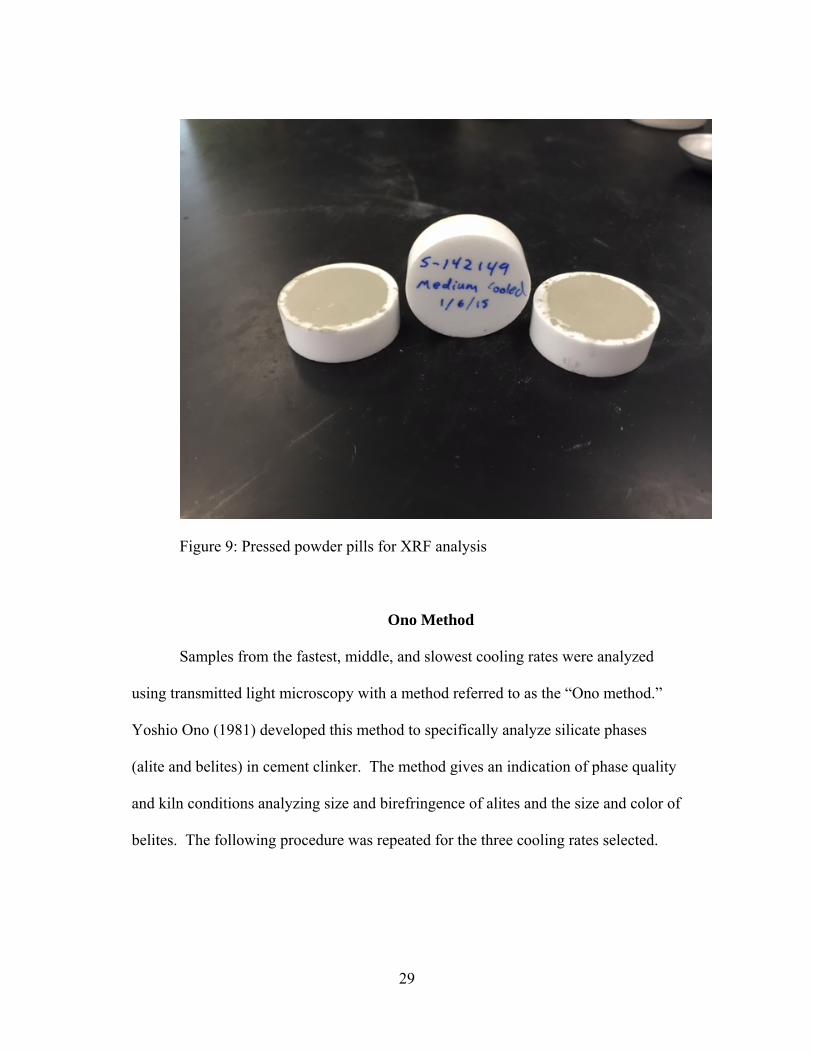
powder pill. Examples are shown in Figure 9 below. Samples were run using the
“Omnian Tags” application and results were quantified using Omnian Semi-Quant
software. CO2 content from the LOI procedure was manually entered into the
software prior to running samples.
29
Figure 9: Pressed powder pills for XRF analysis
Ono Method
Samples from the fastest, middle, and slowest cooling rates were analyzed
using transmitted light microscopy with a method referred to as the “Ono method.”
Yoshio Ono (1981) developed this method to specifically analyze silicate phases
(alite and belites) in cement clinker. The method gives an indication of phase quality
and kiln conditions analyzing size and birefringence of alites and the size and color of
belites. The following procedure was repeated for the three cooling rates selected.
30
Sample preparation
Roughly 10 grams of clinker balls were acquired and crushed with a mortar
and pestle to about the consistency of a fine to medium sand. This material was
passed through a No. 200 and No. 325 sieve. The material retained on the No. 325
sieve was saved for the remainder of the procedure, the rest was discarded. If not
enough material passed the No. 200 sieve, then further grinding with mortar and
pestle would continue. The saved material ranged from about 44 μm to 74 μm in
diameter.
A version of a previously known method of removing matrix phases
(aluminate and ferrite) referred to as KOH sugar extraction is described by Saini and
Guiliani (1995). This method retains and isolates silicate phases for easier and more
accurate analysis of alites and belites with transmitted light microscopy.
1. A small portion (about 5 mg) of retained sample powder is placed in a
small beaker with 10mL of KOH-sugar solution (10 grams of KOH
granules + 5 grams of sugar + 20mL of deionized water).
2. This solution is mixed thoroughly with a glass stirring rod and placed on a
hot plate at about 80°C. While stirring about once every two minutes, the
solution is left on the hot plate for about 15 minutes.
3. Within a 3 minute time interval, the solution is then rinsed with deionized
water and decanted 3 times.
4. The solution is then rinsed with acetone and decanted 3 times, again
within a new 3 minute time interval.

31
5. The remaining powder is then left to dry in open air at room temperature
for several hours.
Transmitted Light Microscopy
A small dusting of the powder is placed on a glass slide and a plastic cover
slip is placed over the powder. Refractive index oil (n=1.7150) is dropped next to the
plastic cover slip and capillary action coats the powder in the oil. An effort is made
to get a light, even covering of powder on the slide by pressing a rubber eraser lightly
on the cover slip and gently moving it around.
The sample was then analyzed using a Nikon transmitted light microscope at
400x magnification. Ten good quality, yet representative alites and belites were
analyzed. Alite grain length and width was measured in microns. After measuring
size, the birefringence of the alite crystal was measured. A 546 nm filter was placed
over the light source (to produce monochromatic light) and a Senermont compensator
was inserted into the scope. The alite crystal being measured was moved to the upper
right quadrant of the operator’s view, and using cross-polarized light, rotated to
extinction (darkness). Then, rotating the stage 45° toward the upper left quadrant
displays the crystal at its brightest. The analyzer (upper polarizing element) was then
rotated to crystal darkness (compensation) and the angle of rotation (θ) was recorded.
If the reading is greater than 90°, then the crystal was placed with an additive
interference and the angle reading was subtracted from 180. The birefringence was
then calculated using the following formula (Campbell, 1999).

32
B = θ/W(0.004044)
B = birefringence, θ = angle recorded and W = crystal width
Belite grain size was determined by measuring the diameter at the widest
point. Belite color was also analyzed by having the operator assign one of the
following colors: clear, pale yellow, yellow or amber. The crystal measurements are
summarized in Table 3 below
Table 3: Burning condition and microscopical character of alite and belite (Ono,
1981).
33
Scanning Electron Microscopy
Three of the polished section pucks previously used for reflected light
microscopy were selected for scanning electron microscopy analysis. The samples
chosen were the fastest, medium and slowest cooling rates (the same samples as were
used in the Ono method). Samples were examined using a FEI Quanta 600 ESEM
with a Thermo Noran System Six energy dispersive spectrometer (EDS) for elemental
analysis. Samples were run under high vacuum at 15 kV with a working distance of
approximately 10 mm and a spot size of 5.0. For each puck, five representative alites
and five representative belites were selected and scanned for elemental analysis.
Magnification varied depending on crystal size and was adequate enough to view
only a representative portion of a particular crystal (and avoid inclusions or
interference from other crystals). Photomicrographs were taken of the crystals that
were analyzed for a visual comparison as well.
34
CHAPTER 4
RESULTS AND DISCUSSION
Chemical Composition
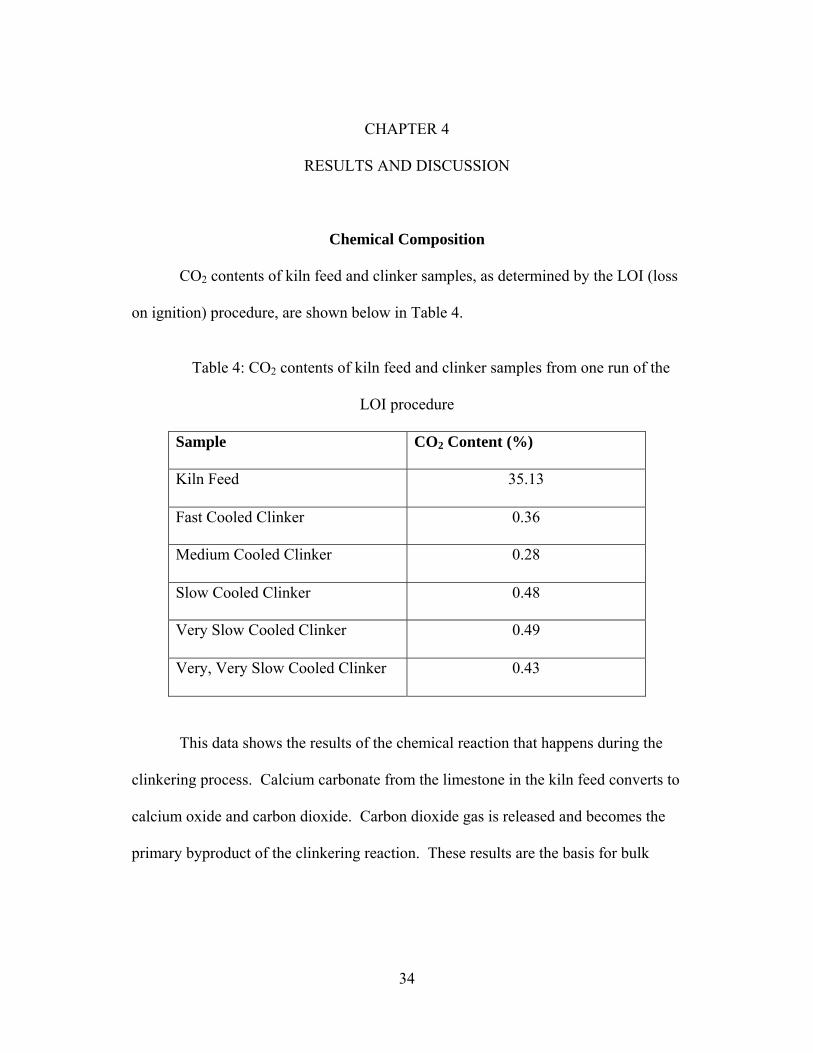
CO2 contents of kiln feed and clinker samples, as determined by the LOI (loss
on ignition) procedure, are shown below in Table 4.
Table 4: CO2 contents of kiln feed and clinker samples from one run of the
LOI procedure
Sample CO2 Content (%)
Kiln Feed 35.13
Fast Cooled Clinker 0.36
Medium Cooled Clinker 0.28
Slow Cooled Clinker 0.48
Very Slow Cooled Clinker 0.49
Very, Very Slow Cooled Clinker 0.43
This data shows the results of the chemical reaction that happens during the
clinkering process. Calcium carbonate from the limestone in the kiln feed converts to
calcium oxide and carbon dioxide. Carbon dioxide gas is released and becomes the
primary byproduct of the clinkering reaction. These results are the basis for bulk

35
chemical composition analysis using XRF. Some of the XRF results are summarized
in Table 5 below. Full results are in Appendix A.
Table 5: Chemical composition of kiln feed and clinker samples by % of total mass
CO2 Na2O MgO Al2O3 SiO2 P2O5 K2O CaO TiO2 Mn2O3 Fe2O3 SrO
Kiln Feed 35.13 0.19 1.38 3.63 12.85 0.06 0.54 42.91 0.20 0.08 2.40 0.17
F.C. Clinker 0.36 0.16 2.08 4.23 21.12 0.12 0.01 66.51 0.30 0.14 3.83 0.29
M.C. Clinker 0.28 0.18 2.20 4.62 21.02 0.11 0.05 66.61 0.28 0.12 3.91 0.28
S.C. Clinker 0.48 0.17 2.19 4.65 20.82 0.12 0.04 66.62 0.32 0.12 3.74 0.28
V.S.C Clinker 0.49 0.17 2.20 4.69 20.96 0.12 0.04 66.54 0.30 0.12 3.72 0.28
V.V.S.C. Clinker 0.43 0.16 2.22 4.74 21.03 0.13 0.02 66.63 0.28 0.11 3.68 0.29
This data corresponds closely to the typical kiln feed composition published
by Peray and Waddell (1972) and others. Percentages of Mg, Al, Mn and Fe in the
kiln feed appear to be within a good range to provide substitutions in silicate
minerals.
Mineral Identification
X-ray diffraction results showed the kiln feed to be composed predominantly
of calcite (CaCO3) and quartz (SiO2). Lesser quantities of dolomite (CaMg(CO3)2),
illite((K,H3O)(Al,Mg,Fe)2(Si,Al)4O10[(OH)2,(H2O)]), kaolinite (Al2Si2O5(OH)4)and
albite (NaAlSi3O8) were present as well (Figure 10). Kiln feed mineral composition
also corresponded closely with typical kiln feed composition published by Peray and
Waddell (1972) and others.
36
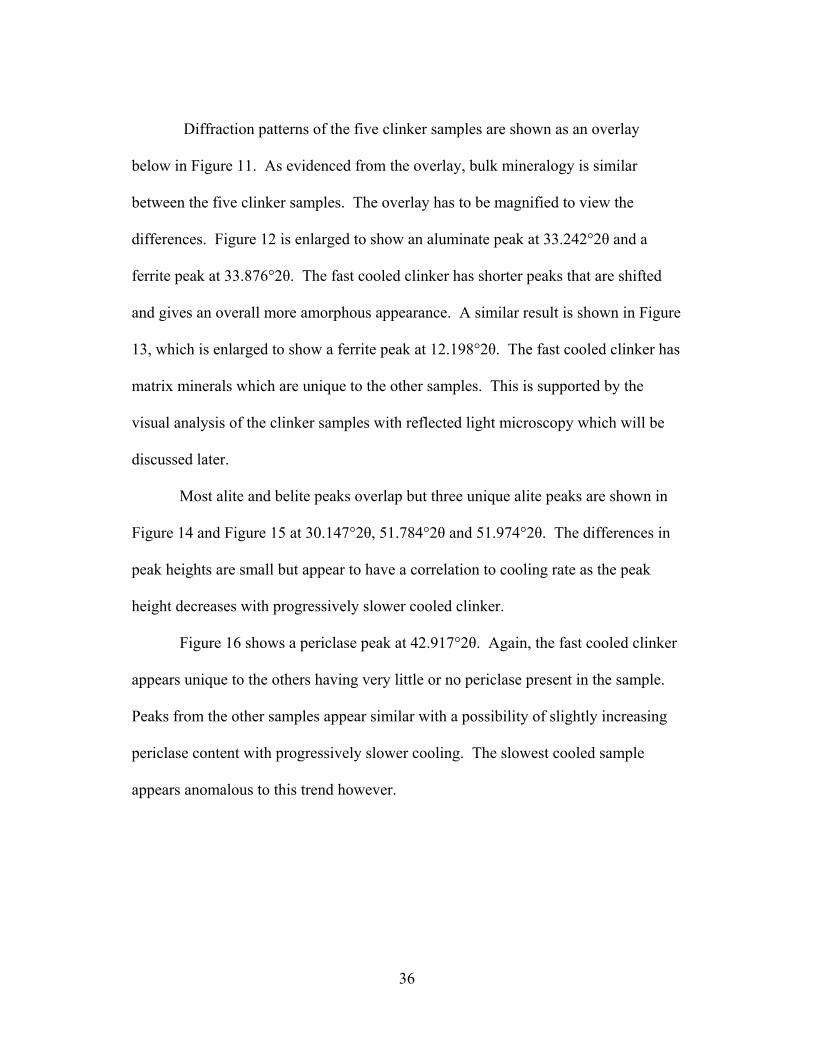
Diffraction patterns of the five clinker samples are shown as an overlay
below in Figure 11. As evidenced from the overlay, bulk mineralogy is similar
between the five clinker samples. The overlay has to be magnified to view the
differences. Figure 12 is enlarged to show an aluminate peak at 33.242°2θ and a
ferrite peak at 33.876°2θ. The fast cooled clinker has shorter peaks that are shifted
and gives an overall more amorphous appearance. A similar result is shown in Figure
13, which is enlarged to show a ferrite peak at 12.198°2θ. The fast cooled clinker has
matrix minerals which are unique to the other samples. This is supported by the
visual analysis of the clinker samples with reflected light microscopy which will be
discussed later.
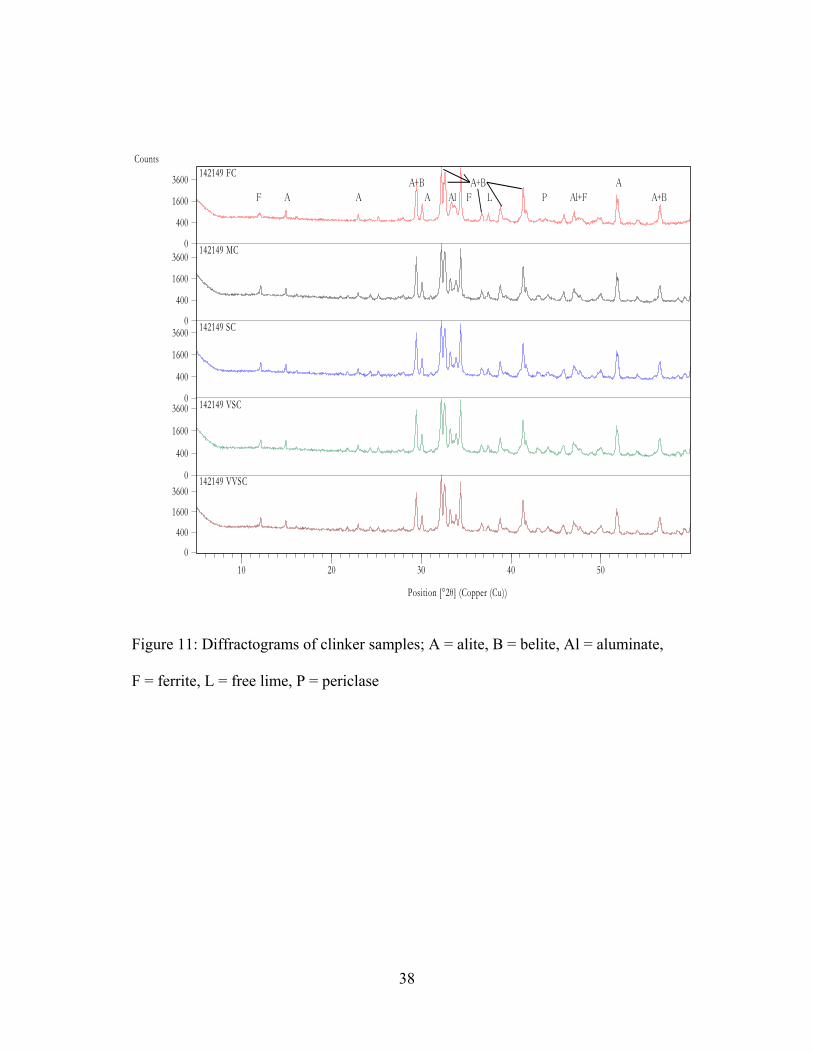
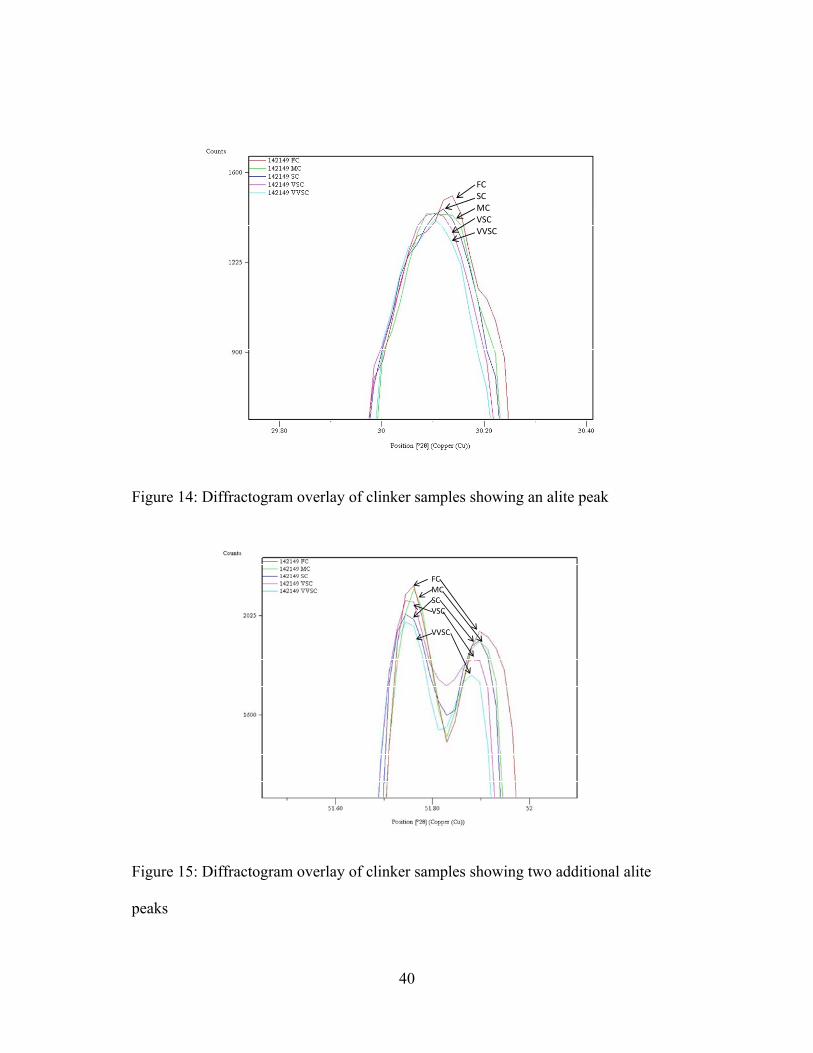
Most alite and belite peaks overlap but three unique alite peaks are shown in
Figure 14 and Figure 15 at 30.147°2θ, 51.784°2θ and 51.974°2θ. The differences in
peak heights are small but appear to have a correlation to cooling rate as the peak
height decreases with progressively slower cooled clinker.
Figure 16 shows a periclase peak at 42.917°2θ. Again, the fast cooled clinker
appears unique to the others having very little or no periclase present in the sample.
Peaks from the other samples appear similar with a possibility of slightly increasing
periclase content with progressively slower cooling. The slowest cooled sample
appears anomalous to this trend however.

37
Figure 10: Diffractogram of kiln feed
C=Calcite Q=Quartz D=Dolomite I=Illite K=Kaolinite A=Albite
C
Q
C
C C C C C
I Q D Q C K Q A C
38
Figure 11: Diffractograms of clinker samples; A = alite, B = belite, Al = aluminate,
F = ferrite, L = free lime, P = periclase
Position [°2θ] (Copper (Cu))
10 20 30 40 50
Counts
0
400
1600
3600
0
400
1600
3600
0
400
1600
3600
0
400
1600
3600
0
400
1600
3600
142149 FC
142149 MC
142149 SC
142149 VSC
142149 VVSC
A+B A+B A
F A A A Al F L P Al+F A+B

39
Figure 12: Diffractogram overlay of clinker samples showing an aluminate peak and
a ferrite peak
Figure 13: Diffractogram overlay of clinker samples showing a ferrite peak
FerriteMC‐VVSC Ferrite FC Aluminate FC Aluminate MC‐VVSC
MC‐VVSC FC
40
Figure 14: Diffractogram overlay of clinker samples showing an alite peak
Figure 15: Diffractogram overlay of clinker samples showing two additional alite
peaks
FCSC MC VSC VVSC
FCMC SC VSC VVSC

41
Figure 16: Diffractogram overlay of clinker samples showing a periclase peak
Periclase: MC‐VVSC FC
42
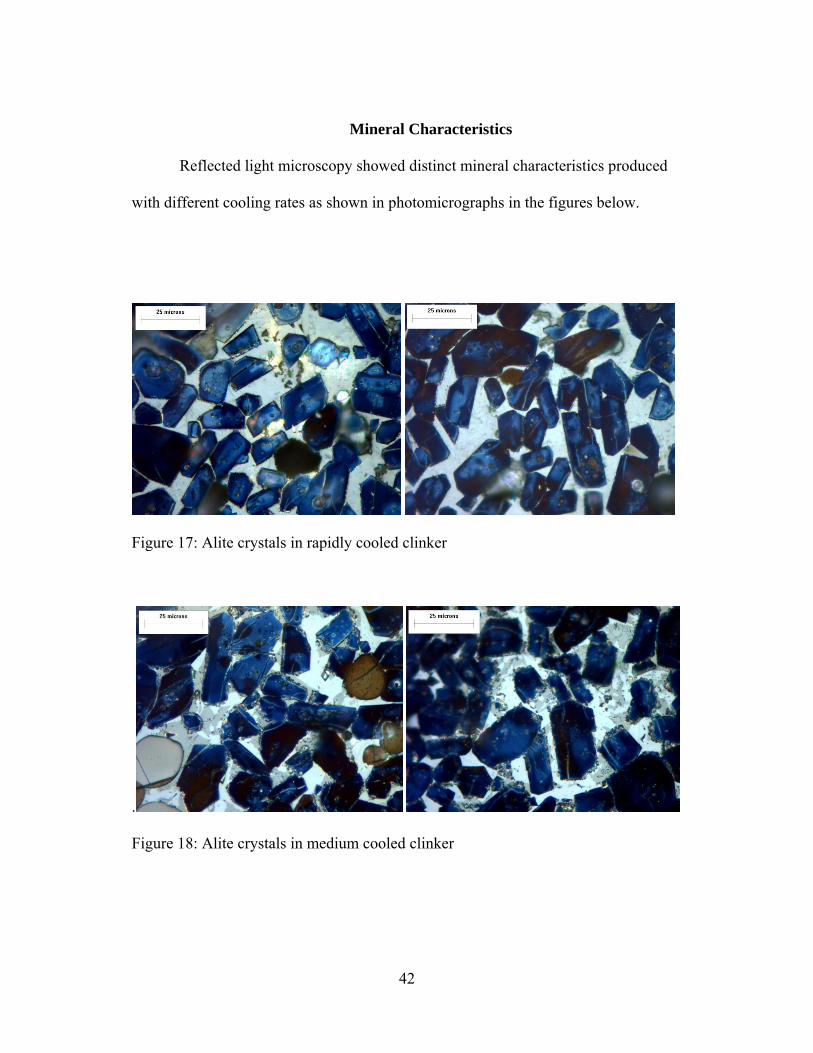
Mineral Characteristics
Reflected light microscopy showed distinct mineral characteristics produced
with different cooling rates as shown in photomicrographs in the figures below.
Figure 17: Alite crystals in rapidly cooled clinker
.
Figure 18: Alite crystals in medium cooled clinker
43
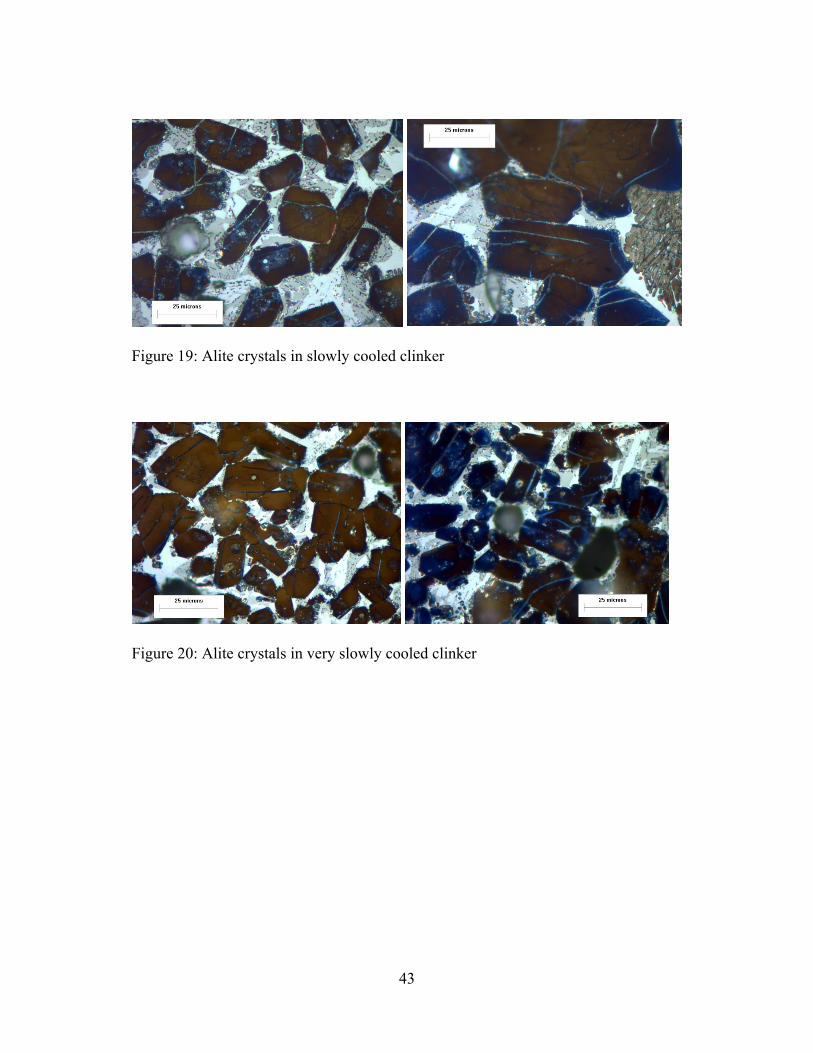
Figure 19: Alite crystals in slowly cooled clinker
Figure 20: Alite crystals in very slowly cooled clinker
44
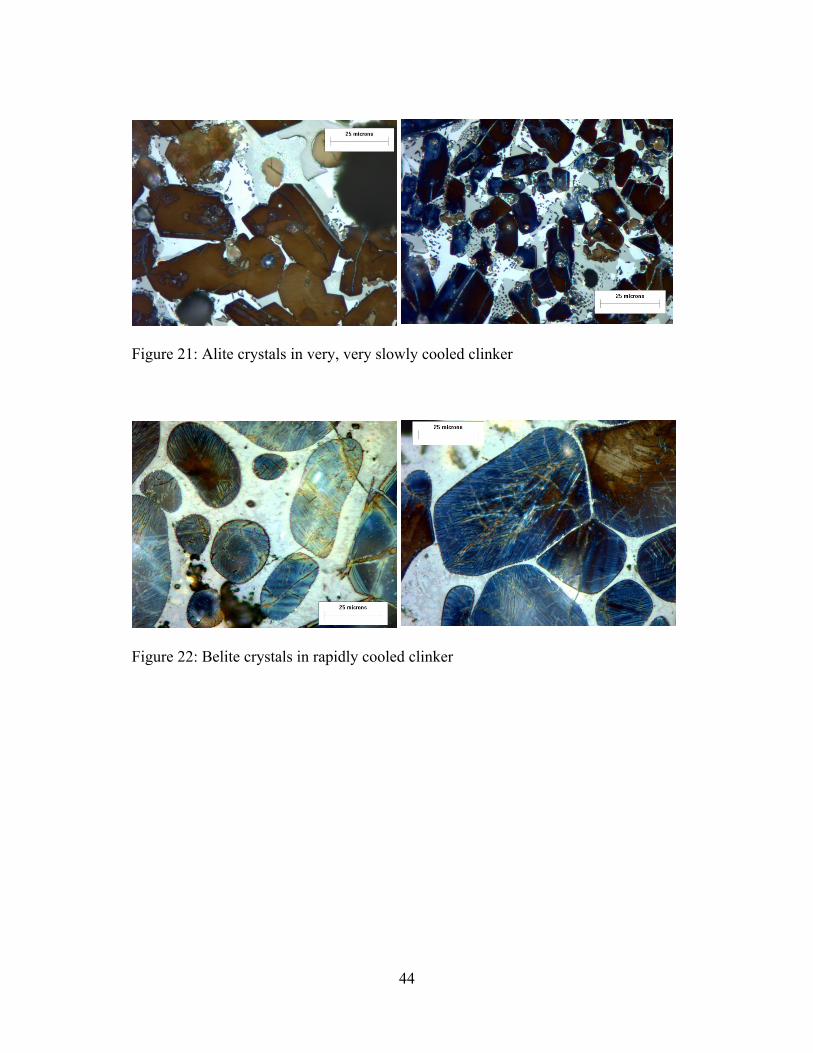
Figure 21: Alite crystals in very, very slowly cooled clinker
Figure 22: Belite crystals in rapidly cooled clinker

45
Figure 23: Belite crystals in medium cooled clinker
Figure 24: Belite crystals in slowly cooled clinker

46
Figure 25: Belite crystals in very slow cooled clinker
Figure 26: Belite crystals in very, very slowly cooled clinker
Both alite and belite crystals were somewhat inhomogeneous in all the clinker
samples, but a summary of general characteristics is as follows (which are illustrated
in the above photomicrographs). Alite crystals in the fast cooled clinker typically
showed sharp edges and good, euhedral crystal form. Crystals were mostly small and
showed up as bright blue from the nital etch. Some small belite inclusions were
observed.
47
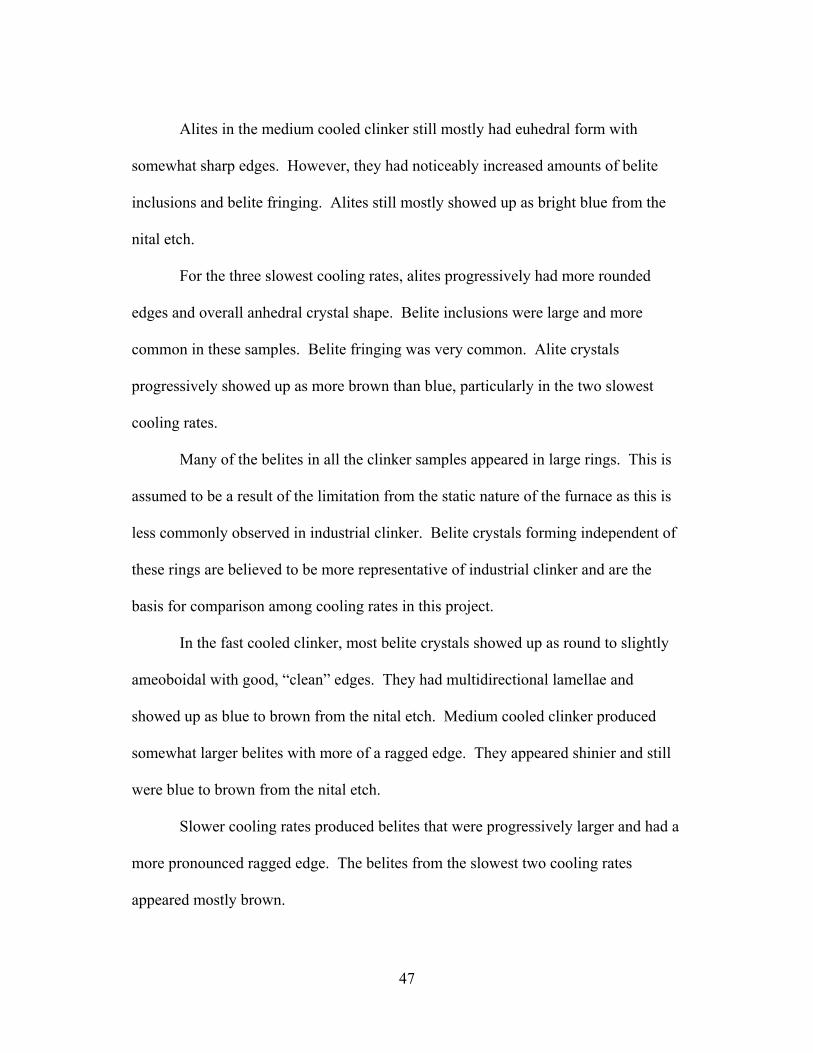
Alites in the medium cooled clinker still mostly had euhedral form with
somewhat sharp edges. However, they had noticeably increased amounts of belite
inclusions and belite fringing. Alites still mostly showed up as bright blue from the
nital etch.
For the three slowest cooling rates, alites progressively had more rounded
edges and overall anhedral crystal shape. Belite inclusions were large and more
common in these samples. Belite fringing was very common. Alite crystals
progressively showed up as more brown than blue, particularly in the two slowest
cooling rates.
Many of the belites in all the clinker samples appeared in large rings. This is
assumed to be a result of the limitation from the static nature of the furnace as this is
less commonly observed in industrial clinker. Belite crystals forming independent of
these rings are believed to be more representative of industrial clinker and are the
basis for comparison among cooling rates in this project.
In the fast cooled clinker, most belite crystals showed up as round to slightly
ameoboidal with good, “clean” edges. They had multidirectional lamellae and
showed up as blue to brown from the nital etch. Medium cooled clinker produced
somewhat larger belites with more of a ragged edge. They appeared shinier and still
were blue to brown from the nital etch.
Slower cooling rates produced belites that were progressively larger and had a
more pronounced ragged edge. The belites from the slowest two cooling rates
appeared mostly brown.
48
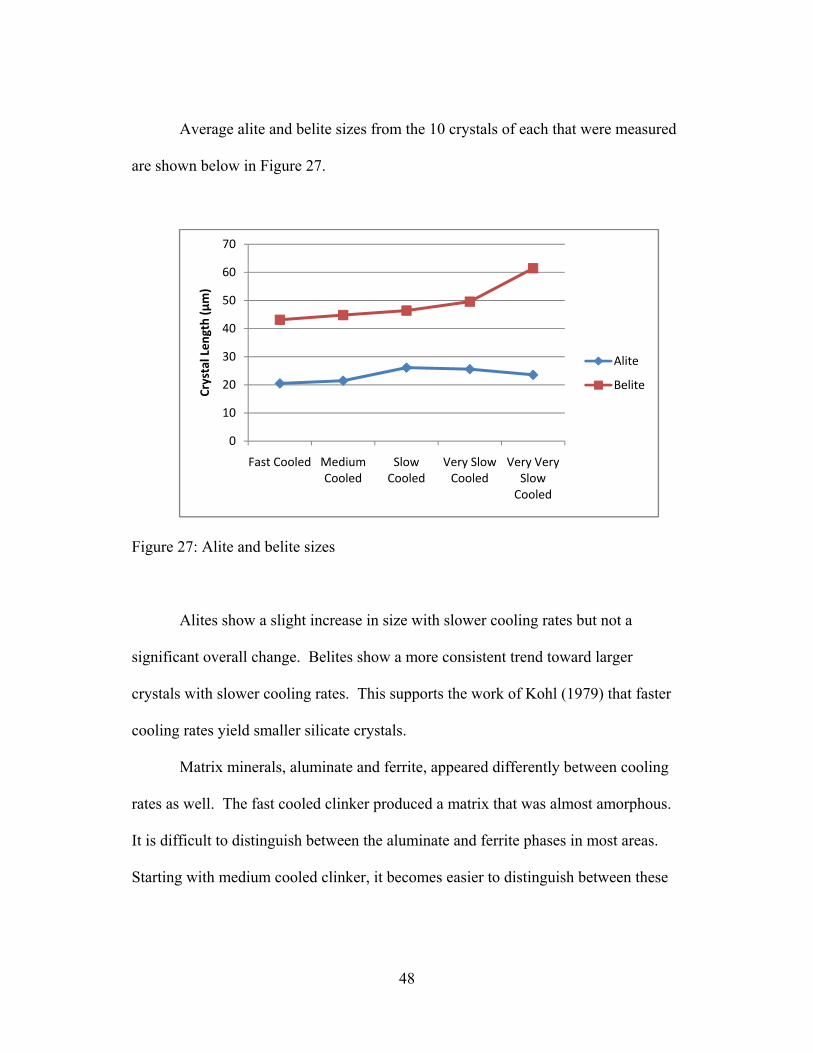
Average alite and belite sizes from the 10 crystals of each that were measured
are shown below in Figure 27.
Figure 27: Alite and belite sizes
Alites show a slight increase in size with slower cooling rates but not a
significant overall change. Belites show a more consistent trend toward larger
crystals with slower cooling rates. This supports the work of Kohl (1979) that faster
cooling rates yield smaller silicate crystals.
Matrix minerals, aluminate and ferrite, appeared differently between cooling
rates as well. The fast cooled clinker produced a matrix that was almost amorphous.
It is difficult to distinguish between the aluminate and ferrite phases in most areas.
Starting with medium cooled clinker, it becomes easier to distinguish between these
0
10
20
30
40
50
60
70
Fast Cooled Medium Cooled
Slow Cooled
Very Slow Cooled
Very Very Slow Cooled
Crystal Length (μm)
Alite
Belite

49
phases and the matrix crystals become progressively larger as the cooling rate gets
slower.
Ono Method
Ono (1981) provides information optimal burning conditions for
clinkerization. This is shown in Table 3 (discussed previously). Measurements of
alite birefringence and belite color from the Ono method are shown in Table 6 below.
Table 6: Ono method results
Alite Birefringence Belite Color
Fast Cooled 0.0080 3.5
Slow Cooled 0.0072 2.0
Very, Very Slow Cooled 0.0083 1.3
Comparing the data from this study in Table 6 to the information in Table 3,
alite birefringence correlates well with an ideal maximum temperature for
clinkerization. Belite color, however, indicates a progressive and significant decline
in quality of cooling rate. These values are determined by assigning a numerical
value to belite color and then acquiring the average value for the 10 crystals examined
in each sample. The values are as follows: colorless = 4, pale yellow = 3, yellow = 2,
amber = 1. This procedure is taken from Ono (1995) and further expanded upon by
Campbell (1999). The results indicate that the fast cooled clinker is an “excellent”
cooling rate, the slow cooled clinker is an “average” cooling rate and the very, very
50
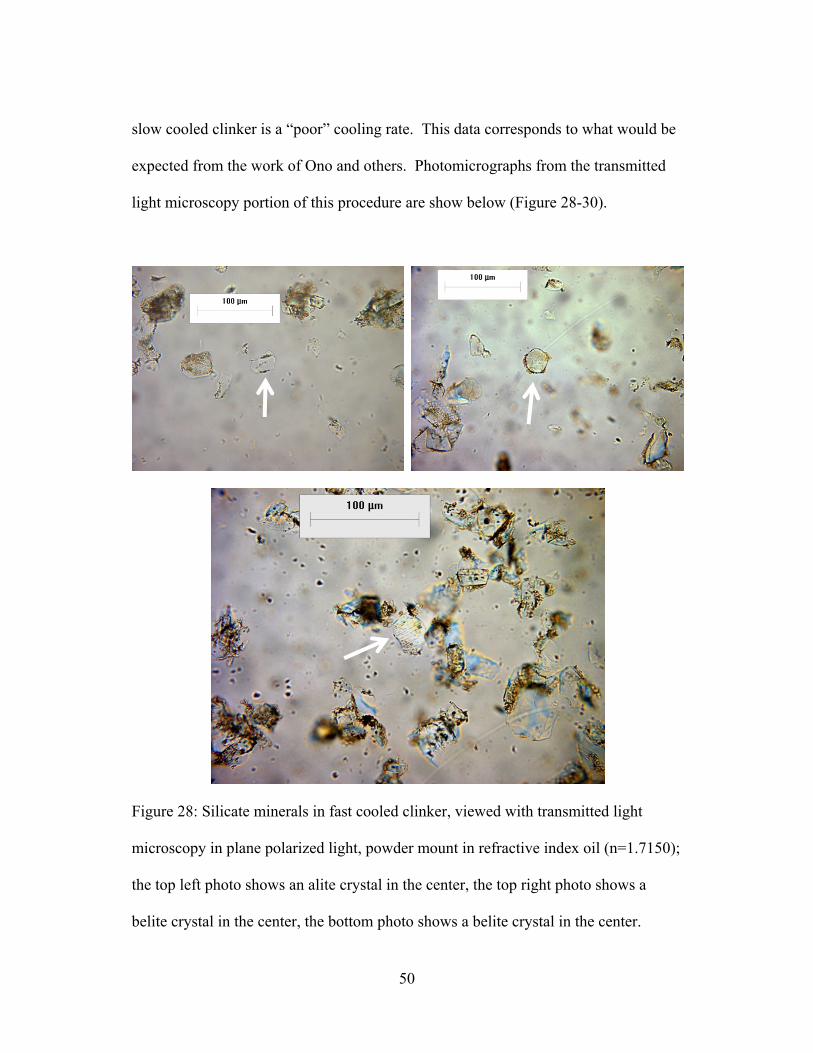
slow cooled clinker is a “poor” cooling rate. This data corresponds to what would be
expected from the work of Ono and others. Photomicrographs from the transmitted
light microscopy portion of this procedure are show below (Figure 28-30).
Figure 28: Silicate minerals in fast cooled clinker, viewed with transmitted light
microscopy in plane polarized light, powder mount in refractive index oil (n=1.7150);
the top left photo shows an alite crystal in the center, the top right photo shows a
belite crystal in the center, the bottom photo shows a belite crystal in the center.
51
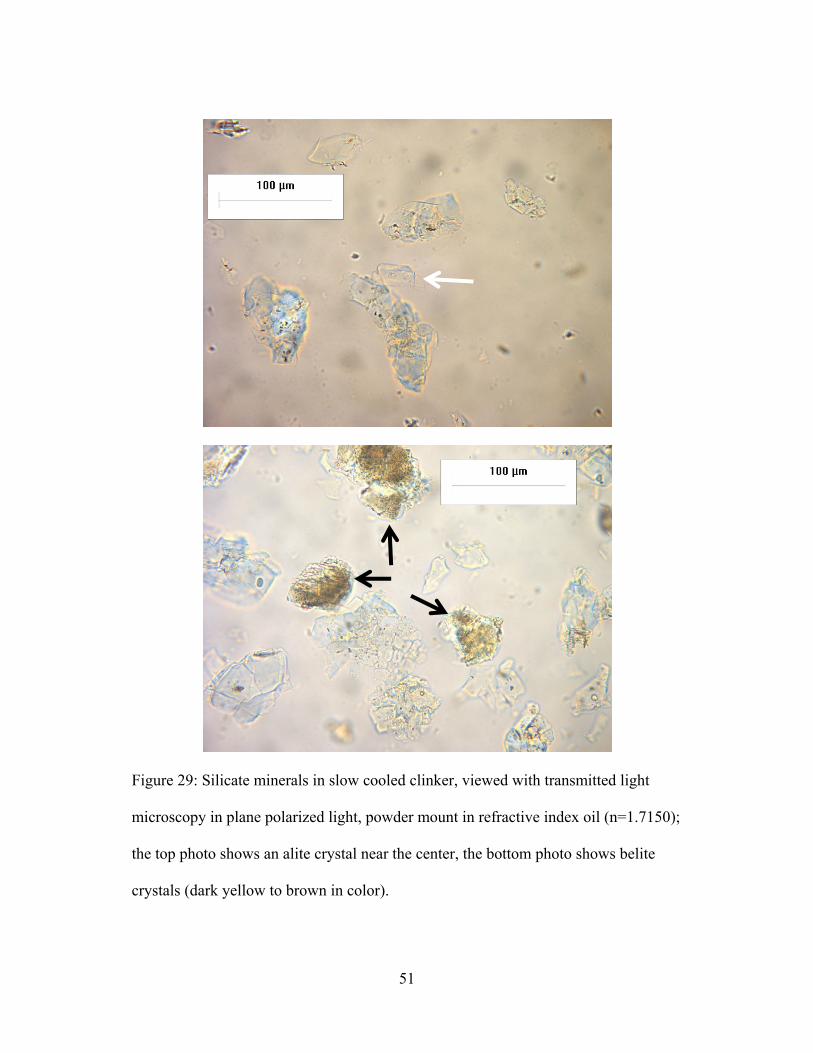
Figure 29: Silicate minerals in slow cooled clinker, viewed with transmitted light
microscopy in plane polarized light, powder mount in refractive index oil (n=1.7150);
the top photo shows an alite crystal near the center, the bottom photo shows belite
crystals (dark yellow to brown in color).
52
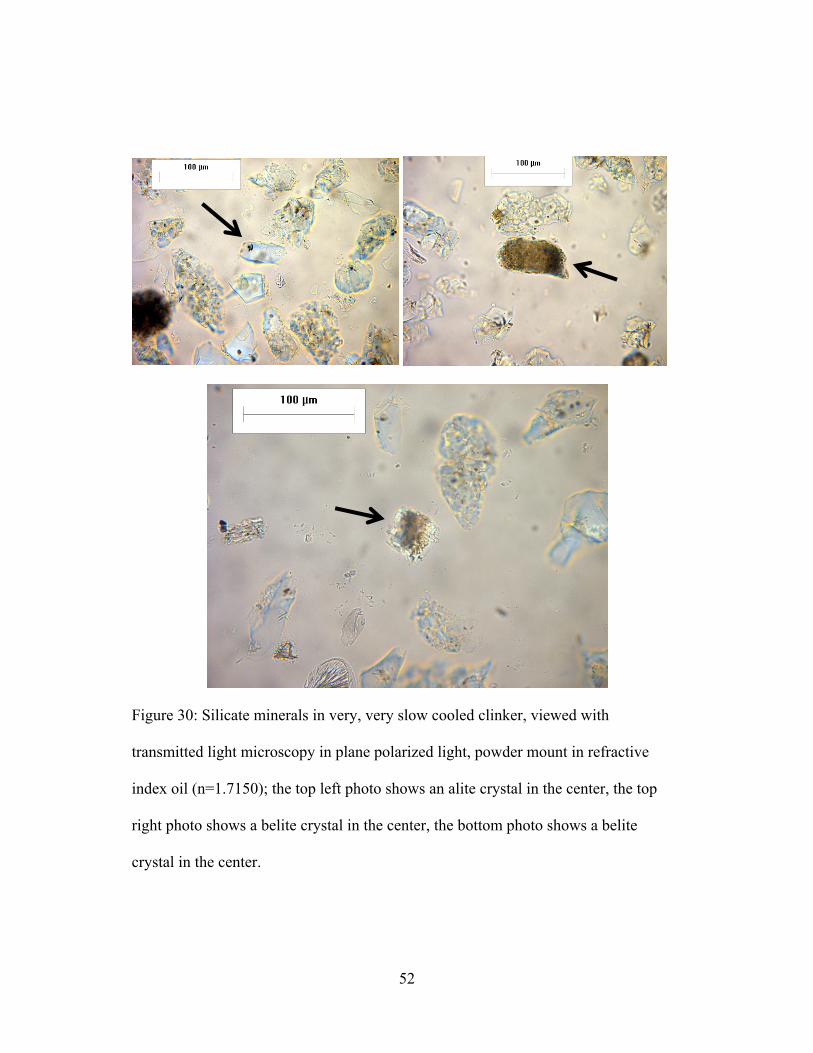
Figure 30: Silicate minerals in very, very slow cooled clinker, viewed with
transmitted light microscopy in plane polarized light, powder mount in refractive
index oil (n=1.7150); the top left photo shows an alite crystal in the center, the top
right photo shows a belite crystal in the center, the bottom photo shows a belite
crystal in the center.
53
Following Ono’s method, KOH-sugar extraction removes everything but the
silicate minerals. This allows for good analysis of alite and belite crystals. Analyzing
crystal shapes and sizes supports the findings previously discussed from reflected
light microscopy. Alites appear to have better crystal form and sharper edges in the
faster cooled clinker samples. Alites in slower cooled samples appear larger than in
faster cooled samples although this is an observation and is not quantified. Belites
show a significant change in color between faster and slower cooled samples.
Mineral Analysis by SEM
Visual mineral characteristics are evident once again in photomicrographs
taken with the SEM (Figures 31-33). These photographs support the previously
discussed mineral characteristic differences in the different cooling rates. To further
expand upon that, in the SEM photomicrographs, the alites in fast cooled clinker
appeared to be more homogenous than those in the slower cooled samples. This
could be due to an increase in belite inclusions in slower cooled samples. Belites in
fast cooled clinker have well defined cross hatched lamellae. This indicates belites in
fast cooled clinker are fairly homogenous and are of the β polymorph. Slower cooled
samples have ragged edges and appear to be breaking apart. This is likely due to
impurities leaching out during slow cooling. Some portions of the belites in slower
cooling rates do not have well defined lamellae or do not have any lamellae at all.
This likely indicates a presence of γ belite along with β belite (although this could not
be determined with certainty).
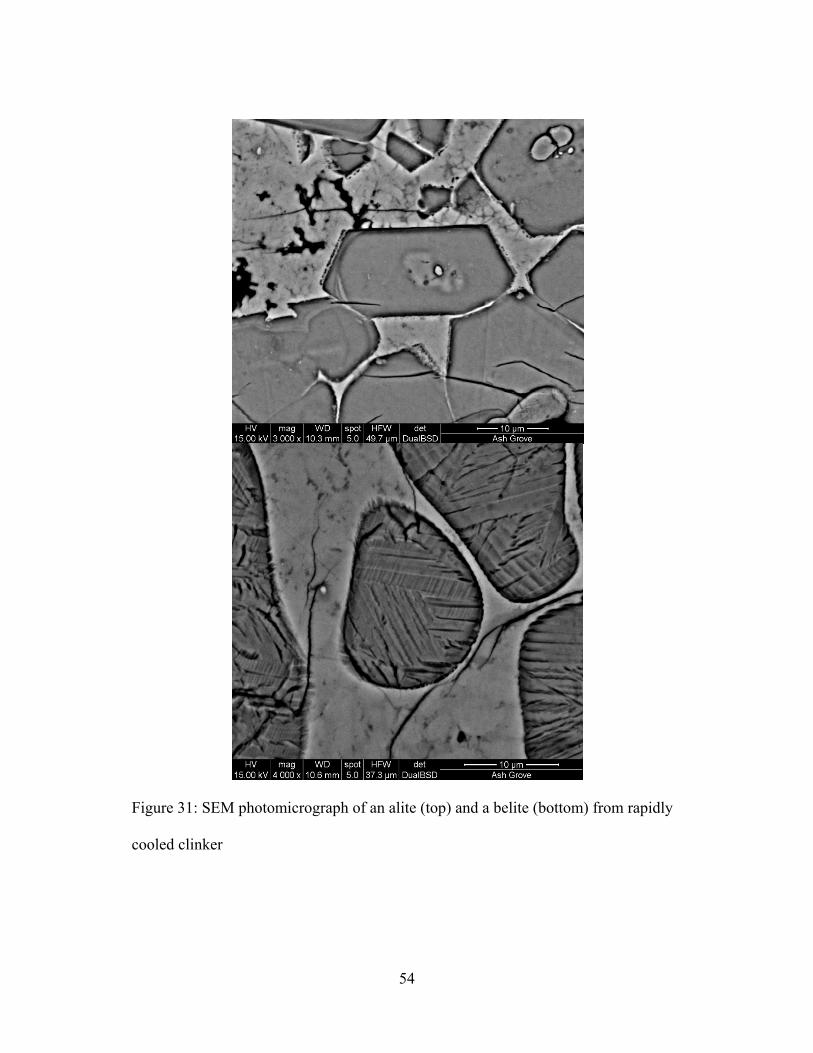
54
Figure 31: SEM photomicrograph of an alite (top) and a belite (bottom) from rapidly
cooled clinker
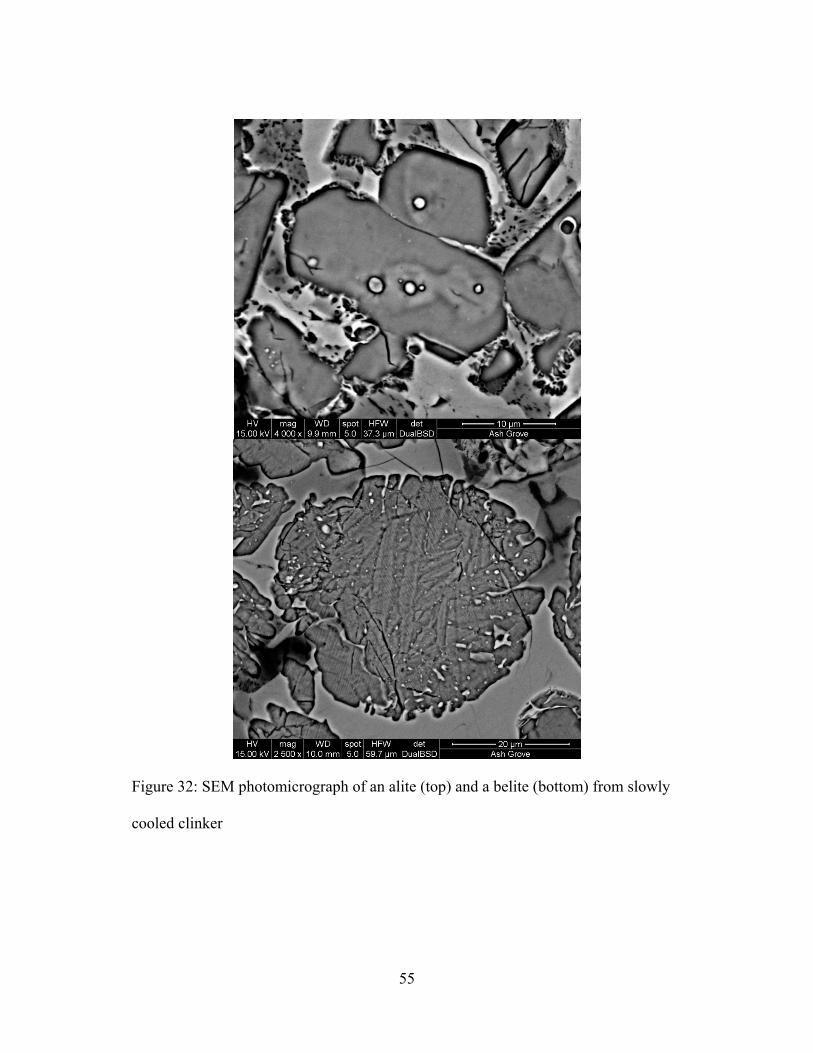
55
Figure 32: SEM photomicrograph of an alite (top) and a belite (bottom) from slowly
cooled clinker
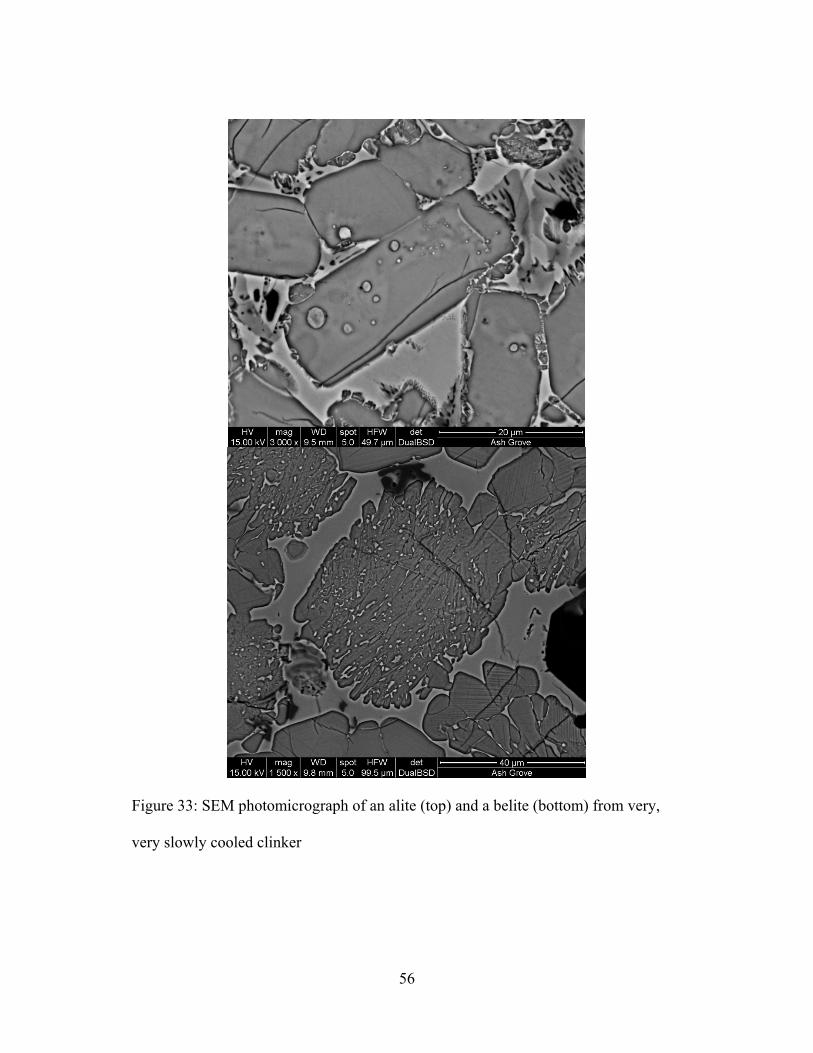
56
Figure 33: SEM photomicrograph of an alite (top) and a belite (bottom) from very,
very slowly cooled clinker

57
Chemical analyses of the crystals shown in the above photographs plus four
additional alites and four additional belites from each cooling rate were analyzed with
EDS. Results are shown below in Figure 34-38 and Table 7-12.
Figure 34: EDS spectrogram of alites in rapidly cooled clinker, shown at two different
scales to highlight minor elements
Table 7: Weight percentage of elements in alites in rapidly cooled clinker
N O F Na Mg Al Si P S Cl K Ca Ti Cr Mn Fe
Alite 1 0.00 55.42 0.00 0.00 0.55 0.45 8.18 0.12 0.07 0.00 0.03 34.63 0.04 0.00 0.00 0.50
Alite 2 0.00 54.47 0.00 0.04 0.53 0.51 8.23 0.20 0.04 0.00 0.03 35.05 0.10 0.08 0.00 0.71
Alite 3 4.51 59.21 0.00 0.00 0.54 0.36 6.86 0.05 0.04 0.07 0.07 27.58 0.10 0.13 0.07 0.42
Alite 4 0.00 57.40 0.00 0.07 0.54 0.54 7.76 0.08 0.01 0.02 0.11 32.88 0.07 0.00 0.16 0.36
Alite 5 0.00 52.62 0.00 0.12 0.66 0.61 8.62 0.04 0.07 0.00 0.10 36.54 0.08 0.08 0.08 0.40
Average: 0.90 55.82 0.00 0.05 0.56 0.49 7.93 0.10 0.05 0.02 0.07 33.34 0.08 0.06 0.06 0.48

58
Figure 35: EDS spectrogram of belites in rapidly cooled clinker, shown at two
different scales to highlight minor elements
Table 8: Weight percentage of elements in belites in rapidly cooled clinker
O F Na Mg Al Si P S Cl K Ca Ti Cr Mn Fe Br
Belite 1 58.63 0.00 0.16 0.26 0.91 9.25 0.83 0.03 0.00 0.06 28.50 0.19 0.05 0.00 1.13 0.00
Belite 2 56.97 0.00 0.19 0.26 0.67 10.34 0.02 0.02 0.03 0.02 29.85 0.21 0.00 0.07 0.90 0.44
Belite 3 54.08 0.00 0.20 0.24 0.28 11.46 0.01 0.04 0.00 0.08 32.88 0.07 0.00 0.00 0.67 0.00
Belite 4 59.10 0.00 0.25 0.21 0.66 9.84 0.03 0.08 0.02 0.02 28.68 0.14 0.09 0.00 0.88 0.00
Belite 5 56.44 0.00 0.27 0.29 0.79 10.33 0.00 0.03 0.00 0.00 30.38 0.11 0.09 0.27 0.99 0.00
Average: 57.04 0.00 0.21 0.25 0.66 10.25 0.18 0.04 0.01 0.04 30.06 0.14 0.04 0.07 0.91 0.09

59
Figure 36: EDS spectrogram of alites in slowly cooled clinker, shown at two different
scales to highlight minor elements
Table 9: Weight percentage of elements in alites in slowly cooled clinker
O F Na Mg Al Si P S Cl K Ca Ti Cr Mn Fe
Alite 1 54.51 0.00 0.06 0.59 0.50 8.41 0.02 0.00 0.03 0.00 35.14 0.03 0.06 0.06 0.59
Alite 2 56.84 0.00 0.15 0.62 0.44 8.35 0.06 0.00 0.01 0.00 33.02 0.10 0.00 0.00 0.42
Alite 3 53.68 0.00 0.12 0.59 0.43 8.75 0.10 0.02 0.04 0.08 35.76 0.03 0.02 0.00 0.38
Alite 4 54.02 0.00 0.00 0.62 0.49 8.30 0.08 0.00 0.02 0.02 35.36 0.18 0.09 0.06 0.77
Alite 5 54.53 0.00 0.08 0.52 0.53 8.57 0.02 0.02 0.04 0.00 35.13 0.08 0.00 0.02 0.44
Average: 54.72 0.00 0.08 0.59 0.48 8.48 0.06 0.01 0.03 0.02 34.88 0.08 0.03 0.03 0.52

60
Figure 37: EDS spectrogram of belites in slowly cooled clinker, shown at two
different scales to highlight minor elements
Table 10: Weight percentage of elements in belites in slowly cooled clinker
O F Na Mg Al Si P S Cl K Ca Ti Cr Mn Fe
Belite 1 55.59 0.00 0.21 0.19 0.72 10.53 0.02 0.02 0.03 0.59 31.25 0.10 0.00 0.00 0.74
Belite 2 55.42 0.00 0.21 0.24 1.10 10.24 0.18 0.00 0.08 0.07 31.61 0.18 0.00 0.06 0.62
Belite 3 56.89 0.00 0.16 0.32 0.29 10.96 0.00 0.02 0.01 0.02 31.08 0.00 0.06 0.00 0.19
Belite 4 56.39 0.00 0.21 0.28 0.17 11.26 0.00 0.00 0.04 0.07 31.23 0.03 0.00 0.03 0.29
Belite 5 55.04 0.00 0.11 0.28 0.22 11.22 0.00 0.02 0.01 0.08 32.47 0.14 0.00 0.00 0.41
Average: 55.87 0.00 0.18 0.26 0.50 10.84 0.04 0.01 0.04 0.16 31.52 0.09 0.01 0.02 0.45

61
Figure 38: EDS spectrogram of alites in very, very slowly cooled clinker, shown at
two different scales to highlight minor elements
Table 11: Weight percentage of elements in alites in very, very slowly cooled clinker
O F Na Mg Al Si P S Cl K Ca Ti Cr Mn Fe
Alite 1 53.17 0.00 0.20 0.57 0.61 8.67 0.03 0.00 0.00 0.03 36.00 0.10 0.01 0.02 0.58
Alite 2 51.61 0.00 0.08 0.42 0.47 8.93 0.00 0.05 0.02 0.07 37.35 0.12 0.00 0.05 0.82
Alite 3 53.41 0.00 0.07 0.56 0.32 8.77 0.06 0.03 0.00 0.00 36.15 0.09 0.04 0.01 0.49
Alite 4 53.40 0.00 0.18 0.63 0.40 8.51 0.06 0.00 0.02 0.08 36.09 0.04 0.01 0.00 0.59
Alite 5 52.14 0.00 0.05 0.42 0.47 8.56 0.08 0.07 0.00 0.00 37.34 0.08 0.00 0.00 0.80
Average: 52.75 0.00 0.11 0.52 0.45 8.69 0.04 0.03 0.01 0.04 36.58 0.09 0.01 0.02 0.66
62
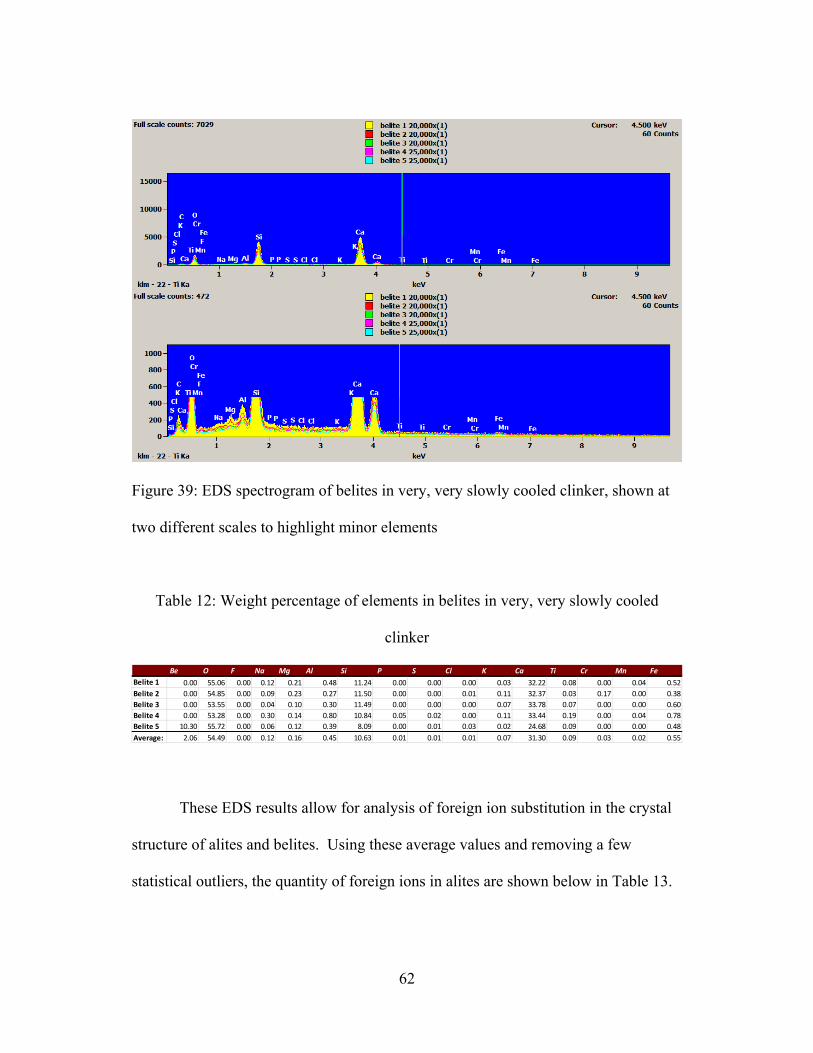
Figure 39: EDS spectrogram of belites in very, very slowly cooled clinker, shown at
two different scales to highlight minor elements
Table 12: Weight percentage of elements in belites in very, very slowly cooled
clinker
These EDS results allow for analysis of foreign ion substitution in the crystal
structure of alites and belites. Using these average values and removing a few
statistical outliers, the quantity of foreign ions in alites are shown below in Table 13.
Be O F Na Mg Al Si P S Cl K Ca Ti Cr Mn Fe
Belite 1 0.00 55.06 0.00 0.12 0.21 0.48 11.24 0.00 0.00 0.00 0.03 32.22 0.08 0.00 0.04 0.52
Belite 2 0.00 54.85 0.00 0.09 0.23 0.27 11.50 0.00 0.00 0.01 0.11 32.37 0.03 0.17 0.00 0.38
Belite 3 0.00 53.55 0.00 0.04 0.10 0.30 11.49 0.00 0.00 0.00 0.07 33.78 0.07 0.00 0.00 0.60
Belite 4 0.00 53.28 0.00 0.30 0.14 0.80 10.84 0.05 0.02 0.00 0.11 33.44 0.19 0.00 0.04 0.78
Belite 5 10.30 55.72 0.00 0.06 0.12 0.39 8.09 0.00 0.01 0.03 0.02 24.68 0.09 0.00 0.00 0.48
Average: 2.06 54.49 0.00 0.12 0.16 0.45 10.63 0.01 0.01 0.01 0.07 31.30 0.09 0.03 0.02 0.55
63
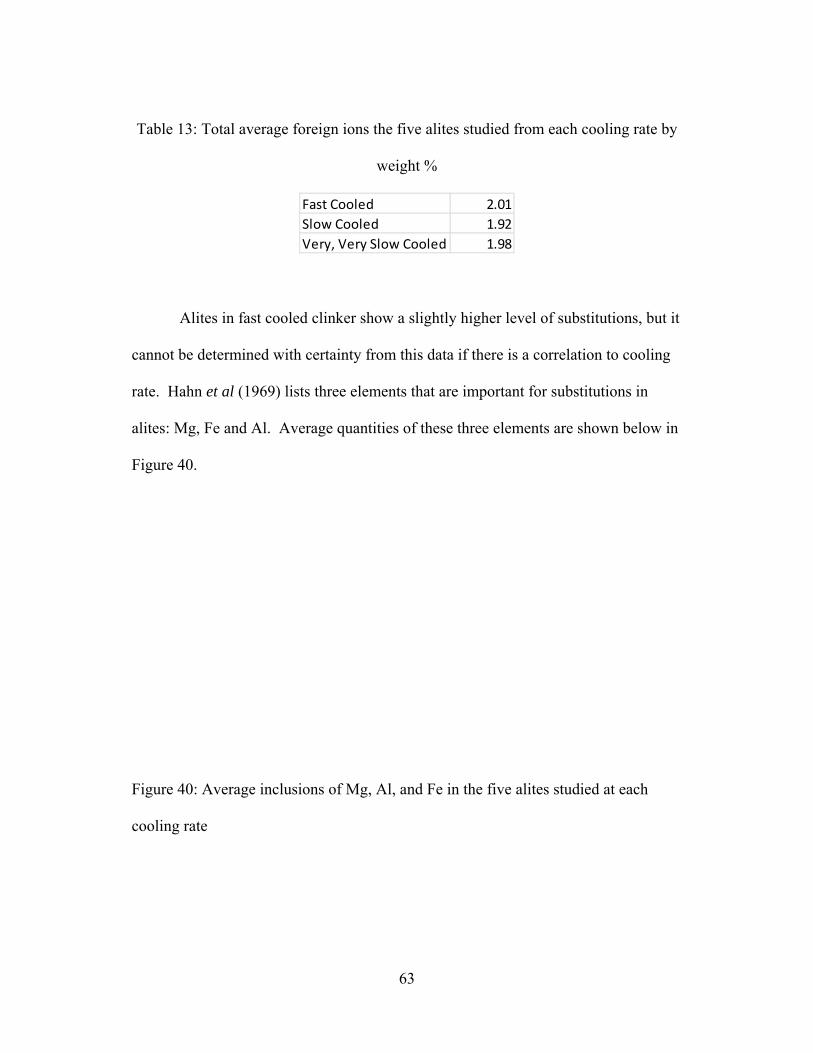
Table 13: Total average foreign ions the five alites studied from each cooling rate by
weight %
Alites in fast cooled clinker show a slightly higher level of substitutions, but it
cannot be determined with certainty from this data if there is a correlation to cooling
rate. Hahn et al (1969) lists three elements that are important for substitutions in
alites: Mg, Fe and Al. Average quantities of these three elements are shown below in
Figure 40.
Figure 40: Average inclusions of Mg, Al, and Fe in the five alites studied at each
cooling rate
Fast Cooled 2.01
Slow Cooled 1.92
Very, Very Slow Cooled 1.98
64
Al appears to decrease with progressively slower cooling, Fe appears to
increase with progressively slower cooling and Mg does not appear to have a
correlation to cooling rate. Although the alites studied showed a slightly higher rate
of total foreign ions in fast cooled clinker, a clear correlation of substitutions and
cooling rate is not evident from this study.
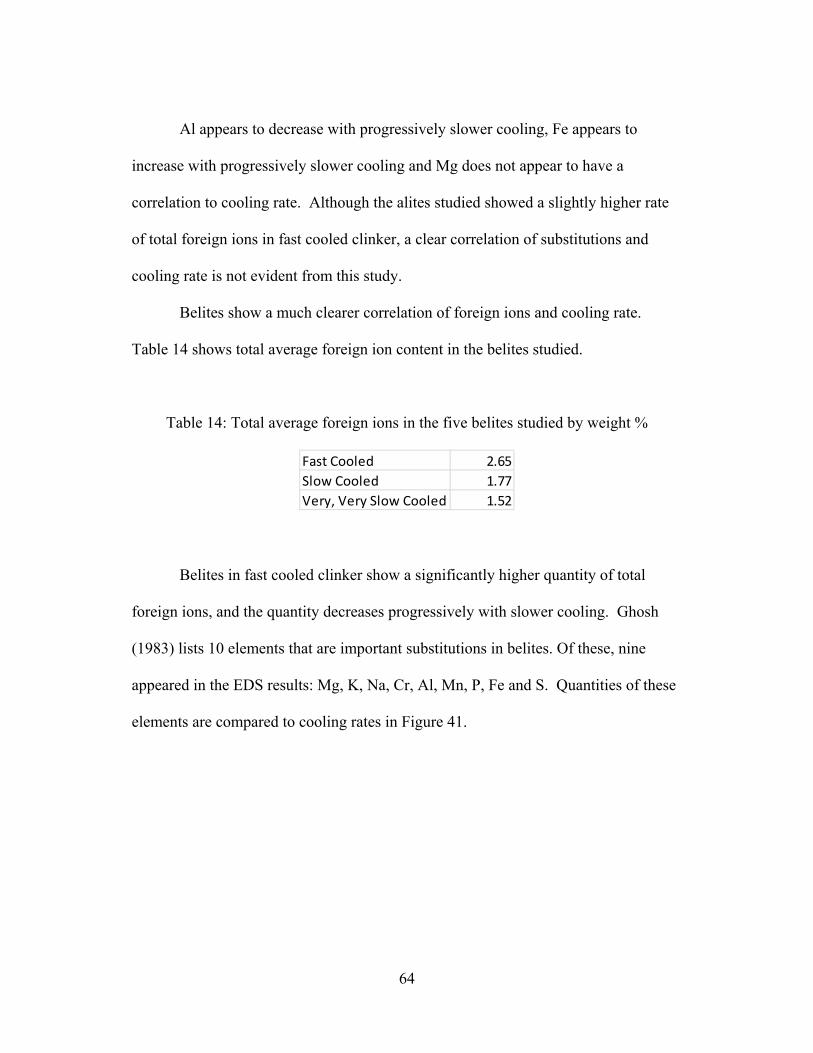
Belites show a much clearer correlation of foreign ions and cooling rate.
Table 14 shows total average foreign ion content in the belites studied.
Table 14: Total average foreign ions in the five belites studied by weight %
Belites in fast cooled clinker show a significantly higher quantity of total
foreign ions, and the quantity decreases progressively with slower cooling. Ghosh
(1983) lists 10 elements that are important substitutions in belites. Of these, nine
appeared in the EDS results: Mg, K, Na, Cr, Al, Mn, P, Fe and S. Quantities of these
elements are compared to cooling rates in Figure 41.
Fast Cooled 2.65
Slow Cooled 1.77
Very, Very Slow Cooled 1.52

65
Figure 41: Average quantities of Mg, K, Na, Cr, Al, Mn, P, Fe, and S in belites
In almost all cases, foreign ion quantities are highest in fast cooled clinker and
most of them progressively decrease with slower cooling.
0
0.1
0.2
0.3
0.4
0.5
0.6
0.7
0.8
0.9
1
FC SC VVSC
Weigh
t %
Cooling Rate
Mg
K
Na
Cr
Al
Mn
P
Fe
S
66
CHAPTER 5
CONCLUSION
The set time and strength qualities of Portland cement are determined by the
minerals present within the cement clinker. Of particular importance are the silicate
phases. Producing highly hydraulically reactive silicate minerals through the cement
making process will provide good set time and good overall strength properties. This
has been a goal of the industry for a very long time and was the objective of this
study.
Of the five cooling rates studied, clear differences in mineralogy were
observed. The fast cooled clinker was removed from the 1500°C and immediately
quenched at room temperature. This produced the best result for a few reasons. Alite
crystals in fast cooled clinker were small with good euhedral crystal form. Crystals
mostly had sharp, clean edges which is optimal for a highly reactive crystal (Taylor,
1997). In reflected light microscopy, alites mostly showed up as bright blue from the
nital etch. Crystals that show up as blue from the nital etch indicate a higher level of
reactivity than those that show up as brown (Campbell, 1999).
Belites in fast cooled clinker also mostly had good crystal form. Crystals
showed up as round, euhedral crystals with clean edges and had clear, cross hatched
lamellae when viewed through various methods of microscopy. Using transmitted
light microscopy, belites showed up as colorless, whereas slower cooled samples
showed up as dark yellow to brown. Colorless belites are optimal and indicate a
67
presence of a high level of foreign ions (Ono, 1981). This was further supported by
EDS results as belites in fast cooled clinker showed an increase of foreign ions and
slower cooled samples progressively showed a decrease in the presence of these ions.
Slower cooling allows for leaching out of foreign ions which puts crystals into a
lower energy state decreasing their hydraulic reactivity. All of these alite and belite
qualities indicate the fast cooled sample would have the highest level of hydraulic
reactivity.
The matrix minerals in the fast cooled sample were smaller and likely
contained a higher glass content. This is a positive benefit for two reasons. First,
smaller crystals of all minerals in clinker allow for easier grindability which is a
benefit when it comes to energy expenditure at the cement plant. Secondly, smaller
aluminate crystals and an increase in glass content are beneficial to resistance to
sulfate attack in the final concrete product (Kohl, 1979). Periclase content was
significantly lower in fast cooled clinker than in all other samples which is a benefit
as periclase can have destructive expansive properties in concrete (Taylor, 1997).
Medium cooled clinker was cooled from a temperature of 1500°C to 950°C
over the span of 20 minutes. The mineralogy of this sample was not as ideal as the
fast cooled clinker but still had some favorable characteristics in terms of hydraulic
reactivity. Alites had mostly optimal crystal form although an increase in belite
inclusions and belite fringing was observed. Belite fringes negatively effect reactivity
for two reasons. First, belite fringes are composed of γ-belite which is virtually
unreactive with water. Secondly, if alite crystals are covered with a layer of these
68
small belite crystals, it can inhibit water from reaching the alite crystal. Many alites
in this sample were blue from the nital etch indicating a higher level of reactivity than
alites that show up as brown from the nital etch.
Belites in the medium cooled sample showed some significant differences as
crystals appeared to have more ragged edges. This is likely due to foreign ions
leaching out of belites and being absorbed by matrix minerals. This would have a
negative effect on reactivity. Crystals of alite, belite, aluminate and ferrite all
appeared larger in the medium cooled sample than in the fast cooled sample.
There were fewer differences among the three slowest cooling rates. Alites
and belites appeared to have increasingly poor crystal form progressively with slower
cooling. Alites had more rounded edges and showed up more often as brown from
the nital etch. Alites in the slowest cooled samples had large inclusions of belite and
belite fringing was common. Belites in the slowest cooled samples showed up as
more ameoboidal and had very ragged edges. Based on observations from
microscopy, γ belite was more common in the slower cooled samples.
Results of this study are supported by strength tests published by Kohl (1979)
which indicated that slower cooling results in decreased cement strength. Based on
these results, it is recommended that clinker should be cooled as quickly as possible.
Cooling from peak temperature to 950°C within a time frame of 20 minutes seems
optimal and realistic for industrial cement plants.
69
APPENDIX A
XRF DATA
PANalytical
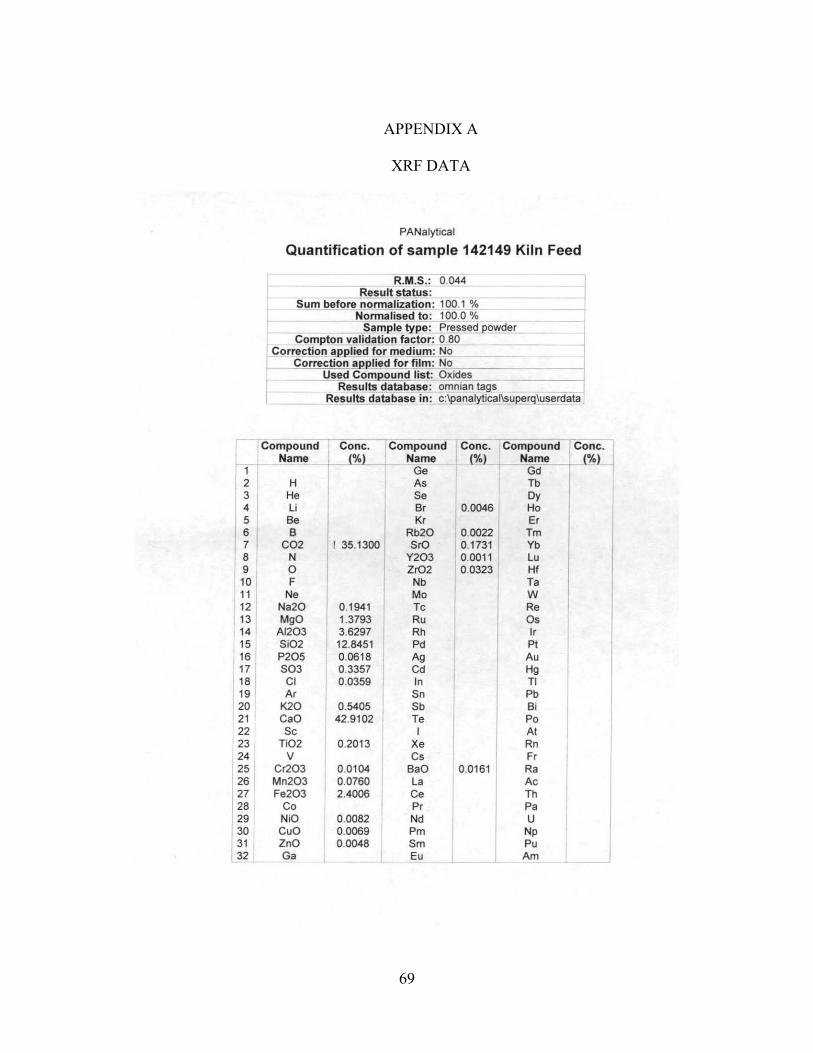
Quantification of sample 142149 Kiln Feed
R.M.S.: 0.044 ......... " ~ Sum before normalization: 100.1 % Normalised to: 100.0 % Sam~pe: Pressed powder
Compton validation factor : 0.80 Correction applied for medium: No
Correction ap-.p1ied for film: No Used Compound list: Oxides
Results database ; omnian tags Results database in: e :\panalytical\superq~userdata
Compound Cone. ' Compound Cone. Compound ' Cone. Name !!) Name % Name
~l 1 Ge Gd 2 H As Tb 3 He Se Oy 4 Li Br 0.0046 Ho 5 Be Kr Er 6 B Rb20 0.0022 Tm 7 CO2 I 35.1300 srO 0.1731 Yb 8 N Y203 I 0.001 1 Lu 9 0 Zr02 0.0323 HI 10 F Nb Ta 11 Ne Mo W 12 Na20 0.1941 Tc Re 13 MgO 1.3793 Ru Os 14 AI203 3.6297 Rh Ir 15 Si02 12.8451 Pd pt
16 P205 0.0618 Ag Au 17 S03 0.3357 Cd Hg 18 CI 0.0359 In TI 19 Ar Sn Pb 20 K20 0.5405 Sb Bi 21 CaO 42.9102 Te Po 22 Sc I At 23 Ti02 0.201 3 Xe Rn 24 V Cs Fr 25 Cr20 3 0.0104 BaO 0.0161 Ra 26 Mn203 0.0760 La Ac 27 Fe203 2.4006 Ce Th
J 28 Co Pr Pa 29 NiO 0.0082 Nd U 30 CuO 0.0069 Pm Np 31 ZnO 0.0048 Sm Pu 32 Ga Eu Am

70
PANalytical
Quantification of sample 142149 Fast Cooled Clinker
1 2 3 4 5 6 7 8 9 10 11 12 13 14 15 16 17 18 19 20 21 22 23 24 25 26 27 28 29 30 31 32
Result status: L R.M.S.: 0.014
S~u-cm""bce"fco-'-rec'normalization: 96.3 o/c~',-__ ~ormalised to: 100.0 %
Saml!!!! ~pe ; Pressed powder Compton validation factor: 0.98
Correctio.!!..!Qplied for medium; No
l Correction applied for film: N:,o,=~ __ _
Used Compound list: Oxides ~==~=d Results database: omnian tag~
ReSUltS database in: c :\pa~tical\superg\userdata
Compound Conc. Compound Conc. I Compound Cone.
t Nam""e_+--'-"%"---t-- Name t {'!!J Nam, .. e,-+-_,(%)
H He Li Be B
C02 N o F
Ne Na20 MgO
AI203 Si02 P205 S03 CI Ar
K20 CaO Sc
Ti02 V
Cr203 Mn203 Fe203
Co NiO Cu
ZnO Ga
! 0.3600
0.1788
0.1649 2.0786 4.7276 21 .1192 0.1237 0.0282 0.0043
0.0429 I 66.5055
0.2963
0.0257 0.1390 3.8345
0.0063
0.0074
Ge Gd As Tb Se Oy Br Ho Kr Er Rb Tm srO 0.2900 Yb
Y203 0.0016 Lu Zr02 0.0135 HI Nb Ta Mo W Tc Re Ru I Os Rh 0.0038 Ir Pd Pt02 0.0241 Ag Au Cd Hg In TI Sn Pb Sb Bi Te Po I At
Xe Rn Cs Fr
BaO 0.0244 Ra La Ac Ce Th Pr Pa Nd U Pm Np
~~ :~~
71
PANalytical
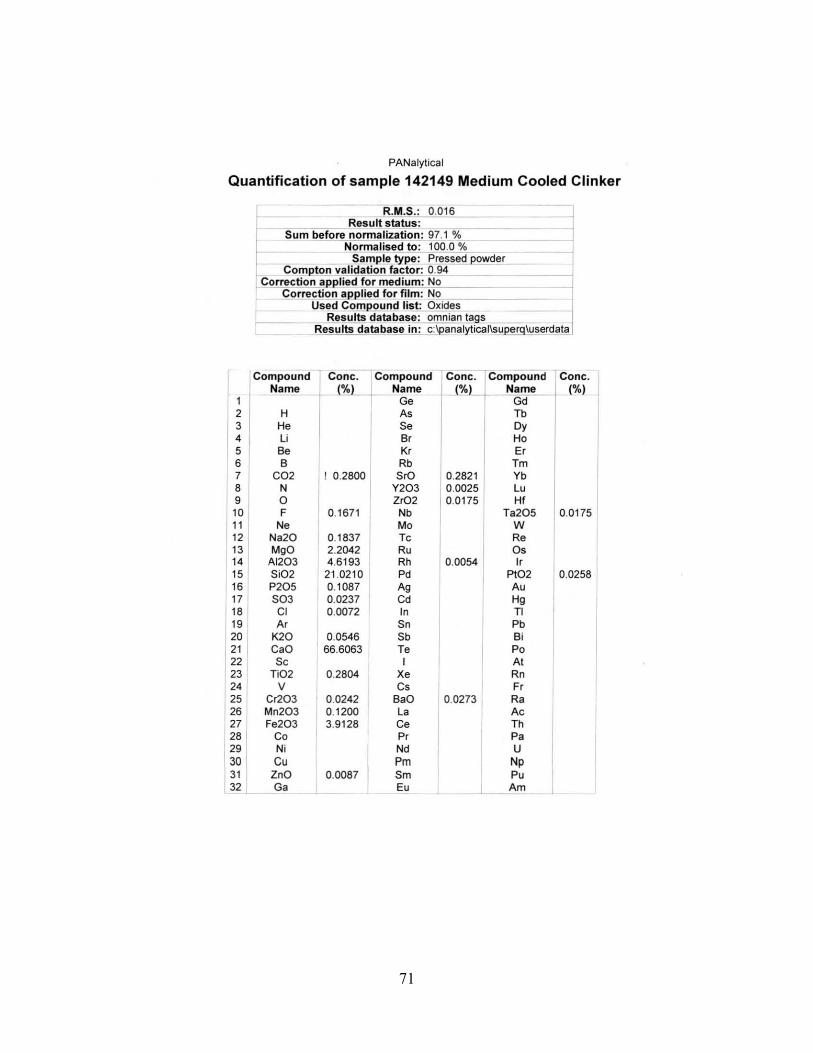
Quantification of sample 142149 Medium Cooled Clinker
---R.M.S.: 0.016
f--Result status:
~ Sum before normalization: 97.1 % Normalised to: 100.0 %
SamQle !YQe: Pressed owder ComQton validation factor: 0.94
Correction appJied for medium: No Correction ap-plied for film: No
Used Comp-ound list: Oxides Results database: omnian ta s
Results databasei n: c:\panal)'ticaf\suQer \userdata
Compound conc~ompound Conc. Compound Conc.
~- r-'" ,,- (%) Name !'!!) 1 Ge Gd 2 H As Tb 3 He Se Oy 4 II Br Ho 5 Be Kr Er 6 B Rb Tm 7 CO2 ! 0.2800 srO 0.2821 Yb 8 N Y203 0.0025 l u 9 0 Zr02 0.0175 Hf 10 F 0.1671 Nb Ta205 0.0175 11 Ne Mo W 12 Na20 0.1837 Tc Re 13 MgO 2.2042 Ru
10
.0054
Os
/ 14 AI203 4.6193 Rh Ir
15 Si02 21 .0210 Pd Pt02 0.0258 16 P205 0.1087 Ag Au 17 S03 0.0237 Cd Hg 18 CI 0.0072 In TI 19 Ar Sn Pb
20 I K20 0.0546 Sb Bi 21 CaD 66.6063 Te Po 22 Sc I At 23 Ti02 0.2804 Xe Rn 24 V Cs Fr 25 Cr203 0.0242 BaD 0.0273 Ra 26 Mn203 0.1200 la Ac 27 Fe203 3.9128 Ce Th 28 Co Pr Pa 29 Ni Nd U 30 Cu Pm Np 31 ZnO 0.0087 Sm Pu 32 I Ga Eu Am
72
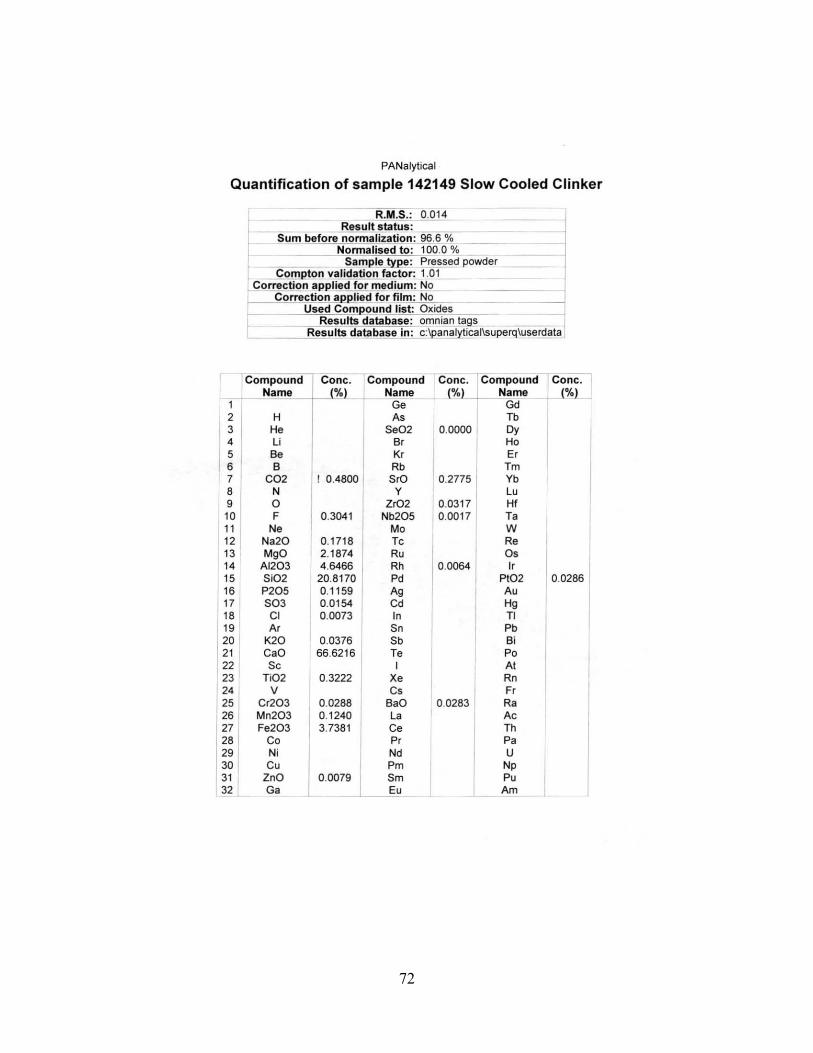
PANalytical
Quantification of sample 142149 Slow Cooled Clinker
I ~ 4 5 6 7 8 9 10 11 12 13 14 15 16 17 18 19 20 21 22 23 24 25 26 27 28 29 30 31 32
R.M.5.: 0.014 ~ Result status:
Sum before normalization: 96.6 % Normalised to":1OO.0 %
1-_~_~_-o!Sample lY.p-e: Pressed powder Compton validation factor: 1.01 _
Corr~P-J~Jjed for medium: No Correction applied for film: No j
Used Comp-ound list: Oxides Results database: omnian ta.",gs"",= = =
'--___ .!R"e"'s"'u"'lts ... database in : c:\panalytical\suQerq\userdata
Compound Name
H He li Be B
CO2 N 0 F
Ne Na20 MgO
AI203 5i02 P205 503 CI Ar
K20 CaO 5e
Ti02 V
Cr203 Mn203 Fe203
Co Ni Cu
ZnO Ga
c. J Compound 1 Conc. i Compound r:onc. +. Name ('!o ) I Name ('!o ) Ge Gd As I Tb
5e02 0.0000 Dy
Con ('!o
Br Ho Kr Er Rb Tm
! 0.4 800 srO 0.2775 Yb
0.3041
0.1718 2.1874 4.6466 20.8170 0.1159 0.0154 0.0073
0.0376 66.6216
0.3222
0.0288 0.1240 3.7381
0.0079
Y Lu Zr02 0.0317 HI
Nb205 0.0017 Ta Mo W Te Ru Rh 0.0064 Pd Ag Cd In Sn 5b Te I
Xe Cs
BaO 0.0283 La Ce Pr Nd Pm Sm Eu
Re Os Ir
Pt02 Au Hg TI Pb Bi Po At Rn Fr Ra Ae Th Pa U Np Pu Am
0.0286 1

73
PANalytical
Quantification of sample 142149 Very Slow Cooled Clinker
-------.R.M.5.:O:D14.---Result status:
Sum before normalization: 97.2 % Normalised to: 100.0 %
___ 5am~le !):~.: Pressed ~'~o"w::>de::::r;--Camp-ton validation factor: 1.05
Correction apl!lied for medium: No Correction al?l?lied for fil:"m~:c.!N",0'S,..,-_
Used Compound list: Oxides ___ Results database: omnian tag~s=====:-d
Results database in: c:\panalvtical\superq\userdata
Compound
1
1 i- Name 2 H 3 He 4 LI 5 Be
1 ~ 1 C~2 10 F 11 Ne 12 Na20 13 MgO 14 AI203 15 Si02 16 P205 17 503 18 CI 19 Ar 20 K20 21 CaO 22 Se 23 Ti02 24 V 25 Cr203 26 1 Mn203
1
27 Fe203 28 Co 29 Ni 30 Cu 31 ZnO 32 Ga
Conc. ('!o)
0.4900
0.2133
0.1656 2.2029 4.6873
20.9616 0.1198 0.0199
0.0419 66.5378
0.2997
0.0247 0.1231 3.7211
Compound Name
Ge As Se Br Kr Rb 5rO
Y203 Zr02 Nb Mo Te Ru Rh Pd Ag Cd In 5n Sb Te I
Xe
0.0078 L
Cs BaO La Ce Pr Nd Pm Sm Eu I
Conc. %)
0.2808 0.0017 0.0397
0.0043 1
0.0366
Compound
Name ---1-''''''---1 Gd Tb Oy Ho Er Tm Yb Lu HI Ta W Re Os Ir
Pt02 Au Hg TI Pb Bi Po At Rn Fr Ra Ae Th Pa U
Np Pu
0.0202
_-"-_ Am l
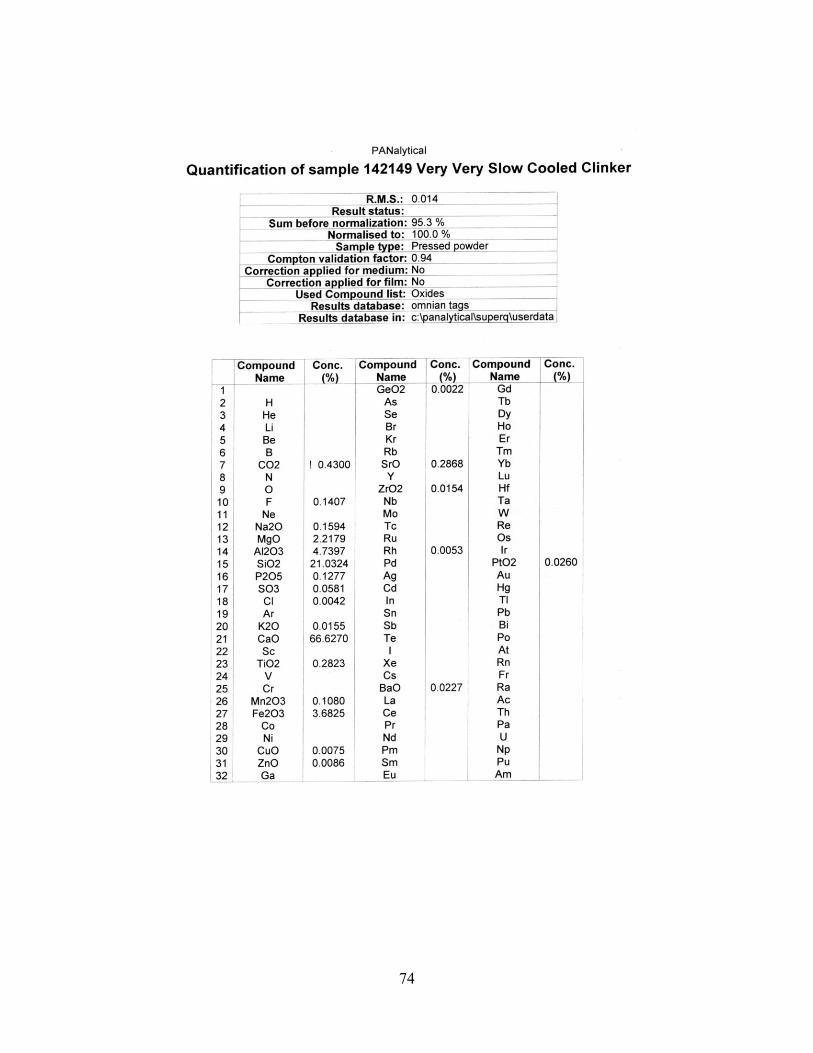
74

75
APPENDIX B
ONO METHOD RESULTS
Sample No. S-142149 Nikon at 400X 1 tick = 2.47 micronsCustomer
widthTicks Microns Ticks Microns Theta Biref. Ticks Microns Color Value
1 20 49.4 9 22.23 32 0.0058 13 32.11 py 32 14 34.58 7 17.29 21 0.0049 12 29.64 cl 43 15 37.05 8 19.76 39 0.0080 12 29.64 cl 44 11 27.17 6 14.82 36 0.0098 20 49.4 py 35 14 34.58 6 14.82 20 0.0055 24 59.28 cl 46 11 27.17 7 17.29 41 0.0096 15 37.05 py 37 11 27.17 6 14.82 22 0.0060 11 27.17 py 38 14 34.58 6 14.82 32 0.0087 17 41.99 cl 49 14 34.58 6 14.82 42 0.0115 23 56.81 cl 4
10 15 37.05 6 14.82 38 0.0104 19 46.93 py 334.3 16.5 0.0080 41.0 3.5
Heating rate (size of alite) = Average
Max temp (birefringence of alite) = Excellent
Burning time (size of belite) = Excellent
Cooling rate (color of belite) = Excellent
Sample Description Fast Cooled Clinker (made in lab)
Clinker Analysis ONOBobby BullardAnalyzed by:
ExcelChanute
amber = 1yellow = 2
clear = 4pale yellow = 3
Alite Length Alite Birefringence Belite Diameter Belite Color
Sample No. 142149 Nikon at 400X 1 tick = 2.47 micronsCustomer
widthTicks Microns Ticks Microns Theta Biref. Ticks Microns Color Value
1 25 61.75 15 37.05 39 0.0043 14 34.58 py 32 11 27.17 5 12.35 31 0.0102 30 74.1 amb 13 12 29.64 7 17.29 20 0.0047 18 44.46 yel 24 14 34.58 7 17.29 31 0.0073 22 54.34 py 35 28 69.16 14 34.58 37 0.0043 23 56.81 yel 26 18 44.46 9 22.23 38 0.0069 25 61.75 yel 27 13 32.11 6 14.82 29 0.0079 17 41.99 yel 28 16 39.52 5 12.35 32 0.0105 26 64.22 yel 29 24 59.28 12 29.64 60 0.0082 26 64.22 amb 1
10 20 49.4 10 24.7 50 0.0082 10 24.7 yel 244.7 22.2 0.0072 52.1 2.0
Heating rate (size of alite) = Poor
Max temp (birefringence of alite) = Good
Burning time (size of belite) = Excellent
Cooling rate (color of belite) = Average
amber = 1yellow = 2
clear = 4pale yellow = 3
Alite Length Alite Birefringence Belite Diameter Belite ColorSample Description Slow Cooled Clinker made in lab
Clinker Analysis ONOBobby BullardAnalyzed by:
ExcelChanute
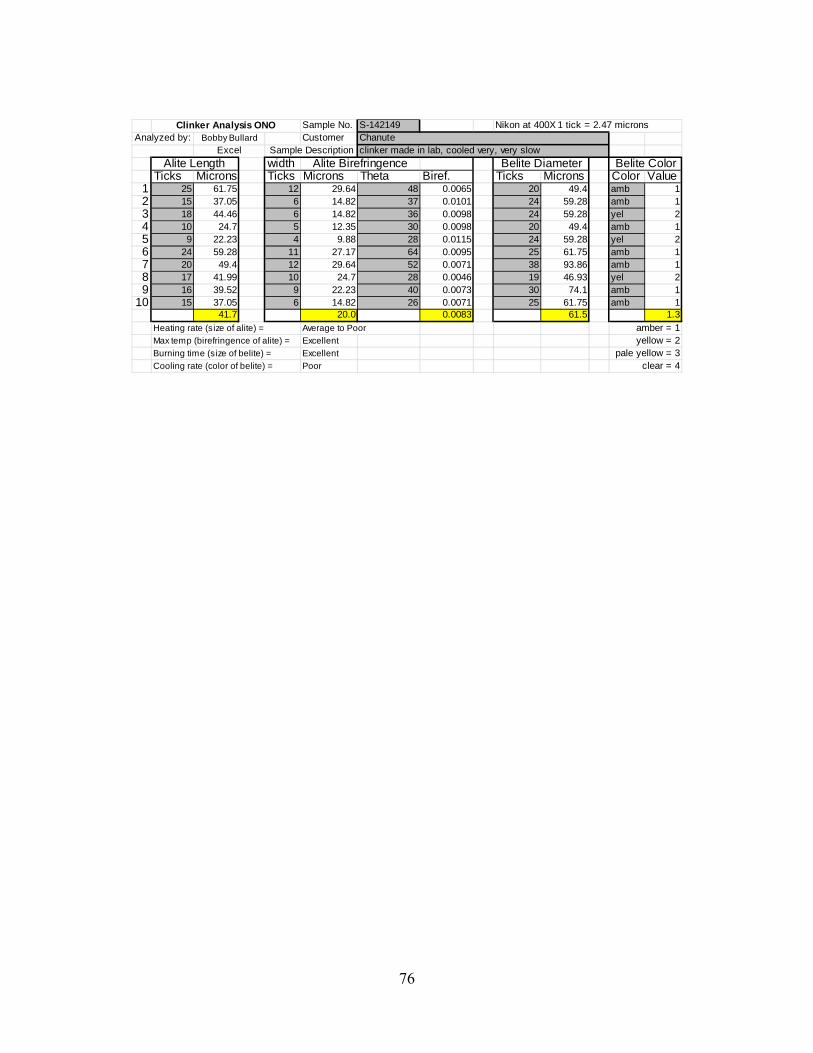
76
Sample No. S-142149 Nikon at 400X 1 tick = 2.47 micronsCustomer
widthTicks Microns Ticks Microns Theta Biref. Ticks Microns Color Value
1 25 61.75 12 29.64 48 0.0065 20 49.4 amb 12 15 37.05 6 14.82 37 0.0101 24 59.28 amb 13 18 44.46 6 14.82 36 0.0098 24 59.28 yel 24 10 24.7 5 12.35 30 0.0098 20 49.4 amb 15 9 22.23 4 9.88 28 0.0115 24 59.28 yel 26 24 59.28 11 27.17 64 0.0095 25 61.75 amb 17 20 49.4 12 29.64 52 0.0071 38 93.86 amb 18 17 41.99 10 24.7 28 0.0046 19 46.93 yel 29 16 39.52 9 22.23 40 0.0073 30 74.1 amb 1
10 15 37.05 6 14.82 26 0.0071 25 61.75 amb 141.7 20.0 0.0083 61.5 1.3
Heating rate (size of alite) = Average to Poor
Max temp (birefringence of alite) = Excellent
Burning time (size of belite) = Excellent
Cooling rate (color of belite) = Poor
amber = 1yellow = 2
clear = 4pale yellow = 3
Alite Length Alite Birefringence Belite Diameter Belite ColorSample Description clinker made in lab, cooled very, very slow
Clinker Analysis ONOBobby BullardAnalyzed by:
ExcelChanute

77
REFERENCES
ASTM Standard C150/C150M-12, 2012, Standard Specification for Portland Cement, ASTM International, West Conshohocken, PA, 2012, DOI: 10.1520/C0150_C0150M-12, www.astm.org
ASTM Standard C-114 Standard Test Methods for Chemical Analysis of
Hydraulic Cement, ASTM International, West Conshohocken, PA, 2012, DOI: 10.1520/C0114, www.astm.org
Alsop, P.A., Chen, H., Tseng, H., 2007, The Cement Plant Operations Handbook,
Tradeship Publications, Surrey, United Kingdom, 276 p. Bye, G.C., 1983, Portland Cement Composition, Production and Properties,
Pergamon Press, Oxford, 149 p. Campbell, D. H., 1999, Microscopical Examination and Interpretation of Portland
Cement and Clinker, Portland Cement Association, Skokie, IL, 201 p. Chromy, S., 1970, Allotropic Varieties of C2S in the Portland Cement Clinker,
Silikaty, v. 14, p. 241-248 Ghosh, S. K., 1983, Portland Cement Phases: Polymorphism, Solid Solution,
Defect Structure, and Hydraulicity, Advances in Cement Technology, Pergamon Press, New York, NY, p. 289-305
Grossman, J. C., 2012, Introduction to Modeling and Simulation Spring 2012 Part II – Quantum Mechanical Methods, http://ocw.mit.edu/courses/materials-science-and-engineering/3-021j-introduction-to-modeling-and-simulation-spring-2012/part-ii-lectures-videos-and-notes/MIT3_021JS12_L0.pdf (10/13/14)
Hahn, T., Eysel, W. and Woermann, E., 1969, Zement Kalk-Gips, 5th ISCC, v. 1,
p. 61 Herfort, D., Moir, G. K., Johansen, V., Sorrentino, F., Bolio Arceo, H., 2010, The
chemistry of Portland cement clinker: Advances in cement research, v 22, no 4, p 187-194
Hills, Linda M., 2000, Clinker Formation and the Value of Microscopy,
Proceedings of the Twenty-Second International Conference of Cement Microscopy, Montreal, p. 1-12

78
Insley, H., 1936, Structural characteristics of some constituents of Portland cement clinker, Journal of Research, National Bureau of Standards, v. 17, p. 353-361
Kohl, R. F., 1979, Effects of Cooling Rate, Kiln Paper no. 24, Portland Cement
Association, Skokie, Il, p. 1-23 Kosmatka, S. H., Kerkhoff, B., and Panarese, W.C., 2002, Design and Control of
Concrete Mixtures, Portland Cement Association, Skokie, IL, 358 p. Kurdowski, W., 2014, Cement and Concrete Chemistry, Springer, New York,
NY, 700 p. Lea, F.M., 1972, The Chemistry of Cement and Concrete, Chemical Publishing
Inc., New York, NY, 1092 p. Maki, I. and Goto, K., 1982, Factors influencing the phase constitution of alite in
Portland cement clinker, Cement and Concrete Research, v. 12, p. 301-308
Maki, I., 1994, Processing Conditions of Portland Cement Clinker as Viewed
from the Fine Textures of the Constituent Minerals, Ceramic Transactions, v. 40, p 3-17
Odler, I., 1998, Hydration, Setting and Hardening of Portland Cement, Hewlitt,
P.C ed., Lea’s Chemistry of Cement and Concrete, Arnold, London, p. 241-298
Ono, Y., Kawamura, S., and Soda, Y., 1968, Microscopic Observations of Alite
and Belite and Hydraulic Strength of Cement, Fifth International Symposium on Chemistry of Cement, Tokyo, v. 1, p. 275-284
Ono, Y., 1981, Microscopical Observations of Clinker for the Estimation of
Burning Condition, Grindability, and Hydraulic Activity: Proceedings of the Third International Conference on Cement Microscopy, International Cement Microscopy Association, Houston, Texas, p 198-210
Ono, Y., 1995, Fundamental Microscopy of Portland Cement Clinker, Chichibu
Onoda Cement Corporation, 229 p. Peray, K.E. and Waddell, J.J., 1972, The Rotary Cement Kiln, Chemical, New
York, NY, 194 p.
79
Saini, A. and Guiliani, N., 1995, Improvements in XRD Analysis of Clinker by Using Optical Microscopy and Selective Extraction Techniques. Contribution and Limits of Calculation Formulas: Proceedings of the 17th International Conference on Cement Microscopy, International Cement Microscopy Association, Calgary, Alberta, p 162-181
St John, D. A., Poole, A. B. and Sims, I., 1998, Concrete Petrography, Wiley,
London, 474 p. Taylor, H.F.W., 1997, Cement Chemistry, Thomas Telford Services, Trowbridge,
Wiltshire, Great Britain, 459 p. Tornebohm, A.E., 1897, The petrography of Portland cement, Tornindustrie
Zeitung, v. 21, p. 1148-1159 Ward, G.W., 1941, Effect of Heat Treatment and Cooling Rate on the
Microscopic Structure of Portland Cement Clinker, Journal of Research of the National Bureau of Standards, v. 26, p. 49-64
Winter, N.B., 2012, Understanding Cement, WHD Microanalysis Consultants,
Rendelsham, 206 p. Yamaguchi, G., and Takagi, S., 1968, Analysis of Portland Cement Clinker, Fifth
International Symposium on the Chemistry of Cement, Tokyo, V. 1, p. 181-218
80
VITA
Robert Alan Bullard was born in Kansas City on December 11, 1981. He was
educated in the Lee’s Summit School District, graduating from Lee’s Summit North
High School in 2000. After high school, Mr. Bullard enrolled at the University of
Missouri-Columbia and graduated with a Bachelor of Science in Business in 2004.
From 2004-2011, Mr. Bullard worked various jobs in sales and marketing.
From 2011-2012 he lived in Guri, South Korea where he worked as an English
teacher at an elementary school.
In the fall of 2012, Mr. Bullard enrolled at the University of Missouri-Kansas
City and began working toward a Master of Science in Environmental and Urban
Geosciences, emphasis in Environmental Geology. While at UMKC, he has been
involved with the Association of Environmental and Engineering Geologists (AEG)
student chapter. In 2014, he was the teaching assistant for Geology Field Camp.
In 2014, Mr. Bullard began an internship at Ash Grove Cement Company and
is currently employed there. Upon completion of his degree requirements, he plans to
begin working full time at Ash Grove and pursue professional registration as a
geologist.


![Indigenous Enhanced Mineralization Pyrene, Benzo[a]pyrene ...Indigenous soil microorganism mineralization experiments. All of the mineralization experiments were performed by using](https://img.pdfslide.us/doc/110x75/5e7c41b0b7c4ef64181e5e16/indigenous-enhanced-mineralization-pyrene-benzoapyrene-indigenous-soil-microorganism.jpg)