Embed Size (px)
Citation preview
EFFECT OF COMPOSTING ON THE PREVALENCE OF ANTIBIOTIC
RESISTANT BACTERIA AND RESISTANCE
GENES IN CATTLE MANURE
By
Robert K. Williams
Thesis submitted to the faculty of the Virginia Polytechnic Institute and State University in
partial fulfillment of the requirements for the degree of
Master of Science
In
Environmental Engineering
Amy Pruden, Chair
Leigh-Anne Krometis
Gregory D. Boardman
December 13, 2016
Blacksburg, Virginia
Keywords: Antibiotic resistant bacteria, ARBs, Antibiotic resistance genes, ARGs, compost,
manure.
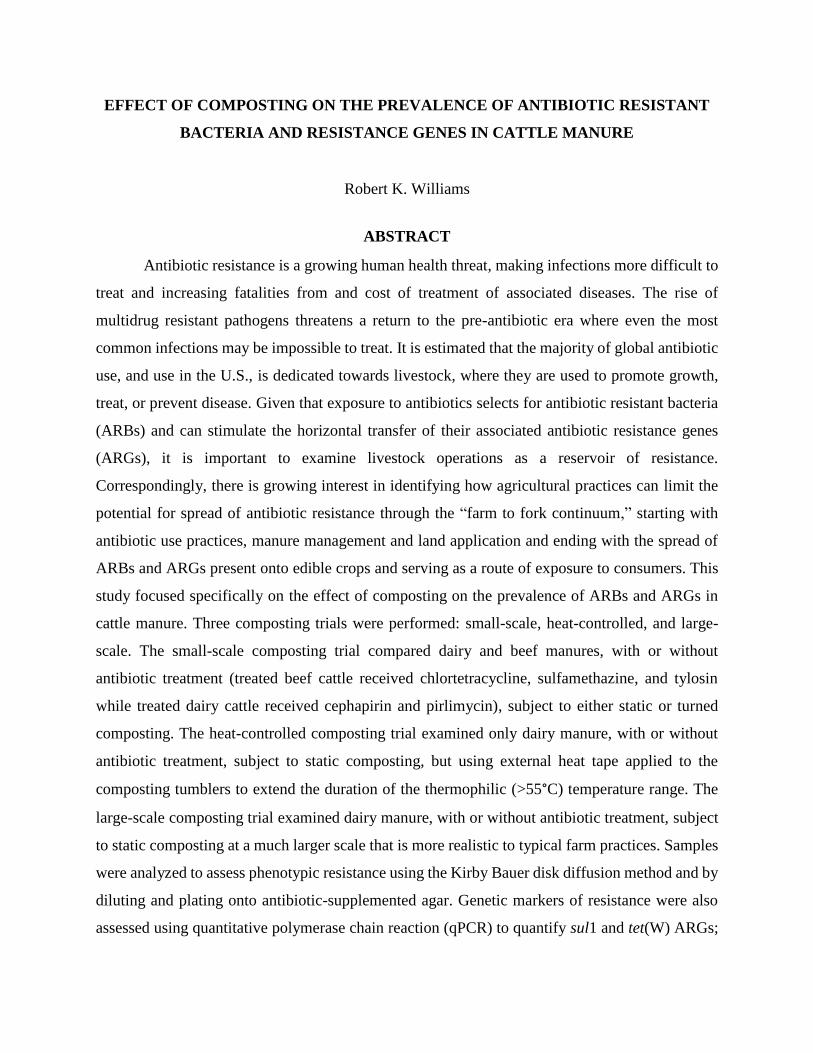
EFFECT OF COMPOSTING ON THE PREVALENCE OF ANTIBIOTIC RESISTANT
BACTERIA AND RESISTANCE GENES IN CATTLE MANURE
Robert K. Williams
ABSTRACT
Antibiotic resistance is a growing human health threat, making infections more difficult to
treat and increasing fatalities from and cost of treatment of associated diseases. The rise of
multidrug resistant pathogens threatens a return to the pre-antibiotic era where even the most
common infections may be impossible to treat. It is estimated that the majority of global antibiotic
use, and use in the U.S., is dedicated towards livestock, where they are used to promote growth,
treat, or prevent disease. Given that exposure to antibiotics selects for antibiotic resistant bacteria
(ARBs) and can stimulate the horizontal transfer of their associated antibiotic resistance genes
(ARGs), it is important to examine livestock operations as a reservoir of resistance.
Correspondingly, there is growing interest in identifying how agricultural practices can limit the
potential for spread of antibiotic resistance through the “farm to fork continuum,” starting with
antibiotic use practices, manure management and land application and ending with the spread of
ARBs and ARGs present onto edible crops and serving as a route of exposure to consumers. This
study focused specifically on the effect of composting on the prevalence of ARBs and ARGs in
cattle manure. Three composting trials were performed: small-scale, heat-controlled, and large-
scale. The small-scale composting trial compared dairy and beef manures, with or without
antibiotic treatment (treated beef cattle received chlortetracycline, sulfamethazine, and tylosin
while treated dairy cattle received cephapirin and pirlimycin), subject to either static or turned
composting. The heat-controlled composting trial examined only dairy manure, with or without
antibiotic treatment, subject to static composting, but using external heat tape applied to the
composting tumblers to extend the duration of the thermophilic (>55°C) temperature range. The
large-scale composting trial examined dairy manure, with or without antibiotic treatment, subject
to static composting at a much larger scale that is more realistic to typical farm practices. Samples
were analyzed to assess phenotypic resistance using the Kirby Bauer disk diffusion method and by
diluting and plating onto antibiotic-supplemented agar. Genetic markers of resistance were also
assessed using quantitative polymerase chain reaction (qPCR) to quantify sul1 and tet(W) ARGs;
metagenomic DNA sequencing and analysis were also performed to assess and compare total ARG
abundance and types across all samples. Results indicate that composting can enrich indicators of
phenotypic and genetic resistance traits to certain antibiotics, but that most ARGs are successfully
attenuated during composting, as evidenced by the metagenomic sequencing. Maintaining
thermophilic composting temperatures for adequate time is necessary for the effective elimination
of enteric bacteria. This study suggests that indicator bacteria that survive composting tend to be
more resistant than those in the original raw manure; however, extending the thermophilic stage
of composting, as was done in the heat-controlled trial, can reduce target indicator bacteria below
detection limits. Of the two ARGs specifically quantified via qPCR, prior administration of
antibiotics to cattle only had a significant impact on tet(W). There was not an obvious difference
in the final antibiotic resistance profiles in the finished beef versus dairy manure composts
according to metagenomics analysis. Based on these results, composting is promising as a method
of attenuating ARGs, but further research is necessary to examine in depth all of the complex
interactions that occur during the composting process to maximize performance. If not applied
appropriately, e.g., if time and temperature guidelines are not enforced, then there is potential that
composting could exacerbate the spread of certain types of antibiotic resistance.
EFFECT OF COMPOSTING ON THE PREVALENCE OF ANTIBIOTIC RESISTANT
BACTERIA AND RESISTANCE GENES IN CATTLE MANURE
Robert K. Williams
GENERAL AUDIENCE ABSTRACT
Antibiotics are drugs that are used to treat bacterial infections by killing the bacteria that
cause the infection. Bacterial infections now exist that are resistant to several antibiotics; which
are extremely difficult and costly to treat. Many antibiotics are used in the agriculture industry
where they are used to promote growth, treat, or prevent disease in livestock animals. The
antibiotics may then cause an increase in antibiotic resistance in bacteria by encouraging changes
to the DNA of the bacteria which allow them to survive in the presence of antibiotics that would
normally kill them. These DNA segments are called antibiotic resistance genes. Once developed,
bacteria can share resistance genes among themselves, allowing for single bacteria that can resist
several types of antibiotics. For this reason, it is important to see if it is possible to prevent the
spread of antibiotic resistance from animal agriculture to people. One way that people could be
affected would be if produce were exposed to resistant bacteria when grown in soil that had been
fertilized with manure or compost. This study looks at the impact of composting on the presence
and amount of antibiotic resistance genes in composted cattle manure. Three composting trials
were performed: small-scale, heat-controlled, and large-scale. The small-scale composting trial
compared dairy and beef manures, with or without antibiotic treatment, with or without regular
turning during composting. The heat-controlled composting trial examined only dairy manure,
with or without antibiotic treatment, without regular turning during composting, but using external
heat to maintain high temperatures. The large-scale composting trial examined dairy manure, with
or without antibiotic treatment, without regular turning during composting, but at a larger scale
that is more realistic to how composting is actually performed on farms. Antibiotic resistance of
compost bacteria was tested by growing bacteria on nutrient-dense plates containing antibiotic
disks and measuring how much each antibiotic prevented the growth of the bacteria, in terms of
the diameter about each disk where bacteria did not grow. Individual target resistance genes were
measured throughout the study by using a method called qPCR. Metagenomic analysis was
performed to identify all of the genes, especially resistance genes, in each of the samples. Results

v
show that composting may increase antibiotic resistance in bacteria that survive the composting
process, but that most resistance genes are themselves reduced. The key to successful composting
is maintaining high temperatures for as long as possible; this is necessary to kill off infectious
bacteria. Extending the high temperature (>55°C) phase of composting is a potential method for
improving the effectiveness of composting in eliminating pathogens and destroying resistance
genes. Results were not significantly affected by whether antibiotics were given to the cattle and
were not different between dairy or beef cattle. Based on these results, composting is a promising
method of reducing resistance genes in composted manure, but further research is necessary to
maximize performance. If not performed correctly, composting could have the opposite effect and
be detrimental.
vi
ACKNOWLEDGEMENTS
I am incredibly grateful to all of the people who supported me during my pursuit of my
master’s degree. I would like to thank Dr. Amy Pruden, my primary advisor, as well as Dr. Leigh-
Anne Krometis and Dr. Monica Ponder, co-PI’s on the project, for their guidance and support. I
would like to thank the other members of the USDA project team, including Partha Ray, Giselle
Guron, Christine Pankow, Lauren Wind, Chaoqi Chen, and Kyle Jacobs, who assisted me at
various times. I would also like to thank all of the members of our “Prudenian” research team who
aided in teaching me and coaching me in performing new techniques and helping with complex
analyses: Pan Ji, Emily Garner, and Jake Metch, and other individuals who assisted with my
research at various times: Rachel Craine, Jian Li, and Kim Waterman. Most of all I would like to
thank my wife, Jackie, for her support and understanding as I have struggled these two and a half
years to now finally achieve this goal.

vii
TABLE OF CONTENTS
1. ANTIBIOTIC RESISTANCE IN AGRICULTURAL COMPOST AND MANURE:
BACKGROUND AND LITERATURE REVIEW……………………………………………..1
1.1. ANTIBIOTIC RESISTANCE……………………………………………………...…2
1.1.1. ANTIBIOTIC RESISTANCE GENES……………………………………..3
1.2. ANTIBIOTIC RESISTANCE IN AGRICULTURE………………………………….5
1.2.1. THE FARM TO FORK CONTINUUM……………………………………5
1.2.2. MANURE TREATMENT STRATEGIES…………………………………6
1.2.3. MANURE COMPOSTING………………..……………………………….7
1.3. SELECT CLASSES OF ANTIBIOTICS AND BACTERIAL MODES OF
RESISTANCE…………………………………………………………………………...10
1.3.1. β-LACTAMS……………………………………………………………...10
1.3.2. GLYCOPEPTIDES………………………………………………………..11
1.3.3. FLUOROQUINOLONES…………………………………………………12
1.3.4. MACROLIDES AND LINCOSAMIDES…………………………………12
1.3.5. SULFONAMIDES………………………………………………………...13
1.3.6. TETRACYCLINES……………………………………………………….13
1.4. METHODS FOR THE DETECTION AND QUANTIFICATION OF ANTIBIOTIC
RESISTANCE…………………………………………………………………………...14
1.4.1. CULTURE BASED TECHNIQUES……………………………………....14
1.4.2. GENETIC TECHNIQUES………………………………………………...15
1.5. GOALS AND OBJECTIVES………………………………………………………..16
1.6. HYPOTHESES……………………………………………...………………………17
2. METHODS AND MATERIALS……………………………..……………………………...18
2.1. SMALL SCALE COMPOSTING SETUP…………………………..……………...19
2.2. HEAT CONTROLLED COMPOSTING SETUP……………………..……………20
2.3. LARGE SCALE COMPOSTING SETUP………………………………...………...20
2.4. BACTERIAL CULTURING AND ENUMERATION……………………..………21
2.5. IDEXX ENUMERATION OF E. COLI………………………..…………………...21
2.6. KIRBY BAUER DISK DIFFUSION TEST…………………………………………22
2.7. DNA EXTRACTION………………………………………………………………..22
viii
2.8. WHOLE GENOME SEQUENCING OF KIRBY BAUER ISOLATES…………….23
2.9. METAGENOMIC SEQUENCING AND ANALYSIS……………………………...23
2.10. 16S AMPLICON SEQUENCING………………………………………………….24
2.11. QUANTITATIVE POLYMERASE CHAIN REACTION (QPCR)……………….24
2.12. STATISTICAL ANALYSES………………………………………………………25
3. EFFECT OF COMPOSTING ON THE PREVALENCE OF ARBs AND ARGs IN
CATTLE MANURE: RESULTS…………………….………………………………………...26
3.1. CULTURE BASED ENUMERATION AND RESISTANCE TESTING…..……....26
3.1.1. SMALL SCALE COMPOSTING…………………………………………26
3.1.2. HEAT CONTROLLED COMPOSTING………………………………….34
3.1.3. LARGE SCALE COMPOSTING…………………………………………40
3.2. QUANTITATIVE POLYMERASE CHAIN REACTION (QPCR)………………...41
3.2.1. SMALL SCALE COMPOSTING…………………………………………41
3.2.2. HEAT CONTROLLED COMPOSTING………………………………….47
3.2.3. LARGE SCALE COMPOSTING…………………………………………50
3.3. METAGENOMIC SEQUENCING…………………………………………………52
3.3.1. SMALL SCALE COMPOSTING…………………………………………52
3.3.2. HEAT CONTROLLED COMPOSTING………………………………….59
3.4. 16S AMPLICON SEQUENCING…………………………………………………...64
3.4.1. SMALL SCALE COMPOSTING…………………………………………64
3.4.2. HEAT CONTROLLED COMPOSTING………………………………….72
3.4.3. LARGE SCALE COMPOSTING…………………………………………78
4. EFFECT OF COMPOSTING ON THE PREVALENCE OF ARBs AND ARGs IN
CATTLE MANURE: DISCUSSION AND CONCLUSIONS………………………...……...86
4.1. EFFECT OF COMPOSTING………………………………………………………..86
4.2. EFFECT OF ANTIBIOTIC TREATMENT OF CATTLE…………………………..88
4.3. EFFECT OF DAIRY OR BEEF MANURE…………………………………………89
4.4. EFFECT OF DNA EXTRACTION KIT…………………………………………….89
4.5 SUMMARY AND CONCLUSIONS………………………………………………...90
REFERENCES………………………………………………………………...………………..91
ix
LIST OF FIGURES
Figure 3.1. Total heterotrophic plate counts (HPCs) over time for raw manure (day 0 only) and
both static and turned composting methods………………………………..…………………….27
Figure 3.2. Comparison of total heterotrophic plate counts (HPCs) on day 0 with those on day 42
by manure type……………………………………..…………………………………………….28
Figure 3.3. Fecal coliforms, as determined by MacConkey plate counts, for raw manure (day 0
only) as well as static and turned composting methods over time ………………………………28
Figure 3.4. Comparison of fecal coliforms, as determined by MacConkey plate counts, on day 0
with those on day 42 by manure type. ……………………..…………………………………….29
Figure 3.5. Abundance of E. coli measured using IDEXX with Colilert………………………….30
Figure 3.6. Comparison of E. coli counts between day 21 and day 42 of composting, broken down
by manure type…………………………………………………...………………………………30
Figure 3.7. Number of MacConkey isolates classified as resistant to each of six antibiotics
according to the Kirby-Bauer disk diffusion assay, organized by composting method.….……...31
Figure 3.8. Number of isolates classified as resistant to each of six antibiotics according to the
Kirby-Bauer disk diffusion assay, in finished day 42 compost derived from the four manure
types. ……………….…………………………………………………………………………....32
Figure 3.9. Comparison of multi-antibiotic resistance occurrence among the MacConkey isolates,
as determined by the Kirby-Bauer disk diffusion assay, organized by composting method……..33
Figure 3.10. Comparison of multi-antibiotic resistance occurrence among the MacConkey isolates,
as determined by the Kirby-Bauer disk diffusion assay, organized by the type of manure subject
to composting…………………………………………………………………………………….34
Figure 3.11. Proportion of ceftazidime resistant fecal coliforms relative to total fecal coliforms, as
determined by MacConkey plate counts …………………………………………………………35
Figure 3.12. Proportion of cefotaxime resistant fecal coliforms relative to total fecal coliforms, as
determined by MacConkey plate counts. ………………………………..………………………36
x
Figure 3.13. Proportion of tetracycline resistant fecal coliforms relative to total fecal coliforms, as
determined by MacConkey plate counts. ……………………………………..…………………37
Figure 3.14. Proportion of erythromycin resistant fecal coliforms relative to total fecal coliforms,
as determined by MacConkey plate counts. ……………………...………………………………38
Figure 3.15. Proportion of clindamycin resistant fecal coliforms relative to total fecal coliforms,
as determined by MacConkey plate counts. ...……………………………………………………39
Figure 3.16. Abundance of E. coli measured using IDEXX with Colilert………………………...40
Figure 3.17. Abundance of E. coli measured using IDEXX with Colilert………………………...41
Figure 3.18. Abundance of sul1 genes over time, by composting method………………………..42
Figure 3.19. Comparison of sul1 gene abundance on day 0 with that on day 42, by manure type
subject to composting…………………………………………………………………………….43
Figure 3.20. Relative abundance of sul1 genes to 16S genes over time, by composting method….43
Figure 3.21. Comparison of relative abundance of sul1 to 16S genes on day 0 with that on day 42,
by manure type subject to composting……………………………………………………………44
Figure 3.22. Abundance of tet(W) genes over time, by composting method…………………….45
Figure 3.23. Comparison of tet(W) gene abundance on day 0 with that on day 42, by manure type
subject to composting…………………………………………………………………………….45
Figure 3.24. Relative abundance of tet(W) genes, normalized to 16S rRNA genes, over time, by
composting method.…………………...…………………………………………………………46
Figure 3.25. Comparison of relative abundance of tet(W) to 16S genes on day 0 with that on day
42, by manure type subject to composting………………………………………….……………47
Figure 3.26. Abundance of sul1 genes over time by manure type………………………………...48
Figure 3.27. Relative abundance of sul1, normalized to 16S rRNA genes, over time by manure
type subject to composting……………………………………………………………………….48
Figure 3. 28. Abundance of tet(W) over time by manure type subject to composting…………...49

xi
Figure 3.29. Relative abundance of tet(W), normalized to 16S rRNA genes, by manure type subject
to composting.……………………………………………………………………………...….....49
Figure 3.30. Effect of treatment type on abundance of sul1 genes with time……………………50
Figure 3.31. Relative abundance of sul1, normalized to 16S rRNA genes, over time by treatment
type……………………………………………………………………………………………….51
Figure 3.32. Abundance of tet(W) with respect to time by treatment type……………………….51
Figure 3.33. Relative abundance of tet(W) to 16s genes over time by treatment type……………52
Figure 3.34. Comparison of total resistance gene category abundance by composting method on
day 0……………………………………………………………………………………………...54
Figure 3.35. Comparison of total resistance gene category abundance by composting method on
day 42…………………………………………………………………………………………….54
Figure 3.36. Comparison of total resistance gene category abundance by manure type on day 0…55
Figure 3.37. Comparison of resistance gene category abundance by manure type on day 42……..56
Figure 3.38. MDS plot of ARG profile similarity with respect to time…………………………...57
Figure 3.39. MDS plot of ARG profile similarity by manure type, day 42 only…………………..57
Figure 3.40. MDS plot of ARG profile similarity for day 4 and day 42 labelled by composting
method……………………………………………………………………………………………58
Figure 3.41. Comparison among composting methods of total ARGs of clinical concern based on
metagenomic sequencing and comparison with the CARD database, day 0 versus day 42……….59
Figure 3.42. Comparison of total resistance gene category abundance by manure type on day 0…60
Figure 3.43. Comparison of total resistance gene category abundance by manure type on day
42……………………………………………………………………………………………........61
Figure 3.44. MDS plot comparing ARG profile similarity by time……………………………….62
Figure 3.45. MDS plot comparing ARG profile similarity with respect to manure type, day 42
only………………………………………………………………………………………………63
xii
Figure 3.46. Comparison among manure types of total ARGs of clinical concern based on
metagenomic sequencing and comparison with the CARD database, day 0 versus day 42……….64
Figure 3.47. Comparison of a class-level taxonomic composition with respect to time…………..65
Figure 3.48. Comparison of a class-level taxonomic composition with respect to composting
method……………………………………………………………………………………………66
Figure 3.49. Comparison of a class-level taxonomic composition with respect to manure type….67
Figure 3.50. Comparison of a class-level taxonomic composition with respect to DNA extraction
kit used…………………………………………………………………………………………...68
Figure 3.51. MDS plot based on the unweighted UniFrac distance matrix comparing taxonomic
similarity, labelled with respect to time…………………………………………………………..69
Figure 3.52. MDS plot on the unweighted UniFrac distance matrix comparing taxonomic similarity
of day 42 samples only, labelled with respect to composting method…………………………….70
Figure 3.53. MDS plot on the unweighted UniFrac distance matrix comparing taxonomic similarity
of day 42 beef compost samples only, labelled with respect to antibiotic treatment………………71
Figure 3.54. MDS plot on the unweighted UniFrac distance matrix comparing taxonomic similarity
of day 42 dairy compost samples only, labelled with respect to antibiotic treatment……………..72
Figure 3.55. Comparison of a class-level taxonomic composition with respect to time…………..73
Figure 3.56. Comparison of a class-level taxonomic composition with respect to composting
method……………………………………………………………………………………………74
Figure 3.57. Comparison of a class-level taxonomic composition with respect to manure type on
day 42…………………………………………………………………………………………….75
Figure 3.58. Comparison of a class-level taxonomic composition with respect to the DNA
extraction kit used………………………………………………………………………………..76
Figure 3.59. MDS plot based on the unweighted UniFrac distance matrix comparing taxonomic
similarity, labelled with respect to time…………………………………………………………..77
xiii
Figure 3.60. MDS plot based on the unweighted UniFrac distance matrix comparing taxonomic
similarity, day 42 samples only, labelled with respect to manure type……………………………78
Figure 3.61. Comparison of a class-level taxonomic composition with respect to time…………..79
Figure 3.62. Comparison of a class-level taxonomic composition with respect to composting
method……………………………………………………………………………………………80
Figure 3.63. Comparison of a class-level taxonomic composition with respect to manure type, day
42 only……………………………………………………………………………………………81
Figure 3.64. Comparison of a class-level taxonomic composition with respect to the DNA
extraction kit used………………………………………………………………………………..82
Figure 3.65. MDS plot based on the unweighted UniFrac distance matrix comparing taxonomic
similarity, labelled with respect to time…………………………………………………………..83
Figure 3.66. MDS plot based on the unweighted UniFrac distance matrix comparing taxonomic
similarity, labelled with respect to manure type…………………………………………………..84
Figure 3.67. MDS plot based on the unweighted UniFrac distance matrix comparing taxonomic
similarity, labelled with respect to composting method…………………………………………..85
xiv
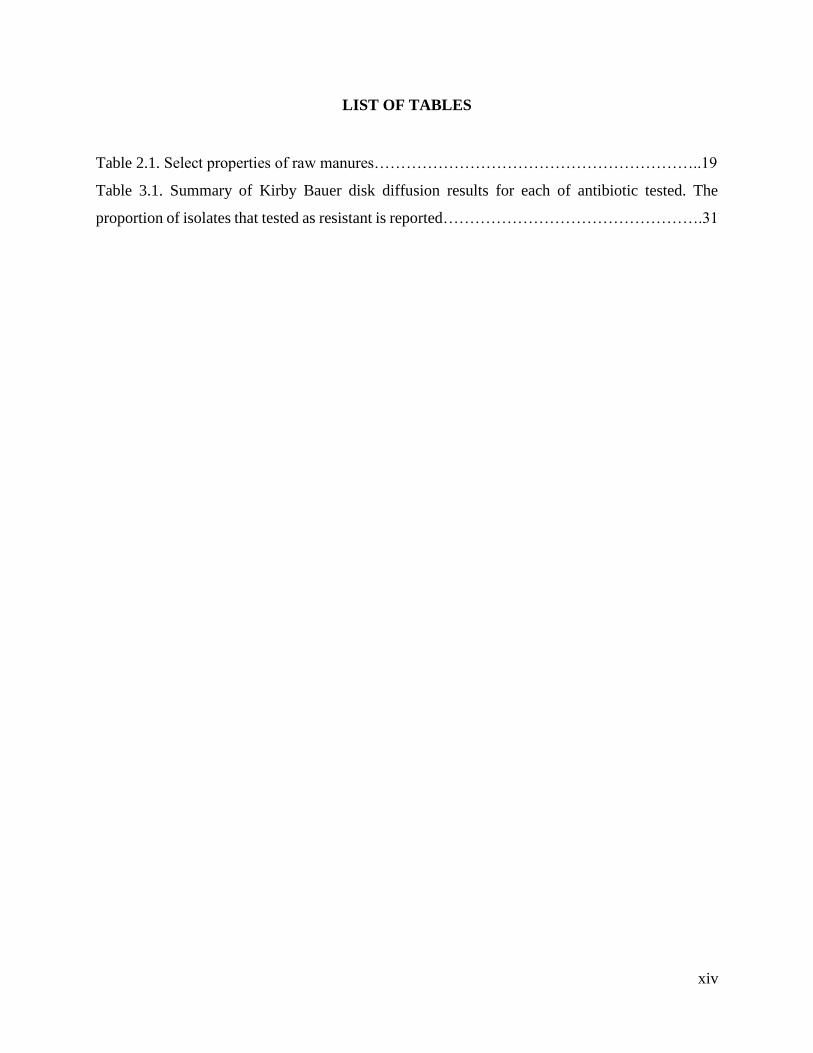
LIST OF TABLES
Table 2.1. Select properties of raw manures……………………………………………………..19
Table 3.1. Summary of Kirby Bauer disk diffusion results for each of antibiotic tested. The
proportion of isolates that tested as resistant is reported………………………………………….31

xv
LIST OF ABBREVIATIONS
ANOSIM: Analysis of Similarities
ARBs: Antibiotic Resistant Bacteria
ARGs: Antibiotic Resistance Genes
CARD: Comprehensive Antibiotic Resistance Database
CFU: Colony Forming Unit
DNA: Deoxyribonucleic Acid
EUCAST: European Committee on Antimicrobial Susceptibility Testing
FSMA: Food Safety Modernization Act
HGT: Horizontal Gene Transfer
HPCs: Heterotrophic Plate Counts
LB: Luria Bertani (Broth)
MDS: Multidimensional Scaling
MG-RAST: Metagenome Project Rapid Annotation using Subsystems Technology
MIC: Minimum Inhibitory Concentration
MLS-B: Macrolide-Lincosamide-Streptogramin B
MPN: Most Probable Number
NCCLS: National Committee for Clinical Laboratory Standards
OTU: Operational Taxonomic Unit
PCR: Polymerase Chain Reaction
PVC: Polyvinyl Chloride
QIIME: Quantitative Insights into Microbial Ecology
xvi
qPCR: Quantitative Polymerase Chain Reaction
WHO: World Health Organization

1
1. ANTIBIOTIC RESISTANCE IN AGRICULTURAL COMPOST AND MANURE:
BACKGROUND AND LITERATURE REVIEW
Antibiotic resistance presents a growing and serious human health risk by making treatment of
serious infections more difficult, thus increasing the odds of complications and fatalities as a result
of infections that do not respond to antibiotics (1). Even common infections, like Staphylococcus
aureus and Escherichia coli, are becoming resistant to the most powerful antibiotics (2).
Microorganisms can develop a number of mechanisms for counteracting the effects of antibiotics
including the use of efflux pumps, synthesis of enzymes to break down the antibiotic, chemical
alteration of the antibiotic, or through mutations to the antibiotic binding site that render it
ineffective (3,4). All of these mechanisms, whether innate or acquired, are coded for in the DNA
by genetic elements, or antibiotic resistance genes (ARGs). Microorganisms can spread ARGs to
their daughter cells through typical cell division and reproduction (i.e. vertical gene transfer, or
VGT), but of particular concern is the ability to share ARGs between bacteria through horizontal
gene transfer (HGT) (5). Even ARGs lysed by dead bacteria may still pose a threat because they
can be assimilated by living bacteria through the HGT process of transformation. For this reason
ARGs themselves can be considered the primary contaminant of concern, rather than resistant
bacteria (6).
Antibiotics are heavily relied upon in livestock agriculture. They are used at therapeutic
levels to treat disease in animals, as well as at sub-therapeutic concentrations to prevent disease or
to promote weight gain (7). It has been estimated that as much as 80% of the antibiotics sold in the
United States, and more than 50% of antibiotics produced in the world, are administered to
livestock (8,9). However, most of the administered antibiotic is later excreted by the animal in
urine or feces (10). This residual antibiotic can persist in the environment and select for antibiotic
resistance (11). When land-applied, livestock manure can lead to the spread of antibiotic resistance
and ARGS directly into the soil, into the waterways via rainfall runoff, or onto vegetable crops
(12,13). Livestock operations can therefore serve as reservoirs of antibiotic resistance (14). This
has drawn attention to the need to understand the potential for antibiotic resistance to spread along
the “farm to fork continuum,” or from antibiotic use and manure management practices through
crop production, post-harvest practice and consumer exposure.
Composting is the controlled process of aerobically biodegrading organic matter into a
2
humus-rich material that is ideal for use as a soil amendment. As composting already presents
other benefits, including manure management and pathogen control, the potential for composting
to also attenuate ARGs is of interest (15). During composting, bacteria and fungi grow rapidly,
degrading the organic matter and producing heat, naturally elevating the temperature into the
thermophilic range (55°C). While the thermophilic phase is known to be essential for killing off
pathogens, little is known about the potential for composting to also reduce the concentration and
bioavailability of antibiotics and the overall abundance of ARBs and ARGs (15,16). With regard
to ARBs, one study looked at the effect of composting antibiotic-administered swine manure on
the growth of erythromycin-resistant and tetracycline-resistant colonies on antibiotic
supplemented tryptic soy agar and found that composting reduces ARB plate counts by 4-7 logs
(17).
Prior studies of the effects of composting on ARG abundance have yielded mixed results.
Selvam et al. (18) examined the effect of composting swine manure spiked with chlortetracycline,
sulfadiazine, and ciprofloxacin on ARGs associated with tetracycline, sulfonamide, and
fluoroquinolone resistance and found that after 28 to 42 days of composting all twelve genes,
except for parC, were undetectable. Conversely, Su et al. studied the effect of composting
municipal sewage sludge on antibiotics resistance using high-throughput quantitative polymerase
chain reaction (qPCR array) of 156 ARGs and found an increase in ARG abundance and diversity
following 50 days of composting (19). The present study seeks to explore the effect of manure
composting on ARB and ARG abundance through the use of culture-based techniques, qPCR, and
metagenomic sequencing to provide a comprehensive understanding of the effects of prior
antibiotic use and composting on various measures of antibiotic resistance. In particular,
metagenomics is a relatively new technology, derived from next-generation DNA sequencing, and
can help to resolve prior discrepancies in the literature regarding the effects of composting on
ARGs.
1.1. ANTIBIOTIC RESISTANCE
Antibiotics are powerful and life-saving drugs and their discovery has led to longer human
life spans and quality of life by providing effective treatments for previously debilitating and fatal
infectious diseases (20). However, resistance to medically important antibiotics was discovered
3
quickly thereafter when penicillin was found to be ineffective against previously susceptible
bacteria (21). Since then, rates of antibiotic resistant infections have continued to increase while
fewer new antibiotics are being discovered each year (22). Antibiotic resistance presents a growing
and serious human health risk by making treatment of serious infections more difficult, thus
increasing the odds of complications and fatality as a result of infections that do not respond to
antibiotics (1). The rates of antibiotic resistance observed are increasing for both hospital- and
community-acquired infections, (1). Even the most common infections, like Staphylococcus
aureus and Escherichia coli, are becoming resistant to the most powerful antibiotics (2).
Many antibiotics are naturally occurring, produced by bacteria and fungi at relatively low
concentrations as a means of attaining a competitive advantage in the environment (3). Antibiotic
resistance is also a natural adaptation to allow bacteria to survive in the presence of these
antibiotics, but the mass production and use of antimicrobial drugs exposes bacteria to levels of
antibiotics orders of magnitude higher than what is experienced in nature. This imposes a strong
selective pressure in which bacteria that adapt, mutate, or acquire ARGs have a competitive
advantage and will increase in abundance (3,5).
In the United States, the overuse and misuse of antibiotics has resulted in increasing levels
of antibiotic resistance in recent years (23), which has correspondingly led to increased cost for
healthcare as infections become more difficult and costly to treat (24). Some infectious bacteria
are developing multidrug resistance, which is of special concern because it even further limits the
treatment options. Some Gram-negative rod-shaped bacteria have been found that are resistant to
virtually all known antibiotics. This distressing observation could mean a future where antibiotics
are no longer helpful and many infections cannot be treated (25).
1.1.1. ANTIBIOTIC RESISTANCE GENES
Microorganisms can develop a number of mechanisms to circumvent the effects of
antibiotics. Some microorganisms possess an innate resistance to certain antibiotics, meaning that
they are naturally immune to their effects either because they lack the target that the antibiotic
works upon, or because they have an impermeable membrane that the antibiotic cannot penetrate
(26). Other microorganisms can acquire resistance through the use of several mechanisms
4
including the use of efflux pumps, synthesis of enzymes to break down the antibiotic, chemical
alteration of the antibiotic, or mutation of the antibiotic binding site, rendering the antibiotic
ineffective (3,4). All of these mechanisms, whether innate or acquired, are coded for by genetic
elements, or antibiotic resistance genes (ARGs). ARGs coding for innate resistance are located on
the bacterial chromosome (4) while ARGs coding for acquired resistances may be located on either
the bacterial chromosome or on mobile genetic elements, such as plasmids (3).
Plasmids are extra-chromosomal, circular elements of double-stranded DNA that often
house ARGs; microorganisms can have multiple plasmids (4,26). Other mobile genetic elements
that can house ARGs include transposons and integrons (26). Transposons are DNA segments that
can change their position within a genome moving from chromosomes to plasmids or vice-versa
(4). Integrons contain mobile gene cassettes that are often the site of ARGs.
Microorganisms can spread ARGs to their offspring through normal cell division
processes, or can be shared between bacteria through horizontal gene transfer (HGT) (5). HGT is
mediated through one of three processes: conjugation, transformation, or transduction.
Conjugation is considered the most prevalent form of HGT, wherein bacterial DNA is shared
between two bacteria through physical contact; DNA from either the chromosome or from
transposons or plasmids can be shared this way (26). Transformation is the process wherein
extracellular DNA from dead or lysed bacteria is incorporated into the genome of living bacteria
(27). The ability for bacteria to uptake DNA through transformation means that even ARGs
contained within dead bacteria still pose a threat and that ARGs themselves are the primary
contaminant of concern, rather than resistant bacteria (6). Transduction is the process whereby
DNA is exchanged from one bacterium to another by the actions of bacteriophages (14). HGT can
be induced by selective pressure such as the presence of antibiotics. HGT allows ARGs to be
spread between different species of bacteria in ways that may not have occurred through mutation
and is therefore considered the most important mechanism in the spread of antibiotic resistance
(22,28,29). This also means that even resistant but non-pathogenic bacteria can pose a health threat
by potentially sharing their ARGs with pathogens (30).
Some ARGs may be located together on the same genetic element (31). The selection for
a genetic element containing a certain ARG may therefore result in resistance to another, unrelated
ARG as well; this can rapidly result in multidrug resistance (32).
5
1.2. ANTIBIOTIC RESISTANCE IN AGRICULTURE
Modern livestock agriculture is heavily reliant on antibiotics. They are used at therapeutic
levels to treat disease in animals, as well as at sub-therapeutic concentrations to prevent disease or
to promote weight gain (7). It has been estimated that as much as 80% of the antibiotics sold in the
United States, and more than 50% of antibiotics produced in the world, are administered to
livestock (8,9). However, most of the administered antibiotics, as well as metabolites, are later
excreted by the animal in urine or feces (10). It has been shown that administration of antibiotic
supplemented feed can significantly increase the prevalence of ARGs in the feces of feedlot cattle
(33). One study demonstrated an increase in resistance to seven different antimicrobials in E. coli
isolated from conventional farms where antibiotics were regularly used as compared to those
isolated from organic farms without antibiotic use (34). This residual antibiotic can persist in the
environment and select for antibiotic resistance (11). There have been several cases of antibiotic
resistant pathogen transfer from animals to humans including the transfer of methicillin-resistant
Staphylococcus aureus (MRSA) and vancomycin-resistant Enterococci infections (35,36).
When land applied, livestock manure can elevate ARGS in the soil where they can be
transferred to crops or to adjacent waterways via runoff (12,13). It has been shown that land and
waterways near farmland contain a higher prevalence of ARBs and ARGs than non-farm areas
(13,37). Livestock operations can therefore serve as reservoirs of antibiotic resistance (14).
Livestock is considered one of the most significant human actions contributing to the rapid spread
of antibiotic resistance (23).
1.2.1. THE FARM TO FORK CONTINUUM
The farm to fork continuum is an important pathway to consider, through which there is
the highly plausible likelihood that human exposure to livestock manure-derived ARGs could
occur. Fecal contamination of produce is often the cause of outbreaks of foodborne illness (38).
The sources for such outbreaks are typically contamination of irrigation water or soil amended
with improperly composted or raw animal manures too near to harvest (39). It has been shown that
enterohemorrhagic E. coli can survive for up to 159 days in untreated manures and that they can
also survive and regrow in compost if not properly performed (40,41). If fecal-derived pathogens
6
can be transmitted to humans through fresh produce, then it stands to reason that humans could
also be exposed to ARGs through the same route. Many animal antibiotics are similar classes to
those used in human medicine, such as lincosamides and β-lactams that are used in the dairy
industry (42). One study showed that E. coli isolated from cases of clinical mastitis displayed
multidrug resistance and were resistant to both veterinary and human antibiotics (43). Within the
farm to fork continuum, the area of manure management represents a critical control point with
the potential for decrease the prevalence of ARGs and ARBs before they can spread to the
consumer.
1.2.2. MANURE TREATMENT STRATEGIES
Manure management refers to the collection, storage, treatment, and subsequent use of
animal manures with the goals of recycling nutrients, preventing the spread of pathogens, and
protecting the environment. Manure treatment aims to reduce nutrient levels in collected animal
manure in order to minimize nutrient runoff into waterways and reduce pathogen loads. Common
options for treating livestock manures include lagoons, anaerobic digestion, and various
composting methods (15,44).
Lagoons are a method for treating liquid or slurry waste by passing it through basins of
slow moving water, allowing suspended solids to settle, and promoting the biological degradation
of organic matter prior to application to cropland (44). One study has shown that simulated lagoon
treatment resulted in a 1 to 2 log decrease in cultivated aerobic heterotrophic erythromycin-
resistant bacteria and tetracycline-resistant bacteria over a 48 day period; however this same study
showed no significant reduction in the absolute abundance of any of the tet and erm ARGs that
were quantified (44).
Anaerobic digestion is a process most commonly used to treat municipal biosolids, but it
is becoming more common as a livestock manure treatment (15). It involves blending biosolids
into a liquid form and incubating in the absence of oxygen at either mesophilic temperatures of 35
to 37°C or at thermophilic temperatures of approximately 55°C. This process produces methane-
rich biogas, which may be sold or burned to produce energy. Solids are separated from the
remaining digestate and are used to produce fertilizer for agriculture (15). Adequate time is
7
required at a given temperature to eliminate pathogens, though less time is needed for higher
temperatures. Past research has demonstrated reductions in ARBs of up to 90% following
mesophilic digestion, and reductions below detection at higher temperatures (45). The majority of
past research on the fate of ARGs during anaerobic digestion has used municipal biosolids and not
livestock manure. Results of such treatments on ARGs have yielded mixed results, with sul, tet,
and erm genes showing modest reduction in most studies, and an increase in others (15). One study
on mesophilic swine manure digestion showed no significant change in the abundances of tested
erm and tet genes (46).
Composting is the controlled process of aerobically biodegrading organic matter into a
humus-rich material that is ideal for use as a soil amendment (15). It is the primary focus of the
present study and is reviewed in depth in the following section.
1.2.3. MANURE COMPOSTING
Manure composting is an aerobic process that involves amending manure with materials
such as mulch, sawdust, and hay, or other readily available organic materials, with the primary
goal of adjusting the C:N ratio and increasing porosity to allow oxygen to penetrate the composting
heap (16). Optimal composting will aim to achieve a carbon to nitrogen ratio (C:N) in the preferred
range of 25:1 to 30:1 and moisture content in the range of 50-60% (16). During composting,
bacteria and fungi will grow rapidly, degrading the organic matter and producing heat. The
composting process takes weeks to months to complete; during this time the biologically generated
heat will naturally raise the temperature into the thermophilic range (55°C). These high
temperatures serve as the primary mechanism for pathogen removal, as well as the potential
inactivation of ARBs, ARGs, and degradation of antibiotics (15,16). Once microbial growth and
decomposition begins to slow, temperatures decline into the mesophilic stage, where they may
remain for one to several weeks while they undergo the final curing process. During curing,
recalcitrant compounds continue to degrade, the pH shifts toward neutral, the C:N continues to
decrease, and the concentration of humus increases. Curing is considered complete when, while
maintaining adequate moisture and oxygen, the compost returns to near ambient temperatures (16).
8
There are three primary types of thermophilic composting, which include: aerated static
piles, turned piles or windrows, and in-vessel systems (15). Windrows are long, narrow piles of
compost which are agitated or turned on a regular basis and are generally 3 feet high for manure-
based composts (16). Currently in the Unites States, composting of animal manure is not regulated
by any federal agency, though some state and local regulations do exist (47). The Food and Drug
Administration (FDA) has proposed a rule for Biological Soil Amendments under Subpart F of its
Food Safety Modernization Act (FSMA) (47). In this proposed rule, manure composting must
either: 1) use a composting method that can be proven scientifically valid by demonstrating that
the finished compost meets certain microbial pathogen standards, i.e. detection of less than 3 MPN
per 4 grams of dry weight solids Salmonella species and less than 1,000 MPN fecal coliforms per
gram dry weight solids (47); or 2) follow one of two composting methods outlined in the rule that
are considered scientifically valid and are designed to meet the aforementioned microbial
standards. These methods include either static composting that maintains aerobic conditions at a
minimum of 55°C for three days, followed by adequate curing, or turned composting that
maintains aerobic conditions at a minimum of 55°C for 15 days, with a minimum of 5 turnings,
followed by adequate curing (47).
Studies examining the effect of composting on the degradation of antibiotics have
consistently shown a reduction, sometimes below detection levels, of sulfonamide, tetracycline,
macrolide, and quinolone antibiotics (48–50).
A limited number studies have demonstrated ARB reductions following composting (15).
Wang et al. found that composting reduced levels of cultivated aerobic heterotrophic tetracycline-
resistant and erythromycin-resistant bacteria isolated on selective tryptic soy agar in swine manure
from pigs administered tetracyclines and tylosin by 4-7 logs over 48 days (17). Sharma et al.
explored the effect of composting on resistant E. coli levels in cattle manure compost from cattle
administered either tylosin, chlortetracycline and sulfamethazine, or no antibiotics, and found that
composting reduced levels of ampicillin-resistant and tetracycline-resistant E. coli (51). Guan et
al. found that composting at temperatures of 50°C or above prevented the transfer of plasmids
containing multiple antibiotic resistances and reduced their E. coli hosts to non-detect levels (52).
Evidence of the effects of composting on ARG abundance are mixed. Some studies show
that composting may have a beneficial effect on ARG attenuation. Holman et al. studied the effects
9
of co-composting cattle manure with construction waste on antimicrobial resistance and found that
composting reduced the abundance of 10 ARGs including erm, sul, and tet genes (53). Selvam et
al. (18) examined the effect of composting swine manure spiked with chlortetracycline,
sulfadiazine, and ciprofloxacin on ARGs associated with tetracycline, sulfonamide, and
fluoroquinolone resistance and found that after 28 to 42 days of composting all twelve genes,
except for parC, were undetectable. Yu et al. and Chen et al. found a reduction in tetracycline
resistance genes and macrolide-lincosamide-streptogramin B resistance genes, respectively, after
composting of swine manure (46,54). Storteboom et al. (55) studied the effect of high and low
intensity manure management techniques on the abundance of ARGs in horse manure spiked with
chlortetracycline, tylosin, and monensin and found a decrease in tet(W) and tet(O) resistance genes
after 6 months of treatment.
Yet other studies show that composting increases ARG abundance. Qian et al. explored the
effect of oxytetracycline concentration on the composting process and its ability to attenuate ARGs
and found that the relative abundances of the ARGs tet(C), tet(X), sul1, sul2, and intI1 increased
while the relative abundances of tet(Q), tet(M), and tet(W) decreased (56). Sharma et al. found an
increase in the genes tet(A), tet(C), and erm(A), but a decrease in the remaining seven genes that
were tested; however, the inability to maintain thermophilic temperatures a full fifteen days may
have limited the ability of composting to degrade all ARGs in this case (51). Su et al. studied the
effect of municipal sewage sludge composting on antibiotics resistance using high-throughput
quantitative polymerase chain reaction (qPCR) of 156 unique ARGs and found an increase in ARG
abundance and diversity following 50 days of composting (19).
While these studies do shed some light on the potential effectiveness of composting in the
attenuation of ARBs and ARGs, the mixed results for ARB attenuation suggest a need for further
research. Specifically, the composting process must be optimized to ensure thermophilic
temperatures are maintained long enough to degrade ARGs. Several of these studies involved
spiking antibiotics into manure while others administered the antibiotics to the livestock;
administration to livestock mirrors real world situations more closely and is the preferred approach
where possible. The aforementioned studies on ARGs in compost primarily quantified ARGs using
targeted qPCR of specific genes, with the exception of Su et al.; the use of metagenomic
sequencing and analysis to get a better overall picture of the antibiotic resistome throughout the
10
composting process would provide enhanced understanding of the complex microbial interactions
that take place during composting (19). It is also helpful to assess resistance using both culture-
based and genetic techniques simultaneously: culture-based techniques demonstrate phenotypic
expression of resistance, while genetic techniques provide an insight into the majority of the
microbial community that is unculturable. Together, these will give a more complete picture of the
resistome.
1.3. SELECT CLASSES OF ANTIBIOTICS AND BACTERIAL MODES OF
RESISTANCE
In general, antibiotics can be classified into one of four main categories based upon their
method of action and their site of activity within the bacterial cell, i.e. antibiotics may: inhibit cell
wall synthesis, inhibit protein synthesis, inhibit nucleic acid synthesis, or weaken the integrity of
the cell membrane (57). Of the following antibiotics, the World Health Organization has named
3rd and 4th generation cephalosporins, glycopeptides, macrolides, and fluoroquinolones the highest
priority critically important antimicrobials; this means that a large number of people are affected
by diseases for which these antibiotics are the sole or one of few antibiotics available for treatment,
that they have a high frequency of use, and that there is a greater degree of confidence that non-
human sources, like the livestock industry, play a role in increasing the transfer of associated ARGs
and ARBs (58).
1.3.1. β-LACTAMS
The β-lactam class of antibiotics includes penicillins, cephalosporins, monobactams, and
carbapenems; β-lactam antibiotics are structurally similar in that they all contain a β-lactam ring
(57). This is the most commonly used class of antibiotics with cephalosporins alone accounting
for more than 28% of antibiotic sales (59). β-lactam antibiotics work by inhibiting the formation
of peptidoglycan in the bacterial cell wall; they do this by binding to enzymes that produce
peptidoglycan, called penicillin binding proteins (57). Resistance to β-lactams occurs through one
of four primary mechanisms: through a mutation in penicillin binding proteins which prevents the
antibiotic from being able to bind to it, through the production of β-lactamase enzymes that
11
degrade the antibiotic, through the use of efflux pumps, or by altering cell wall channels called
porins to prevent the antibiotic from permeating deep enough into the cell wall to reach the target
site (57).
Of these mechanisms, the production of β-lactamase enzymes is the most important factor
contributing to β-lactam resistance, especially in gram negative organisms (60). Extended
spectrum β-lactamases (ESBL) are of special concern because they have the ability to degrade and
cause resistance to a wide array of β-lactam antibiotics including the relatively newer 3rd and 4th
generation cephalosporins (60). Most ESBLs can be broken down into three distinct types: CTX-
M, TEM, and SHV types. The most common producer of CTX-M type ESBLs is E. coli (60).
Carbapenems are generally considered the last line of defense when treating serious gram-negative
infections because they are unaffected by most β-lactamases; however, recently the New Delhi
metallo-β-lactamase (NDM) gene has appeared which confers resistance to carbapenems (1). Of
particular concern is the spread of a multidrug resistant NDM strain of E. coli across continents as
it is resistant to virtually all antimicrobials (58). In the United States, the use of penicillins and all
four generations of cephalosporins are approved for use in cattle, swine, and poultry (61). Due to
their extensive use in the dairy industry to treat bacterial mastitis, the potential exists for β-lactam
resistance to be enriched in animal manure (42).
1.3.2. GLYCOPEPTIDES
Glycopeptides are composed of glycosylated cyclic or polycyclic non-ribosomal peptides;
they are generally too large to infiltrate the gram-negative outer membrane and therefore their
action is limited to gram-positive microorganisms (57). Glycopeptides function by binding to the
end of peptidoglycan penta-peptide side chains and preventing reactions necessary to form more
peptidoglycan, thereby weakening the cell wall (57). Bacterial resistance depends upon the ability
to produce a D-Ala-D-Lac dipeptide terminus, rather than the typical D-Ala-D-Ala terminus, thus
depriving the glycopeptides of a suitable target site (57). The most well-known glycopeptides
antibiotic is vancomycin; there are 6 known vancomycin resistance types, with van(A) being the
most common. In humans, glycopeptides are among the only available therapies for serious
enterococcal infections; they are also the first line treatment for methicillin resistant
Staphylococcus aureus (1,35,58). It has been shown that transmission of glycopeptide-resistant

12
Enterococcal infections from animals to people can occur, such as the transmission of vancomycin
resistant Enterococcal infections from chickens that had received avoparcin treatment (35).
1.3.3. FLUOROQUINOLONES
Fluoroquinolones, and other quinolones, are a class of synthetic, broad-spectrum
antibiotics that share a similar structure to nalidixic acid, the first antibiotic of their class (62).
Fluoroquinolones have a rapid bactericidal effect and function by binding to DNA topoisomerase
enzymes and inhibiting their activity, thereby inhibiting nucleic acid metabolism (57,62).
Resistance to fluoroquinolones can develop through the use of three mechanisms: developing a
mutation in the target topoisomerase enzymes, decreasing bacterial cell wall permeability, and
through the use of efflux pumps (57). Each of these mechanisms of resistance can occur
simultaneously within the same cell, leading to high level resistance (57). In humans, use of
fluoroquinolones is generally reserved for cases of hospital acquired infections or infections where
resistance to older antibiotics is suspected (1). In the United States, quinolones are approved only
for use in cattle to treat respiratory diseases, and off-label use is banned (61,63).
1.3.4. MACROLIDES AND LINCOSAMIDES
Macrolides are a class of antibiotics that are distinguished structurally by having a large
macrocyclic lactone ring; lincosamides are structurally different from macrolides and instead have
a sulfur containing octose ring (57,64). Macrolides and lincosamides share a similar mechanism
of action: they bind to the 50S subunit on bacterial transfer RNA (tRNA) which causes the tRNA
to dissociate from ribosomes and therefore inhibit protein synthesis (57). Bacterial mechanisms of
resistance include mutations of the 23S RNA subunit or the use of efflux pumps (57). In human
medicine macrolides and lincosamides are used to treat gram positive infections such as respiratory
tract and soft tissue infections (1). In the United States, both macrolides and lincosamides are
approved for use in cattle, swine, and poultry (61).
13
1.3.5. SULFONAMIDES
Sulfonamide antibiotics are synthetic antibiotics that contain a sulfonyl group connected to
an amine group; they are structurally similar to p-aminobenzoic acid (PABA) (57). Due to this
similarity, sulfonamides compete with PABA for the dihydropteroate synthase (DHPS) enzyme
site, blocking the formation of nucleotide precursors (57). Bacteria can become resistant to
sulfonamides by producing a new variant of the DHPS enzyme that is incompatible with
sulfonamides (57). Two common resistant DHPS enzymes are encoded by the sul1 and sul2 genes,
which have been found in gram negative bacteria and can exist on conjugative plasmids (5).
Sulfonamide resistance is widespread, so they are rarely used in the treatment of human infections
anymore (1,65). In livestock, they are still regularly used in the cattle, swine, and poultry industries
(61).
1.3.6. TETRACYCLINES
Tetracyclines are a class of broad spectrum antibiotics that structurally consist of four
hydrocarbon rings; they are bacteriostatic and block protein synthesis by blocking aminoacyl
tRNA binding at the 30S RNA subunit (57). Tetracyclines are effective against a wide range of
gram negative and gram positive bacteria as well as protozoa (57). Bacterial mechanisms of
resistance to tetracyclines include efflux pumps or the production of ribosomal protection proteins
that prevent tetracycline from binding at the target site (5,57). In human medicine, tetracyclines
are not considered a first line of treatment, but are used when resistance to other antimicrobials is
indicated; they are often administered in combination with other drugs because tetracyclines do
not distribute evenly throughout the body (1). In livestock, tetracyclines have been regularly used
both therapeutically and sub-therapeutically in feed to enhance growth of animals (57,66). In the
United States they are approved for use in the cattle, swine, and poultry industries (61).
14
1.4. METHODS FOR THE DETECTION AND QUANTIFICATION OF ANTIBIOTIC
RESISTANCE
Given the diversity of antibiotics in use, as well as the inability to culture the majority of
bacteria in a lab setting, there is no standard method for the assessment of overall resistance
potential; therefore, the following summary reviews both culture-based techniques, which target
the phenotypic display of resistance by living and culturable bacteria, as well as genetic markers
of resistance potential like the presence of ARGs.
1.4.1. CULTURE BASED TECHNIQUES
Culture-based techniques for assessing antibiotic resistance depend on the phenotypic
expression of resistance and involve exposing live bacterial isolates to known concentrations of
antibiotics and determining the level of growth inhibition that results (67,68). From this
information a minimum inhibitory concentration (MIC) can be determined; the MIC is the lowest
concentration of a specific antibiotic required to visibly inhibit bacterial growth (69). The National
Committee for Clinical Laboratory Standards (NCCLS) has established standards for the
preparation of media that must be followed in order to obtain an accurate MIC (67). There are two
primary culture techniques for assessing resistance: disk diffusion methods, and dilution methods
(70). Disk diffusion methods, such as the Kirby Bauer disk diffusion method, allow a single
bacterial isolate to be tested for resistance to many antibiotics at once (70). These methods utilize
paper disks containing a known concentration of antibiotic; the antibiotic diffuses into the agar
creating a concentration gradient (69). When a bacterial isolate is grown onto an agar plate
containing antibiotic disks, zones of inhibition will appear around each paper disk; the diameter of
each zone of inhibition is measured used to determine resistance; smaller zones of inhibition
indicate increased resistance while larger zones indicate susceptibility (69). The zone of inhibition
may be used to mathematically estimate the MIC for that isolate to each antibiotic tested (70).
Dilution methods involve inoculating a series of solid or liquid media containing serial dilutions
of antibiotic concentrations with a known quantity of the bacterial isolate of interest; the MIC can
then be directly determined when the concentration of antibiotic is sufficiently high to prevent the
isolate from growing (69,70). While culture based methods are important for assessing phenotypic
resistance, they are limited by the necessity for the target bacteria to be culturable; it is worth
15
noting that the vast majority of bacteria are therefore not quantifiable by these strategies, as it is
estimated that fewer than 1% can be cultured using current methods (68).
1.4.2. GENETIC TECHNIQUES
Genetic techniques for detecting and quantifying resistance focus on identifying ARGs
within a sample. Polymerase Chain Reaction (PCR) is a technique used to identify the presence of
a target gene within a sample (68). During PCR, extracted DNA is heated to cause the unwinding
of double-stranded DNA into single stranded DNA. The DNA is then cooled to allow gene-specific
primers to anneal to a target site within the DNA sequence. DNA polymerase adds complementary
nucleotides to complete the sequence, thereby amplifying the gene of interest. This cycle is
repeated many times, resulting in an exponential increase in the number of target gene copies (71).
When the PCR cycles are complete, it is necessary to verify that the correct gene sequence was
amplified by performing gel electrophoresis to ensure that the resulting amplicon is the correct
size (67). Real-time PCR, also known as quantitative PCR (qPCR), follows the same general
process but allows for quantification of the gene of interest rather than mere detection; it does this
through the use of fluorescent hybridization probes (72). Each time that the gene of interest is
replicated, fluorescent light is emitted and measured; this information is plotted onto an
amplification curve based upon target gene standards of a known concentration, and from this
curve the number of target gene copies present in the DNA sample can be mathematically
determined (72). With either PCR or qPCR specially designed primers must be used to target a
specific, known gene; therefore, these technologies are therefore not useful for discovering novel
ARGs (68).
Metagenomics is the analysis of all of the genes within a sample through direct shot-gun
sequencing of DNA extracts, without prior PCR amplification, performed by using next-generation
sequencing technologies, like 454-Pyrosequencing or Illumina. A main advantage of the
metagenomics approach is that it amplifies all genes within a sample without the requirement of
specific, targeted primers, as is the case in PCR-based techniques (73). When sequencing is
complete, sequenced reads are compared against online databases to determine the identity and
function of each gene. The Meta-Genome Rapid Annotation using Subsystems Technology (MG-
RAST) database is a well-known open-source database that can be used for a variety of

16
metagenomic analyses including phylogenetic comparisons, functional annotations, and metabolic
reconstructions (74). There are also databases dedicated specifically to the genetics and genomics
of antibiotic resistance, such as the Comprehensive Antibiotic Resistance Database (CARD),
which compiles data about antibiotics, their targets, associated resistance genes, and associated
proteins (75). The primary drawback to metagenomic sequencing and analysis currently is its high
cost, which is expected to decrease with time. Another issue is that databases do not contain
information on every possible gene sequence, but this also will improve with time as more studies
are done and databases are populated with more information (74).
1.5. GOALS AND OBJECTIVES
The overall goal of this project was to investigate the effect of various composting practices on
the prevalence of ARBs (operationally defined as capable of growth on antibiotic-amended
media or characterized using the Kirby-Bauer disk diffusion method) and ARGs. To achieve this
goal, the following objectives were specified:
1) Compare the occurrence of ARBs and ARGs in cattle manure and corresponding composts
generated using various methods: small-scale static, small-scale turned, temperature-
controlled, large-scale static.
2) Determine the effect of prior antibiotic administration on the prevalence of ARBs and
ARGs during composting of corresponding dairy and beef manures.
3) Compare effectiveness of composting for reducing levels of ARBs and ARGs in dairy
versus beef manures.
4) Compare the effect of different DNA extraction methods on the characterization of the
taxonomic composition of dairy and beef manures and corresponding composts.
17
1.6. HYPOTHESES
The following hypotheses were tested:
1) Composting reduces the prevalence of ARBs and ARGs relative to non-composted, raw
cattle manures.
2) Static versus turned composting approaches influence the occurrence of ARBs and ARGs in
resulting compost.
3) Prior administration of antibiotics increases the prevalence of ARBs and ARGs in resulting
manure and corresponding composts.
4) DNA extraction significantly influences characterization of the taxonomic composition of
microbial communities in manure and compost.
5) There is a difference in the prevalence of ARBs and ARGs in beef manure, and derived
products, when compared to dairy manure, and derived products.
18
2. METHODS AND MATERIALS
Three trials of composting experiments were performed to assess the impact of cattle
manure composting on various measures of antibiotic resistance. The first trial was a small scale
composting experiment performed in compost tumblers designed to: 1) test the impact of two
distinct composting methods recommended in the Food Safety Modernization Act (FSMA)
guidelines for biological soil amendments – an aerobic, static composting method where compost
is maintained at or above 55°C for 3 days, followed by adequate curing, and an aerobic, turned
composting method where compost is maintained at or above 55°C for 15 days and is turned at
least five times during this phase, followed by adequate curing; 2) assess whether the use of manure
from dairy cattle or beef cattle impacts the degree of antibiotic resistance in the finished compost
and finally, 3) assess whether manure from antibiotic-treated cattle would result in finished
compost with significantly different levels of antibiotic resistance than finished compost created
from untreated cattle manure. This trial was allowed to heat naturally.
The second trial was a heat-controlled trial, also performed at bench-scale, but with FSMA-
required thermophilic temperatures imposed using an external heat source. This trial focused only
on dairy manure treated via the static composting method, but still compared composting of
manure from antibiotic-treated versus untreated cattle manure. This trial was performed in
response to the unexpected survival of E. coli through the end of the first small-scale trial. Given
difficulties in maintaining recommended temperatures in the first trial, external heat in this effort
served to extend the time at thermophilic temperatures in attempt to eliminate E. coli.
The third trial was conducted at full-scale and focused only on static composting of dairy
manure from cattle with and without prior administration of antibiotics. A full-scale non-
composted stockpile of antibiotic-treated cattle manure was also set up to serve as a positive
control.
The cattle used in this study had no prior history of antibiotic treatment. To generate beef
manure, nine healthy, yearling Hereford steers were fed a basal diet of corn silage and medicated
or non-medicated grain mix. Three steers were fed 350 mg each of chlortetracycline and
sulfamethazine per day; three steers were fed 11mg Tylosin per kg feed, and three steers were fed
the basal diet containing non-medicated grain mix. Urine and feces were collected from day 3 to

19
day 7 post treatment when peak excretion of antibiotics and ARGs was expected. To generate dairy
manure, six healthy, peak lactation dairy cows and three cows at the end of their current lactation
cycle were used. Three cows received two intramammary therapeutic doses of 50 mg each of
pirlimycin at peak lactation; three cows received a single intramammary therapeutic dose of 300
mg cephapirin at end of lactation; and three peak lactation cows received no antibiotic treatment.
Both urine and feces were collected and composited to achieve homogeneous manures for each
cattle and treatment type. Select properties of the four manures are outlined in Table 2.1.
Table 2.1. Select properties of raw manures.
2.1. SMALL-SCALE COMPOSTING SETUP
The small-scale composting trial was set up to compare the effects of a static versus turned
composting method. Four different manures (beef with or without chlortetracycline,
sulfamethazine, and tylosin or dairy with or without pirlimycin and cephapirin antibiotic treatment)
were mixed with alfalfa hay, pine bark mulch, and sawdust to achieve a C:N ratio of 23-26 and a
moisture content of 55-65% and were composted in triplicate using both static and turned
composting methods for a total of 24 independent composters (wet mass=20-22 kg). Static
composters were aerated using an air pump and perforated polyvinyl chloride (PVC) pipes. Turned
composters were mixed well by hand daily. Temperature sensors were placed at four locations
within each composter to record and monitor temperature over time. Compost samples were taken
on days 0, 4, 7, 14, 21, 28, 35 and 42. On day 0 samples were also taken of each non-composted,
raw manure for comparison with the finished composts. Samples were used immediately for
analysis by culture techniques and additional sample was stored at -20°C for subsequent molecular
analysis.
Manure pH Moisture (%) Carbon (%) Nitrogen (%)
Beef Antibiotic 7.26 54.6 48.1 2.01
Beef Control 7.22 54.6 47.8 2.1
Dairy Antibiotic 6.79 56.4 47.8 2.12
Dairy Control 6.99 58.1 47.9 2.08

20
2.2. HEAT CONTROLLED COMPOSTING SETUP
The heat-controlled trial tested dairy manures (with and without pirlimycin and cephapirin)
and only used the static composting method; each combination was composted in triplicate for a
total of 6 composters. Manures were mixed with grass hay and sawdust at ratios that were set to
achieve a C:N ratio of 25-30 and a moisture content of 55-65%. Each composter was aerated using
an air pump and perforated PVC pipes. Temperature sensors were placed at two locations within
each composter to record and monitor temperature over time. Heat tape was applied externally to
control the compost temperature; it was not turned on for the first 72 hours to allow self-heating
of compost, but were then turned on to maintain the thermophilic stage (>55°C) for 15 days, after
which a mesophilic temperature range (35-45°C) was maintained for three weeks before allowing
compost to cool to room temperature. Samples were collected on days 0, 1, 3, 7, 14, 21, 28, 35,
and 42 and raw manure samples were collected on day 0 for comparison with finished composts.
Samples were used immediately for analysis by culture techniques and additional sample was
stored at -20°C for subsequent molecular analysis.
2.3. LARGE-SCALE COMPOSTING SETUP
The large-scale composting took place outdoors at Kentland Farm in southwest Virginia.
The compost piles were formed in early January. Dairy manure (with and without pirlimycin and
cephapirin antibiotic treatment) was mixed with alfalfa hay and sawdust at a ratio of 4:1:4.3 to
achieve a moisture content of 55-65% and a C:N ratio of 25-30. Compost piles were formed in
large metal containers (20 × 8 × 4 ft.) on top of a system of perforated PCV pipes which supplied
forced aeration using an attached air pump. A stockpile of antibiotic manure without any
amendments or aeration was also formed in a metal container to serve as a non-composted positive
control. Compost and stockpile samples were taken on days 0, 4, 7, 14, 28, 42, 56, and 63. Samples
were used to enumerate E. coli using the Colilert defined substrate method on days 0 and 63
(www.idexx.com, Wetsbrook, MN). The remaining samples were stored at -20°C for subsequent
molecular analysis.
21
2.4. BACTERIAL CULTURING AND ENUMERATION
Compost samples from the small-scale composting trial were plated onto both R2A and
MacConkey agars to enumerate total heterotrophs and fecal coliforms, respectively. The fecal
coliform count was intended to serve as a rough proxy for E. coli, though MacConkey is not
specific to only E. coli. Heat controlled composting samples were plated onto MacConkey agar
and MacConkey agar that had been supplemented with one of several antibiotics: 40 µg/ml
erythromycin, 35 µg/ml clindamycin, 8 µg/ml tetracycline, 0.25 µg/ml cefotaxime, or 0.5 µg/ml
ceftazidime to enumerate resistance of fecal coliforms. These concentrations were determined
from EUCAST MICs for E. coli (tetracycline, cefotaxime, ceftazidime) and concentrations for
those antibiotics without known E. coli MICs (erythromycin and clindamycin) were determined
experimentally and therefore are not MICs indicating true resistance.
For both small-scale and heat-controlled compost samples, 10g of compost or manure were
added to a sterile blender bag with 90 mL of 0.1% peptone solution to make a 1:10 dilution. The
bag was mixed in a bag mixer for 2 minutes. A serial dilution was then performed in test tubes
containing 0.1% peptone solution. The dilutions were then plated onto the appropriate media.
Plates were incubated for 24 hours at 37°C. Only plates containing between 30 and 300 colonies
were counted. All colonies were counted on R2A plates and only colonies appearing pink or red
(indicating lactose fermentation) were counted on MacConkey plates.
2.5. IDEXX ENUMERATION OF E. COLI
Due to the non-specificity of MacConkey Agar to E. coli, the Colilert defined substrate
method with Quanti-Tray 2000s was used to verify that the fecal coliform count from the
MacConkey plates did in fact indicate survival of E. coli following the thermophilic stage of
composting. A 1:10 dilution was made using 0.1% peptone solution via the bag mixer as for the
plating method. This was further diluted to an appropriate concentration and combined with the
Colilert powder in a 100ml vial and mixed thoroughly by hand until the powder dissolved
completely. The resulting solution was poured into a Quanti-Tray 2000 tray and heat sealed. Trays
were incubated for 24 hours at 37°C. The number of large and small wells that fluoresced under

22
ultraviolet light were counted and E. coli counts were determined using the IDEXX MPN
Generator Software.
2.6. KIRBY BAUER DISK DIFFUSION TEST
The Kirby Bauer disk diffusion test was used to assess antibiotic resistance of fecal
coliform bacteria collected from small-scale composting MacConkey plates on day 42,
representing conditions at the end of composting. Ten colonies were selected randomly from plates
from each compost or manure treatment and were streaked to isolation onto a fresh MacConkey
plate and incubated for 24 hours at 37°C. Isolated colonies were added to tubes of sterile saline
(0.9% NaCl) and compared to a 0.5 McFarland standard to ensure a standard cell density. Isolated
colonies were also grown up in Luria-Bertani (LB) broth and preserved in glycerol stock at -20°C
for future analysis. Large (15 cm diameter) plates of Mueller Hinton agar were made with a
standard agar thickness of 4 mm. A Mueller Hinton plate was inoculated from the saline solution
by using a cotton swab to streak the full area of the plate. Antibiotic disks were placed onto the
inoculated plate using a disk dispenser to ensure even spacing. The antibiotics disks used were: 10
µg ampicillin, 5 µg cefotaxime, 30 µg chloramphenicol, 5 µg ciprofloxacin, 10 µg gentamicin, and
10 µg imipenem. Plates were incubated for 24 hours at 37°C. Results were read as the diameter
of the resulting zone of inhibition formed around each disk in millimeters, with a smaller zone of
inhibition indicating greater resistance. Results were compared to the European Committee on
Antimicrobial Susceptibility Testing (EUCAST) clinical breakpoint values for E. coli for each
antibiotic to determine the proportion of samples from each treatment that are considered resistant.
The breakpoint diameters used were: ampicillin: 14 mm, cefotaxime: 23 mm, chloramphenicol: 17
mm, ciprofloxacin: 25 mm, gentamicin: 16 mm, and imipenem: 24mm.
2.7. DNA EXTRACTION
DNA from compost and manure samples was extracted using two extraction kits: the
FastDNA Spin Kit for Soil, Catalog #116560200 (MP Biomedicals, Solon, OH), which served as
the primary extraction kit and was used for all samples, and the ZR Fecal DNA MiniPrep Kit,
Catalog #D6010 (Zymo Research Corporation, Irvine, CA) which served as a secondary kit for

23
comparison purposes and was only used to extract 10% of samples. Compost samples were first
blended thoroughly to break down large pieces of mulch and hay into a more uniform and
homogeneous consistency that could be easily extracted. Following blending, 500 mg of compost
or manure was aseptically transferred into an appropriate test tube for extraction. Extraction
followed manufacturer’s instructions, except that a 2-hour incubation period was added to the
protocol immediately following the bead-beating step to ensure unbiased lysing of both gram-
positive and gram-negative microbial cells, and the final centrifugation step was extended to 3
minutes to ensure complete capture of DNA. The OneStep PCR Inhibitor Removal Kit, Catalog
#D6030 (Zymo Research Corporation, Irvine, CA) was used as an additional cleanup step.
DNA was also extracted from the Kirby Bauer isolates using the FastDNA Spin Kit for
Soil by streaking the stored isolates from glycerol stock onto a fresh MacConkey agar plate and
incubating overnight. The plate was then rinsed with 500 ml of deionized (DI) water and mixed
using a sterile plate spreader. The resulting suspension fluid was then pipetted into the extraction
kit’s Lysing Matrix E tube and DNA was then extracted following the manufacturer’s protocol
and the Zymo OneStep PCR Inhibitor Removal Kit was used as an additional cleanup step.
2.8. WHOLE GENOME SEQUENCING OF KIRBY BAUER ISOLATES
Illumina whole genome sequencing of the Kirby Bauer isolates will be carried out in the
future to explore the genotypes of putative E. coli colonies. This can help validate the use of the
selected antibiotic MICs and also provide evidence of whether gene transfer was at play in the
composting process. Eighty isolates have been submitted to MicrobesNG at the University of
Birmingham, England for whole-genome sequencing.
2.9. METAGENOMIC SEQUENCING AND ANALYSIS
A set of 60 samples was selected from among all of the small-scale and heat-controlled
compost and manure samples to provide a cross-section of the overall composting process with
time. Samples were selected to be equally representative of all manure types and composting
methods at each time point. Samples were then submitted to the Virginia Bioinformatics Institute,

24
Blacksburg, VA, for Illumina HiSeq High Output 2x100 paired end cycle clustering and
sequencing per lane and run as 5 lanes of 12 samples each. Sequencing results were stitched
together and analyzed by uploading to MetaStorm, an online metagenomics analysis tool which
compares gene sequence reads against several databases for both taxonomic and ARG analysis
and facilitates visualization of the results (76). ARG sequences were identified through comparison
with the comprehensive antibiotics resistance database (CARD).
2.10. 16S rRNA GENE AMPLICON SEQUENCING
All extracted DNA samples from each composting trial were submitted to the Virginia
Bioinformatics Institute for 16S rRNA gen amplicon sequencing. Samples were submitted in 2
lanes of 150 samples each sequenced using Illumina MiSeq V3 2x300 paired end cycle clustering
and sequencing per lane. Sequencing results were stitched together and taxonomic analysis was
performed using QIIME(77). All singleton reads and chimeric sequences were removed and OTU
tables were generated allowing for taxonomic composition analysis. Jackknifed beta diversity
analysis was performed to calculate unweighted UniFrac distance matrices for the comparison of
sample taxonomic similarity.
2.11. QUANTITATIVE POLYMERASE CHAIN REACTION (QPCR)
A qPCR dilution test was performed on extracted DNA to minimize inhibition by running
a plate with a range of dilutions and determining which dilution resulted in the highest initial
concentrations of 16s rRNA. Samples were then diluted 1:100 based upon this result. QPCR was
then performed in triplicate on all diluted samples using the CFX96 Touch Real-Time PCR
Detection System (BioRad Laboratories, Hercules, CA) to quantify initial concentrations of 16S
rRNA genes, tet(W), and sul1. Tet(W) and sul1 were chosen because the treated beef cattle were
administered chlortetracycline and sulfamethazine, so an effect on tetracycline and sulfonamide
resistance was expected; these two genes are also well represented in the current research. Tet(W)
codes for ribosomal protection proteins, while sul1 codes for sulfonamide-resistant
dihydropteroate synthase. Primer sequences used were those outlined by Ma et al. (78). The
25
SsoFast Evagreen Supermix, Catalog #1725204 (BioRad Laboratories, Hercules, CA) was used
according to manufacturer instruction to create the qPCR mastermix.
2.12. STATISTICAL ANALYSES
Statistical analyses were performed using the JMP statistics software (SAS Institute Inc.,
Cary, NC). Statistical differences in the number of colonies enumerated on R2A and MacConkey
agars were calculated using a Kruskal-Wallis non-parametric rank test. Zero-Inflated Poisson
analysis was used to test for differences in the antibiotic supplemented plates due to the presence
of many “below detection limit” measurements. A significance value of α = 0.05 (i.e. p < 0.05)
was considered significant. Statistical differences between qPCR ARG concentrations were also
calculated using the Kruskal-Wallis nonparametric rank test. The test was applied to the log
starting quantity as well as to the starting quantity normalized to the number of 16S rRNA gene
copies. Statistical differences in the proportion of Kirby Bauer isolates resistant to each of the
tested antibiotics were calculated using a Pearson’s Chi-Squared analysis. Statistical comparisons
of the similarity of ARG profiles of metagenomic data and of similarity of taxonomic class data
and UniFrac distances were determined using an analysis of similarities (ANOSIM) test performed
using the software Primer 6 (79). The ANOSIM test is a nonparametric test comparing samples
based upon similarity using a similarity matrix. The ANOSIM test is more sensitive to presence
or absence of a parameter (bacterial species or ARG) than to differences in the abundance of the
most abundant parameters.
26
3. RESULTS: EFFECT OF COMPOSTING CATTLE MANURE ON THE
PREVALENCE OF ARBs AND ARGs
3.1. CULTURE-BASED ENUMERATION AND RESISTANCE TESTING
3.1.1. SMALL-SCALE COMPOSTING
For the small-scale composting trial, total heterotrophic plate counts (HPCs) were
enumerated using R2A agar, with results shown in Figure 3.1 and Figure 3.2. It was found that
the number of HPCs increased rapidly at the onset of composting and ultimately stabilized 2 logs
higher than initial day 0 values (Figure 3.1). There was significant variation in the number of HPCs
in each of the four manure types subject to composting at day 0 (p<0.0001; Kruskal-Wallis), but
by day 42 there was no significant difference among composts derived from the different manure
types (Figure 3.2.).
The small-scale composting trial achieved the FSMA required 3 days at thermophilic
temperatures for the statically composted treatments, but the turned treatments failed to maintain
thermophilic temperatures for the required 15 days. Fecal coliforms enumerated using MacConkey
agar (Figures 3.3 and 3.4) behaved in a similar manner as observed for HPCs. Despite a decrease
in fecal coliforms on day 4 of static composting, counts rebounded and finished 2 logs higher than
initial day 0 values finishing at 9 log CFU/g. This change was significant (p<0.0001; Kruskal-
Wallis). The fecal coliform count, therefore, did not only fail to meet the FSMA required 3 log
MPN/g, but the composting process appeared to increase the number of indicator bacteria. There
was no significant difference in MacConkey counts between the two composting methods, i.e. the
maintenance of target temperatures did not improve inactivation of indicator bacteria. The high
remaining abundance of fecal coliforms prompted the use of IDEXX with Colilert to specifically
quantify E. coli (Figure 3.5 and 3.6), which confirmed that E. coli were present in the 3-4 log
MPN/g range in the finished day 42 compost.
The Kirby Bauer disk diffusion test was applied to a randomly selected subset of 10
MacConkey isolates corresponding to each treatment at day 42 for compost samples and day 0 for
non-composted manure samples to characterize resistance patterns pre- and post-composting, as
outlined in Table 3.1. The number of isolates classified as resistant to each of the six antibiotics is
shown in Figures 3.7 and 3.8, organized by composting method and manure type, respectively.
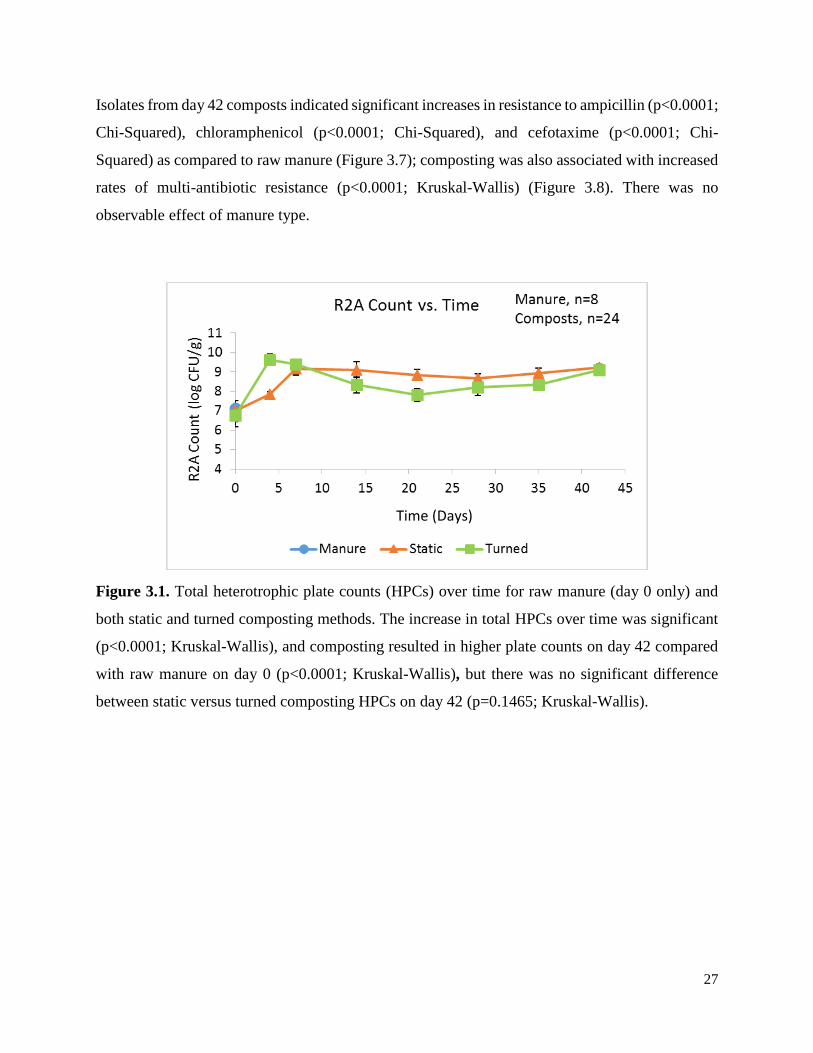
27
Isolates from day 42 composts indicated significant increases in resistance to ampicillin (p<0.0001;
Chi-Squared), chloramphenicol (p<0.0001; Chi-Squared), and cefotaxime (p<0.0001; Chi-
Squared) as compared to raw manure (Figure 3.7); composting was also associated with increased
rates of multi-antibiotic resistance (p<0.0001; Kruskal-Wallis) (Figure 3.8). There was no
observable effect of manure type.
Figure 3.1. Total heterotrophic plate counts (HPCs) over time for raw manure (day 0 only) and
both static and turned composting methods. The increase in total HPCs over time was significant
(p<0.0001; Kruskal-Wallis), and composting resulted in higher plate counts on day 42 compared
with raw manure on day 0 (p<0.0001; Kruskal-Wallis), but there was no significant difference
between static versus turned composting HPCs on day 42 (p=0.1465; Kruskal-Wallis).
Time (Days)
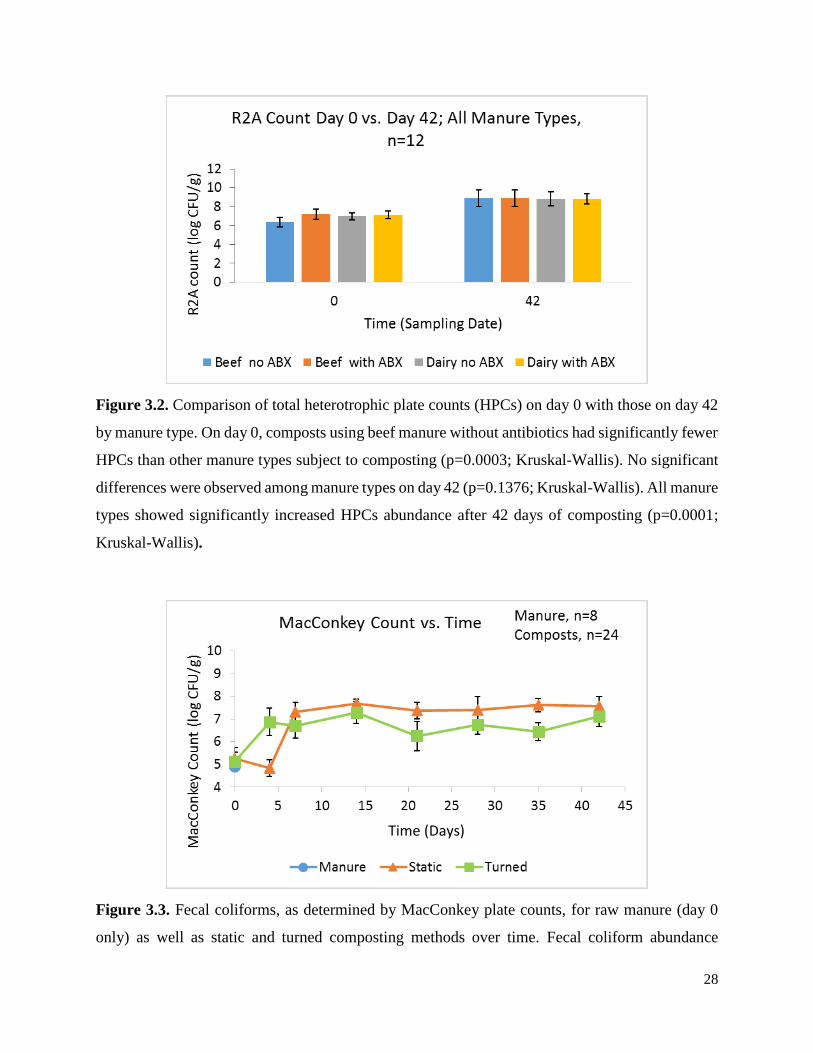
28
Figure 3.2. Comparison of total heterotrophic plate counts (HPCs) on day 0 with those on day 42
by manure type. On day 0, composts using beef manure without antibiotics had significantly fewer
HPCs than other manure types subject to composting (p=0.0003; Kruskal-Wallis). No significant
differences were observed among manure types on day 42 (p=0.1376; Kruskal-Wallis). All manure
types showed significantly increased HPCs abundance after 42 days of composting (p=0.0001;
Kruskal-Wallis).
Figure 3.3. Fecal coliforms, as determined by MacConkey plate counts, for raw manure (day 0
only) as well as static and turned composting methods over time. Fecal coliform abundance
Time (Days)
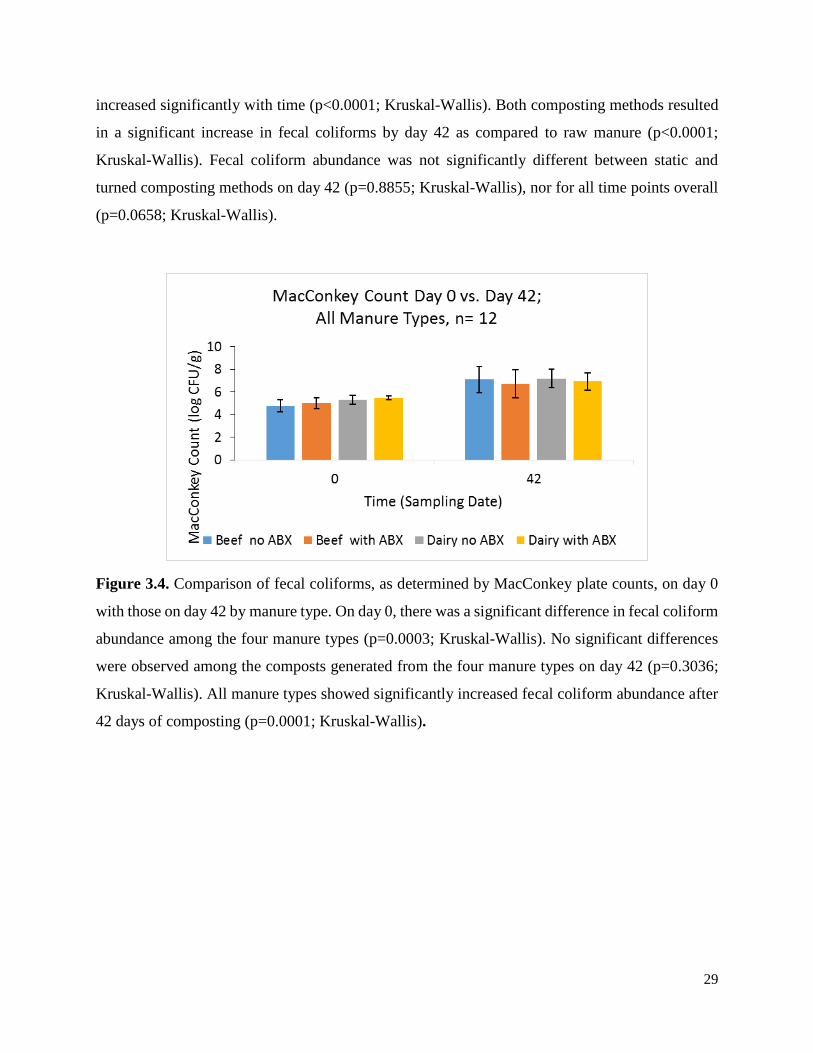
29
increased significantly with time (p<0.0001; Kruskal-Wallis). Both composting methods resulted
in a significant increase in fecal coliforms by day 42 as compared to raw manure (p<0.0001;
Kruskal-Wallis). Fecal coliform abundance was not significantly different between static and
turned composting methods on day 42 (p=0.8855; Kruskal-Wallis), nor for all time points overall
(p=0.0658; Kruskal-Wallis).
Figure 3.4. Comparison of fecal coliforms, as determined by MacConkey plate counts, on day 0
with those on day 42 by manure type. On day 0, there was a significant difference in fecal coliform
abundance among the four manure types (p=0.0003; Kruskal-Wallis). No significant differences
were observed among the composts generated from the four manure types on day 42 (p=0.3036;
Kruskal-Wallis). All manure types showed significantly increased fecal coliform abundance after
42 days of composting (p=0.0001; Kruskal-Wallis).
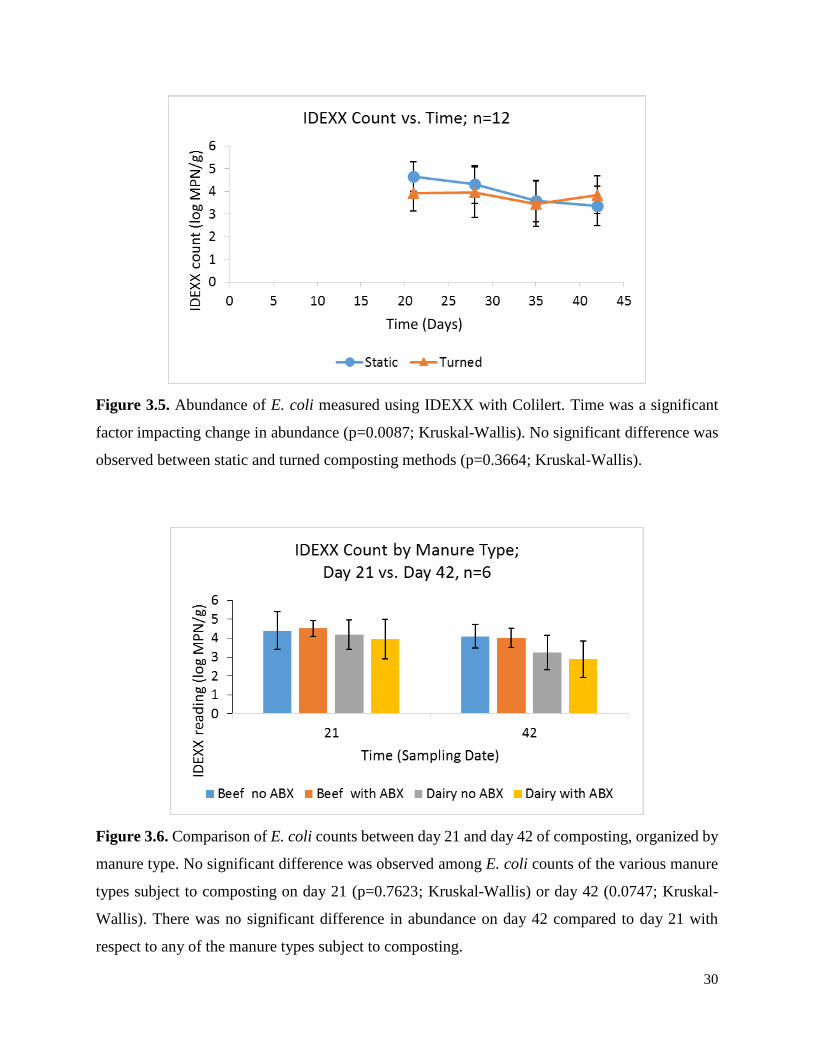
30
Figure 3.5. Abundance of E. coli measured using IDEXX with Colilert. Time was a significant
factor impacting change in abundance (p=0.0087; Kruskal-Wallis). No significant difference was
observed between static and turned composting methods (p=0.3664; Kruskal-Wallis).
Figure 3.6. Comparison of E. coli counts between day 21 and day 42 of composting, organized by
manure type. No significant difference was observed among E. coli counts of the various manure
types subject to composting on day 21 (p=0.7623; Kruskal-Wallis) or day 42 (0.0747; Kruskal-
Wallis). There was no significant difference in abundance on day 42 compared to day 21 with
respect to any of the manure types subject to composting.
Time (Days)

31
Table 3.1. Summary of Kirby Bauer disk diffusion results for each of antibiotic tested. The
proportion of isolates that tested as resistant is reported. Ten total isolates were tested for each
reported sample type.
Figure 3.7. Number of MacConkey isolates classified as resistant to each of six antibiotics
according to the Kirby-Bauer disk diffusion assay, organized by composting method. Composting,
relative to raw manure, was associated with a significant increase in the number of isolates resistant
to ampicillin (p<0.0001; Chi-squared), chloramphenicol (p<0.0001; Chi-squared), and cefotaxime
Sample Type Ampicillin Ciprofloxacin Chloramphenicol Gentamicin Imipenem Cefotaxime
Beef Antibiotic Manure 0.0 0.0 0.0 0.0 0.0 0.0
Beef Control Manure 0.0 0.1 0.0 0.0 0.0 0.0
Dairy Antibiotic Manure 0.0 0.0 0.0 0.0 0.0 0.0
Dairy Control Manure 0.1 0.1 0.0 0.0 0.0 0.1
Static Beef Antibiotic Compost 1.0 0.1 0.7 0.0 0.0 0.6
Static Beef Control Compost 1.0 0.1 0.7 0.0 0.1 0.7
Static Dairy Antibiotic Compost 1.0 0.0 0.9 0.0 0.0 0.9
Static Dairy Control Compost 1.0 0.0 0.8 0.0 0.0 0.3
Turned Beef Antibiotic Compost 1.0 0.0 0.5 0.0 0.0 0.5
Turned Beef Control Compost 1.0 0.3 0.9 0.0 0.0 0.8
Turned Dairy Antibiotic Compost 0.6 0.2 0.3 0.0 0.1 0.2
Turned Dairy Control Compost 1.0 0.0 0.7 0.0 0.0 0.7
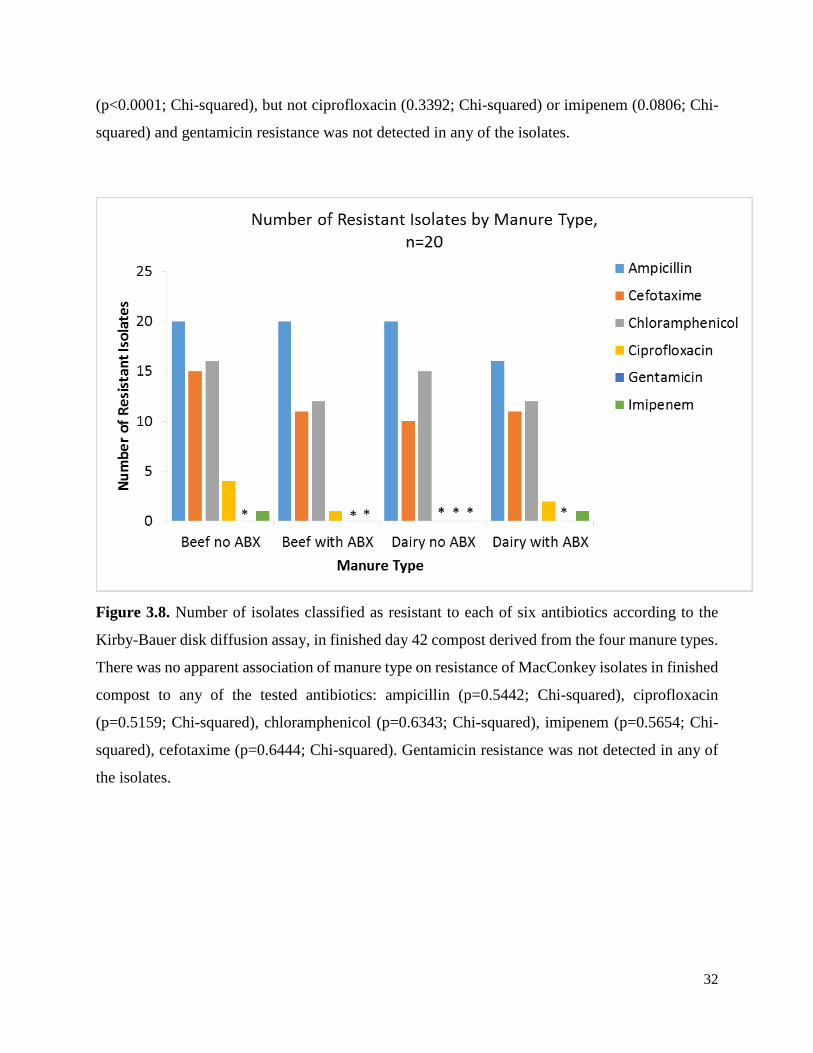
32
(p<0.0001; Chi-squared), but not ciprofloxacin (0.3392; Chi-squared) or imipenem (0.0806; Chi-
squared) and gentamicin resistance was not detected in any of the isolates.
Figure 3.8. Number of isolates classified as resistant to each of six antibiotics according to the
Kirby-Bauer disk diffusion assay, in finished day 42 compost derived from the four manure types.
There was no apparent association of manure type on resistance of MacConkey isolates in finished
compost to any of the tested antibiotics: ampicillin (p=0.5442; Chi-squared), ciprofloxacin
(p=0.5159; Chi-squared), chloramphenicol (p=0.6343; Chi-squared), imipenem (p=0.5654; Chi-
squared), cefotaxime (p=0.6444; Chi-squared). Gentamicin resistance was not detected in any of
the isolates.

33
Figure 3.9. Comparison of multi-antibiotic resistance occurrence among the MacConkey isolates,
as determined by the Kirby-Bauer disk diffusion assay, organized by composting method. Isolates
derived from compost tested resistant to a significantly greater mean number of antibiotics than
those taken from raw manure (p<0.0001; Kruskal-Wallis).
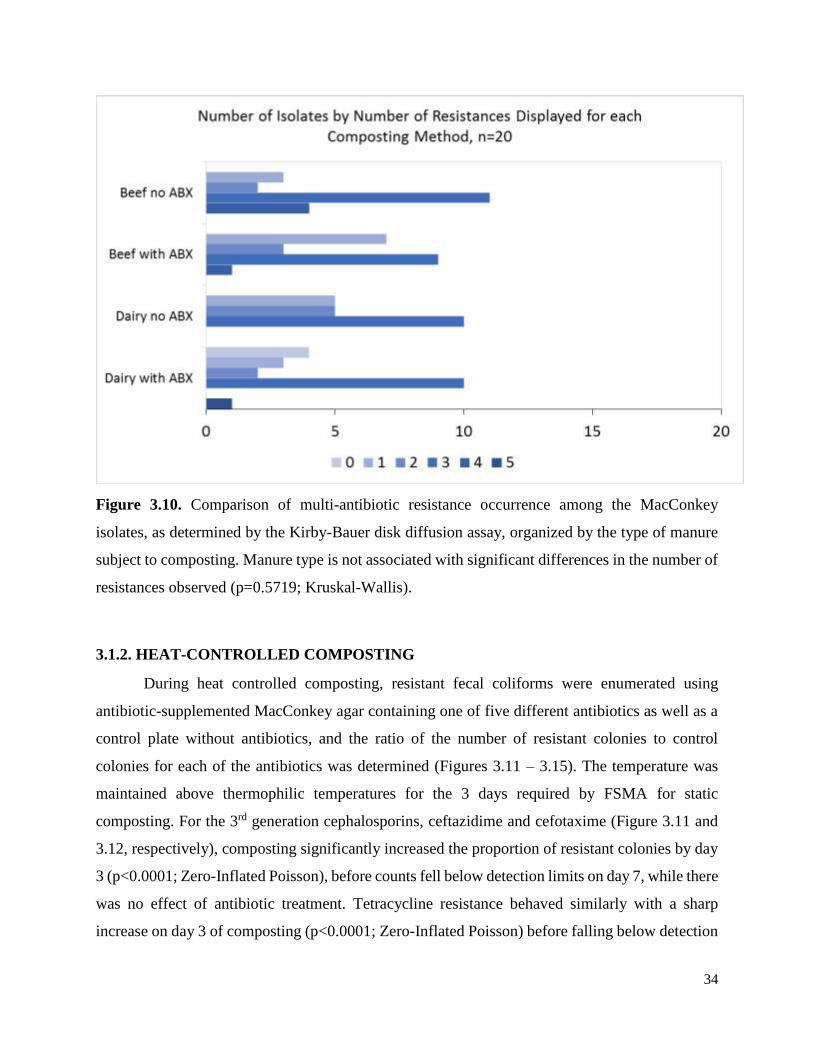
34
Figure 3.10. Comparison of multi-antibiotic resistance occurrence among the MacConkey
isolates, as determined by the Kirby-Bauer disk diffusion assay, organized by the type of manure
subject to composting. Manure type is not associated with significant differences in the number of
resistances observed (p=0.5719; Kruskal-Wallis).
3.1.2. HEAT-CONTROLLED COMPOSTING
During heat controlled composting, resistant fecal coliforms were enumerated using
antibiotic-supplemented MacConkey agar containing one of five different antibiotics as well as a
control plate without antibiotics, and the ratio of the number of resistant colonies to control
colonies for each of the antibiotics was determined (Figures 3.11 – 3.15). The temperature was
maintained above thermophilic temperatures for the 3 days required by FSMA for static
composting. For the 3rd generation cephalosporins, ceftazidime and cefotaxime (Figure 3.11 and
3.12, respectively), composting significantly increased the proportion of resistant colonies by day
3 (p<0.0001; Zero-Inflated Poisson), before counts fell below detection limits on day 7, while there
was no effect of antibiotic treatment. Tetracycline resistance behaved similarly with a sharp
increase on day 3 of composting (p<0.0001; Zero-Inflated Poisson) before falling below detection
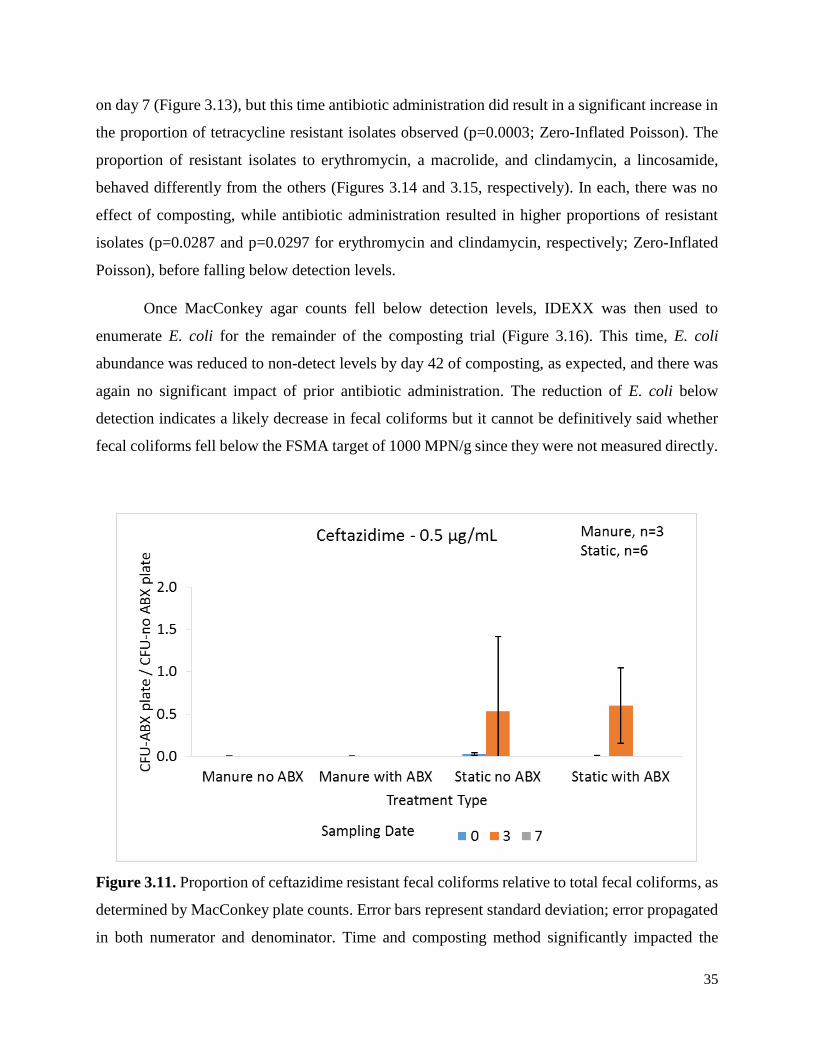
35
on day 7 (Figure 3.13), but this time antibiotic administration did result in a significant increase in
the proportion of tetracycline resistant isolates observed (p=0.0003; Zero-Inflated Poisson). The
proportion of resistant isolates to erythromycin, a macrolide, and clindamycin, a lincosamide,
behaved differently from the others (Figures 3.14 and 3.15, respectively). In each, there was no
effect of composting, while antibiotic administration resulted in higher proportions of resistant
isolates (p=0.0287 and p=0.0297 for erythromycin and clindamycin, respectively; Zero-Inflated
Poisson), before falling below detection levels.
Once MacConkey agar counts fell below detection levels, IDEXX was then used to
enumerate E. coli for the remainder of the composting trial (Figure 3.16). This time, E. coli
abundance was reduced to non-detect levels by day 42 of composting, as expected, and there was
again no significant impact of prior antibiotic administration. The reduction of E. coli below
detection indicates a likely decrease in fecal coliforms but it cannot be definitively said whether
fecal coliforms fell below the FSMA target of 1000 MPN/g since they were not measured directly.
Figure 3.11. Proportion of ceftazidime resistant fecal coliforms relative to total fecal coliforms, as
determined by MacConkey plate counts. Error bars represent standard deviation; error propagated
in both numerator and denominator. Time and composting method significantly impacted the

36
proportion of fecal coliforms capable of growth on plates containing ceftazidime (p<0.0001; Zero-
inflated Poisson). Prior antibiotic administration did not have a significant effect (p=0.6724; Zero-
inflated Poisson).
Figure 3.12. Proportion of cefotaxime resistant fecal coliforms relative to total fecal coliforms, as
determined by MacConkey plate counts. Error bars represent standard deviation; error propagated
in both numerator and denominator. Time and composting method significantly impact relative
resistance of fecal coliforms to cefotaxime (p<0.0001; Zero-inflated Poisson), antibiotic treatment
has no significant impact (p=0.5905; Zero-inflated Poisson).
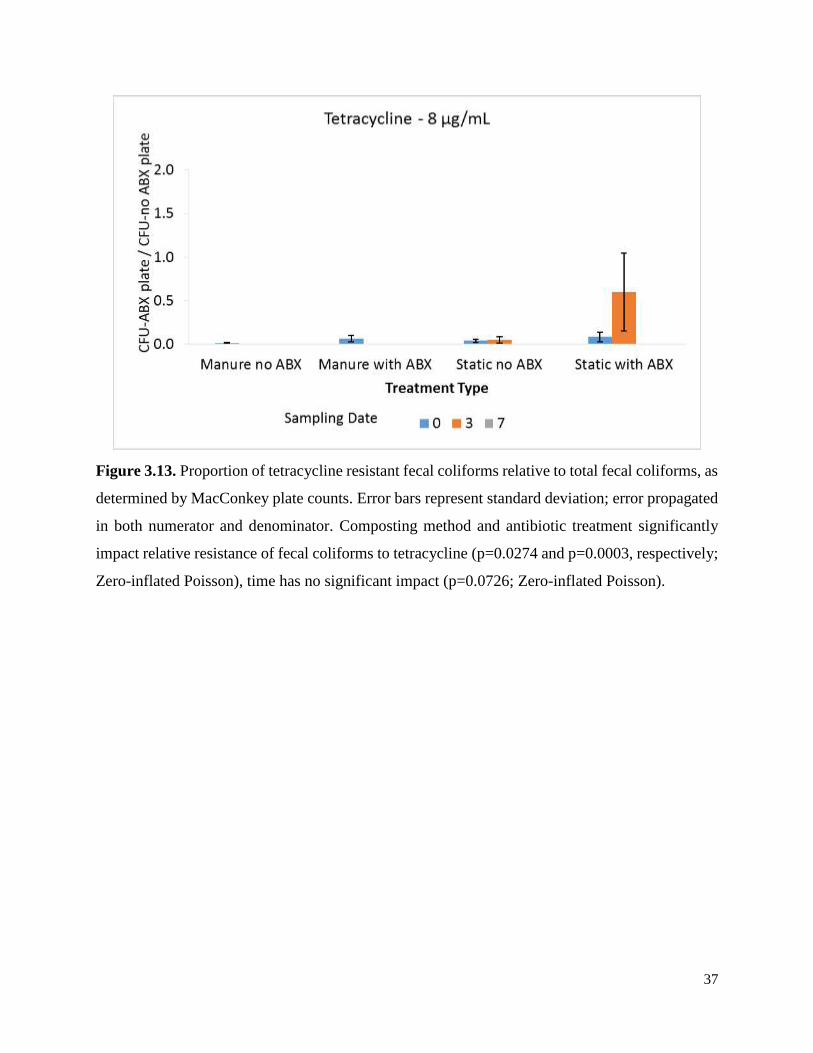
37
Figure 3.13. Proportion of tetracycline resistant fecal coliforms relative to total fecal coliforms, as
determined by MacConkey plate counts. Error bars represent standard deviation; error propagated
in both numerator and denominator. Composting method and antibiotic treatment significantly
impact relative resistance of fecal coliforms to tetracycline (p=0.0274 and p=0.0003, respectively;
Zero-inflated Poisson), time has no significant impact (p=0.0726; Zero-inflated Poisson).
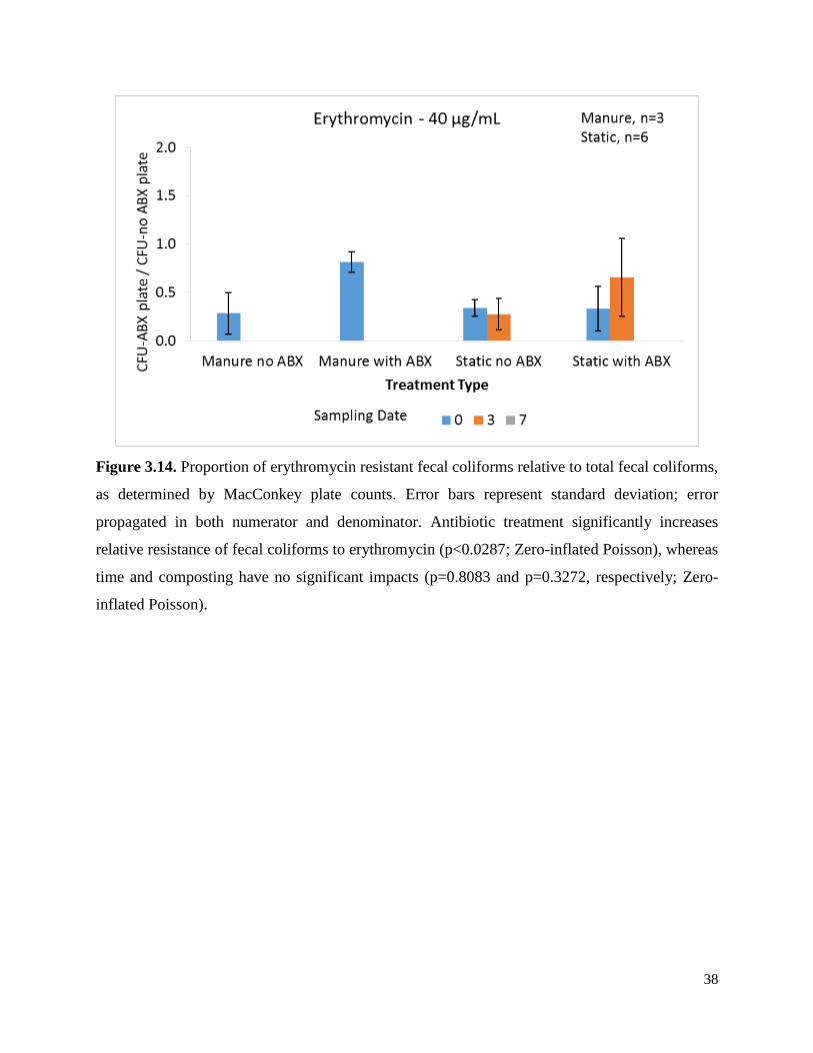
38
Figure 3.14. Proportion of erythromycin resistant fecal coliforms relative to total fecal coliforms,
as determined by MacConkey plate counts. Error bars represent standard deviation; error
propagated in both numerator and denominator. Antibiotic treatment significantly increases
relative resistance of fecal coliforms to erythromycin (p<0.0287; Zero-inflated Poisson), whereas
time and composting have no significant impacts (p=0.8083 and p=0.3272, respectively; Zero-
inflated Poisson).

39
Figure 3.15. Proportion of clindamycin resistant fecal coliforms relative to total fecal coliforms,
as determined by MacConkey plate counts. Error bars represent standard deviation; error
propagated in both numerator and denominator. Antibiotic treatment significantly impacts the
relative resistance of fecal coliforms to clindamycin (p<0.0297; Zero-inflated Poisson), whereas
time and composting have no significant impact (p=0.2378 and p=0.8272, respectively; Zero-
inflated Poisson).
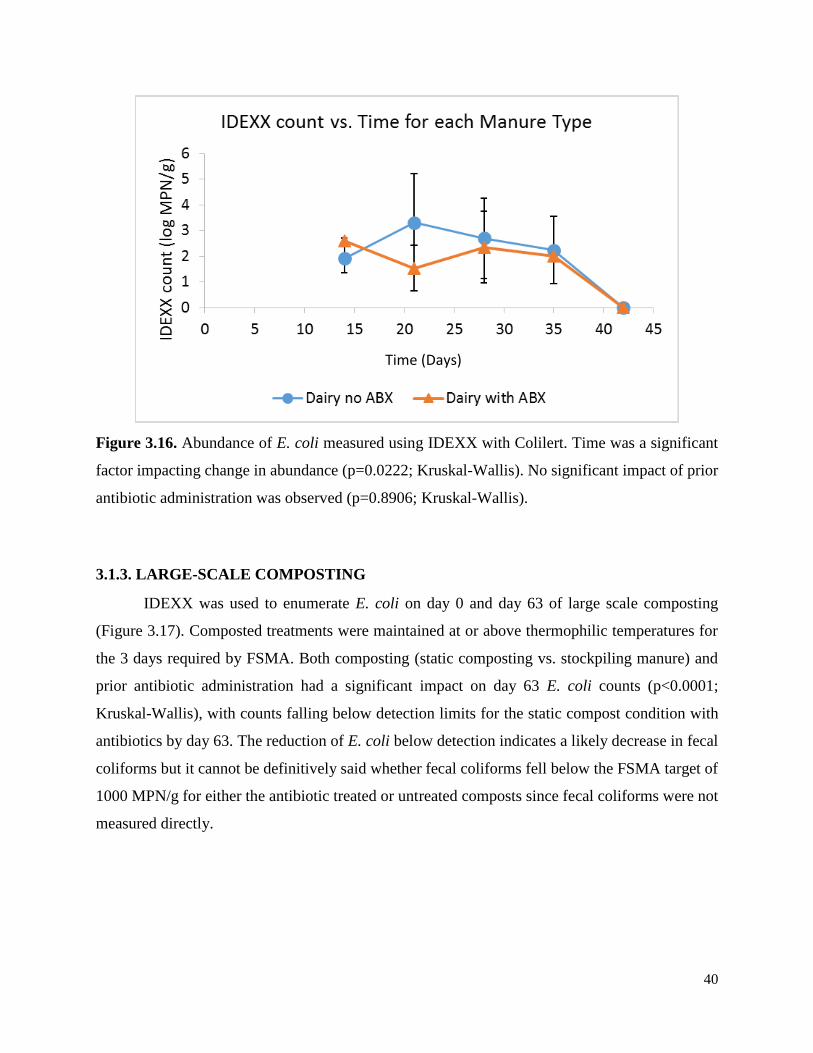
40
Figure 3.16. Abundance of E. coli measured using IDEXX with Colilert. Time was a significant
factor impacting change in abundance (p=0.0222; Kruskal-Wallis). No significant impact of prior
antibiotic administration was observed (p=0.8906; Kruskal-Wallis).
3.1.3. LARGE-SCALE COMPOSTING
IDEXX was used to enumerate E. coli on day 0 and day 63 of large scale composting
(Figure 3.17). Composted treatments were maintained at or above thermophilic temperatures for
the 3 days required by FSMA. Both composting (static composting vs. stockpiling manure) and
prior antibiotic administration had a significant impact on day 63 E. coli counts (p<0.0001;
Kruskal-Wallis), with counts falling below detection limits for the static compost condition with
antibiotics by day 63. The reduction of E. coli below detection indicates a likely decrease in fecal
coliforms but it cannot be definitively said whether fecal coliforms fell below the FSMA target of
1000 MPN/g for either the antibiotic treated or untreated composts since fecal coliforms were not
measured directly.
Time (Days)
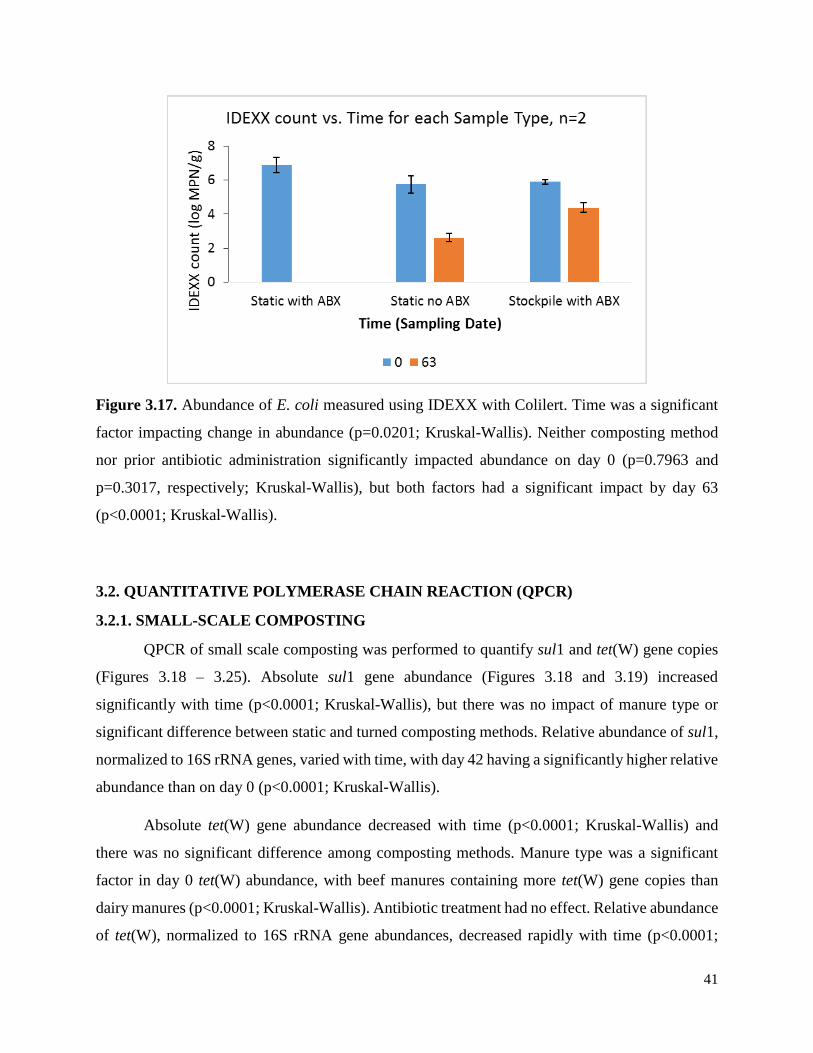
41
Figure 3.17. Abundance of E. coli measured using IDEXX with Colilert. Time was a significant
factor impacting change in abundance (p=0.0201; Kruskal-Wallis). Neither composting method
nor prior antibiotic administration significantly impacted abundance on day 0 (p=0.7963 and
p=0.3017, respectively; Kruskal-Wallis), but both factors had a significant impact by day 63
(p<0.0001; Kruskal-Wallis).
3.2. QUANTITATIVE POLYMERASE CHAIN REACTION (QPCR)
3.2.1. SMALL-SCALE COMPOSTING
QPCR of small scale composting was performed to quantify sul1 and tet(W) gene copies
(Figures 3.18 – 3.25). Absolute sul1 gene abundance (Figures 3.18 and 3.19) increased
significantly with time (p<0.0001; Kruskal-Wallis), but there was no impact of manure type or
significant difference between static and turned composting methods. Relative abundance of sul1,
normalized to 16S rRNA genes, varied with time, with day 42 having a significantly higher relative
abundance than on day 0 (p<0.0001; Kruskal-Wallis).
Absolute tet(W) gene abundance decreased with time (p<0.0001; Kruskal-Wallis) and
there was no significant difference among composting methods. Manure type was a significant
factor in day 0 tet(W) abundance, with beef manures containing more tet(W) gene copies than
dairy manures (p<0.0001; Kruskal-Wallis). Antibiotic treatment had no effect. Relative abundance
of tet(W), normalized to 16S rRNA gene abundances, decreased rapidly with time (p<0.0001;
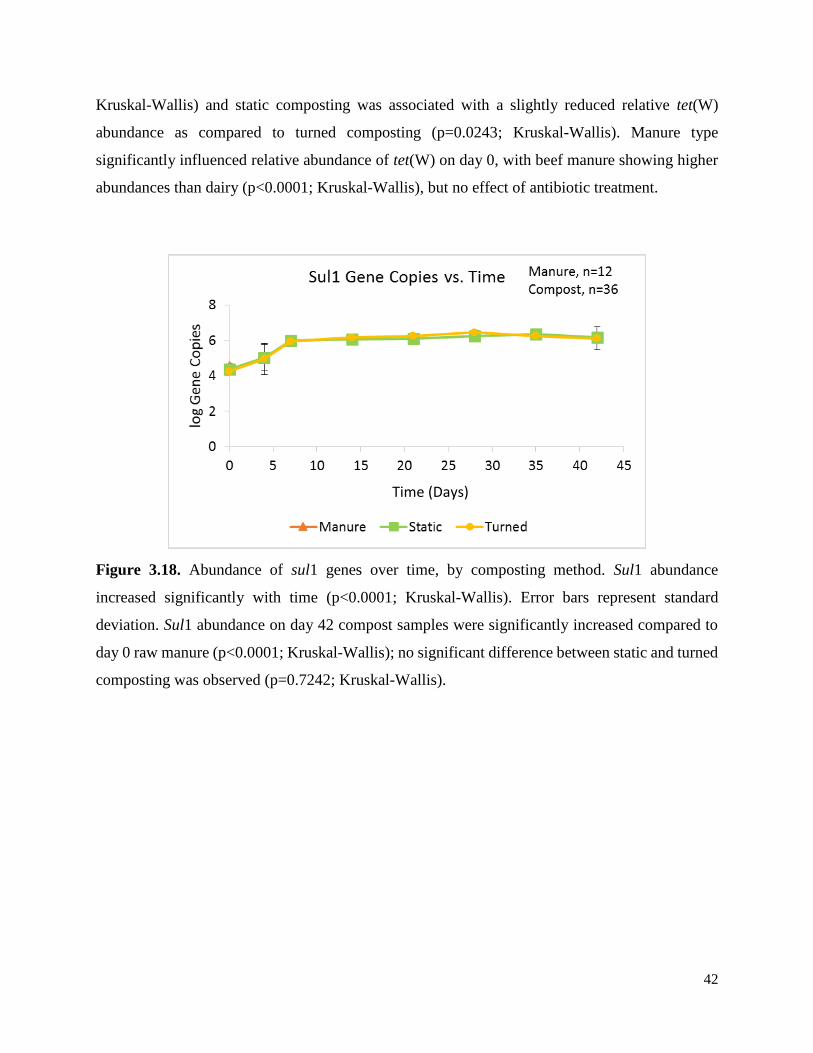
42
Kruskal-Wallis) and static composting was associated with a slightly reduced relative tet(W)
abundance as compared to turned composting (p=0.0243; Kruskal-Wallis). Manure type
significantly influenced relative abundance of tet(W) on day 0, with beef manure showing higher
abundances than dairy (p<0.0001; Kruskal-Wallis), but no effect of antibiotic treatment.
Figure 3.18. Abundance of sul1 genes over time, by composting method. Sul1 abundance
increased significantly with time (p<0.0001; Kruskal-Wallis). Error bars represent standard
deviation. Sul1 abundance on day 42 compost samples were significantly increased compared to
day 0 raw manure (p<0.0001; Kruskal-Wallis); no significant difference between static and turned
composting was observed (p=0.7242; Kruskal-Wallis).
Time (Days)
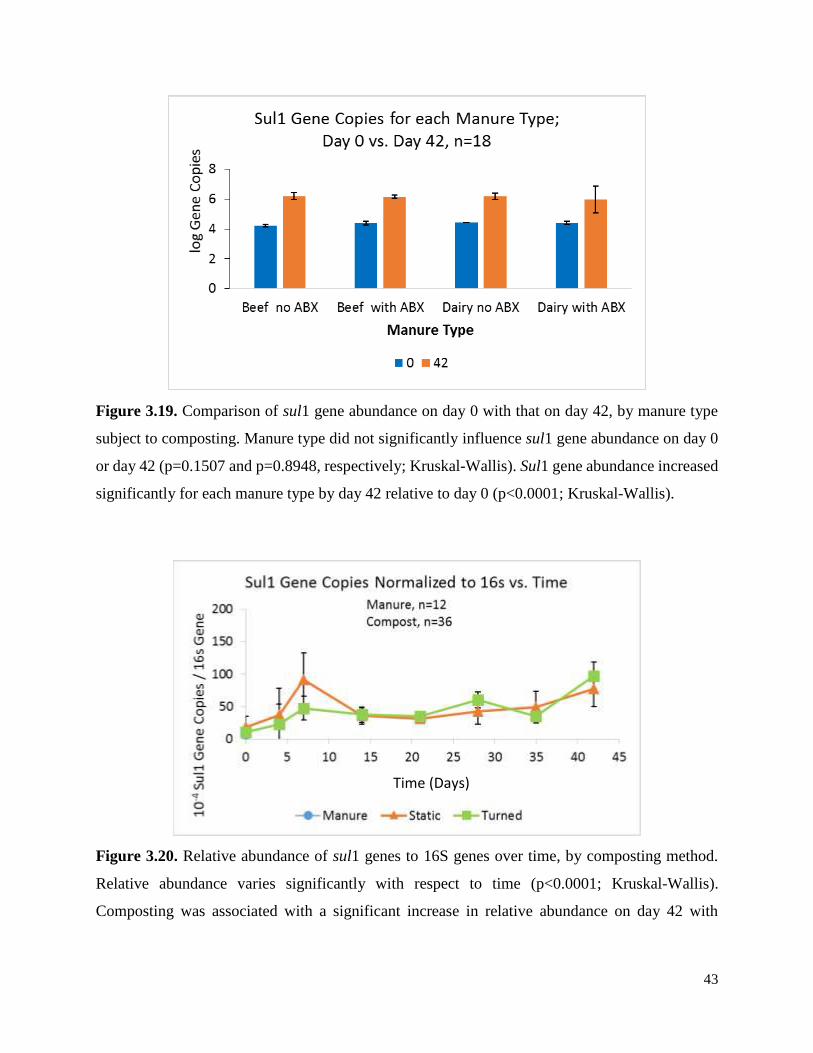
43
Figure 3.19. Comparison of sul1 gene abundance on day 0 with that on day 42, by manure type
subject to composting. Manure type did not significantly influence sul1 gene abundance on day 0
or day 42 (p=0.1507 and p=0.8948, respectively; Kruskal-Wallis). Sul1 gene abundance increased
significantly for each manure type by day 42 relative to day 0 (p<0.0001; Kruskal-Wallis).
Figure 3.20. Relative abundance of sul1 genes to 16S genes over time, by composting method.
Relative abundance varies significantly with respect to time (p<0.0001; Kruskal-Wallis).
Composting was associated with a significant increase in relative abundance on day 42 with
Time (Days)
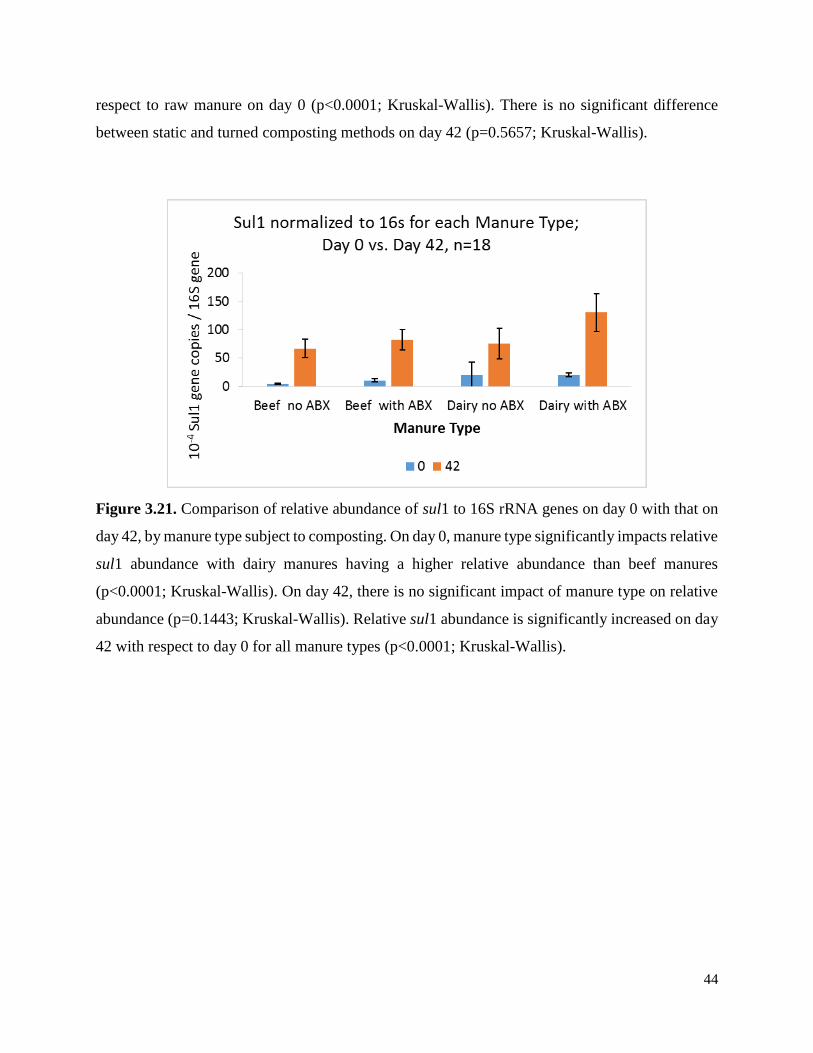
44
respect to raw manure on day 0 (p<0.0001; Kruskal-Wallis). There is no significant difference
between static and turned composting methods on day 42 (p=0.5657; Kruskal-Wallis).
Figure 3.21. Comparison of relative abundance of sul1 to 16S rRNA genes on day 0 with that on
day 42, by manure type subject to composting. On day 0, manure type significantly impacts relative
sul1 abundance with dairy manures having a higher relative abundance than beef manures
(p<0.0001; Kruskal-Wallis). On day 42, there is no significant impact of manure type on relative
abundance (p=0.1443; Kruskal-Wallis). Relative sul1 abundance is significantly increased on day
42 with respect to day 0 for all manure types (p<0.0001; Kruskal-Wallis).
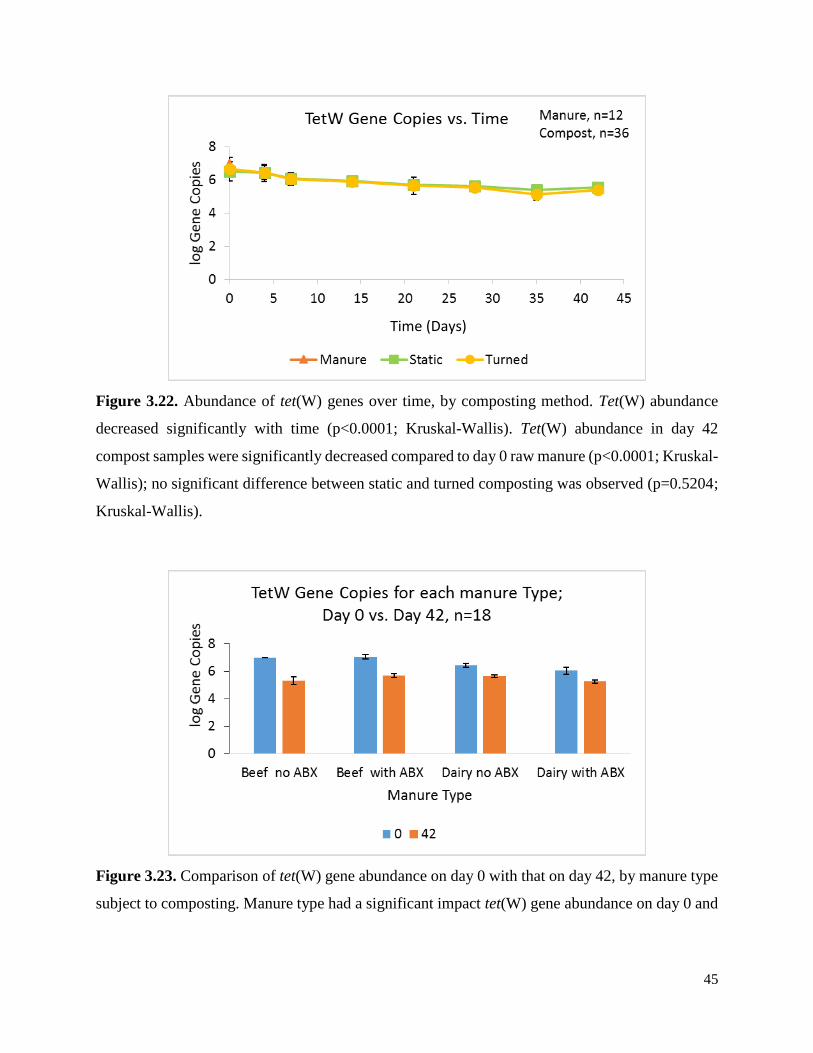
45
Figure 3.22. Abundance of tet(W) genes over time, by composting method. Tet(W) abundance
decreased significantly with time (p<0.0001; Kruskal-Wallis). Tet(W) abundance in day 42
compost samples were significantly decreased compared to day 0 raw manure (p<0.0001; Kruskal-
Wallis); no significant difference between static and turned composting was observed (p=0.5204;
Kruskal-Wallis).
Figure 3.23. Comparison of tet(W) gene abundance on day 0 with that on day 42, by manure type
subject to composting. Manure type had a significant impact tet(W) gene abundance on day 0 and
Time (Days)
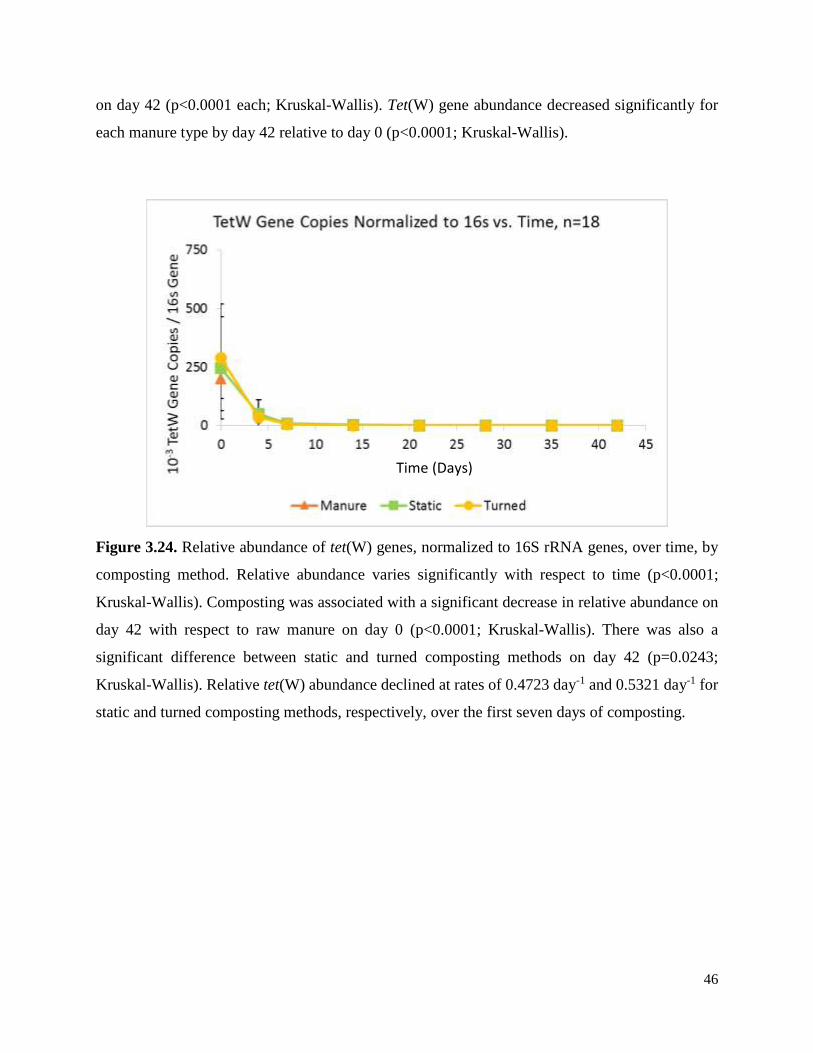
46
on day 42 (p<0.0001 each; Kruskal-Wallis). Tet(W) gene abundance decreased significantly for
each manure type by day 42 relative to day 0 (p<0.0001; Kruskal-Wallis).
Figure 3.24. Relative abundance of tet(W) genes, normalized to 16S rRNA genes, over time, by
composting method. Relative abundance varies significantly with respect to time (p<0.0001;
Kruskal-Wallis). Composting was associated with a significant decrease in relative abundance on
day 42 with respect to raw manure on day 0 (p<0.0001; Kruskal-Wallis). There was also a
significant difference between static and turned composting methods on day 42 (p=0.0243;
Kruskal-Wallis). Relative tet(W) abundance declined at rates of 0.4723 day-1 and 0.5321 day-1 for
static and turned composting methods, respectively, over the first seven days of composting.
Time (Days)
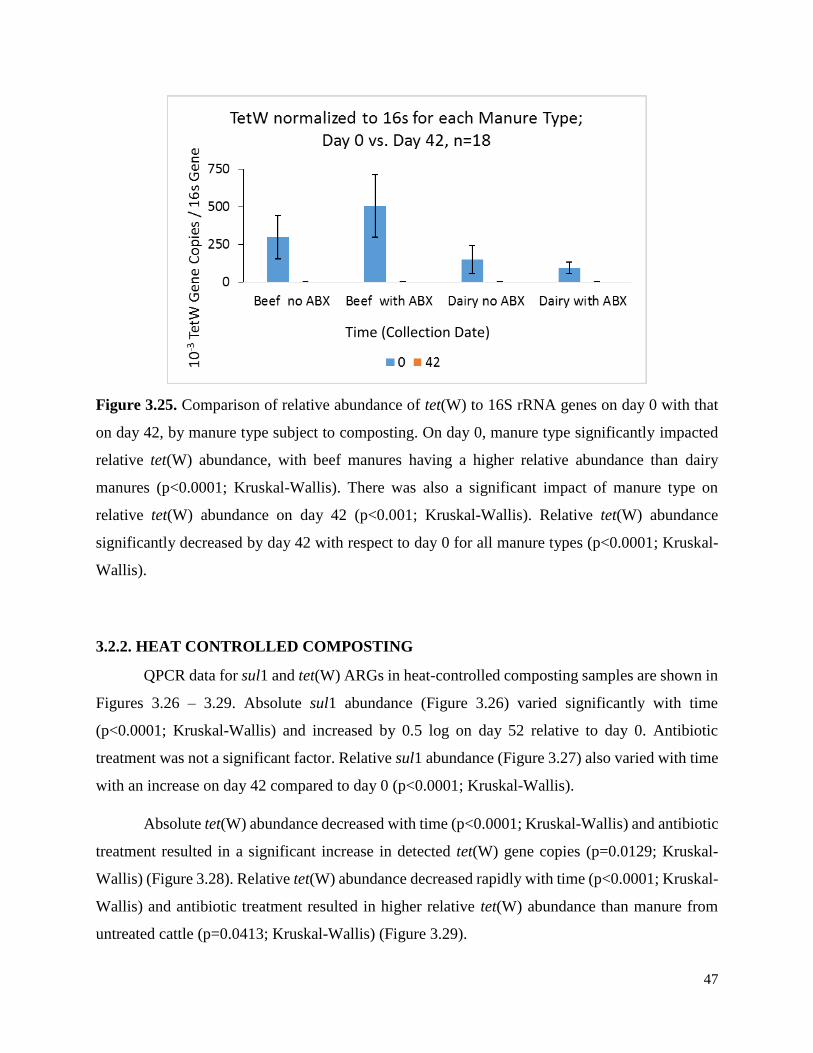
47
Figure 3.25. Comparison of relative abundance of tet(W) to 16S rRNA genes on day 0 with that
on day 42, by manure type subject to composting. On day 0, manure type significantly impacted
relative tet(W) abundance, with beef manures having a higher relative abundance than dairy
manures (p<0.0001; Kruskal-Wallis). There was also a significant impact of manure type on
relative tet(W) abundance on day 42 (p<0.001; Kruskal-Wallis). Relative tet(W) abundance
significantly decreased by day 42 with respect to day 0 for all manure types (p<0.0001; Kruskal-
Wallis).
3.2.2. HEAT CONTROLLED COMPOSTING
QPCR data for sul1 and tet(W) ARGs in heat-controlled composting samples are shown in
Figures 3.26 – 3.29. Absolute sul1 abundance (Figure 3.26) varied significantly with time
(p<0.0001; Kruskal-Wallis) and increased by 0.5 log on day 52 relative to day 0. Antibiotic
treatment was not a significant factor. Relative sul1 abundance (Figure 3.27) also varied with time
with an increase on day 42 compared to day 0 (p<0.0001; Kruskal-Wallis).
Absolute tet(W) abundance decreased with time (p<0.0001; Kruskal-Wallis) and antibiotic
treatment resulted in a significant increase in detected tet(W) gene copies (p=0.0129; Kruskal-
Wallis) (Figure 3.28). Relative tet(W) abundance decreased rapidly with time (p<0.0001; Kruskal-
Wallis) and antibiotic treatment resulted in higher relative tet(W) abundance than manure from
untreated cattle (p=0.0413; Kruskal-Wallis) (Figure 3.29).
Time (Collection Date)
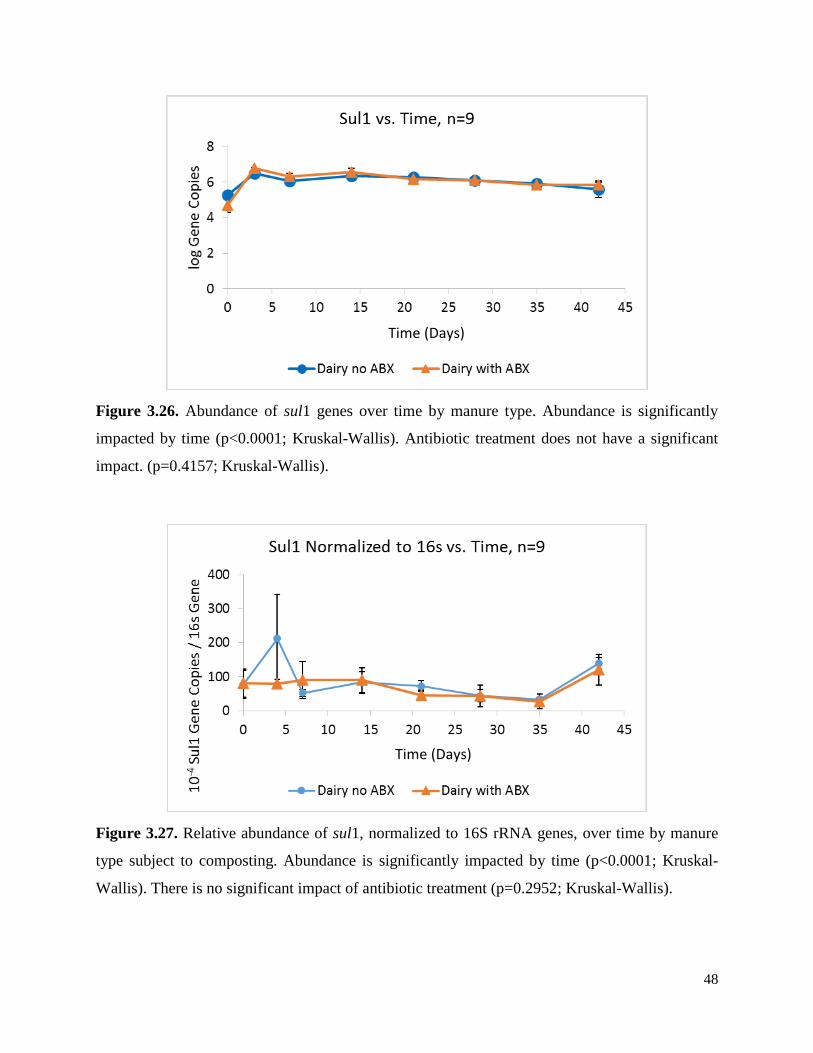
48
Figure 3.26. Abundance of sul1 genes over time by manure type. Abundance is significantly
impacted by time (p<0.0001; Kruskal-Wallis). Antibiotic treatment does not have a significant
impact. (p=0.4157; Kruskal-Wallis).
Figure 3.27. Relative abundance of sul1, normalized to 16S rRNA genes, over time by manure
type subject to composting. Abundance is significantly impacted by time (p<0.0001; Kruskal-
Wallis). There is no significant impact of antibiotic treatment (p=0.2952; Kruskal-Wallis).
Time (Days)
Time (Days)

49
Figure 3. 28. Abundance of tet(W) over time by manure type subject to composting. Time had a
significant effect on tet(W) abundance (p<0.0001; Kruskal-Wallis), as did antibiotic treatment
(p=0.0129; Kruskal-Wallis).
Figure 3.29. Relative abundance of tet(W), normalized to 16S rRNA genes, by manure type
subject to composting. Time and antibiotic treatment each had a significant impact on relative
tet(W) abundance (p<0.0001 and p=0.0413, respectively; Kruskal-Wallis). Relative tet(W)
abundance declined at rates of 0.7725 day-1 and 0.7171 day-1 for antibiotic treated and untreated
composting methods, respectively, over the first seven days of composting.
Time (Days)
Time (Days)
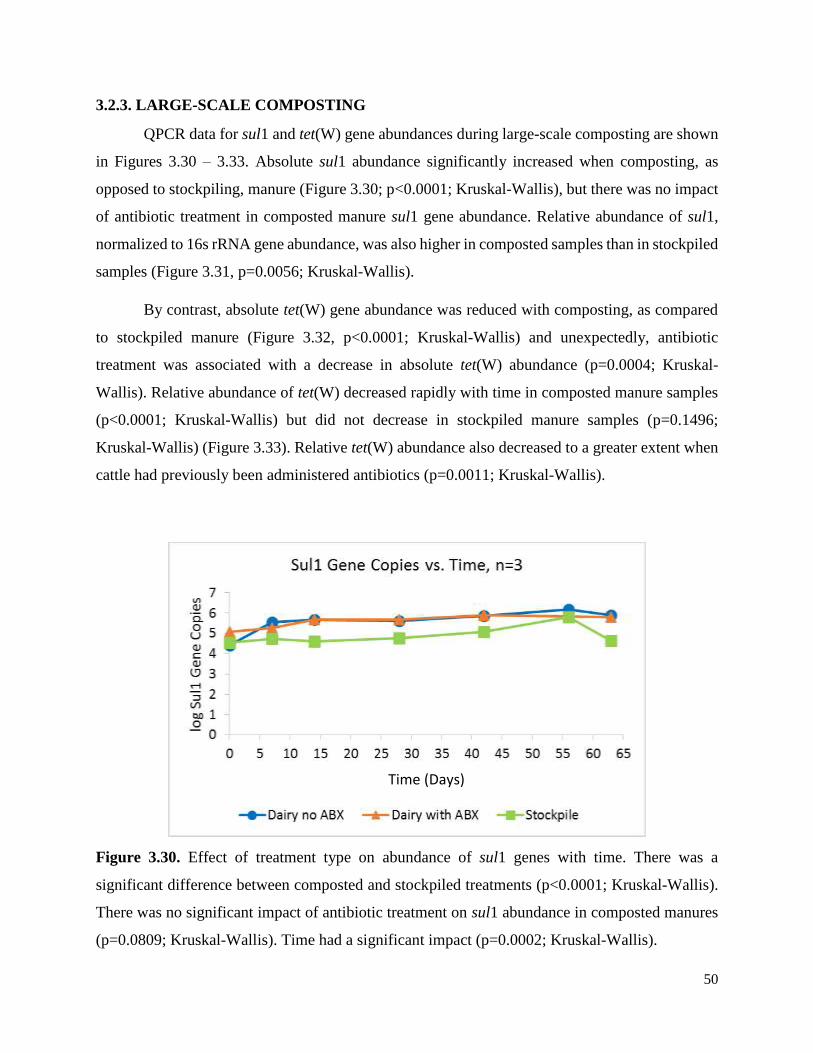
50
3.2.3. LARGE-SCALE COMPOSTING
QPCR data for sul1 and tet(W) gene abundances during large-scale composting are shown
in Figures 3.30 – 3.33. Absolute sul1 abundance significantly increased when composting, as
opposed to stockpiling, manure (Figure 3.30; p<0.0001; Kruskal-Wallis), but there was no impact
of antibiotic treatment in composted manure sul1 gene abundance. Relative abundance of sul1,
normalized to 16s rRNA gene abundance, was also higher in composted samples than in stockpiled
samples (Figure 3.31, p=0.0056; Kruskal-Wallis).
By contrast, absolute tet(W) gene abundance was reduced with composting, as compared
to stockpiled manure (Figure 3.32, p<0.0001; Kruskal-Wallis) and unexpectedly, antibiotic
treatment was associated with a decrease in absolute tet(W) abundance (p=0.0004; Kruskal-
Wallis). Relative abundance of tet(W) decreased rapidly with time in composted manure samples
(p<0.0001; Kruskal-Wallis) but did not decrease in stockpiled manure samples (p=0.1496;
Kruskal-Wallis) (Figure 3.33). Relative tet(W) abundance also decreased to a greater extent when
cattle had previously been administered antibiotics (p=0.0011; Kruskal-Wallis).
Figure 3.30. Effect of treatment type on abundance of sul1 genes with time. There was a
significant difference between composted and stockpiled treatments (p<0.0001; Kruskal-Wallis).
There was no significant impact of antibiotic treatment on sul1 abundance in composted manures
(p=0.0809; Kruskal-Wallis). Time had a significant impact (p=0.0002; Kruskal-Wallis).
Time (Days)
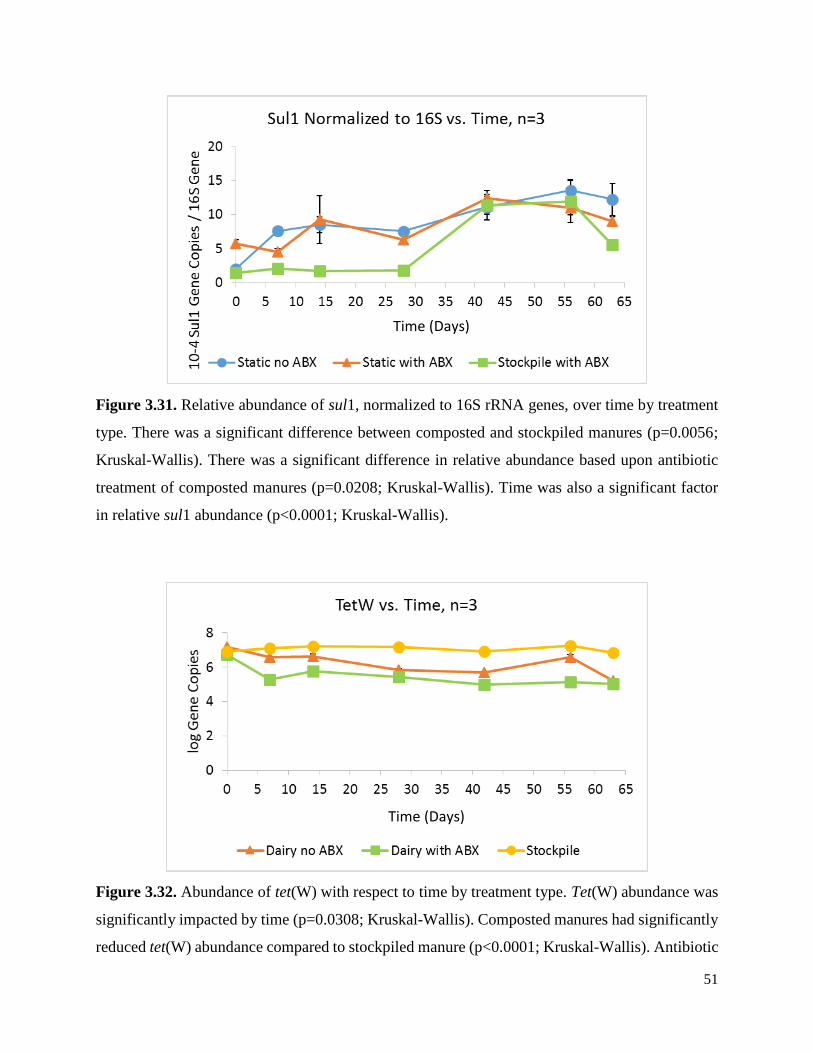
51
Figure 3.31. Relative abundance of sul1, normalized to 16S rRNA genes, over time by treatment
type. There was a significant difference between composted and stockpiled manures (p=0.0056;
Kruskal-Wallis). There was a significant difference in relative abundance based upon antibiotic
treatment of composted manures (p=0.0208; Kruskal-Wallis). Time was also a significant factor
in relative sul1 abundance (p<0.0001; Kruskal-Wallis).
Figure 3.32. Abundance of tet(W) with respect to time by treatment type. Tet(W) abundance was
significantly impacted by time (p=0.0308; Kruskal-Wallis). Composted manures had significantly
reduced tet(W) abundance compared to stockpiled manure (p<0.0001; Kruskal-Wallis). Antibiotic
Time (Days)
Time (Days)
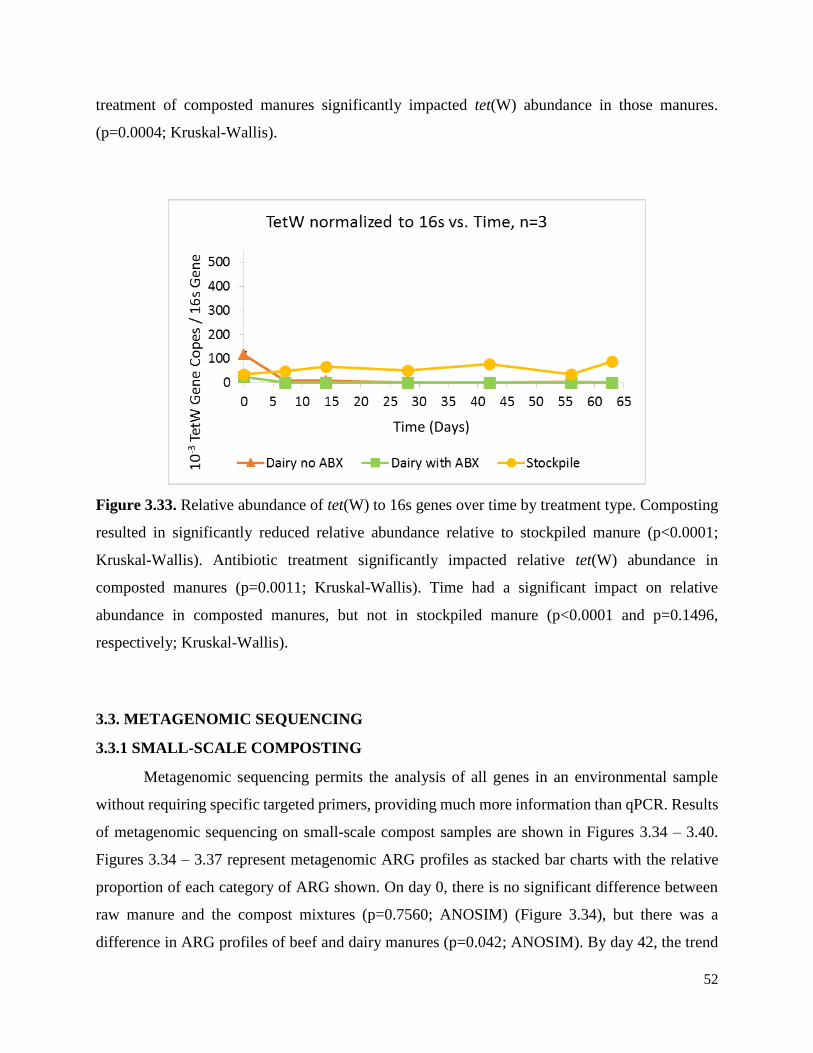
52
treatment of composted manures significantly impacted tet(W) abundance in those manures.
(p=0.0004; Kruskal-Wallis).
Figure 3.33. Relative abundance of tet(W) to 16s genes over time by treatment type. Composting
resulted in significantly reduced relative abundance relative to stockpiled manure (p<0.0001;
Kruskal-Wallis). Antibiotic treatment significantly impacted relative tet(W) abundance in
composted manures (p=0.0011; Kruskal-Wallis). Time had a significant impact on relative
abundance in composted manures, but not in stockpiled manure (p<0.0001 and p=0.1496,
respectively; Kruskal-Wallis).
3.3. METAGENOMIC SEQUENCING
3.3.1 SMALL-SCALE COMPOSTING
Metagenomic sequencing permits the analysis of all genes in an environmental sample
without requiring specific targeted primers, providing much more information than qPCR. Results
of metagenomic sequencing on small-scale compost samples are shown in Figures 3.34 – 3.40.
Figures 3.34 – 3.37 represent metagenomic ARG profiles as stacked bar charts with the relative
proportion of each category of ARG shown. On day 0, there is no significant difference between
raw manure and the compost mixtures (p=0.7560; ANOSIM) (Figure 3.34), but there was a
difference in ARG profiles of beef and dairy manures (p=0.042; ANOSIM). By day 42, the trend
Time (Days)
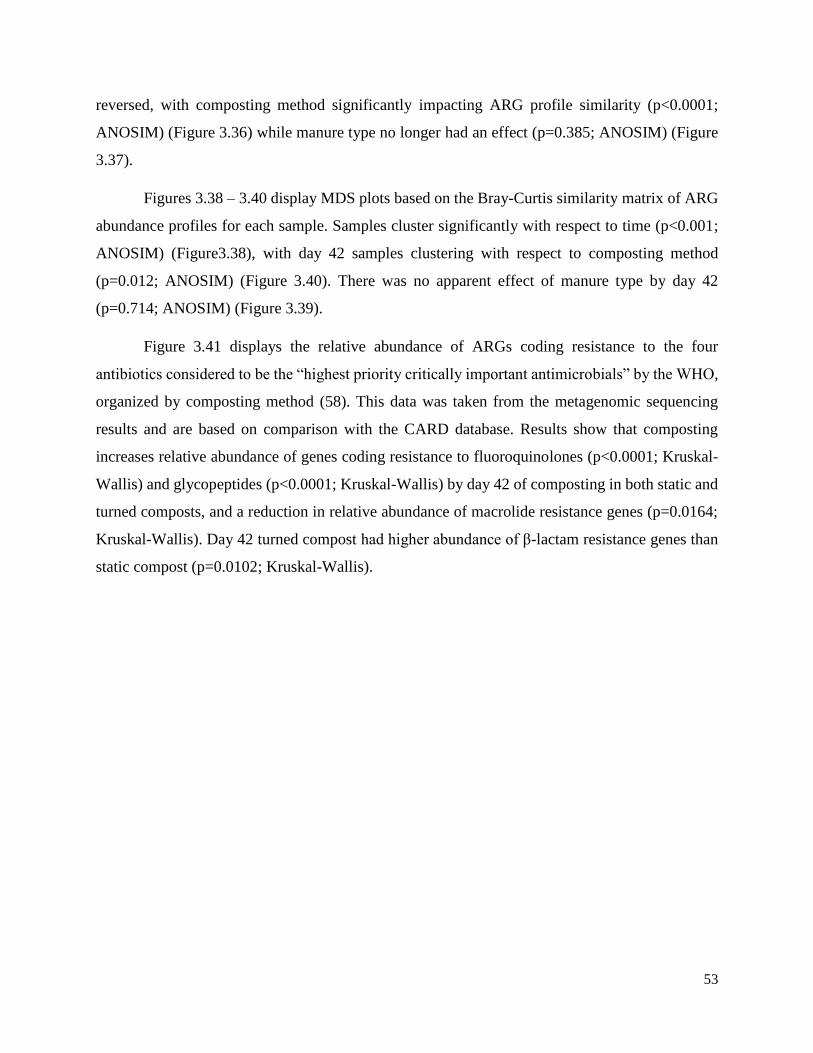
53
reversed, with composting method significantly impacting ARG profile similarity (p<0.0001;
ANOSIM) (Figure 3.36) while manure type no longer had an effect (p=0.385; ANOSIM) (Figure
3.37).
Figures 3.38 – 3.40 display MDS plots based on the Bray-Curtis similarity matrix of ARG
abundance profiles for each sample. Samples cluster significantly with respect to time (p<0.001;
ANOSIM) (Figure3.38), with day 42 samples clustering with respect to composting method
(p=0.012; ANOSIM) (Figure 3.40). There was no apparent effect of manure type by day 42
(p=0.714; ANOSIM) (Figure 3.39).
Figure 3.41 displays the relative abundance of ARGs coding resistance to the four
antibiotics considered to be the “highest priority critically important antimicrobials” by the WHO,
organized by composting method (58). This data was taken from the metagenomic sequencing
results and are based on comparison with the CARD database. Results show that composting
increases relative abundance of genes coding resistance to fluoroquinolones (p<0.0001; Kruskal-
Wallis) and glycopeptides (p<0.0001; Kruskal-Wallis) by day 42 of composting in both static and
turned composts, and a reduction in relative abundance of macrolide resistance genes (p=0.0164;
Kruskal-Wallis). Day 42 turned compost had higher abundance of β-lactam resistance genes than
static compost (p=0.0102; Kruskal-Wallis).

54
Figure 3.34. Comparison of total resistance gene category abundance by composting method on
day 0. Based on metagenomic sequencing and comparison with the CARD database. There is no
significant effect of composting method (p=0.7560; ANOSIM).
Figure 3.35. Comparison of total resistance gene category abundance by composting method on
day 42. Based on metagenomic sequencing and comparison with the CARD database. There is a
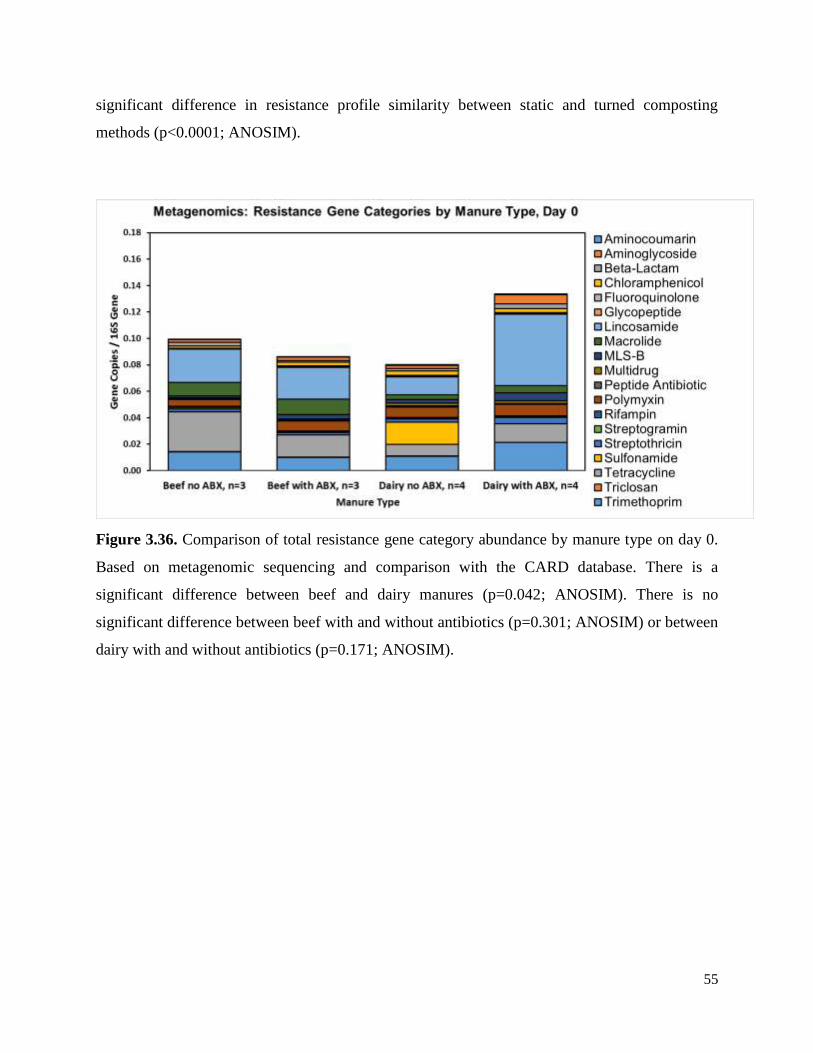
55
significant difference in resistance profile similarity between static and turned composting
methods (p<0.0001; ANOSIM).
Figure 3.36. Comparison of total resistance gene category abundance by manure type on day 0.
Based on metagenomic sequencing and comparison with the CARD database. There is a
significant difference between beef and dairy manures (p=0.042; ANOSIM). There is no
significant difference between beef with and without antibiotics (p=0.301; ANOSIM) or between
dairy with and without antibiotics (p=0.171; ANOSIM).
56
Figure 3.37. Comparison of resistance gene category abundance by manure type on day 42. Based
on metagenomic sequencing and comparison with the CARD database. Despite the increase in
trimethoprim resistance in antibiotic treated dairy manure composts, there is no significant
difference between resistance gene category profiles based upon manure type (p=0.385;
ANOSIM). There is no significant difference between dairy and beef (p=0.125; ANOSIM),
between dairy with and without antibiotics (p=0.714; ANOSIM), or between beef with and without
antibiotics (p=0.136; ANOSIM).
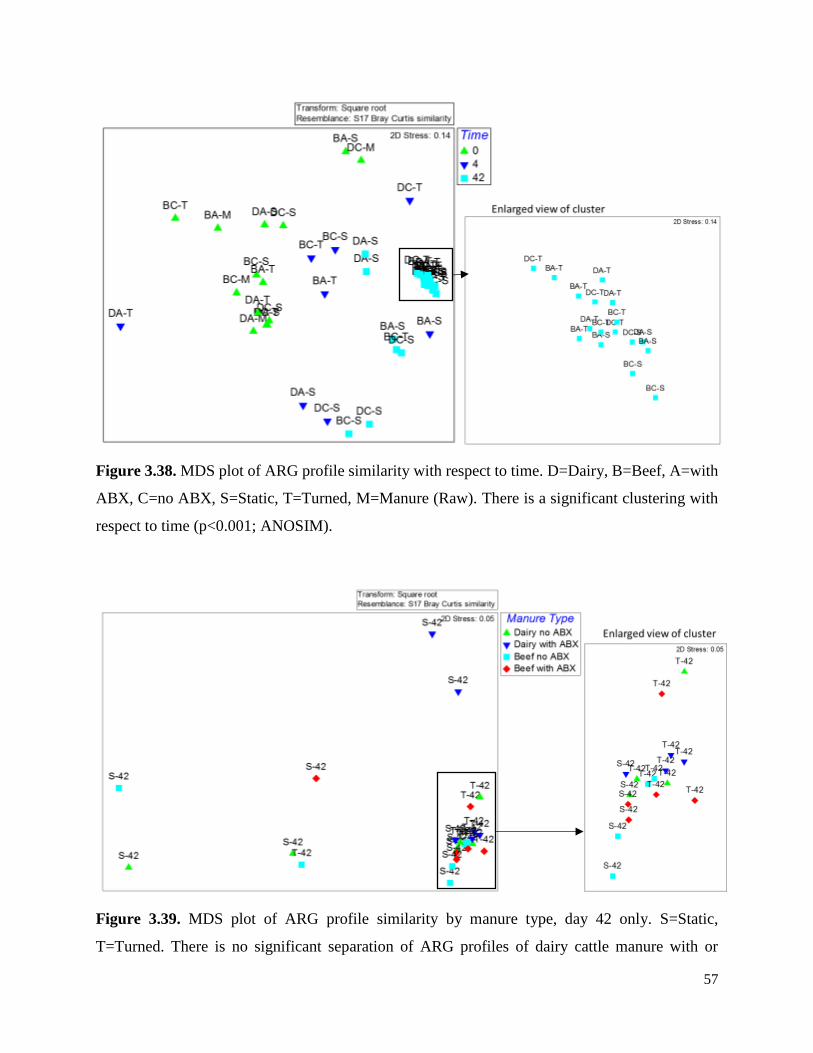
57
Figure 3.38. MDS plot of ARG profile similarity with respect to time. D=Dairy, B=Beef, A=with
ABX, C=no ABX, S=Static, T=Turned, M=Manure (Raw). There is a significant clustering with
respect to time (p<0.001; ANOSIM).
Figure 3.39. MDS plot of ARG profile similarity by manure type, day 42 only. S=Static,
T=Turned. There is no significant separation of ARG profiles of dairy cattle manure with or
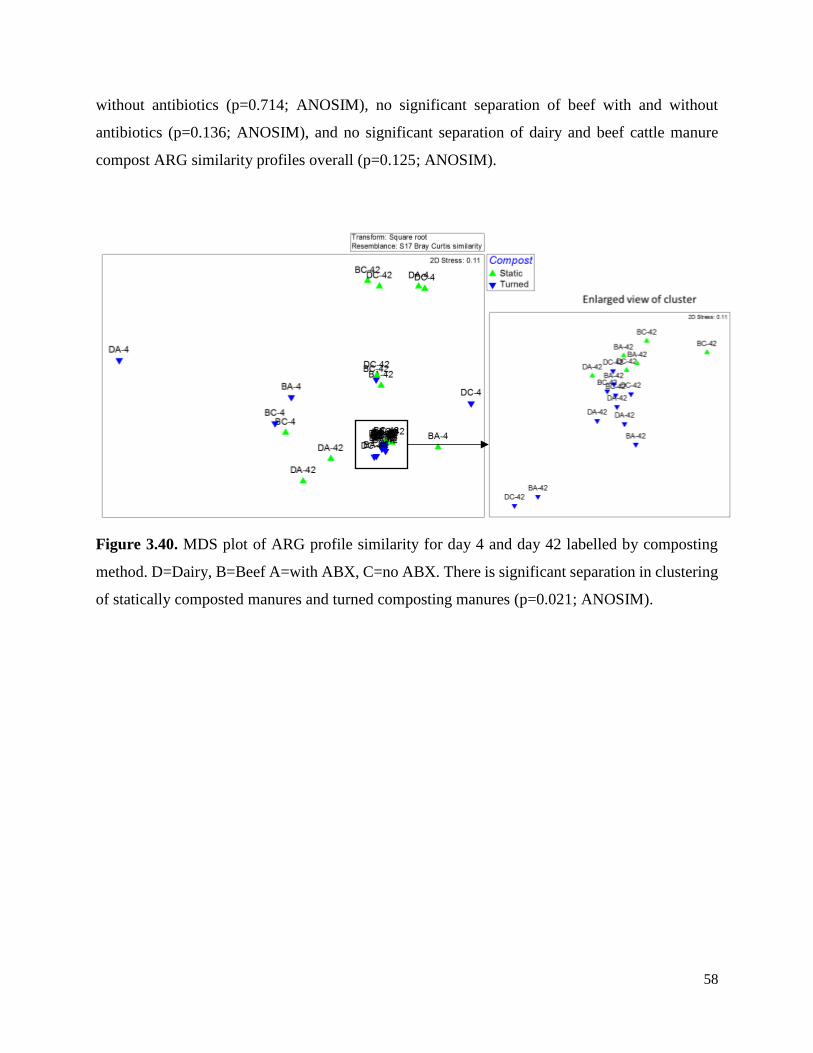
58
without antibiotics (p=0.714; ANOSIM), no significant separation of beef with and without
antibiotics (p=0.136; ANOSIM), and no significant separation of dairy and beef cattle manure
compost ARG similarity profiles overall (p=0.125; ANOSIM).
Figure 3.40. MDS plot of ARG profile similarity for day 4 and day 42 labelled by composting
method. D=Dairy, B=Beef A=with ABX, C=no ABX. There is significant separation in clustering
of statically composted manures and turned composting manures (p=0.021; ANOSIM).
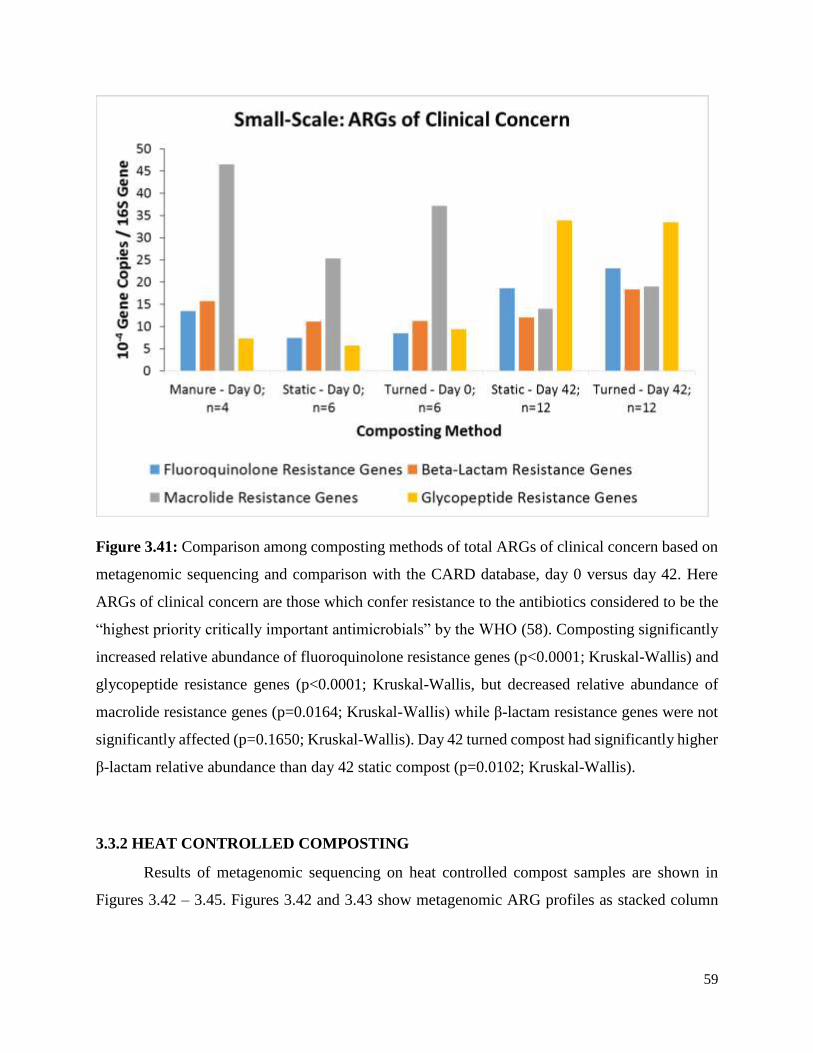
59
Figure 3.41: Comparison among composting methods of total ARGs of clinical concern based on
metagenomic sequencing and comparison with the CARD database, day 0 versus day 42. Here
ARGs of clinical concern are those which confer resistance to the antibiotics considered to be the
“highest priority critically important antimicrobials” by the WHO (58). Composting significantly
increased relative abundance of fluoroquinolone resistance genes (p<0.0001; Kruskal-Wallis) and
glycopeptide resistance genes (p<0.0001; Kruskal-Wallis, but decreased relative abundance of
macrolide resistance genes (p=0.0164; Kruskal-Wallis) while β-lactam resistance genes were not
significantly affected (p=0.1650; Kruskal-Wallis). Day 42 turned compost had significantly higher
β-lactam relative abundance than day 42 static compost (p=0.0102; Kruskal-Wallis).
3.3.2 HEAT CONTROLLED COMPOSTING
Results of metagenomic sequencing on heat controlled compost samples are shown in
Figures 3.42 – 3.45. Figures 3.42 and 3.43 show metagenomic ARG profiles as stacked column
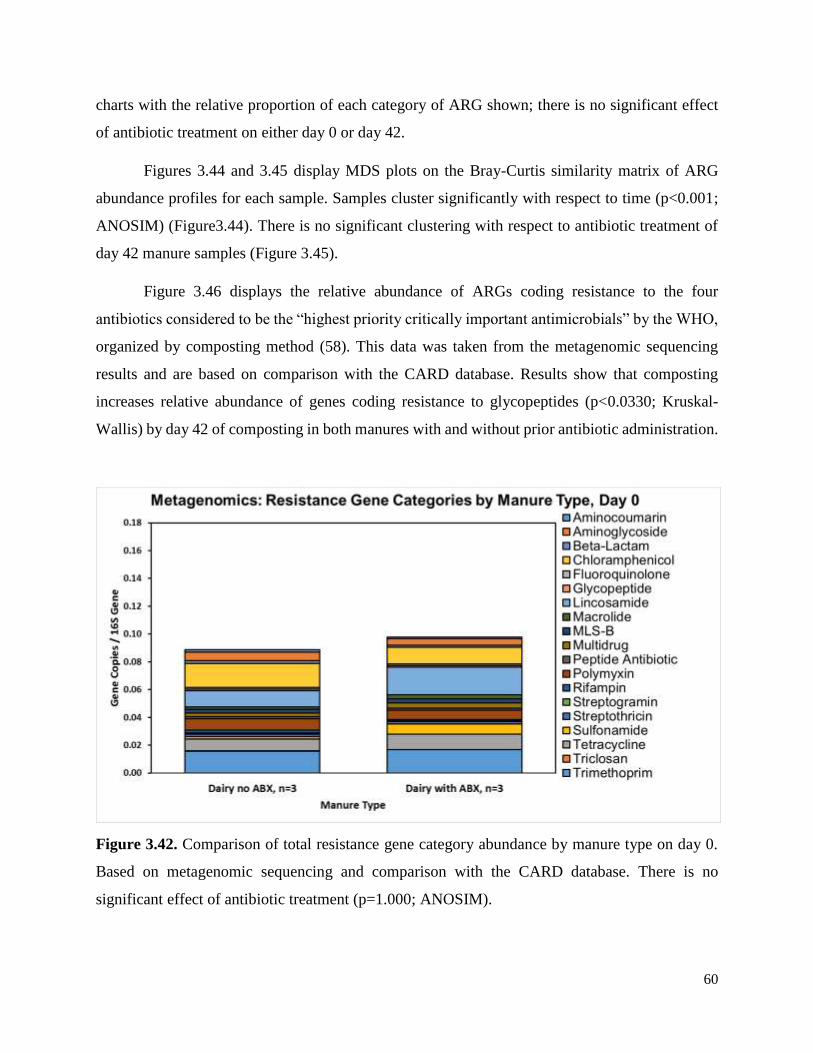
60
charts with the relative proportion of each category of ARG shown; there is no significant effect
of antibiotic treatment on either day 0 or day 42.
Figures 3.44 and 3.45 display MDS plots on the Bray-Curtis similarity matrix of ARG
abundance profiles for each sample. Samples cluster significantly with respect to time (p<0.001;
ANOSIM) (Figure3.44). There is no significant clustering with respect to antibiotic treatment of
day 42 manure samples (Figure 3.45).
Figure 3.46 displays the relative abundance of ARGs coding resistance to the four
antibiotics considered to be the “highest priority critically important antimicrobials” by the WHO,
organized by composting method (58). This data was taken from the metagenomic sequencing
results and are based on comparison with the CARD database. Results show that composting
increases relative abundance of genes coding resistance to glycopeptides (p<0.0330; Kruskal-
Wallis) by day 42 of composting in both manures with and without prior antibiotic administration.
Figure 3.42. Comparison of total resistance gene category abundance by manure type on day 0.
Based on metagenomic sequencing and comparison with the CARD database. There is no
significant effect of antibiotic treatment (p=1.000; ANOSIM).
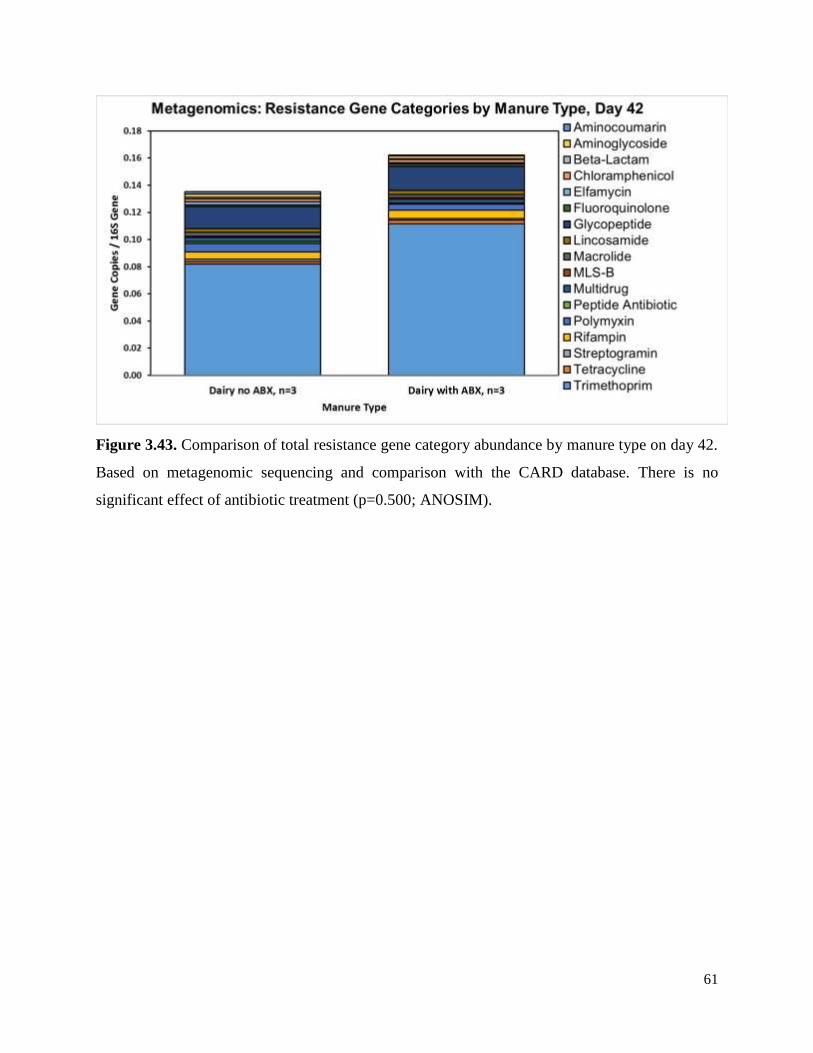
61
Figure 3.43. Comparison of total resistance gene category abundance by manure type on day 42.
Based on metagenomic sequencing and comparison with the CARD database. There is no
significant effect of antibiotic treatment (p=0.500; ANOSIM).

62
Figure 3.44. MDS plot comparing ARG profile similarity by time. D=Dairy, A=with ABX, C=no
ABX, S= Static, M=Manure (Raw). There is significant separation of profile clusters with respect
to time (p<0.001; ANOSIM).
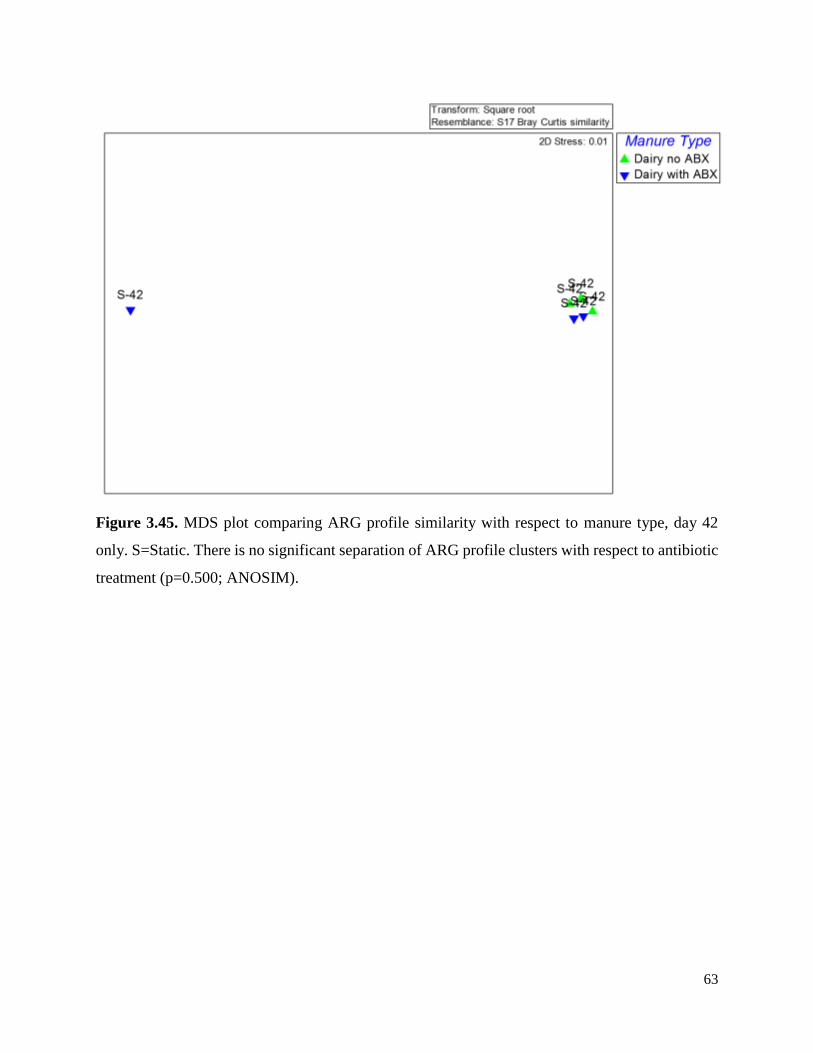
63
Figure 3.45. MDS plot comparing ARG profile similarity with respect to manure type, day 42
only. S=Static. There is no significant separation of ARG profile clusters with respect to antibiotic
treatment (p=0.500; ANOSIM).
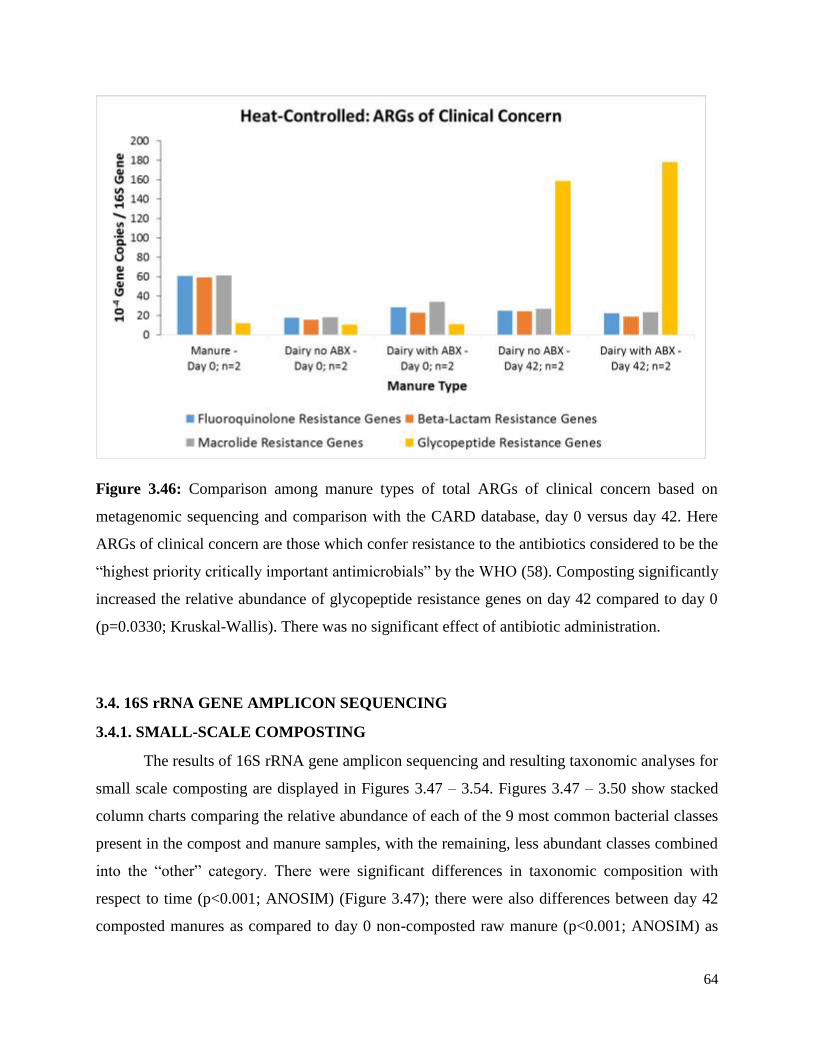
64
Figure 3.46: Comparison among manure types of total ARGs of clinical concern based on
metagenomic sequencing and comparison with the CARD database, day 0 versus day 42. Here
ARGs of clinical concern are those which confer resistance to the antibiotics considered to be the
“highest priority critically important antimicrobials” by the WHO (58). Composting significantly
increased the relative abundance of glycopeptide resistance genes on day 42 compared to day 0
(p=0.0330; Kruskal-Wallis). There was no significant effect of antibiotic administration.
3.4. 16S rRNA GENE AMPLICON SEQUENCING
3.4.1. SMALL-SCALE COMPOSTING
The results of 16S rRNA gene amplicon sequencing and resulting taxonomic analyses for
small scale composting are displayed in Figures 3.47 – 3.54. Figures 3.47 – 3.50 show stacked
column charts comparing the relative abundance of each of the 9 most common bacterial classes
present in the compost and manure samples, with the remaining, less abundant classes combined
into the “other” category. There were significant differences in taxonomic composition with
respect to time (p<0.001; ANOSIM) (Figure 3.47); there were also differences between day 42
composted manures as compared to day 0 non-composted raw manure (p<0.001; ANOSIM) as
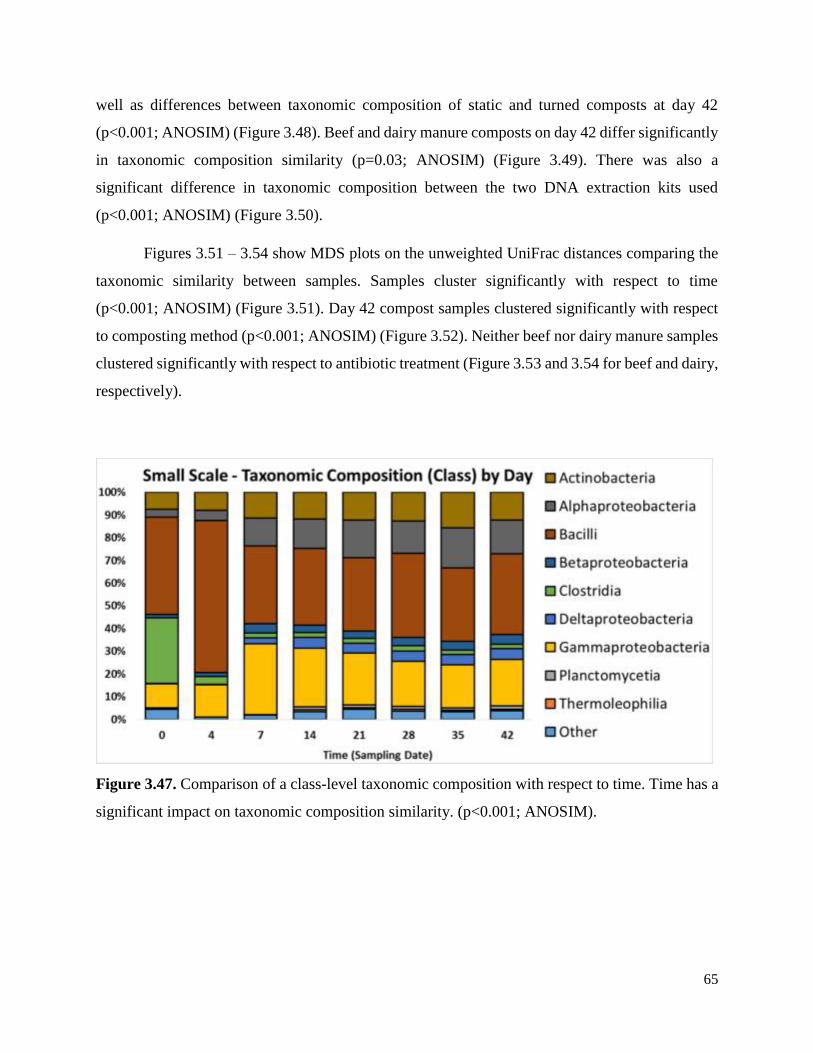
65
well as differences between taxonomic composition of static and turned composts at day 42
(p<0.001; ANOSIM) (Figure 3.48). Beef and dairy manure composts on day 42 differ significantly
in taxonomic composition similarity (p=0.03; ANOSIM) (Figure 3.49). There was also a
significant difference in taxonomic composition between the two DNA extraction kits used
(p<0.001; ANOSIM) (Figure 3.50).
Figures 3.51 – 3.54 show MDS plots on the unweighted UniFrac distances comparing the
taxonomic similarity between samples. Samples cluster significantly with respect to time
(p<0.001; ANOSIM) (Figure 3.51). Day 42 compost samples clustered significantly with respect
to composting method (p<0.001; ANOSIM) (Figure 3.52). Neither beef nor dairy manure samples
clustered significantly with respect to antibiotic treatment (Figure 3.53 and 3.54 for beef and dairy,
respectively).
Figure 3.47. Comparison of a class-level taxonomic composition with respect to time. Time has a
significant impact on taxonomic composition similarity. (p<0.001; ANOSIM).
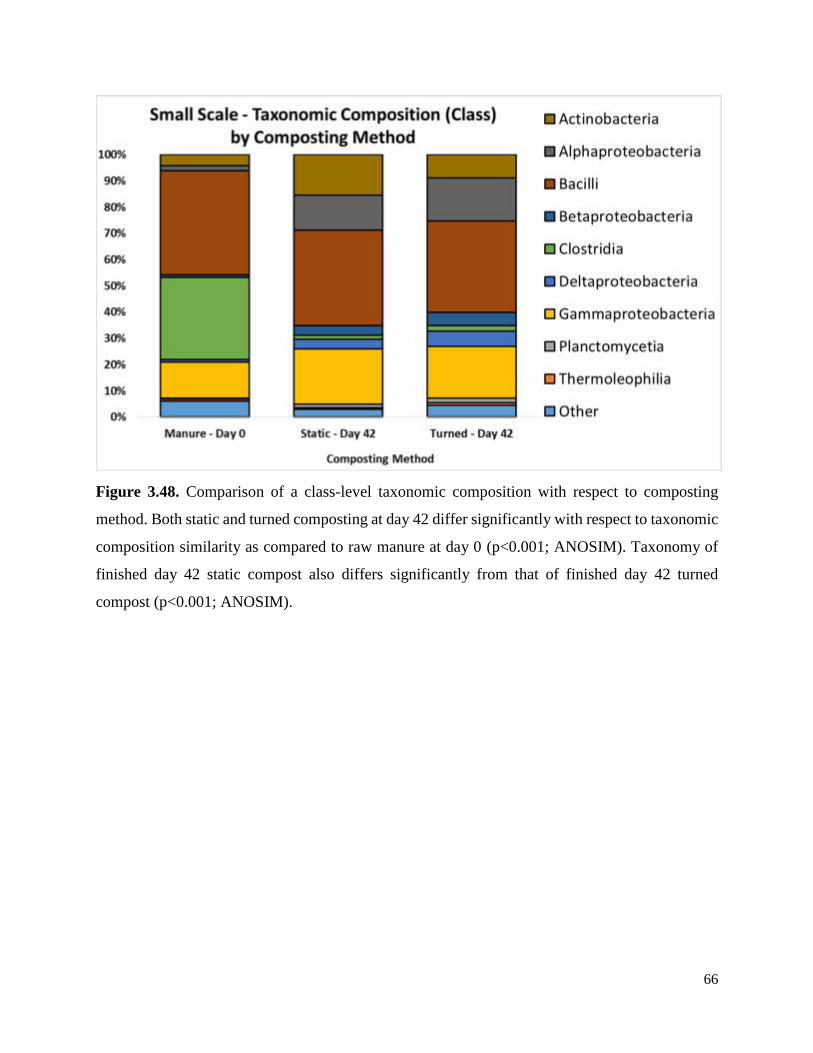
66
Figure 3.48. Comparison of a class-level taxonomic composition with respect to composting
method. Both static and turned composting at day 42 differ significantly with respect to taxonomic
composition similarity as compared to raw manure at day 0 (p<0.001; ANOSIM). Taxonomy of
finished day 42 static compost also differs significantly from that of finished day 42 turned
compost (p<0.001; ANOSIM).

67
Figure 3.49. Comparison of a class-level taxonomic composition with respect to manure type.
There is a significant difference in taxonomic composition similarity between beef and dairy
manure composts (p=0.03; ANOSIM) but no difference between beef with or without antibiotic
treatment (p=0.513; ANOSIM) or between dairy with or without antibiotic treatment (p=0.221;
ANOSIM).
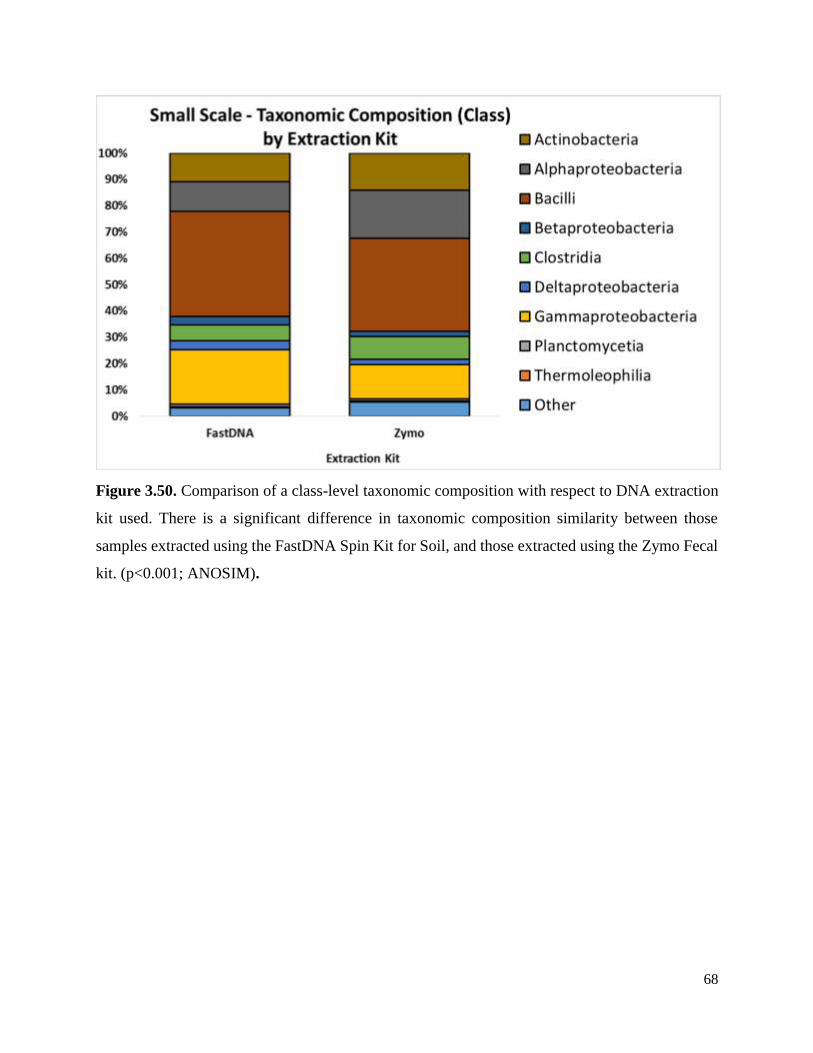
68
Figure 3.50. Comparison of a class-level taxonomic composition with respect to DNA extraction
kit used. There is a significant difference in taxonomic composition similarity between those
samples extracted using the FastDNA Spin Kit for Soil, and those extracted using the Zymo Fecal
kit. (p<0.001; ANOSIM).
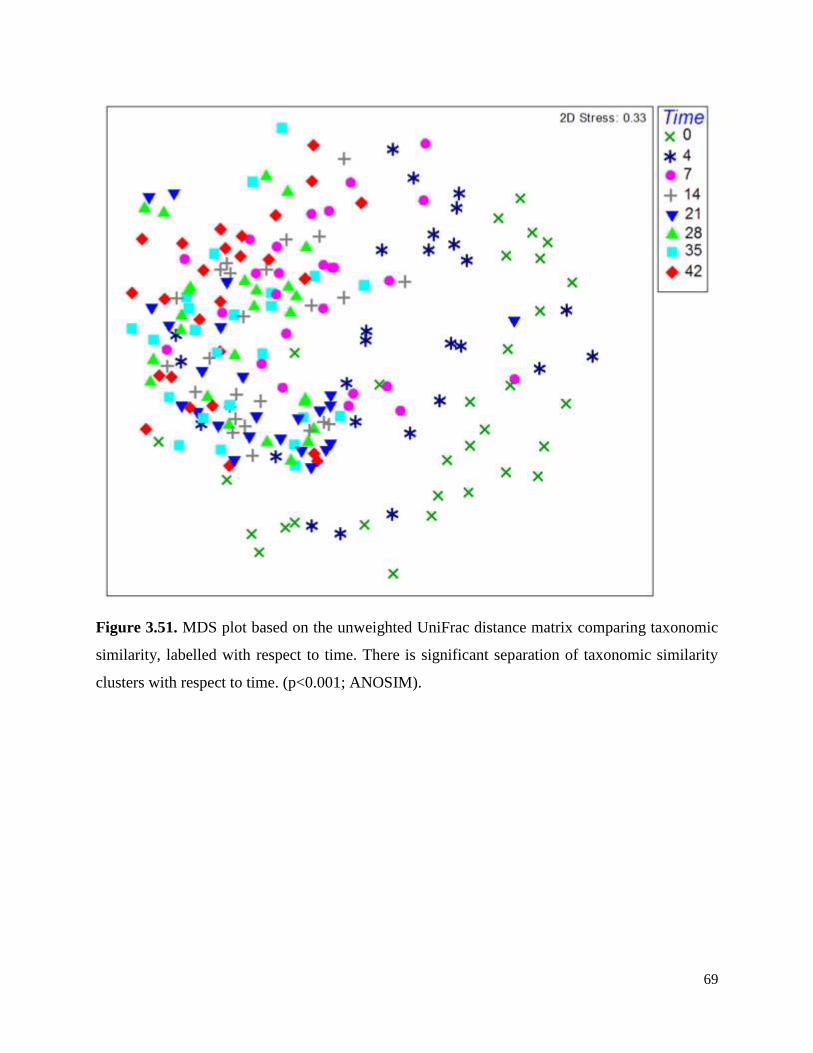
69
Figure 3.51. MDS plot based on the unweighted UniFrac distance matrix comparing taxonomic
similarity, labelled with respect to time. There is significant separation of taxonomic similarity
clusters with respect to time. (p<0.001; ANOSIM).
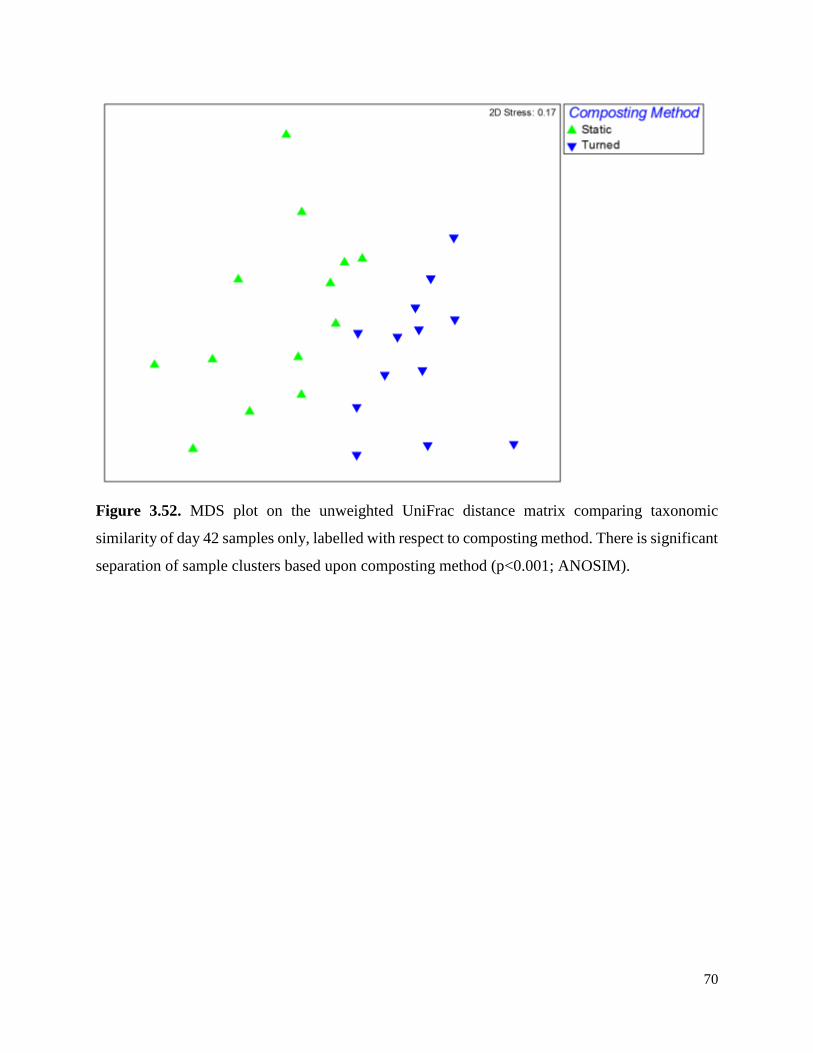
70
Figure 3.52. MDS plot on the unweighted UniFrac distance matrix comparing taxonomic
similarity of day 42 samples only, labelled with respect to composting method. There is significant
separation of sample clusters based upon composting method (p<0.001; ANOSIM).
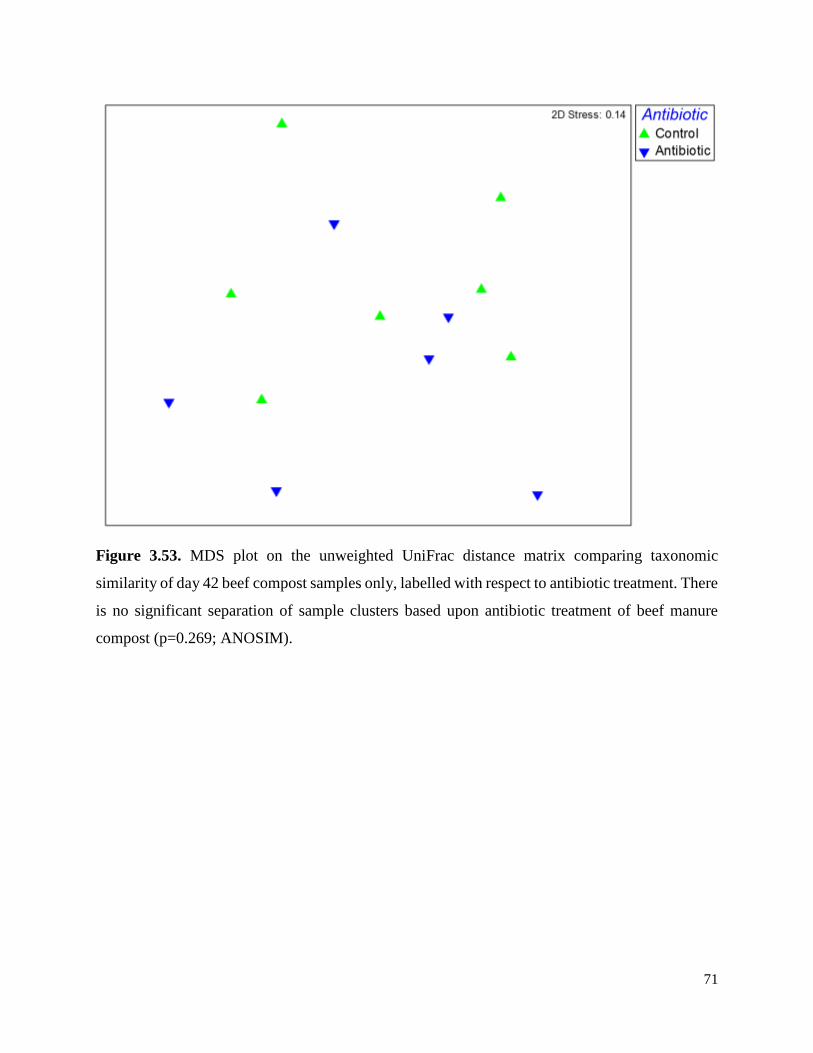
71
Figure 3.53. MDS plot on the unweighted UniFrac distance matrix comparing taxonomic
similarity of day 42 beef compost samples only, labelled with respect to antibiotic treatment. There
is no significant separation of sample clusters based upon antibiotic treatment of beef manure
compost (p=0.269; ANOSIM).
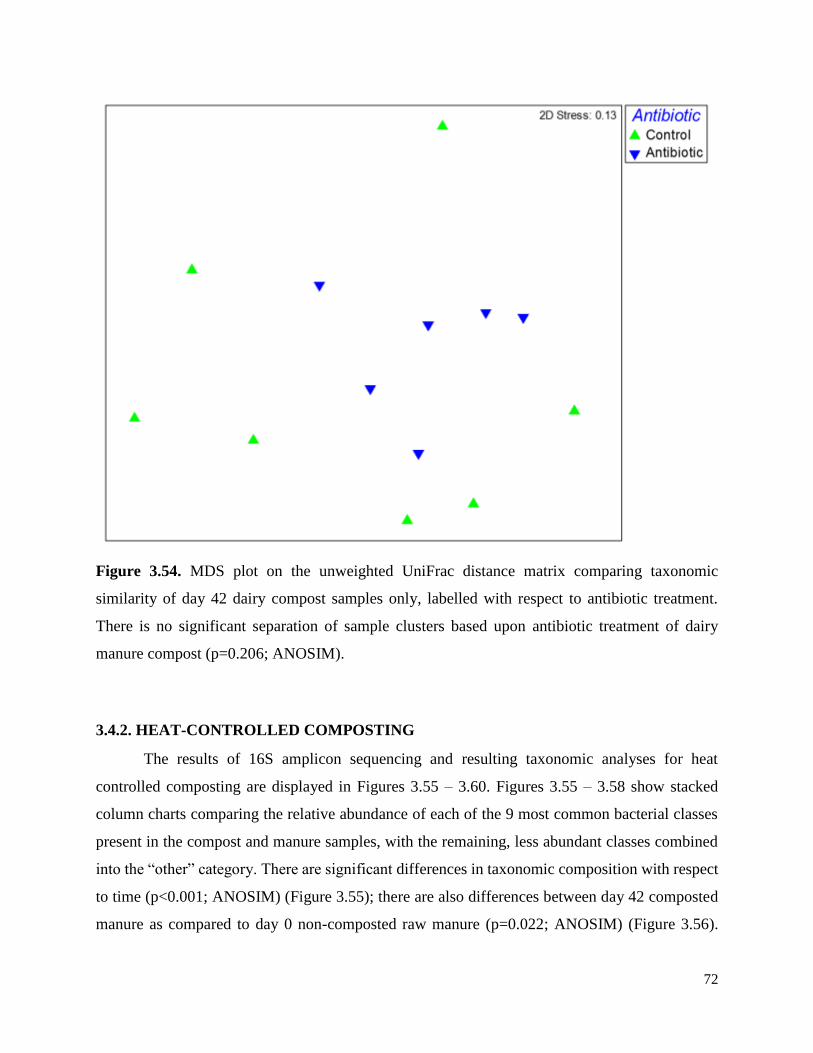
72
Figure 3.54. MDS plot on the unweighted UniFrac distance matrix comparing taxonomic
similarity of day 42 dairy compost samples only, labelled with respect to antibiotic treatment.
There is no significant separation of sample clusters based upon antibiotic treatment of dairy
manure compost (p=0.206; ANOSIM).
3.4.2. HEAT-CONTROLLED COMPOSTING
The results of 16S amplicon sequencing and resulting taxonomic analyses for heat
controlled composting are displayed in Figures 3.55 – 3.60. Figures 3.55 – 3.58 show stacked
column charts comparing the relative abundance of each of the 9 most common bacterial classes
present in the compost and manure samples, with the remaining, less abundant classes combined
into the “other” category. There are significant differences in taxonomic composition with respect
to time (p<0.001; ANOSIM) (Figure 3.55); there are also differences between day 42 composted
manure as compared to day 0 non-composted raw manure (p=0.022; ANOSIM) (Figure 3.56).

73
There is no significant impact of antibiotic treatment on taxonomic composition similarity
(p=0.413; ANOSIM) (Figure 3.57). There was however a significant difference in taxonomic
composition between the two DNA extraction kits used for all treatments (p<0.001; ANOSIM)
(Figure 3.58).
Figures 3.59 and 3.60 show MDS plots on the unweighted UniFrac distances comparing
the taxonomic similarity between samples. Samples cluster significantly with respect to time
(p<0.001; ANOSIM) (Figure 3.59). Day 42 compost samples did not cluster significantly with
respect to antibiotic treatment (Figure 3.60).
Figure 3.55. Comparison of a class-level taxonomic composition with respect to time. Time has a
significant impact on taxonomic composition similarity. (p<0.001; ANOSIM).
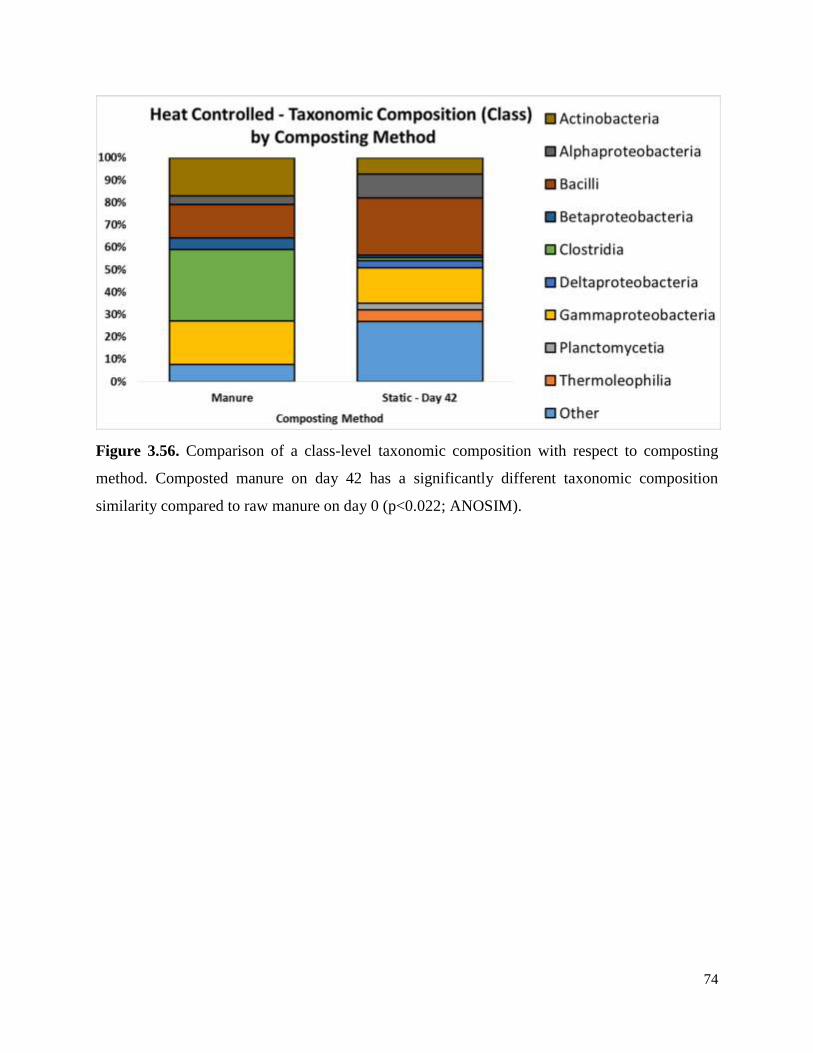
74
Figure 3.56. Comparison of a class-level taxonomic composition with respect to composting
method. Composted manure on day 42 has a significantly different taxonomic composition
similarity compared to raw manure on day 0 (p<0.022; ANOSIM).
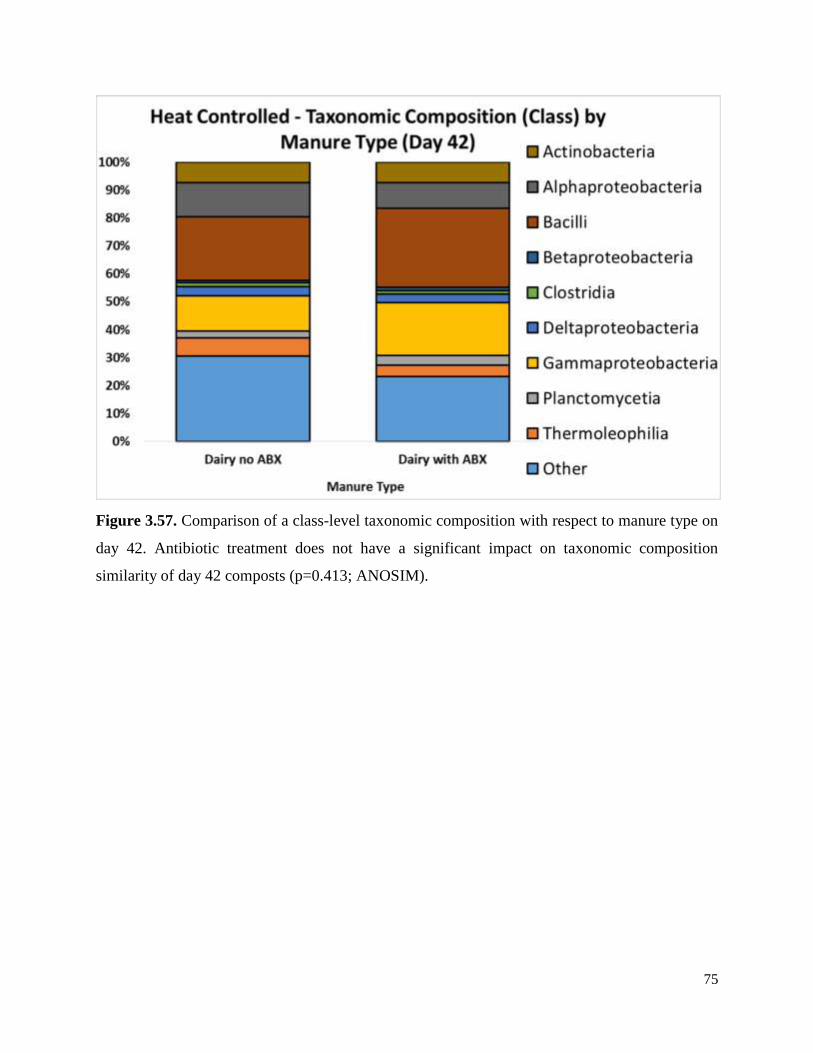
75
Figure 3.57. Comparison of a class-level taxonomic composition with respect to manure type on
day 42. Antibiotic treatment does not have a significant impact on taxonomic composition
similarity of day 42 composts (p=0.413; ANOSIM).
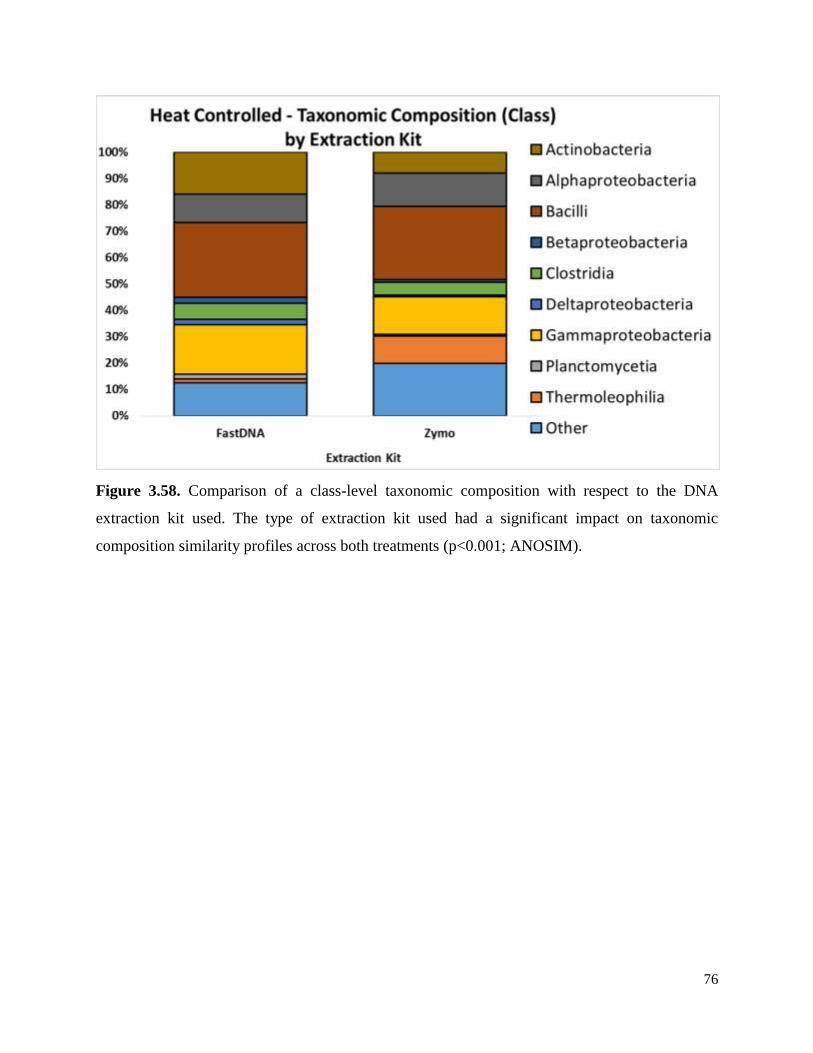
76
Figure 3.58. Comparison of a class-level taxonomic composition with respect to the DNA
extraction kit used. The type of extraction kit used had a significant impact on taxonomic
composition similarity profiles across both treatments (p<0.001; ANOSIM).
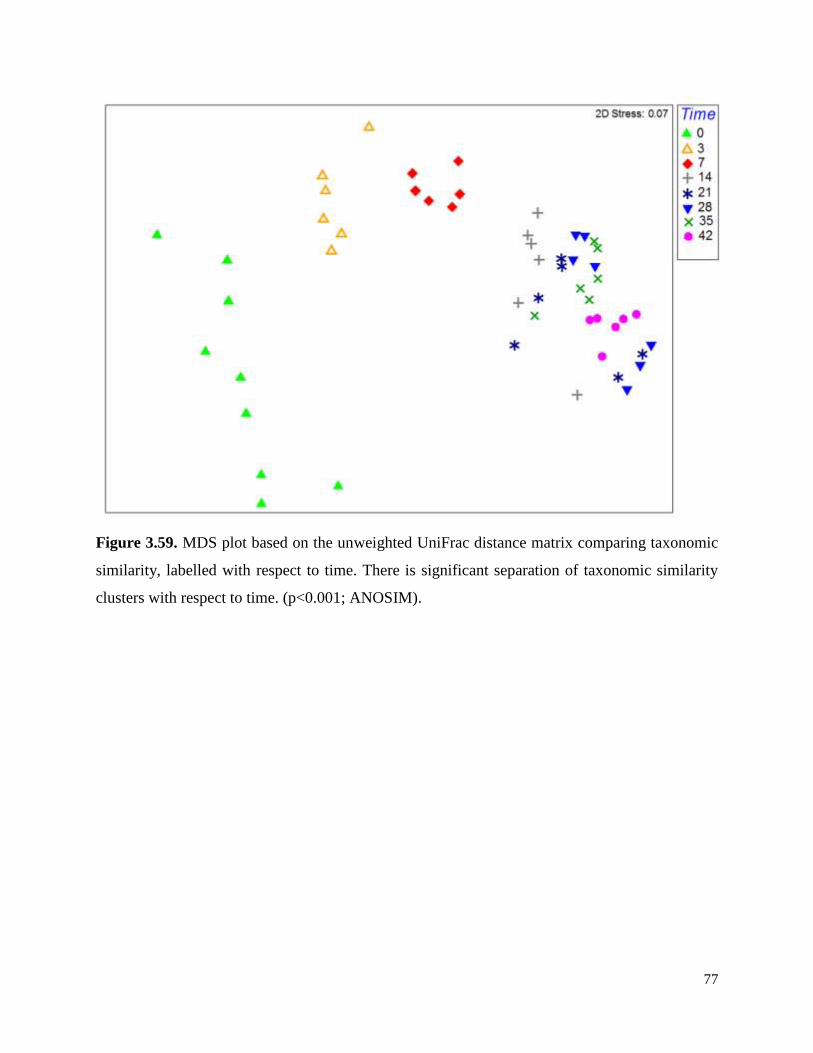
77
Figure 3.59. MDS plot based on the unweighted UniFrac distance matrix comparing taxonomic
similarity, labelled with respect to time. There is significant separation of taxonomic similarity
clusters with respect to time. (p<0.001; ANOSIM).
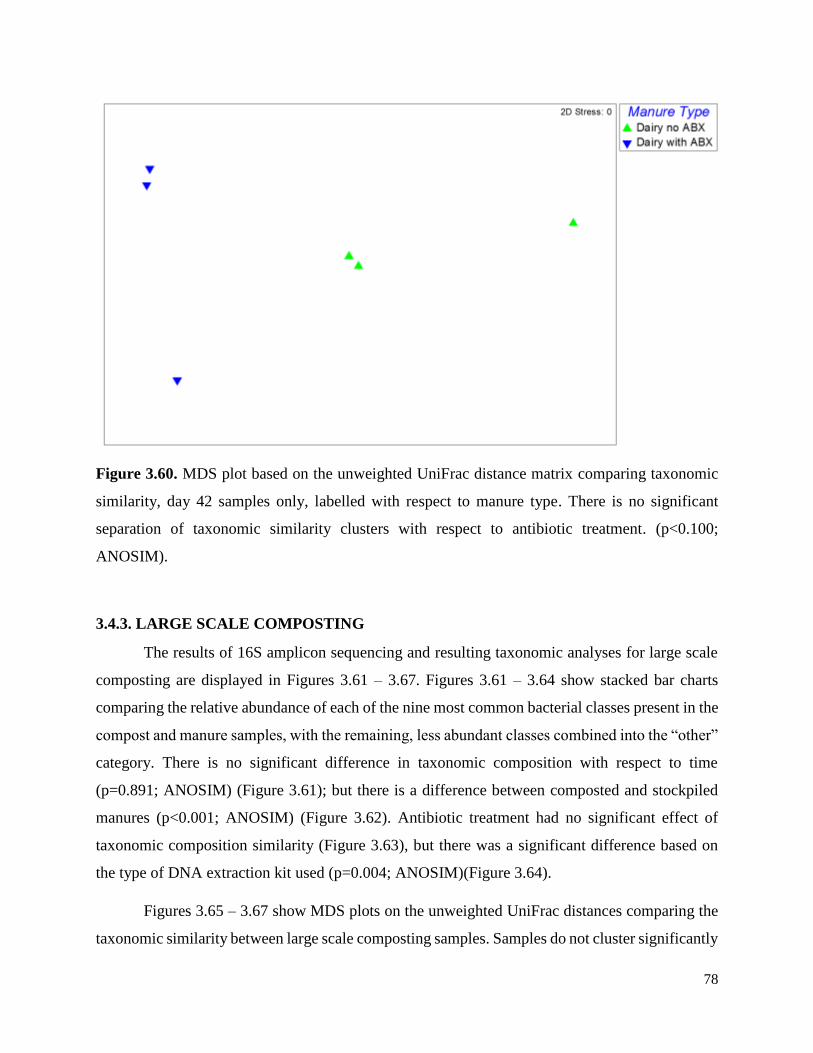
78
Figure 3.60. MDS plot based on the unweighted UniFrac distance matrix comparing taxonomic
similarity, day 42 samples only, labelled with respect to manure type. There is no significant
separation of taxonomic similarity clusters with respect to antibiotic treatment. (p<0.100;
ANOSIM).
3.4.3. LARGE SCALE COMPOSTING
The results of 16S amplicon sequencing and resulting taxonomic analyses for large scale
composting are displayed in Figures 3.61 – 3.67. Figures 3.61 – 3.64 show stacked bar charts
comparing the relative abundance of each of the nine most common bacterial classes present in the
compost and manure samples, with the remaining, less abundant classes combined into the “other”
category. There is no significant difference in taxonomic composition with respect to time
(p=0.891; ANOSIM) (Figure 3.61); but there is a difference between composted and stockpiled
manures (p<0.001; ANOSIM) (Figure 3.62). Antibiotic treatment had no significant effect of
taxonomic composition similarity (Figure 3.63), but there was a significant difference based on
the type of DNA extraction kit used (p=0.004; ANOSIM)(Figure 3.64).
Figures 3.65 – 3.67 show MDS plots on the unweighted UniFrac distances comparing the
taxonomic similarity between large scale composting samples. Samples do not cluster significantly
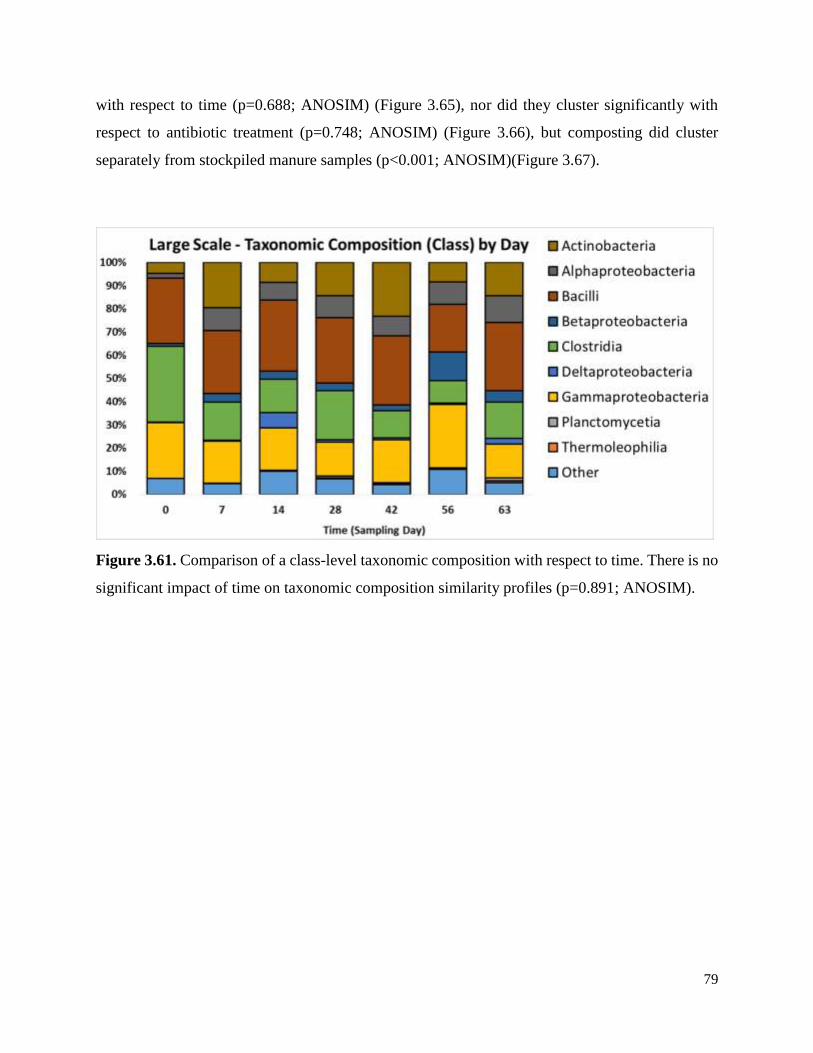
79
with respect to time (p=0.688; ANOSIM) (Figure 3.65), nor did they cluster significantly with
respect to antibiotic treatment (p=0.748; ANOSIM) (Figure 3.66), but composting did cluster
separately from stockpiled manure samples (p<0.001; ANOSIM)(Figure 3.67).
Figure 3.61. Comparison of a class-level taxonomic composition with respect to time. There is no
significant impact of time on taxonomic composition similarity profiles (p=0.891; ANOSIM).
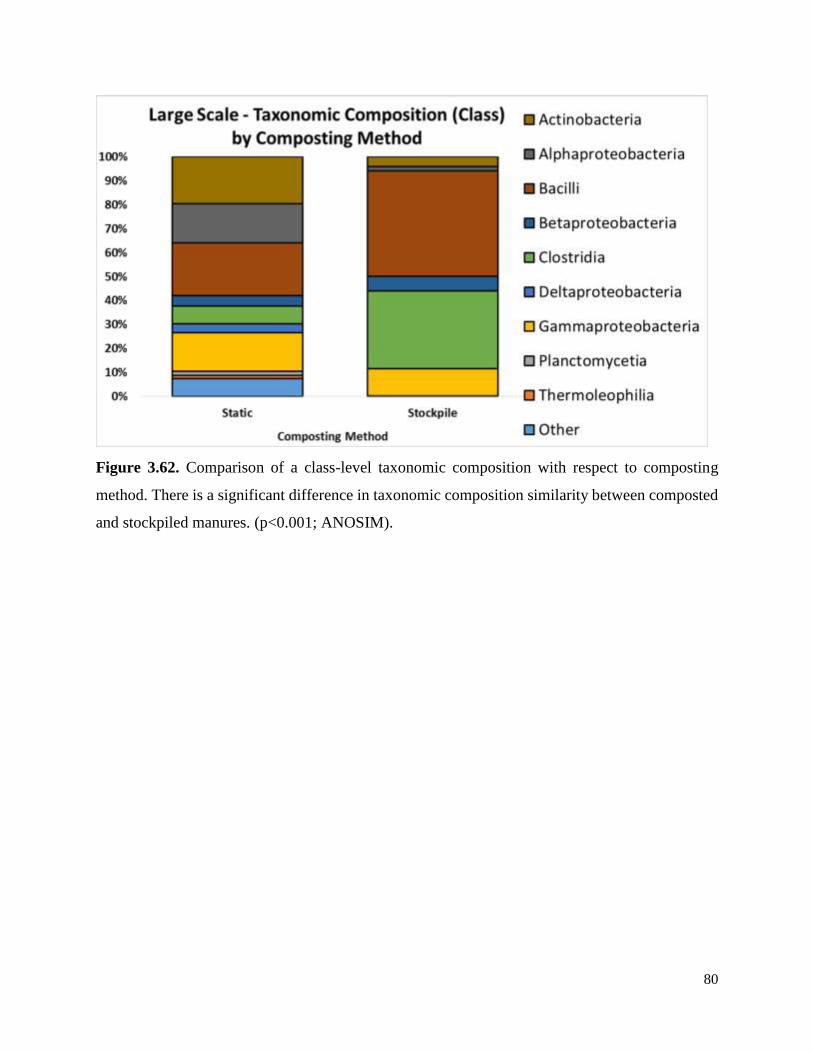
80
Figure 3.62. Comparison of a class-level taxonomic composition with respect to composting
method. There is a significant difference in taxonomic composition similarity between composted
and stockpiled manures. (p<0.001; ANOSIM).
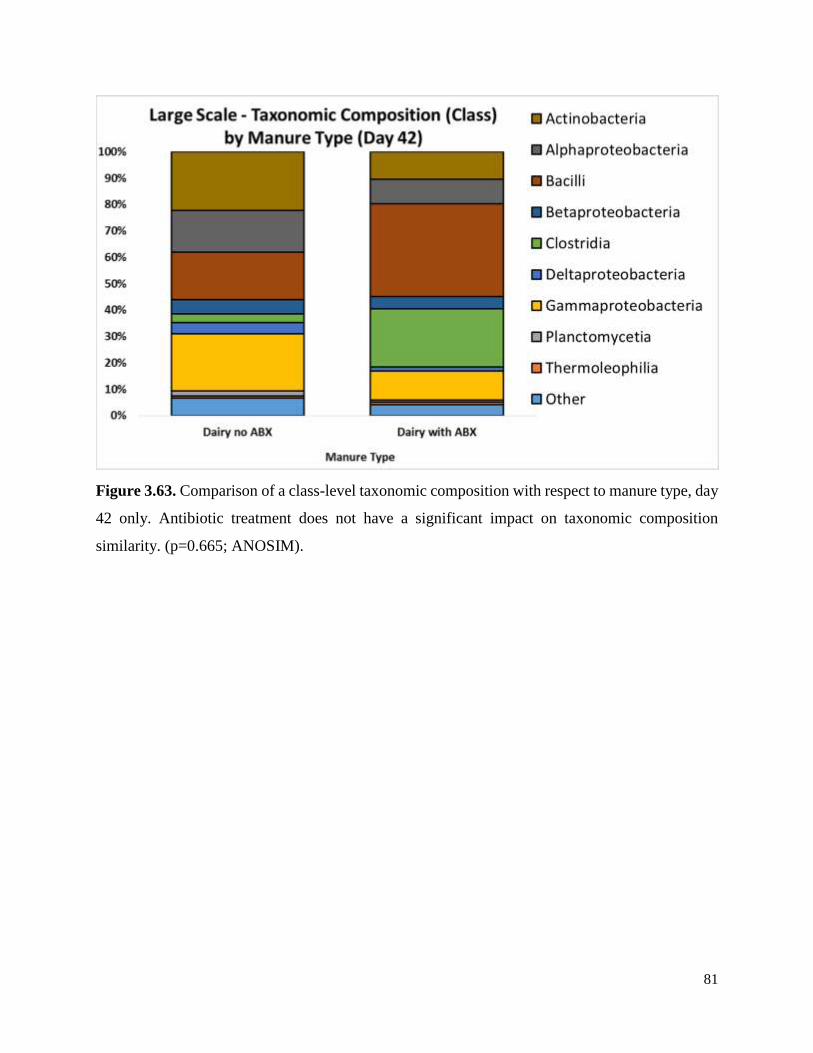
81
Figure 3.63. Comparison of a class-level taxonomic composition with respect to manure type, day
42 only. Antibiotic treatment does not have a significant impact on taxonomic composition
similarity. (p=0.665; ANOSIM).

82
Figure 3.64. Comparison of a class-level taxonomic composition with respect to the DNA
extraction kit used. The type of extraction kit used has a significant impact on taxonomic
composition similarity. (p=0.004; ANOSIM). The Zymo Fecal kit resulted in a lower relative
abundance of the classes actinobacteria, alphaproteobacteria, and clostridia, while having
increased relative abundances of the many less abundant classes which are combined into the
“other” classes category.

83
Figure 3.65. MDS plot based on the unweighted UniFrac distance matrix comparing taxonomic
similarity, labelled with respect to time. There is no significant separation of taxonomic similarity
clusters with respect to time. (p=0.688; ANOSIM).

84
Figure 3.66. MDS plot based on the unweighted UniFrac distance matrix comparing taxonomic
similarity, labelled with respect to manure type. There is no significant separation of taxonomic
similarity clusters with respect to antibiotic treatment. (p<0.748; ANOSIM).
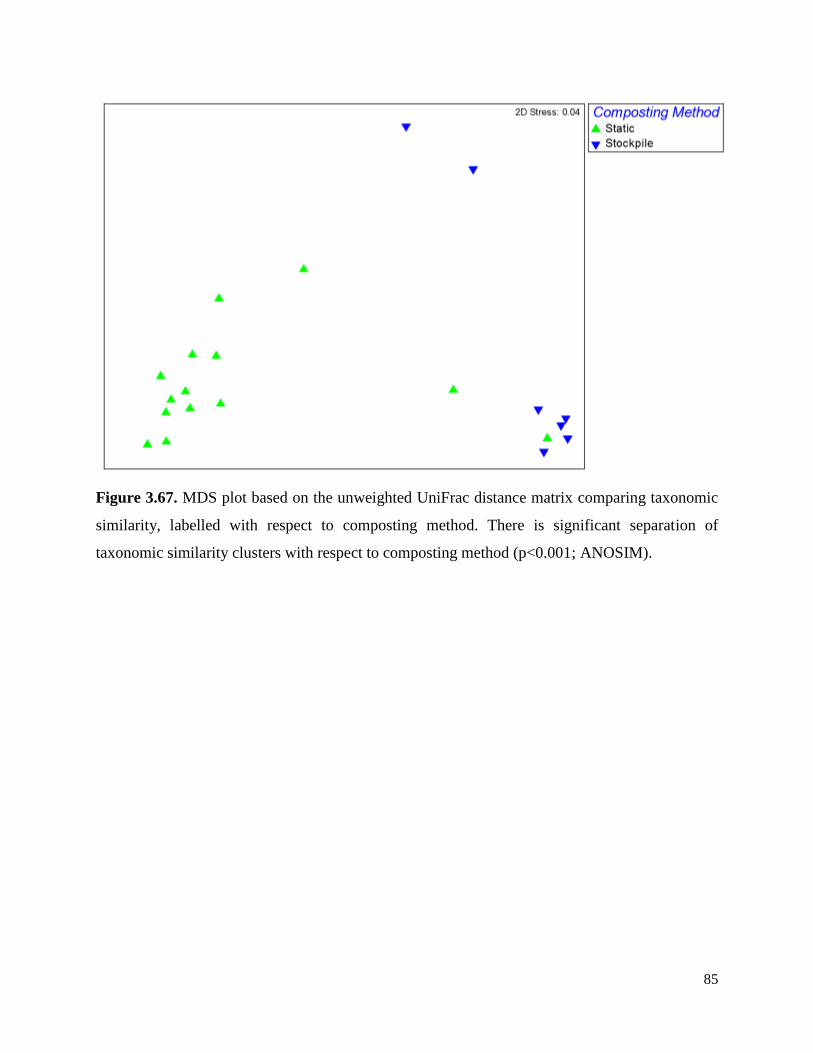
85
Figure 3.67. MDS plot based on the unweighted UniFrac distance matrix comparing taxonomic
similarity, labelled with respect to composting method. There is significant separation of
taxonomic similarity clusters with respect to composting method (p<0.001; ANOSIM).
86
4. EFFECT OF COMPOSTING ON THE PREVALENCE
OF ARBs AND ARGs IN CATTLE MANURE:
DISCUSSION AND CONCLUSIONS
Antibiotic resistance presents a growing human health risk and agriculture plays a
significant potential role as a reservoir and source of ARB and ARG dissemination. This study
examined the effect of several parameters on the abundance of ARBs and ARGs in cattle manure
and cattle manure composts. The following sections summarize the overall findings of this study
with respect to the study objectives.
4.1. EFFECT OF COMPOSTING METHOD
Composting has been explored as a potential method of reducing abundance of antibiotic
resistance, however the results of this study show that the potential outcomes are complex. On the
one hand, it seems that composting can increase phenotypic resistance in bacteria when they
survive composting. Despite following FSMA guidelines for composting, E. coli was not
eliminated during initial small-scale composting. The FSMA guidelines for temperature were
maintained for small-scale static composting, but not for small-scale turned composting. Despite
this discrepancy, neither treatment resulted in reducing fecal coliform counts below the FSMA
target of 1000 MPN/g as indicated by the high IDEXX E. coli counts of 9 log MPN/g. The resulting
isolates collected on day 42 and tested for resistance using the Kirby Bauer disk diffusion method
showed an increase in the number of isolates testing as resistant to 3 of 6 antibiotics when
composted as compared to raw manures on day 0 (Figure 3.7). The mean number of antibiotics
that each isolate tested as resistant to increased from 0.10 resistances per isolate for raw manure to
2.55 and 2.10 resistances per isolate for static and turned composting, respectively. Similarly,
relative resistance to ceftazidime, cefotaxime, and tetracycline antibiotics increased by an average
of 0.5 antibiotic plate CFU per control plate CFU in composted manures on day 3 of the heat-
controlled composting trial (Figures 3.11 – 3.13). Yet when target bacteria are successfully
eradicated during the composting process then composting could result in a decrease in ARBs, as
it did by day 7 of the heat-controlled composting trial when fecal coliforms fell below the detection
limit of plating methods (Figures 3.11 – 3.15). It could be that resistant bacteria are more fit for
87
surviving high composting temperatures than non-resistant bacteria of the same species resulting
in a higher relative proportion of resistant bacteria.
QPCR data suggests that the effect of composting on specific ARGs depends on the gene
of interest. In general, absolute sul1 abundance increased by 2 logs during composting while
relative abundance increased by a factor of 5 from day 0 to day 42 (Figures 3.18, 3.20, 3.27, and
3.31) while tet(W) absolute abundance decreased by 1 to 2 logs during composting and relative
abundance rapidly approached zero (Figures 3.22, 3.24, 3.28, 3.29, and 3.33). These results agree
with the findings of Selvam et al. with respect to reduction of tet(W) during 42 days of composting,
although a complete reduction to below detection levels was not observed as it was in that study
(18). However, results contradict those of Selvam et al. with respect to sul1 and those of
Storteboom et al. with respect to tet(W) (18,55). The small-scale metagenomic data suggests that
the total abundance of ARGs decreases throughout composting by (Figures 3.34 and 3.35), while
the heat controlled trial shows a decrease in the abundance of most classes of ARGs, but a
significant increase in trimethoprim resistance genes which increases ARG abundance overall
(Figures 3.42 and 3.43). These metagenomic results contradict the high-throughput qPCR results
of Su et al. which showed an overall increase in ARG abundance and diversity (19). This
discrepancy is possibly due to the difference in the bacterial community composition of municipal
sewage sludge as compared to that of animal manure.
There was no difference between static and turned composting methods on fecal coliform
counts (Figure 3.3) or on resistant Kirby Bauer isolates (Figure 3.7). However, there were
differences in the total ARG profiles based on metagenomics profiling (Figures 3.35 and 3.40) and
in clustering based upon taxonomic similarity (Figures 3.48 and 3.52).
On the whole, there is evidence that composting attenuates most ARGs, but select ARGs
may behave in radically different ways. ARBs can either be enriched or eliminated depending on
the bacteria of interest and the ability of the compost to maintain adequate time at thermophilic
temperatures. Because of the evidence that it can greatly reduce the abundance of most ARGs,
composting is definitely promising as a tool for preventing the spread of antibiotic resistance.
However, due to the fact that some of the ARGs that increase during composting confer resistance
to antibiotics that are critically important for human medicine, and because composting must be
carried out correctly in order to eliminate pathogens and achieve the desired results, it is not
88
recommended that composting be promoted for the purpose of attenuating ARGs until further
study can be done. It is worth noting that composting in accordance with FSMA guidelines can be
challenging to perform and it may be difficult for the average farmer to meet these standards in
practice. As far as composting method, metagenomic results indicate that turned composting better
reduces total ARG abundance than does static composting, even when the required time and
temperature guidelines are not met. For this reason turned composting may be the preferred
method, though a follow up study evaluating the effects of turned composting when the time and
temperature guidelines are met is needed.
Interestingly, the effect of composting was varied with respect to the four classes of ARGs
of clinical concern analyzed from the metagenomic sequencing data. In the small-scale trial,
composting increased the relative abundance of genes coding for resistance to fluoroquinolones,
and glycopeptides, but reduced the relative abundance of genes coding for macrolide resistance
(Figure 3.41). In the heat-controlled trial, the only statistically significant effect was a sharp
increase in glycopeptide resistance gene relative abundance (Figure 3.46).
4.2. EFFECT OF ANTIBIOTIC TREATMENT OF CATTLE
Widespread antibiotic usage in cattle and other livestock is one reason why antibiotic
resistance in agriculture is such a major concern. This study assessed the impact of administration
of antibiotics to cattle on the resulting patterns of resistance in manure and manure composts.
Antibiotic treatment of cattle increased phenotypic bacterial resistance to certain antibiotics such
as relative tetracycline, erythromycin, and clindamycin resistances measured in the heat controlled
composting experiment (Figures 3.13, 3.14, and 3.15), but had no effect on any of the resistances
to antibiotics measured during the Kirby Bauer testing of small scale composting isolates (Figure
3.8), or on resistance to either cephalosporin antibiotic measured during the heat controlled trial
(Figures 3.11 and 3.12), which is interesting because these dairy cattle had been administered
cephapirin, yet this did not enrich resistance to cephalosporins.
There was no significant effect of antibiotic treatment on most sul1 qPCR abundances
(Figures 3.19, 3.26, 3.27, and 3.30) or on any of the metagenomic ARG similarity profiles or any
of the taxonomic composition profile similarities of samples. This suggests that antibiotic
administration is not a major driver of community composition or ARG profiles overall. In
89
contrast, antibiotic administration did selectively enrich for increased tetracycline resistance in
both heat controlled and large scale composting trials (Figures 3.28, 3.29, 3.31, and 3.32). Since
tetracyclines were not administered to the dairy cattle in either of these trials it is especially
interesting that tet(W) abundance is positively correlated with antibiotic treatment. These results
suggest that antibiotic administration does have a significant impact on phenotypic resistance to
certain antibiotics but that this is not as important a driver of resistance as is the composting process
itself.
4.3. EFFECT OF DAIRY OR BEEF CATTLE
There are differences between the types of antibiotics administered to dairy and beef cattle
and their diets also vary, which results in gut microbiomes which have adapted to different
conditions and may therefore be significantly different. This study examined the difference in
ARG and ARB abundance between beef and cattle manure after composting. For the most part,
few significant differences were observed between the two cattle types. Those that were observed
were greater sul1 abundance on day 0 of small scale composting in dairy manures as compared
with beef manures (Figure 3.23), greater absolute and relative tet(W) abundance in beef manure
on day 0 as compared with dairy manure (Figures 3.23 and 3.25), and differences in metagenomic
ARG profile similarity between the two cattle types on day 0 (Figure 3.36). In all of these cases
the difference is only an initial one which vanishes after composting as the composts made from
the two cattle manure types become more similar. This suggests that the difference in dairy and
beef manure is not a significant factor in altering the resistance profiles of finished composts. In
practice, composting of dairy manure is more common than beef because dairy cows are typically
confined to smaller areas, allowing for easier manure collection.
4.4. EFFECT OF DNA EXTRACTION KIT
All extraction kits use varied protocols that are optimized for different purposes. This study
compared the taxonomic composition of DNA extracted using two different kits, the FastDNA
Spin Kit for Soil by MP Biomedicals, and the Zymo Fecal kit. In all three trials, there was a
significant difference in the similarity of taxonomic composition between DNA extracted from the
two kits (Figures 3.50, 3.58, and 3.64). On the whole, the Zymo fecal kit resulted in a lower
90
relative abundance of the classes actinobacteria, alphaproteobacteria, and clostridia, while having
increased relative abundances of the many less abundant classes which are combined into the
“other” classes category. This may indicate that the Zymo kit is less able to fully extract DNA
from these more abundant classes and that the less abundant species therefore make up a larger
proportion of the classes that remain.
4.5 SUMMARY AND CONCLUSIONS
The results of this experiment show many complex interactions among bacteria and
antibiotics throughout the composting process. Because of these complexities, composting may
either increase or decrease phenotypic or genetic resistance to any specific antibiotic, but on the
whole the metagenomics data suggests that composting helps to attenuate total ARG abundance
more so than increase it. Still, further research should be conducted to allow for better
understanding. High priority research questions include: 1) examining the spatial variation in ARB
and ARG abundance at various locations within a large composting heap and 2) exploring different
time and temperature combinations to optimize ARG attenuation and especially focus on reduction
of ARGs of clinical importance. Antibiotic administration has an effect only on select ARGs,
increasing their abundance, but has no effect on most. There is no significant impact on the choice
of beef or dairy manure on the final ARG profiles of finished compost. Different DNA extraction
kits may be better at extracting DNA from some species and not others.
91
REFERENCES
1. CDC. Antibiotic resistance threats in the United States, 2013. Current. 2013;114.
2. Tan R, Liu J, Li M, Huang J, Sun J, Qu H. Epidemiology and antimicrobial resistance
among commonly encountered bacteria associated with infections and colonization in
intensive care units in a university- affiliated hospital in Shanghai. 2014;
3. Allen H, Donato J. Call of the wild: antibiotic resistance genes in natural environments.
Nat Rev …. 2010;8(4):251–9.
4. Perry JA, Westman EL, Wright GD, Degroote AMG. The antibiotic resistome: what’s
new? Curr Opin Microbiol. 2014;21:45–50.
5. Schwarz S, Chaslus-Dancla E. Use of antimicrobials in veterinary medicine and
mechanisms of resistance. Vet Res. 2001;32:201–25.
6. Pruden A, Pei R, Storteboom H, Carlson KH. Antibiotic Resistance Genes as Emerging
Contaminants: Studies in Northern Colorado. Environ Sci Technol. 2006;40(23):7445–50.
7. US Food and Drug Administration. Guidance for Industry #213 New Animal Drugs and
New Animal Drug Combination Products Administered in or on Medicated Feed or
Drinking Water of Food- Producing Animals: Recommendations for Drug Sponsors for
Voluntarily Aligning Product Use Conditions with . Fed Regist. 2013;(December 2013).
8. US Food and Drug Administration. Antimicrobials Sold or Distributed for Use in Food-
Producing Animals. 2011;
9. Teuber M. Veterinary use and Antibiotic Resistance. Curr Opin Microbiol. 2001;4:493–9.
10. Sarmah AK, Meyer MT, Boxall ABA. A global perspective on the use, sales, exposure
pathways, occurrence, fate and effects of veterinary antibiotics (VAs) in the environment.
2006;
11. Gullberg E, Cao S, Berg OG, Ilbä Ck C, Sandegren L, Hughes D, et al. Selection of
Resistant Bacteria at Very Low Antibiotic Concentrations. PLoS Pathog. 2011;7(7).
12. Mcewen SA, Fedorka PJ. Antimicrobial Use and Resistance in Animals. Clin Infect Dis.
2002;34:93–106.
13. Marti R, Scott A, Tien Y-C, Murray R, Sabourin L, Zhang Y, et al. Impact of Manure
Fertilization on the Abundance of Antibiotic- Resistant Bacteria and Frequency of
Detection of Antibiotic Resistance Genes in Soil and on Vegetables at Harvest. 2013;
14. Khachatourians GG. Agricultural use of antibiotics and the evolution and transfer of
antibiotic-resistant bacteria.
15. Youngquist CP, Mitchell SM, Cogger CG. Fate of Antibiotics and Antibiotic Resistance
during Digestion and Composting: A Review. J Environ Qual. 2016;45(2):537.
16. Service SC, Ranch GE, Henderson E, Stem D, Farm RV, Gerster W, et al.
Acknowledgments.
92
17. Wang L, Gutek A, Grewal S, Michel FC, Yu Z. Changes in diversity of cultured bacteria
resistant to erythromycin and tetracycline in swine manure during simulated composting
and lagoon storage. Lett Appl Microbiol. 2015;61(3):245–51.
18. Selvam A, Xu D, Zhao Z, Wong JWC. Fate of tetracycline, sulfonamide and
fluoroquinolone resistance genes and the changes in bacterial diversity during composting
of swine manure. 2012;
19. Su JQ, Wei B, Ou-Yang WY, Huang FY, Zhao Y, Xu HJ, et al. Antibiotic Resistome and
Its Association with Bacterial Communities during Sewage Sludge Composting. Environ
Sci Technol. 2015;49(12):7356–63.
20. Gyssens IC, M van der Meer JW, Carlet J, Collignon P, Goldmann D, Goossens H, et al.
WHO, African Partnership for Patient Safety programme, Society’s failure to protect a
precious resource: antibiotics. Lancet. 2011;378(378):369–71.
21. Abraham EP, Chain E. An Enzyme from Bacteria Able to Destroy Penicillin. Source Rev
Infect Dis. 10(4):677–8.
22. Aminov RI, Mackie RI. Evolution and ecology of antibiotic resistance genes. FEMS
Microbiol. 2007;271:147–61.
23. WHO. Antimicrobial resistance. Bull World Health Organ. 2014;61(3):383–94.
24. Society T, Epidemiology H. The Cost of Antibiotic Resistance : Effect of Resistance
Among Staphylococcus aureus , Klebsiella pneumoniae , Acinetobacter baumannii , and
Pseudomonas aeruginosa on Length of Hospital Stay Author ( s ): Brooklyn Antibiotic
Resistance Task Force Source : 2016;23(2):8–11.
25. Carlet J, Jarlier V, Harbarth S, Voss A, Goossens H, Pittet D. Ready for a world without
antibiotics? The Pensières Antibiotic Resistance Call to Action. Antimicrob Resist Infect
Control. 2012;
26. Alekshun MN, Levy SB. Molecular Mechanisms of Antibacterial Multidrug Resistance.
Cell. 2007;128.
27. Barbosa TM, Levy SB. Antibiotic use and resistance development The impact of
antibiotic use on resistance development and persistence.
28. Davies J, Davies D. Origins and Evolution of Antibiotic Resistance. Microbiol Mol Biol
Rev. 2010;74(3):417–33.
29. Zhaxybayeva O, Ford Doolittle W. Lateral gene transfer. CURBIO.
2011;21(R242):R242–6.
30. Sommer MO, Dantas G. Antibiotics and the resistant microbiome. Curr Opin Microbiol.
2011;14:556–63.
31. Van Den Bogaard AE, Stobberingh EE. Epidemiology of resistance to antibiotics: Links
between animals and humans. Int J Antimicrob Agents. 2000;
32. Summers A 0. Generally Overlooked Fundamentals of Bacterial Genetics and Ecology.
Clin Infect Dis. 2002;34(3):S85-92.

93
33. Alexander TW, Inglis GD, Yanke LJ, Topp E, Read RR, Reuter T, et al. Farm-to-fork
characterization of Escherichia coli associated with feedlot cattle with a known history of
antimicrobial use. Int J Food Microbiol. 137:40–8.
34. Sato K, Bartlett PC, Saeed MA. Antimicrobial Susceptibility of Escherichia coli Isolates
from Dairy Farms Using Organic versus Conventional Production Methods. JAVMA.
2005;226(4).
35. Bates RJ. Epidemiology of vancomycin-resistant enterococci in the ca%munity and the
relevance of farm animals to human infection. J Hosp Infect. 1997;37:89–101.
36. Bager F, Madsen M, Christensen J, Aarestrup FM. Enterococcus faecium on Danish
poultry and pig farms. Prev Vet Med. 1997;3(1):95–112.
37. Shi P, Jia S, Zhang X-X, Zhang T, Cheng S, Li A. Metagenomic insights into chlorination
effects on microbial antibiotic resistance in drinking water. Water Res. 2013;47:111–20.
38. Marti R, Scott A, Tien Y-C, Murray R, Sabourin L, Zhang Y, et al. Impact of Manure
Fertilization on the Abundance of Antibiotic- Resistant Bacteria and Frequency of
Detection of Antibiotic Resistance Genes in Soil and on Vegetables at Harvest. Appl
Environ Microbiol. 2013;79(18):5701–9.
39. Franz E, van Bruggen AH. Critical Reviews in Microbiology Ecology of E. coli O157:H7
and Salmonella enterica in the Primary Vegetable Production Chain Ecology of E. coli
O157:H7 and Salmonella enterica in the Primary Vegetable Production Chain. Crit Rev
Microbiol. 2008;34:143–61.
40. Kim J, Luo F, Jiang X. Factors Impacting the Regrowth of Escherichia coli O157:H7 in
Dairy Manure Compost. J Food Prot. 2009;72(7):1576–84.
41. Semenov A V., Van Bruggen AHC, Van Overbeek L, Termorshuizen AJ, Semenov AM.
Influence of temperature fluctuations on Escherichia coli O157:H7 and Salmonella
enterica serovar Typhimurium in cow manure. FEMS Microbiol Ecol. 2007;60(3):419–28.
42. Zwald AG, Ruegg PL, Kaneene JB, Warnick LD, Wells SJ, Fossler C, et al. Management
Practices and Reported Antimicrobial Usage on Conventional and Organic Dairy Farms 1.
J Dairy Sci. 2004;87:191–201.
43. Srinivasan V, Gillespie BE, Lewis MJ, Nguyen LT, Headrick SI, Schukken YH, et al.
Phenotypic and genotypic antimicrobial resistance patterns of Escherichia coli isolated
from dairy cows with mastitis. Vet Microbiol. 2007;
44. Wang L, Oda Y, Grewal S, Morrison M, Michel FC, Yu Z. Persistence of Resistance to
Erythromycin and Tetracycline in Swine Manure During Simulated Composting and
Lagoon Treatments. Source Microb Ecol. 2012;63(1):32–40.
45. Beneragama N, Iwasaki M, Lateef SA, Yamashiro T, Ihara I, Umetsu K. The survival of
multidrug-resistant bacteria in thermophilic and mesophilic anaerobic co-digestion of
dairy manure and waste milk. Anim Sci J. 2013;84(5):426–33.
46. Chen ᰔ Jing, Yu Z, Michel FC, Wittum T, Morrison M. Development and Application of
Real-Time PCR Assays for Quantification of erm Genes Conferring Resistance to
94
Macrolides-Lincosamides-Streptogramin B in Livestock Manure and Manure
Management Systems. Appl Environ Microbiol. 2007;73(14):4407–16.
47. US Food and Drug Administration. FSMA Facts - Biological Soil Amendments: Subpart
F.
48. Selvam A, Zhao Z, Wong JWC. Composting of swine manure spiked with sulfadiazine,
chlortetracycline and ciprofloxacin. 2012;
49. Mitchell SM, Ullman JL, Bary A, Cogger CG, Teel AL, Watts RJ. Antibiotic Degradation
During Thermophilic Composting. Water Air Soil Pollut. 2015;226:13.
50. Ho Y Bin, Zakaria MP, Latif PA, Saari N. Degradation of veterinary antibiotics and
hormone during broiler manure composting. Bioresour Technol. 2013;131:476–84.
51. Sharma R, Larney FJ, Chen J, Yanke LJ, Morrison M, Topp E, et al. Selected
antimicrobial resistance during composting of manure from cattle administered sub-
therapeutic antimicrobials. J Environ Qual. 2009;38(2):567–75.
52. Guan J, Wasty a, Grenier C, Chan M. Influence of temperature on survival and
conjugative transfer of multiple antibiotic-resistant plasmids in chicken manure and
compost microcosms. Poult Sci. 2007;86(4):610–3.
53. Holman DB, Hao X, Topp E, Yang HE, Alexander TW. Effect of co-composting cattle
manure with construction and demolition waste on the archaeal, bacterial, and fungal
microbiota, and on antimicrobial resistance determinants. PLoS One. 2016;11(6):1–21.
54. Yu Z, Michel FC, Hansen G, Wittum T, Morrison M. Development and Application of
Real-Time PCR Assays for Quantification of Genes Encoding Tetracycline Resistance.
Appl Environ Microbiol. 2005;71(11):6926–33.
55. Storteboom HN, Kim S-C, Doesken KC, Carlson KH, Davis JG, Pruden A. Response of
antibiotics and resistance genes to high-intensity and low-intensity manure management. J
Environ Qual. 2002;36(6):1695–703.
56. Qian X, Sun W, Gu J, Wang X-J, Sun J-J, Yin Y-N, et al. Variable effects of
oxytetracycline on antibiotic resistance gene abundance and the bacterial community
during aerobic composting of cow manure. J Hazard Mater. 2016;315(315):61–9.
57. Mcdermott PF, Walker RD, White DG. Antimicrobials: Modes of Action and Mechanisms
of Resistance. Int J Toxicol. 2003;22:135–43.
58. Organization WH. Critically Important Antimicrobials for Human Medicine. 2011;
59. Hamad B. The antibiotics market. Nat Rev Drug Discov. 2010;9:675–6.
60. Pitout JDD, Laupland KB. Extended-spectrum β-lactamase-producing Enterobacteriaceae:
an emerging public-health concern. Lancet Infect Dis. 2008;8:159–66.
61. Seiffert SN, Hilty M, Perreten V, Endimiani A. Drug Resistance Updates Extended-
spectrum cephalosporin-resistant gram-negative organisms in livestock: An emerging
problem for human health? Drug Resist Updat. 2013;16:22–45.
95
62. Appelbaum PC, Hunter PA. The fluoroquinolone antibacterials: past, present and future
perspectives. Int J Antimicrob Agents. 2000;16:5–15.
63. USDA. Dairy Heifer Raiser, 2011. 2012;(October):1–164.
64. Leclercq R. Mechanisms of Resistance to Macrolides and Lincosamides: Nature of the
Resistance. Clin Infect Dis. 2002;34(4):482–92.
65. Sköld O. Sulfonamide resistance: mechanisms and trends. Drug Resist Updat.
2000;3:155–60.
66. Chopra I, Roberts M. Tetracycline Antibiotics : Mode of Action , Applications , Molecular
Biology , and Epidemiology of Bacterial Resistance Tetracycline Antibiotics : Mode of
Action , Applications , Molecular Biology , and Epidemiology of Bacterial Resistance.
Microbiol Mol Biol Rev. 2001;65(2):232–260.
67. Cockerill Iii FR. MINIREVIEW Genetic Methods for Assessing Antimicrobial
Resistance. Antimicrob Agents Chemother. 1999;43(2):199–212.
68. Schmieder R, Edwards R. Insights into Antibiotic Resistance Through Metagenomic
Approaches. Future Microbiol. 2012;7:73–89.
69. Papich MG. Antimicrobials, Susceptibility Testing, and Minimum Inhibitory
Concentrations (MIC) in Veterinary Infection Treatment. Vet Clin Small Anim.
2013;43:1079–89.
70. Smith P, Hiney MP, Samuelsen OB. Bacterial resistance to antimicrobial agents used in
fish farming: A critical evaluation of method and meaning. Annu Rev Fish Dis.
1994;4(C):273–313.
71. Steffan} RJ, Atlas RM. POLYMERASE CHAIN REACTION: Applications in
Environmental Microbiology. Annu Rev Microb. 1991;45:137–41.
72. Wilhelm J, Pingoud A. Real-Time Polymerase Chain Reaction. ChemBioChem. 2003 Nov
7;4(11):1120–8.
73. Metzker ML. Sequencing technologies - the next generation. Nat Rev Genet.
2010;11(1):31–46.
74. Bioinformatics B, Meyer F, Paarmann D, D ’souza M, Olson R, Glass E, et al. The
metagenomics RAST server – a public resource for the automatic phylogenetic and
functional analysis of metagenomes. BMC Bioinformatics. 2008;9(9).
75. Mcarthur AG, Waglechner N, Nizam F, Yan A, Azad MA, Baylay AJ, et al. The
Comprehensive Antibiotic Resistance Database. Antimicrob Agents Chemother.
2013;57(7):3348–57.
76. Arango-Argoty G, Zhang L, Singh G, Heath LS, Pruden A, Xiao W. MetaStorm: A Public
Resource for Customizable Metagenomics Annotation. PLoS One. 2016;Under Revi:1–
14.
77. Caporaso JG, Kuczynski J, Stombaugh J, Bittinger K, Bushman FD, Costello EK, et al.
correspondence QIIME allows analysis of high- throughput community sequencing data
96
Intensity normalization improves color calling in SOLiD sequencing. Nat Publ Gr.
2010;7(5):335–6.
78. Ma Y, Wilson CA, Novak JT, Riffat R, Aynur S, Murthy S, et al. Effect of various sludge
digestion conditions on sulfonamide, macrolide, and tetracycline resistance genes and
class i integrons. Environ Sci Technol. 2011;45(18):7855–61.
79. Lozupone C, Lladser ME, Knights D, Stombaugh J, Knight R. UniFrac: an effective
distance metric for microbial community comparison. ISME J. 2010;5(10):169–72.


![Phenotypic Tests of Bacterial Antimicrobial Susceptibility ......of bacterial antimicrobial resistance; can be widely used in clinical and diagnostic microbiology laboratories [4]](https://img.pdfslide.us/doc/110x75/606cfd6f126eaf0637640765/phenotypic-tests-of-bacterial-antimicrobial-susceptibility-of-bacterial.jpg)