Embed Size (px)
Citation preview
Paper ID #11986
Effect of Comfort Zone on Entrepreneurship Potential, Innovation Culture,and Career Satisfaction
Dr. Ikhlaq Sidhu, University of California, Berkeley
Ikhlaq Sidhu is the Chief Scientist and Founding Director of UC Berkeley’s Center for Entrepreneurship& Technology. Prof. Sidhu also developed and founded the Fung Institute for Engineering Leadership.He received the IEOR Emerging Area Professor Award from his department at Berkeley. He has beengranted over 60 US Patents in networking technology, IP telephony, and mobile computing. He wasawarded 3Com Corporation’s ”Inventor of the Year” in 1999. Dr. Sidhu also serves as a Senior Fellowof the Applied Innovation Institute and as a Venture Advisor at Onset Ventures, a leading Silicon Valleyinvestment firm.
Dr. Paris Deletraz, IE Business School
Dr. Deletraz is Professor of Entrepreneurship and runs the Venture Lab at IE Business School
c©American Society for Engineering Education, 2015
Effect of Comfort Zone on Entrepreneurship Potential,
Innovation Culture, and Career Satisfaction
0. Abstract: In this paper, we demonstrate preliminary determinations that a person’s comfort zone, as measured on a newly developed CZone Scale, has significant correlation with their potential as an entrepreneur or innovator. “Comfort Zone” is a behavioral state within which a person operates in an anxiety-neutral condition, using a limited set of behaviors to deliver a steady level of performance, usually without a sense of risk (White 2008). Our preliminary data, based on approximately 1000 samples, shows that the potential of an entrepreneur or innovator is much more correlated with higher tolerance for uncertainty than it is with field of study. We also find that this critical indicator of entrepreneurial potential is linked with the ability to learn and grow professionally, and that comfort with uncertainty is even an indicator of a person’s perception of overall career satisfaction and personal happiness. We also find two particularly interesting characteristics; firstly, that comfort with uncertainty in professional decisions does not have to be the same as comfort with uncertainty in personal situations, and secondly, that a person’s comfort with uncertainty can change in both directions over the course of his or her life and career. In fact, entrepreneurs tend to increase their comfort with uncertainty over their career, which is not true of non-entrepreneurs. Our findings have implications on how entrepreneurship is taught, on how to test for entrepreneurial and innovation potential, and even what types of individual-level behaviors are most critical to increase the innovation culture of an organization. Our study supports a position that not only can students and employees be screened for these fundamental characteristics, but also that this ability can be developed, grown, and reinforced. This study further reinforces a hypothesis that seminal entrepreneurship and innovation skills can actually be learned. 1. Introduction: The comfort zone is a behavioral state within which a person operates in an anxiety-neutral condition, using a limited set of behaviors to deliver a steady level of performance, usually without a sense of risk (White 2008). It is a type of mental conditioning that causes people to create and maneuver mental boundaries. These boundaries differ from person to person based on varying methods of processing uncertainty. For some, making a decision based on ambiguous or little information is nerve-wracking; for others, it is a thrill. In a broad sense we may relate a higher tolerance for uncertainty in decision-making with the characteristic of exhibiting a ‘growth mindset’ (Dweck 2006). Growth mindset is characterized by a tolerance for learning in areas outside of a person’s comfort zone. This study reveals that increased risk tolerance is a common characteristic between both a potential for entrepreneurship and a person’s growth mindset.
We also endeavor to determine the effect of this mindset on one’s personal and professional life, as well as its potential as a predictor for success in certain fields. In previous literature, entrepreneurs have been identified as having a higher tolerance for uncertainty and a higher propensity to make risky decisions. This study additionally provides empirical foundation to these theories, showing that entrepreneurs have a higher risk tolerance as compared to corporate managers and engineers in both their personal and professional lives. 2. Objective: This research project focuses on understanding one’s risk tolerance in professional and personal decisions and the implications of this tolerance on their lives. We divided an audience of approximately 1000 people by career and education in order to ascertain whether certain backgrounds foster greater comfort with uncertainty. We also used this data set to determine the relationship, if any, between risk tolerances in one’s personal and professional life, as well the evolution of these tolerances over time. We aim to expose whether entrepreneurs and innovators are more comfortable with uncertainty than managers and engineers in both personal and professional situations. Finally, we intend to decipher the effect of this comfort on occupational success and individual happiness. 3. Literature Analysis: The main focus of this research originates with the work of Professor de l’Etraz (de l’Etraz 2002, 2004, 2005, 2006, 2011) on “Quants,” or individuals with a low tolerance for ambiguity and uncertainty in their professional lives. After further research (de l’Etraz, Sidhu 2013), the authors also introduce an analysis of a person’s tolerance for uncertainty in their personal lives. This research resulted in the CZone scale, which directly relates tolerance of uncertainty to the size of our comfort zones. A tolerance for risky behavior has been linked to entrepreneurship in a variety of literature. René Mauer, Helle Neergaard, and Anne Kirketerp Linstad (2009) find that innovation and risk taking are two “uniquely entrepreneurial” factors that ultimately differentiate entrepreneurs from managers. Furthermore, they link tolerance for risk taking to conditioning from an early age and argue that a decreased tolerance can become unconditioned (Mauer, Neergaard, Linstad 2009). Additionally, Dean Shepherd, Holger Patzelt, and J. Michael Haynie (2010) discuss this correlation and the factors that contribute to increased risk tolerance, such as finding a social partner and becoming more personally secure. These factors in turn increase a manager’s entrepreneurial spirals. These spirals could be decreased when other elements become an influence. For example, a reminder that one is ageing could lead to a decrease in entrepreneurial spirals due to the fact that age is correlated with risk-averse behavior (Shepherd, Holger, et.al. 2010). Carol Dweck (2006) discusses growth and fixed mindsets and their relation to a comfort zone. A fixed mindset is characterized by the thought that one’s qualities are set in stone. People with this mindset tend to look at situations as evaluations of their intelligence or character; furthermore, when they are presented with circumstances that challenge their intelligence or character, they tend to shy away from them. A growth mindset, however, is characterized by the idea that qualities are increased and refined through effort and determination. People with this mindset tend to welcome challenges because they view them as a chance to grow. Notably, those with a growth mindset welcome the chance to step out of
their comfort zone (Dweck 2006). Stepping out of one’s comfort zone raises anxiety levels and stimulates a stress response, resulting in enhanced concentration. White (2008) refers to this as the Optimal Performance Zone due to the heightened functioning skills that arise in this zone. However, White also discusses the research of Robert Yerkes (1907) about a potential danger zone that develops due to anxiety. He reports that anxiety has a positive effect on performance until an “optimum level of arousal” is achieved; as anxiety surpasses this optimal amount, performance declines in this danger zone (1907).
In Free Trait Theory, Little (2009) describes Free Traits as emerging when individuals enact sociogenic scripts to advance idiogenic aims, irrespective of the person’s biogenic dispositions. In other words, a biogenic introvert (Cain 2012) could act in an extraverted manner in order to advance his/her core project of leading his team at his company. He would be engaging in free-traited behavior. This implies that a person could operate within the realms of large comfort zones professionally while having a small comfort zone at a personal level. In our research, we validate the idea that a person´s personal and professional relationship with uncertainty is not directly correlated; rather, they could be considered different comfort zones. Little’s (2005, 2006, 2007) research validates that personally construed action, termed idiogenic action, has the capacity to confront biogenic and sociogenic forces. We similarly argue that once you start to feel comfortable by “stepping out” of your comfort zone you begin to change your biogenic disposition in either your personal life or your professional life. And finally, the “self” has more options of becoming socially constructed (Alvesson 2001, Ashforth 2001, Ibarra 2003, Suchaman 1987, Weick 1995) depending on our relationship with ambiguity and uncertainty. We identify ourselves with a type of identity. Professionally this can have big implications for our disposition in work environments.
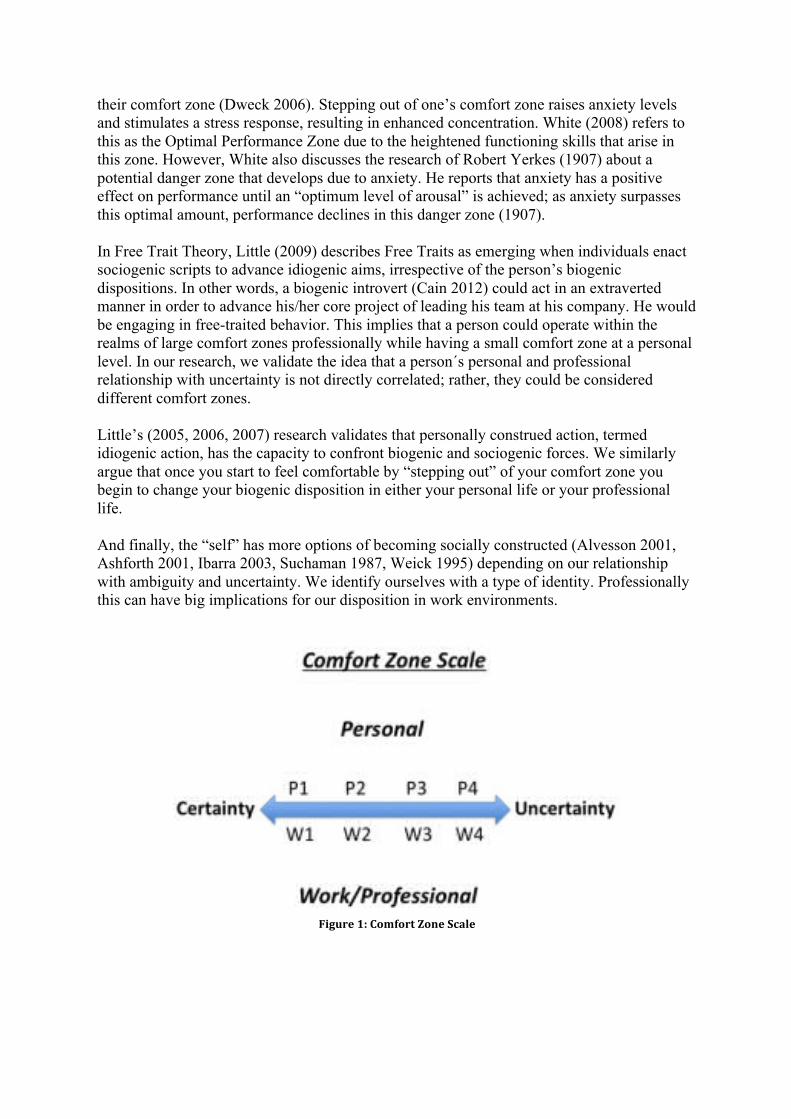
Figure 1: Comfort Zone Scale
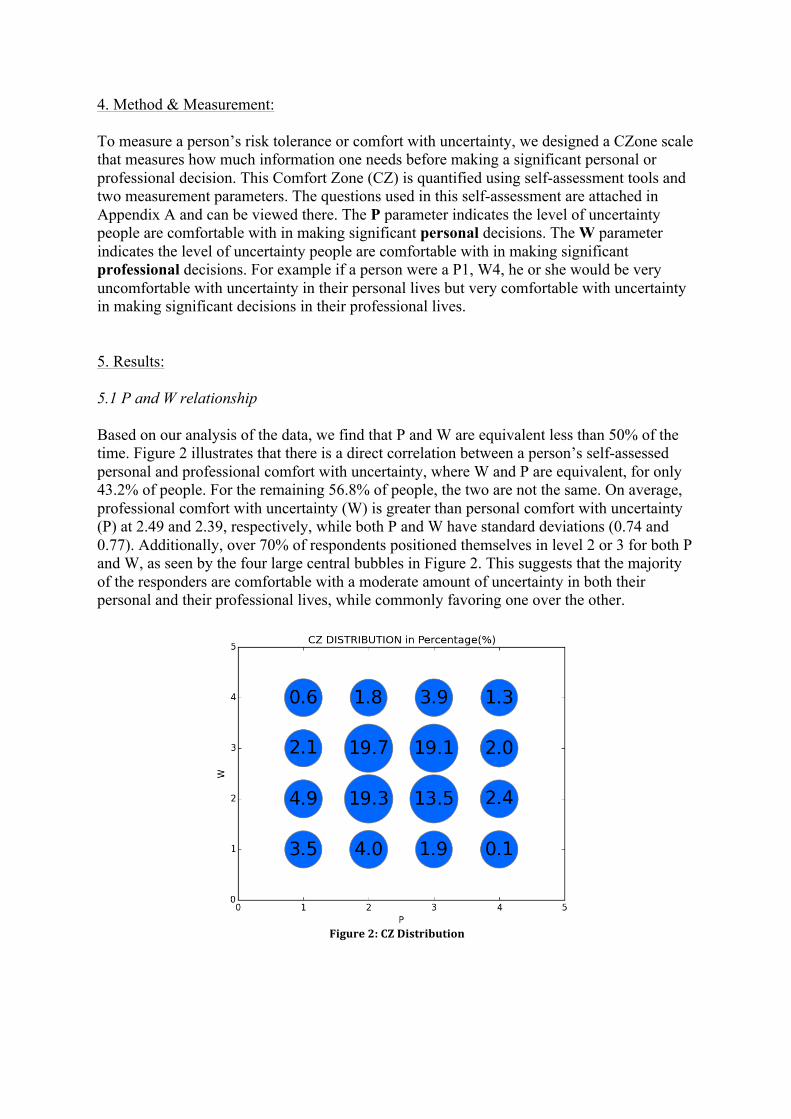
4. Method & Measurement: To measure a person’s risk tolerance or comfort with uncertainty, we designed a CZone scale that measures how much information one needs before making a significant personal or professional decision. This Comfort Zone (CZ) is quantified using self-assessment tools and two measurement parameters. The questions used in this self-assessment are attached in Appendix A and can be viewed there. The P parameter indicates the level of uncertainty people are comfortable with in making significant personal decisions. The W parameter indicates the level of uncertainty people are comfortable with in making significant professional decisions. For example if a person were a P1, W4, he or she would be very uncomfortable with uncertainty in their personal lives but very comfortable with uncertainty in making significant decisions in their professional lives. 5. Results: 5.1 P and W relationship Based on our analysis of the data, we find that P and W are equivalent less than 50% of the time. Figure 2 illustrates that there is a direct correlation between a person’s self-assessed personal and professional comfort with uncertainty, where W and P are equivalent, for only 43.2% of people. For the remaining 56.8% of people, the two are not the same. On average, professional comfort with uncertainty (W) is greater than personal comfort with uncertainty (P) at 2.49 and 2.39, respectively, while both P and W have standard deviations (0.74 and 0.77). Additionally, over 70% of respondents positioned themselves in level 2 or 3 for both P and W, as seen by the four large central bubbles in Figure 2. This suggests that the majority of the responders are comfortable with a moderate amount of uncertainty in both their personal and their professional lives, while commonly favoring one over the other.
Figure 2: CZ Distribution
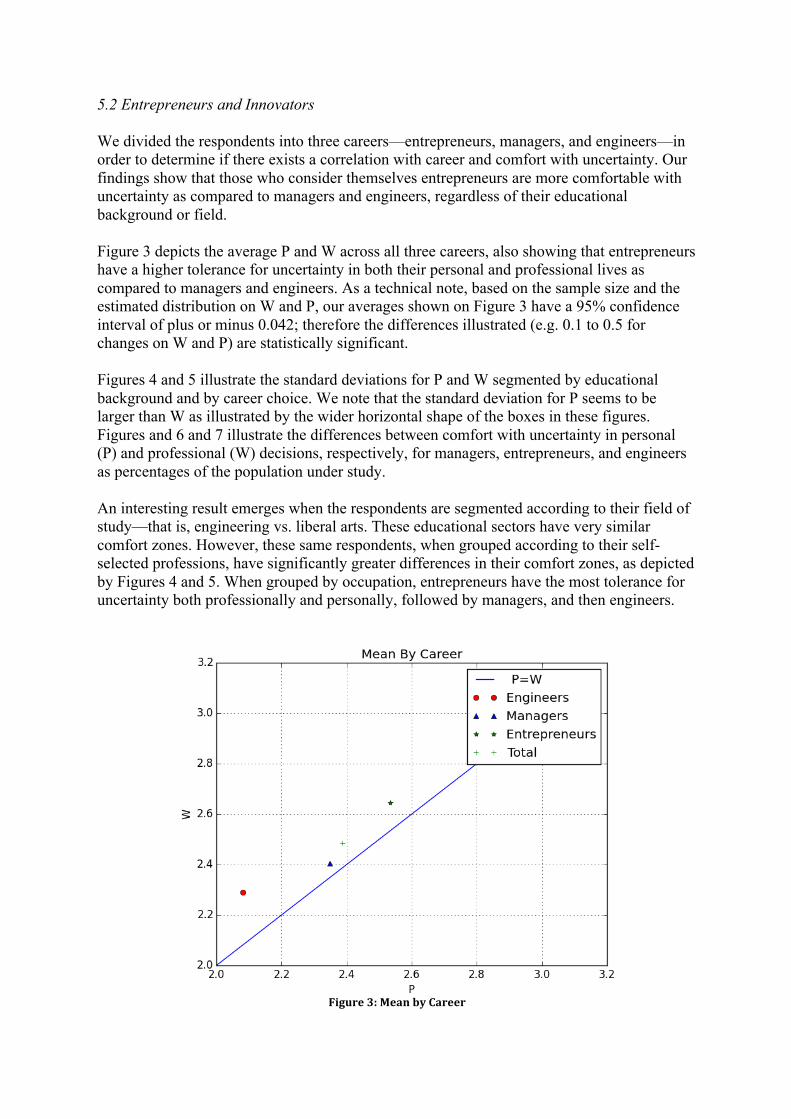
5.2 Entrepreneurs and Innovators We divided the respondents into three careers—entrepreneurs, managers, and engineers—in order to determine if there exists a correlation with career and comfort with uncertainty. Our findings show that those who consider themselves entrepreneurs are more comfortable with uncertainty as compared to managers and engineers, regardless of their educational background or field. Figure 3 depicts the average P and W across all three careers, also showing that entrepreneurs have a higher tolerance for uncertainty in both their personal and professional lives as compared to managers and engineers. As a technical note, based on the sample size and the estimated distribution on W and P, our averages shown on Figure 3 have a 95% confidence interval of plus or minus 0.042; therefore the differences illustrated (e.g. 0.1 to 0.5 for changes on W and P) are statistically significant. Figures 4 and 5 illustrate the standard deviations for P and W segmented by educational background and by career choice. We note that the standard deviation for P seems to be larger than W as illustrated by the wider horizontal shape of the boxes in these figures. Figures and 6 and 7 illustrate the differences between comfort with uncertainty in personal (P) and professional (W) decisions, respectively, for managers, entrepreneurs, and engineers as percentages of the population under study. An interesting result emerges when the respondents are segmented according to their field of study—that is, engineering vs. liberal arts. These educational sectors have very similar comfort zones. However, these same respondents, when grouped according to their self-selected professions, have significantly greater differences in their comfort zones, as depicted by Figures 4 and 5. When grouped by occupation, entrepreneurs have the most tolerance for uncertainty both professionally and personally, followed by managers, and then engineers.
Figure 3: Mean by Career
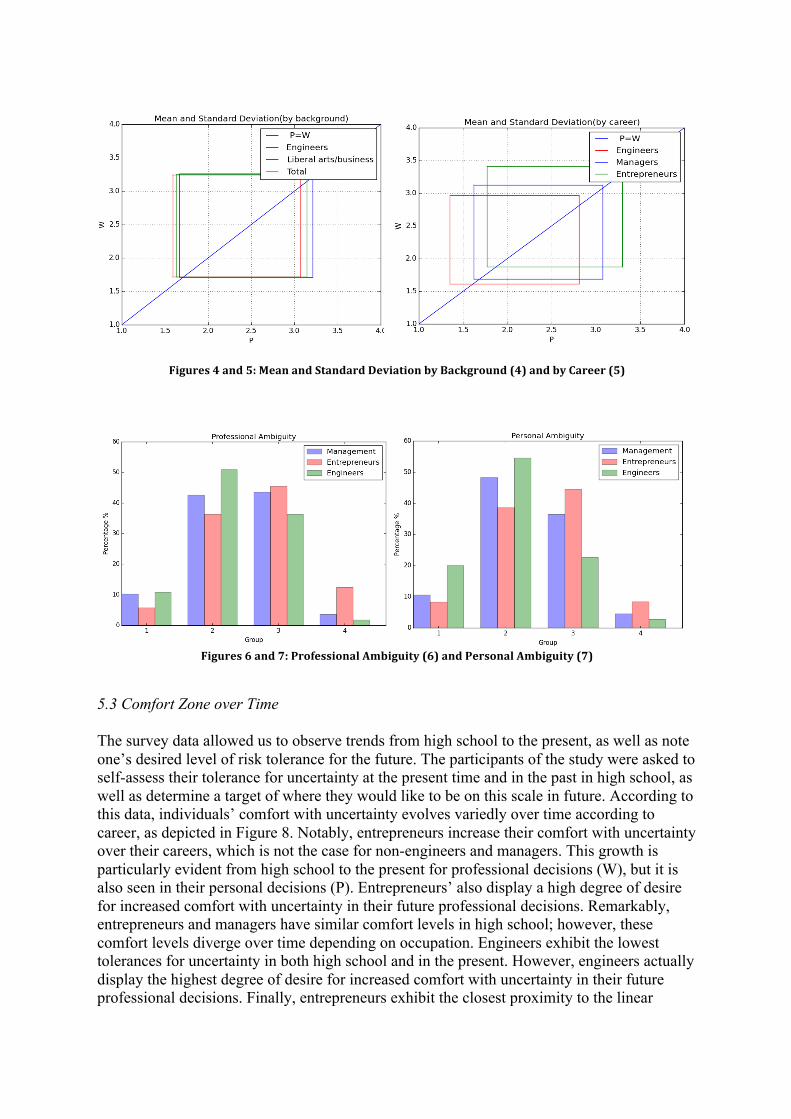
Figures 4 and 5: Mean and Standard Deviation by Background (4) and by Career (5)
Figures 6 and 7: Professional Ambiguity (6) and Personal Ambiguity (7)
5.3 Comfort Zone over Time The survey data allowed us to observe trends from high school to the present, as well as note one’s desired level of risk tolerance for the future. The participants of the study were asked to self-assess their tolerance for uncertainty at the present time and in the past in high school, as well as determine a target of where they would like to be on this scale in future. According to this data, individuals’ comfort with uncertainty evolves variedly over time according to career, as depicted in Figure 8. Notably, entrepreneurs increase their comfort with uncertainty over their careers, which is not the case for non-engineers and managers. This growth is particularly evident from high school to the present for professional decisions (W), but it is also seen in their personal decisions (P). Entrepreneurs’ also display a high degree of desire for increased comfort with uncertainty in their future professional decisions. Remarkably, entrepreneurs and managers have similar comfort levels in high school; however, these comfort levels diverge over time depending on occupation. Engineers exhibit the lowest tolerances for uncertainty in both high school and in the present. However, engineers actually display the highest degree of desire for increased comfort with uncertainty in their future professional decisions. Finally, entrepreneurs exhibit the closest proximity to the linear
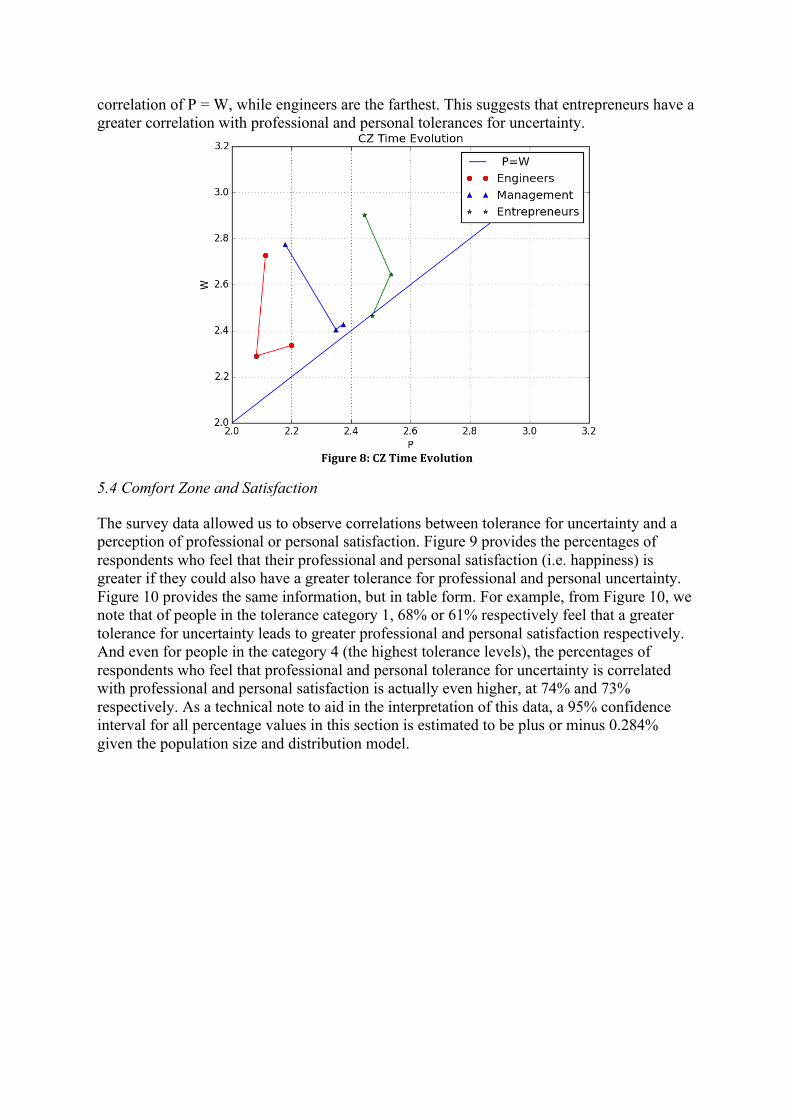
correlation of P = W, while engineers are the farthest. This suggests that entrepreneurs have a greater correlation with professional and personal tolerances for uncertainty.
Figure 8: CZ Time Evolution
5.4 Comfort Zone and Satisfaction
The survey data allowed us to observe correlations between tolerance for uncertainty and a perception of professional or personal satisfaction. Figure 9 provides the percentages of respondents who feel that their professional and personal satisfaction (i.e. happiness) is greater if they could also have a greater tolerance for professional and personal uncertainty. Figure 10 provides the same information, but in table form. For example, from Figure 10, we note that of people in the tolerance category 1, 68% or 61% respectively feel that a greater tolerance for uncertainty leads to greater professional and personal satisfaction respectively. And even for people in the category 4 (the highest tolerance levels), the percentages of respondents who feel that professional and personal tolerance for uncertainty is correlated with professional and personal satisfaction is actually even higher, at 74% and 73% respectively. As a technical note to aid in the interpretation of this data, a 95% confidence interval for all percentage values in this section is estimated to be plus or minus 0.284% given the population size and distribution model.
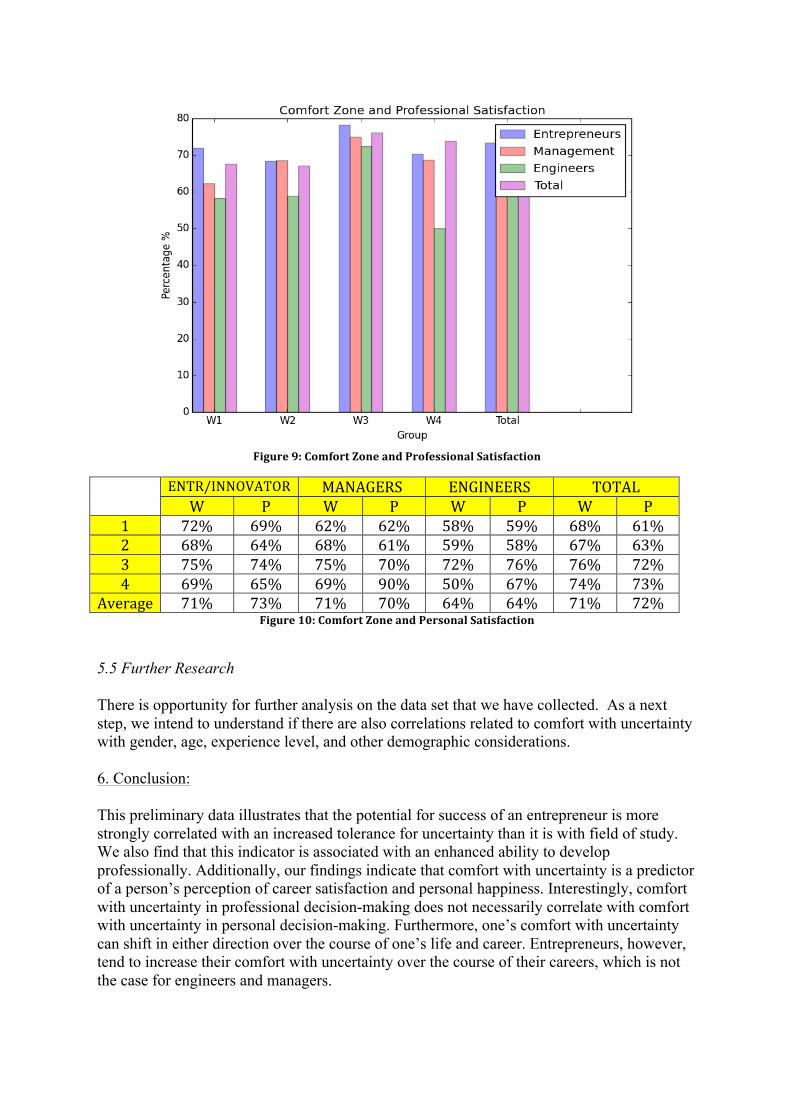
Figure 9: Comfort Zone and Professional Satisfaction
ENTR/INNOVATOR MANAGERS ENGINEERS TOTAL W P W P W P W P
1 72% 69% 62% 62% 58% 59% 68% 61% 2 68% 64% 68% 61% 59% 58% 67% 63% 3 75% 74% 75% 70% 72% 76% 76% 72% 4 69% 65% 69% 90% 50% 67% 74% 73%
Average 71% 73% 71% 70% 64% 64% 71% 72% Figure 10: Comfort Zone and Personal Satisfaction
5.5 Further Research There is opportunity for further analysis on the data set that we have collected. As a next step, we intend to understand if there are also correlations related to comfort with uncertainty with gender, age, experience level, and other demographic considerations. 6. Conclusion: This preliminary data illustrates that the potential for success of an entrepreneur is more strongly correlated with an increased tolerance for uncertainty than it is with field of study. We also find that this indicator is associated with an enhanced ability to develop professionally. Additionally, our findings indicate that comfort with uncertainty is a predictor of a person’s perception of career satisfaction and personal happiness. Interestingly, comfort with uncertainty in professional decision-making does not necessarily correlate with comfort with uncertainty in personal decision-making. Furthermore, one’s comfort with uncertainty can shift in either direction over the course of one’s life and career. Entrepreneurs, however, tend to increase their comfort with uncertainty over the course of their careers, which is not the case for engineers and managers.
7. Implications: These findings suggest important consequences on the method of entrepreneurship education, the process of testing for entrepreneurial and innovation potential, and the types of individual behaviors critical for the increase of the innovation culture of an organization. This study maintains a position that people can be screened for these critical characteristics and that these abilities can be developed and fortified. Most importantly, however, the study reinforces the hypothesis that seminal entrepreneurship and innovation skills can be learned. 8. Acknowledgements: We would like to thank and acknowledge students Sara Karabashlieva for editing and Rishabh Holani for contributing to the data analytics on this project.
Bibliography
Alvesson, M. (2001). “Knowledge Work: Ambiguity, Image and Identity.” Human Relations, Special Issue on Knowledge Management in Professional Service Firms, 2001, 54(7), 863–86. Ashforth, B.E. (2001). “Role Transitions in Organizational Life: An Identity-Based Perspective.” New Jersey: Lawrence Erlbaum Associates. de l’Etraz, Paris. (2002). “Productivity Issues in Investment Banking: An Ethnomethodological Approach.” Barcelona: ESADE. de l’Etraz, Paris. (2004). “The Productivity Challenge in Knowledge Work: A Communities of Practice Approach within a Global Investment Bank.” Barcelona: ESADE. de l’Etraz, Paris. (2005) “Shared Rhetoric: The Productivity Challenge in Investment Banking,” paper presented at EURAM 2005. de l’Etraz, Paris. (2006). “Negotiating the Meaning of Numbers”, paper presented at the 1st Conference on Rhetoric and Narratives in Management, ESADE Business School, 2006. de l’Etraz, Paris. (2011). “The Socialization of the Quantitatively Minded Professional,” Ph.D Thesis, ESADE Business School, 2011. Dweck, Carol. (2006). Mindset: The New Psychology of Success. New York: Random House. Elliot, Andrew & Dweck, Carol. (Eds.) (2005). Handbook of Competence and Motivation.Guilford Press. Ibarra, H. (2003). Working Identity. Cambridge: Harvard Business School Press. Little, B. R. (2011). Personal Projects and Free Traits: Personality and Motivation Reconsidered. Thousand Oaks, CA: Sage. Mauer, René et. al. (2009). Self-Efficacy: Conditioning the Entrepreneurial Mindset. International Studies in Entrepreneurship, 24, 233-257. Shepherd, Dean A. et. al. (2010). Entrepreneurial Spirals: Deviation-Amplifying Loops of an Entrepreneurial Mindset and Organizational Culture. Entrepreneurship: Theory and Practice, 34, 59-82. Suchman, L. (1987). Plans and Situated Actions. Cambridge: Cambridge University Press Weick, K. (1995). Sensemaking in Organizations. Thousand Oaks, CA: Sage

White, Alasdair. (2008). From Comfort Zone to Performance Management: Understanding development and performance. White and Maclean Publishing. Yerkes, R., & Dodson, J. (1907). The Dancing Mouse, A Study in Animal Behavior. Journal of Comparative Neurology & Psychology, 18, 459-482.
Appendix A
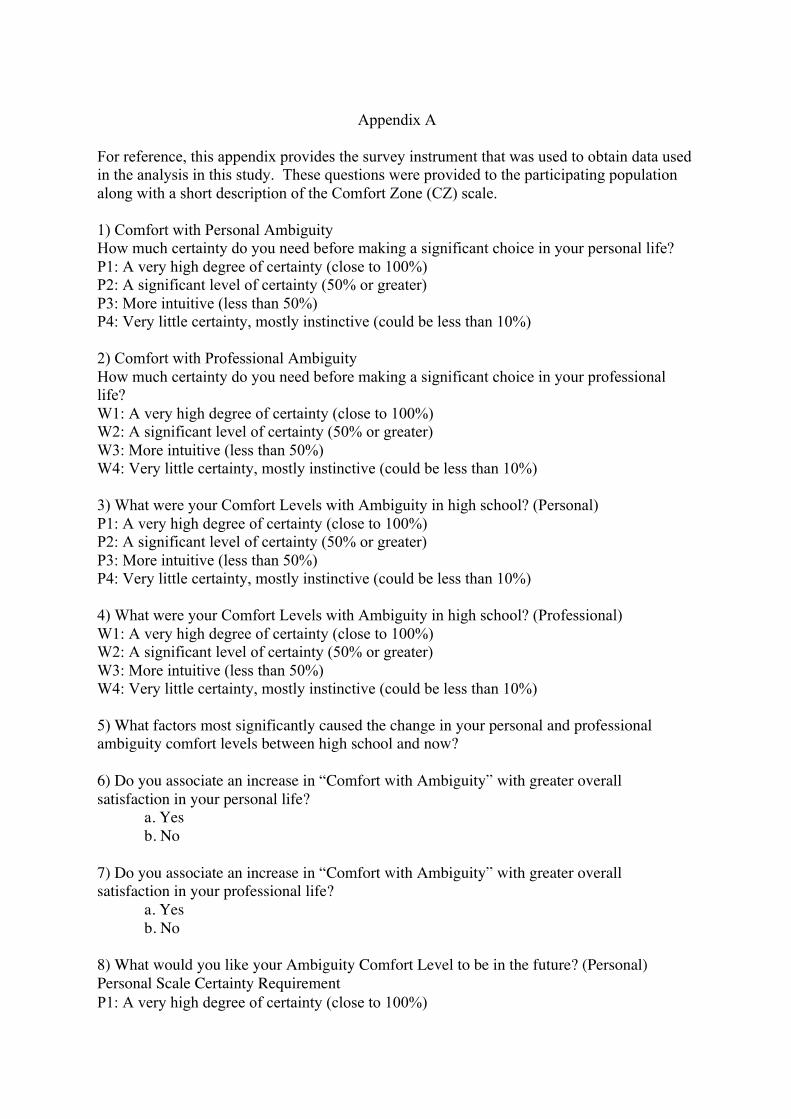
For reference, this appendix provides the survey instrument that was used to obtain data used in the analysis in this study. These questions were provided to the participating population along with a short description of the Comfort Zone (CZ) scale.
1) Comfort with Personal Ambiguity How much certainty do you need before making a significant choice in your personal life? P1: A very high degree of certainty (close to 100%) P2: A significant level of certainty (50% or greater) P3: More intuitive (less than 50%) P4: Very little certainty, mostly instinctive (could be less than 10%) 2) Comfort with Professional Ambiguity How much certainty do you need before making a significant choice in your professional life? W1: A very high degree of certainty (close to 100%) W2: A significant level of certainty (50% or greater) W3: More intuitive (less than 50%) W4: Very little certainty, mostly instinctive (could be less than 10%) 3) What were your Comfort Levels with Ambiguity in high school? (Personal) P1: A very high degree of certainty (close to 100%) P2: A significant level of certainty (50% or greater) P3: More intuitive (less than 50%) P4: Very little certainty, mostly instinctive (could be less than 10%) 4) What were your Comfort Levels with Ambiguity in high school? (Professional) W1: A very high degree of certainty (close to 100%) W2: A significant level of certainty (50% or greater) W3: More intuitive (less than 50%) W4: Very little certainty, mostly instinctive (could be less than 10%) 5) What factors most significantly caused the change in your personal and professional ambiguity comfort levels between high school and now? 6) Do you associate an increase in “Comfort with Ambiguity” with greater overall satisfaction in your personal life? a. Yes b. No 7) Do you associate an increase in “Comfort with Ambiguity” with greater overall satisfaction in your professional life? a. Yes b. No 8) What would you like your Ambiguity Comfort Level to be in the future? (Personal) Personal Scale Certainty Requirement P1: A very high degree of certainty (close to 100%)
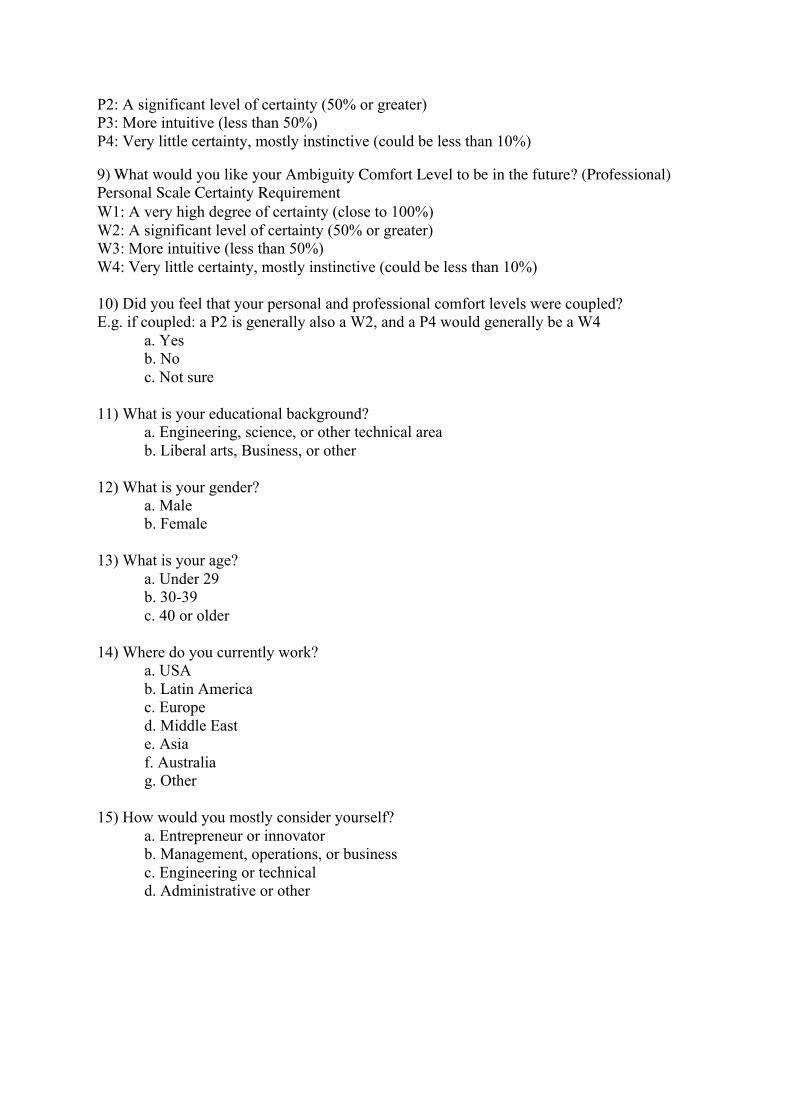
P2: A significant level of certainty (50% or greater) P3: More intuitive (less than 50%) P4: Very little certainty, mostly instinctive (could be less than 10%) 9) What would you like your Ambiguity Comfort Level to be in the future? (Professional) Personal Scale Certainty Requirement W1: A very high degree of certainty (close to 100%) W2: A significant level of certainty (50% or greater) W3: More intuitive (less than 50%) W4: Very little certainty, mostly instinctive (could be less than 10%) 10) Did you feel that your personal and professional comfort levels were coupled? E.g. if coupled: a P2 is generally also a W2, and a P4 would generally be a W4 a. Yes b. No c. Not sure 11) What is your educational background? a. Engineering, science, or other technical area b. Liberal arts, Business, or other 12) What is your gender? a. Male b. Female 13) What is your age? a. Under 29 b. 30-39 c. 40 or older 14) Where do you currently work? a. USA b. Latin America c. Europe d. Middle East e. Asia f. Australia g. Other 15) How would you mostly consider yourself? a. Entrepreneur or innovator b. Management, operations, or business c. Engineering or technical d. Administrative or other


![Introducing [comfort zone]](https://img.pdfslide.us/doc/110x75/559d0b201a28abed478b4732/introducing-comfort-zone.jpg)
![Sdb3 q1 pw5_[comfort zone]](https://img.pdfslide.us/doc/110x75/547d6ecc5906b5ba718b4567/sdb3-q1-pw5comfort-zone.jpg)


![[ comfort zone ] A5 press book](https://img.pdfslide.us/doc/110x75/568bf35f1a28ab89339a13cd/-comfort-zone-a5-press-book.jpg)