Embed Size (px)
Citation preview
Effect of Columbium and Vanadium on the Weldabi l i ty of HSLA Steels
Excellent low-temperature HAZ and weld-metal toughness can be obtained in a variety of HSLA steels
containing Cb and V
BY E. G. SIGNES AND J. C. BAKER
SUMMARY. A comprehensive study was conducted on the effects of Cb and V on the weldabil i ty of high-strength low-alloy (HSLA) steels, particularly on the heat-affected zone (HAZ) and weld metal toughness.
Results were based on a series of 500 lb (225 kg) laboratory heats which were Si-Al-ki I led low-sulfur steels containing 1.5% Mn and control-rol led. We looked at compositions in which C, Cb and V ranges were 0.08-0.18%, 0-0.15% and 0-0.10%, respectively. Base-metal yield and tensile strength varied from 52 to 77 ksi (359 to 531 MPa) and from 67 to 92 ksi (482 to 620 MPa), respectively.
Much of the data was statistically analyzed. Equations were developed for material properties for compositions within the design limits. From these equations graphs were plotted that enabled strength and toughness properties to be predicted as a function of C, Cb and V. Metallography was util ized to determine microstructural causes for property differences.
In general, good weld-metal and HAZ toughnesses were obtained over a large part of the range of steels studied. The main findings of the study were:
1. HAZ toughness increased with the addition of Cb at low C (0.08%) and with the addition of V at high C levels (0.18%). But at all C levels, the addition of Cb and V together decreased HAZ toughness.
Paper presented at the AWS 60th Annual Meeting held in Detroit, Michigan, during April 2-6, 1979
E. G. 5IGNES is a Research Engineer—Product Metallurgy and I. C BAKER is Research Supervisor—Product Metallurgy, Bethlehem Steel Corporation, Homer Research Laboratories, Bethlehem, Pennsylvania.
2. Three different electrode/flux combinations gave good weld-metal toughness in most cases. At low C levels a Ti-B electrode produced exceptionally tough weld metal for all microalloy combinations, even in steel containing 0.15% Cb.
Materials and Weld ing Procedures
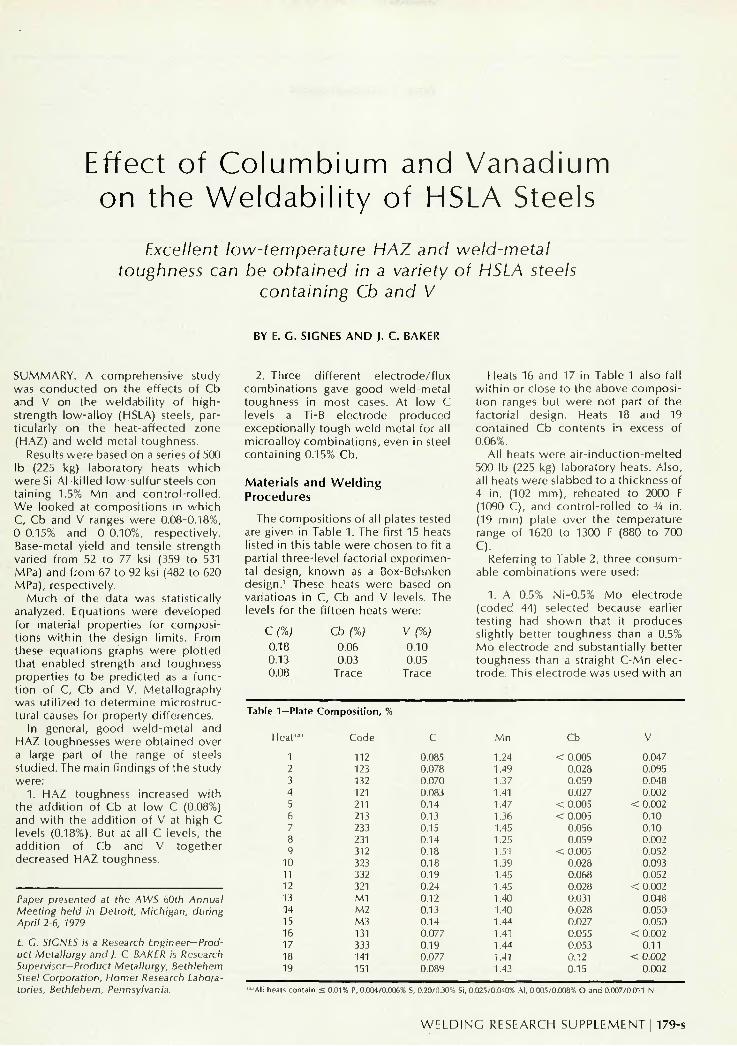
The compositions of all plates tested are given in Table 1. The first 15 heats listed in this table were chosen to fit a partial three-level factorial experimental design, known as a Box-Behnken design.' These heats were based on variations in C, Cb and V levels. The levels for the fifteen heats were:
C (%) 0.18 0.13 0.08
Cb (%)
0.06 0.03
Trace
V (%)
0.10 0.05
Trace
Heats 16 and 17 in Table 1 also fall wi th in or close to the above composition ranges but were not part of the factorial design. Heats 18 and 19 contained Cb contents in excess of 0.06%.
All heats were air-induction-melted 500 lb (225 kg) laboratory heats. Also, all heats were slabbed to a thickness of 4 in. (102 mm), reheated to 2000 F (1090 C), and control-rolled to % in. (19 mm) plate over the temperature range of 1620 to 1300 F (880 to 700 C).
Referring to Table 2, three consumable combinations were used:
1. A 0.5% Ni-0.5% Mo electrode (coded 44) selected because earlier testing had shown that it produces slightly better toughness than a 0.5% Mo electrode and substantially better toughness than a straight C-Mn electrode. This electrode was used with an
Table 1 —Plate Composition, %
Heat' Code Mn Cb
I 2 3 4 5 6 7 8 9
10 11 12 13 14 15 16 17 18 19
112 123 132 121 211 213 233 231 312 323 332 321 M1 M2 M3 131 333 141 151
0.085 0.078 0.070 0.083 0.14 0.13 0.15 0.14 0.18 0.18 0.19 0.24 0.12 0.13 0.14 0.077 0.19 0.077 0.089
1.24 1.49 1.37 1.41 1.47 1.36 1.45 1.25 1.51 1.39 1.45 1.45 1.40 1.40 1.44 1.41 1.44 1.41 1.43
< 0.005 0.028 0.059 0.027
< 0.005 < 0.005
0.056 0.059
< 0.005 0.028 0.068 0.028 0.031 0.028 0.027 0.055 0.053 0.12 0.15
0.047 0.095 0.048 0.002
< 0.002 0.10 0.10 0.002 0.052 0.093 0.052
< 0.002 0.048 0.050 0.050
< 0.002 0.11
< 0.002 0.002
"A l l heals conta in £ 0.01% P, 0.004/0.006% S, 0.20/0.30% Si, 0.025/0.040% Al , 0.005/0.008% O and 0.007/0.011 N.
W E L D I N G RESEARCH SUPPLEMENT I 179-s
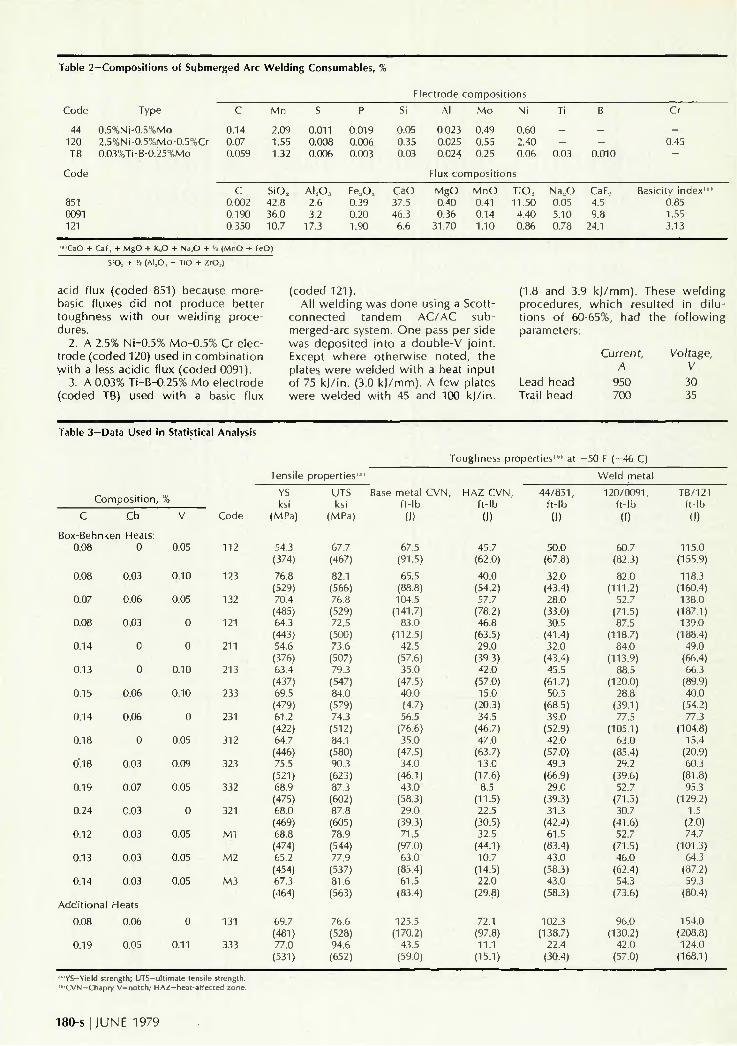
Table 2-Compositions of Submerged Arc Welding Consumables, %
Electrode compositions
Code
44 120 TB
Code
851 0091 121
'"CaO +
Type
0.5%Ni-0.5%Mo 2.5%Ni-0.5%Mo-0.5%Cr 0.03%Ti-B-0.25o/oMo
CaF.. + MgO + K.O + Na,0 + I
C
0.14 0.07 0.059
C 0.002 0.190 0.350
i (MnO + 1
SiO, + "2 (ALO, + TiO + ZrO.)
M n
2.09 1.55 1.32
SiO, 42.8 36.0 10.7
eO)
S
0.011 0.008 0.006
A L O , 2.6 3.2
17.3
P
0.019 0.006 0.003
Fe..O, 0.39 0.20 1.90
Si
0.05 0.35 0.03
CaO 37.5 46.3 6.6
Al
0.023 0.025 0.024
M o
0.49 0.55 0.25
Ni
0.60 2.40 0.06
Flux composit ions
MgO 0.40 0.36
31.70
M n O 0.41 0.14 1.10
T iO, 11.50 4.40 0.86
Ti
--
0.03
Na.O 0.05 5.10 0.78
li
--
0.010
CaF., 4.5 9.8
24.1
Cr
-0.45 -
Basicity index'" ' 0.85 1.55 3.13
acid flux (coded 851) because more-basic fluxes did not produce better toughness wi th our welding procedures.
2. A 2.5% Ni-0.5% Mo-0.5% Cr electrode (coded 120) used in combination with a less acidic flux (coded 0091).
3. A 0.03% Ti-B-0.25% Mo electrode (coded TB) used wi th a basic flux
(coded 121). All welding was done using a Scott-
connected tandem AC/AC submerged-arc system. One pass per side was deposited into a double-V joint. Except where otherwise noted, the plates were welded wi th a heat input of 75 k j / in . (3.0 k j /mm) . A few plates were welded wi th 45 and 100 k j / in .
(1.8 and 3.9 k) /mm). These welding procedures, which resulted in d i lutions of 60-65%, had the fol lowing parameters:
Lead head Trail head
Current, A
950 700
Voltage, V 30 35
Table 3—Data Used in Statistical Analysis
Toughness properties"', at —50 F (—46 C)
Co
C
Box-Behnk 0.08
0.08
0.07
0.08
0.14
0.13
0.15
0.14
0.18
0.18
0.19
0.24
0.12
0.13
0.14
Addit ional
0.08
0.19
m posit ion,
Cb
en Heats: 0
0.03
0.06
0.03
0
0
0.06
0.06
0
0.03
0.07
0.03
0.03
0.03
0.03
Heats
0.06
0.05
% V
0.05
0.10
0.05
0
0
0.10
0.10
0
0.05
0.09
0.05
0
0.05
0.05
0.05
0
0.11
Code
112
123
132
121
211
213
233
231
312
323
332
321
M l
M2
M3
131
333
Tensile
YS ksi
(MPa)
54.3 (374)
76.8 (529) 70.4 (485) 64.3 (443) 54.6 (376) 63.4 (437) 69.5 (479) 61.2 (422) 64.7 (446) 75.5 (521) 68.9 (475) 68.0 (469) 68.8 (474) 65.2 (454) 67.3 (464)
69.7 (481) 77.0 (531)
properties"1
UTS ksi
(MPa)
67.7 (467)
82.1 (566) 76.8 (529) 72.5 (500) 73.6 (507) 79.3 (547) 84.0 (579) 74.3 (512) 84.1 (580) 90.3 (623) 87.3 (602) 87.8 (605) 78.9 (544) 77.9 (537) 81.6 (563)
76.6 (528) 94.6 (652)
Base metal CVN, It- lb
(I)
67.5 (91.5)
65.5 (88.8) 104.5
(141.7) 83.0
(112.5) 42.5
(57.6) 35.0
(47.5) 40.0 (4.7) 56.5
(76.6) 35.0
(47.5) 34.0
(46.1) 43.0
(58.3) 29.0
(39.3) 71.5
(97.0) 63.0
(85.4) 61.5
(83.4)
125.5 (170.2)
43.5 (59.0)
HAZ CVN, ft- lb
(I)
45.7 (62.0)
40.0 (54.2) 57.7
(78.2) 46.8
(63.5) 29.0
(39.3) 42.0
(57.0) 15.0
(20.3) 34.5
(46.7) 47.0
(63.7) 13.0
(17.6) 8.5
(11.5) 22.5
(30.5) 32.5
(44.1) 10.7
(14.5) 22.0
(29.8)
72.1 (97.8) 11.1
(15.1)
44/851, f t- lb
(I)
50.0 (67.8)
32.0 (43.4) 28.0
(33.0) 30.5
(41.4) 32.0
(43.4) 45.5
(61.7) 50.5
(68.5) 39.0
(52.9) 42.0
(57.0) 49.3
(66.9) 29.0
(39.3) 31.3
(42.4) 61.5
(83.4) 43.0
(58.3) 43.0
(58.3)
102.3 (138.7)
22.4 (30.4)
Weld metal
120/0091, ft- lb
(I)
60.7 (82.3)
82.0 (111.2)
52.7 (71.5) 87.5
(118.7) 84.0
(113.9) 88.5
(120.0) 28.8
(39.1) 77.5
(105.1) 63.0
(85.4) 29.2
(39.6) 52.7
(71.5) 30.7
(41.6) 52.7
(71.5) 46.0
(62.4) 54.3
(73.6)
96.0 (130.2)
42.0 (57.0)
TB/ 12 1 ft-lb
(1)
115.0 (155.9)
118.3 (160.4) 138.0
(187.1) 139.0
(188.4) 49.0
(66.4) 66.3
(89.9) 40.0
(54.2) 77.3
(104.8) 15.4
(20.9) 60.3
(81.8) 95.3
(129.2) 1.5
(2.0) 74.7
(101.3) 64.3
(87.2) 59.3
(80.4)
154.0 (208.8) 124.0
(168.1)
""YS—Yield strength; UTS—ultimate tensile strength. ""CVN— Chapry V—notch; HAZ—heat-affected zone.
180-s I JUNE 1979
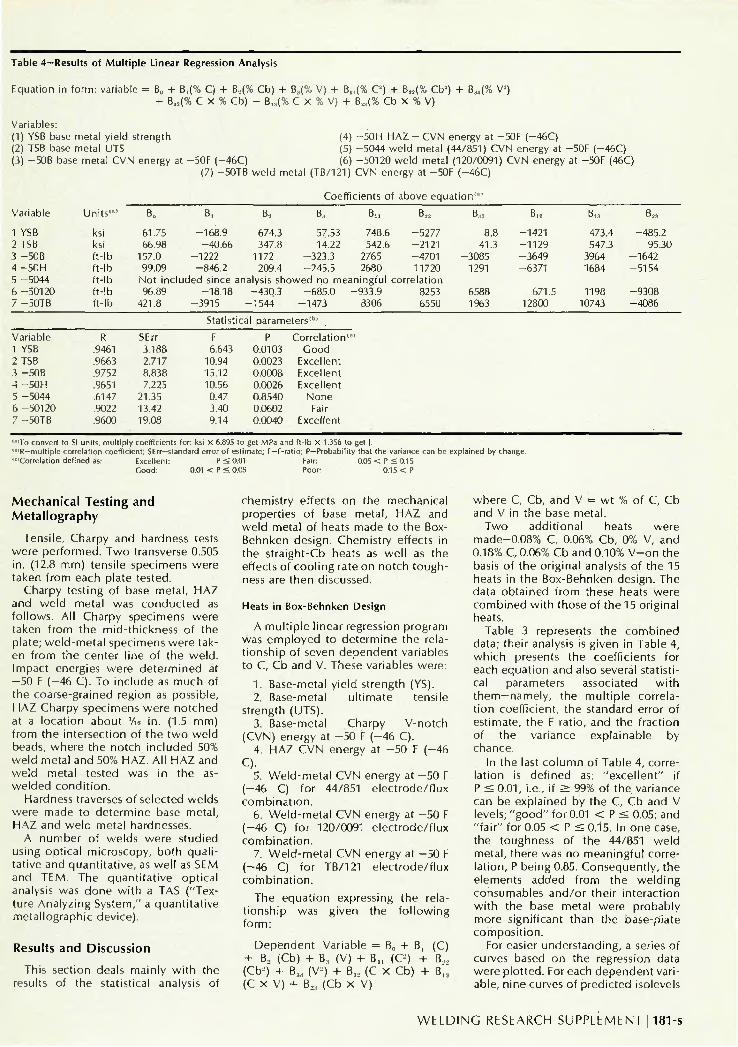
Table 4—Results of Multiple Linear Regression Analysis
Equation in form: variable = B„ + B,(% C) + B,(% Cb) + B,(% V) + B,,(% C3) + B.,.,{% Cb3) + BM(% V3) 4- B,,(% C x % Cb) -I- B„(% C x % V) 4- BM(% Cb x % V)
Variables: (1) YSB base metal yield strength (2) TSB base metal UTS (3) -50B base metal CVN energy at
(4) -50H HAZ - CVN energy at -50F (-46C) (5) -5044 weld metal (44/851) CVN energy at -50F (-46C)
-50F (-46C) (6) -50120 weld metal (120/0091) CVN energy at -50F (46C) (7) -50TB weld metal (TB/121) CVN energy at -50F (-46C)
Coefficients of above equation'"
Variable
1 YSB 2 TSB 3 -50B 4 - 5 0 H 5 -5044 6 -50120 7 -50TB
Variable 1 YSB 2 TSB 3 -50B 4 - 5 0 H 5 -5044 6 -50120 7 -50TB
Uni ts""
ksi ksi ft-lb ft- lb ft- lb ft- lb ft- lb
R .9461 .9663 .9752 .9651 .6147 .9022 .9600
B„
61.75 66.98
157.0 99.09
Not inc 96.89
421.8
SErr 3.188 2.717 8.838 7.225
21.35 13.42 19.08
B,
-168.9 -40.66
-1222 -846.2
B2
674.3 347.8
1172 209.4
B„ B,, B2,
57.53 748.6 -5277 14.22 542.6 -2121
-323.3 2765 -4701 -245.5 2680 11720
uded since analysis showed no meaningful correlation -18.18
-3915 -430.3
-1544 -685.0 -933.9 8253
-1473 8306 6550
Statistical parameters""
F 6.643
10.94 15.12 10.56 0.47 3.40 9.14
P 0.0103 0.0023 0.0008 0.0026 0.8540 0.0602 0.0040
Correlat ion1 0
Good Excellent Excellent Excellent
None Fair
Excellent
B„ 8.8
41.3 -3085
1291
6588 1963
B„ -1421 -1129 -3649 -6371
671.5 12800
B«
473.4 547.3
3964 1684
1198 10743
B,;,
-485.2 95.30
-1642 -5154
-9308 -4086
la'To convert to SI units, multiply coefficients for: ksi X 6.895 to get MPa and ft-lb X 1.356 to get J. ""R—multiple correlation coefficient; SErr—standard error of estimate; F—F-ratio; P—Probability that the variance can be explained by change. '"'Correlation defined as: Excellent: P < 0.01 Fair: 0.05 < P£0.15
Good: 0.01 < P £0.05 Poor: 0.15 < P
Mechanical Testing and Metallography
Tensile, Charpy and hardness tests were performed. Two transverse 0.505 in. (12.8 mm) tensile specimens were taken from each plate tested.
Charpy testing of base metal, HAZ and weld metal was conducted as follows. All Charpy specimens were taken from the mid-thickness of the plate; weld-metal specimens were taken from the center line of the weld. Impact energies were determined at —50 F (—46 C). To include as much of the coarse-grained region as possible, HAZ Charpy specimens were notched at a location about Va in. (1.5 mm) from the intersection of the two weld beads, where the notch included 50% weld metal and 50% HAZ. All HAZ and weld metal tested was in the as-welded condit ion.
Hardness traverses of selected welds were made to determine base metal, HAZ and weld metal hardnesses.
A number of welds were studied using optical microscopy, both qualitative and quantitative, as well as SEM and TEM. The quantitative optical analysis was done with a TAS ("Texture Analyzing System," a quantitative metallographic device).
Results and Discussion
This section deals mainly wi th the results of the statistical analysis of
chemistry effects on the mechanical properties of base metal, HAZ and weld metal of heats made to the Box-Behnken design. Chemistry effects in the straight-Cb heats as well as the effects of cooling rate on notch toughness are then discussed.
Heats in Box-Behnken Design
A mult iple linear regression program was employed to determine the relationship of seven dependent variables to C, Cb and V. These variables were:
1. Base-metal yield strength (YS). 2. Base-metal ultimate tensile
strength (UTS). 3. Base-metal Charpy V-notch
(CVN) energy at - 5 0 F ( -46 C). 4. HAZ CVN energy at - 5 0 F ( -46
Q. 5. Weld-metal CVN energy at - 5 0 F
(-46 C) for 44/851 electrode/flux combination.
6. Weld-metal CVN energy at - 5 0 F (-46 C) for 120/0091 electrode/flux combination.
7. Weld-metal CVN energy at - 5 0 F (-46 C) for TB/121 electrode/flux combination.
The equation expressing the relationship was given the fol lowing form:
Dependent Variable = B„ + B, + B., (Cb) 4- B, (V) + B,, (C3) + (Cb3)" 4- B„ (V3) 4- B„ (C x Cb) 4-(C x V) + B.„ (Cb x V)
(C)
where C, Cb, and V = wt % of C, Cb and V in the base metal.
Two additional heats were made-0.08% C, 0.06% Cb, 0% V, and 0.18% C, 0.06% Cb and 0.10% V - o n the basis of the original analysis of the 15 heats in the Box-Behnken design. The data obtained from these heats were combined wi th those of the 15 original heats.
Table 3 represents the combined data; their analysis is given in Table 4, which presents the coefficients for each equation and also several statistical parameters associated wi th them—namely, the multiple correlation coefficient, the standard error of estimate, the F-ratio, and the fraction of the variance explainable by chance.
In the last column of Table 4, correlation is defined as: "excel lent" if P < 0.01, i.e., if > 99% of the variance can be explained by the C, Cb and V levels; " g o o d " for 0.01 < P < 0.05; and "fair" for 0.05 < P < 0.15. In one case, the toughness of the 44/851 weld metal, there was no meaningful correlation, P being 0.85. Consequently, the elements added from the welding consumables and/or their interaction with the base metal were probably more significant than the base-plate composit ion.
For easier understanding, a series of curves based on the regression data were plotted. For each dependent variable, nine curves of predicted isolevels
W E L D I N G RESEARCH SUPPLEMENT I 181-s

HAZ Toughness ft lb at - 5 0 F C = 0 . I 8 %
HAZ Toughness,ft-lb at - 5 0 F
0 0 . 1 3 %
0.03 COLUMBIUM
0.06 003 COLUMBIUM
0 0 6
Fig. 7-CVN energy levels at -50 F (-46 C) in ft-lb of HAZ for 0.08% C (multiply by 1.356 to get I)
Fig. 2-CVN energy levels at -50 F (-46 C) in ft-lb of HAZ for 0.13% C (multiply by 1.356 to get I)
0 10
HAZ Toughness f t - lb a t - 5 0 F C = 0 .08%
Fig. 3 (right)-CVN energy levels at -50 F (-46 C) in ft-lb of HAZ for 0.18% C (multiply by 1.356 to get I)
ot that variable were plotted. In three of the nine, C was held constant at 0.08%, 0.13% and 0.18%, and the isolev-els were plotted on a graph of Cb vs. V. Similarly, fixed levels of 0%, 0.03% and 0.06% Cb, and 0%, 0.05% and 0.10% V were plotted. Several of these curves are presented and discussed in the fol lowing sections.
Base Metal. Predicted yield strengths ranged from 52 to 77 ksi (359 to 531 MPa) and increased continuously wi th V. C did not have a significant effect; yield strength as a funct ion of Cb was maximum at about 0.04-0.05%. Tensile strength levels were in the 67 to 92 ksi range (462 to 634 MPa). The UTS increased wi th both C and V, its maximum also being at 0.04-0.05% Cb.
Toughness in the base metal at —50 F (-46 C) varied from about 25 to more than 110 ft- lb (39 to 150 )). It decreased with C and increased wi th Cb. V levels for maximum toughness depended on the C and Cb contents.
An optical metallographic examination showed that all heats consisted of
0 03 COLUMBIUM
0 0 6
a conventional polygonal ferrite structure wi th small amounts of pearlite.
Heat-Affected Zone. With in the range of compositions studied, HAZ toughness varied from 5 to about 70 ft-lb (7 to 95 )) at - 5 0 F ( -46 C). Toughness was found to decrease wi th C. Predicted HAZ trends show that at all C levels best results are obtained by adding either Cb or V, but not both.
As seen in Fig. 1, a heat containing 0.08% C, 0.06% Cb and no V should have a HAZ toughness of about 70 ft-lb (95 |) and one containing 0.08% C, 0.10% V, and no Cb should have a HAZ toughness of slightly more than 45 ft-lb (61 )). Thus, w i th reference to - 5 0
F (-46 C) HAZ toughness at least, Cb would be slightly preferable to V for this level of C.
For 0.08% C, the minimum toughness of about 34 ft-lb (46 )) is predicted to occur at 0.035% Cb and 0.10% V. Figure 2 shows that for 0.13% C the high-V heat is now predicted to be slightly tougher than the high -Cb heat, wi th a minimum at about 0.05% Cb and 0.10% V. The high-V heat is clearly better at 0.18% C, where Cb actually decreases toughness (Fig. 3), and the minimum occurs at 0.06% Cb and 0.10% V.
Metallographic examination of the coarse-grained region of the HAZ
182-s I JUNE 1979
Weld Metal l HAZ
m -fe-;' ; * f l
,..*;: ;-^».y«',....*, .- -; . <.-^..,r.r .
,: 3 > ^ A ~**! ' . ^ ^ t n * i ^ -**1;;
<kmm
••-AOP y--~"* >>..v; •iw:><s,u3-w(T^;;.
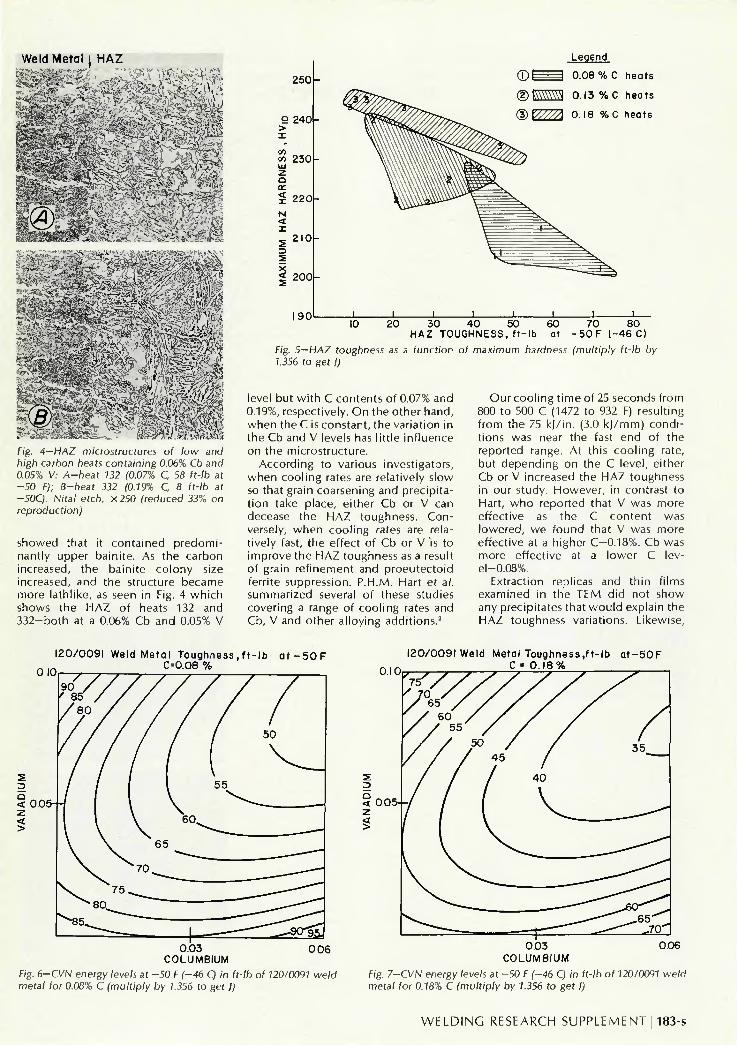
F/g. 4—HAZ microstructures of tow and high carbon heats containing 0.06% Cb and 0.05% V: A-heat 132 (0.07% C, 58 it-lb at -50 F); B-heat 332 (0.19% C, 8 ft-lb at -50C). Nital etch, X250 (reduced 33% on reproduction)
showed that it contained predominantly upper bainite. As the carbon increased, the bainite colony size increased, and the structure became more lathlike, as seen in Fig. 4 which shows the HAZ of heats 132 and 332-both at a 0.06% Cb and 0.05% V
250
o
> X
<n tn UJ 7-Q or < X N
< X
? -D i X
< ^
240
230
220
2 I 0
?or
I 9 0
Legend
0.08 %C heats
0.13 % C heats
(D V///A 0.18 %C heats
IO 20 30 40 50 60 HAZ TOUGHNESS, f t - lb at
70 80 - 5 0 F (-46 C)
Fig. 5—HAZ toughness as a function of maximum hardness (multiply ft-lb by 1.356 to get I)
level but wi th C contents of 0.07% and 0.19%, respectively. On the other hand, when the C is constant, the variation in the Cb and V levels has little influence on the microstructure.
According to various investigators, when cooling rates are relatively slow so that grain coarsening and precipitation take place, either Cb or V can decease the HAZ toughness. Conversely, when cooling rates are relatively fast, the effect of Cb or V 'is to improve the HAZ toughness as a result of grain refinement and proeutectoid ferrite suppression. P.H.M. Hart et al. summarized several of these studies covering a range of cooling rates and Cb, V and other alloying additions.3
Ourcool ing t ime of 25 seconds from 800 to 500 C (1472 to 932 F) resulting from the 75 k j / in . (3.0 k j /mm) conditions was near the fast end of the reported range. At this cooling rate, but depending on the C level, either Cb or V increased the HAZ toughness in our study. However, in contrast to Hart, who reported that V was more effective as the C content was lowered, we found that V was more effective at a higher C-0.18%. Cb was more effective at a lower C lev-el-0.08%.
Extraction replicas and thin films examined in the TEM did not show any precipitates that would explain the HAZ toughness variations. Likewise,
010
120/0091 Weld Metal Toughness,f t - lb a t - 5 0 F C=0.08 % 010
120/0091 Weld Metal Toughness,ft-lb a t - 5 0 F C = 0.18%
0.03 006 COLUMBIUM
Fig. 6-CVN energy levels at -50 F (-46 C) in ft-lb ol 120/0091 weld metal for 0.08% C (multiply by 1.356 to get I)
003 006 COLUMBIUM
Fig. 7-CVN energy levels at -50 F (-46 C) in ft-lb ol 120/0091 weld metal for 0.18% C (multiply by 1.356 to get I)
W E L D I N G RESEARCH SUPPLEMENT I 183-s
TB/121 Weld Metal Toughness,ft-lb at -C = 0.08%
5 0 F TB/121 Weld Metal Toughness,ft-lb C =018%
a t - 5 0 F
2
a < < >
0 0
0.03 COLUMBIUM
0.06 0 03 COLUMBIUM
0.06
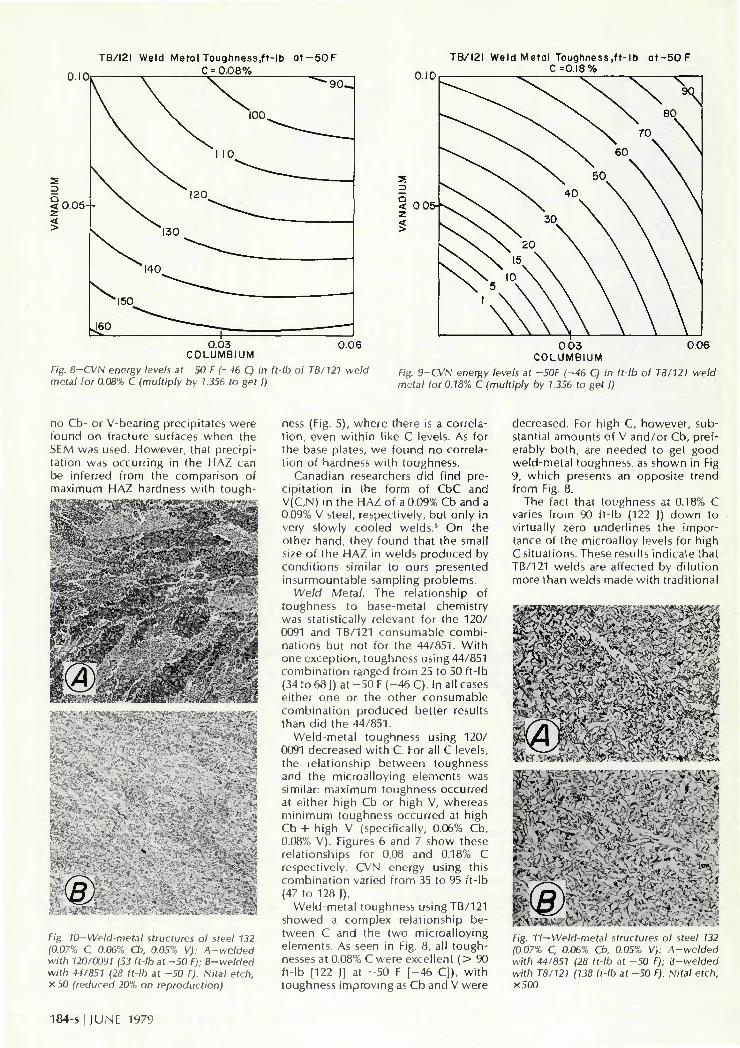
Fig. 8-CVN energy levels at -50 F (-46 C) in ft-lb of TB/121 weld metal lor 0.08% C (multiply by 1.356 to get I)
Fig. 9-CVN energy levels at -50F (-46 C) in it-lb of TB/121 weld metal for 0.18% C (multiply by 1.356 to get I)
no Cb- or V-bearing precipitates were found on fracture surfaces when the SEM was used. However, that precipitation was occurring in the HAZ can be inferred from the comparison of maximum HAZ hardness wi th tough-
§:m^'MM^M
Fig. 10-Weld-metal structures of steel 132 (0.07% C, 0.06% Cb, 0.05% V): A-welded with 120/0091 (53 ft-lb at -50 F); B-welded with 44/851 (28 ft-lb at -50 F). Nital etch, X50 (reduced 20% on reproduction)
ness (Fig. 5), where there is a correlat ion, even wi th in like C levels. As for the base plates, we found no correlation of hardness wi th toughness.
Canadian researchers did find precipitation in the form of CbC and V(C,N) in the HAZ of a 0.09% Cb and a 0.09% V steel, respectively, but only in very slowly cooled welds.3 On the other hand, they found that the small size of the HAZ in welds produced by conditions similar to ours presented insurmountable sampling problems.
Weld Metal. The relationship of toughness to base-metal chemistry was statistically relevant for the 120/ 0091 and TB/121 consumable combinations but not for the 44/851. Wi th one exception, toughness using 44/851 combination ranged from 25 to 50 ft-lb (34 to 68 )) at - 5 0 F (-46 C). In all cases either one or the other consumable combination produced better results than did the 44/851.
Weld-metal toughness using 120/ 0091 decreased wi th C. For all C levels, the relationship between toughness and the microalloying elements was similar: maximum toughness occurred at either high Cb or high V, whereas minimum toughness occurred at high Cb + high V (specifically, 0.06% Cb, 0.08% V). Figures 6 and 7 show these relationships for 0.08 and 0.18% C respectively. CVN energy using this combination varied from 35 to 95 ft-lb (47 to 128 |).
Weld-metal toughness using TB/121 showed a complex relationship between C and the two microalloying elements. As seen in Fig. 8, all toughnesses at 0.08% C were excellent ( > 90 ft-lb [122 |] at - 5 0 F [ -46 CJ), with toughness improving as Cb and V were
decreased. For high C, however, substantial amounts of V and/or Cb, preferably both, are needed to get good weld-metal toughness, as shown in Fig 9, which presents an opposite trend from Fig. 8.
The fact that toughness at 0.18% C varies from 90 ft- lb (122 J) down to virtually zero underlines the importance of the microalloy levels for high C situations. These results indicate that TB/121 welds are affected by di lut ion more than welds made wi th traditional
iM^uM^AKC-AA€A-fe-ii,/'':>sV;-'r;:^ r?> fcJfe
|pg A:^:^^.A--y>,: l&yA-^"M , , f # » > J -•••> •
Ar. • .yyy-yA^Aru-;xAA'^ .- .Ay V "' ''--*:'; iiZ'l »\PfA<l
.-T:< . i . v ...K,,,V.''. »\ . \ > W _ ' ' • • • ' . - \ - - • ; • * • ' : . . r ' -
Fig. 77—Weld-metal structures of steel 132 (0.07% C, 0.06% Cb. 0.05% V): A-welded with 44/851 (28 ft-lb at -50 F); B-welded with TB/121 (138 It-lb at -50 F). Nital etch, X500
184-s I |UNE 1979

consumables. Consequently, when using such t i tanium/boron consumable combinations, careful attention should be paid to the base-plate composition.
Weld-metal microstructures were examined for possible microstructural features that wou ld distinguish welds of good toughness from those of poor toughness.
The presence of proeutectoid ferrite at the prior austenite grain boundaries of weld metal produces a phenomenon known as veining—Fig. 10A. To determine whether there was any correlation between the amount of veining and toughness, the TAS was used to determine % veining in selected samples. Not only was no correlation found, but several samples actually showed no veining—Fig. 10B.
The structures between the proeutectoid veins were predominantly weld metal acicular ferrite. This feature is seen in Figure 11 (weld metal microstructures of steel 132 (0.07% C, 0.06% Cb, 0.05% V) welded wi th 44/851 and wi th TB/121). The weld metals had toughnesses of 28 and 138 ft- lb at - 5 0 F (38 and 187 J at - 4 6 C), respectively.
Although the trend for a whi le had been to stress that a good weld metal could be produced by simply avoiding proeutectoid ferrite in favor of acicular ferrite, our results show that the situa-
- ^ *y* *3
•ill''
A-,< vv* c if* fcSftA
y^'^y «^. ^ > . *?
yy-:*$^*, •
"r (* ' \ •A-K
^ A f . •'-J 1
•Xr. ' • — * &
, .-• "%l
A:"> •*vk •>
^Ster.. '
'8®A.A~: i**
i / I Vs- tvS wr; % V •• — • - •. c ;
^ ' ' \ A 4 )&-'-*+ « ' /,#«* • V» --?• - 2 . J 5^S^5J88P?yg^ / • ;
\V . •y
'(/
V i .
- i
>•
r(
* c
" —
<F
v""" f
75 @
f "V
^ :
i. * T-.,
I
\r •' ).".-^ "t
*V» * " . ' V
• i S
' l 4- " , —.
' A *V r * • ,— j
fr' t r "
. ( -. ,;. c c , V . ••."*
' • •' '- '
£
%
• ' 'ic
*\* • t \
Jt •> ~"
A-t *» **"
4,V
« - * . v1 V , >•
. - . *«*v.
« r * • -:- - ™ —
.4 .y -
*• y
F/g. 13—M-A phase in two welds in steel 132 (0.07% C, 0.06% Cb, 0.05% V): A-welded with 44/851 (28 It-lb at -50 F); B-welded with TB/121 (138 ft-lb at -50 F). 10% sodium metabisulfite, x 1000 (reduced 20% on reproduction)
Fig. 12— Two weld metal structures produced with TB/121: A-steel 312 (15 ft-lb at -50 F); B-steel 332 (95 ft-lb at -50 F). Nital etch, X500
tion is by no means that simple. Garland and Kirkwood had also made a similar point.3
Some investigators have considered that the coarsening of acicular ferrite may be a cause of poor toughness. Figure 12 shows two structures in which lath size may be a contributing factor to toughness. However, the quantitative analysis of lath size is not practical for such structures.
The martensite/austenite microcon-stituent known as M-A has been reported to be detrimental to weld-metal toughness.5 For this reason, we examined weld metal samples to determine the amount of M-A micro-phase present. The samples were examined at X1000 after etching with sodium metabisulfite, and the M-A feature is discernible in Fig. 13, which has the same weld metals as those shown in Fig. 11. As determined by the TAS, the percentages of the M-A phase in several welds (Table 5) point to a relation between this phase and toughness—specifically, the more M-A the lower the toughness.
Straight-Cb Steels
Four steels w e r e made w i t h Cb as t h e o n l y m i c r o a l l o y i n g e lemen t—Tab le 6. St rength and b o t h t he base meta l a n d H A Z toughnesses w e r e m a x i m i z e d in the 0.06-0.12% Cb range, whereas w e l d - m e t a l toughness was best at a b o u t 0.06% Cb.
M e t a l l o g r a p h i c exam ina t i ons s h o w e d very l i t t l e d i f f e rence a m o n g the w e l d me ta l a n d H A Z m ic ros t r uc tures of l o w - c a r b o n s t ra igh t -Cb steels of va ry ing toughness . As t he results i nd i ca te , w i t h t he p roper c o n s u m a b l e s and w e l d i n g c o n d i t i o n s , w e l d meta l t oughness shou ld not be a l i m i t i n g fac tor even in t he very h i g h - C b steels.
Effect of Weld Cooling Rate on Toughness
Tab le 7 shows that a decrease in c o o l i n g rate d u e to inc reas ing heat i npu t genera l ly leads t o poo re r t o u g h ness in the H A Z and w e l d m e t a l , an ef fect genera l ly n o t e d in the l i te ra tu re . In t he H A Z th is decreased toughness is associated w i t h a coarse-g ra ined reg i on that is b o t h w i d e r and coarser, t he s l ower t he c o o l i n g rate.
A l l coarse-g ra ined H A Z areas o b served w e r e p r e d o m i n a n t l y ba i n i t e , w i t h presence o r absence o f m a r t e n site and overa l l coarseness b e i n g t h e ma in d i s t i n g u i s h i n g features. For steel 231 (0.14% C, 0.06% Cb, 0% V) w e l d e d at 45 and 100 k j / i n . (1.8 and 3.0 k ) / m m ) , Fig. 14 s h o w s a typ ica l coarseg ra ined reg ion . At 100 k j / i n . (3.0 k|/ m m ) the s t ruc tu re is p r e d o m i n a n t l y upper ba in i t e , whereas at 45 k j / i n . (1.8 k j / m m ) a m i x t u r e o f l o w e r ba in i t e a n d mar tens i te is f o r m e d .
A m i c r o s c o p i c e x a m i n a t i o n i n d i ca ted that the a m o u n t of p r o e u t e c t o i d fe r r i te d i d increase, a l t h o u g h the TAS was unab le to de tec t a s ign i f i can t increase in t he a m o u n t o f v e i n i n g of 100 k j / i n . (3.0 k j / m m ) w e l d s as c o m p a r e d w i t h 45 k j / i n (1.8 k j / m m ) we lds . A lso , t he s t ruc tu re b e c a m e coarser at s l ow e r c o o l i n g rates.
These p h e n o m e n a can be seen in Figure 15, w h i c h shows the s t ruc tu re o f steel 151 (0.09% C, 0.15% C b , 0% V) w e l d meta l w e l d e d w i t h TB/121 at 45 and 100 k j / i n . (1.8 and 3.0 k j / m m ) .
Table 5—M-A Microphase in Weld Metal as Determined by TAS (%)—Comparison wi th Toughness
Base Metal
132 132 132 332 312
Composit ion,
C
0.07 0.07 0.07 0.19 0.18
Cb
0.06 0.06 0.06 0.07
0
% V
0.05 0.05 0.05 0.05 0.05
Weld consumables
44/851 120/0091 TB/121 TB/121 TB/121
M-A, %
11.7 11.5 6.5 5.9
13.9
CVN, ft- lb (]) al
- 5 0 F ( -46 C)
28 (38) 53 (72)
138 (187) 95 (129) 15 (20)
W E L D I N G R E S E A R C H S U P P L E M E N T I 185 -s
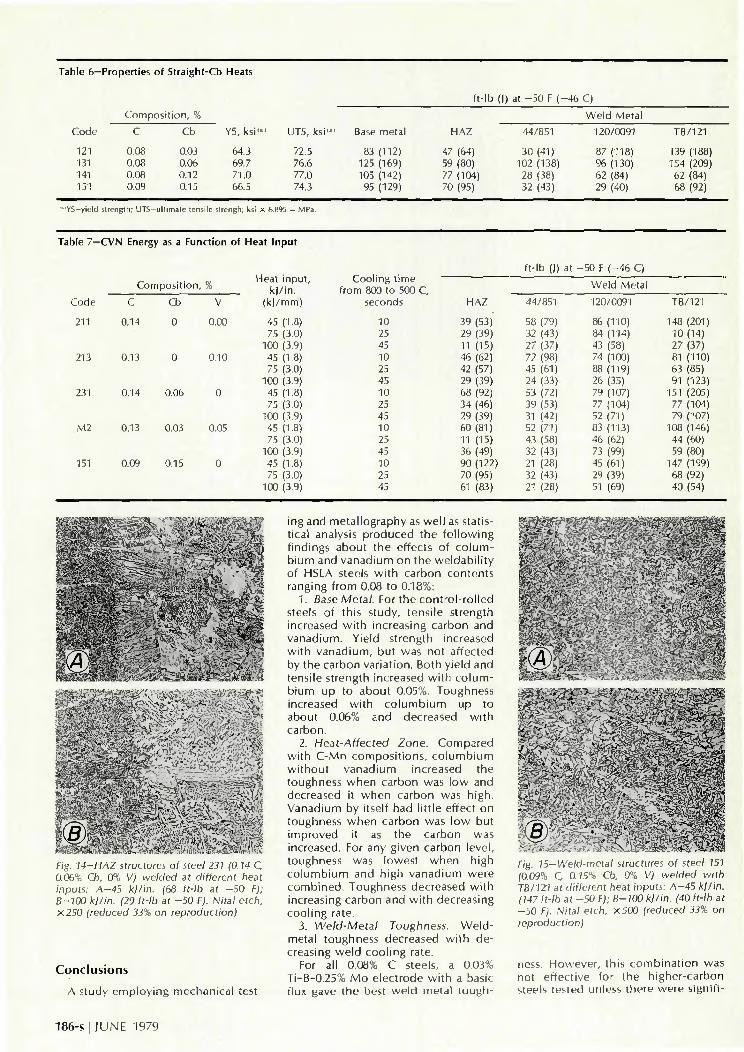
Table 6—Properties of Straight-Cb Heats
ft- lb (|) at - 5 0 F ( -46 C)
Code
121 131 141 151
'"YS-yield si
Comp
C
0.08 0.08 0.08 0.09
rength; UTS-
osition, %
Cb
0.03 0.06 0.12 0.15
ultimate tensile
YS, ksi'"
64.3 69.7 71.0 66.5
UTS, ks i " "
72.5 76.6 77.0 74.3
slrengh; ksi x 6.895 - MPa.
Base metal
83 (112) 125 (169) 105 (142) 95 (129)
HAZ
47 (64) 59 (80) 77 (104) 70 (95)
44/851
30 (41) 102 (138) 28 (38) 32 (43)
Weld Metal
120/0091
87 (118) 96 (130) 62 (84) 29 (40)
TB/121
139 (188) 154 (209) 62 (84) 68 (92)
Table 7—CVN Energy as a Function of Heat Input
Composit ion, %
Code C Cb y
211 0.14 0 0.00
213 0.13 0 0.10
231 0.14 0.06 0
M2 0.13 0.03 0.05
151 0.09 0.15 0
Heat input, k j / i n .
(k l /mm)
45 (1.8) 75 (3.0)
100 (3.9) 45 (1.8) 75 (3.0)
100 (3.9) 45 (1.8) 75 (3.0)
100 (3.9) 45 (1.8) 75 (3.0)
100 (3.9) 45 (1.8) 75 (3.0)
100 (3.9)
Cool ing t ime from 800 to 500 C,
seconds
10 25 45 10 25 45 10 25 45 10 25 45 10 25 45
ft- lb (|) at - 5 0 F ( -46 C)
Weld Melal
HAZ
39 (53) 29 (39) 11 (15) 46 (62) 42 (57) 29 (39) 68 (92) 34 (46) 29 (39) 60 (81) 11 (15) 36 (49) 90 (122) 70 (95) 61 (83)
44/851
58 (79) 32 (43) 27 (37) 72 (98) 45 (61) 24 (33) 53 (72) 39 (53)
31 (42) 52 (71) 43 (58)
32 (43) 21 (28) 32 (43) 21 (28)
120/0091
86 (110) 84 (114) 43 (58) 74 (100) 88 (119) 26 (35) 79 (107) 77 (104) 52 (71) 83 (113) 46 (62) 73 (99) 45 (61) 29 (39) 51 (69)
TB/121
148 (201) 10 (14) 27 (37) 81 (110) 63 (85) 91 (123)
151 (205) 77 (104) 79 (107)
108 (146) 44 (60) 59 (80)
147 (199) 68 (92) 40 (54)
&
y xA°> r-.yiysp*
•:.-Ah.^w-:><, Fig. 14—HAZ structures of steel 231 (0.14 C, 0.06% Ch, 0% V) welded at different heat inputs: A-45 kj/in. (68 It-lb at -50 F); B-100 kj/in. (29 ft-lb at -50 F). Nital etch, X250 (reduced 33% on reproduction)
C o n c l u s i o n s
A s tudy e m p l o y i n g mechan i ca l test
ing and m e t a l l o g r a p h y as w e l l as stat ist ica l analysis p r o d u c e d t h e f o l l o w i n g f i nd ings a b o u t t he ef fects of c o l u m b i u m and v a n a d i u m o n the w e l d a b i l i t y o f HSLA steels w i t h c a r b o n c o n t e n t s rang ing f r o m 0.08 to 0.18%:
1. Base Metal. For t he c o n t r o l - r o l l e d steels of th is s tudy , tens i le s t reng th increased w i t h increas ing c a r b o n a n d v a n a d i u m . Y ie ld s t reng th increased w i t h v a n a d i u m , b u t was no t a f fec ted by t h e c a r b o n va r i a t i on . Bo th y ie ld and tensi le s t reng th increased w i t h c o l u m b i u m up to a b o u t 0.05%. Toughness increased w i t h c o l u m b i u m up to abou t 0.06% and decreased w i t h ca rbon .
2. Heat-Affected Zone. C o m p a r e d w i t h C - M n c o m p o s i t i o n s , c o l u m b i u m w i t h o u t v a n a d i u m increased the toughness w h e n c a r b o n was l o w a n d decreased it w h e n c a r b o n was h igh . V a n a d i u m by i tself had l i t t l e ef fect o n toughness w h e n ca rbon was l o w bu t i m p r o v e d it as t h e c a r b o n was increased. For any g iven ca rbon leve l , toughness was lowes t w h e n h igh c o l u m b i u m and h igh v a n a d i u m w e r e c o m b i n e d . Toughness decreased w i t h increas ing ca rbon a n d w i t h decreas ing c o o l i n g rate.
3. Weld-Metal Toughness. W e l d -meta l t oughness decreased w i t h d e creasing w e l d c o o l i n g rate.
For all 0.08% C steels, a 0.03% T i -B -0 .25% M o e l ec t r ode w i t h a basic f lux gave the best w e l d m e t a l t o u g h -
yyy'yy - yy.'-yyytAyAA
Fig. 15—Weld-metal structures of steel 151 (0.09% C, 0.15% Cb, 0% V) welded with TB/121 at different heat inputs: A-45 kj/in. (147 ft-lb at -50 F); B-100 kjlin. (40 ft-lb at -50 F). Nital etch, X500 (reduced 33% on reproduction)
ness. H o w e v e r , th is c o m b i n a t i o n was not e f fec t i ve for Ihe h i g h e r - c a r b o n steels tes ted unless the re w e r e s ign i f i -
186-s I JUNE 1979
cant a m o u n t s o f t he m i c r o a l l o y i n g e l e m e n t s in t h e base me ta l .
T w o o the r c o n s u m a b l e c o m b i n a t i ons gave toughnesses greater t h a n 20 f t - l b (28 |) at - 5 0 F ( - 4 6 C) in all cases.
Acknowledgments
The au tho rs w i s h to t hank R. L. K ie fer fo r his he lp w i t h the e x p e r i m e n tal p o r t i o n o f th is p r o g r a m . The e d i t o rial c o m m e n t s o f B. S. M i k o f s k y are
great ly a p p r e c i a t e d , as is t he cr i t ica l r ev i ew of C. F. M e i t z n e r .
References
1. Box, G. E. P., and Behnken, D. W., "Some New Three Level Designs for the Study of Quanti tat ive Variables," Techno-metrics 2 (1960), pp. 455-475.
2. Hart, Peter H. M., et al., "The Weldability of Microal loyed Steels," Microalloying 75 Proceedings, Union Carbide, 1977, pp. 540-551.
3. Canadian Centre for Mineral and Energy Technology, Seminar "HAZ Toughness of Welded loints in Microal loy Steel," Ottawa, November 16, 1978.
4. Garland, |. G., and Kirkwood, P. R., "Toward Improved Submerged Arc Weld Metal , " Metal Construction 7(5), May 1975, pp. 275-283 and 7(6), June 1975, pp. 320-330.
5. Levine, E., and Hi l l , D. C , "A Review of the Structure and Properties of Welds in Columbium or Vanadium Containing High Strength Low-Alloy Steels," WRC Bulletin No. 213, February 1976.
Technical Note (Continued from page 178-s)
BY E. BETZ A N D H. K. LEUNG
sure vary near ly l inear ly w i t h the increase of h y d r o g e n i n p u t , bu t the d i f f u s i o n rate is q u i t e un respons i ve to t h e change .
The ef fect o f p r e h e a t i n g o n d i f f u s ion has also been inves t iga ted . The resul ts have i nd i ca ted that h igher in i t ia l t e m p e r a t u r e , espec ia l ly above 230 C (446 F), w o u l d acce lera te the h y d r o g e n d i f f u s i o n rate, a n d in conse q u e n c e , the m a x i m u m va lues w o u l d be l o w e r e d a n d a m o r e even d i s t r i b u t i on is o b t a i n e d .
A n o t h e r aspect is t h e poss ib i l i t y that hyd ros ta t i c pressure gene ra ted by the h y d r o g e n a lone c o u l d in i t i a te a tear. The results have s h o w n that th is is h igh l y un l i ke l y . A l l e n - B o o t h et a/.'3
suggest tha t , fo r th is t ype o f fa i l u re to occu r , the hyd ros ta t i c pressure w o u l d need to be o f t he same o rde r as the f rac tu re s t reng th o f the ma te r i a l , and in th is case is equ i va len t t o a h y d r o stat ic pressure o f 2800 a tmospheres . Such a pressure can o n l y be ach ieved t h r o u g h an excep t i ona l l y h i gh h y d r o gen i n p u t o f 40 c c / 1 0 0 d e p . me ta l t o g e t h e r w i t h an extra l o w f rac t i ona l v o i d v o l u m e of 0.02%. The p r o b a b i l i t y o f th is c o m b i n a t i o n of rare events is surely l o w . This imp l ies tha t hyd ros ta t ic pressure can o n l y play a s u p p o r t i n g ro le in t he f rac tu re process.
In regard to t he c o n t r i b u t i o n of h y d r o g e n to t h r o u g h - t h i c k n e s s d u c t i l i ty loss D L „ re fe rence is m a d e to the two -s tage poss ib i l i t y tear ing process. Results s h o w that h y d r o g e n c o n t r i b utes l i t t l e to d u c t i l i t y loss in an early stage fa i lu re as substant ia l h y d r o g e n c o n t e n t has not yet d i f f used to the
suscept ib le reg ion . But at t he later stage fa i lu re poss ib i l i t y , it is f o u n d that t he f o l l o w i n g th ree fac tors b e c o m e re levant , n a m e l y , t h r o u g h - t h i c k n e s s d u c t i l i t y , b o u n d a r y restra ints, and hyd r o g e n e m b r i t t l e m e n t , w h i c h bear equa l respons ib i l i t i es in t he loss of d u c t i l i t y . From th is analysis, it is c o n c l u d e d that h y d r o g e n can on l y play a s u p p o r t i n g ro le in lamel la r tearing.
C o n c l u s i o n
A m a t h e m a t i c a l m o d e l is g iven w h i c h enab les the i n t e rac t i on bet w e e n t e m p e r a t u r e , h y d r o g e n d i f f u s ion and stress-strain levels t o be s t u d ied q u a n t i t a t i v e l y , for t yp i ca l w e l d e d -jo in t s , w h e n the j o i n t is b e i n g w e l d e d . T h r o u g h va ry ing t he re la ted pa rameters, the s ign i f i cance of h y d r o g e n has been revealed in t he c rack ing process o f lamel la r tea r ing , and it was s h o w n that the h y d r o g e n e f fec t , in the f o r m of hyd ros ta t i c pressure or d u c t i l i t y loss, c a n n o t o n its o w n i n i t i a te a tear. Thus it is c o n c l u d e d tha t , in lamel la r t ea r i ng , h y d r o g e n is no t t he p r i m e fac tor caus ing fa i l u re , bu t plays a s u p p o r t i n g ro le on l y .
References
1. Kumar, Rajendra, Physical Metallurgy of Iron and Steel, Asia Publishing House, 1968.
2. Hall, E.O., Yield Point Phenomena in Metals and Alloys, MacMil lan Co Ltd., 1970.
3. St. lohn, C , and Gerberich, W.W.,
"The Effect of Loading Mode of Hydrogen Embrit t lement," Metallurgical Transactions, 4, Feb. 1973, p. 589-594.
4. Watanabe, M., "The Pull-Out Type Fracture in Rolled Steel Plates," Proc. of a Symposium on Welding in Ship Building, London, 30th Oct. to 3rd Nov. 1961, The Welding Institute, 1962, pp. 219-225.
5. Hewit t , )., Hydrogen in Steel, ISI Special Report 73, London, 1962, p. 83-89.
6. Nicholls, D.M., "An Investigation of Lamellar Tearing," D.A.E. Thesis, Cranfield Institute of Technology, Sept. 1966, 121
PP-7. Bellen, A., Spanraft, |. and van der
Veen, J.H., "Some Steelmakers' Experience on Improving the Resistance of Steel Plate to Lamellar Tearing," IIW Doc. IX-778-72, 1972, 9 pp.
8. Nishio, Y., Yamamoto, Y., Kajimoto, K. and Hirozane, T., " O n the Lamellar Tearing in Mul t i run Fillet Welds," Mitsubishi Heavy Industries Technical Review, 9, (3), 1972, pp. 19-27.
9. Ochiai , S., Yoshinaga, S., and Kikuta, Y. "Formation of Stress (Strain)—Induced Diffusion of Hydrogen and its Solution by Computer-Aided Finite Element Method , " Trans, japan Iron and Steel Institute, 15, 1975, pp. 503-507.
10. Al len-Booth, D.M., and Hewit t , )., "A Mathematical Model Describing the Effects of Micro-Voids upon the Diffusion of Hydrogen in Iron and Steel," Acta Metallur-gica, 22, Feb. 1974, pp. 171-175.
11. Kauzmann, W., Thermal Properties of Matter, Volume I—Kinetic Theory of Gases, W.A. Benjamin, Inc., New York, 1966, p. 74.
12. Al len-Booth, D.M., Atkinson, C , and Bilby, B.A., "A Numerical Solution of the Diffusion Equation Resulting from the Void Theory of the Trapping of Hydrogen in Iron and Steel," Acta Metallurgica, 23, March 1975, pp. 371-376.
W E L D I N G R E S E A R C H S U P P L E M E N T I 187-s

Now Available . . . WRC Bulletin 246
February 1979
Interpretive Report on Dynamic Analysis of Pressure Components
This interpretive report has been prepared by the Pressure Vessel Research Committee, Subcommittee on Dynamic Analysis of Pressure Components.
The intent in writing this report was to summarize, in one document, a brief background description of areas of concern to the Subcommittee as well as information currently available to industry and to assist in determining the course of research this Subcommittee will undertake in the future.
The Subcommittee in developing this report has associated the current topics with the Subcommittee Task Group assignments. Each topic has been written so that it can be read in its entirety without having cross references to other topics. This was done for clarity and to develop a procedure for inclusion of future work of the Pressure Vessel Research Committee. Subcommittee on Dynamic Analysis of Pressure Components.
Publication of this bulletin was sponsored by the Pressure Vessel Research Committee of the Welding Research Council.
The price of WRC Bulletin 246 is $10.00 per copy. Orders should be sent with payment to the Welding Research Council, 345 East 47th St., New York, NY 10017.
Also R e c e n t . .
Weldability of Steels Third Edition
by the Welding Research Council
The third edition of the book Weldability of Steels was published to update the information and make the book available again.
Special credit is given to Messrs. C. W. Ott and D. J. Snyder of the U. S. Steel Corporation for updating the appendix that contains the table "Steel Compositions with Suggested Practices Generally Required for Sound Welding" and the "Index of Steels in the Weldability Table." This information should be of value to all engineers concerned with welding.
The price of this book is $18.00. Orders should be sent with payment to the Welding Research Council, 345 East 47th St., New York, NY 10017.
WRC Bulletin 242 October 1978
Fatigue Behavior of 5000 Series Aluminum Alloy Weldments in Marine Environment
by W. W. Sanders, Jr. and K. A. McDowell
The report represents the results of a study of the fatigue behavior of 5000 series aluminum alloy weldments submerged in seawater. Tests were conducted on plain plate, transverse butt-welded and longitudinal butt-welded specimens of 5086-H116, 5456-H11G and 5456-H117 aluminum alloys.
Supplemental tests were conducted, including fatigue tests of six plain plate specimens of ABS Class C Steel. Studies also include the measurement of weld angles at the point of crack initiation in welded specimens, finite element analysis of a typical butt-welded shape, distribution of residual stresses and weld quality evaluation.
Publication of this bulletin was sponsored by the Aluminum Alloys Committee of the Welding Research Council.
The price of WRC Bulletin 242 is $7.00 per copy. Orders should be sent with payment to the Welding Research Council. 345 East 47th St., Room 801 , New York, NY 10017.
188-s I JUNE 1979