Embed Size (px)
Citation preview
CHAPTERS
EFFECT OF COIR GEOTEXTILES ON BEARING CAPACITY
8.1 GENERAL
One of the important functions of geotextiles is to increase thc bearing capacity of the
soil. The reinforcement effect is achieved either by micro reinforcement or by macro
reinforcement. In the former, the reinforcement of the soil is achieved by mixing it
with randomly oriented fibres. This aspect has been discussed in detail in Chapter 12.
Macro reinforcement on the other hand, consists of placing reinforcing elements such
as strips, bars, sheets, grids, cells, etc. in the soil. This can be placed in single layer or
in multiple layers. In many cases roads and embankments are subjected to
submergence and the soil will be in saturated conditions. To know the effectiveness of
coir geotextiles in such situations it is necessary to carry out experimental studies in
saturated conditions also. In the present investigation the possibility of utilizing coir
geotextiles as reinforcement is explored by conducting studies on square footings
resting on coir geotextile reinforced sand beds, both in dry and saturated conditions.
8.2 BACKGROUND
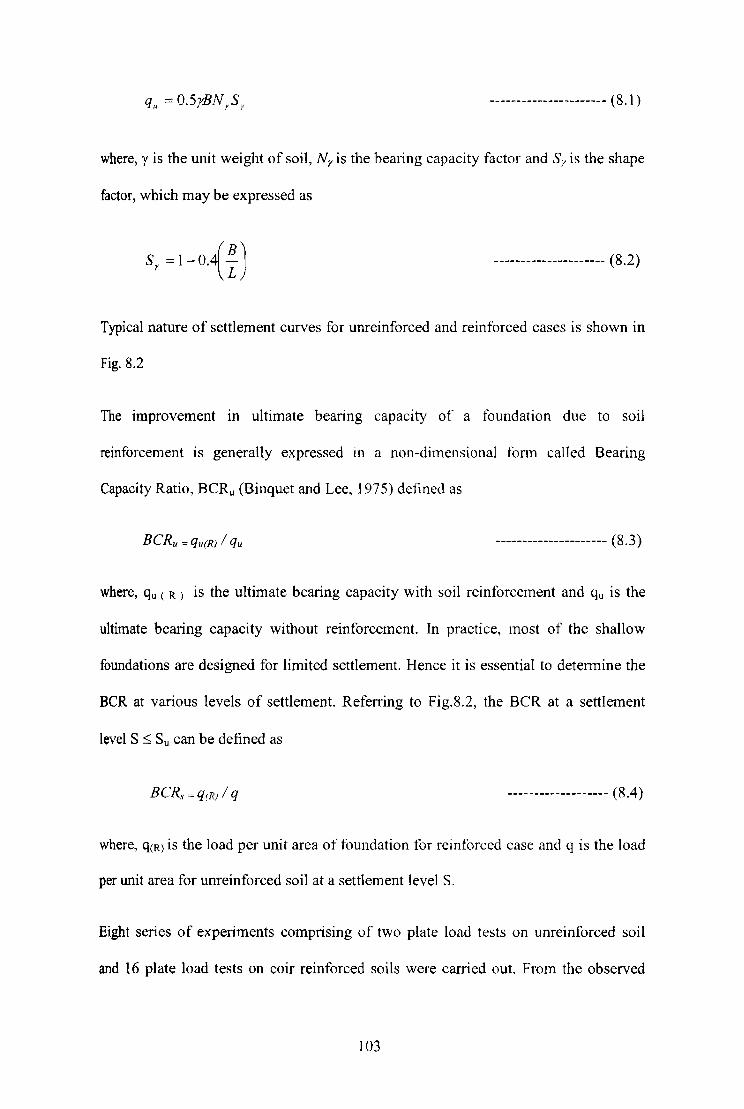
Consider a square footing of size B x B resting on coir geotexrile reinforced sand bed,
which is subjected to an intensity of loading' q' as shown in Fig. X.). The depth of the
sand bed is 'Z' and the coif geotextile is placed at a depth 'z' below the footing. The
ultimate bearing capacity of foundation can be givcn by the following equation
(Vesic, 1973)
---------------------- (8.1)
where, y is the unit weight of soil, N y is the bearing capacity factor and Si'is the shape
factor, which may be expressed as
--------------------- (8.2)
Typical nature of settlement curves for unreinforced and reinforced cases is shown in
Fig. 8.2
The improvement in ultimate bearing capacity of a foundation due to soil
reinforcement is generally expressed in a non-dimensional tonn called Bearing
Capacity Ratio, BCRu (Binquet and Lee, 1975) defined as
--------------------- (8.3)
where, qu ( R) is the ultimate bearing capacity with soil reinforcement and qu is the
ultimate bearing capacity without reinforcement. In practice, most of the shallow
foundations are designed for limited settlement. Hence it is essential to determine the
BeR at various levels of settlement. Referring to Fig.8.2, the BCR at a settlement
level S S; Su can be defined as
------------------- (8.4)
where, q(R) is the load per unit area of foundation for reinforced case and q is the load
per unit area for unreinforced soil at a settlement level S.
Eight series of experiments comprising of two plate load tests on unreinforced soil
and 16 plate load tests on coir reinforced soils were carried out. From the observed
103
data. applied pressure versus settlement curves were plotted and presented for each
test. Variations of BeR for different coir geotextiles placed at different levels under
dry and saturated conditions were studied.
q
Foo\in~
r z
1 Fig. 8.1 Square footing supported by coir geotextile reinforced saod bed
s
Su (Rl ~
Load Intensity (q ) q u q R
•
• \ \""
Vnreinforced /' soi l
(
q u\R , -
Coir Geotexti le Reinforced so il
Fig. 8.2 Typical pressure settlement curves (or unrein(orccd and
coir geotextiJe reinforced sand supporting a square rooting
104
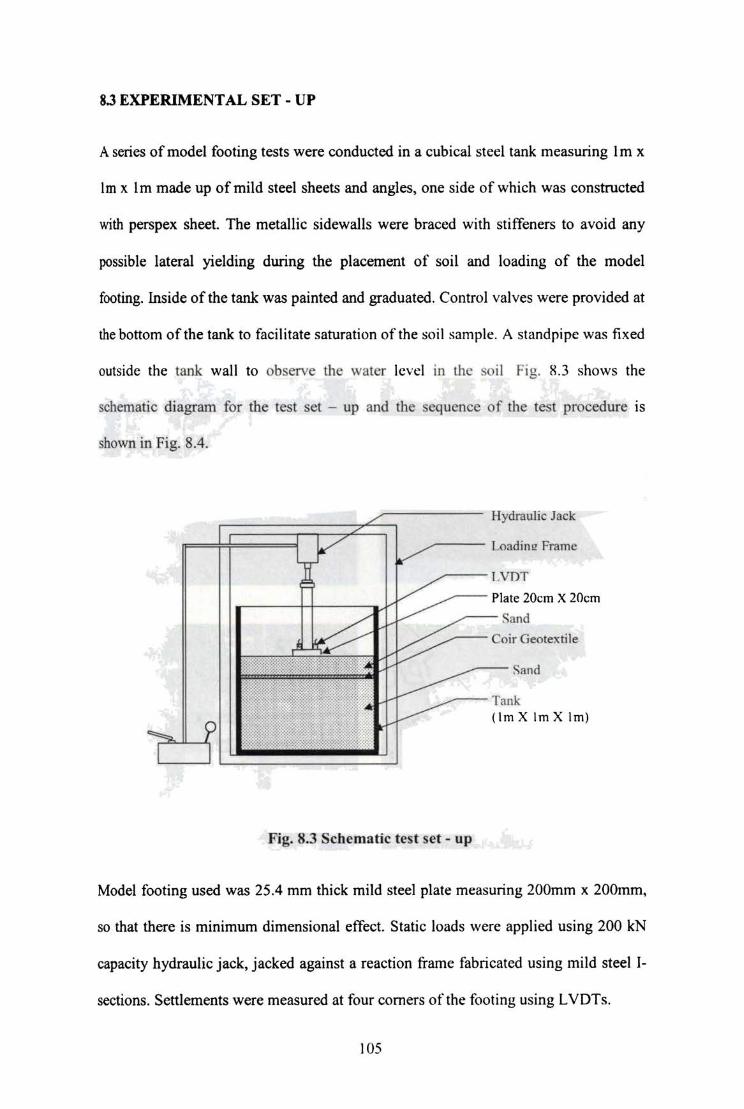
83 EXPERIMENTAL SET - UP
A series of model footing tests were conducted in a cubical steel tank measuring Im x
Im x Im made up of mild steel sheets and angles, one side of which was constructed
with perspex sheet. The metallic sidewalls were braced with stiffeners to avoid any
possible lateral yielding during the placement of soil and loading of the model
footing. Inside of the tank was painted and graduated. Control val ves were provided at
the bottom of the tank to facilitate saturation of the so il sample . A standpipe was fixed
outside the tank wall to observe the water level in the soil Fig. R.3 shows the
schematic diagram for the test set - up and the sequence of the test procedure is
shown in Fig. 8.4.
==~~~~;;;jr=t:7:Z=:~1==== Hydraulic Jack ~ /--- Loadille Fmmc
>.., ;::;; ..
____ -- LVDT
___ -- Plate 20cm X 20cm
.----- Sand
___ -- Coir Geotextile
~--Sand
___ --Tank
(ImX Im X Irn)
Fig. 8.3 Schematic test set - up
Model footing used was 25.4 mm thick mild steel plate measuring 200mm x 200mm,
so that there is minimum dimensional effect. Static loads were applied using 200 kN
capacity hydraulic jack, jacked against a reaction frame fabricated using mild steel 1-
sections. Settlements were measured at four corners of the footing using LVDTs.
105
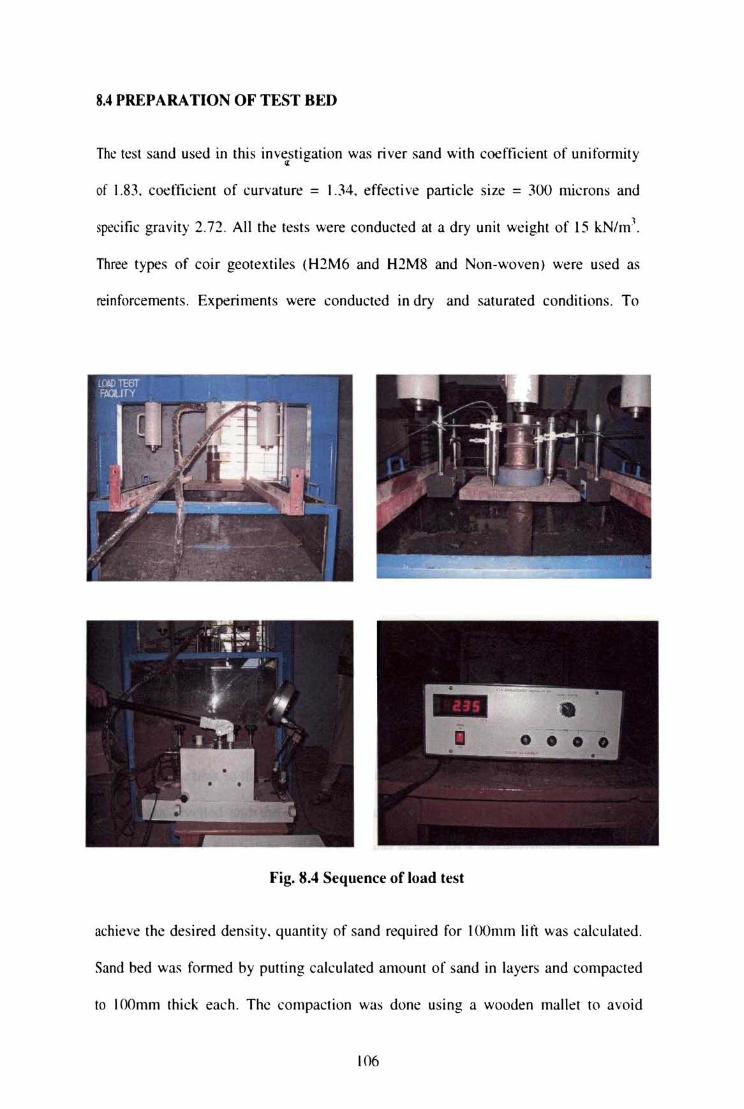
8.4 PREPARA nON OF TEST BED
The test sand used in thi s investi gation was ri ver sand with coeffi cienl of uni fo rmity •
of 1.83. coefficient of curvalUre = 1.34. effecti ve panicle size :::: 300 microns and
s~ci fic gra vity 2.72. All the tests were conducted al a dry unit weight o f 15 kN/m'.
Th ree Iypes of eoir geotex liles (H1M6 and H2M8 and Non-wove n) were used as
reinforcement s . Ex periments were conducted in dry and saturated conditions. To
Fig. 8.4 Sequence of load test
achieve the desired densit y, quanlit y of sand required for 100 mm lift was calculated.
Sand bed was fomlcd by putting calc ula ted amount o f sand in layers and compac ted
to l 00mm thid each. The compaclion was done uSing a wooden malle t to avoid
106
crushing of sand particles. To saturate the soil. water was allowed to tlow in the
upward direction by operating the control valves provided at the bottom of the tank.
Water level in the soil could be seen from the standpipe provided outside the tank
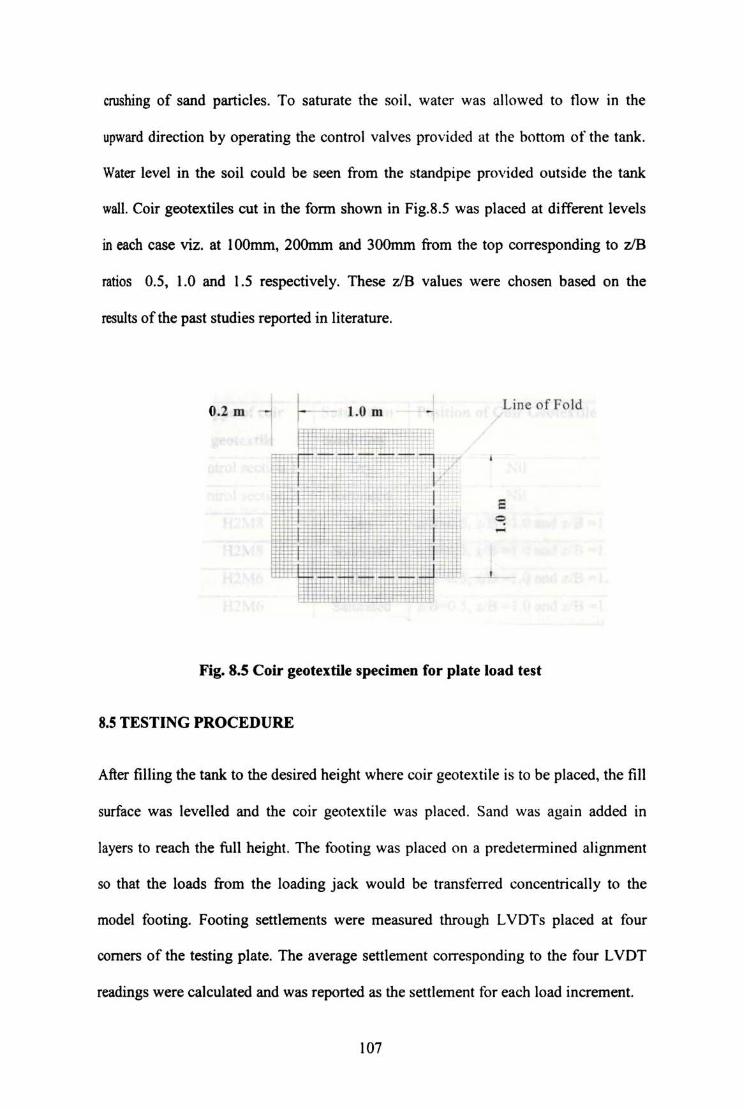
wan. Coir geotextiles cut in the fonn shown in Fig.8.5 was placed at different levels
in each case viz. at lOOmm, 200mm and 300mm from the top corresponding to zIB
ratios 0.5, 1.0 and 1.5 respectively. These vB values were chosen based on the
results of the past studies reported in literature.
0.2 m I 1.0 m
tUF,...i;if
Line of Fold
Fig. 8.S Coir geotextile specimen for plate load test
8.S TESTING PROCEDURE
After filling the tank to the desired height where coir geotextile is to be placed. the fill
surface was levelled and the coir geotextile was placed. Sand was again added in
layers to reach the full height. The footing was placed on a predetennined alignment
so that the loads from the loading jack would be transferred concentrically to the
model footing. Footing settlements were measured through L VDTs placed at four
corners of the testing plate. The average settlement corresponding to the four L VDT
readings were calculated and was reported as the settlement for each load increment.
107
The footing was loaded at a constant loading rate until ultimate state was reached. It
may be noted that the tests were conducted under stress-controJIed conditions, and the
post failure behaviour was not recorded. Before starting a new test entire sand in the
tank from the previous test was removed and fresh sand was placed in lifts of 100mm.
While conducting tests under saturated conditions, the soil bed was saturated and kept
for three days before testing. Details of the model tests carried out are given in Table
8.1.
Table 8.1 Details of model tests conducted
Series Type of coir Saturation Position of Coir Geotextile
geotextile condition
1 Control section 1 Dry Nil
2 Control section 2 Saturated Nil
3 H2M8 Dry z/B=0.5, zlB =1.0 and z/B =1.5
4 H2M8 Saturated z/B=0.5, z/B = 1.0 and zlB =1.5
5 H2M6 Dry I z/B=0.5. zlB =1.0 and z/B =1.5 -----------
6 H2M6 Saturated ziB=O.5, ziB = 1.0 and z/B = 1.5
7 Non-woven Dry z/B=0.5, z/B =1.0 and z/B =1.5
8 Non-woven Saturated z/B=0.5, z/B =1.0 and z/B =1.5
8.6 TEST RESULTS AND DISCUSSION
The improvement in bearing capacity due to the proVISIon of cOlr geotextile
reinforcement is represented usmg a non dimensional parameter, BeRs which is
defined as the ratio of footing pressure with reinforcement at a given settlement (qR)
to the corresponding pressure on the unreinforced soil (q) at the same settlement. The
results of experiments using three types of coir geotextiks placed at three embedment
levels in dry and saturated conditions are discussed belo\v. In general it was observed
108
.that the deformation reduced considerably by the use of coir geotcxtile both in dry and
saturated conditions.
8.6.1 Variation of Bearing Capacity with z/B
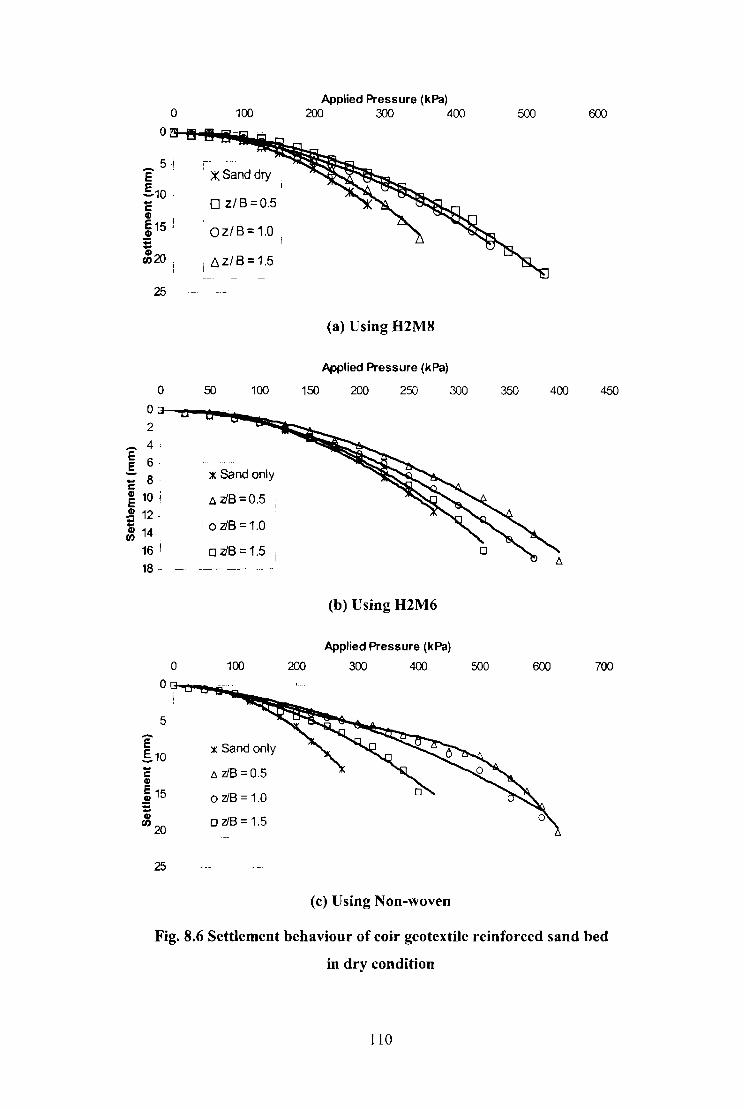
The variations of the applied pressure with settlement of the footing for various values
ofz/B obtained from the laboratory model tests on coir geokxtik reintorced sand bcd
in dry condition are shown in Fig. 8.6.
It could be observed from Fig. 8.6 that the load carrying capacity of sand reinforced
with H2M8 coir geotextile placed at 100mm, 200mm and 300mm from the top (z/B =
0.5, z/B = J.O and z/B = 1.5) increased by 36%, 30% and 9% respectively for a
settlement of 10mm. The corresponding increases in the bearing capacity with non
woven coir geotextile were 80%, 75% and 32% and thosc with H2M6 coir geotextile,
this increase was 22%, 12% and 3% respectively. In dry condition it was observed
that the percentage increase in the load carrying capacity was increased in the order of
22% to 80% for z/B value of 0.5 with different geotextilcs. It could be seen from the
plots that for tests conducted on unrcinforced sand and reinf()rccd sand with z/B 2:: I,
the magnitudes of settlement in reinforced and unreinforced cases were approximately
equal. However for z/B < 1, the foundation settlement at the ultimate load was
reduced by 1.5 to 2.0 times that obtained from the test on unreinforced soil.
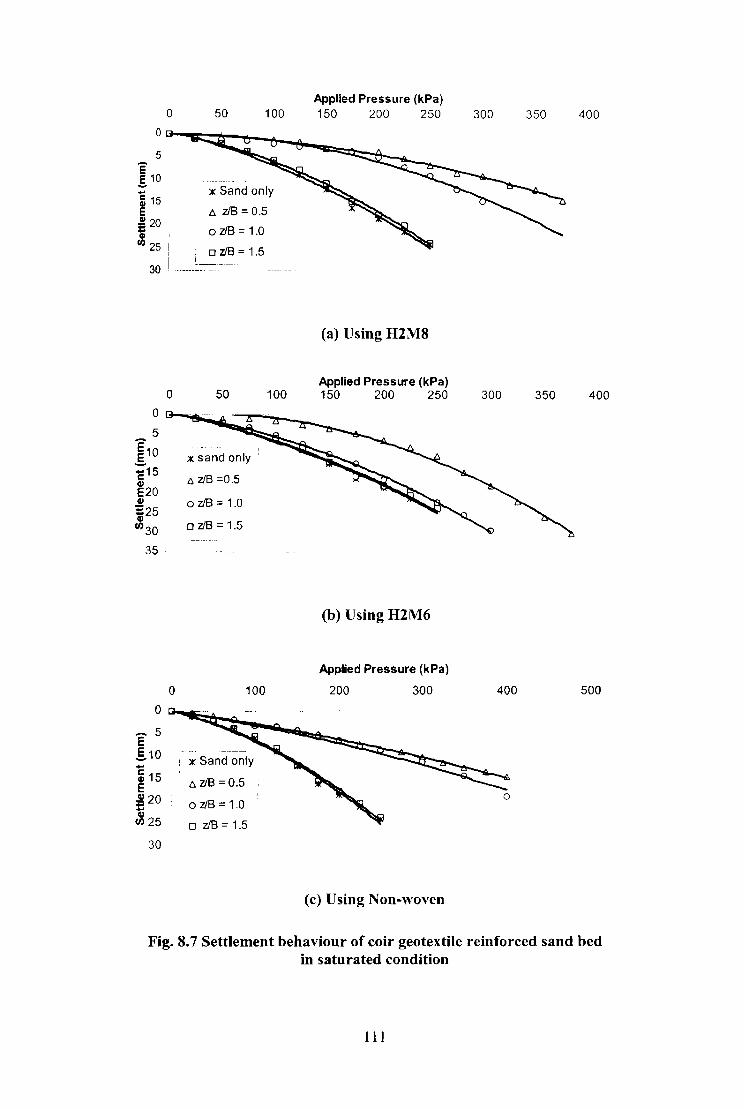
The pressure deformation response of tests conducted with COl[ geotextiles in
saturated condition is shown in Fig. 8.7 for H2M8, H2M6 and NW. The pressure
settlement plot for the model foundation supported by unreinforced sand is also
shown in these figures. In saturated condition it was observed that the pressure
settlement plots were almost coinciding, showing only nominal increase in the load
109
Applied Pressure (kPa) o 100 200 300 400
:~-! ~,-~~~~ E - , ::( Sand dry
E..10 -'E 0 z/B=O.5 Gl -E 15 J CD 0 zl B = 1.0 ;::
~20 i 6z/B = 1.5
25
(a) Using H2M8
Applied Pressure (kPa)
o 50 100 150 200 250 300
~ ~-&--e-~~ ....... E 4 ' !. 6 'E 8-E 10 J
.! 12-t: ~ 14
16 I
18 -
0
5
E E..10 -c Cl)
E 15 ~ q; en 20
25
0
i X Sand only
A~B=O.5
! o~B=1.0
o ~B = 1.5
100
;( Sand only
t.~B=0-5
o zlB = 1.0
o zlB = 1.5
(b) Using H2M6
Applied Pressure (kPa)
200 300 400 500
(c) Using Non-woven
500 600
350 400 450
600 700
Fig. 8.6 Settlement behaviour of coir geotextile reinforced sand bed
in dry condition
110
e .§. 10
~ 15 E .!! 20 =
o
GI I
Cl) 25 I I
30 I
o
0
0
5 E .§. 10 -~15 E ~20 -~25
30
50 100
x Sand only
11 zJB;:: 0.5
o zl8;:: 1.0
o zl8 = 1.5
50
x sand only!
11 zl8 =0.5
o zl8;:: 1.0
o zl8;:: 1.5
100
x Sand only
11 zl8 = 0.5 I
o zl8;:: 1.0
o zJB = 1.5
100
Applied Pressure (kPa) 150 200 250
(a) Using H2M8
Applied Pressure (kPa) 150 200 250
(b) Using H2M6
Applied Pressure (kPa)
200 300
(c) Using Non-woven
300 350 400
300 350 400
400 500
o
Fig. 8.7 Settlement behaviour of coir geotextile reinforced sand bed in saturated condition
III
carrying capacity when coir geotextiles were placed at Z/B = 1.5
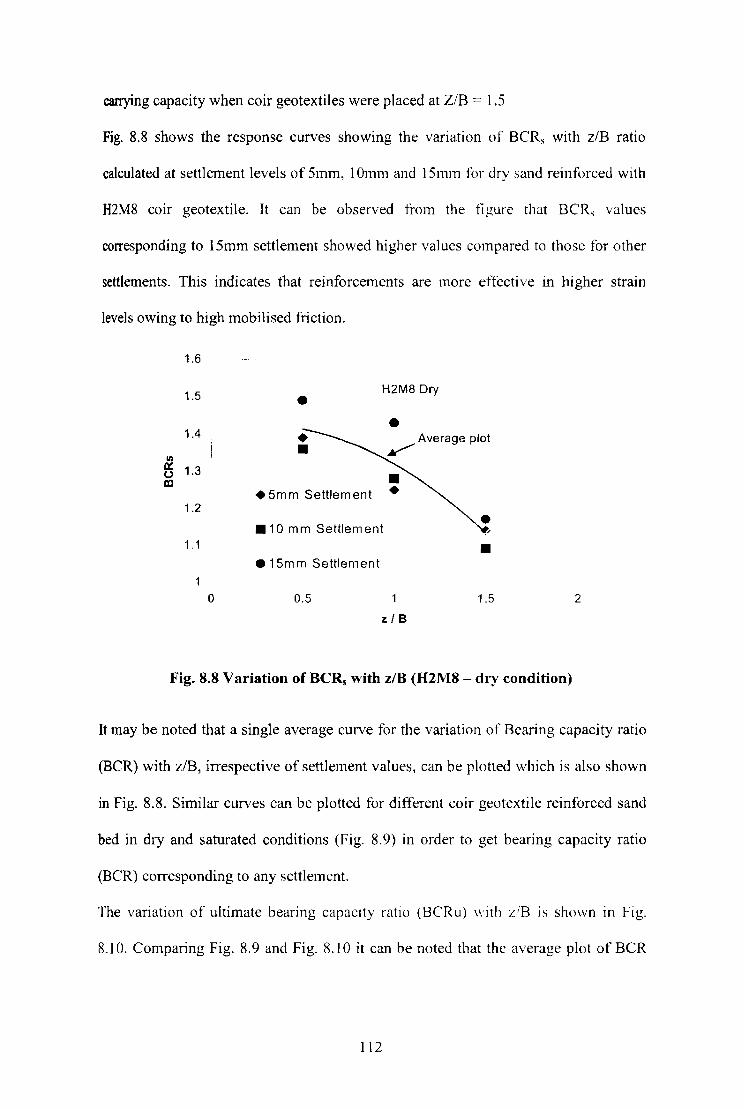
Fig. 8.8 shows the response curves showing the variation of BCRs with z/B ratio
calculated at settlement levels of 5mm, 10mm and 15mm for dry sand reinforced with
H2M8 coir geotexti1e. It can be observed from the figure that BeR, values
corresponding to 15mm settlement showed higher values compared to those for other
settlements. This indicates that reinforcements are more effective in higher strain
levels owing to high mobilised friction.
1.6
1.5 • H2M8 Dry
• 1.4
I/)
a:: 1.3 (,) ID
• 5m m Settlem en t 1.2
• 10 mm Settlement • , 1.1 • e15m m Settlement
0 0.5 1.5 2
z/B
Fig. 8.8 Variation of BCRs with z/B (H2M8 - dry condition)
It may be noted that a single average curve for the variation of Bearing capacity ratio
(BCR) with z/B, irrespective of settlement values, can be plotted which is also shown
in Fig. 8.8. Similar curves can be plotted for different coir geotextile reinforced sand
bed in dry and saturated conditions (Fig. 8.9) in order to get bearing capacity ratio
(BCR) corresponding to any settlement.
The variation of ultimate bearing capacity ratio (BCRu) with ziB is shown in Fig.
8.10. Comparing Fig. 8.9 and Fig. S.10 it can he noted that the average plot of BeR
112
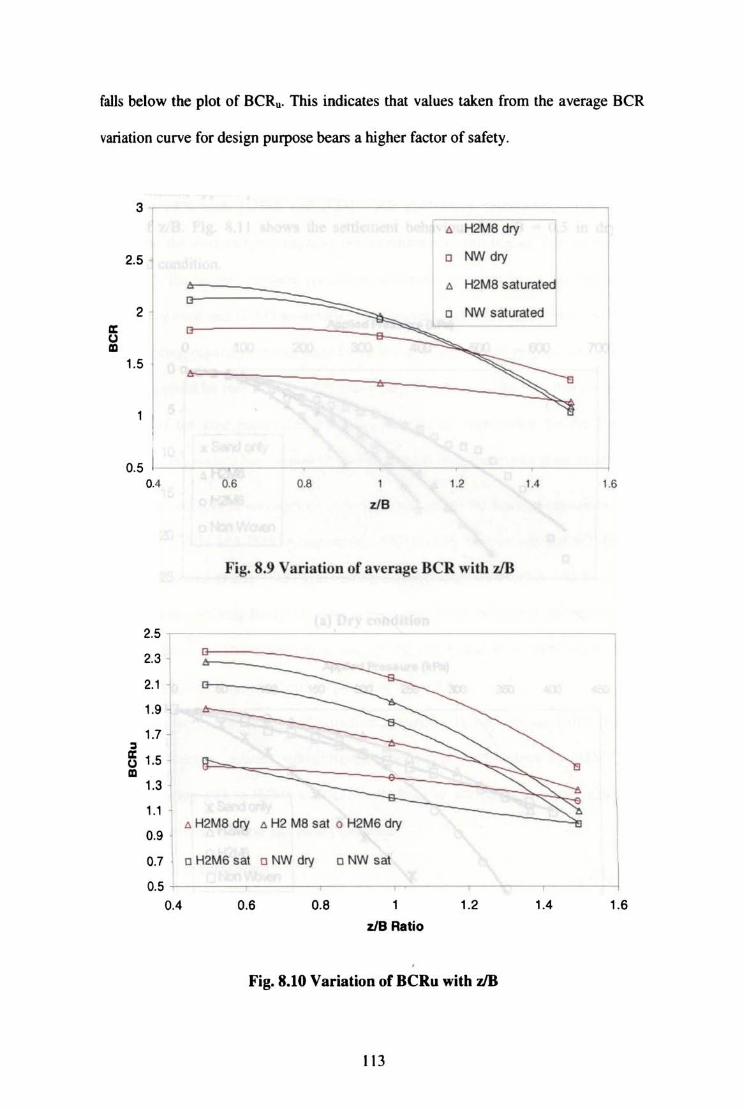
falls below the plO( of BCRu. This indicates that values taken from the average BeR
variation curve for design purpose bears a higher factor of safety.
3
• H2M8 dry
2.5 c NW dry
A H2M8 saturated
2 c NW saturated a:
" III 1.5
05 I J 0.4 0.6 0.8 1.2 1.4 1.6
zJB
Fig. 8.9 Variation of average Be R with zIB
2.5 -.--
2.3
2.1
1.9
1.7 , a:
15 1 " III 1.3 i 1.1
0 9 j 0.7
A H2M8 dry A H2 M8 sat 0 H2M6 dry
c H2M6 sat c NW dry c NW sat
0.5 0.4 0.6 0.8 1 1.2 1.4 1.6
zIB Ratio
Fig. 8.10 Variation of BCRu with VB
1\3
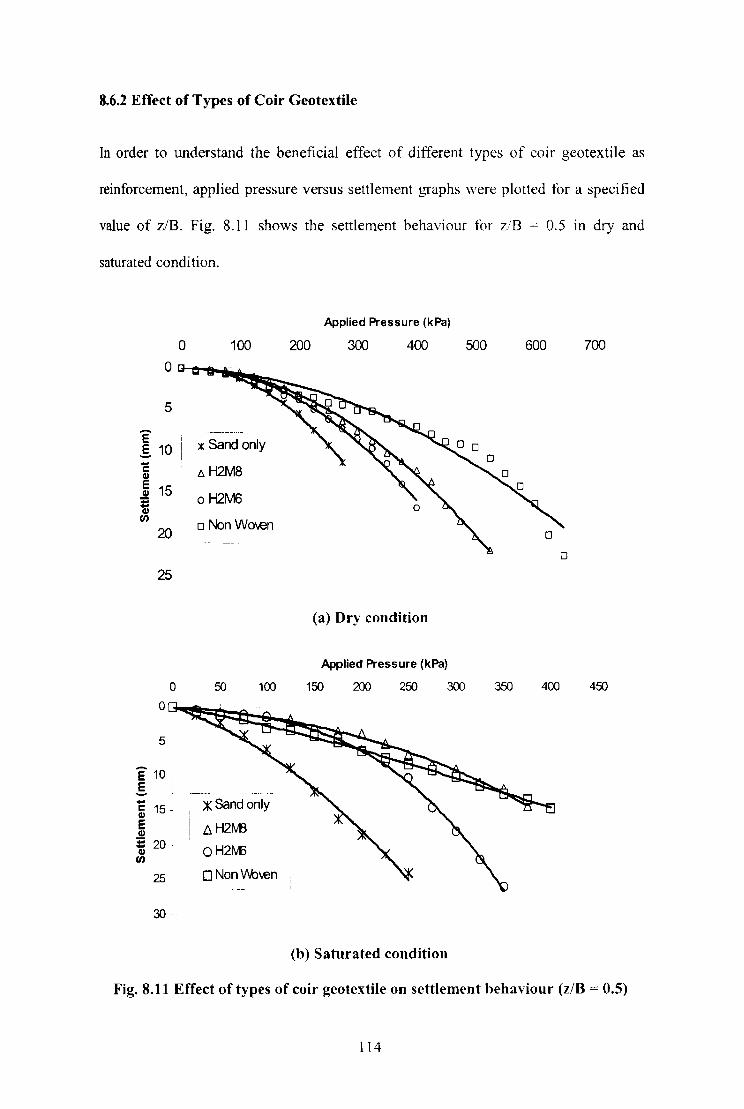
8.6.2 Effect of Types of Coir Geotextile
In order to understand the beneficial effect of different types of coir geotextile as
reinforcement, applied pressure versus settlement graphs were plotted for a specified
value of z/B. Fig. 8.11 shows the settlement behaviour tor z/B = 0.5 in dry and
saturated condition.
o
5
E I
E 10 I -- I -c
~ eLl 15 ~ en
20
25
o
5
E 10 , .§.. i .... ~ 15-E Cl)
E 20· eLl en
25
30·
100
;( Sand only
lJ.H2MB
oH21V16
o NonWo\en
50 100
~Sandonly
D.H2M3
o H21vO
o Non V\.b\en
Applied Pressure (kPa)
200 300 400 500 600 700
o
(a) Dry condition
Applied Pressure (kPa)
150 200 250 300 350 400 450
(b) Saturated condition
Fig. 8.11 Effect of types of coir geotextiIe on settlement hehaviour (z/B = 0.5)
114
From Fig. 8.11 it could be seen that when coir geotextiles were placed at level
corresponding to z/B = 0.5, the applied pressure for 5mm settlement with non-woven
coir geotextile was 3 12.5kPa showing an increase of 74 %. But this increase was only
39% and 25% with H2M8 and H2M6 coir geotextiles respectively. For higher
settlement the load carrying capacity enhancement was still higher. For example, at
z/B = 0.5, the applied pressure for IOmm settlement to take place when reinforced
with Non-woven and H2M8 gcotextiles were respectively 452.5 kPa and 350kPa, the
corresponding capacity enhancement factor being l. 77 and 1.37 respectively. Similar
variations could be seen for other z/B ratios also. Thus it could be seen that the tensile
strength of the coir geotextile is not the only factor responsible for the bearing
capacity improvement but the interfacial friction also contributes to a great extent.
In saturated condition, corresponding to 5mm settlement the bearing capacities were
210kPa, I 77.5kPa and 165kPa respectively with H2M8, Non-woven and H2M6 coir
geotextiles placed at z/B = 0.5. The bearing capacity improvements is 162 %, 122 %
and 106 % respectively for H2M8, Non-woven and H2M6. Similarly, the increases in
bearing capacity at 10mm settlement was 139 %, 123 %) and 85 ~/;) with H2M8, Non
woven and H2M6 respectively when placed at z/B = 0.5.
For all z/B ratios, both in dry and saturated conditions, H2M6 coir geotextile showed
minimum bearing capacity enhancement. The higher pertonnance of H2M8 coir
geotextile compared to H2M6 coir geotextile may be attributed to higher values of
stiffness, interface friction and secant modulus.
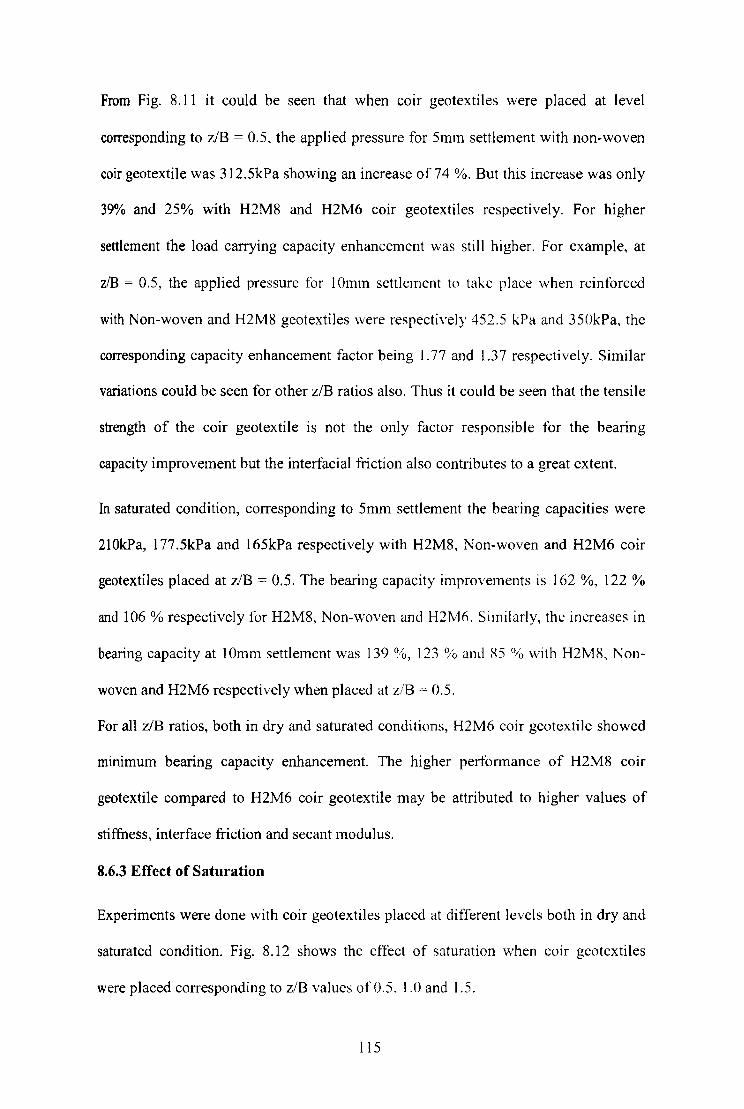
8.6.3 Effect of Saturation
Experiments were done with coir geotextiles placed at different levels both in dry and
saturated condition. Fig. 8.l2 shows the effect of saturation when coir geotextiles
were placed corresponding to z/B values of 0.5, 1.0 and 1.5.
115
o 100
Applied Pressure (kPa)
200 300 400 500 600 700
~ ~~~~~~"-----"-----~~~~;;=;;=~==~, 6. Dry zIB=O.5 1 1:1 Saturated Z/B=O.5 I o Dryz/8=1.O I o Saturated vB=1 .0 o DrytIB::::l .5 o Saturated zIB=1 .5
E :j .§. 8
! 10
j ~! 1 16
18 1 20 ~1----------_.-------,
o ' 00
(a) H2M8 coir geote.tile Applied Pressure (kPa)
200 300 400 500 600 700
o~~~-----------------~~~~-2 II Dry z/B:O.S
4 11 Saturated zlB=O.S
E 6 OOryzlB=1 .0
.s. 8 0 Saturated 218=1.0
110 1 ODryzlB=l .5 I ~ :: DSaturaled~
'6] 18 ro L-________ ~1-___ '_~"_,~ ________ _
o 100
o
(b) H2M6 coir geote.lile Load (kN)
roo 300 400 500 600 700
tJ. Dry z/B:O.5 I:!. Saturated zIB--o.5
:~~~~::~o~o~r;~_~-~I~.O~ __ ~O Saturated 1lB:l .0
6 , E g 8
I ~
10 j 12
14 1 16
1 18
20
\. o Dryz/B.:l .S o SaluraledzlS=l .S
(c) Non-woven coir geotextile
Fig.S.i2 Effect of saturation on coir geotextile reinforced sand
116
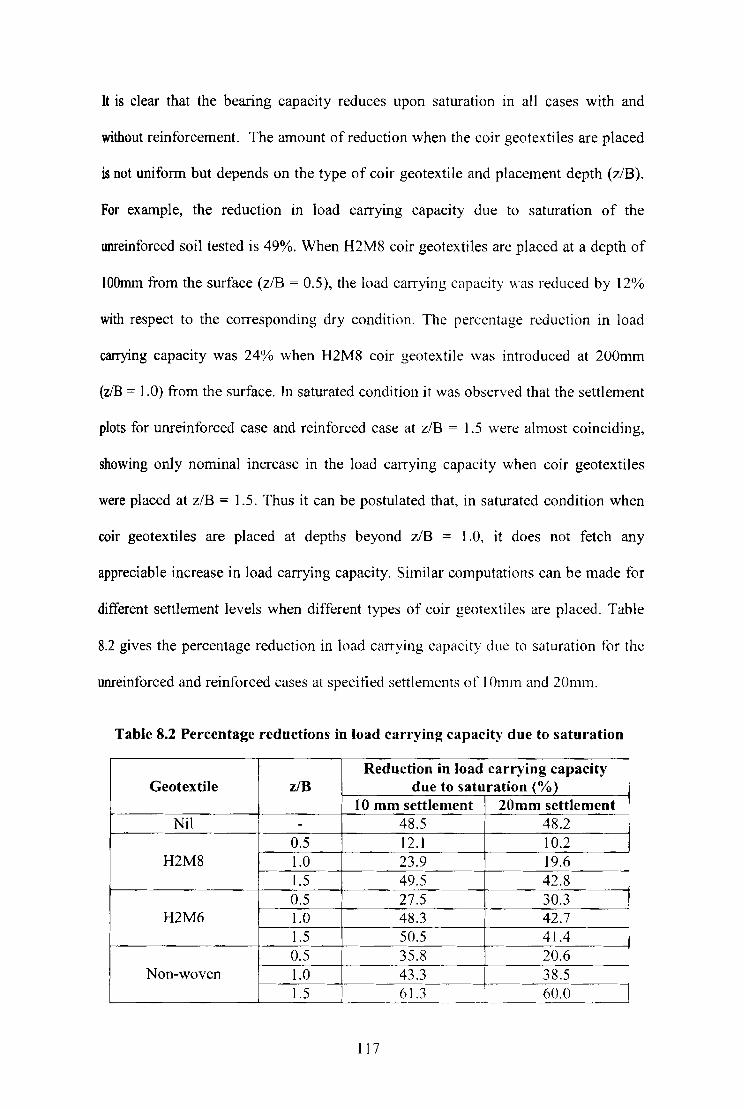
It is clear that the bearing capacity reduces upon saturation in all cases with and
without reinforcement. The amount of reduction when the eoir geotextiles are placed
is not uniform but depends on the type of coir geotextile and placement depth (z/B).
For example, the reduction in load carrying capacity due to saturation of the
unreinforced soil tested is 49%. When H2M8 coir geotextiles arc placed at a depth of
IOOmm from the surface (z/B = 0.5), the load carrying crtpacity was reduced by 12%
with respect to the corresponding dry condition. Thc percentage reduction in load
carrying capacity was 24% when H2M8 coir geotextile was introduced at 200mm
(zIB = 1.0) from the surface. In saturated condition it was observed that the settlement
plots for unreinforced case and reinforced case at z/B = 1.5 were almost coinciding,
showing only nominal increase in the load carrying capacity when coir geotextiles
were placed at z/B = 1.5. Thus it can be postulated that, in saturated condition when
coir geotextiles are placed at depths beyond z/B = 1.0, it does not fetch any
appreciable increase in load carrying capacity. Similar computations can be made for
different settlement levels when different types of coir geotextiles are placed. Table
8.2 gives the percentage reduction in load carrying capacity due to saturation for the
unreinforced and reinforced cases at specitied settlements or I Omm and 20mm.
Table 8.2 Percentage reductions in load carrying capacity due to saturation
Reduction in load carrying capacity Geotextile z/B due to saturation (%)
10 mm settlement 20mm settlement Nil - 48.5 48.2
0.5 12.1 10.2 H2M8 1.0 23.9 19.6
1.5 49.5 42.8 0.5 27.5 30.3
H2M6 1.0 48.3 42.7 1.5 50.5 41.4 0.5 35.8 20.6
Non-woven 1.0 43.3 38.5 .-
1.5 61.3 60.0 _____ •• ___ ~_ •• v
117
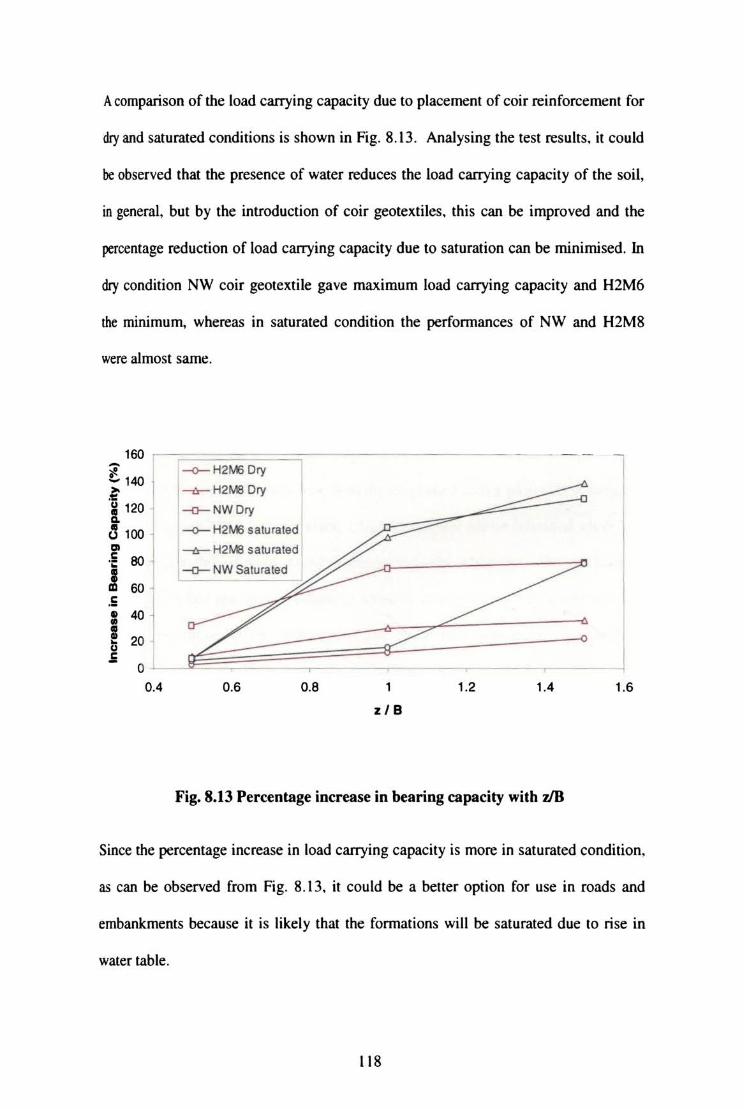
A comparison of the load carrying capacity due to placement of coir reinforcement for
dry and saturated conditions is shown in Fig. 8.13. Ana1ysing the test results. it could
be observed that the presence of water reduces the load carrying capacity of the soil,
in general, but by the introduction of coir geotex.tiles. this can be improved and the
percentage reduction of load carrying capacity due to saturation can be minimised. In
dry condition NW coir geotex.tile gave maximum load carrying capacity and H2M6
me minimum, whereas in saturated condition the performances of NW and H2M8
were almost same.
160 f - --l ~
l,4O I --0-- H2PvE Dry
.~ --tr- H2iV8 Dry
i '20 -o-NWDry
~': j --0- H2MB saturated I --tr- H2M3 saturated
! -0-- NW Saturated
60 .5 40 j : I 20 • u .5
0
0.' 0.6 0.8 '.2 1.4 1.6
z I B
Fig. 8.13 Percentage increase in bearing capacity with :dB
Since the percentage increase in load carrying capacity is more in saturated condition,
as can be observed from Fig. 8.13. it could be a beller option for use in roads and
embankments because it is likely that the formations will be saturated due to rise in
water table.
liS
8.7 SUMMARY
Results clearly demonstrate that coir geotextiles, a natural product, can substantially
increase the bearing capacity of shallow square footing on sand both in dry and
saturated conditions. The performance in saturated condition was even better in some
cases. Both H2M8 and NW coir geotextiles were found suitable for increasing the
bearing capacity in dry condition and the fonner was found more effective in
saturated condition.
119


![IS 11060 (1984): Rubberized Coir Cushioning - ccriindia.org is.11060.1984.pdf · IS 11060 (1984): Rubberized Coir Cushioning [TXD 25: Coir and Coir Products] iS:liO60 :1984 MOULDED](https://img.pdfslide.us/doc/110x75/5b5bf1b67f8b9a2d458ea426/is-11060-1984-rubberized-coir-cushioning-is110601984pdf-is-11060-1984.jpg)