Embed Size (px)
Citation preview
Construction and Building Materials 25 (2011) 1196–1204
Contents lists available at ScienceDirect
Construction and Building Materials
journal homepage: www.elsevier .com/locate /conbui ldmat
Effect of coarse aggregate characteristics on concrete rheology
Jiong Hu a,⇑, Kejin Wang b
a Department of Engineering Technology, Texas State University – San Marcos, San Marcos, TX 78666, United Statesb Department of Civil, Construction, and Environmental Engineering, Iowa State University, Ames, IA 50011, United States
a r t i c l e i n f o a b s t r a c t
Article history:Received 11 August 2009Received in revised form 16 August 2010Accepted 2 September 2010Available online 26 September 2010
Keywords:AggregateGradationProportionVoidsRheology
0950-0618/$ - see front matter � 2010 Elsevier Ltd. Adoi:10.1016/j.conbuildmat.2010.09.035
⇑ Corresponding author. Tel.: +1 512 2456328; fax:E-mail address: [email protected] (J. Hu).
In the present study, concrete was considered as a two-phase material, consisting of coarse aggregate(CA) and mortar. Coarse aggregate properties were characterized by fineness, uncompacted void and fric-tion angle. The combined effects of CA characteristics and mix design on the rheological properties of thecorresponding concrete were investigated using a portable IBB concrete rheometer. Experimental resultsindicated that a higher CA and fine aggregate content normally result in higher concrete rheologicalparameters (yield stress and viscosity). For a given type and amount of mortar, concrete yield stressand viscosity generally increase with the uncompacted void content and friction angle but decreasedwith the size (or fineness) of CA. Well graded CA, generally having low uncompacted void content, pro-vides concrete with considerably reduced yield stress and viscosity when compared with single-sized CA.In addition, a multiple-parameter linear regression analysis was conducted to evaluate how different CAcharacteristics (fineness, uncompacted void and friction angle) and mix design parameters (mortar com-position, and CA volume fraction) affect concrete rheological behavior.
� 2010 Elsevier Ltd. All rights reserved.
1. Introduction
Aggregate characteristics, such as size, gradation, shape, surfacetexture and volume fraction, all have significant effects on concreterheology [1–3]. These effects result from the aggregate interparti-cle forces (such as interlocking and friction among solid particles)and the particle movement in the liquid phases of fresh concrete[4–6]. Geiker et al. have shown that the relative yield stress andviscosity of concrete significantly increase with increased coarseaggregate (CA) volume fraction [7]. The water requirement for con-crete decreases with increased aggregate particle size. Very fineaggregate requires more water for a given consistency. An optimalaggregate gradation provides a higher degree of packing and re-quires less paste to reach a given consistency since less cementpaste is needed to fill the space among the aggregate [8–10]. Pre-vious research also indicates that friction among aggregate has asignificant contribution to concrete rheology [11]. Particles witha nearly spherical shape and a smooth surface texture providemore workable concrete. However, compared with the study of ce-ment paste and mortar, the study of concrete rheology is still lim-ited due to the difficulties in characterizing concrete aggregate andthe limited equipment available for concrete rheology measure-ments. Very few aggregate parameters are applied in concrete rhe-ology study.
ll rights reserved.
+1 512 2453052.
In the present study, concrete was considered as a two-phasematerial, composed with mortar and CA. The two-phase approachcan not only reduce the error of analysis caused from the widerange of aggregate size, but also provide practical advantages inconcrete mix design since fine aggregate (FA) and CA are usuallyproportioned separated [12]. In addition to proportions of concrete,CA properties were studied. The CA was characterized by grada-tion, uncompacted void and aggregate friction angle tests. The ef-fects of concrete material properties (CA characteristics) as wellas mix design parameters (mortar composition and CA content)on concrete rheological behavior were studied. A multi-parameterlinear regression analysis was conducted to study effects of differ-ent material and mix design parameters on concrete rheology.Based on the regression analysis, the degree of importance of theaggregate properties and mix design parameters in concrete rheol-ogy were evaluated.
2. Research significance
Aggregate characteristics and content significantly influencerheology of concrete. Rational characterization of concrete aggre-gate has been challenging. In the present paper, test methods forcharacterizing coarse aggregate were explored, and the aggregateproperty parameters obtained from these tests were further usedto quantify the influence of aggregate (properties and content)on concrete rheology. Based on the experimental results, a statisti-cal analysis was used to evaluate the effect of original mix designand aggregate properties on rheological properties of concrete.
0
20
40
60
80
100
37.5mm (1.5")
25mm (1")
19.0mm (3/4")
12.5mm (1/2")
9.5mm (3/8")
4.75mm (#4)
Perc
ent p
assi
ng, b
y m
ass
Sieve Size
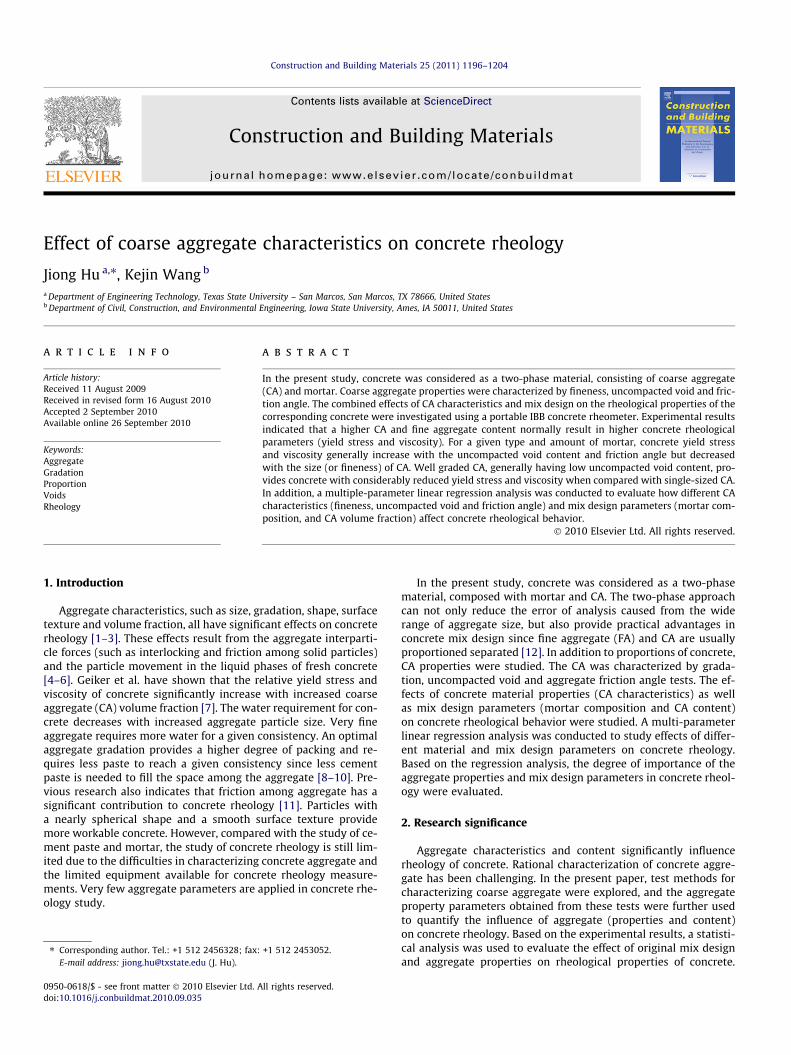
G1 (FM=7.27)G2 (FM=7.06)G3 (FM=6.85)
Fig. 1. Coarse aggregate gradation curves.
J. Hu, K. Wang / Construction and Building Materials 25 (2011) 1196–1204 1197
These test and analysis results can provide researchers and engi-neers with useful tools to evaluate and predict the effects of aggre-gate on concrete rheology.
3. Experimental work
3.1. Material properties
ASTM Type I cement was used as a binder in present study, andits chemical composition and physical properties are listed in Table1. Natural graded river sand with a fineness modulus (FM) of 2.92was used as fine aggregate (FA). The absorption of FA was 1.60%,and specific gravities were 2.59 and 2.63 at the oven-dried (OD)and saturated surface dry (SSD) condition respectively. Crushedlimestone with a 25 mm (1 in.) normal maximum size of aggregate(NMSA) was used as CA. As seen in Fig. 1, three CA gradations (G1,G2, and G3) were employed, where G1 and G3 are the high and thelow limits of ASTM C33 ‘‘Standard Specification for Concrete Aggre-gates” and G2 is the middle point gradation between G1 and G3. Inaddition, four single-sized CAs, retained on the 19.0 mm (3/4 in.),12.5 mm (1/2 in.), 9.5 mm (3/8 in.), and 4.75 mm (no. 4) sieve butpassed the sieve one size higher than the specified sieve, were alsoused. The specific gravity of the CA was 2.53 at SSD condition and2.45 at OD condition. Absorption of the CA varied from 2.76% to3.77%, depending on the aggregate particle sizes. The uncompactedvoid content and friction angle of the CA was also measured, thetest procedures and results will be described later.
3.2. Mix proportions
Different mortar proportions, CA gradations, and CA volumefractions (Vca) as shown in Table 2 were considered in the concretemix design. A total of 23 concrete mixes with three different mortarproportions (M1: s/c = 1.75, w/c = 0.45; M2: s/c = 2.21, w/c = 0.45;and M3: s/c = 2.60, w/c = 0.50), three CA contents (Vca = 35%, 38%and 41%), and seven CA gradations (four single sizes at 19 mm,12.5 mm, 9.5 mm and 4.75 mm and three gradations at G1, G2and G3) were prepared. Note that the mortar proportions were orig-inally designed with the same water-to-cement rations (w/c) butdifferent sand-to-cement ratios (s/c). However, mixes with thehighest s/c (M3) was chosen to have slightly higher w/c than mixeswith lower s/c so as to achieve acceptable flow ability.
3.3. Mixing procedure
The concrete was mixed using a pan mixer based on ASTMC192, ‘‘Standard Practice for Making and Curing Concrete TestSpecimens in the Laboratory”. CA and FA both at the SSD condi-tions and tap water at 23 ± 2 �C (73 ± 3 �F) were used.
3.4. Aggregate property measurement
CAs used in present study were sieved and recombined to ob-tain the designed gradation as described earlier. The uncompactedvoid content tests were performed according to ASTM C29 ‘‘Stan-dard Test Method for Bulk Density (‘‘Unit Weight”) and Voids in
Table 1Chemical composition and physical properties of cement.
Composition CaO SiO2 Al2O3 Fe2O3 Mg
(%) 64.2 20.8 5.55 2.25 1.9Mean size = 23.7 lm Fineness = 399 m2/kg
a (Na2O)eq. = (Na2O) + 0.658 (K2O).b LOS = loss of ignition.
Aggregate”. The void contents of CAs were calculated accordingto the mass of the aggregate required to fill a container of a spec-ified unit volume. Generally, angularity increases void contentswhile well-graded aggregate decreases void content. The void con-tent between aggregate particles affects paste and mortar require-ments in mix design. While a higher void content of aggregateusually requires more paste and mortar to provide concrete withthe same workability, with the same mix design, aggregate withhigher void content usually results in concrete with lower work-ability [3].
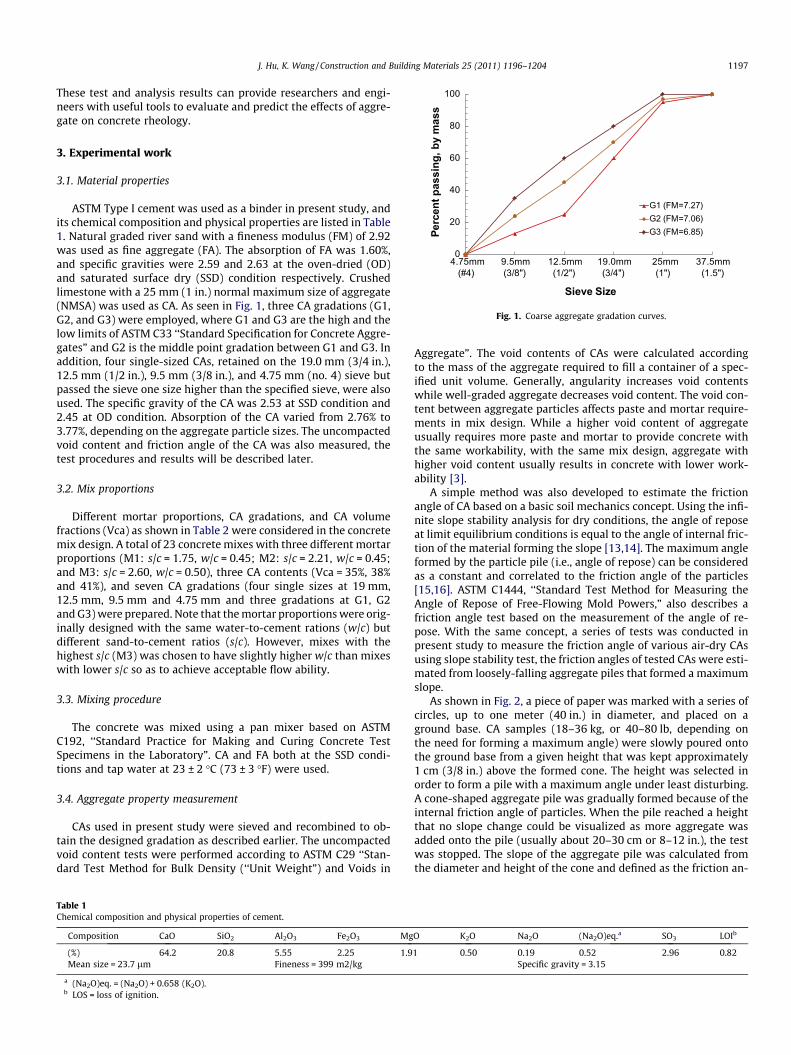
A simple method was also developed to estimate the frictionangle of CA based on a basic soil mechanics concept. Using the infi-nite slope stability analysis for dry conditions, the angle of reposeat limit equilibrium conditions is equal to the angle of internal fric-tion of the material forming the slope [13,14]. The maximum angleformed by the particle pile (i.e., angle of repose) can be consideredas a constant and correlated to the friction angle of the particles[15,16]. ASTM C1444, ‘‘Standard Test Method for Measuring theAngle of Repose of Free-Flowing Mold Powers,” also describes afriction angle test based on the measurement of the angle of re-pose. With the same concept, a series of tests was conducted inpresent study to measure the friction angle of various air-dry CAsusing slope stability test, the friction angles of tested CAs were esti-mated from loosely-falling aggregate piles that formed a maximumslope.
As shown in Fig. 2, a piece of paper was marked with a series ofcircles, up to one meter (40 in.) in diameter, and placed on aground base. CA samples (18–36 kg, or 40–80 lb, depending onthe need for forming a maximum angle) were slowly poured ontothe ground base from a given height that was kept approximately1 cm (3/8 in.) above the formed cone. The height was selected inorder to form a pile with a maximum angle under least disturbing.A cone-shaped aggregate pile was gradually formed because of theinternal friction angle of particles. When the pile reached a heightthat no slope change could be visualized as more aggregate wasadded onto the pile (usually about 20–30 cm or 8–12 in.), the testwas stopped. The slope of the aggregate pile was calculated fromthe diameter and height of the cone and defined as the friction an-
O K2O Na2O (Na2O)eq.a SO3 LOIb
1 0.50 0.19 0.52 2.96 0.82Specific gravity = 3.15
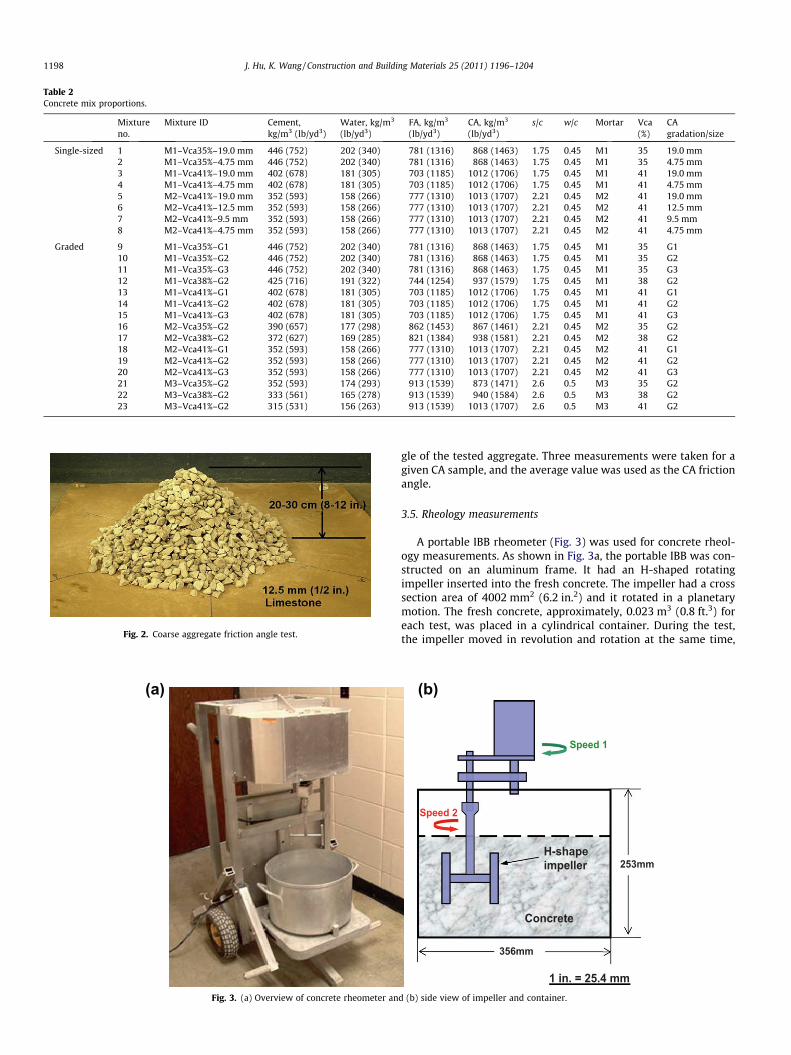
Table 2Concrete mix proportions.
Mixtureno.
Mixture ID Cement,kg/m3 (lb/yd3)
Water, kg/m3
(lb/yd3)FA, kg/m3
(lb/yd3)CA, kg/m3
(lb/yd3)s/c w/c Mortar Vca
(%)CAgradation/size
Single-sized 1 M1–Vca35%–19.0 mm 446 (752) 202 (340) 781 (1316) 868 (1463) 1.75 0.45 M1 35 19.0 mm2 M1–Vca35%–4.75 mm 446 (752) 202 (340) 781 (1316) 868 (1463) 1.75 0.45 M1 35 4.75 mm3 M1–Vca41%–19.0 mm 402 (678) 181 (305) 703 (1185) 1012 (1706) 1.75 0.45 M1 41 19.0 mm4 M1–Vca41%–4.75 mm 402 (678) 181 (305) 703 (1185) 1012 (1706) 1.75 0.45 M1 41 4.75 mm5 M2–Vca41%–19.0 mm 352 (593) 158 (266) 777 (1310) 1013 (1707) 2.21 0.45 M2 41 19.0 mm6 M2–Vca41%–12.5 mm 352 (593) 158 (266) 777 (1310) 1013 (1707) 2.21 0.45 M2 41 12.5 mm7 M2–Vca41%–9.5 mm 352 (593) 158 (266) 777 (1310) 1013 (1707) 2.21 0.45 M2 41 9.5 mm8 M2–Vca41%–4.75 mm 352 (593) 158 (266) 777 (1310) 1013 (1707) 2.21 0.45 M2 41 4.75 mm
Graded 9 M1–Vca35%–G1 446 (752) 202 (340) 781 (1316) 868 (1463) 1.75 0.45 M1 35 G110 M1–Vca35%–G2 446 (752) 202 (340) 781 (1316) 868 (1463) 1.75 0.45 M1 35 G211 M1–Vca35%–G3 446 (752) 202 (340) 781 (1316) 868 (1463) 1.75 0.45 M1 35 G312 M1–Vca38%–G2 425 (716) 191 (322) 744 (1254) 937 (1579) 1.75 0.45 M1 38 G213 M1–Vca41%–G1 402 (678) 181 (305) 703 (1185) 1012 (1706) 1.75 0.45 M1 41 G114 M1–Vca41%–G2 402 (678) 181 (305) 703 (1185) 1012 (1706) 1.75 0.45 M1 41 G215 M1–Vca41%–G3 402 (678) 181 (305) 703 (1185) 1012 (1706) 1.75 0.45 M1 41 G316 M2–Vca35%–G2 390 (657) 177 (298) 862 (1453) 867 (1461) 2.21 0.45 M2 35 G217 M2–Vca38%–G2 372 (627) 169 (285) 821 (1384) 938 (1581) 2.21 0.45 M2 38 G218 M2–Vca41%–G1 352 (593) 158 (266) 777 (1310) 1013 (1707) 2.21 0.45 M2 41 G119 M2–Vca41%–G2 352 (593) 158 (266) 777 (1310) 1013 (1707) 2.21 0.45 M2 41 G220 M2–Vca41%–G3 352 (593) 158 (266) 777 (1310) 1013 (1707) 2.21 0.45 M2 41 G321 M3–Vca35%–G2 352 (593) 174 (293) 913 (1539) 873 (1471) 2.6 0.5 M3 35 G222 M3–Vca38%–G2 333 (561) 165 (278) 913 (1539) 940 (1584) 2.6 0.5 M3 38 G223 M3–Vca41%–G2 315 (531) 156 (263) 913 (1539) 1013 (1707) 2.6 0.5 M3 41 G2
Fig. 2. Coarse aggregate friction angle test.
(a)
Fig. 3. (a) Overview of concrete rheometer an
1198 J. Hu, K. Wang / Construction and Building Materials 25 (2011) 1196–1204
gle of the tested aggregate. Three measurements were taken for agiven CA sample, and the average value was used as the CA frictionangle.
3.5. Rheology measurements
A portable IBB rheometer (Fig. 3) was used for concrete rheol-ogy measurements. As shown in Fig. 3a, the portable IBB was con-structed on an aluminum frame. It had an H-shaped rotatingimpeller inserted into the fresh concrete. The impeller had a crosssection area of 4002 mm2 (6.2 in.2) and it rotated in a planetarymotion. The fresh concrete, approximately, 0.023 m3 (0.8 ft.3) foreach test, was placed in a cylindrical container. During the test,the impeller moved in revolution and rotation at the same time,
Concrete
H-shape impeller
Speed 1
Speed 2
253mm
356mm
1 in. = 25.4 mm
(b)
d (b) side view of impeller and container.
J. Hu, K. Wang / Construction and Building Materials 25 (2011) 1196–1204 1199
(a) revolution around the main shaft of the rheometer at speed I,and (b) rotation around the axis of the H-shaped impeller at speedII, where speed II was approximately 2.20 times of speed I (Fig. 3b).A load cell measured the reaction torque from the impeller, while atachometer measured the rotation speed of the impeller.
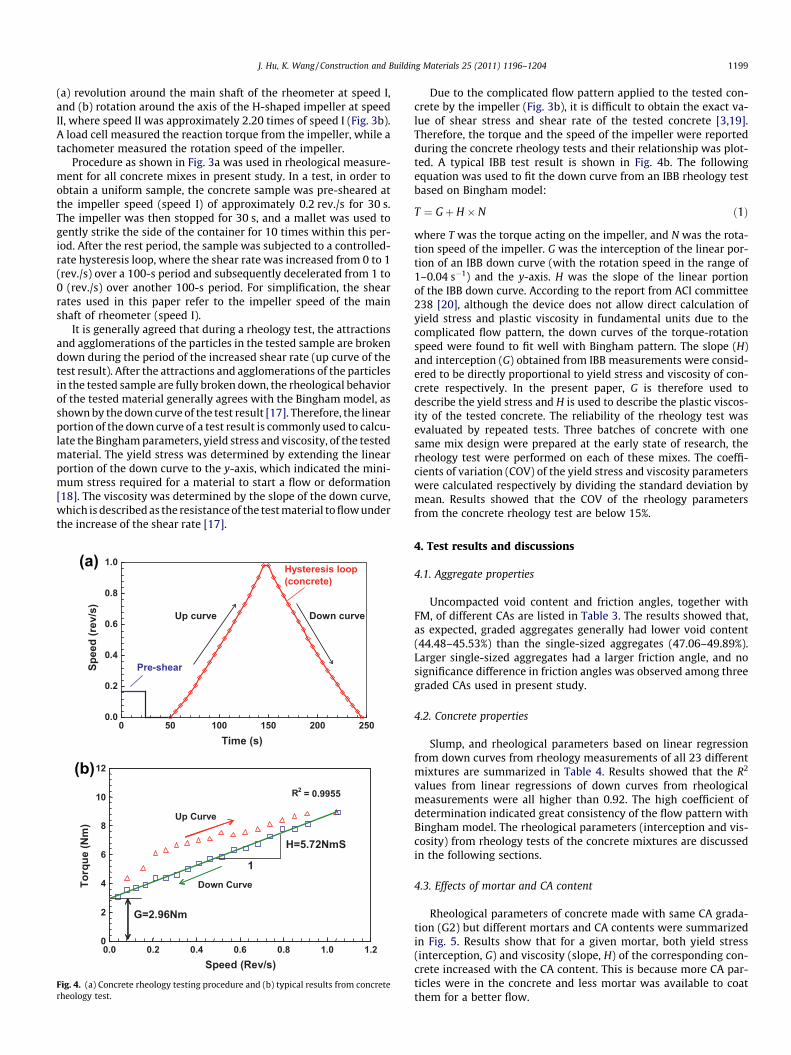
Procedure as shown in Fig. 3a was used in rheological measure-ment for all concrete mixes in present study. In a test, in order toobtain a uniform sample, the concrete sample was pre-sheared atthe impeller speed (speed I) of approximately 0.2 rev./s for 30 s.The impeller was then stopped for 30 s, and a mallet was used togently strike the side of the container for 10 times within this per-iod. After the rest period, the sample was subjected to a controlled-rate hysteresis loop, where the shear rate was increased from 0 to 1(rev./s) over a 100-s period and subsequently decelerated from 1 to0 (rev./s) over another 100-s period. For simplification, the shearrates used in this paper refer to the impeller speed of the mainshaft of rheometer (speed I).
It is generally agreed that during a rheology test, the attractionsand agglomerations of the particles in the tested sample are brokendown during the period of the increased shear rate (up curve of thetest result). After the attractions and agglomerations of the particlesin the tested sample are fully broken down, the rheological behaviorof the tested material generally agrees with the Bingham model, asshown by the down curve of the test result [17]. Therefore, the linearportion of the down curve of a test result is commonly used to calcu-late the Bingham parameters, yield stress and viscosity, of the testedmaterial. The yield stress was determined by extending the linearportion of the down curve to the y-axis, which indicated the mini-mum stress required for a material to start a flow or deformation[18]. The viscosity was determined by the slope of the down curve,which is described as the resistance of the test material to flow underthe increase of the shear rate [17].
0.0
0.2
0.4
0.6
0.8
1.0
0 50 100 150 200 250Time (s)
Spee
d (r
ev/s
)
Pre-shear
Hysteresis loop(concrete)
Up curve Down curve
R2 = 0.9955
0
2
4
6
8
10
12
0.0 0.2 0.4 0.6 0.8 1.0 1.2Speed (Rev/s)
Torq
ue (N
m)
G=2.96Nm
H=5.72NmS
1Down Curve
Up Curve
(a)
(b)
Fig. 4. (a) Concrete rheology testing procedure and (b) typical results from concreterheology test.
Due to the complicated flow pattern applied to the tested con-crete by the impeller (Fig. 3b), it is difficult to obtain the exact va-lue of shear stress and shear rate of the tested concrete [3,19].Therefore, the torque and the speed of the impeller were reportedduring the concrete rheology tests and their relationship was plot-ted. A typical IBB test result is shown in Fig. 4b. The followingequation was used to fit the down curve from an IBB rheology testbased on Bingham model:
T ¼ Gþ H � N ð1Þ
where T was the torque acting on the impeller, and N was the rota-tion speed of the impeller. G was the interception of the linear por-tion of an IBB down curve (with the rotation speed in the range of1–0.04 s�1) and the y-axis. H was the slope of the linear portionof the IBB down curve. According to the report from ACI committee238 [20], although the device does not allow direct calculation ofyield stress and plastic viscosity in fundamental units due to thecomplicated flow pattern, the down curves of the torque-rotationspeed were found to fit well with Bingham pattern. The slope (H)and interception (G) obtained from IBB measurements were consid-ered to be directly proportional to yield stress and viscosity of con-crete respectively. In the present paper, G is therefore used todescribe the yield stress and H is used to describe the plastic viscos-ity of the tested concrete. The reliability of the rheology test wasevaluated by repeated tests. Three batches of concrete with onesame mix design were prepared at the early state of research, therheology test were performed on each of these mixes. The coeffi-cients of variation (COV) of the yield stress and viscosity parameterswere calculated respectively by dividing the standard deviation bymean. Results showed that the COV of the rheology parametersfrom the concrete rheology test are below 15%.
4. Test results and discussions
4.1. Aggregate properties
Uncompacted void content and friction angles, together withFM, of different CAs are listed in Table 3. The results showed that,as expected, graded aggregates generally had lower void content(44.48–45.53%) than the single-sized aggregates (47.06–49.89%).Larger single-sized aggregates had a larger friction angle, and nosignificance difference in friction angles was observed among threegraded CAs used in present study.
4.2. Concrete properties
Slump, and rheological parameters based on linear regressionfrom down curves from rheology measurements of all 23 differentmixtures are summarized in Table 4. Results showed that the R2
values from linear regressions of down curves from rheologicalmeasurements were all higher than 0.92. The high coefficient ofdetermination indicated great consistency of the flow pattern withBingham model. The rheological parameters (interception and vis-cosity) from rheology tests of the concrete mixtures are discussedin the following sections.
4.3. Effects of mortar and CA content
Rheological parameters of concrete made with same CA grada-tion (G2) but different mortars and CA contents were summarizedin Fig. 5. Results show that for a given mortar, both yield stress(interception, G) and viscosity (slope, H) of the corresponding con-crete increased with the CA content. This is because more CA par-ticles were in the concrete and less mortar was available to coatthem for a better flow.
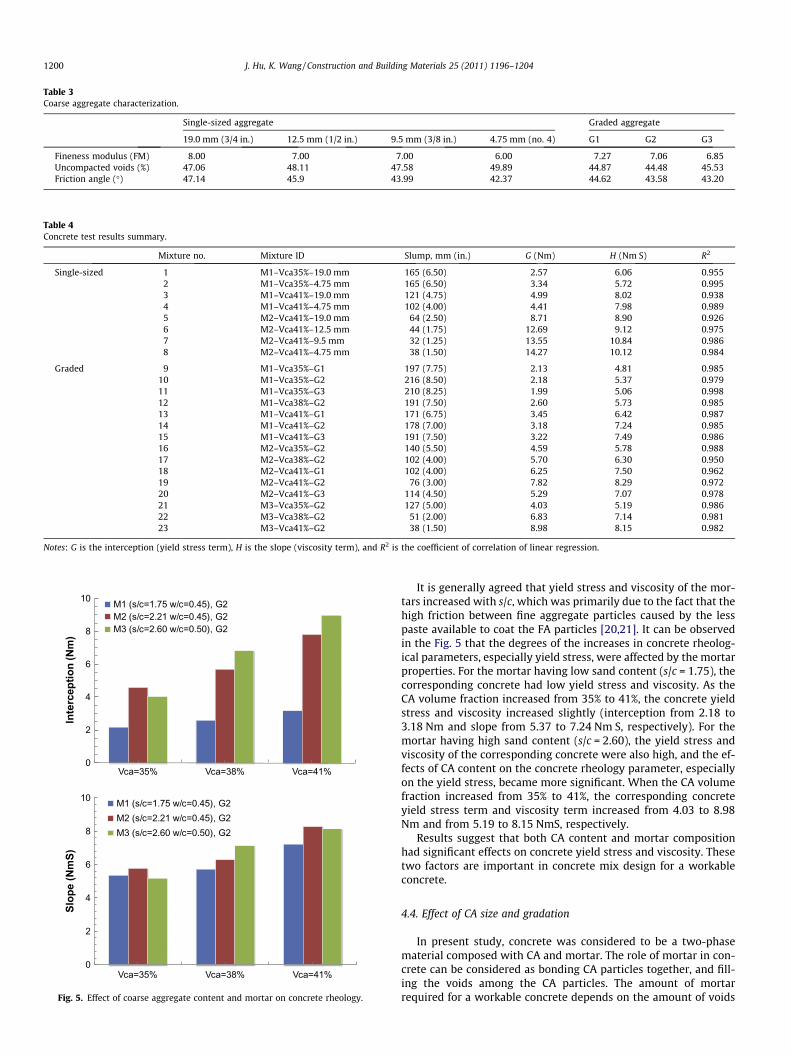
Table 3Coarse aggregate characterization.
Single-sized aggregate Graded aggregate
19.0 mm (3/4 in.) 12.5 mm (1/2 in.) 9.5 mm (3/8 in.) 4.75 mm (no. 4) G1 G2 G3
Fineness modulus (FM) 8.00 7.00 7.00 6.00 7.27 7.06 6.85Uncompacted voids (%) 47.06 48.11 47.58 49.89 44.87 44.48 45.53Friction angle (�) 47.14 45.9 43.99 42.37 44.62 43.58 43.20
Table 4Concrete test results summary.
Mixture no. Mixture ID Slump, mm (in.) G (Nm) H (Nm S) R2
Single-sized 1 M1–Vca35%–19.0 mm 165 (6.50) 2.57 6.06 0.9552 M1–Vca35%–4.75 mm 165 (6.50) 3.34 5.72 0.9953 M1–Vca41%–19.0 mm 121 (4.75) 4.99 8.02 0.9384 M1–Vca41%–4.75 mm 102 (4.00) 4.41 7.98 0.9895 M2–Vca41%–19.0 mm 64 (2.50) 8.71 8.90 0.9266 M2–Vca41%–12.5 mm 44 (1.75) 12.69 9.12 0.9757 M2–Vca41%–9.5 mm 32 (1.25) 13.55 10.84 0.9868 M2–Vca41%–4.75 mm 38 (1.50) 14.27 10.12 0.984
Graded 9 M1–Vca35%–G1 197 (7.75) 2.13 4.81 0.98510 M1–Vca35%–G2 216 (8.50) 2.18 5.37 0.97911 M1–Vca35%–G3 210 (8.25) 1.99 5.06 0.99812 M1–Vca38%–G2 191 (7.50) 2.60 5.73 0.98513 M1–Vca41%–G1 171 (6.75) 3.45 6.42 0.98714 M1–Vca41%–G2 178 (7.00) 3.18 7.24 0.98515 M1–Vca41%–G3 191 (7.50) 3.22 7.49 0.98616 M2–Vca35%–G2 140 (5.50) 4.59 5.78 0.98817 M2–Vca38%–G2 102 (4.00) 5.70 6.30 0.95018 M2–Vca41%–G1 102 (4.00) 6.25 7.50 0.96219 M2–Vca41%–G2 76 (3.00) 7.82 8.29 0.97220 M2–Vca41%–G3 114 (4.50) 5.29 7.07 0.97821 M3–Vca35%–G2 127 (5.00) 4.03 5.19 0.98622 M3–Vca38%–G2 51 (2.00) 6.83 7.14 0.98123 M3–Vca41%–G2 38 (1.50) 8.98 8.15 0.982
Notes: G is the interception (yield stress term), H is the slope (viscosity term), and R2 is the coefficient of correlation of linear regression.
0
2
4
6
8
10
Vca=35% Vca=38% Vca=41%
Inte
rcep
tion
(Nm
)
M1 (s/c=1.75 w/c=0.45), G2M2 (s/c=2.21 w/c=0.45), G2M3 (s/c=2.60 w/c=0.50), G2
0
2
4
6
8
10
Vca=35% Vca=38% Vca=41%
Slop
e (N
mS)
M1 (s/c=1.75 w/c=0.45), G2M2 (s/c=2.21 w/c=0.45), G2M3 (s/c=2.60 w/c=0.50), G2
Fig. 5. Effect of coarse aggregate content and mortar on concrete rheology.
1200 J. Hu, K. Wang / Construction and Building Materials 25 (2011) 1196–1204
It is generally agreed that yield stress and viscosity of the mor-tars increased with s/c, which was primarily due to the fact that thehigh friction between fine aggregate particles caused by the lesspaste available to coat the FA particles [20,21]. It can be observedin the Fig. 5 that the degrees of the increases in concrete rheolog-ical parameters, especially yield stress, were affected by the mortarproperties. For the mortar having low sand content (s/c = 1.75), thecorresponding concrete had low yield stress and viscosity. As theCA volume fraction increased from 35% to 41%, the concrete yieldstress and viscosity increased slightly (interception from 2.18 to3.18 Nm and slope from 5.37 to 7.24 Nm S, respectively). For themortar having high sand content (s/c = 2.60), the yield stress andviscosity of the corresponding concrete were also high, and the ef-fects of CA content on the concrete rheology parameter, especiallyon the yield stress, became more significant. When the CA volumefraction increased from 35% to 41%, the corresponding concreteyield stress term and viscosity term increased from 4.03 to 8.98Nm and from 5.19 to 8.15 NmS, respectively.
Results suggest that both CA content and mortar compositionhad significant effects on concrete yield stress and viscosity. Thesetwo factors are important in concrete mix design for a workableconcrete.
4.4. Effect of CA size and gradation
In present study, concrete was considered to be a two-phasematerial composed with CA and mortar. The role of mortar in con-crete can be considered as bonding CA particles together, and fill-ing the voids among the CA particles. The amount of mortarrequired for a workable concrete depends on the amount of voids
0
4
8
12
16
20
G1 G2 G3
M1 (s/c=1.75 w/c=0.45), Vca=35%M2 (s/c=2.21 w/c=0.45), Vca=38%M2 (s/c=2.21 w/c=0.45), Vca=41%
Aggregate gradation
Inte
rcep
tion
(Nm
)
3
6
9
12
15M1 (s/c=1.75 w/c=0.45), Vca=35%M2 (s/c=2.21 w/c=0.45), Vca=38%M2 (s/c=2.21 w/c=0.45), Vca=41%
Slop
e (N
mS)
J. Hu, K. Wang / Construction and Building Materials 25 (2011) 1196–1204 1201
among the CA particles and the total surface area of the CA to becoated, which are in turn depending upon the size, gradation,shape and surface texture of the CA [22]. Since CA friction anglemeasurements take into account of the CA gradation, shape andsurface texture [22], CA friction angle was considered an importantparameter of concrete rheology in the present study.
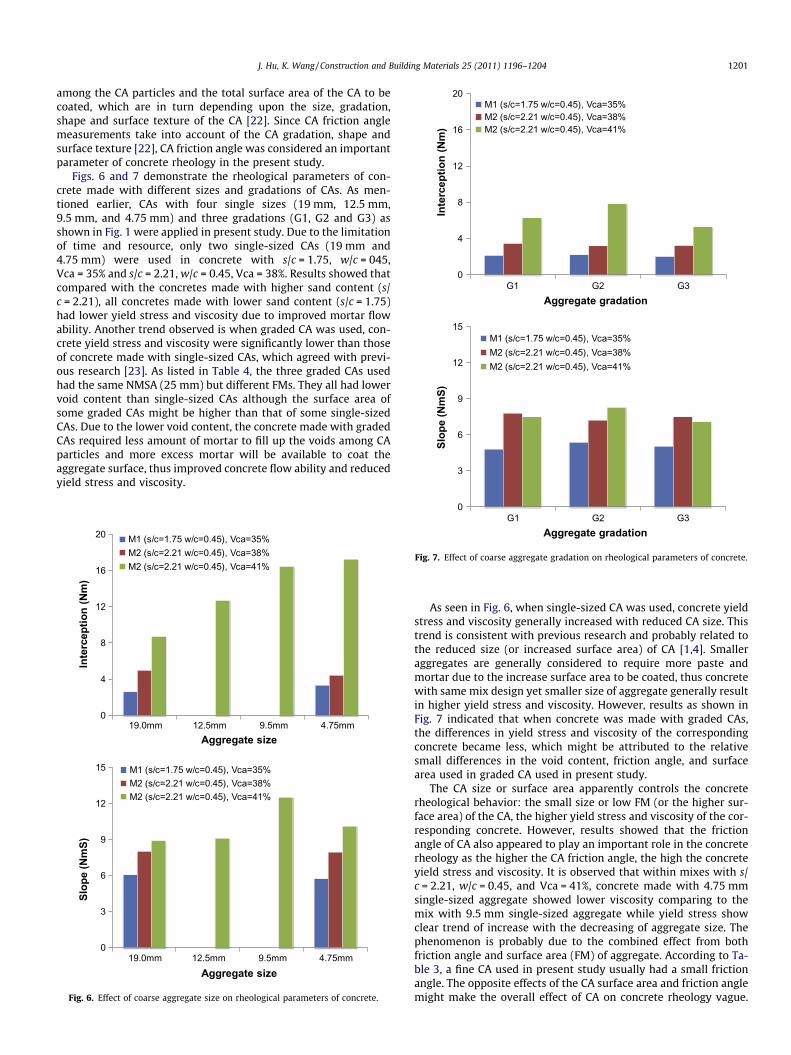
Figs. 6 and 7 demonstrate the rheological parameters of con-crete made with different sizes and gradations of CAs. As men-tioned earlier, CAs with four single sizes (19 mm, 12.5 mm,9.5 mm, and 4.75 mm) and three gradations (G1, G2 and G3) asshown in Fig. 1 were applied in present study. Due to the limitationof time and resource, only two single-sized CAs (19 mm and4.75 mm) were used in concrete with s/c = 1.75, w/c = 045,Vca = 35% and s/c = 2.21, w/c = 0.45, Vca = 38%. Results showed thatcompared with the concretes made with higher sand content (s/c = 2.21), all concretes made with lower sand content (s/c = 1.75)had lower yield stress and viscosity due to improved mortar flowability. Another trend observed is when graded CA was used, con-crete yield stress and viscosity were significantly lower than thoseof concrete made with single-sized CAs, which agreed with previ-ous research [23]. As listed in Table 4, the three graded CAs usedhad the same NMSA (25 mm) but different FMs. They all had lowervoid content than single-sized CAs although the surface area ofsome graded CAs might be higher than that of some single-sizedCAs. Due to the lower void content, the concrete made with gradedCAs required less amount of mortar to fill up the voids among CAparticles and more excess mortar will be available to coat theaggregate surface, thus improved concrete flow ability and reducedyield stress and viscosity.
0
4
8
12
16
20
19.0mm 12.5mm 9.5mm 4.75mm
M1 (s/c=1.75 w/c=0.45), Vca=35%M2 (s/c=2.21 w/c=0.45), Vca=38%M2 (s/c=2.21 w/c=0.45), Vca=41%
Aggregate size
Inte
rcep
tion
(Nm
)
0
3
6
9
12
15
19.0mm 12.5mm 9.5mm 4.75mm
M1 (s/c=1.75 w/c=0.45), Vca=35%M2 (s/c=2.21 w/c=0.45), Vca=38%M2 (s/c=2.21 w/c=0.45), Vca=41%
Aggregate size
Slop
e (N
mS)
Fig. 6. Effect of coarse aggregate size on rheological parameters of concrete.
0G1 G2 G3
Aggregate gradation
Fig. 7. Effect of coarse aggregate gradation on rheological parameters of concrete.
As seen in Fig. 6, when single-sized CA was used, concrete yieldstress and viscosity generally increased with reduced CA size. Thistrend is consistent with previous research and probably related tothe reduced size (or increased surface area) of CA [1,4]. Smalleraggregates are generally considered to require more paste andmortar due to the increase surface area to be coated, thus concretewith same mix design yet smaller size of aggregate generally resultin higher yield stress and viscosity. However, results as shown inFig. 7 indicated that when concrete was made with graded CAs,the differences in yield stress and viscosity of the correspondingconcrete became less, which might be attributed to the relativesmall differences in the void content, friction angle, and surfacearea used in graded CA used in present study.
The CA size or surface area apparently controls the concreterheological behavior: the small size or low FM (or the higher sur-face area) of the CA, the higher yield stress and viscosity of the cor-responding concrete. However, results showed that the frictionangle of CA also appeared to play an important role in the concreterheology as the higher the CA friction angle, the high the concreteyield stress and viscosity. It is observed that within mixes with s/c = 2.21, w/c = 0.45, and Vca = 41%, concrete made with 4.75 mmsingle-sized aggregate showed lower viscosity comparing to themix with 9.5 mm single-sized aggregate while yield stress showclear trend of increase with the decreasing of aggregate size. Thephenomenon is probably due to the combined effect from bothfriction angle and surface area (FM) of aggregate. According to Ta-ble 3, a fine CA used in present study usually had a small frictionangle. The opposite effects of the CA surface area and friction anglemight make the overall effect of CA on concrete rheology vague.
1202 J. Hu, K. Wang / Construction and Building Materials 25 (2011) 1196–1204
Further study is needed on the combined effects of aggregate voidcontent, friction angle, and surface area.
4.5. Concrete slump
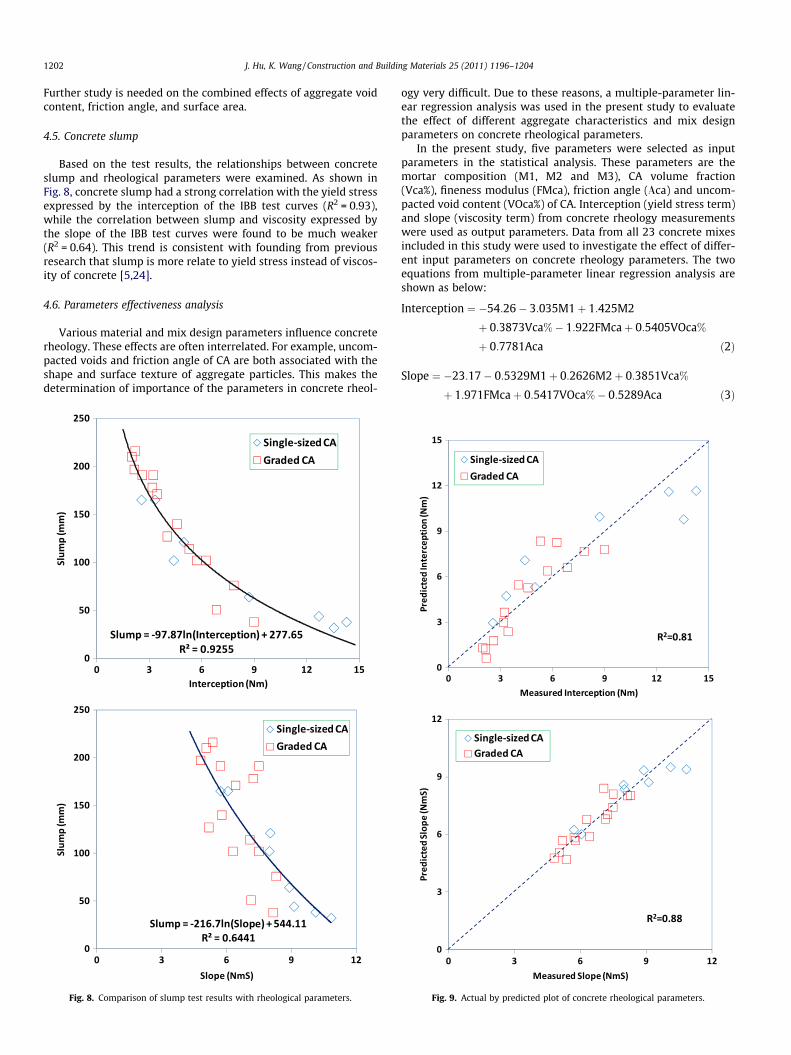
Based on the test results, the relationships between concreteslump and rheological parameters were examined. As shown inFig. 8, concrete slump had a strong correlation with the yield stressexpressed by the interception of the IBB test curves (R2 = 0.93),while the correlation between slump and viscosity expressed bythe slope of the IBB test curves were found to be much weaker(R2 = 0.64). This trend is consistent with founding from previousresearch that slump is more relate to yield stress instead of viscos-ity of concrete [5,24].
4.6. Parameters effectiveness analysis
Various material and mix design parameters influence concreterheology. These effects are often interrelated. For example, uncom-pacted voids and friction angle of CA are both associated with theshape and surface texture of aggregate particles. This makes thedetermination of importance of the parameters in concrete rheol-
Fig. 8. Comparison of slump test results with rheological parameters.
ogy very difficult. Due to these reasons, a multiple-parameter lin-ear regression analysis was used in the present study to evaluatethe effect of different aggregate characteristics and mix designparameters on concrete rheological parameters.
In the present study, five parameters were selected as inputparameters in the statistical analysis. These parameters are themortar composition (M1, M2 and M3), CA volume fraction(Vca%), fineness modulus (FMca), friction angle (Fca) and uncom-pacted void content (VOca%) of CA. Interception (yield stress term)and slope (viscosity term) from concrete rheology measurementswere used as output parameters. Data from all 23 concrete mixesincluded in this study were used to investigate the effect of differ-ent input parameters on concrete rheology parameters. The twoequations from multiple-parameter linear regression analysis areshown as below:
Interception ¼ �54:26� 3:035M1þ 1:425M2
þ 0:3873Vca%� 1:922FMcaþ 0:5405VOca%
þ 0:7781Aca ð2Þ
Slope ¼ �23:17� 0:5329M1þ 0:2626M2þ 0:3851Vca%
þ 1:971FMcaþ 0:5417VOca%� 0:5289Aca ð3Þ
Fig. 9. Actual by predicted plot of concrete rheological parameters.
Inte
rcep
tion
(Nm
)
14
0
Slop
e (N
mS)
8
0
Mortar
M1
M2
M3
Vca%
35 41
FMca
6 8
VOca%
42.4
47.1
Aca
44.5 50
Fig. 10. Effects of mix design and coarse aggregate characteristics on concrete rheology.
J. Hu, K. Wang / Construction and Building Materials 25 (2011) 1196–1204 1203
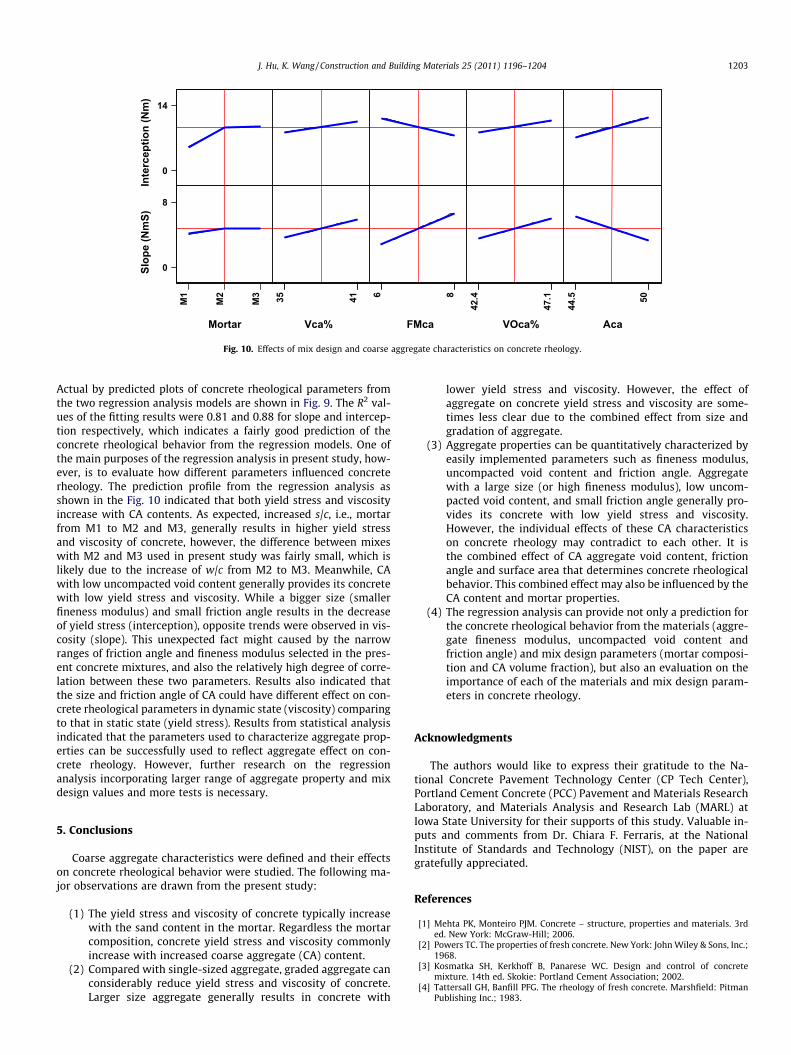
Actual by predicted plots of concrete rheological parameters fromthe two regression analysis models are shown in Fig. 9. The R2 val-ues of the fitting results were 0.81 and 0.88 for slope and intercep-tion respectively, which indicates a fairly good prediction of theconcrete rheological behavior from the regression models. One ofthe main purposes of the regression analysis in present study, how-ever, is to evaluate how different parameters influenced concreterheology. The prediction profile from the regression analysis asshown in the Fig. 10 indicated that both yield stress and viscosityincrease with CA contents. As expected, increased s/c, i.e., mortarfrom M1 to M2 and M3, generally results in higher yield stressand viscosity of concrete, however, the difference between mixeswith M2 and M3 used in present study was fairly small, which islikely due to the increase of w/c from M2 to M3. Meanwhile, CAwith low uncompacted void content generally provides its concretewith low yield stress and viscosity. While a bigger size (smallerfineness modulus) and small friction angle results in the decreaseof yield stress (interception), opposite trends were observed in vis-cosity (slope). This unexpected fact might caused by the narrowranges of friction angle and fineness modulus selected in the pres-ent concrete mixtures, and also the relatively high degree of corre-lation between these two parameters. Results also indicated thatthe size and friction angle of CA could have different effect on con-crete rheological parameters in dynamic state (viscosity) comparingto that in static state (yield stress). Results from statistical analysisindicated that the parameters used to characterize aggregate prop-erties can be successfully used to reflect aggregate effect on con-crete rheology. However, further research on the regressionanalysis incorporating larger range of aggregate property and mixdesign values and more tests is necessary.
5. Conclusions
Coarse aggregate characteristics were defined and their effectson concrete rheological behavior were studied. The following ma-jor observations are drawn from the present study:
(1) The yield stress and viscosity of concrete typically increasewith the sand content in the mortar. Regardless the mortarcomposition, concrete yield stress and viscosity commonlyincrease with increased coarse aggregate (CA) content.
(2) Compared with single-sized aggregate, graded aggregate canconsiderably reduce yield stress and viscosity of concrete.Larger size aggregate generally results in concrete with
lower yield stress and viscosity. However, the effect ofaggregate on concrete yield stress and viscosity are some-times less clear due to the combined effect from size andgradation of aggregate.
(3) Aggregate properties can be quantitatively characterized byeasily implemented parameters such as fineness modulus,uncompacted void content and friction angle. Aggregatewith a large size (or high fineness modulus), low uncom-pacted void content, and small friction angle generally pro-vides its concrete with low yield stress and viscosity.However, the individual effects of these CA characteristicson concrete rheology may contradict to each other. It isthe combined effect of CA aggregate void content, frictionangle and surface area that determines concrete rheologicalbehavior. This combined effect may also be influenced by theCA content and mortar properties.
(4) The regression analysis can provide not only a prediction forthe concrete rheological behavior from the materials (aggre-gate fineness modulus, uncompacted void content andfriction angle) and mix design parameters (mortar composi-tion and CA volume fraction), but also an evaluation on theimportance of each of the materials and mix design param-eters in concrete rheology.
Acknowledgments
The authors would like to express their gratitude to the Na-tional Concrete Pavement Technology Center (CP Tech Center),Portland Cement Concrete (PCC) Pavement and Materials ResearchLaboratory, and Materials Analysis and Research Lab (MARL) atIowa State University for their supports of this study. Valuable in-puts and comments from Dr. Chiara F. Ferraris, at the NationalInstitute of Standards and Technology (NIST), on the paper aregratefully appreciated.
References
[1] Mehta PK, Monteiro PJM. Concrete – structure, properties and materials. 3rded. New York: McGraw-Hill; 2006.
[2] Powers TC. The properties of fresh concrete. New York: John Wiley & Sons, Inc.;1968.
[3] Kosmatka SH, Kerkhoff B, Panarese WC. Design and control of concretemixture. 14th ed. Skokie: Portland Cement Association; 2002.
[4] Tattersall GH, Banfill PFG. The rheology of fresh concrete. Marshfield: PitmanPublishing Inc.; 1983.
1204 J. Hu, K. Wang / Construction and Building Materials 25 (2011) 1196–1204
[5] Tattersall GH. Workability and quality control of concrete. New York: E & FNSpon.; 1991.
[6] Ferraris CF. Measurement of the rheological properties of high performanceconcrete: state of the art report. J Res Natl Inst Stan 1999;104(5):461–77.
[7] Geiker MR, Brandl M, Thrane LN, Nielsen LF. On the effect of coarse aggregatefraction and shape on the rheological properties of self-compacting concrete.Cem Concr Aggr 2002;24(1):3–6.
[8] Jamkar SS, Rao CBK. Index of aggregate particle shape and texture of coarseaggregate as a parameter for concrete mix proportioning. Cem Concr Res2004;34(11):2021–7.
[9] Smith MR, Collis L. Aggregates – sand, gravel and crushed rock aggregates forconstruction purposes. 3rd ed. London: The Geological Society; 2001.
[10] Struble LJ, Szecsy R, Lei W, Sun G. Rheology of cement paste and concrete. CemConcr Aggr 1998;20(2):269–77.
[11] Kurokawa Y, Tanigawa Y, Mori H, Nishinosono K. Analytical study on effect ofvolume fraction of coarse aggregate on Bingham’s constants of fresh concrete.T Jpn Concr I 1996;18:37–44.
[12] Topcu IB, Kocataskin F. A two-phase composite materials approach to theworkability of concrete. Cem Concr Comp 1995;17(4):319–25.
[13] Das BM. Principles of geotechnical engineering. Boston: PWS Engineering;1985.
[14] Lambe TW. Soil mechanics. New York: John Wiley & Sons; 1969.
[15] Chik Z, Vallejo LE. Characterization of the angle of repose of binary granularmaterials. Can Geotech J 2005;42(2):683–92.
[16] Pandian NS, Sridharan A, Srinivas S. Angle of internal friction for pond ashes. JTest Eval 2000;28(6):443–54.
[17] Banfill PFG. Rheological methods for assessing the flow properties of mortarand related materials. Constr Build Mater 1994;8(1):43–50.
[18] Schramm G. A practical approach to rheology andrheometry. Karlsruhe: Gebrueder HAAKE GmbH; 1994.
[19] Tattersall GH. The workability of concrete. London: Viewpoint Publication,Cement and Concrete Association; 1976.
[20] ACI. Report on measurements of workability and rheology of fresh concrete.ACI 238. 1R-08. Farmington Hills: American Concrete Institute; 2008.
[21] Hu J, Wang K. Effects of size and uncompacted voids of aggregate on mortarflow ability. J Adv Concr Technol 2007;5(1):75–85.
[22] Oh SG, Noguchi T, Tomosawa F. Toward mix design for rheology of self-compacting concrete. In: Tokyo: RILEM international symposium on self-compacting concrete; 1999.
[23] Mindess S, Young JF, Darwin D. Concrete. 2nd ed. Upper Saddle River: PrenticeHall; 2003.
[24] Murata J, Kikukawa H. Viscosity equation for fresh concrete. ACI Mater J1992;89(3):230–7.