Embed Size (px)
Citation preview
Effect of Cladding Systems on Moisture Performance of Wood-Framed Walls in a Mixed-Humid Climate
S. Craig Drumheller Charles G. CarllMember ASHRAE
ABSTRACT
A 22-month field investigation of nine different north- and south-oriented wood-framed wall assemblies was conducted todetermine the moisture performance of various wall construction types, most of which incorporated absorptive cladding. Thestudy was conducted on the campus of the National Association of Home Builders (NAHB) Research Center, in Upper Marlboro,MD, 20 miles east of Washington, DC, in a mixed humid climate. Moisture content of the sheathing and wall cavity temperatureswere measured at various points in each wall section. The primary performance measure was moisture content of the wood-basedstructural sheathing.
Under normal weather exposure, the studs and sheathing in all walls investigated remained well below 20% moisture content.South-facing walls with direct solar exposure resulted in dryer sheathing. Walls with non-absorptive cladding (vinyl siding andinsulated vinyl siding) had among the lowest sheathing moisture contents recorded in the study; this was the case for walls thatfaced either north or south. Low sheathing moisture contents were also recorded in the south-facing walls with (a relatively darkcolor) manufactured stone cladding and in the south-facing wall with brick veneer cladding.
Controlled injections of water behind the cladding indicated that some walls were less able to drain (or otherwise dissipate)the injected water than were others. Stucco-clad walls with only one layer of water-resistive barrier (WRB) showed the least abilityto dissipate injected water. Walls with manufactured stone cladding (which incorporated two layers of WRB) showed a lesser abil-ity to dissipate injected water than walls with most of the other cladding systems, but greater ability than stucco-clad walls witha single layer of WRB.
INTRODUCTION
Moisture issues such as mold and rot, especially in exte-rior walls, have become a growing concern in residentialconstruction, particularly as building envelopes have becometighter and have incorporated higher levels of thermal insula-tion as a result of more stringent energy codes and a growingconsumer demand for comfortable and energy-efficienthomes. Older homes, where wall insulation levels were loweror nonexistent and air infiltration, beyond minimizing drafts,was not a concern, are generally believed to be more forgivingof minor water intrusion because of their higher capability fornatural drying. Therefore, the design of walls constructed tocurrent specifications needs to include consideration of the
ability to manage moisture, in addition to energy efficiencyrequirements. This study investigated moisture conditions in avariety of wall assemblies that meet current building coderequirements.
Builders are often influenced by architects and homebuyers to select exterior cladding systems based on aestheticconsiderations. According to US Census Bureau (2009a)statistics, over half of all new homes are clad with absorptivematerials such as brick, stucco, wood, fiber cement, and stone(Figure 1). Especially in humid climates, the increased popu-larity of absorptive claddings has led to a growing number ofproblems with moisture accumulation in exterior wallsystems. The problems have been exacerbated by complicated
© 2010 ASHRAE.
S. Craig Drumheller is a senior research engineer with the NAHB Research Center, Upper Marlboro, MD. Charles G. Carll is a technologistat the Forest Products Laboratory, US Department of Agriculture (USDA) Forest Service, Madison, WI.

architecture, fewer overhangs, and confusing water and vaporbarrier requirements. Concern over the effect of moisture onthe durability of homes provided the impetus to study thehygrothermal performance of walls with various exterior clad-ding systems.
Every climate has its own characteristics that must beconsidered when designing a wall system. The mixed humidclimate has unique conditions, which typically include mois-ture migration from the inside of a structure during the winterand from the outside during the summer. These dynamic hygro-thermic conditions can be problematic for certain wall assem-blies. The mixed humid climate is defined by the followingcharacteristics: (1) more than 20 in. of annual precipitation,(2) fewer than 5400 annual heating degree days (base 65°F),and (3) an average monthly winter temperature below 45°F.
WOOD MOISTURE THRESHOLDS
There are industry-established moisture thresholds forwood products at which durability or performance problemsmay occur. The threshold levels are driven by concerns relat-ing to rated structural performance, decay, and mold. Woodbuilding materials, and assemblies constructed of wood andwood-based products, perform best when they remain dry.
Prominent organizations in the wood industry havedefined a dry condition for engineered wood products (EWP)as moisture content (MC) of less than 16%, and for solid woodless than 19%; these levels relate to rated structural perfor-mance. When wood products are used in conditions wheremoisture contents exceed these levels, the National DesignSpecification requires that wet service factors be applied(American Forest and Paper Association 2005). The service
factors derate the design values for material strength and stiff-ness. Engineers apply these service factors when they expectthat in-service moisture conditions will exceed the thresholds(16% for EWP; 19% for wood). The primary reason thethreshold moisture content is set lower for engineered woodproducts than for solid wood is that engineered wood productshave lower equilibrium moisture contents than solid wood atequivalent relative humidity conditions (Carll and Wieden-hoeft 2009).
The dry design threshold conditions are essentially equiv-alent to equilibrium moisture conditions with room tempera-ture air and a relative humidity just below 90% (see Table 3-4 in Simpson and TenWolde [1999]). This corresponds with amoisture level just below the long-recognized 20% moisturecontent (MC) threshold for wood, which will prevent propa-gation of decay, even in wood previously infected with decayfungi (Carll and Highley 1999). In fresh, uninfected wood andwood products, decay is only likely to be established whenmoisture content exceeds the fiber saturation point (average30% MC in lumber) at temperatures between 50°F and 95°F.The long-recognized 20% threshold provides a margin ofsafety with regard to preventing decay propagation.
The same moisture threshold value that determines appli-cation of wet service factors is also assumed by the wood prod-ucts industry to be the upper limit of in-service moisturecontent limit for wood-based structural panels (APA 2002).The industry applies the same assumed limit to in-servicemoisture content of both plywood and oriented strand board(OSB) panels.
Conditions necessary to minimize mold growth have beenoutlined in the first edition of ANSI/ASHRAE Standard 160-2009: Criteria for Moisture-Control Design Analysis in Build-ings. The values in the standard translate to lower maximumallowable in-service moisture contents for engineered woodproducts than the value assumed by the industry (APA 2002).The mold growth prevention criteria outlined in ASHRAEStandard 160 consist of three parameters: time, temperature,and surface relative humidity. The criterion with the longesttime duration element (30-day running average) specifies thatsurface relative humidity not exceed 80%; this correspondswith a solid wood moisture content of 16%, which approxi-mately equates to a plywood MC of 14% and OSB MC of 13%(Richards et al. 1992).
STUDY OBJECTIVE
The objective of this research was to quantify the fieldperformance of wood-frame walls clad with a variety ofcommon claddings in a mixed-humid climate. Performancewas judged primarily on measurements of in-situ moisturecontent of the wood-based (oriented strand board or plywood)sheathing. Nine different wall designs were evaluated in thisstudy.
The study was designed to identify relative moistureperformance for light frame wall assemblies in a mixed humidclimate with a variety of cladding systems. Some of the wall
Figure 1 Principal type of exterior wall cladding on newconstruction.Source: US Census (2009b).
2 Buildings XI

assemblies differed substantially in both cladding type andmoisture handling, while others were of similar type andappearance but differed with regard to their moisture drainagedesign. A related study objective was to identify the relativecapabilities of the different wall assemblies to dissipate mois-ture should wetting occur.
TECHNICAL APPROACH
Selection of the wall designs evaluated in this study wasbased in part on their use in new construction. Wall claddingtypes selected in this study represent roughly 90% of theprimary claddings used in new construction in the UnitedStates (see Figure 1). The various wall constructions wereexpected to exhibit a range of hygrothermal performance.Final selection of the walls was made by industry profession-als on the basis of their common use and practical constructa-bility.
For each of the nine wall designs, a pair of wall test panelswas evaluated, one of which was placed in north-facing expo-sure, while the other was placed in south-facing exposure.Each wall panel pair was installed in one of two test structuresconstructed on the NAHB Research Center campus in UpperMarlboro, MD. Five of the wall pairs were commissioned inJanuary 2008; these were installed in the first test structure.The other four wall pairs were commissioned in November2008; these were installed in a second test structure, alsolocated on the National Association of Home Builders(NAHB) Research Center campus. A solar site survey wasconducted to verify that walls in the two structures receivedequal solar exposure. Moisture conditions in the nine pairswere monitored through October 2009. The interior of eachbuilding was climate controlled (temperature and winterhumidity) to simulate common indoor residential conditions.Detailed measurements of indoor and outdoor environmentalconditions and the moisture content of studs and sheathingwere used to determine hygrothermal performance of eachassembly.
The study was thus primarily based on field monitoring ofmoisture conditions in test wall panels, but also involved addi-tional testing, some of which was conducted in the laboratoryand some of which was conducted in the field.
FIELD MONITORING
Both test structures had a nominal footprint of 8 ft by 48 ft(Figure 2). Each building allowed for five pairs of 8 ft wide by9 ft high wall test panels to be installed as exterior wallsections, with one panel of each pair having cardinallyoriented southern exposure and the other panel of the pairhaving northern exposure. Test structure 1 was constructed onsite and was commissioned in January 2008. The secondbuilding was prefabricated and delivered to the site; walls werethen added on site, with data collection for the walls beginningin November 2008.
The 8 ft × 9 ft test panels were framed with 2 in. × 4 in.studs, sheathed with OSB or plywood. The panels included
various combinations of cladding and drainage strategies,which are described in the following section of this report. Awindow is located on the west end of the building and anentrance door is located on the east. The interior was finishedwith two coats of latex paint over 1/2 in. drywall. The perim-eter of each wall section was caulked to eliminate flanking airinfiltration. The floor is raised approximately 2 ft from theground and insulated with R-19 fiberglass batt insulation. Theroof is shingled on 4/12 pitch trusses and insulated to R-30 atthe attic ceiling interface. Even though the first structure ispermanent and the second is semimobile, they wereconstructed to nearly identical specifications. Roof overhangwas limited to the 4 in. gutter; test panel exteriors therefore hadappreciable exposure to the elements. All products wereinstalled in accordance with manufacturer recommendationsor, if recommendations were unavailable, in accordance withthe prevailing building code (IRC 2003).
Portable air conditioners were set to limit the maximuminterior summer temperature to 78°F, and resistance heatmaintained indoor temperature in the winter at 70°F. A humid-ifier maintained a winter indoor relative humidity between 25and 30%.
Wall Panel Assemblies
The nine wall panel designs evaluated in the study areoutlined in Table 1. The panels included four with stucco clad-ding. Three of these had OSB sheathing, and these threediffered with regard to drainage strategy for the claddingsystem; the fourth stucco-clad wall design had plywoodsheathing. One of the wall designs had synthetic stone clad-ding, one had lap fiber-cement siding, and one had brickveneer cladding. The wall with brick veneer had a nominal1 in. gap between the sheathing (covered with a water-resistivebarrier) and the back face of the brick. Two wall designs hadnonabsorptive cladding; one of these had insulated vinyl
Figure 2 Test buildings 1 (right) and 2 (left).
Buildings XI 3

siding, while the other had unbacked vinyl siding. As indi-cated previously, all walls were constructed with 2 × 4 fram-ing; studs were at 16 in. (405 mm) on-center (o.c.) spacing.Stud cavities were insulated with R-13 kraft-faced glass fiberbatt insulation, which was face-stapled.
Sensor Placement and Data Collection
In order to monitor conditions within wall sections, eachwas instrumented with 44 sensors (Figure 3) capable ofrecording temperatures, relative humidity, and wood mois-ture content. Each sensor included two, uninsulated 2 in.stainless steel screws that secure it to wood framing or sheath-ing. The screws penetrated 0.4 in. (10 mm) into the substrateto obtain a conductance reading related to substrate moisturecontent. The sensors had an MC measurement range of 7% to40% (initially calibrated to Douglas fir), a temperature rangeof –40°F (–40°C) to 185°F (85°C), and a relative humidityrange from 0% to 100%. The measurement interval wasprogrammable, and was set to 30 minutes. Data were trans-mitted wirelessly at each reading time to a local gateway,which in turn periodically transmitted the data via the Internetto a database maintained by the sensor manufacturer. Thesensor manufacturer provided temperature compensation ofthe conductance readings obtained from the screw electrodes.The temperature reading that was used for compensation was,however, taken at a location separated from the screw tips byroughly 35 mm. For conductance readings taken in sheathing,the temperature compensation may, under some conditions,thus be less than ideal. All moisture content readings weregravimetrically calibrated to the material (plywood and OSB,inclusive of resin mass). The calibration adjustment that wasfound necessary for plywood was substantial (considerablylarger than that needed for either SPF lumber or OSB), partic-ularly at higher moisture content levels. The nature of the cali-bration adjustment that was found necessary for plywoodconcurred with that found necessary by Glass and Carll(2009).
Weather Data
A weather station was mounted on the roof of the first teststructure. The station included a wind vane and anemometer tomeasure wind direction and speed, a temperature and humid-ity sensor, a tipping-bucket rain gage, and a horizontallyinstalled spectral pyranometer to measure solar radiation. Acustom-designed, wind-driven rain gauge and a verticallypositioned spectral pyranometer were also installed on thenorth and south walls of the first test structure to better under-stand the conditions at the wall surface.
Weather conditions over the 2008–2009 monitoringperiod were reasonably similar to the 30-year historical aver-age conditions at Andrews Air Force Base, located roughly10 miles from the NAHBRC campus (Table 2). For the last12 months of the monitoring period (November 2008–October 2009), the number of heating degree days was nearlyidentical to the historical average (4440 vs. 4421 HDD). Thesummer of 2009 was milder than average, with only 1097CDD compared to a 1241 average. Rainfall was also close to
Table 1. Test Wall Configurations
Panel # Building Sheathing Water Resistive Barrier Exterior Cladding
1- Vinyl 1 7/16 in. OSB Spun bonded polyolefin Vinyl siding
2- Stucco 1 1 7/16 in. OSB 1 layer No. 15 felt Stucco
3- Stucco 2 1 7/16 in. OSB 2 layers No. 15 felt Stucco
4- Stucco Vent 1 7/16 in. OSB SBP 3/8” gap #15 felt Stucco
5- Manu Stone 1 7/16 in. OSB 2 layers No. 15 felt Manufactured stone
6- Ins Siding 2 7/16 in. OSB Spun bonded polyolefin Insulated Vinyl Siding
7- Fiber Cement 2 7/16 in. OSB Spun bonded polyolefin Fiber Cement Siding
8- Stucco/Plywood 2 1/2 in. Plywood 2 layers No. 15 felt Stucco
9- Brick 2 7/16 in. OSB Spun bonded polyolefin Brick
Figure 3 Sensor locations and wall framing.
4 Buildings XI

historical average with the 12-month accumulation totaling39.8 in.; just 2.1 in. shy of normal.
ADDITIONAL TESTING
Permeance Testing
Published data for vapor permeance were available forsome of the materials used in the wall sections. Laboratorytesting of the materials used in construction of test wallsections was nonetheless performed. This was deemed appro-priate to account for product variation, which may occurbetween manufacturers, manufacturing plants, and productionruns within a given manufacturing plant. Testing was accord-ing to ASTM E96-05, Standard Test Methods for Water VaporTransmission of Materials. Permeance tests were performedon the same lots of material that were used to construct wall
panels. Test results are presented in Table 3. The test values formost materials were in general concurrence with publishedvalues (Kumaran et al. 2002; ASHRAE 2009). The measuredvalues for permeance of painted gypsum drywall were,however, substantially higher than the values listed byASHRAE for paint films, or by Kumaran et al. for paintedgypsum drywall.
Vented Cladding Air Change Rate Testing
As indicated in Table 1, one of the stucco-clad walldesigns selected for evaluation (wall pair #4) included a 3/8 in.(10 mm) gap between the cladding and the sheathing. The topof the furred space was blocked, but the bottom was open toallow drainage and some degree of ventilation. In order tocharacterize the ventilation rate of the space over the 22-monthmonitoring period, tracer gas testing was conducted on six
Table 2. Weather Data and Historical Averages
Andrews AFB - ASHRAE/NOAA Historical Averages NAHBRC Weather Station Data
Average
Temp., °FPrecipita-tion, in.
Heating Degree
Days, °F
Cooling Degree
Days, °F
Average Temp., °F
Precipita-tion, in.
Heating Degree
Days, °F
Cooling Degree
Days, °F
January 34.6 3.5 943 0 Jan. 08 36.5 1.1 798 0
February 37.7 3.0 764 0 Feb. 08 39.1 2.9 754 2
March 45.1 3.9 622 5 Mar. 08 46.0 2.8 476 0
April 54.8 3.0 324 19 Apr. 08 56.4 7.1 264 14
May 63.8 3.9 117 79 May 08 62.7 3.4 126 54
June 72.7 3.4 12 242 Jun. 08 75.2 5.6 0 305
July 77.7 3.9 1 394 Jul. 08 77.1 3.5 0 375
August 75.6 3.7 2 330 Aug. 08 73.0 2.3 0 249
September 68.4 4.0 44 145 Sep. 08 69.3 4.5 25 154
October 57.3 3.2 263 24 Oct. 08 55.5 1.2 311 17
November 48.1 3.1 510 3 Nov. 08 46.1 2.7 566 0
December 38.6 3.4 819 0 Dec. 08 40.4 2.5 762 0
Year 56.3 42.0 4421 1241 Year 56.4 39.6 4081 1170
January 34.6 3.5 943 0 Jan. 09 30.7 2.6 1062 0
February 37.7 3.0 764 0 Feb. 09 39.8 0.3 706 0
March 45.1 3.9 622 5 Mar. 09 44.6 1.5 638 4
April 54.8 3.0 324 19 Apr. 09 56.6 4.0 305 51
May 63.8 3.9 117 79 May 09 64.1 3.9 83 61
June 72.7 3.4 12 242 Jun. 09 72.2 7.9 10 226
July 77.7 3.9 1 394 Jul. 09 74.9 1.0 0 306
August 75.6 3.7 2 330 Aug. 09 76.5 4.6 0 357
September 68.4 4.0 44 145 Sep. 09 66.6 2.8 31 80
October 57.3 3.2 263 24 Oct. 09 56.5 6.0 277 14
Jan–Oct 58.8 35.5 3092 1238 Jan–Oct 58.2 34.6 3112 1097
Buildings XI 5
separate days during the test period to determine air exchangerate in the space between the sheathing and the stucco claddingof wall pair #4. Tests were performed by injecting sulfur hexa-fluoride (SF6) into the cavity, then monitoring the decay of theSF6 concentration with a gas analyzer using the ASTM Stan-dard E741-00 protocol.
Although there were insufficient test data to adequatelycorrelate vented cladding air exchange rates with environmen-tal conditions, the data nonetheless indicated an approximateair exchange rate and provided some indication of meteoro-logical influences on the exchange rate. Measured airexchange rates varied between 2 and 28 air changes per hour,and generally were higher in the south wall, in the winter, andduring the day.
WATER INJECTION TESTING
Water resistive barriers (WRBs) are intended to blockpassage of water that breaches the cladding system. Penetra-tion of water behind a WRB is, however, not unusual, andoften occurs around windows and other penetrations. In orderto understand how the wall sections responded when waterbreached their cladding systems, controlled water injectionswere made into each of the wall sections. The water injectionswere performed daily over five consecutive days in August2009. An increase in sheathing moisture readings relative tothose in an unaffected area indicated the degree to which theinjected water was absorbed into the sheathing. The readingsfrom one of the seven sensors in the sheathing in each of thetest wall sections were potentially affected by the water injec-tion events.
The five consecutive days during which injections weremade began at noon on August 3, 2009. On each day, 30 mLof water was injected through each of two 1/4 in. hoses,installed at the time of construction, which directed water toeach side of the WRB (for a daily injection of 60 mL total).One of the tubes terminated between the WRB and the clad-ding (or between the WRBs when two WRB layers were pres-ent), while the other terminated between the WRB and thesheathing. The successive injections were intended to simulatea leak from a multiday storm.
Moisture Content of Sheathing
Over the course of the testing, sheathing moisture contentwas consistently well below 18%. Only the first weekly read-ing for the wall pair with plywood sheathing (which wasstucco-clad) was in excess of 20%. During the first week ofmonitoring, construction moisture in walls with wet-placedcladding systems was being dissipated. Once the moisturefrom wet-placed cladding systems was dissipated, the over-whelming majority of sheathing measurements remained at orbelow 16% MC. The exceptions were brief excursions above16% sheathing MC in both plywood-sheathed walls and thenorth-facing stucco wall with one WRB layer. During theseexcursions, the moisture content levels nonetheless remainedbelow the respective equilibrium values at 90% relativehumidity (Richards et al. 1992; Kumaran et al. 2002).
Walls with “wet-placed” claddings, such as stucco andmanufactured stone, generally had higher sheathing moisturecontents than walls with other claddings. Sheathing moisturecontents in south-facing walls with unventilated wet-placedcladdings were generally higher than in south-facing wallswith other cladding systems; the exception to this was the wallwith manufactured stone cladding, which showed relativelydry readings in the sheathing. This, as explained later, appearsto have been associated with warm sheathing temperatureconditions in that wall, attributed to direct solar gains.
The wall pair that consistently had among the highestsheathing moisture content was the pair with plywood sheath-ing (which had stucco cladding over two layers of felt).Figures 4 and 5 show that the plywood had elevated moisturecontent at the start of monitoring. This suggests significantwetting of the plywood during installation of the (wet-placed)cladding system. This may reflect an inherent differencebetween plywood and OSB: in an unweathered condition,OSB is more resistant to water absorption than is sheathing-grade plywood (Quarles and Flynn 2001; Kumaran et al 2002).The stucco on the wall pair with plywood sheathing was,however, applied at a slightly different time of year than anyof the four other wet-placed claddings (which were all on theother test building) and was applied by a different contractor.This difference in construction history could have been acontributing factor that affected wetting of the sheathing. In
Table 3. Tested Wall Material Specifications
Material Thickness, in. Density, lb/ft3 Permeance (Dry Cup) Permeance (Wet Cup)
Drywall 0.489 37.9 48 44
Painted drywall 0.496 38.6 40 40
OSB 0.448 41.5 4.1 4.5
Stucco 0.758 51.2 4.3 5.5
Manufactured stone (trimmed) 0.767 99.9 2.8 5.1
Spun bonded polyolefin 0.005 35.4 36 35
No. 15 asphalt felt 0.018 68.3 6.9 13.9
Stud (trimmed) 0.699 21.5 0.6 6.1
6 Buildings XI

the north-facing exposure, sheathing moisture content in theplywood-sheathed wall reached levels essentially comparableto those in an otherwise similar OSB-sheathed wall afterroughly 7 months (Figure 5). In south-facing exposure, incontrast, sheathing moisture content the plywood-sheathedwall remained higher than in any other wall over the length ofthe monitoring period (Figure 4).
The north-facing wall with manufactured stone claddingshowed elevated sheathing MC levels at commissioning,although not as high as in the stucco-clad wall with plywood
sheathing. Sheathing moisture contents in this wall settled toa level below 15% after approximately 6 months. This walltook longer to dissipate its construction moisture than anyother wall, except for the wall with plywood sheathing. Afterdissipation of the construction moisture, sheathing MC levelsin this wall were roughly equivalent to those in unventednorth-facing stucco-clad walls. Sheathing moisture contentsof walls clad with manufactured stone were highly dependenton the direction the walls faced. From September 2008onward, the south-facing wall with stone cladding showed
Figure 4 Sheathing moisture content: south.
Figure 5 Sheathing moisture content: north.
Buildings XI 7

lower sheathing moisture content than most other walls,whereas the corresponding north-facing wall showed highersheathing moisture contents than most other walls, and inJanuary and February 2009 showed higher sheathing moisturecontent than any other wall.
In summary, 3 of the 18 walls monitored in this studyshowed sheathing moisture contents (after dissipation ofconstruction moisture) that sometimes exceeded 16%. Thesewere the stucco-clad walls sheathed with plywood (north- andsouth-facing exposures) and the north-facing stucco-clad wallwith OSB sheathing and a single layer of #15 felt. When in-service sheathing moisture contents exceeded 16%, they didso for limited periods of time. The three best performing wallswere insulated vinyl siding, brick with a 1 in. air gap, and tradi-tional vinyl siding.
Wall Cavity Temperature
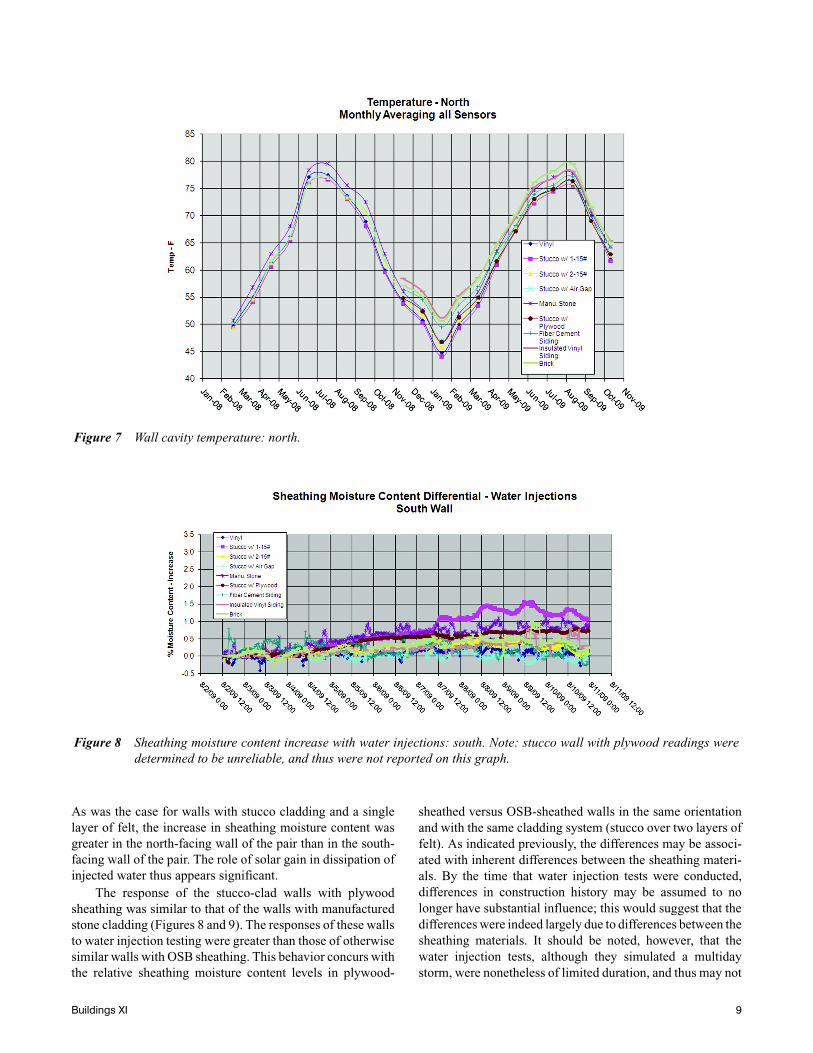
Over the monitoring period, wall cavity temperatures insouth-facing walls were consistently warmer than in north-facing walls (Figure 6). During winter months, the warmestwall in north-facing orientation was the wall clad with insu-lated vinyl siding; the next warmest cavity temperaturesduring winter (after those in the wall clad with insulatedsiding) were observed in the wall clad with brick veneer,followed by the wall clad with lap fiber cement siding (Figure7). This indicates that air spaces behind the cladding system(including the discontinuous spaces provided by installationof lap siding) provided some thermal benefit during winter.
Figure 6 clearly indicates that the south-facing walls withbrick and manufactured stone cladding had notably higher
within-wall temperatures than were found in most of the otherwalls over most of the monitoring period. Over the period ofNovember 2008 through early April 2009, the wall with insu-lated siding was warmer than the wall with manufacturedstone cladding, but otherwise, the walls with brick and withmanufactured stone claddings were the warmest walls over themonitoring period. The likely explanation for the relativelyhigh temperatures in these walls is the ability of the claddingsystems to absorb and store radiant solar gains. In the north-facing wall with manufactured stone cladding, within-walltemperatures did not differ substantially from those in wallsclad with either stucco or uninsulated vinyl siding (Figure 7).The relatively high temperatures in south-facing walls withdarker brick and stone cladding influenced moisture condi-tions in these walls.
Water Injection Testing
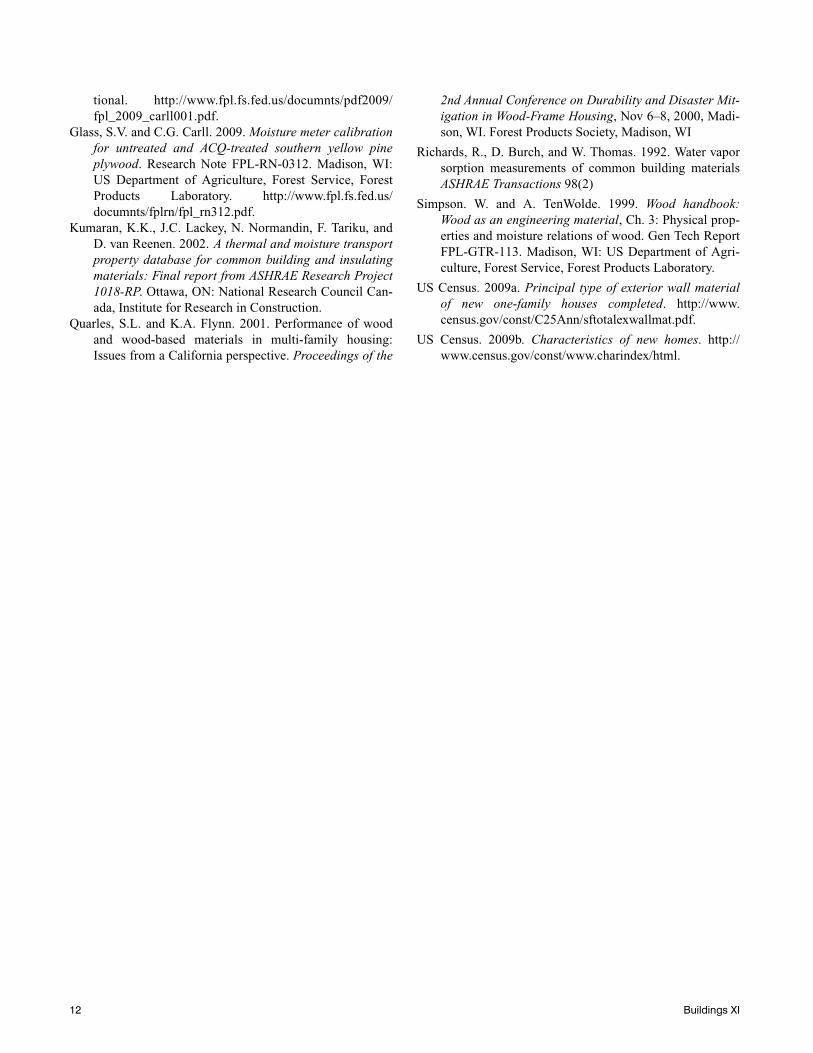
Water injection testing resulted in distinctly differentmoisture responses in different wall types. Only three of thenine wall pairs showed a sustained increase of greater than0.5% moisture content. The wall pair that showed the greatestincrease (3% north, 1.5% south) in sheathing moisture contenthad stucco cladding over a single layer of felt (Figures 8 and9) for both orientations. The other two walls that showed anoticeable increase were the manufactured stone wall and theplywood sheathed stucco wall.
The wall pair with manufactured stone cladding showedan increase in sheathing moisture content in response to waterinjection testing, but to a lesser degree than the wall pair withstucco cladding and a single layer of WRB (Figures 8 and 9).
Figure 6 Wall cavity temperature: south.
8 Buildings XI
As was the case for walls with stucco cladding and a singlelayer of felt, the increase in sheathing moisture content wasgreater in the north-facing wall of the pair than in the south-facing wall of the pair. The role of solar gain in dissipation ofinjected water thus appears significant.
The response of the stucco-clad walls with plywoodsheathing was similar to that of the walls with manufacturedstone cladding (Figures 8 and 9). The responses of these wallsto water injection testing were greater than those of otherwisesimilar walls with OSB sheathing. This behavior concurs withthe relative sheathing moisture content levels in plywood-
sheathed versus OSB-sheathed walls in the same orientationand with the same cladding system (stucco over two layers offelt). As indicated previously, the differences may be associ-ated with inherent differences between the sheathing materi-als. By the time that water injection tests were conducted,differences in construction history may be assumed to nolonger have substantial influence; this would suggest that thedifferences were indeed largely due to differences between thesheathing materials. It should be noted, however, that thewater injection tests, although they simulated a multidaystorm, were nonetheless of limited duration, and thus may not
Figure 7 Wall cavity temperature: north.
Figure 8 Sheathing moisture content increase with water injections: south. Note: stucco wall with plywood readings weredetermined to be unreliable, and thus were not reported on this graph.
Buildings XI 9

necessarily be indicative of relative performance in walls thatexperience chronic leakage over weeks, months, or years.
CONCLUSIONS
Over the monitoring period, sheathing in all of the ninepairs of walls (18 walls) evaluated in this study generallyremained below the industry-recognized moisture contentthreshold level of 16%, although there were some exceptions.Three of the wall pairs (six walls) did not incorporate wet-placed cladding materials; in these walls, and in walls withbrick veneer cladding, there was little indication of construc-tion moisture, and the sheathing in these walls remainedsubstantially below 16% MC throughout the monitoringperiod. North-facing walls clad with manufactured stone andstucco-clad walls with plywood sheathing (facing either northor south) had the highest initial moisture contents and were theslowest to dry. In stucco-clad walls with plywood sheathingand in the north-facing stucco-clad wall with a single layer of#15 felt, there were periods after dissipation of constructionmoisture when sheathing moisture contents briefly exceeded16%.
There were two primary mechanisms that acted to lowerin-service moisture content of the wood-based sheathings: aircirculation and wall temperature. Air circulation behind thecladding contributed to the drying capability of the vinylsiding, brick, stucco (3/8 in. furred), and, to a lesser extent,fiber cement siding. Higher wall cavity temperatures generallycorrelated with lower sheathing moisture contents. This wasespecially true with insulated vinyl siding and darker clad-dings with southern solar exposure such as brick and manu-factured stone.
The 30-day mold-growth-minimizing criterion outlinedin ASHRAE Standard 160 (a running average surface RH
below 80% RH) effectively specifies lower sheathing moisturecontents than the 16% wet service factor threshold value. Asindicated previously, an 80% surface RH value correspondswith approximately 13% MC for OSB and 14% MC forplywood. The ASHRAE Standard 160 criterion also has atemperature component: the surface RH criterion applieswhen the 30-day running average temperature exceeds 41°F(5°C). The ASHRAE Standard 160 criterion was not exceededin six of the nine south-facing walls. The three south-facingwalls in which the criterion was exceeded were stucco-cladand without an air gap. In contrast, the criterion was exceededin six of the nine north-facing walls. The north-facing wallswhere the criterion was not exceeded were the walls clad withvinyl siding, insulated vinyl siding, and brick veneer. It isimportant to note that the mold-growth-inhibition criteriaoutlined in ASHRAE Standard 160 are termed “conditionsnecessary to minimize mold growth.” If the ASHRAE Stan-dard 160 criteria are exceeded, there is some risk of moldgrowth, but mold growth will not necessarily occur. ASHRAEStandard 160 acknowledges that criteria for inhibition of moldare typically more restrictive than other moisture limitationcriteria applicable to buildings; thus, this criterion was notconsidered determinate on the performance of the wall assem-blies. In addition, core samples of the sheathing were exam-ined at the conclusion of the study period, and no evidence ofmold growth was observed on either side of the sheathing.
Additional observations, based on sheathing moisturecontent readings, were as follows:
• Orientation and solar exposure are important factors inwall performance. All north-facing walls experiencedhigher moisture and cavity humidity readings than the
Figure 9 Sheathing moisture content increase with water injections: north. Note: stucco wall with plywood readings weredetermined to be unreliable, and thus were not reported on this graph.
10 Buildings XI

corresponding south-facing wall of the same construc-tion.
• The wall pair with vented stucco cladding performedbetter than any other wall clad with stucco. The perfor-mance of this pair was similar to that of the wall pairwith the fiber cement lap siding.
• The two walls with dark claddings performed quite dif-ferently on the south than the north. South-facing wallswith brick (dark red) and manufactured stone (dark earthtones) had relatively high cavity temperatures through-out the monitoring period (although during coldweather, cavity temperatures in the wall with insulatedsiding were higher than in the wall with manufacturedstone).
• The wall pair with insulated vinyl siding had the lowestall-around sheathing moisture content values. This isattributed to warmer within-wall temperatures duringthe heating season, which are afforded by the exteriorinsulation provided by the foam backing. The warmertemperatures result in lower within-wall relative humid-ity values, corresponding lower equilibrium moisturecontent, and increased drying capacity.
• The wall pair clad with brick veneer was among the dri-est of all the walls evaluated in this study. The 1 in. airgap along with the increased absorptance (darker color)evidently provided increased drying capability.
• Manufactured stone had the greatest sensitivity to orien-tation. Sheathing moisture content was reduced bynearly a third in the south-facing wall with manufac-tured stone cladding (14% north, 10% south). This wasattributed to the higher wall cavity temperatures due tothe radiant gains on the southern exposure.
• Vinyl siding generally provided for consistently drysheathing conditions. The loose fit of the siding allowedthe wall to dry from the inside toward the outside, whilethe siding also shed bulk moisture.
• A second layer of water-resistive barrier becomes criti-cal for stucco applications when bulk moisture getsbehind the cladding. Stucco-clad walls with one and twoWRB layers performed comparably under normal expo-sure; however, when moisture was injected, the sheath-ing in the wall with two layers of WRB had virtually noincrease in moisture content, while the sheathing in boththe north- and south-facing stucco-clad walls with a sin-gle layer of WRB saw moisture increases of up to 3.5%MC over the five-day injection period.
• The north-facing wall with manufactured stone clad-ding, which had two WRB layers, did not perform aswell as the north-facing stucco-clad wall with two WRBlayers and the same sheathing material (OSB).
• Wall assemblies with an air gap (fiber cement, vinyl,stucco with 3/8 in. gap, and brick veneer) saw no sus-tained increase in sheathing moisture content duringmoisture injections.
Although moisture problems and building failures relatedto moisture have been seen in the field on absorptive clad-dings, extended high moisture levels were not observed in thisstudy. The problems that have been experienced in residencescould be due to a variety of factors: material selection, work-manship problems, elevated interior humidity conditions,increased weather exposure, and/or lack of design consider-ations. A more thorough effort is necessary to adequatelyunderstand moisture-related wall failures.
ACKNOWLEDGEMENTS
This report was prepared by the NAHB Research Centerunder sponsorship of the Forest Products Laboratory withjoint research conducted for the US Department of Housingand Urban Development, the Brick Industry Association, andProgressive Foam Technologies, Inc. Achilles Karagiozis,Theresa Weston, and Anton TenWolde provided guidance andcomment in the development of the study plan. NAHBResearch Center staff Lance Barta and Kevin Kauffman wereinstrumental in gathering and compiling millions of datapoints used in this report.
REFERENCES
American Forest and Paper Association. 2005. NationalDesign Specification for Wood Construction: ANSI/AF&PA NDS-2005 (refer to section C4.1.4 on pg 193)
ASHRAE. 2009. ANSI/ASHRAE Standard 160-2009: Crite-ria for Moisture-Control Design Analysis in Buildings.Atlanta: American Soc. of Heating, Refrigerating andAir-Conditioning Engineers, Inc.
ASHRAE. 2009. ASHRAE Handbook—Fundamentals, Ch.26: Heat, air, and moisture control in building assem-blies—Material properties; Tables 7 and 8. Atlanta:American Soc. of Heating, Refrigerating and Air-Condi-tioning Engineers, Inc.
APA. 2002. Moisture exposure recommendations for woodstructural panels: Form No. TT-002. Tacoma, WA:APA—The Engineered Wood Association.
ASTM. 2005 ASTM E96-05: Standard Test Methods forWater Vapor Transmission of Materials. West Con-shohocken, PA: ASTM International.
ASTM. 2006. ASTM E741-00(2006)e1, Standard TestMethod for Determining Air Change in a Single Zone bymeans of a Tracer Gas Dilution. West Conshohocken,PA: ASTM International.
Carll, C. and T. Highley. 1999. Decay of wood and wood-based products above ground in buildings. ASTM Jour-nal of Testing and Evaluation 27(2):150–58. http://www.fpl.fs.fed.us/documnts/pdf1999/carll99a.pdf.
Carll, C. and A.C. Wiedenhoeft. 2009. Moisture-relatedproperties of wood and the effects of moisture on woodand wood products: In Moisture control in buildings:The key factor in mold prevention, Chapter 4, pp. 54–79, H.R. Trechsel and M.T. Bomberg, eds. ASTMMNL18-2. West Conshohocken, PA: ASTM Interna-
Buildings XI 11
tional. http://www.fpl.fs.fed.us/documnts/pdf2009/fpl_2009_carll001.pdf.
Glass, S.V. and C.G. Carll. 2009. Moisture meter calibrationfor untreated and ACQ-treated southern yellow pineplywood. Research Note FPL-RN-0312. Madison, WI:US Department of Agriculture, Forest Service, ForestProducts Laboratory. http://www.fpl.fs.fed.us/documnts/fplrn/fpl_rn312.pdf.
Kumaran, K.K., J.C. Lackey, N. Normandin, F. Tariku, andD. van Reenen. 2002. A thermal and moisture transportproperty database for common building and insulatingmaterials: Final report from ASHRAE Research Project1018-RP. Ottawa, ON: National Research Council Can-ada, Institute for Research in Construction.
Quarles, S.L. and K.A. Flynn. 2001. Performance of woodand wood-based materials in multi-family housing:Issues from a California perspective. Proceedings of the
2nd Annual Conference on Durability and Disaster Mit-igation in Wood-Frame Housing, Nov 6–8, 2000, Madi-son, WI. Forest Products Society, Madison, WI
Richards, R., D. Burch, and W. Thomas. 1992. Water vaporsorption measurements of common building materialsASHRAE Transactions 98(2)
Simpson. W. and A. TenWolde. 1999. Wood handbook:Wood as an engineering material, Ch. 3: Physical prop-erties and moisture relations of wood. Gen Tech ReportFPL-GTR-113. Madison, WI: US Department of Agri-culture, Forest Service, Forest Products Laboratory.
US Census. 2009a. Principal type of exterior wall materialof new one-family houses completed. http://www.census.gov/const/C25Ann/sftotalexwallmat.pdf.
US Census. 2009b. Characteristics of new homes. http://www.census.gov/const/www.charindex/html.
12 Buildings XI


![Methods to determine wood moisture content and their ... · Fig. 2: Influence of wood moisture content on selected wood properties, from [1] The dimensional changes of wood due to](https://img.pdfslide.us/doc/110x75/5d51837388c993ad428bcaf8/methods-to-determine-wood-moisture-content-and-their-fig-2-influence-of.jpg)