Embed Size (px)
Citation preview

Proceedings of the 2nd World Congress on Civil, Structural, and Environmental Engineering (CSEE’17)
Barcelona, Spain – April 2 – 4, 2017
Paper No. ICGRE 107
ISSN: 2371-5294
DOI: 10.11159/icgre17.107
ICGRE 107-1
Effect of Cavities on the Behaviour of Model Pile under Axial Loading in Sand
Ali Al-Jazaairry, Tahsin Toma Sabbagh University of Salford
Manchester, UK
[email protected]; [email protected]
Abstract - Presence of cavities in soils is an important area of interest within the field of geotechnical engineering. A better
understanding of the behaviour of such soils, particularly in locations where the presence of gypsum deposits is apparent, will have a
large impact on the stability of foundations and allows designers and engineers to have a convincing explanation of this phenomenon
on the stability of foundations in general. The research offers an experimental investigation to study the performance of axially loaded
piles embedded in sandy soils with cavities. The experimental study comprised a full laboratory testing programme carried out on small
scale piles embedded in predetermined cavities within a soil mass. The experimental model has the capability to investigate the effect
of different cavity locations on the ultimate pile resistances. Thirteen cavity locations were chosen to study their influence on the
ultimate carrying load of single pile. It was concluded that the maximum ultimate carrying load of the pile is reduced by the presence of
the cavity within the soil mass. This reduction varies according to the cavity location. The effect of cavity’s presence on the ultimate
bearing capacity of pile ranged from 0% to 30.82% for side cavities, while the range of reduction factor for cavities under the pile tip is
from 31.58% to 43.4%. The reduction in pile capacity increases when the cavity is closer to the pile. Also, pile settlement value without
cavity is less than the settlement of the same pile with cavity.
Keywords: Axial load, Cavity, Pile, Sand
1. Introduction Unlike most structural materials, behaviour of soils is regarded as complicated material. These soils have to be dealt
with carefully to use the structures built on them safely. One of the most common problems in soils is the presence of
cavities. Soils comprise cavities are usually titled “problematic soils” since cavities might cause structural destruction and
loss of life. Cavities can be divided into two types, natural and man-made cavities. Natural cavities are due to extinction
(dry set) of some seas or water areas, dissolvable materials including limestone, salt, dolomite and mainly gypsum and
thawing of subsurface ice lenses. Different sizes of cavities in sandy soil ranging from 100 mm to 3000 mm have been
encountered by [1] as illustrated in Fig. 1. Artificial cavities are due to tunnelling or mining activities, underground piping
maintenance and old conduits vault (oldest) building. Therefore, the sudden failure of structures founded on these soils is
normal to happen due to the formation of cavities before or after load application. Moreover, when structures are
constructed on soils with cavities, cracks develop within the walls and roofs of the buildings due to the differential
settlement.
Piles are the most common deep foundation elements which are used for transmission the external loads to inferior
layers within the soil mass. This transference might be done by a straight load application to a lower level over the pile
point, or the vertical load distributes along the pile shaft. A direct load application is made by an end-bearing pile, and a
vertical load distribution is through using a floating (or friction) pile [2].
2. Previous Work Investigations on the performance of piles above cavities are limited in the available literature; merely rare studies
associated with this topic matter are available. [3] studied the behaviour of strip foundation located on a continuous void.
An evaluation was made for two cases, one for without void condition and another for the void at 102 mm beneath the
footing. The load carrying capacity of the foundation for each test condition was acquired from the point at which the slope

ICGRE 107-2
of the foundation pressure versus settlement curve becomes a minimum constant value. [4] investigated cavity influence on
the stability of strip foundation in two layer soils. For each soil layer, the ultimate bearing capacity for no cavity case was
also determined. The no cavity bearing capacity value was used to obtain the reduction factor for each condition.
Fig. 1: Photographs for different cavities with different sizes and locations in Al-Najaf city / Iraq [1].
[5] studied the influence of tunnelling prompt soil movements on piles. The outcomes revealed that for the condition
of a single friction pile, generated bending moments are normally slight when the horizontal distance between the pile and
the centre of the tunnel is more than 2 tunnel diameter. [6] examined the performance of piles embedded in sandy soils,
which contain cavities, under lateral load. It has been found that the number and location of cavities have a combined
impact on the behaviour of the pile under lateral load. The influence of cavities situated in front of the pile is negligible at
X/D > 8 where X is the distance between pile and cavity and D is the pile’s diameter. [1] investigated the behaviour of a
laterally loaded pile embedded into the cohesionless soil of Al-Najaf city with the cavity. The experimental results
indicated that the model tests for a shallow or very deep cavity with negative distance ratio (the ratio of the horizontal
distance between cavity and pile to pile width = -8) bears more load than the condition of positive distance ratio. The effect
of the cavity presence on the nearby buildings particularly piled structures has been studied by [7]. [8] utilised the finite
element software (PLAXIS) to inspect load carrying capacity and failure mechanism of strip foundation situated on soil
with twin voids. They proposed that a critical distance between voids and a critical depth of them occur in which there was
no influence of voids on the ultimate capacity of foundation. This study presented an experimental and numerical analysis
to examine the behaviour of pile model embedded in sand of dry unit weight 16.8 kN/m3. The settlement of the pile
embedded in soil without a cavity is much less than that with the cavity; the reduction ratio is about 60%-70%.
The previous revision showed a necessity to improve the stability analysis method for piled foundations placed in
cavited soil. An important element required for the development is the pile’s ultimate carrying capacity and displacement
behaviour. This paper offers the bearing capacity behaviour of floating pile embedded in sandy soil with cavities. As a
model study on this topic, this study is limited to floating pile located close to continuous cavities of regular shape and
subjected to vertical central loading.
3. Bearing Capacity of Piles The main factors in which the bearing capacity of foundations relies on are the water conditions in the soil, original
stresses, and the mechanical properties of the soil, such as shearing strength, deformation characteristics, density, the
physical characteristics of the foundation, such as shape, size, roughness, and depth and the installation method [9].
However, [9] and [10] suggested the failure zone near the pile base. It has been believed that the failure zone is mainly
shear failure kind as well as the rupture surfaces expand to a specific distance over the pile tip. It is suggested that the
failure zone shape is a logarithmic spiral. Additionally, the failure zone height raises by the increasing in soil friction angle.
The methods of determining failure loads are based on load-displacement curves. A failure load, as suggested by
Terzaghi, might be defined as that which produces a displacement equal to 10 percent of the pile width or diameter which
is commonly taken by engineers. However, there are some other reported criteria for describing the load at failure of piled
foundations.

ICGRE 107-3
4. Sand Properties The soil used is Leighton Buzzard silica sand from Leighton Buzzard town in Bedfordshire, England. Standardised
tests were conducted to reveal the physical and engineering properties of the sand according to the BS specifications. The
grain size distribution of the sand used is shown in Fig. 2, whereas details of the soil properties are shown in Table 1.
For quality assurance, the particle size distribution tests were performed on four soil samples. The angle of internal
friction is concluded by performing the direct shear box test which was conducted at a unit weight of 16.5 kN/m3.
Table 1: Physical properties of the soil used in the tests.
Index property Unit Value/description Specification
Specific gravity, Gs 2.66 BS 1377-2
Effective size D10 mm 0.24 BS 1377-2
D30 mm 0.38 BS 1377-2
Mean grain size D50 mm 0.46 BS 1377-2
D60 mm 0.49 BS 1377-2
Particle size range mm 0.063 - 1.18 Sieve analysis
Coefficient of uniformity, Cu 2.04 ASTM
Coefficient of curvature, Cc 1.23 ASTM
Soil classification SP* USCS**
Soil Textural Classification Sand USDA***
AASHTO classification A-3 AASHTO****
Maximum dry unit weight γd(max) kN/m3 18.14 BS 1377-4
Minimum dry unit weight γd(min) kN/m3 15.51 BS 1377-4
Angle of internal friction (Φ) at Dr = 17 degree 38.6 BS 1377-7 *SP = Sand, Poorly graded. **USCS = Unified Soil Classification System. *** USDA = U.S. Department of Agriculture. ****AASHTO = American Association of State Highway and Transportation Officials.
Fig. 2: Grain size distribution curve of soil sample.
5. Testing Apparatus The experimental work has been carried out in the heavy structure’s Laboratory of the school of computing, science
and engineering at the University of Salford. The testing apparatus, see Fig. 3, consists of loading unit, reaction frame, pile
model, temporary pile holder, box of test soil and measuring system. These units have been employed to simulate soil-pile-
cavity system in order to study the influence of the presence of cavity in different locations on the load carrying capacity of
the single pile.
5.1. The Loading Unit The loading unit consists of screw jack attached to the electronically controlled motor. The screw jack has a maximum
capacity of 5 kN. During the experimental test programme, the rate of the load was kept unchanging at 1 mm/min, refer to
[11]. Additionally, the loading unit consists of reaction frame used for holding loading unit. It consists of vertically
movable arm which is raised by a hydraulic jack and supported by two tension bars to prevent the arm from moving
upward during load application period. The loading system is shown in Fig. 3 and Fig. 4.

ICGRE 107-4
Fig. 3: Schematic diagram of the test setup.
(a)
(b)
Fig. 4: Load Application System (a) The whole reaction Frame (b) Screw jack attached to the motor.
5.2. Model Pile The model piles used in this study are rough aluminium pipe piles. The model pile surface has been made rough by
gluing dry sand particles carefully on the shaft and bottom of the pile as suggested by [12] and [13] to simulate soil to soil
interaction and to develop frictional properties of the pile. The outside diameter of pile is 18 mm, and the wall thickness is
1.7 mm, whereas the pile length is kept at 255 mm at all stages of the testing programme, whereas the free length of the
pile above the sand bed level is maintained at 25 mm.
A free head pile condition is maintained for load application at all stages. In order to achieve this, a smooth
hemisphere metal ball is welded to the head of the pile model. A temporary pile holder was manufactured to keep the pile
in position while the sand is being put in the test box. After completing this stage, the pile holder is raised up.

ICGRE 107-5
5.3. Testing Box A wooden test box (container) has been used with inside dimensions of (600 mm) in width, (600 mm) in length and
(700 mm) in height. The dimensions have been chosen so that no wall effect will influence the tests. Upon selection of the
box dimensions, the following points were taking into account:
1. Piled raft foundation under lateral loading, the size of the box should be extended up to 12d and 4d, where d is a pile
diameter, in the direction parallel and perpendicular to the lateral load respectively. Additionally, a distance of at least 6d
must be kept below the pile tip, refer to [14].
2. To avoid the effect of tip resistance on diameter/width of the container, the ratio of the box diameter to the model
pile diameter should be larger than 30 in sand [15], where this ratio in the current test is 40.
3. Effect of container walls might intensely decrease the vertical stress with depth, to prevent side friction of the
container walls; the ratio of the box height to the diameter must be ≤ 1 [16] and [17].
4. To eliminate the effects of box boundaries on the behaviour of axially loaded piled foundation, pile tip should be left
for a distance greater than pile length (l) from the container bottom [18].
5.4. Sand density control technique Soil samples for all tests were prepared by filling dry soil in a temporary container, then 4% moisture content is
gradually added to the mass of soil using a water sprinkler and mixed thoroughly with the soil. Care is taken to mix the
water evenly. The temporary container is made of plastic to avoid any loss in moisture content during the mixing
procedure. To maintain an equal density, the test box is divided into 14 layers by a permanent marker on glass sides, each
layer with 50 mm in height. The wet soil is weighed on an electronic scale to the required weight, (to occupy one layer),
for the aim of obtaining the soil unit weight. Then the mixture is spread inside the test box and compacted with wooden
tamping hammer until the soil reached the height equivalent to 50 mm. The compaction process was carefully performed to
produce a homogeneous sample that could be used in a parametric study in a laboratory testing programme. This operation
is repeated until the final height is reached.
5.5. Forming of the Cavity Cavity locations have been chosen to be at certain distances from the pile as shown in Fig. 5. Those locations, both
vertically and horizontally, have been taken and shown as percentages of pile diameter and pile length. Holes in both
perspective glass sides were made according to these locations. A Teflon PolyTetraFluoroEthylene (PTFE) mold rod, with
an outside diameter (D) equals to 30 mm, has been selected to create cavities. This material has been chosen because of its
low coefficient of friction (μs) comparing with other materials, (μs = 0.05 – 0.10). The Teflon rod placed in the required
hole before filling the soil in the box to form the cavity in that specific location. Following the placement of the required
Teflon rod, soil filling continued till the final level of the bed of soil (ground surface level) as shown in Fig. 4. Plugs, made
of wood block and metal plate, are used to close the unused cavity openings in order to stop the soil extraction out from
these openings. After placing the model pile and completion of the soil bed, the rod is pulled gently out of the container
leaving formed cavity in the predetermined location as shown in Fig. 6.
5.6. The Measuring System a. Displacement measurement
Vertical displacements of the model pile measured using Linear Variable Differential Transformer (LVDT) which
connected to data logger. This LVDT has been connected to the pile using thin wires to avoid any interfering with loading
system.

ICGRE 107-6
Fig. 5: Problem geometry showing pile and cavity locations in the test rig.
Fig. 6: Cavity Formed after removing Teflon rod.
b. Load measurement
A load cell was used to measure the applied load with a maximum capacity 200 kg. A connection box is used to
connect the load cell and the LVDT to the data logger in order to measure and display the load and displacements values
on the computer. Computer software, Catman version 3.5, has been used to visualise and analyse measured data.
6. Testing Programme The testing program was planned to consist of thirteen compressive tests on the vertical pile to study the effects of the
presence of cavities on the performance of bored piles subjected to axial load. The depth of embedment of pile (l = 230
mm), pile length (L = 255 mm), pile diameter (d = 18 mm) and free length of the pile above the bed of the soil surface level
equal to (25 mm). The cavity location was varied from 0d to 6.2d from pile centreline in horizontal direction and from

ICGRE 107-7
0.16l to 1.3l from the soil surface in vertical direction as shown in Fig. 5. In addition, one test without cavity has been
conducted as reference test. In order to evaluate the repeatability and approve the reliability of the small scale laboratory
test outcomes, a repetition of the original test with the same conditions has been carried out at least twice. Consequently,
by conducting a sequence of check tests before starting to accept the test results, it has been found that changing in water
content and soil unit weight has an appreciable effect on the test results. Therefore, to overcome this, the box fulling
operation has followed a certain procedure by maintaining a soil layers technique and using Moisture Analyser device
throughout all tests.
When piles are subjected to vertical loading alone, horizontal displacements are very small compared to vertical
displacements. To facilitate comparisons between the different tests, the dimensionless geometric parameters are given in
terms of the following forms:
X/d = 0, 2, 4.1 and 6.2.
Z/l = 0.16, 0.33, 0.66, 1, 1.14 and 1.3.
7. Experimental Results and Discussion This section includes discussion of the effects of the presence of cavities on the performance of vertically loaded piles.
To facilitate comparisons between the model tests, the geometric parameters are presented in terms of the following
dimensionless forms:
(X/d): the ratio of cavity horizontal distance from pile centreline to pile diameter, X/d = 0, 2, 4.1 and 6.2.
(Z/L): the ratio of the depth of the cavity to the pile embedment length, Z/L = 0.16, 0.33, 0.66, 1, 1.14 and 1.3.
Reviewing the load-displacement curves for all tests shows that these curves do not show a peak behaviour, with the
axial loading increasing with the increase of pile displacement. Therefore, failure loads for the current set of tests were
evaluated using the load required to produce a displacement corresponding to 10% of the pile diameter as suggested by
[19]. Generally, the 10% pile diameter method gives the lowest value of failure load comparing with other failure criteria.
Moreover, the results of the tests are presented as relationships between the load in the pile that represents the load cell
indicator readings and the settlement that represents the LVDT readings.
Fig. 7 illustrates the load-displacement curve of single pile embedded in soil without cavity as a reference case as well
as cavities in different locations. Fig. 7(a) shows the load-settlement curves of single pile embedded in soil with X = 0d at
different depths, while Fig. 7(b) presents the load-displacement curves of single pile embedded in soil with X = 2d at
different depths. Similarly, Fig. 7(c) and Fig. 7(d) reveals the load-displacement curves of single pile embedded in soil at
different depths with X = 4.1d and X = 6.2d respectively.
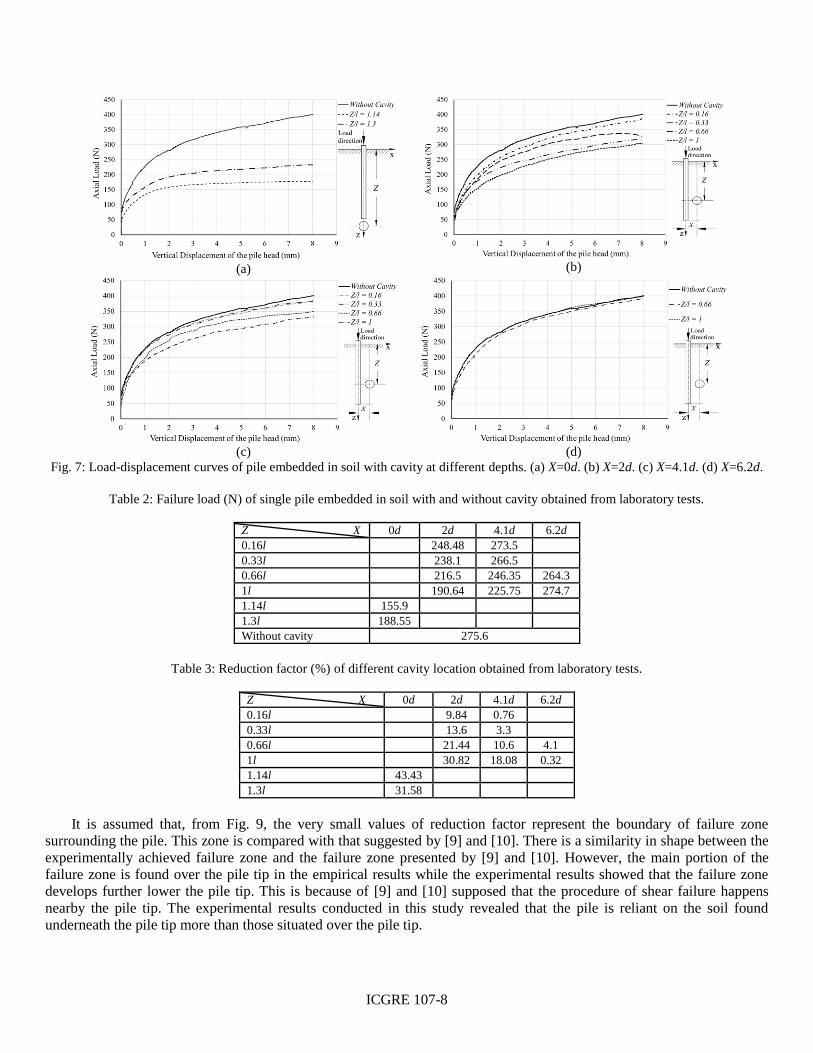
Table 2 shows the values of the failure load obtained from laboratory tests. From this table, it can be seen that the
cavity presence in the soil decreases the load carrying capacity of the pile. The reduction factor in the ultimate pile capacity
is defined as:
𝑅eduction Factor= load without cavity - load with cavity
load without cavity
Table 3 reveals the values of the reduction factor in percent for all cavities in different cavity locations. The summary
of the effect of the cavity location of the ultimate carrying load of the pile is illustrated in Fig. 8 as a reduction factor in
percent versus Z/l ratio for different X/d ratios. To simplify the effect of the cavity locations on the load carrying capacity
of floating pile, the reduction factors in percent of each cavity position have been drawn in Fig. 9.
ICGRE 107-8
(a)
(b)
(c)
(d)
Fig. 7: Load-displacement curves of pile embedded in soil with cavity at different depths. (a) X=0d. (b) X=2d. (c) X=4.1d. (d) X=6.2d.
Table 2: Failure load (N) of single pile embedded in soil with and without cavity obtained from laboratory tests.
Z X 0d 2d 4.1d 6.2d
0.16l 248.48 273.5
0.33l 238.1 266.5
0.66l 216.5 246.35 264.3
1l 190.64 225.75 274.7
1.14l 155.9
1.3l 188.55
Without cavity 275.6
Table 3: Reduction factor (%) of different cavity location obtained from laboratory tests.
Z X 0d 2d 4.1d 6.2d
0.16l 9.84 0.76
0.33l 13.6 3.3
0.66l 21.44 10.6 4.1
1l 30.82 18.08 0.32
1.14l 43.43
1.3l 31.58
It is assumed that, from Fig. 9, the very small values of reduction factor represent the boundary of failure zone
surrounding the pile. This zone is compared with that suggested by [9] and [10]. There is a similarity in shape between the
experimentally achieved failure zone and the failure zone presented by [9] and [10]. However, the main portion of the
failure zone is found over the pile tip in the empirical results while the experimental results showed that the failure zone
develops further lower the pile tip. This is because of [9] and [10] supposed that the procedure of shear failure happens
nearby the pile tip. The experimental results conducted in this study revealed that the pile is reliant on the soil found
underneath the pile tip more than those situated over the pile tip.

ICGRE 107-9
Fig. 8: Reduction in carrying loads versus Z/L for different X/d.
Fig. 9: Reduction factor (%) of different cavity locations obtained from laboratory tests.
8. Conclusion The results that are obtained from the laboratory tests have revealed the effect of cavity presence on the flexible pile
behaviour in sandy soil. Below are the conclusions that can be drawn from the achieved experimental results.
1. The pile settlement reduces with the increase of the ratio of the horizontal distance of cavity centreline to pile
diameter (X/d).
2. The influence of the cavity position in horizontal distance X/d ≥ 6.2 can be neglected when the ratio between the
cavity depth to pile length Z/l ≤ 0.33 or Z/l ≥ 1.0.
3. Maximum reduction factor of 43.4% and 31.6% was achieved at X/d = 0 and at cavity depth Z/l equals to 1.0 and 1.3
respectively.
4. When X/d = 2 the reduction factor ranged from 9.84 to 30.82 at cavity depths Z/l of 0.16 and 1.0 respectively.
Moreover, for X/d = 4.1 the reduction factor is about (0.8% to 18 %) at cavity depth Z/l of 0.16 and 1.0 respectively.
5. The range of the influence of side cavities is from 0% to 30.82% from the load carrying capacity of pile whereas the
range of cavities under the pile tip is from 31.58% to 43.4%.
6. Based on the experimental results, the influence of the cavity position in horizontal distance X/d ≥ 6.2 can be
neglected when the ratio between the cavity depth to pile length Z/l ≤ 0.66.

ICGRE 107-10
7. Experimental analysis illustrates that the failure zone near the pile tip is generally extended beneath the pile tip. This
lead to conclude that the load carrying capacity of piles is reliant on the soil properties located beneath the pile base more
that those situated over the pile tip.
It is to note that the pile load carrying capacity improves with the increase of the X/d ratio in all occasions and it can
be attributed to the following reasons:
1. Decrease of the effective zone influenced by the presence of cavity.
2. When the cavity is located at close range to the pile, it will reduce the soil density at that zone and hence decreases
the shaft friction along the pile and leads to a decrease in the pile failure load.
3. At large distances from the pile; (X/d = 6.2), the reduction factor was found to decrease especially at (Z/l =1.0).
References [1] L. J. Aziz, “Lateral Resistance of Single Pile Embedded in Sand with Cavities,” in Ph.D. thesis, University of
Technology, Iraq, 2008.
[2] J. E. Bowles, Foundation analysis and design, 5th ed. McGraw-Hill International Book Company, 1988.
[3] A. Badie, M. C. Wang, “Stability of Spread Footing above Void in Clay,” Journal of Geotechnical Engineering-
Asce, vol. 110, no. 11, pp. 1591-1605, 1984.
[4] G. Azam, M. Jao, M. C. Wang, “Cavity effect on stability of strip footing in two-layer soils,” Geotechnical
Engineering, vol. 28, no. 2, 1997.
[5] C. Y. Cheng, G. R. Dasari, C. F. Leung, Y. K. Chow, H. B. Rosser, “3D numerical study of tunnel-soil-pile
interaction,” Tunnelling and Underground Space Technology, vol. 19, no. 4, pp. 381-382, 2004.
[6] M. J. Al-Mosawe, Y. J. Al-Shakarchi, S. M. Al-Taie, “Embedded in sandy soils with cavities,” Journal of
Engineering, vol. 13, no. 1, pp. 1168-1187, 2007.
[7] H. H. Abed, “Effect of Cavity in Sandy Soil on Load Distribution of Pile Group,” in the Building and Construction
Engineering Department, University of Technology, Iraq, 2013.
[8] A. A. Lavasan, A. Talsaz, M. Ghazavi, T. Schanz, “Behavior of Shallow Strip Footing on Twin Voids,”
Geotechnical and Geological Engineering, pp. 1-15, 2016.
[9] G. G. Meyerhof, “The ultimate bearing capacity of foudations,” Geotechnique, vol. 2, no. 4, pp. 301-332, 1951.
[10] E. E. De Beer, “The scale effect in the transposition of the results of deep-sounding tests on the ultimate bearing
capacity of piles and caisson foundations,” Geotechnique, vol. 13, no. 1, pp. 39-75, 1963.
[11] J. E. Bowels, Engineering Properties of Soils and Their Measurement 2ed: McGraw-Hill International Book
Company, Tokyo, Japan, 1978.
[12] S. Roy, B. C. Chattopadhyay, R. B. Sahu, “Pile behavior under inclined compressive loads–a model study,”
Electronic Journal of Geotechnical Engineering, vol. 18, pp. 2187-2205, 2013.
[13] Y. J. Al-Shakarchi, M. Y. Fattah, I. K. Kashat, “The behaviour of batter piles under uplift loads,” in Proceedings of
international conference on geotechnical engineering, Sharjah. 2004.
[14] M. Khari, K. A. Kassim, A. Adnan, “An experimental study on pile spacing effects under lateral loading in sand,”
Scientific World Journal, pp. 1-8, 2013.
[15] M. D. Bolton, et al., “Centrifuge cone penetration tests in sand,” Geotechnique, vol. 49, no. 4, pp. 543-552, 1999.
[16] O. Ternet, “Reconstitution et caractérisation des massifs de sable: application aux essais en centrifugeuse et en
chambre de calibration,” Université de Caen, 1999.
[17] J. Garnier, “Physical models in geotechnics: state of the art and recent advances,” in First Coulomb lecture, Caquot
Conference, Paris, 2001.
[18] K. Horikoshi, M. F. Randolph, “Estimation of overall settlement of piled rafts,” Soils and Foundations, vol. 39, no.
2, pp. 59-68, 1999.
[19] K. Terzaghi. Theoretical Soil Mechanics, John Wiley & Sons, New York, 1943.


![Module 2 - Pile Group Effect [Compatibility Mode]](https://img.pdfslide.us/doc/110x75/55cf905b550346703ba524d2/module-2-pile-group-effect-compatibility-mode.jpg)