Embed Size (px)
Citation preview
Effect of Catalysts on the Pyrolysis of TurkishZonguldak Bituminous Coal
Nursen Altuntas Oztas† and Yuda Yurum*,‡
Department of Chemistry, Hacettepe University, 06532 Beytepe, Ankara Turkey, and Faculty ofEngineering and Natural Sciences, Sabanci University, 81474 Tuzla, Istanbul, Turkey
Received August 26, 1999
Raw coal, HCl-treated coal, and HCl-HF treated coal samples ZnCl2, NiCl2, CoCl2, CuCl2,and Fe2O3‚SO4 as catalysts were pyrolyzed under various temperature and time conditions inan inert atmosphere. The conversion of organic matter was calculated. The change in the aliphatichydrogen and the degree of aromatic condensation by FTIR technique have been examined afunction of temperature, time, and catalyst type. The volumetric swelling ratio of the charsobtained in different experimental conditions have been measured using the pyridine swellingtechnique, and the extent of cross-linking in the macromolecular network of chars was examined.It was found that the cross-linking increased with the catalysts.
IntroductionMineral matter and inorganic compounds change coal
behavior during the gasification and pyrolysis processes.These compounds have catalytic effects and changeswelling and coke forming characteristics of the coal.How these compounds act is difficult to describe sincethey may behave as chemical agents or catalysts.1-4
The effects of various additives, selected mainly fortheir acidic-basic characteristics, on coal pyrolysis wereexamined.5-9 Lewis acids, in particular zinc hallides,have been used as test catalysts for lowering the oper-ating conditions and for increasing product selectivity.
Iron, copper, nickel, and zinc chlorides are mainlyused as catalysts for liquefaction, gasification, and pyr-olysis of coals.10,11 The catalytic activity of Fe2O3 for thehydrocracking of a bituminous coal increases when asmall amount of SO4
2- is included in the catalyst.12 Theeffect of nitrates of Cr(III), Mn(II), Fe(III), Co(II), Ni-(II), Cu(II), and Zn(II) on the gasification rate and thecomposition of the evolved gases during steam gasifica-tion of Spanish lignite coke have been studied.13 Amongthe metals studied Ni showed the highest carbon conv-ersion, although at steady conditions Fe was the bestcatalyst.
In this work the catalytic effects of ZnCl2, NiCl2,CoCl2, CuCl2, and Fe2O3‚SO4 during pyrolysis wereexamined. Changes in the conversion of organic mate-rial and cross-linking matter of the Zonguldak bitumi-nous coal were investigated, and the char samplesobtained were characterized by FTIR.
Experimental Section
Sample. The Zonguldak bituminous coal has a carbon con-tent of 89 wt % (dmmf). The composition of the Zonguldak coalis presented in Table 1. The coal sample was ground under anitrogen atmosphere to -65 mesh ASTM and stored under ni-trogen. Coal sample was Soxhlet extracted with a toluene-ethyl alcohol solvent couple (1:1) at its atmospheric boilingpoint to separate the resins of the coal and dried in a vacuumoven at 50 °C, for 24 h under a nitrogen atmosphere. Thissample is referred to as raw coal throughout the text of thepresent work. Then, this sample was demineralized with HCland HF by standard methods.14 A 2 L aliquot of 6 N HCl wasadded to 200 g of coal. The slurry was stirred for 24 h undera nitrogen atmosphere; then it was filtered and washed withdistilled water until the filtrate became neutral. Consecutively,1.6 L of aqueous (40%) HF was added to HCl-washed coal, andthis mixture was stirred for ∼24 h under a nitrogen atmo-sphere. After filtering, the demineralized coal was washed with1 L of distilled water and dried at 50 °C, for 24 h undervacuum.
Pyrolysis Experiments. Pyrolysis experiments were madewith a Mettler TA 3000 differential scanning calorimeter. Rawand HCl- and HCl/HF-washed Zonguldak bituminous coalsamples (approximately 6 mg, particle size of 210 µm) and coalsamples containing catalysts were placed in a standardaluminum crucible in the differential scanning calorimetry(DSC) cell to run the pyrolysis experiments.
ZnCl2, NiCl2, CuCl2, CoCl2, and Fe2O3‚SO4 compounds wereused as catalysts in pyrolysis experiments. The percentage ofthe catalysts added to raw and HCl- and HCl/HF-treated coalsamples was 5, 10, and 20%. The powdered coal samples weremechanically mixed with the catalysts. All chemicals used as
*Corresponding author.† Hacettepe University.‡ Sabanci University.(1) Franklin, H. D.; Peters, W. A.; Cariello, F.; Howard, J. B. Ind.
Eng. Chem. Process. Des. Dev. 1981, 10, 670.(2) Franklin, H. D.; Peters, W. A.; Howard, J. B. Fuel 1982, 61, 155.(3) Franklin, H. D.; Peters, W. A.; Howard, J. B. Fuel 1982, 61, 1213.(4) Bexley, K.; Green, D. P.; Thomas, M. K. Fuel 1986, 65, 47.(5) Bell, T.A.; Mobley, D. P. Fuel 1979, 58, 661.(6) Jolly, R.; Charcosset, H.; Boudou, J. P.; Guet, J. M. Fuel Proc.
Technol. 1988, 20, 51.(7) Kandiyoti, R.; Lazaridis, J. I.; Dyrvold, B.; Weerasinghe, C. R.
Fuel 1984, 63, 1583.(8) Ibarra, J. V.; Moliner, R.; Gavilab, M. P. Fuel 1991, 70, 408.(9) Ibarra, J. V.; Moliner, R.; Palacios J. M. Fuel 1991, 70, 727.(10) Song, C.; Nomura, M.; Miyake, M. Fuel 1986, 65, 922.(11) Nishiyama, Y. Fuel 1986, 65, 1404.(12) Tanabe, K.; Hattari, H.; Yamaguchi; Yokoyama, S.; Umematsu,
J.; Sanada, Y.; Fuel 1982, 61, 389.(13) Lopez-Peinado, A.; Carrasco-Marin, F.; Rivera-Utrilla, J.; Moreno-
Castilla, C. Fuel 1992, 71, 105.(14) Yurum, Y.; Kramer, R.; Levy, M. Thermochim. Acta 1985, 94,
285.
820 Energy & Fuels 2000, 14, 820-827
10.1021/ef9901847 CCC: $19.00 © 2000 American Chemical SocietyPublished on Web 06/22/2000
catalysts were of reagent grade quality. Fe2O3‚SO4 was pre-pared according to the method given by Farcasiu and Smith.15
Ferric ammonium sulfate (25 g) and urea (50 g) were dissolvedin 1000 mL of distilled water. The solution was heated at 95°C for 2 h with constant rapid stirring. Precipitation of FeO-(OH) particles takes place during the heating by reaction withammonia formed from urea and water. After precipitation wascomplete, the precipitate was washed 4-5 times with hot (∼70°C) water to remove impurity ions. The washed precipitate wasfiltered, dried at 110 °C for 24 h, and finally calcined at 500°C in air for 3 h.
All of the pyrolysis experiments were made in a constantflow rate of N2 gas (25 mL min-1) and with a constant heatingrate of 50 K min-1. The pyrolysis reactions were investigatedin the temperature range of 300-500 °C and between 0 and60 min. Conversion of pyrolysis experiments was calculatedwith the following equation:
where W0 is the weight of the coal (dry basis) at the beginning,W1 is the weight of the residue, and a is the amount of ash(dry basis).
Solvent Swelling Experiments. The swelling behavior ofthe residues was studied by Liotta’s method.16 Approximately100 mg of a coal sample was placed in a 6 mm o.d. tube andcentrifuged for 5 min at 2500 rev/min. The height of the samplewas measured as h1. Excess pyridine (∼1 mL) was added intothe tube, the contents of the tube were mixed, the tube wascentrifuged after 24 h, and the height of the sample in thetube (h2) was measured. The volumetric swelling ratio wascalculated as Qv ) h2/h1. Qv values were normalized between0 and 1 using an X parameter introduced by Solomon et al.:17
1 - X ) 1 corresponds to the raw coal, and 1 - X ) 0, to themaximum cross-linked residue.
FTIR Analysis. Infrared spectra of both coal samples andcoke samples with and without catalyst were obtained with aMattson 1000 FTIR spectrometer. KBr pellets were preparedby grinding exactly 2.5 mg of dried coal, and a coke sample
with 200 mg KBr pellets, 12.9 mm in diameter and 0.4 mmthickness, was pressed in an evacuated die from a 60.0 mgmixture of KBr and sample and dried at 110 °C for 72 h undera nitrogen atmosphere to remove water. Spectra were obtainedwith 300 scans at a resolution of 2 cm-1. The peak integrationof aliphatic C-H bands (2800-3000 cm-1) was done by usinga software present in a Mattson 1000 FTIR spectrometer.Infrared spectra of the coal and coke samples for aromaticC-H out-of bending bands in the range 600-900 cm-1 wereresolved by the least squares curve fitting technique describedpreviously by Yurum and Altuntas18
Results and Discussion
Pyrolysis Experiments. In the present work, theeffect of pyrolysis temperature and the percentage ofcatalytic chemicals was investigated in the pyrolysis ofraw, HCl-treated, and HCl/HF-treated coal samples.ZnCl2, NiCl2, CoCl2, CuCl2, and Fe2O3‚SO4 were usedas catalysts. The experimental time in all of the pyroly-sis experiments was 60 min. Figure 1 shows the change(15) Farcasiu, M.; Smith, C. Fuel Process. Technol. 1991, 29, 199.
(16) Liotta, R.; Brons, G.; Isaacs, J. Fuel 1983, 62, 781.(17) Solomon, P. R.; Serio, M. A.; Desphande, G. V.; Kroo, E. Energy
and Fuels 1990, 4, 42. (18) Yurum, Y.; Altuntas, N. Fuel Sci. Technol. Int. 1994, 12, 1115.
Table 1. Composition of the Zonguldak Bituminous CoalSample
Proximate Analysis (wt %)volatile matter 22.4fixed carbon 23.2ash 53.4moisture 1.0
Elemental Analysis (wt %)C 89.0H 5.0S (total) 1.2N 1.3O (by difference) 3.5
Maceral Group Analysis (vol %)vitrinite 38.0 86.0a
liptiniteinertinite 6.0 14.0a
minerals 56.0carbonates 1clay minerals 52pyrite 3
a Mineral-free.
% conversion )W0 - W1
W0(1 - a)× 100
X )Qv,coal - Qv,residue
Qv,coal - 1
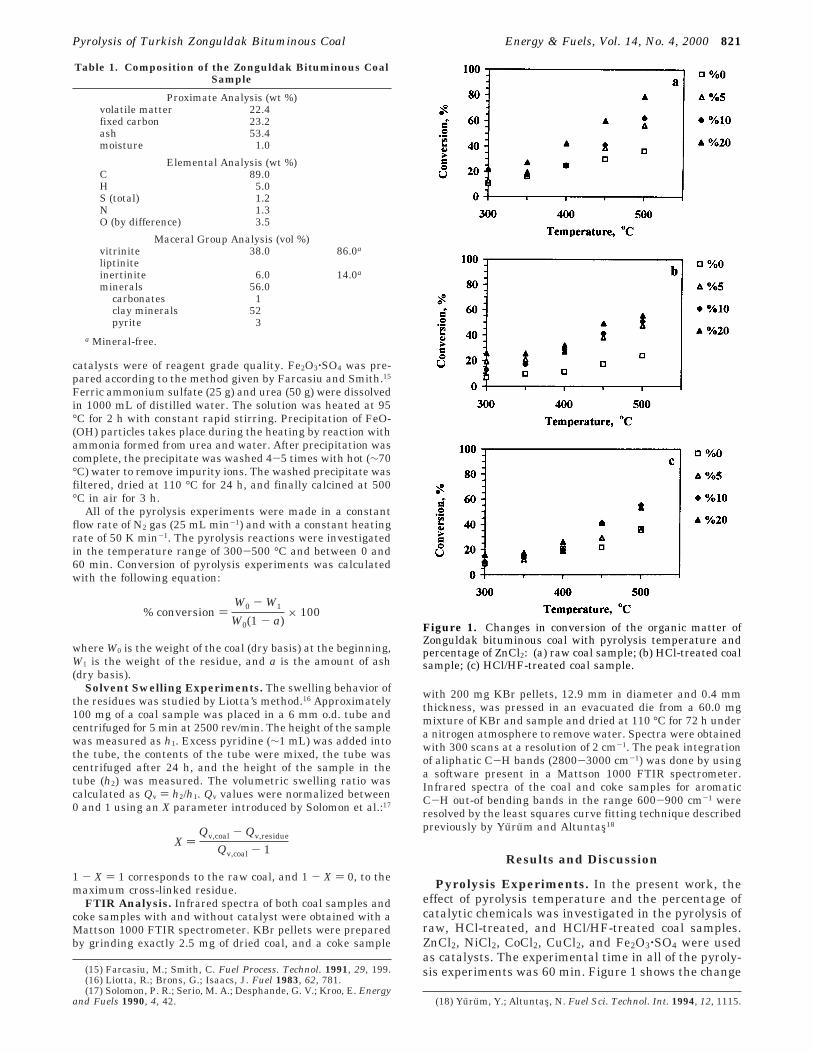
Figure 1. Changes in conversion of the organic matter ofZonguldak bituminous coal with pyrolysis temperature andpercentage of ZnCl2: (a) raw coal sample; (b) HCl-treated coalsample; (c) HCl/HF-treated coal sample.
Pyrolysis of Turkish Zonguldak Bituminous Coal Energy & Fuels, Vol. 14, No. 4, 2000 821
in organic matter conversion with pyrolysis temperatureand the percentage of catalyst in the pyrolysis of raw,HCl-treated, and HCl/HF-treated coal samples usingZnCl2 as catalyst.
Conversion of raw coal in the pyrolysis reactionswithout catalyst changed from 10 to 38% as the tem-perature was increased from 300 to 500 °C. Addition ofZnCl2 to the raw coal increased the conversion signifi-cantly. Conversion of experiments with 5% ZnCl2 changedbetween 10 and 55% as the temperature of pyrolysis wasraised from 300 to 500 °C. But it should also be notedthat in experiments at 300 °C, 350, and 400 °C theconversions measured were similar to those obtainedin experiments with no catalyst. Conversion seemed toincrease in experiments at 450 °C from 25 (no catalyst)to 38% and in experiments at 500 °C from 35 (nocatalyst) to 55%. Same situation was also observed inexperiments with 10% ZnCl2. Conversions with 10%catalyst were similar to those with no catalyst inexperiments at 300, 350, and 400 °C, and an increasein conversion was observed in experiments at 450 and500 °C, from 30 (no catalyst) to 40% and from 35 (nocatalyst) to 60%, respectively. These results indicatedthat ZnCl2 added to the raw coal up to 10 wt % startedto be active as a catalyst at temperatures 450 °C andabove. When the catalyst percentage was raised to 20%,the conversion of pyrolysis increased to 20-80% withinthe temperature range of 300-500 °C. The increasesin conversion were as follows: at 300 °C from 10 (nocatalyst) to 20%, at 350 °C from 15 (no catalyst) to 28%,at 400 °C from 25 (no catalyst) to 40%, at 450 °C from30 (no catalyst) to 60%, and at 500 °C from 35 (nocatalyst) to 80%. It seemed that as the percentage ofthe ZnCl2 was increased to values higher than 10%, thetemperature at which the catalyst started to be activewas lowered to 300 °C. This might be due to theinteraction between the mineral matter and the cata-lytic material added.19 The action of the catalyticalmaterial added can be explained by the anchorage ofmetal ions to the minerals by a reaction with surface-OH groups.20 Therefore the presence of mineralscontaining the surface -OH groups might be consideredas the starting point for the synergetic catalytic activityof both the minerals and the chemicals added.
Conversion values for HCl-treated and HCl/HF-treated coal samples within the same temperaturelimits were 7-25% and 8-35%, respectively. The leach-ing of the mineral matter first with HCl and then withHF caused substantial decreases in the conversionvalues. The reason for this behavior can be explainedwith the presence of mineral matter in the raw coalsamples. Raw Zonguldak bituminous coal containedcarbonate, clay, and pyrite minerals.21 Calcite mineralsare known to catalyze degradation of phenols in thepyrolysis of coals;22 therefore, removal of these mineralsmight have changed the behavior of the HCl-treatedcoals when they were compared with the raw coals.Pyrolysis of HCl/HF-treated coal samples gave rise tolower conversions than those of raw coal samples.
When ZnCl2 was added to HCl- and HCl/HF-treatedcoals, conversions observed were lower than those ofthe ZnCl2/raw coal mixture. This indicated that neitherthe mineral matter nor the added chemicals actedcatalytically when they are by themselves. But catalysisseemed to be active when both the original minerals andZnCl2 were present in the pyrolysis system. Thisindicated that there existed a synergetic effect betweenthe minerals present in the coal and the chemicalsadded as catalysts.
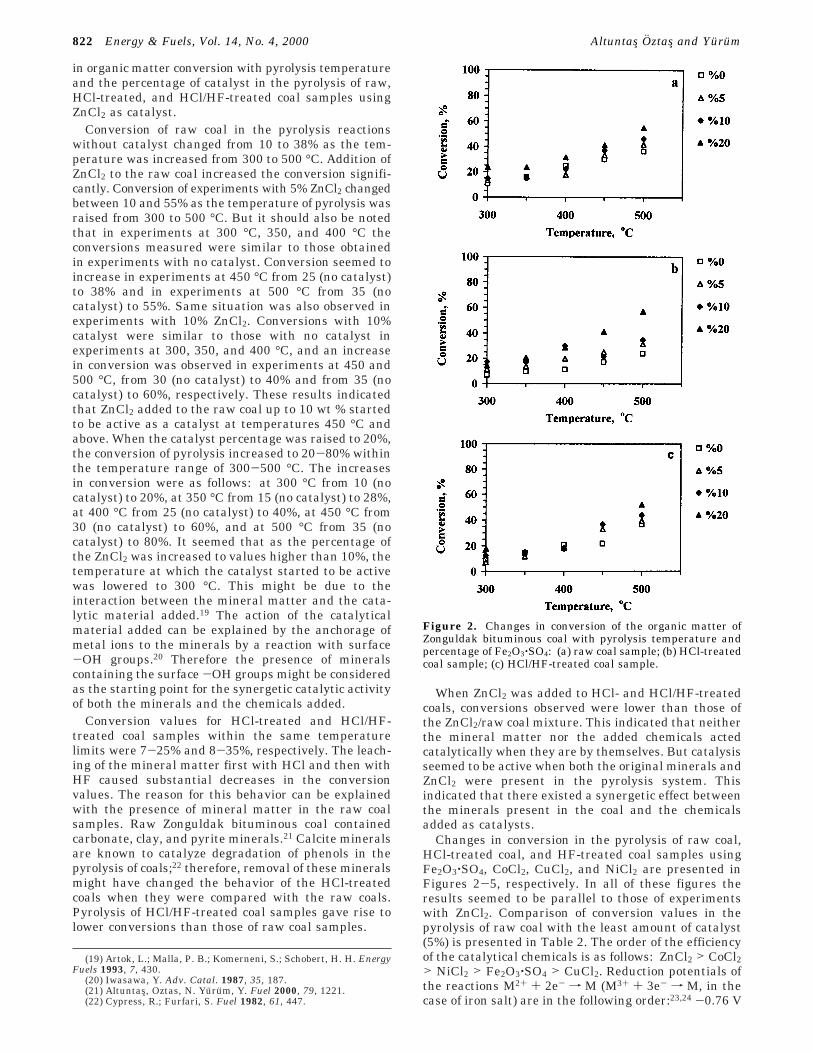
Changes in conversion in the pyrolysis of raw coal,HCl-treated coal, and HF-treated coal samples usingFe2O3‚SO4, CoCl2, CuCl2, and NiCl2 are presented inFigures 2-5, respectively. In all of these figures theresults seemed to be parallel to those of experimentswith ZnCl2. Comparison of conversion values in thepyrolysis of raw coal with the least amount of catalyst(5%) is presented in Table 2. The order of the efficiencyof the catalytical chemicals is as follows: ZnCl2 > CoCl2> NiCl2 > Fe2O3‚SO4 > CuCl2. Reduction potentials ofthe reactions M2+ + 2e- f M (M3+ + 3e- f M, in thecase of iron salt) are in the following order:23,24 -0.76 V
(19) Artok, L.; Malla, P. B.; Komerneni, S.; Schobert, H. H. EnergyFuels 1993, 7, 430.
(20) Iwasawa, Y. Adv. Catal. 1987, 35, 187.(21) Altuntas, Oztas, N. Yurum, Y. Fuel 2000, 79, 1221.(22) Cypress, R.; Furfari, S. Fuel 1982, 61, 447.
Figure 2. Changes in conversion of the organic matter ofZonguldak bituminous coal with pyrolysis temperature andpercentage of Fe2O3‚SO4: (a) raw coal sample; (b) HCl-treatedcoal sample; (c) HCl/HF-treated coal sample.
822 Energy & Fuels, Vol. 14, No. 4, 2000 Altuntas Oztas and Yurum
(ZnCl2) < -0.28 V (CoCl2) < -0.23 V (NiCl2) < -0.04 V(Fe2O3‚SO4) < 0.34 V (CuCl2). The decreasing order inthe efficiency for the catalysts was exactly the same asthe increasing order of the reduction potentials of thechemicals that were used. It seemed that the lower thereduction potential of the ionic species, the higher theconversion obtained in the pyrolysis and the higher theefficiency of the catalyst. The metallic salts attached tothe surface structures can readily be reduced by hydro-gen evolved during pyrolysis of the organics. When themetal is reduced to the zerovalent state, it migrates overthe surface and forms aggregates of metal atoms,thereby giving the most common form of a supportedmetal catalyst.25 Therefore it might be considered thatthe active species of the chemicals was the metallic formof the cation which was created by the reductive actionof the hydrogen evolved during pyrolysis reactions.
Solvent Swelling Experiments. The volumetricswelling ratios of the pyrolysis chars obtained in dif-ferent experimental conditions with and without acatalyst were measured using the pyridine swellingtechnique, and the extent of cross-linking in the mac-romolecular network of chars was examined with re-spect to the catalyst type and the percentage of thecatalyst. The functional group dependence of cross-linking reactions in coal pyrolysis has been recentlyshown.8,9,26 The change in the volumetric swelling ratiosof the coke samples obtained from the raw coal samplewith the catalyst type used and the catalyst percentage(at 500 °C; time, 60 min) is presented in Figure 6.
As it is seen in Figure 6, when the coal was pyrolyzedwithout any catalyst, an increase in cross-linking wasobserved, X ) 0 (raw coal) and X ) 0.70 (coke obtainedin pyrolysis). Addition of 5% of NiCl2 or CoCl2 to theraw coal further increased the cross-links (decreased theswelling in pyridine) in the cokes produced, X ) 0.70(coke without catalyst) and X ) 1 (cokes with catalyst).
(23) Ebbing, D. D. General Chemistry; Houghton Mifflin Co.: Boston,1984, p 696.
(24) Oxtoby, D. W.; Gillis, H. P.; Nachtrieb, N. H. Principles ofModern Chemistry, 4th ed.; Saunders College Publishing: New York,1999; p A39.
(25) Gates, B. C. Catalytic Chemistry; John Wiley and Sons: NewYork, 1992; p 338. (26) Ibarra, J. V.; Moliner, R.; Bonet, A. J. Fuel 1994, 73, 918.
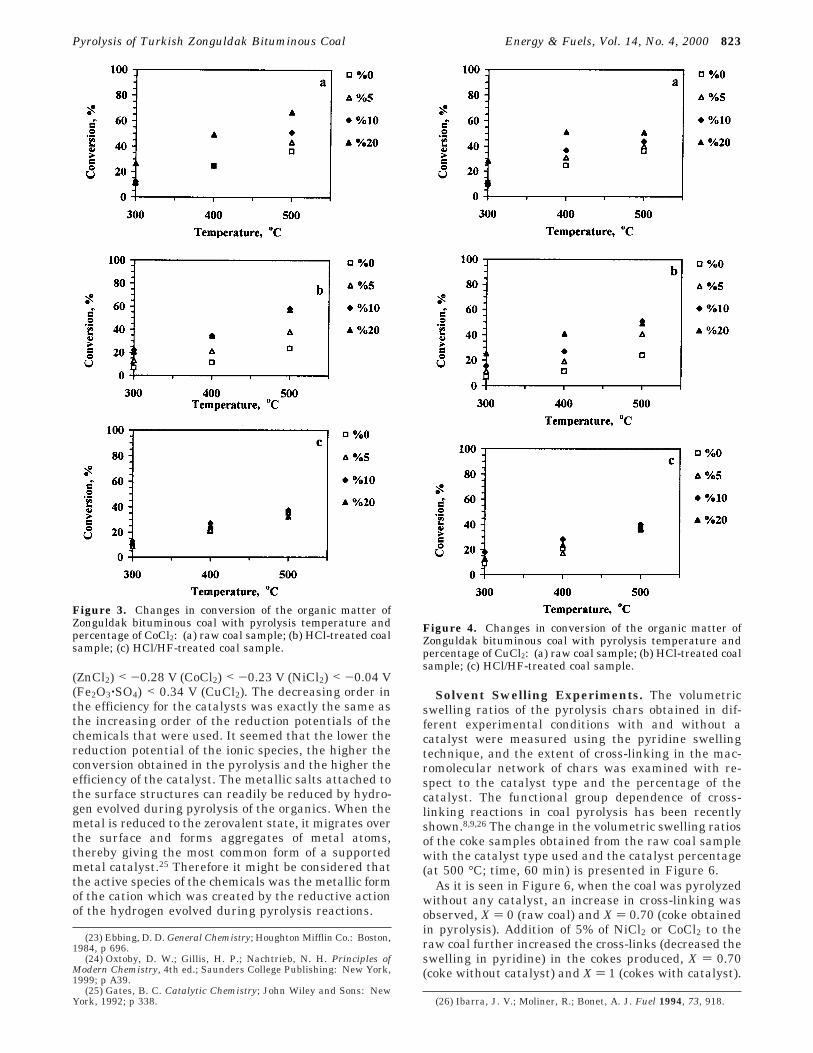
Figure 3. Changes in conversion of the organic matter ofZonguldak bituminous coal with pyrolysis temperature andpercentage of CoCl2: (a) raw coal sample; (b) HCl-treated coalsample; (c) HCl/HF-treated coal sample.
Figure 4. Changes in conversion of the organic matter ofZonguldak bituminous coal with pyrolysis temperature andpercentage of CuCl2: (a) raw coal sample; (b) HCl-treated coalsample; (c) HCl/HF-treated coal sample.
Pyrolysis of Turkish Zonguldak Bituminous Coal Energy & Fuels, Vol. 14, No. 4, 2000 823
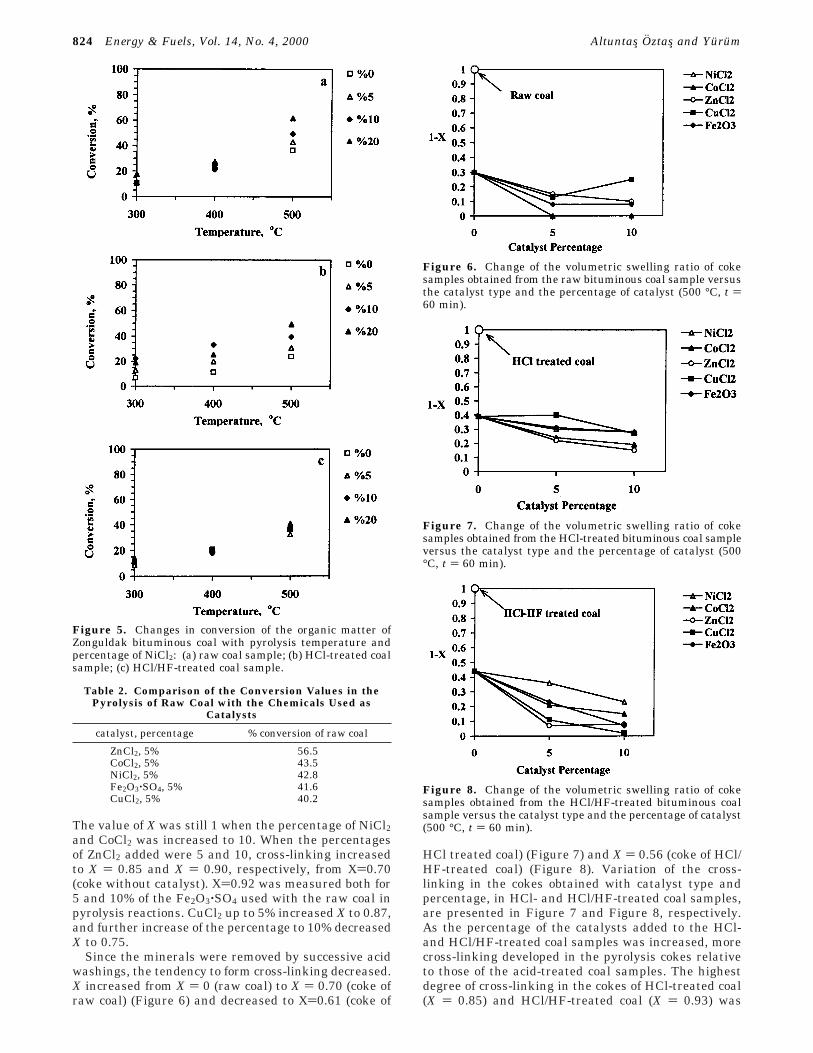
The value of X was still 1 when the percentage of NiCl2and CoCl2 was increased to 10. When the percentagesof ZnCl2 added were 5 and 10, cross-linking increasedto X ) 0.85 and X ) 0.90, respectively, from X)0.70(coke without catalyst). X)0.92 was measured both for5 and 10% of the Fe2O3‚SO4 used with the raw coal inpyrolysis reactions. CuCl2 up to 5% increased X to 0.87,and further increase of the percentage to 10% decreasedX to 0.75.
Since the minerals were removed by successive acidwashings, the tendency to form cross-linking decreased.X increased from X ) 0 (raw coal) to X ) 0.70 (coke ofraw coal) (Figure 6) and decreased to X)0.61 (coke of
HCl treated coal) (Figure 7) and X ) 0.56 (coke of HCl/HF-treated coal) (Figure 8). Variation of the cross-linking in the cokes obtained with catalyst type andpercentage, in HCl- and HCl/HF-treated coal samples,are presented in Figure 7 and Figure 8, respectively.As the percentage of the catalysts added to the HCl-and HCl/HF-treated coal samples was increased, morecross-linking developed in the pyrolysis cokes relativeto those of the acid-treated coal samples. The highestdegree of cross-linking in the cokes of HCl-treated coal(X ) 0.85) and HCl/HF-treated coal (X ) 0.93) was
Figure 5. Changes in conversion of the organic matter ofZonguldak bituminous coal with pyrolysis temperature andpercentage of NiCl2: (a) raw coal sample; (b) HCl-treated coalsample; (c) HCl/HF-treated coal sample.
Table 2. Comparison of the Conversion Values in thePyrolysis of Raw Coal with the Chemicals Used as
Catalysts
catalyst, percentage % conversion of raw coal
ZnCl2, 5% 56.5CoCl2, 5% 43.5NiCl2, 5% 42.8Fe2O3‚SO4, 5% 41.6CuCl2, 5% 40.2
Figure 6. Change of the volumetric swelling ratio of cokesamples obtained from the raw bituminous coal sample versusthe catalyst type and the percentage of catalyst (500 °C, t )60 min).
Figure 7. Change of the volumetric swelling ratio of cokesamples obtained from the HCl-treated bituminous coal sampleversus the catalyst type and the percentage of catalyst (500°C, t ) 60 min).
Figure 8. Change of the volumetric swelling ratio of cokesamples obtained from the HCl/HF-treated bituminous coalsample versus the catalyst type and the percentage of catalyst(500 °C, t ) 60 min).
824 Energy & Fuels, Vol. 14, No. 4, 2000 Altuntas Oztas and Yurum
observed when 5% ZnCl2 was used as catalyst. It seemedthat when catalysts added to the raw and HCl- and HCl/HF-treated samples, the pyrolysis cokes contained morecross-linked structures. This was probably due to thesynergetic effect of the native minerals present in theraw coal and the chemicals added as catalysts.
Characterization of Chars by FTIR Spectros-copy. Aliphatic Hydrogen. Since most of the nativeminerals were separated in HCl/HF-treated coal samples,it was thought that it would be rational to observe theeffect of the chemicals added as catalysts on the organicmaterial of the coal by investigating the cokes producedfrom the pyrolysis reactions. Table 3 shows the variationin the areas of all of the aliphatic C-H stretching peaksin the region of 2800-3000 cm-1 in the FTIR spectra ofthe coke samples obtained from the pyrolysis of HCl/HF-treated coal samples at 300, 400, and 500 °C for 0,30, and 60 min (0 min means the time at which thefurnace temperature reached 300, 400, or 500 °C at aheating rate of 50 °C/min). The total aliphatic C-H peakarea in the unpyrolyzed HCl/HF-treated coal samplewas 5.74. It seemed that, in experiments done at 300°C and t ) 0 min, the aliphatic structures remainedunchanged since the area of the total aliphatic C-Hpeak area stayed at 5.77. When the pyrolysis temper-ature was increased from 300 to 500 °C and theexperimental time from 0 to 60 min, the total peak areaof the aliphatic C-H bands decreased sharply. Practi-cally most of the aliphatic structures were removed inexperiments done at 500 °C and t ) 60 min. Theseresults showed that dehydrogenation reactions throughaliphatic group losses occurred as the pyrolysis tem-peratures and times were increased. The dehydrogena-tion reactions seemed to start at 300 °C, and as thetemperature was increased to higher temperatures, adrastic decrease was observed in the aliphatic C-Hpeak area.
Table 4 shows the change in the peak area of aliphaticC-H peaks in the FTIR spectra of the coke samplesobtained in the pyrolysis experiments with 10% catalystadded-HCl/HF-treated coal samples. As it is seen inTable 4, addition of the catalysts decreased the intensityof the aliphatic peaks in all of the experiments to valueseven lower than those of the cokes obtained withoutaddition of any catalysts (Table 3). In all of the cases,as the temperatures and experimental times wereincreased, the areas of the aliphatic bands also de-creased. Losses in the aliphatic structures cause anincrease in the tar production, and the radicals formedas the alkyl groups left during pyrolysis were stabilizedby forming cross-links in the coke produced. This is inaccordance with our swelling results given above.
Aromatic Hydrogen. Eight out-of-plane C-H defor-mation bands were observed by curve fitting in the FTIRspectrum of the HCl/HF-treated coal samples in the600-900 cm-1 region, Table 5. Peaks due to isolatedaromatic hydrogens (1H), two or three adjacent aromatichydrogens per ring (2H, 3H), and four or five adjacentaromatic hydrogens (4H, 5H) were in the 830-900 cm-1,770-830 cm-1, and 700-770 cm-1 sections of thespectrum, respectively.27
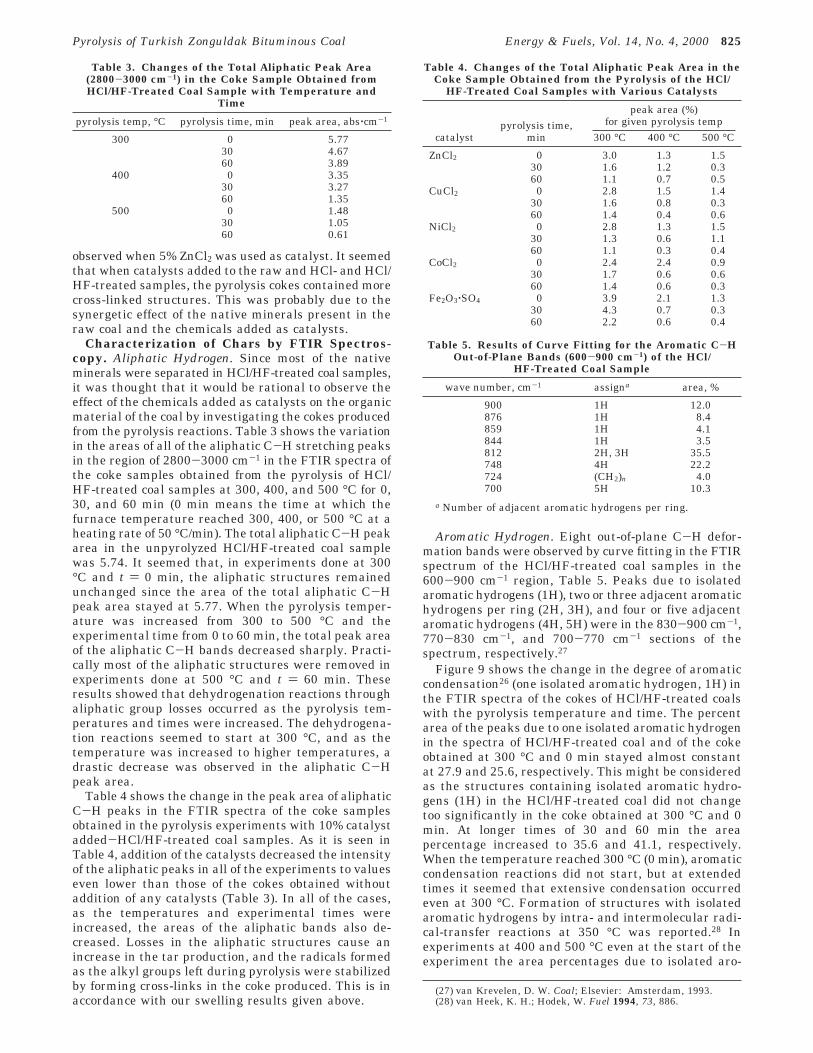
Figure 9 shows the change in the degree of aromaticcondensation26 (one isolated aromatic hydrogen, 1H) inthe FTIR spectra of the cokes of HCl/HF-treated coalswith the pyrolysis temperature and time. The percentarea of the peaks due to one isolated aromatic hydrogenin the spectra of HCl/HF-treated coal and of the cokeobtained at 300 °C and 0 min stayed almost constantat 27.9 and 25.6, respectively. This might be consideredas the structures containing isolated aromatic hydro-gens (1H) in the HCl/HF-treated coal did not changetoo significantly in the coke obtained at 300 °C and 0min. At longer times of 30 and 60 min the areapercentage increased to 35.6 and 41.1, respectively.When the temperature reached 300 °C (0 min), aromaticcondensation reactions did not start, but at extendedtimes it seemed that extensive condensation occurredeven at 300 °C. Formation of structures with isolatedaromatic hydrogens by intra- and intermolecular radi-cal-transfer reactions at 350 °C was reported.28 Inexperiments at 400 and 500 °C even at the start of theexperiment the area percentages due to isolated aro-
(27) van Krevelen, D. W. Coal; Elsevier: Amsterdam, 1993.(28) van Heek, K. H.; Hodek, W. Fuel 1994, 73, 886.
Table 3. Changes of the Total Aliphatic Peak Area(2800-3000 cm-1) in the Coke Sample Obtained fromHCl/HF-Treated Coal Sample with Temperature and
Time
pyrolysis temp, °C pyrolysis time, min peak area, abs‚cm-1
300 0 5.7730 4.6760 3.89
400 0 3.3530 3.2760 1.35
500 0 1.4830 1.0560 0.61
Table 4. Changes of the Total Aliphatic Peak Area in theCoke Sample Obtained from the Pyrolysis of the HCl/
HF-Treated Coal Samples with Various Catalysts
peak area (%)for given pyrolysis temp
catalystpyrolysis time,
min 300 °C 400 °C 500 °C
ZnCl2 0 3.0 1.3 1.530 1.6 1.2 0.360 1.1 0.7 0.5
CuCl2 0 2.8 1.5 1.430 1.6 0.8 0.360 1.4 0.4 0.6
NiCl2 0 2.8 1.3 1.530 1.3 0.6 1.160 1.1 0.3 0.4
CoCl2 0 2.4 2.4 0.930 1.7 0.6 0.660 1.4 0.6 0.3
Fe2O3‚SO4 0 3.9 2.1 1.330 4.3 0.7 0.360 2.2 0.6 0.4
Table 5. Results of Curve Fitting for the Aromatic C-HOut-of-Plane Bands (600-900 cm-1) of the HCl/
HF-Treated Coal Sample
wave number, cm-1 assigna area, %
900 1H 12.0876 1H 8.4859 1H 4.1844 1H 3.5812 2H, 3H 35.5748 4H 22.2724 (CH2)n 4.0700 5H 10.3
a Number of adjacent aromatic hydrogens per ring.
Pyrolysis of Turkish Zonguldak Bituminous Coal Energy & Fuels, Vol. 14, No. 4, 2000 825
matic hydrogens (1H) sharply increased to greatervalues than those of HCl/HF-treated coal. Aromaticcondensation reactions seemed to increase with increas-ing pyrolysis temperature and time.
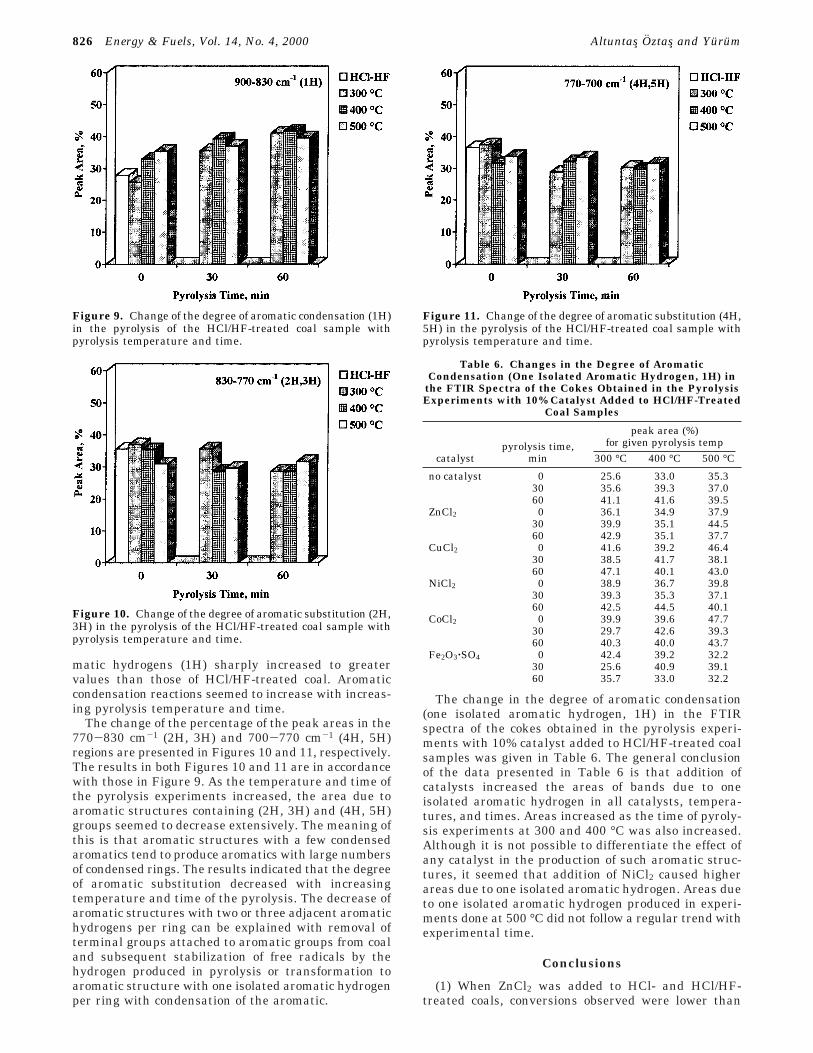
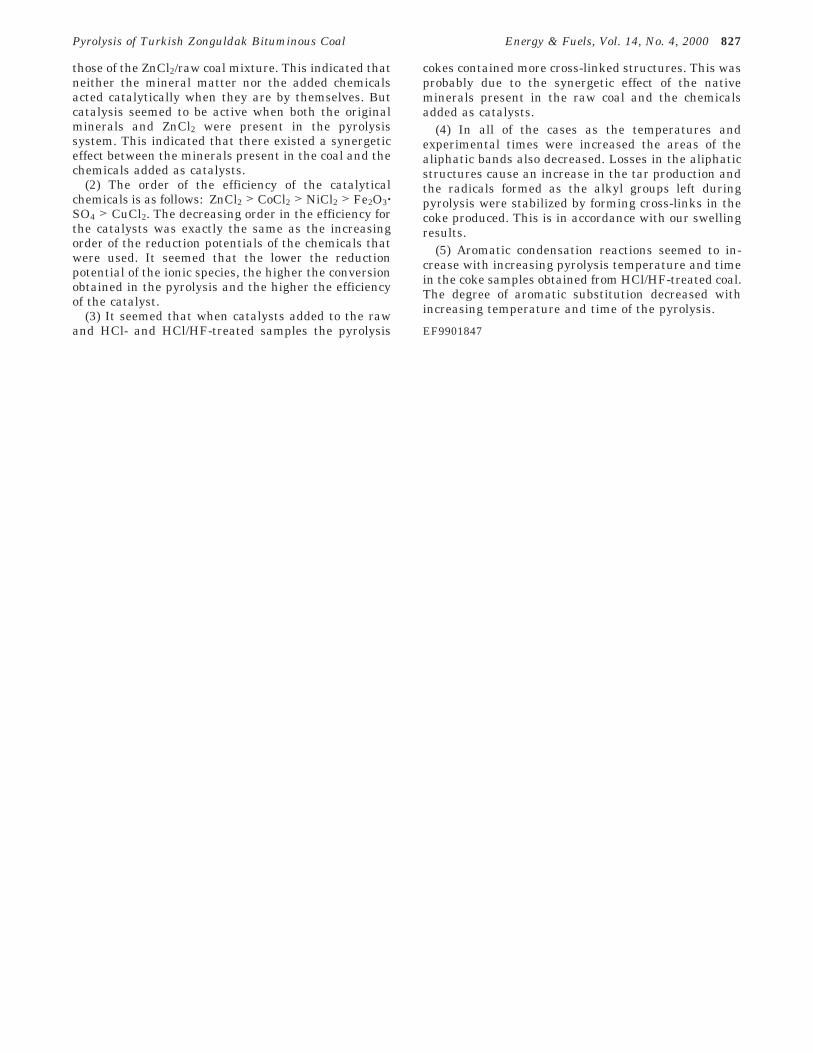
The change of the percentage of the peak areas in the770-830 cm-1 (2H, 3H) and 700-770 cm-1 (4H, 5H)regions are presented in Figures 10 and 11, respectively.The results in both Figures 10 and 11 are in accordancewith those in Figure 9. As the temperature and time ofthe pyrolysis experiments increased, the area due toaromatic structures containing (2H, 3H) and (4H, 5H)groups seemed to decrease extensively. The meaning ofthis is that aromatic structures with a few condensedaromatics tend to produce aromatics with large numbersof condensed rings. The results indicated that the degreeof aromatic substitution decreased with increasingtemperature and time of the pyrolysis. The decrease ofaromatic structures with two or three adjacent aromatichydrogens per ring can be explained with removal ofterminal groups attached to aromatic groups from coaland subsequent stabilization of free radicals by thehydrogen produced in pyrolysis or transformation toaromatic structure with one isolated aromatic hydrogenper ring with condensation of the aromatic.
The change in the degree of aromatic condensation(one isolated aromatic hydrogen, 1H) in the FTIRspectra of the cokes obtained in the pyrolysis experi-ments with 10% catalyst added to HCl/HF-treated coalsamples was given in Table 6. The general conclusionof the data presented in Table 6 is that addition ofcatalysts increased the areas of bands due to oneisolated aromatic hydrogen in all catalysts, tempera-tures, and times. Areas increased as the time of pyroly-sis experiments at 300 and 400 °C was also increased.Although it is not possible to differentiate the effect ofany catalyst in the production of such aromatic struc-tures, it seemed that addition of NiCl2 caused higherareas due to one isolated aromatic hydrogen. Areas dueto one isolated aromatic hydrogen produced in experi-ments done at 500 °C did not follow a regular trend withexperimental time.
Conclusions
(1) When ZnCl2 was added to HCl- and HCl/HF-treated coals, conversions observed were lower than
Figure 9. Change of the degree of aromatic condensation (1H)in the pyrolysis of the HCl/HF-treated coal sample withpyrolysis temperature and time.
Figure 10. Change of the degree of aromatic substitution (2H,3H) in the pyrolysis of the HCl/HF-treated coal sample withpyrolysis temperature and time.
Figure 11. Change of the degree of aromatic substitution (4H,5H) in the pyrolysis of the HCl/HF-treated coal sample withpyrolysis temperature and time.
Table 6. Changes in the Degree of AromaticCondensation (One Isolated Aromatic Hydrogen, 1H) in
the FTIR Spectra of the Cokes Obtained in the PyrolysisExperiments with 10% Catalyst Added to HCl/HF-Treated
Coal Samples
peak area (%)for given pyrolysis temp
catalystpyrolysis time,
min 300 °C 400 °C 500 °C
no catalyst 0 25.6 33.0 35.330 35.6 39.3 37.060 41.1 41.6 39.5
ZnCl2 0 36.1 34.9 37.930 39.9 35.1 44.560 42.9 35.1 37.7
CuCl2 0 41.6 39.2 46.430 38.5 41.7 38.160 47.1 40.1 43.0
NiCl2 0 38.9 36.7 39.830 39.3 35.3 37.160 42.5 44.5 40.1
CoCl2 0 39.9 39.6 47.730 29.7 42.6 39.360 40.3 40.0 43.7
Fe2O3‚SO4 0 42.4 39.2 32.230 25.6 40.9 39.160 35.7 33.0 32.2
826 Energy & Fuels, Vol. 14, No. 4, 2000 Altuntas Oztas and Yurum
those of the ZnCl2/raw coal mixture. This indicated thatneither the mineral matter nor the added chemicalsacted catalytically when they are by themselves. Butcatalysis seemed to be active when both the originalminerals and ZnCl2 were present in the pyrolysissystem. This indicated that there existed a synergeticeffect between the minerals present in the coal and thechemicals added as catalysts.
(2) The order of the efficiency of the catalyticalchemicals is as follows: ZnCl2 > CoCl2 > NiCl2 > Fe2O3‚SO4 > CuCl2. The decreasing order in the efficiency forthe catalysts was exactly the same as the increasingorder of the reduction potentials of the chemicals thatwere used. It seemed that the lower the reductionpotential of the ionic species, the higher the conversionobtained in the pyrolysis and the higher the efficiencyof the catalyst.
(3) It seemed that when catalysts added to the rawand HCl- and HCl/HF-treated samples the pyrolysis
cokes contained more cross-linked structures. This wasprobably due to the synergetic effect of the nativeminerals present in the raw coal and the chemicalsadded as catalysts.
(4) In all of the cases as the temperatures andexperimental times were increased the areas of thealiphatic bands also decreased. Losses in the aliphaticstructures cause an increase in the tar production andthe radicals formed as the alkyl groups left duringpyrolysis were stabilized by forming cross-links in thecoke produced. This is in accordance with our swellingresults.
(5) Aromatic condensation reactions seemed to in-crease with increasing pyrolysis temperature and timein the coke samples obtained from HCl/HF-treated coal.The degree of aromatic substitution decreased withincreasing temperature and time of the pyrolysis.
EF9901847
Pyrolysis of Turkish Zonguldak Bituminous Coal Energy & Fuels, Vol. 14, No. 4, 2000 827