Embed Size (px)
Citation preview
ORIGINAL ARTICLE
Effect of carbon source on acclimatization of nitrifying bacteriato achieve high-rate partial nitrification of wastewater with highammonium concentration
Seyyed Alireza Mousavi • Shaliza Ibrahim •
Mohamed Kheireddine Aroua
Received: 18 January 2014 / Accepted: 22 July 2014 / Published online: 24 August 2014
� The Author(s) 2014. This article is published with open access at Springerlink.com
Abstract Experiments in two laboratory-scale sequential
batch reactors were carried out to investigate the effect of
heterotrophic bacteria on nitrifying bacteria using external
carbon sources. Partial nitrification of ammonium-rich
wastewater during short-term acclimatization enriched the
activity of ammonia-oxidizing bacteria in both reactors.
Heterotrophic bacteria exhibited a minor effect on nitrify-
ing bacteria, and complete removal of ammonium occurred
at a rate of 41 mg L-1 h-1 in both reactors. The main
strategy of this research was to carry out partial nitrification
using high-activity ammonia-oxidizing bacteria with a high
concentration of free ammonia (70 mg L-1). The NO2-/
(NO3- ? NO2
-) ratio was greater than 0.9 in both reactors
most of the time.
Keywords Nitrification � Nitrifying bacteria �Ammonium-rich wastewater � Partial nitrification
Introduction
The uncontrolled discharge of wastewater containing
ammonia in water bodies through nitrogen-rich wastewaters
has been considered as a worldwide human health threat
and toxicity to aquacultures (Chen et al. 2006; Mousavi
et al. 2012). Among different sources of nitrogen compo-
nents, anaerobic sludge digesters effluent (sludge rejected
water) generally contains 15–25 % of the total nitrogen load
in a flow and is recycled to the head of the sewage treatment
works (Mata-Alvarez 2002; Dosta et al. 2007). In addition,
the remaining COD in this effluent is weakly biodegradable.
Different processes have been tested to find a suitable
method for treating this kind of wastewater (Van Kempen
et al. 2001).
In the past decades, both physicochemical and biologi-
cal methods have been used for ammonium removal from
wastewater to obtain discharge standards (Komorowska-
Kaufman et al. 2006). Some drawbacks of physicochemical
technologies for ammonia removal have shifted research
interest toward biological nitrogen removal (BNR) as a
promising method for eliminating ammonia from waste-
water (Dosta et al. 2007). Biological ammonia removal
normally takes place in two steps, namely, nitrification and
denitrification. Nitrification is also a two-step process,
where ammonium is firstly oxidised to nitrite by ammo-
nium-oxidising biomass (AOB). This process is called
nitritation and its stoichiometry is:
NHþ4 þ 3/2O2 ! NO�
2 þ 2Hþ þ H2O ð1Þ
Secondly, nitrite is oxidised to nitrate by nitrite-oxidising
biomass (NOB). This process is called nitratation and its
stoichiometry is:
NO�2 þ 1/2O2 ! NO�
3 ð2Þ
The rate of the nitrification process depends on the
activities of nitrifying bacteria and is affected by
environmental and operational parameters (e.g.,
S. A. Mousavi (&)
Department of Environmental Health, Kermanshah University of
Medical Sciences, Kermanshah, Iran
e-mail: [email protected]
S. A. Mousavi � S. IbrahimDepartment of Civil Engineering, Faculty of Engineering,
University of Malaya, 50603 Kuala Lumpur, Malaysia
M. K. Aroua
Department of Chemical Engineering, Faculty of Engineering,
University of Malaya, 50603 Kuala Lumpur, Malaysia
123
Appl Water Sci (2017) 7:165–173
DOI 10.1007/s13201-014-0229-z
temperature, pH microorganism population, organic carbon
and nitrogen concentration). Optimizing factors affecting
the nitrogen removal process is thus necessary to build up
nitrifying bacteria and increase the effectiveness of
wastewater treatment investigations (Komorowska-
Kaufman et al. 2006). The heterotroph/autotroph
population ratio depends on the organic carbon/nitrogen
ratio (C/N) in wastewater. According to the results of
previous studies, at high ratio of C/N, heterotrophic
bacteria dominate the nitrifying bacteria, resulting in a
decrease of ammonium removal (Okabe et al. 1996;
Campos et al. 1999; Carrera et al. 2004; Wu et al. 2008).
Rostron et al. (2001) investigated the effect of COD
(glucose) addition on nitrification at 12 h of operational
HRT. In this condition, heterotrophic bacteria grow rapidly
and reduce influent COD by 90 % within 10 days of adding
500 mg L–1 COD to the feed. Results indicated that all
three reactors lost nitrate production because of limited
oxygen for nitrifying bacteria, which can be attributed to
the dominance of heterotrophs (Rostron et al. 2001).
Research has shown the complexity of AOB enrichment
in a single reactor and considerably low rates of system
efficiency. On the other hand, a solid retention time (as a
controlling parameter) of less than 4 days has been repor-
ted to cause washout of nitrifying microorganisms, thus
reducing the nitrification rate (Campos et al. 1999). In
addition, ammonia oxidation in a single reactor is usually
limited to 0.2 kg N-NH4? m-3 per day. Therefore, using
two biological units, with the nitrification process taking
place individually in the subsequent unit, to prevail over
the above-described limitations was recommended (Cam-
pos et al. 1999; Wu et al. 2008). On the other hand, using a
single reactor for nitrification increases the initial capital
and maintenance cost, which encourage researchers to
develop energy-saving nitrogen elimination systems and
increase the nitrification rate by applying cost-effective
methods, such as SHARON (Van Kempen et al. 2001) and
Anammox (Volcke et al. 2006), for treatment of sludge
rejected water (Chen et al. 2010).
This preliminary study evaluated the role of the C/N
ratio, among several factors affecting microbial growth, as
an inhibitor in the nitrification process. In addition, the
feasibility of partial nitrification (PN) as a cost-effective
process was investigated during enrichment of nitrifying
bacteria with a high concentration of ammonium. This
work lays the groundwork for further research on bio-
electrochemical nitrogen elimination.
BNR via nitrite
This section discusses the importance and mechanisms of
PN to elucidate the process. PN occurs via AOB according
to Eq. 1, but activated sludge is a mixed culture containing
both AOB and NOB. As such, researchers have carried out
BNR via nitrite by adjusting the environmental and oper-
ational parameters (pH, dissolved oxygen, temperature, and
substrate concentrations) to limit the growth of NOB and
enrich AOB, which cause nitrite accumulation (Dosta et al.
2007; Blackburne et al. 2008; Chen et al. 2010). Savings of
25 % in aeration costs using low concentrations of dis-
solved oxygen only to enrich AOB and a reduction of 40 %
of the external carbon source needed during denitrification
by limiting NOB in PN have been reported (Ruiz et al.
2003). Free ammonia (FA) and free nitrous acid are inhi-
bition parameters that play key roles in PN. The values of
both substrates depend on the total ammonia concentration,
pH, and temperature (Grunditz and Dalhammar 2001;
Whang et al. 2009). Previous studies have shown the
inhibitory effect of high concentrations of FA and HNO2
on AOB and NOB in PN (Chen et al. 2010). Blackburne
et al. (2008) investigated the role of high-concentration FA
in inhibiting Nitrobacter and Nitrospira activities and
found that Nitrospira species are much more sensitive to
low concentrations of FA than Nitrobacter species. In
addition, NOB were found to be inhibited at concentrations
higher than 0.1–1 mg NH3 L-1 and/or 0.2–2.8 mg
HNO2 L-1, whereas AOB were inhibited by unionized
ammonia concentrations higher than 10–150 mg NH3 L-1.
These findings suggest that enrichment of nitrifying bac-
teria can enhances the nitrification rate. For example,
Zheng et al. (2004) examined the high activity of AOB in a
pure culture (6–8 g NH4--N g-1 VSS per day). Moreover,
Chen, et al. (2010) investigated the enrichment of high
nitrifier activity with the aim of enhancing the performance
of the PN process and reported a specific ammonium oxi-
dation rate (2.78 g NH4?-N g-1 VSS per day) higher than
previously reported values (0.6 g NH4?-N g-1 VSS per
day (Ciudad et al. 2007), 1.54 g NH4?-N g-1 VSS per day
(Kim et al. 2009), and 2.76 g NH4?-N g-1 VSS per day
(Jianlong and Ning 2004)).
Materials and methods
Seed sludge and synthetic wastewater
A biomass with a mixed culture nitrifying bacteria was
obtained from the activated sludge of an urban wastewater
treatment plant (WWTP) in Pantai Dalam, Kuala Lumpur,
Malaysia. The activated sludge was filtered to remove
wastes and washed repeatedly to remove internal nitrogen
components (NH4?, NO2
-, and NO3-). The sludge was
then dewatered and kept in a growth medium in a cold
room (4 �C) for future use. Sludge with an initial mixed-
liquor suspended solid (MLSS) concentration of 2 g L-1
166 Appl Water Sci (2017) 7:165–173
123
was inoculated into two 5 L sequencing batch reactors to
acclimatize with high-strength ammonium. A headspace of
1 L was provided to prevent any solid loss generally
caused by foaming. The reactors were fed with synthetic
wastewater according to Table 1. The synthetic wastewater
was stored in a cold room at temperature below 4 �C. Thefeed temperature increased to 25 �C before input to the
SBRs by a water bath. The SBRs were fed with synthetic
wastewater containing different C/N ratio with
1,000 mg L-1 of (NH4)2SO4 as the source of nitrogen. The
source of phosphorus was 200 mg L-1 KH2PO4, and car-
bon was prepared using 3,000 mg L-1 NaHCO3 to achieve
a suitable ratio of C/N. Trace elements were adjusted by
adding 1 mL/L of stock solution according to Table 1.
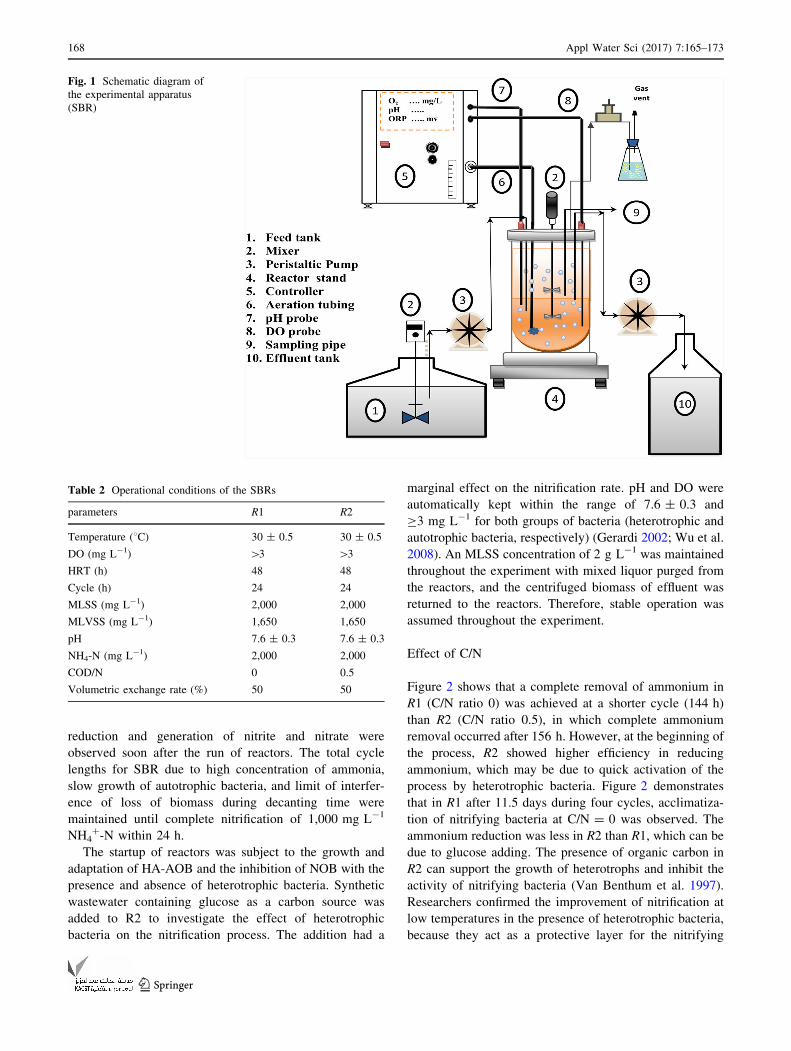
Experimental setup
The enrichment of high-activity AOB was conducted in a
laboratory-scale sequencing batch reactor (SBR) with a
working volume of 5 L (Fig. 1). Two reactors (R1, R2)
were run in multiple cycles with sequencing stages of 23 h
reaction, 50 min settling, 5 min decanting, and 5 min fill-
ing, with each cycle lasting no less than 24 h. The reactors
were provided with a thermostatic jacket, and temperature
was maintained at 30 ± 0.5 �C using a thermostatic bath.
The suspension medium was mechanically agitated
throughout the reaction time. The stirring rate was con-
trolled to be adequate (200 rpm) to create a uniform bio-
mass suspension. Two air pumps (HAILEA, ACO-9820,
China) supplied air that was fed from the bottom of the
reactors, and dissolved oxygen was measured with an
electrode (METTLER TOLEDO, O2-sensor, Switzerland)
and maintained higher than 3 mg L-1 by adjusting the air
flow rate manually. pH was measured with an electrode
(METTLER TOLEDO, ph-sensor, Switzerland) and
adjusted between 7.3 and 7.9 by automatic injection of acid
(H2SO4; 1 N) or alkaline (NaOH 1 N) solution, respec-
tively. The decanting ratio of feed was 0.5. At the end of
each settling phase, 50 % of the reactor contents was
decanted and replaced with new feed. Furthermore, no
sludge removal and MLSS of effluent returned to the
reactors, with the centrifugation at 3,600 rpm for 10 min
for all decanted samples.
Analytical methods
The samples were either analyzed immediately or stored at
temperature below 4 �C until subjected to analysis. The
determination of ammonium, nitrate, and nitrite concen-
trations was done using an Advanced Compact IC 861
(Metrohm� Ltd., Herisau, Switzerland) ion chromatograph
(IC) and guard column. The eluents to determine cation
and anion were prepared using ultrapure water (18.2 ls)containing pyridin-2, 6-dicarbonsaure (0.117 g/L), and
HNO3 (0.11 mL/L) for cation, and NaCO3 (0.3392 g/L),
NaHCO3 (0.084 mg/L), and H2SO4 (0.1 mol) for anion,
respectively. Before analyses, the samples were centri-
fuged and filtered with a 0.2 lm filter. The process tem-
perature, pH, DO, and ORP were continually monitored by
a digital controller. In addition, the MLSS and MLVSS
were determined following standard methods (APHA et al.
2012). Experiments were repeated if an error higher than
5 % occurred in the sample analysis. By adjusting pH,
temperature, and the remaining concentration of ammo-
nium, FA and FNA concentrations were calculated
according to Eqs. 3 and 4 (Chen et al. 2010). The operating
conditions in this research are summarized in Table 2.
FA mg/Lð Þ ¼ 17
14� ½NH4 � N� � 10pH
exp½6344= 273þ Tð Þ� þ 10pHð3Þ
FNA mg/Lð Þ ¼ 46
14� ½NO�
2 � N�exp½�2300= 273þ Tð Þ� � 10pH
ð4Þ
Results and discussion
Acclimatization performance of the HA-AOB
The experiments were carried out by feeding the reactors in
parallel at 30 ± 0.5 �C with an initial NH4?-N concen-
tration of 1,000 mg L-1, which is considered to be highly
contaminated ammonium wastewater. The reaction time
(RT) was maintained at 23 h for both reactors. Ammonium
Table 1 Synthetic wastewater compositions
Constituent Concentration (mg L-1)
NH4-N 2,000
NaHCO3 6,000
KH2PO4 400 (as P)
MgSO4�(g/l) 120
Glucose 0 and 1,000
pH 8
Composition of trace element solution (1 ml/pre liter of reactor)
EDTA 10
ZnSO4�7H2O 2.2
CoCL2�6H2O 3.2
MnCl2�4H2O 10.2
CuSO4�5H2O 0.22
(NH4)6Mo7O24�4H2O 2.2
CaCl2�2H2O 1.1
FeSO4�7H2O 10
H3BO3 0.3
NiSO4�6H2O 1
Appl Water Sci (2017) 7:165–173 167
123
reduction and generation of nitrite and nitrate were
observed soon after the run of reactors. The total cycle
lengths for SBR due to high concentration of ammonia,
slow growth of autotrophic bacteria, and limit of interfer-
ence of loss of biomass during decanting time were
maintained until complete nitrification of 1,000 mg L-1
NH4?-N within 24 h.
The startup of reactors was subject to the growth and
adaptation of HA-AOB and the inhibition of NOB with the
presence and absence of heterotrophic bacteria. Synthetic
wastewater containing glucose as a carbon source was
added to R2 to investigate the effect of heterotrophic
bacteria on the nitrification process. The addition had a
marginal effect on the nitrification rate. pH and DO were
automatically kept within the range of 7.6 ± 0.3 and
C3 mg L-1 for both groups of bacteria (heterotrophic and
autotrophic bacteria, respectively) (Gerardi 2002; Wu et al.
2008). An MLSS concentration of 2 g L-1 was maintained
throughout the experiment with mixed liquor purged from
the reactors, and the centrifuged biomass of effluent was
returned to the reactors. Therefore, stable operation was
assumed throughout the experiment.
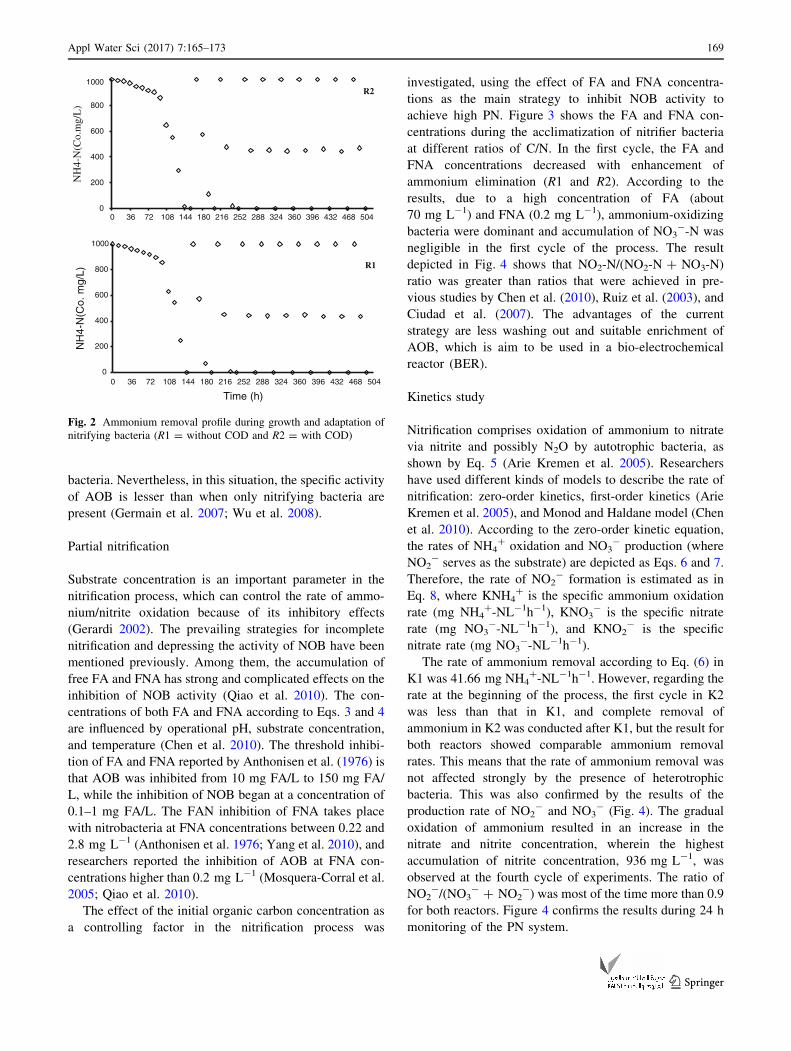
Effect of C/N
Figure 2 shows that a complete removal of ammonium in
R1 (C/N ratio 0) was achieved at a shorter cycle (144 h)
than R2 (C/N ratio 0.5), in which complete ammonium
removal occurred after 156 h. However, at the beginning of
the process, R2 showed higher efficiency in reducing
ammonium, which may be due to quick activation of the
process by heterotrophic bacteria. Figure 2 demonstrates
that in R1 after 11.5 days during four cycles, acclimatiza-
tion of nitrifying bacteria at C/N = 0 was observed. The
ammonium reduction was less in R2 than R1, which can be
due to glucose adding. The presence of organic carbon in
R2 can support the growth of heterotrophs and inhibit the
activity of nitrifying bacteria (Van Benthum et al. 1997).
Researchers confirmed the improvement of nitrification at
low temperatures in the presence of heterotrophic bacteria,
because they act as a protective layer for the nitrifying
Fig. 1 Schematic diagram of
the experimental apparatus
(SBR)
Table 2 Operational conditions of the SBRs
parameters R1 R2
Temperature (8C) 30 ± 0.5 30 ± 0.5
DO (mg L-1) [3 [3
HRT (h) 48 48
Cycle (h) 24 24
MLSS (mg L-1) 2,000 2,000
MLVSS (mg L-1) 1,650 1,650
pH 7.6 ± 0.3 7.6 ± 0.3
NH4-N (mg L-1) 2,000 2,000
COD/N 0 0.5
Volumetric exchange rate (%) 50 50
168 Appl Water Sci (2017) 7:165–173
123
bacteria. Nevertheless, in this situation, the specific activity
of AOB is lesser than when only nitrifying bacteria are
present (Germain et al. 2007; Wu et al. 2008).
Partial nitrification
Substrate concentration is an important parameter in the
nitrification process, which can control the rate of ammo-
nium/nitrite oxidation because of its inhibitory effects
(Gerardi 2002). The prevailing strategies for incomplete
nitrification and depressing the activity of NOB have been
mentioned previously. Among them, the accumulation of
free FA and FNA has strong and complicated effects on the
inhibition of NOB activity (Qiao et al. 2010). The con-
centrations of both FA and FNA according to Eqs. 3 and 4
are influenced by operational pH, substrate concentration,
and temperature (Chen et al. 2010). The threshold inhibi-
tion of FA and FNA reported by Anthonisen et al. (1976) is
that AOB was inhibited from 10 mg FA/L to 150 mg FA/
L, while the inhibition of NOB began at a concentration of
0.1–1 mg FA/L. The FAN inhibition of FNA takes place
with nitrobacteria at FNA concentrations between 0.22 and
2.8 mg L-1 (Anthonisen et al. 1976; Yang et al. 2010), and
researchers reported the inhibition of AOB at FNA con-
centrations higher than 0.2 mg L-1 (Mosquera-Corral et al.
2005; Qiao et al. 2010).
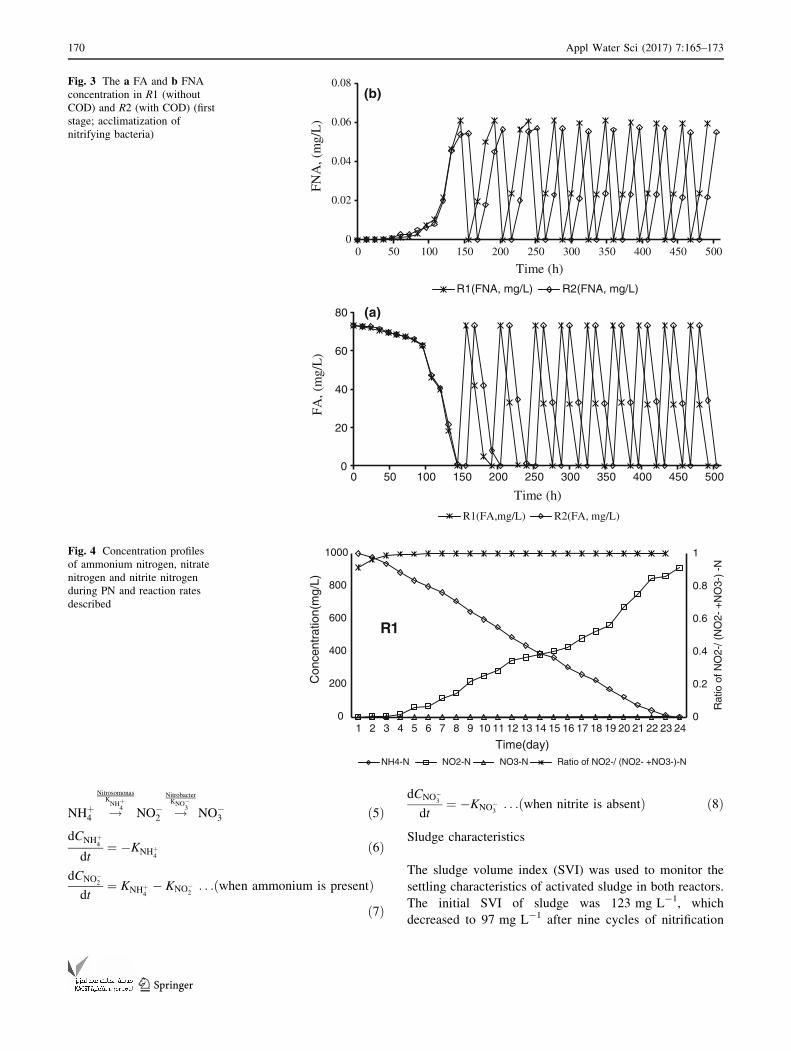
The effect of the initial organic carbon concentration as
a controlling factor in the nitrification process was
investigated, using the effect of FA and FNA concentra-
tions as the main strategy to inhibit NOB activity to
achieve high PN. Figure 3 shows the FA and FNA con-
centrations during the acclimatization of nitrifier bacteria
at different ratios of C/N. In the first cycle, the FA and
FNA concentrations decreased with enhancement of
ammonium elimination (R1 and R2). According to the
results, due to a high concentration of FA (about
70 mg L-1) and FNA (0.2 mg L-1), ammonium-oxidizing
bacteria were dominant and accumulation of NO3--N was
negligible in the first cycle of the process. The result
depicted in Fig. 4 shows that NO2-N/(NO2-N ? NO3-N)
ratio was greater than ratios that were achieved in pre-
vious studies by Chen et al. (2010), Ruiz et al. (2003), and
Ciudad et al. (2007). The advantages of the current
strategy are less washing out and suitable enrichment of
AOB, which is aim to be used in a bio-electrochemical
reactor (BER).
Kinetics study
Nitrification comprises oxidation of ammonium to nitrate
via nitrite and possibly N2O by autotrophic bacteria, as
shown by Eq. 5 (Arie Kremen et al. 2005). Researchers
have used different kinds of models to describe the rate of
nitrification: zero-order kinetics, first-order kinetics (Arie
Kremen et al. 2005), and Monod and Haldane model (Chen
et al. 2010). According to the zero-order kinetic equation,
the rates of NH4? oxidation and NO3
- production (where
NO2- serves as the substrate) are depicted as Eqs. 6 and 7.
Therefore, the rate of NO2- formation is estimated as in
Eq. 8, where KNH4? is the specific ammonium oxidation
rate (mg NH4?-NL-1h-1), KNO3
- is the specific nitrate
rate (mg NO3--NL-1h-1), and KNO2
- is the specific
nitrate rate (mg NO3--NL-1h-1).
The rate of ammonium removal according to Eq. (6) in
K1 was 41.66 mg NH4?-NL-1h-1. However, regarding the
rate at the beginning of the process, the first cycle in K2
was less than that in K1, and complete removal of
ammonium in K2 was conducted after K1, but the result for
both reactors showed comparable ammonium removal
rates. This means that the rate of ammonium removal was
not affected strongly by the presence of heterotrophic
bacteria. This was also confirmed by the results of the
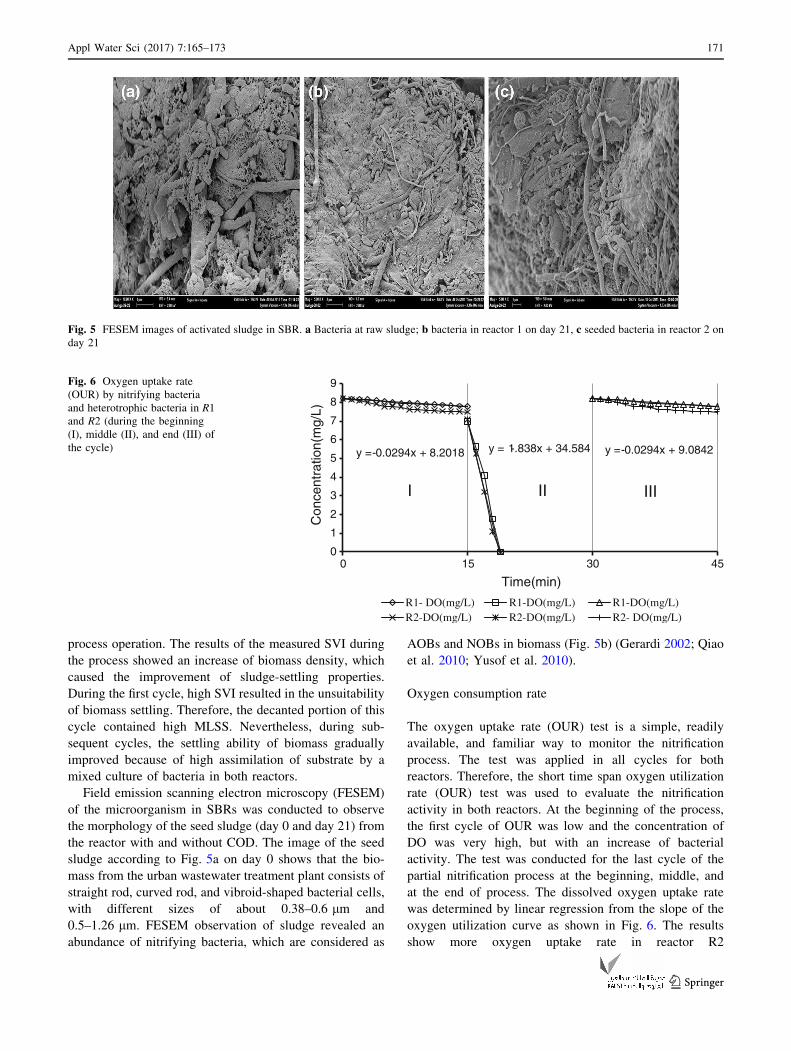
production rate of NO2- and NO3
- (Fig. 4). The gradual
oxidation of ammonium resulted in an increase in the
nitrate and nitrite concentration, wherein the highest
accumulation of nitrite concentration, 936 mg L-1, was
observed at the fourth cycle of experiments. The ratio of
NO2-/(NO3
- ? NO2-) was most of the time more than 0.9
for both reactors. Figure 4 confirms the results during 24 h
monitoring of the PN system.
0
200
400
600
800
0 36 72 108 144 180 216 252 288 324 360 396 432 468 504
NH
4-N
(Co.
mg/
L)
R2
0
200
400
600
800
1000
1000
0 36 72 108 144 180 216 252 288 324 360 396 432 468 504
NH
4-N
(Co.
mg/
L)
Time (h)
R1
Fig. 2 Ammonium removal profile during growth and adaptation of
nitrifying bacteria (R1 = without COD and R2 = with COD)
Appl Water Sci (2017) 7:165–173 169
123
NHþ4 !
NitrosomonasKNHþ
4NO�
2 !NitrobacterKNO�
3NO�
3 ð5ÞdCNHþ
4
dt¼ �KNHþ
4ð6Þ
dCNO�2
dt¼ KNHþ
4� KNO�
2. . .ðwhen ammonium is presentÞ
ð7Þ
dCNO�3
dt¼ �KNO�
3. . .ðwhen nitrite is absentÞ ð8Þ
Sludge characteristics
The sludge volume index (SVI) was used to monitor the
settling characteristics of activated sludge in both reactors.
The initial SVI of sludge was 123 mg L-1, which
decreased to 97 mg L-1 after nine cycles of nitrification
0
0.02
0.04
0.06
0.08
0 50 100 150 200 250 300 350 400 450 500
FNA
, (m
g/L
)
Time (h)
R1(FNA, mg/L) R2(FNA, mg/L)
0
20
40
60
80
0 50 100 150 200 250 300 350 400 450 500
FA, (
mg/
L)
Time (h)
R1(FA,mg/L) R2(FA, mg/L)
(b)
(a)
Fig. 3 The a FA and b FNA
concentration in R1 (without
COD) and R2 (with COD) (first
stage; acclimatization of
nitrifying bacteria)
0
0.2
0.4
0.6
0.8
1
0
200
400
600
800
1000
1 2 3 4 5 6 7 8 9 10 11 12 13 14 15 16 17 18 19 20 21 22 23 24R
atio
of N
O2-
/ (N
O2-
+N
O3-
) -N
Con
cent
ratio
n(m
g/L)
Time(day)NH4-N NO2-N NO3-N Ratio of NO2-/ (NO2- +NO3-)-N
R1
Fig. 4 Concentration profiles
of ammonium nitrogen, nitrate
nitrogen and nitrite nitrogen
during PN and reaction rates
described
170 Appl Water Sci (2017) 7:165–173
123
process operation. The results of the measured SVI during
the process showed an increase of biomass density, which
caused the improvement of sludge-settling properties.
During the first cycle, high SVI resulted in the unsuitability
of biomass settling. Therefore, the decanted portion of this
cycle contained high MLSS. Nevertheless, during sub-
sequent cycles, the settling ability of biomass gradually
improved because of high assimilation of substrate by a
mixed culture of bacteria in both reactors.
Field emission scanning electron microscopy (FESEM)
of the microorganism in SBRs was conducted to observe
the morphology of the seed sludge (day 0 and day 21) from
the reactor with and without COD. The image of the seed
sludge according to Fig. 5a on day 0 shows that the bio-
mass from the urban wastewater treatment plant consists of
straight rod, curved rod, and vibroid-shaped bacterial cells,
with different sizes of about 0.38–0.6 lm and
0.5–1.26 lm. FESEM observation of sludge revealed an
abundance of nitrifying bacteria, which are considered as
AOBs and NOBs in biomass (Fig. 5b) (Gerardi 2002; Qiao
et al. 2010; Yusof et al. 2010).
Oxygen consumption rate
The oxygen uptake rate (OUR) test is a simple, readily
available, and familiar way to monitor the nitrification
process. The test was applied in all cycles for both
reactors. Therefore, the short time span oxygen utilization
rate (OUR) test was used to evaluate the nitrification
activity in both reactors. At the beginning of the process,
the first cycle of OUR was low and the concentration of
DO was very high, but with an increase of bacterial
activity. The test was conducted for the last cycle of the
partial nitrification process at the beginning, middle, and
at the end of process. The dissolved oxygen uptake rate
was determined by linear regression from the slope of the
oxygen utilization curve as shown in Fig. 6. The results
show more oxygen uptake rate in reactor R2
Fig. 5 FESEM images of activated sludge in SBR. a Bacteria at raw sludge; b bacteria in reactor 1 on day 21, c seeded bacteria in reactor 2 on
day 21
y = -0.0294x + 8.2018 y = -0.0294x + 9.0842y = -1.838x + 34.584
0
1
2
3
4
5
6
7
8
9
0 15 30 45
Con
cent
ratio
n(m
g/L)
Time(min)
R1- DO(mg/L) R1-DO(mg/L) R1-DO(mg/L)R2-DO(mg/L) R2-DO(mg/L) R2- DO(mg/L)
I II III
Fig. 6 Oxygen uptake rate
(OUR) by nitrifying bacteria
and heterotrophic bacteria in R1
and R2 (during the beginning
(I), middle (II), and end (III) of
the cycle)
Appl Water Sci (2017) 7:165–173 171
123
(2.86 mgO2 g VSS-1 min-1) because of the presence of
heterotrophic bacteria.
Conclusion
The results of applying various C/N ratios showed that a C/N
ratio of 0 is the most suitable for resulting in faster ammonium
removal, in contrast to the use of a C/N ratio of 0.5, in which
the nitrification process was slightly inhibited and complete
removal of ammonium was carried out for a longer time.
Factors FA and FNA are the main strategies of NOB inhibi-
tion, where the most significant inhibition was conducted by
FA over NOB in both reactors. The rate of ammonium
removal was 41.66 mg NH4--NL-1 h-1, and the acclimati-
zation of biomass was conducted at a high ratio of NO2--N/
(NO2--N ? NO3
--N). The results confirmed that enriched
biomass could be inoculums in a PN system to produce high
concentration of NO2-with improvement of biomass physical
characteristics during an acclimatization process.
Acknowledgments The authors are thankful for the financial sup-
port from Universiti Malaya (UM) through Grant No. RG 077/09SUS
and the Department of Civil Engineering, UM, for the use of
facilities.
Open Access This article is distributed under the terms of the
Creative Commons Attribution License which permits any use, dis-
tribution, and reproduction in any medium, provided the original
author(s) and the source are credited.
References
Anthonisen AC, Loehr RC, Prakasam TBS, Srinath EG (1976)
Inhibition of nitrification by ammonia and nitrous acid. I J Water
Pollut Control 48:835–852
APHA et al. (2012) Standard methods for the examination of water
and wastewater. American Public Health Association
Arie Kremen JB, Shavit URI, Shaviv AVI (2005) Model demonstrat-
ing the potential for coupled nitrification denitrification in soil
aggregates. Environ Sci Technol 39:4180–4188
Blackburne R, Yuan Z, Keller J (2008) Demonstration of nitrogen
removal via nitrite in a sequencing batch reactor treating
domestic wastewater. Water Res 42:2166–2176
Campos JL, Garrido-Fermindez JM, a R L. Mendez JM (1999)
Nitrification at high ammonia loading rates in an activated
sludge unit. Bioresour Technol 68:141–148
Carrera J, Vicent T, Lafuente J (2004) Effect of influent COD/N ratio
on biological nitrogen removal (BNR) from high-strength ammo-
nium industrial wastewater. Process Biochem 39:2035–2041
Chen S, Ling J, Blancheton JP (2006) Nitrification kinetics of biofilm
as affected by water quality factors. Aquacult Eng 34:179–197
Chen J, Zheng P, Yu Y, Mahmood Q, Tang C (2010) Enrichment of
high activity nitrifers to enhance partial nitrification process.
Bioresour Technol 101:7293–7298
Ciudad G, Gonzalez R, Bornhardt C, Antileo C (2007) Modes of
operation and pH control as enhancement factors for partial
nitrification with oxygen transport limitation. Water Res
41:4621–4629
Dosta J, Galı A, Benabdallah El-Hadj T, Mace S, Mata-Alvarez J
(2007) Operation and model description of a sequencing batch
reactor treating reject water for biological nitrogen removal via
nitrite. Bioresour Technol 98:2065–2075
Gerardi MH (2002) Nitrification in the activated sludge process.
Wiley Online Library, New York
Germain E, Bancroft L, Dawson A, Hinrichs C, Fricker L, Pearce P
(2007) Evaluation of hybrid processes for nitrification by
comparing MBBR/AS and IFAS configurations. Water Sci
Technol J Internatl Association Water Pollut Res 55:43
Grunditz C, Dalhammar G (2001) Development of nitrification
inhibition assays using pure cultures of nitrosomonas and
nitrobacter. Water Res 35:433–440
Jianlong W, Ning Y (2004) Partial nitrification under limited
dissolved oxygen conditions. Process Biochem 39:1223–1229
Kim J-H, Guo X, Behera SK, Park H-S (2009) A unified model of
ammonium oxidation rate at various initial ammonium strength
and active ammonium oxidizer concentrations. Bioresour Tech-
nol 100:2118–2123
Komorowska-Kaufman M, Majcherek H, Klaczynski E (2006)
Factors affecting the biological nitrogen removal from waste-
water. Process Biochem 41:1015–1021
Mata-Alvarez SMaJ (2002) Utilization of SBR technology for
wastewater treatment: an overview. Ind Eng Chem Res
41:5539–5553
Mosquera-Corral A, Gonzalez F, Campos J, Mendez R (2005) Partial
nitrification in a SHARON reactor in the presence of salts and
organic carbon compounds. Process Biochem 40:3109–3118
Mousavi S, Ibrahim S, Aroua MK (2012) Sequential nitrification and
denitrification in a novel palm shell granular activated carbon
twin-chamber upflow bio-electrochemical reactor for treating
ammonium-rich wastewater. Bioresour Technol 125:256–266
Okabe S, Oozawa Y, Hirata K, Watanabe Y (1996) Relationship
between population dynamics of nitrifiers in biofilms and reactor
performance at various C:N ratios. Water Res 30:1563–1572
Qiao S, Matsumoto N, Shinohara T, Nishiyama T, Fujii T, Bhatti Z,
Furukawa K (2010) High-rate partial nitrification performance of
high ammonium containing wastewater under low temperatures.
Bioresour Technol 101:111–117
Rostron WM, Stuckey DC, Young AA (2001) Nitrification of high
strength ammonia wastewaters: comparative study of immobi-
lisation media. Water Res 35:1169–1178
Ruiz G, Jeison D, Chamy R (2003) Nitrification with high nitrite
accumulation for the treatment of wastewater with high ammo-
nia concentration. Water Res 37:1371–1377
Van Benthum W, Van Loosdrecht M, Heijnen J (1997) Control of
heterotrophic layer formation on nitrifying biofilms in a biofilm
airlift suspension reactor. Biotechnol Bioeng 53:397–405
Van Kempen R, Mulder J, Uijterlinde C, Loosdrecht M (2001)
Overview: full scale experience of the SHARON� process for
treatment of rejection water of digested sludge dewatering.
Water Sci Technol 44:145–152
Volcke EIP, Gernaey KV, Vrecko D, Jeppsson U, van Loosdrecht
MCM, Vanrolleghem PA, Kroiss H (2006) Plant-wide (BSM 2)
evaluation of reject water treatment with a SHARON–Anammox
process. Citeseer
Whang L-M, Chien IC, Yuan S-L, Wu Y-J (2009) Nitrifying
community structures and nitrification performance of full-scale
municipal and swine wastewater treatment plants. Chemosphere
75:234–242
Wu G, Rodgers M, Zhan X (2008) Nitrification in sequencing batch
reactors with and without glucose addition at 11 �C. BiochemEng J 40:373–378
172 Appl Water Sci (2017) 7:165–173
123
Yang J, Zhang L, Daisuke H, Takahiro S, Ma Y, Li Z, Furukawa K
(2010) High rate partial nitrification treatment of reject waste-
water. J Biosci Bioeng 110:436–440
Yusof N, Hassan MA, Phang LY, Tabatabaei M, Othman MR, Mori
M, Wakisaka M, Sakai K, Shirai Y (2010) Nitrification of
ammonium-rich sanitary landfill leachate. Waste Manag
30:100–109
Zheng P, Xu XY, Hu BL (2004) Novel theories and technologies for
biological nitrogen removal. Science Press, Beijing
Appl Water Sci (2017) 7:165–173 173
123