Embed Size (px)
Citation preview
RESEARCH PAPER
Effect of Caloric Restriction and AMPK Activation on HepaticNuclear Receptor, Biotransformation Enzyme, and TransporterExpression in Lean and Obese Mice
Supriya R. Kulkarni & Jialin Xu & Ajay C. Donepudi & Wei Wei & Angela L. Slitt
Received: 8 January 2013 /Accepted: 1 July 2013 /Published online: 16 August 2013# Springer Science+Business Media New York 2013
ABSTRACTPurpose Fatty liver alters liver transporter expression. Caloricrestriction (CR), the recommended therapy to reverse fatty liver,increases Sirtuin1 deacetylase activity in liver. This study evalu-ated whether CR and CR mimetics reversed obesity-inducedtransporter expression in liver and hepatocytes.Methods mRNA and protein expression was determined inadult lean (lean) and leptin-deficient obese (OB) mice fed adlibitum or placed on 40% (kCal) reduced diet. Hepatocyteswere isolated from lean and OB mice, treated with AMP Kinaseactivators, and gene expression was determined.Results CR decreased Oatp1a1, Oatp1b2, and Abcb11 mRNAexpression in lean, but not OB mice. CR increased Abcc2mRNA OB livers, whereas protein expression increased in bothgenotypes. CR increased Abcc3 protein expression increased inOB livers. CR did not alter Abcc1, 4 and 5 mRNA expression inlean mice but decreased expression in livers of OB mice. CRincreased Abcc4 protein in lean, but not OB mice.Conclusions CR restriction reversed the expression of some,but not all transporters in livers of OB mice. Overall, these dataindicate a potential for CR to restore some hepatic transporterchanges in OBmice, but suggest a functional leptin axis is neededfor reversal of expression for some transporters.
KEY WORDS gene expression . liver . nuclear receptor .steatosis . transport
ABBREVIATIONSAbcc ATP-Binding Cassette, sub-family CAhr Aryl hydrocarbon receptorAL ad libitumAMPK AMP KinaseCar Constitutive androstane receptorCR caloric restrictionCreb cAMP response element binding proteinCyp Cytochrome P450Fxr Farnesoid x receptorGclc Glutamate-cysteine ligase, catalytic subunitGsta1 Glutathione S-transferase a1Ho-1 Heme oxygenase 1Nqo1 NADPH:quinone oxidoreductaseNR nuclear receptorNrf2 Nuclear factor (erythroid-derived 2)-like 2Oatp Organic anion transporting polypeptide (Oatp)Pepck Phosphoenolpyruvate carboxykinasePGC1α Peroxisome proliferator-activated receptor-γ
coactivator-1αPPAR Peroxisome proliferator-activated receptorPXR Pregnane X receptorRXR Retinoid X receptorSod1 Superoxide dismutase 1Srebp-1c Sterol regulatory element binding protein 1cTF transcription factor
INTRODUCTION
Non-Alcoholic Fatty Liver Disease (NAFLD), or steatosis, isdefined as lipid accumulation exceeding 5% by weight inhepatocytes in the absence of substantial alcohol intake,often with increased hepatic triglyceride accumulation (1).Metabolic syndrome (MetS), which is a cluster of risk factorsfor coronary heart disease (e.g. obesity, inflammation,
Pharm Res (2013) 30:2232–2247DOI 10.1007/s11095-013-1140-2
Electronic supplementary material The online version of this article(doi:10.1007/s11095-013-1140-2) contains supplementary material,which is available to authorized users.
S. R. Kulkarni : J. Xu : A. C. Donepudi :W. Wei : A. L. Slitt (*)Department of Biomedical and Pharmaceutical SciencesCollege of Pharmacy, 7 Greenhouse RoadKingston, Rhode Island 02881, USAe-mail: [email protected]
dyslipidemia, and type-2 diabetes), is considered to be theunderlying cause of NAFLD (2). It is estimated that morethan 86% of US adults will be overweight or obese, andmore than 50% obese by the year 2030 (3). In the UnitedStates, prevalence of NAFLD alone, or in combination withincreased liver enzymes in serum, was 3.1% and 16.4%among adults, respectively (4). With no intervention, NAFLDcan progress to Non-alcoholic steatohepatitis (NASH) andcirrhosis.
Epidemiological and clinical studies demonstrate changedpharmacokinetic and –dynamic parameters of some drugs inobese subjects (5). NAFLD and NASH are associated withaltered pharmacokinetics of some drugs (e.g. ezetimibe, acet-aminophen), as well as, altered endogenous metabolite levels,such as cholesterol and bilirubin (6,7). Acetaminophen-glucuronide concentration in plasma and urine was higherin children with NAFLD (6), similar to what has been reportedin db/db mice that exhibit hepatic steatosis (8). This likelyoccurs because Phase-I, -II biotransformation enzyme, anddrug transporter expression is altered compared to non-steatotic livers (9,10).
Dietary changes, such as caloric restriction (CR) and exer-cise, are the recommended therapeutic intervention to treatNAFLD and reverse hepatic fat accumulation (11). For exam-ple, a regimen of diet and exercise decreased hepatic steatosisand serum lipids in overweight subjects with NAFLD (12).Also, vigorous physical activity was associated with decreasedadjusted odds of having NASH in adults with NAFLD (13).
Beneficial effects of CR are attributed to activation ofSirtuin 1 (Sirt1), a deacetylase that activates gluconeogenicand fatty acid oxidation gene expression via deacetylation andupregulation of the transcriptional co-activator, Peroxisomeproliferator-activated receptor gamma coactivator 1-alpha(Pgc-1α) (14). The AMP Kinase (AMPK) secondary messen-ger pathway is an upstream activator of the Sirt-Pgc1-αcascade during CR. AMPK activates Sirt1 deacetylasein response to changes in redox status (NAD+/NADHratio, AMP/ATP ratio) of the cell (15). Steatotic liversexhibit decreased AMPK pathway activity in rodentsand increased activity can reverse fatty liver (16). CRalters activity and expression of various biotransformationenzymes, such as Sult2a1, Cyp2b10, Ugt1a1, Cyp4a14 inliver (17–19). However, to our knowledge, no studies haveshown how CR actually affects drug transporter expressionin livers of obese mice, which have hepatic steatosis andcould better mimic the population most likely to undergointervention.
In the present study we hypothesized that CR wouldreverse the transcription factor (TF) and drug transporterexpression changes previously observed in obesity-inducedhepatic steatosis (10,20). Constitutive androstane receptor(Car), Farnesoid x receptor (Fxr), Pregnane x receptor(Pxr), and Nuclear factor E2-related factor 2 (Nrf2) are
transcription factors previously described to regulate trans-porter expression in liver (21). Given the well-describedassociation of Nrf2 with Abcc transporter induction (22,23),emphasis was placed on the Nrf2 pathway in the presentstudy, but Car, Fxr, and Pxr were also evaluated. Our dataherein illustrate that CR differentially regulates TF, bio-transformation enzyme, and transporter expression in liversfrom lean and Lepob/ob mice. Furthermore, AMPK andSirt1 activators differentially modulated transporter andNR expression in lean and steatotic hepatocytes.
MATERIALS AND METHODS
Animals and Treatments
Adult male lean and OB mice were chosen for this studybecause previous work revealed that transporter expressionwas markedly altered in livers of OB mice (20). Adult maleC57BL/6 (lean, stock no. 000664) and Lepob/ob (OB, B6.V-Lepob/J, stock no. 0000632) mice were purchased fromJackson Laboratories (Bar Harbor, ME). C57BL/6 miceused in this study as lean controls are the recommendedvendor controls (Jackon Laboratories, Bar Harbor, ME).Mice were housed in a temperature-, light-, and humidity-controlled environment in cages with corn-cob bedding, andfed Harlan Teklad LM-485Mouse/rat sterilizable diet (Har-lan Laboratories, Madison, WI) ad libitum. After acclimationfor 2 weeks, mice were transferred on to a purified diet(AIN93-G) obtained from Test Diet, IN, USA and allowedto acclimate for a period of 2 weeks. The average caloricconsumption was calculated for each mouse over a period of10 days. At 16 weeks of age, lean (n=7) and OB mice (n=7)were fed ad libitum, or lean (n=10) and OB mice (n=10) werefed a 40% reduced caloric diet for 10 weeks with access towater ad libitum. Body weight and food consumption weremonitored at least once per week for the entire study. Thestudy was terminated when weights remained similar forseveral weeks. Blood glucose measurement and necropsywas performed in the morning between 10–12 am. Thestudy was carried at University of Rhode Island and IACUCapproved.
Primary Mouse Hepatocyte Isolation
Primary mouse hepatocytes were obtained from livers ofadult C57BL/6 and OB mice using a two-step collagenaseperfusion; 1×10⁶ cells/well in 2 mL completed medium(MEM supplied with 10% FBS) were seeded on collagen-coated 6-well plates. After cell attachment (~4 h), they werecultured in serum-free MEM containing 1% ITS supple-ment (Invitrogen, CA). Approximately 24 h post-plating,hepatocytes were treated with control (media or 0.01%
Caloric Restriction and Transporters 2233
DMSO), AICAR (0.5 mM), NAD+(5 mM) or Metformin(1 mM) for 6 h. Total RNA was isolated from TRIzol reagent(Invitrogen, CA) according to the manufacturer’s instructions.
RNA Isolation and mRNA Quantification
Total RNA was isolated from liver by phenol-chloroformextraction with RNAzol B reagent (Tel-Test Inc., Friends-wood, TX) according to the manufacturer’s instructions.RNA concentration was determined by measuring UV absor-bance at 260 nm using NanoDrop™ and integrity wasconfirmed by formaldehyde gel electrophoresis. The to-tal RNA samples were stored at −80°C until further usefor analysis. The total RNA samples were analyzed formRNA quantification using Branched DNA signal am-plification assay (Quantigene 1.0 assay), obtained fromPanomics Inc., CA, USA. RNA obtained from hepato-cyte treatment was quantified using RT2-PCR methods asdescribed in (10).
Tissue Homogenate, Membrane, and CytosolPreparation
Liver membrane and cytosol fractions were obtained aspreviously described for assessing transporter expression(20,24). Briefly, tissues were homogenized 150 mM sucrosein 10 mM Tris–HCl (ST) buffer (1:9 ratio), pH 7.5, using aPotter Elvehjem motorized homogenizer. Homogenateswere centrifuged at 100,000×g for 1 h at 4°C. The resultingsupernatant (cytosolic fraction) was saved and pellets werere-suspended in ST buffer.
Western Blotting
Fifty microgram protein lysates were solubilized in Laemmlibuffer containing β-mercaptoethanol and electrophoretically sep-arated by SDS-PAGE (8% for Abccs and 10% for Oatps, 12%for cytosolic, nuclear and homogenate samples) at 200 V for50 min and transferred onto a polyvinylidene difluoride mem-brane at 100 V for 30–45 min or at 75 V for 1.5 h. Themembrane was blocked overnight with 5% Non-fat dry milk(NFDM) in phosphate-buffered saline with 0.05% Tween 20(PBS/T) or 50 mM Tris, 150 mM NaCl, 0.05% Tween 20(TBS/T). After blocking, the membrane was incubated withprimary antibodies diluted in 5% NFDM in PBS/T orTBS/T for 2 h and subsequently with corresponding horse-radish peroxidase labeled secondary antibodies also diluted in5% NFDM in PBS/T as previously described in (8, 10).The blots were incubated in Pierce ECL-Plus western blotdetection reagent (Thermo Fisher Scientific, Rockford, IL,USA) and exposed to X-ray film, developed, and visualized.The resulting autoradiography films were quantified usingImageQuant software (Bio-Rad, Hercules, CA). Oatp1a4 and
2b1 western blots were attempted, but not successful. Details ofthe antibodies used are as previously published (25).
Transcription Factor Binding Assay
Nuclear extracts were isolated from livers using a TF Procartanuclear extraction kit (Panomics Inc, CA, USA) and proteinconcentrations were measured with BCA protein assay (Pierce,Rockford, IL, USA). The resulting fractions were checked forenrichment of nuclear proteins by western blot with Lamin B1antibody. Nrf2, AhR, Pxr, Fxr, binding to described consensussequences was quantified using a Procarta TF custom array(Affymetrix, CA) using 10 μg nuclear extract protein per sampleaccording to manufacturer’s instructions and published work(10). Samples were analyzed using a Luminex Bio-Plex 200 arrayreader with Luminex 100 xMAP technology, and data wereacquired using Bio-Plex Manager software (version 5.0). Datawas acquired by a Luminex Bio-plexTM 200 Array reader withLuminex 100X-MAP technology, and data were acquired usingBio-Plex Data Manager Software Version 5.0 (Bio-Rad, Hercu-les, CA).
Heatmap and Cluster Analysis
mRNA expression of genes quantified in vivo and in vitro wereplotted on a heatmap using the R software environment (RFoundation for Statistical Computing, Vienna, Austria). Thegenes in lean and OB CR groups were normalized to theirrespective ad libitum controls and the fold changes relative tocontrol were used for heat map generation. The spectrum offold changes spans from−14 to +14 fold in reference to control.
Statistics
The statistical significance of differences was determined bya two-way ANOVA followed by a Duncan’s Multiple Rangepost-hoc test. Groups without a common letter are consideredsignificantly different from each other (p≤0.05).
RESULTS
CR Decreases BodyWeight and Hepatic Lipid Contentin Lean and OB Mice
After 10 weeks of CR, average body weight decreased by 30%and 12% in lean and OB mice, respectively (Fig. 1a). CRdecreased the average liver and liver-to-body weight ratio inboth genotypes, with a greater liver weight decrease in leanmice (Table I). CR also decreased serum glucose (50% inleans), TG (50% in lean and 11% in OB), and increasedNon-esterified fatty acid (NEFA) levels (60% in lean and~100% in OB over the AL fed controls). Additionally, CR
2234 Kulkarni, Xu, Donepudi and Slitt
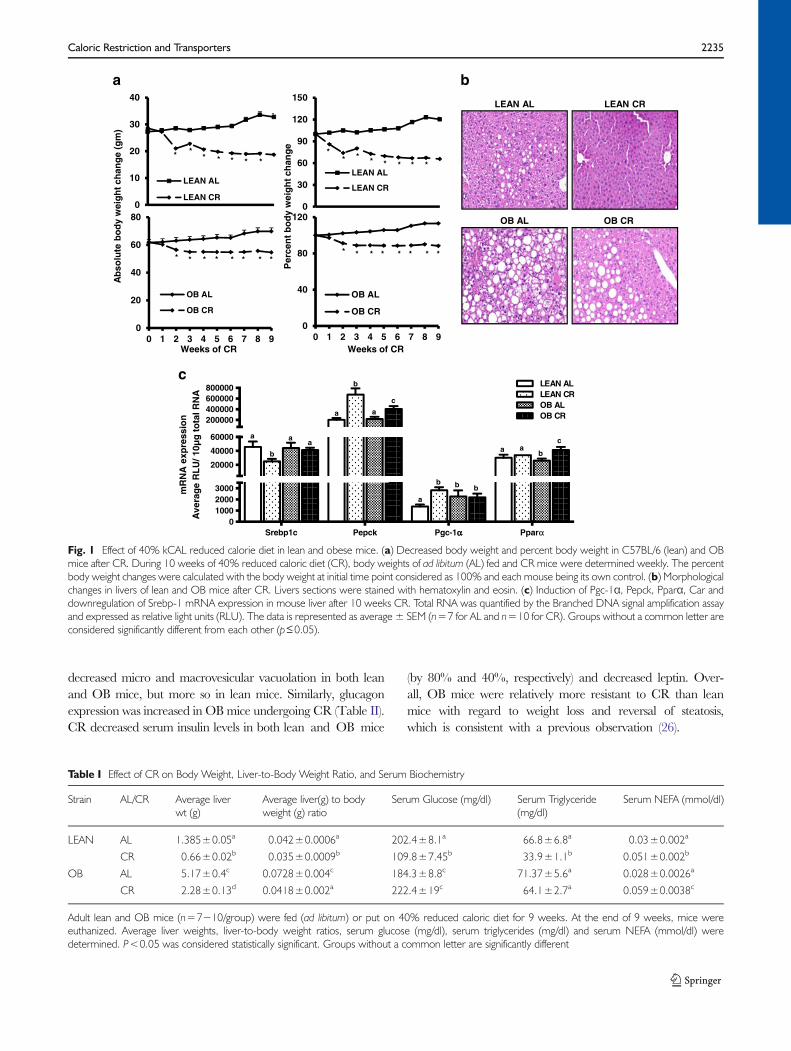
decreased micro and macrovesicular vacuolation in both leanand OB mice, but more so in lean mice. Similarly, glucagonexpression was increased in OBmice undergoing CR (Table II).CR decreased serum insulin levels in both lean and OB mice
(by 80% and 40%, respectively) and decreased leptin. Over-all, OB mice were relatively more resistant to CR than leanmice with regard to weight loss and reversal of steatosis,which is consistent with a previous observation (26).
a b
LEAN CRLEAN AL
OB CROB AL
c
Ab
solu
te b
od
y w
eig
ht c
han
ge
(gm
)
0
40
80
120
0 1 2 3 4 5 6 7 8 9
OB AL
OB CR
Weeks of CR
Per
cen
t b
od
y w
eig
ht c
han
ge
0
20
40
60
80
0 1 2 3 4 5 6 7 8 9
OB AL
OB CR
Weeks of CR
0
10
20
30
40
LEAN AL
LEAN CR
* ** * * * *
0
30
60
90
120
150
LEAN AL
LEAN CR
** * * * * * *
* * * * * * * ** * * * * * * *
Srebp1c Pepck Pgc-1αα Pparα0
100020003000
20000
40000
60000
200000400000600000800000
OB AL
LEAN ALLEAN CR
OB CR
b
a
b
aa
a a
c
a
b b b
a ab
c
mR
NA
exp
ress
ion
Ave
rag
e R
LU
/ 10µ
g t
ota
l RN
A
Fig. 1 Effect of 40% kCAL reduced calorie diet in lean and obese mice. (a) Decreased body weight and percent body weight in C57BL/6 (lean) and OBmice after CR. During 10 weeks of 40% reduced caloric diet (CR), body weights of ad libitum (AL) fed and CR mice were determined weekly. The percentbody weight changes were calculated with the body weight at initial time point considered as 100% and each mouse being its own control. (b) Morphologicalchanges in livers of lean and OB mice after CR. Livers sections were stained with hematoxylin and eosin. (c) Induction of Pgc-1α, Pepck, Pparα, Car anddownregulation of Srebp-1 mRNA expression in mouse liver after 10 weeks CR. Total RNA was quantified by the Branched DNA signal amplification assayand expressed as relative light units (RLU). The data is represented as average ± SEM (n=7 for AL and n=10 for CR). Groups without a common letter areconsidered significantly different from each other (p≤0.05).
Table I Effect of CR on Body Weight, Liver-to-Body Weight Ratio, and Serum Biochemistry
Strain AL/CR Average liverwt (g)
Average liver(g) to bodyweight (g) ratio
Serum Glucose (mg/dl) Serum Triglyceride(mg/dl)
Serum NEFA (mmol/dl)
LEAN AL 1.385±0.05a 0.042±0.0006a 202.4±8.1a 66.8±6.8a 0.03±0.002a
CR 0.66±0.02b 0.035±0.0009b 109.8±7.45b 33.9±1.1b 0.051±0.002b
OB AL 5.17±0.4c 0.0728±0.004c 184.3±8.8c 71.37±5.6a 0.028±0.0026a
CR 2.28±0.13d 0.0418±0.002a 222.4±19c 64.1±2.7a 0.059±0.0038c
Adult lean and OB mice (n=7−10/group) were fed (ad libitum) or put on 40% reduced caloric diet for 9 weeks. At the end of 9 weeks, mice wereeuthanized. Average liver weights, liver-to-body weight ratios, serum glucose (mg/dl), serum triglycerides (mg/dl) and serum NEFA (mmol/dl) weredetermined. P<0.05 was considered statistically significant. Groups without a common letter are significantly different
Caloric Restriction and Transporters 2235
CR Decreases Lipogenic Gene and IncreasesGluconeogenic Gene Expression
CR induces glucagon secretion to increase mitochondrial bio-genesis and up regulate glucose production. This well charac-terized response results in the induction of genes needed toincrease gluconeogenesis (27). Therefore, genes known to beregulated by CRweremeasured to further confirm response tothe food restriction. mRNA expression of the lipogenic masterregulator, Srebp-1c, was decreased in lean mouse livers butremained unchanged inOBmouse liver after CR (Fig. 1c). CRincreased expression of gluconeogenic genes Pgc-1α and Pepckin lean mouse livers (2 and 3.5 fold, respectively), however thisincrease was decreased in OBmouse livers (Fig. 1c), which hasbeen previously described (14). CR did not increase Ppar-αmRNA expression in leans, but did in OB mice.
CR Alters mRNA Expression of Various DrugBiotransformation Enzymes, Transportersand Transcription Regulators in Livers of Lean and OBMice
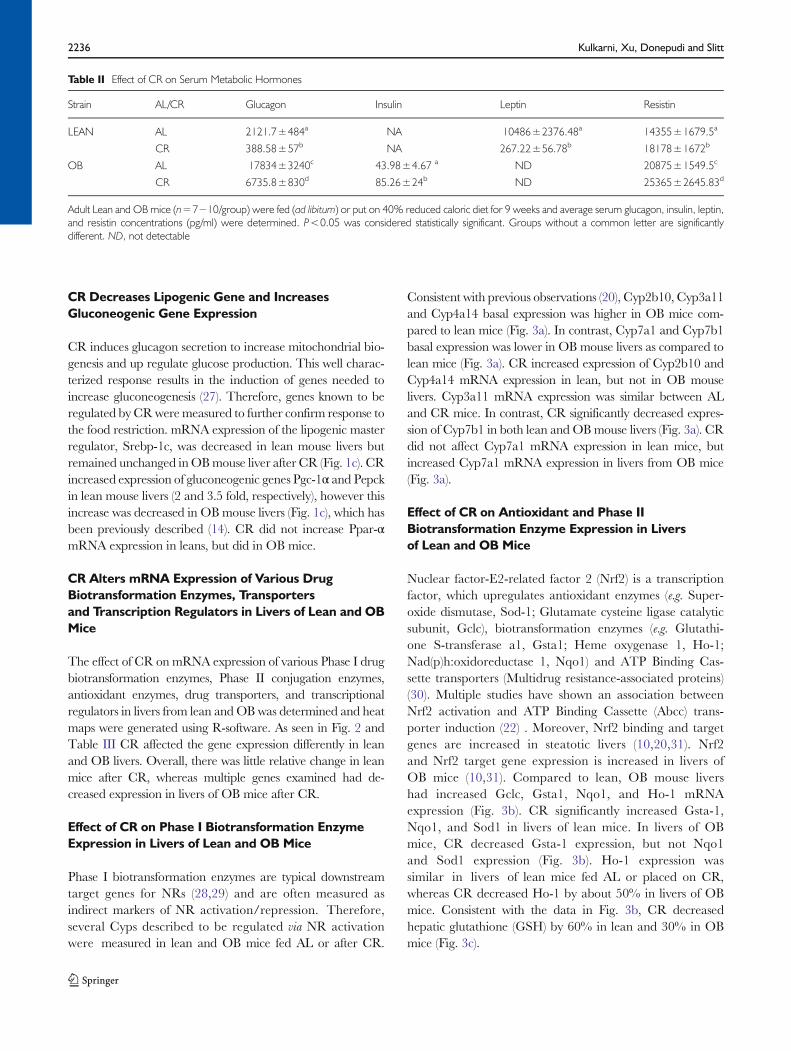
The effect of CR on mRNA expression of various Phase I drugbiotransformation enzymes, Phase II conjugation enzymes,antioxidant enzymes, drug transporters, and transcriptionalregulators in livers from lean andOB was determined and heatmaps were generated using R-software. As seen in Fig. 2 andTable III CR affected the gene expression differently in leanand OB livers. Overall, there was little relative change in leanmice after CR, whereas multiple genes examined had de-creased expression in livers of OB mice after CR.
Effect of CR on Phase I Biotransformation EnzymeExpression in Livers of Lean and OB Mice
Phase I biotransformation enzymes are typical downstreamtarget genes for NRs (28,29) and are often measured asindirect markers of NR activation/repression. Therefore,several Cyps described to be regulated via NR activationwere measured in lean and OB mice fed AL or after CR.
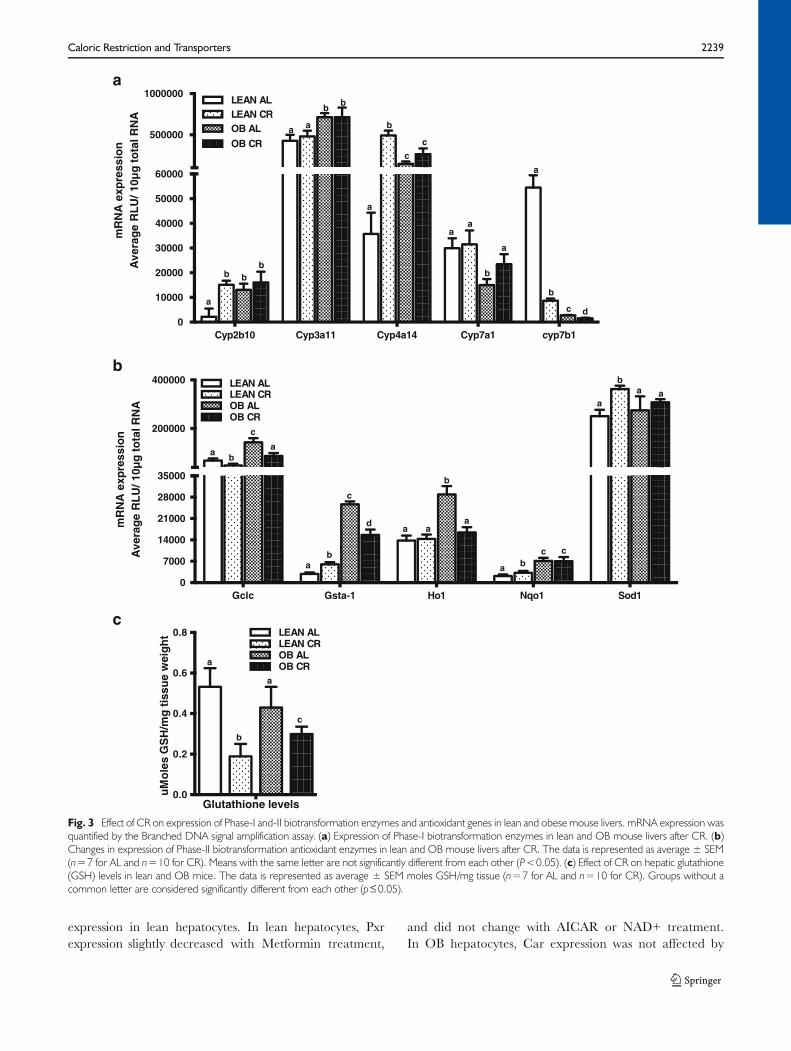
Consistent with previous observations (20), Cyp2b10, Cyp3a11and Cyp4a14 basal expression was higher in OB mice com-pared to lean mice (Fig. 3a). In contrast, Cyp7a1 and Cyp7b1basal expression was lower in OB mouse livers as compared tolean mice (Fig. 3a). CR increased expression of Cyp2b10 andCyp4a14 mRNA expression in lean, but not in OB mouselivers. Cyp3a11 mRNA expression was similar between ALand CR mice. In contrast, CR significantly decreased expres-sion of Cyp7b1 in both lean and OBmouse livers (Fig. 3a). CRdid not affect Cyp7a1 mRNA expression in lean mice, butincreased Cyp7a1 mRNA expression in livers from OB mice(Fig. 3a).
Effect of CR on Antioxidant and Phase IIBiotransformation Enzyme Expression in Liversof Lean and OB Mice
Nuclear factor-E2-related factor 2 (Nrf2) is a transcriptionfactor, which upregulates antioxidant enzymes (e.g. Super-oxide dismutase, Sod-1; Glutamate cysteine ligase catalyticsubunit, Gclc), biotransformation enzymes (e.g. Glutathi-one S-transferase a1, Gsta1; Heme oxygenase 1, Ho-1;Nad(p)h:oxidoreductase 1, Nqo1) and ATP Binding Cas-sette transporters (Multidrug resistance-associated proteins)(30). Multiple studies have shown an association betweenNrf2 activation and ATP Binding Cassette (Abcc) trans-porter induction (22) . Moreover, Nrf2 binding and targetgenes are increased in steatotic livers (10,20,31). Nrf2and Nrf2 target gene expression is increased in livers ofOB mice (10,31). Compared to lean, OB mouse livershad increased Gclc, Gsta1, Nqo1, and Ho-1 mRNAexpression (Fig. 3b). CR significantly increased Gsta-1,Nqo1, and Sod1 in livers of lean mice. In livers of OBmice, CR decreased Gsta-1 expression, but not Nqo1and Sod1 expression (Fig. 3b). Ho-1 expression wassimilar in livers of lean mice fed AL or placed on CR,whereas CR decreased Ho-1 by about 50% in livers of OBmice. Consistent with the data in Fig. 3b, CR decreasedhepatic glutathione (GSH) by 60% in lean and 30% in OBmice (Fig. 3c).
Table II Effect of CR on Serum Metabolic Hormones
Strain AL/CR Glucagon Insulin Leptin Resistin
LEAN AL 2121.7±484a NA 10486±2376.48a 14355±1679.5a
CR 388.58±57b NA 267.22±56.78b 18178±1672b
OB AL 17834±3240c 43.98±4.67 a ND 20875±1549.5c
CR 6735.8±830d 85.26±24b ND 25365±2645.83d
Adult Lean and OB mice (n=7−10/group) were fed (ad libitum) or put on 40% reduced caloric diet for 9 weeks and average serum glucagon, insulin, leptin,and resistin concentrations (pg/ml) were determined. P<0.05 was considered statistically significant. Groups without a common letter are significantlydifferent. ND, not detectable
2236 Kulkarni, Xu, Donepudi and Slitt
Effect of CR on Oatp Expression in Livers of Leanand OB Mice
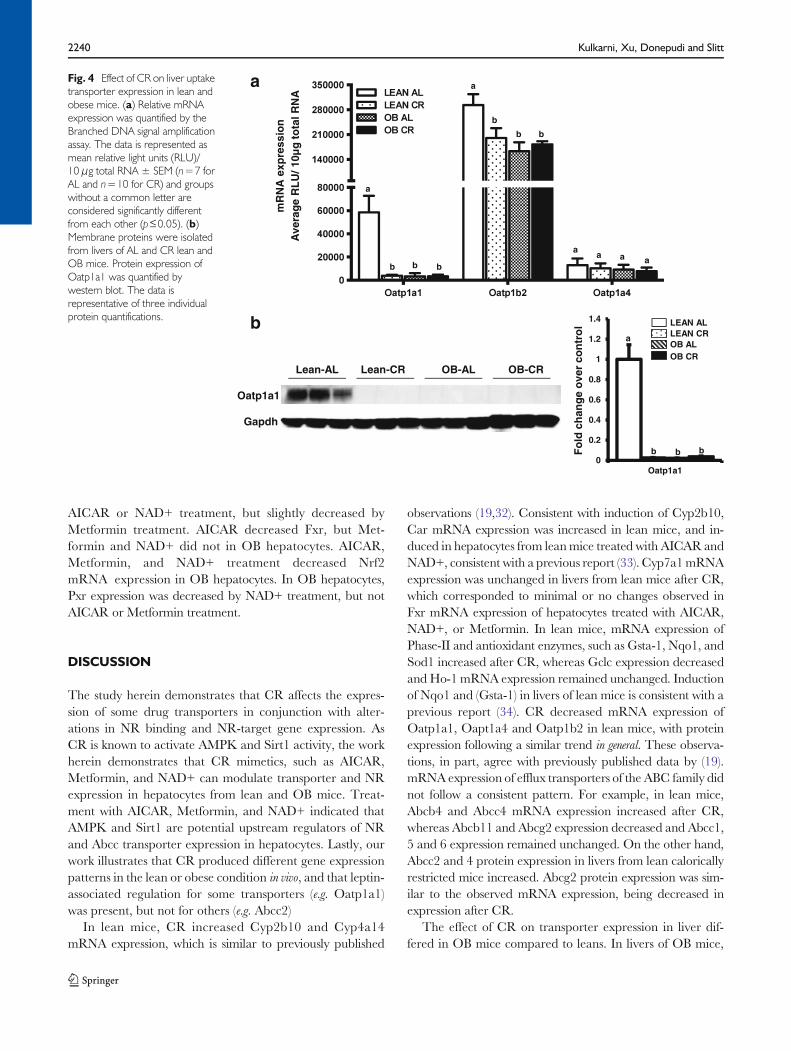
Consistent with previous observations (20) Oatp1a1 and 1b2mRNA expression was lower in livers of OB than leanmice andOatp1a4 expression was similar between the two genotypes(Fig. 4a). CR decreased Oatp1a1 and 1b2 mRNA, but not1a4 mRNA expression in livers of lean mice (Fig. 4a) (19).Oatp1a1 and 1b2 expression remained low in livers OB miceeven after CR, perhaps indicating importance for leptin-associated regulation. Lastly, Oatp1a1 protein expression wasrelatively undetectable in livers from OB mice, consistent withCheng et al., 2008. Oatp1a1 protein expression wasundetectable in livers from lean andOBmice after CR (Fig. 4b).
Effect of CR on Abc Transporter Expression in Liversof Lean and OB Mice
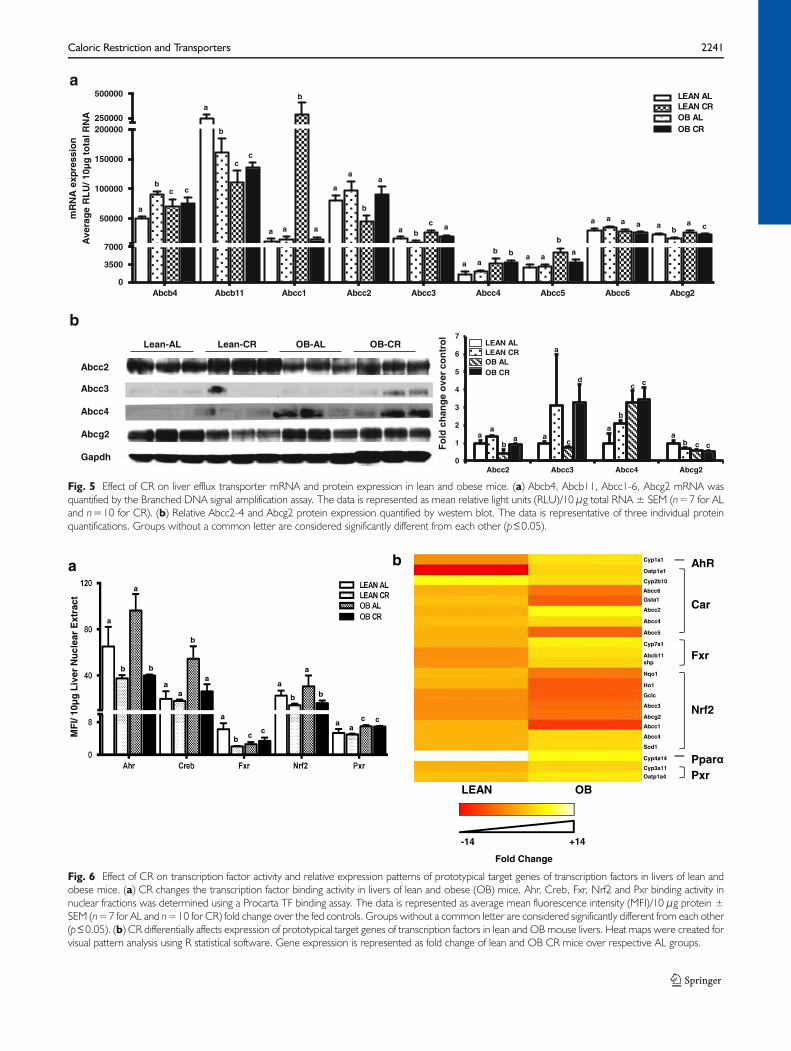
OBmice fed ad libitum had higher liver expression of several Abctransporters (e.g. Abcb4, Abcc1, Abcc3-5) and lower expression
of others (e.g.Abcb11, Abcc2) (Fig. 5a) compared to AL fed leanmice. Abcc4 protein expression increased, whereas Abcc2 and3, Abcg2 protein expression was decreased in livers of OB ALfed mice compared to lean AL fed mice (Fig. 5b).
Figure 5a and b depict CR effects on Abc mRNA andprotein expression in liver. CR induced Abcb4 in livers of leanmice, but not OBmice. CR decreased Abcb11 mRNA expres-sion in lean, but not OB mice. CR did not change Abcc1expression in leans, but decreased it inOBmice. Abcc2mRNAand did not change after CR in lean mice, but increased in OBmice (Fig. 5a & b). CR decreased Abcc3 mRNA expression inlean and OB mice while protein expression increased in LeanCR livers, but this was not observed at the protein level (Fig. 5a& b). CR did not affect Abcc4mRNA expression in lean orOBmice, but did increased protein expression in livers of leanmice. Abcc5 mRNA expression was similar between fed andCR lean mice, but decreased in OB mice after CR. Abcc6expression was similar between all groups. CR decreasedAbcg2 mRNA expression in lean and OB mice, an also Abcg2protein expression in lean mice (Fig. 5b).
LEAN OB
Phase I DMEs
Anti-oxidant response
UptakeTransporters
EffluxTransporters
Transcription Regulators
Cyp1a1Cyp2b10
Cyp3a11
Cyp4a14
Cyp7a1
Cyp7b1Gclc
Gsta1
Ho-1Nqo1
Sod1Oatp1a1
Oatp1a4
Oatp1b2Abcb4
Abcb11Abcc1
Abcc2
Abcc3Abcc4
Abcc5Abcc6
Abcg2
Car
Hnf1αKeap1
Lrh
Nrf1Nrf2
Pgc-1αPparα
Shp
Srebp1c
Fold Change
-14 +14
Fig. 2 Heatmap analysis of biotransformation enzyme and transporter expression patterns in lean and obese mouse livers after CR. Total RNA was isolatedfrom lean and OB mouse livers after CR and Phase I, Phase II biotransformation enzyme, and transporter expression was determined using the the BranchedDNA signal amplification assay. Heat maps represent the spectrum of fold change compared to ad libitum fed mice, spanning from −14 to +14 fold.
Caloric Restriction and Transporters 2237
Transcription Factor Binding Activity in Lean and OBMouse Livers After CR
Transcription factor binding to prototypical consensus se-quences was also determined in nuclear fractions isolated
from liver (Fig. 6a). Creb, and Pxr binding was increased inliver nuclear fractions fromOBmice compared to lean mice,with a trend for increased Ahr binding (p<0.07). In leanmice, CR decreased Ahr, Fxr, and Nrf2 binding, but didnot affect Creb or Pxr binding. In OB mice, CR decreasedAhr, Creb, and Nrf2 binding.
To determine whether prototypical targets of these tran-scription factors were affected similarly by CR, a heat mapwas created to better visualize differences how CR affectstranscriptional pathways in lean and OB mice (Fig. 6b). Forthe most part, prototypical Ahr, Car, Fxr, Pxr, and Nrf2target genes were regulated similarly in lean livers. However,in the OB livers, the CR effect was not consistent among thetranscriptional pathways. For example, CR induced someCar target gene expression, but not others. In contrast, CRpredominantly decreased the expression of most Nrf2 targetgenes.
Effect of AMPK and Sirt1 Activators on Abcc and NRInduction in Hepatocytes Obtained From Lean and OBMice
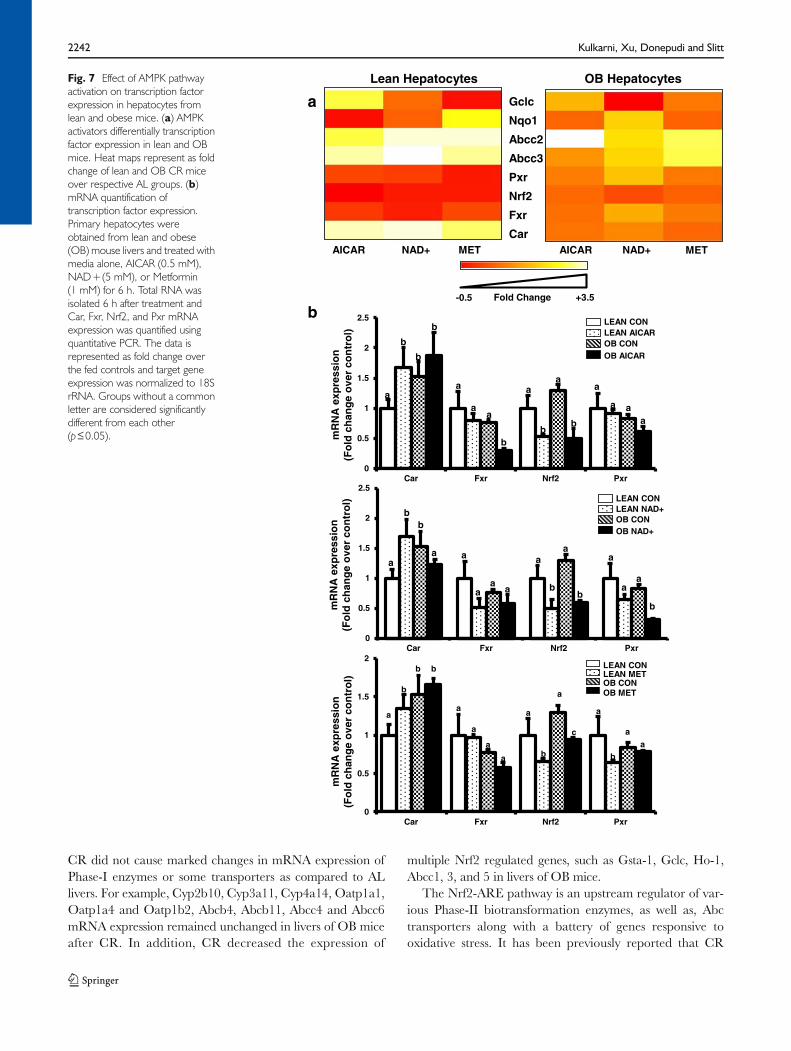
The AMPK pathway is an important CR signal transductionpathway upstream of transcription factor activation. Hence,primary mouse hepatocytes were isolated from 11-week oldlean and OB mice and treated with pharmacological AMPK(AICAR, Metformin) and Sirt1 (NAD+) activators (Fig. 7).Heat maps illustrate the effect of AICAR, NAD+, and Met-formin on transcription factor, Abcc, and Nrf2 target geneexpression. Overall, the treatments downregulated expres-sion of many genes in hepatocytes from lean mice, but less soin hepatocytes from OB mice. Abcc2 and 3 mRNA expres-sion was increased about 3 fold in hepatocytes isolated fromOBmice compared to lean mice (Fig. 7a and SupplementaryFig. 1), which is similar to mRNA expression observed inintact livers from lean and OB mice of the same age (20).Treatment with AMPK activators (AICAR, NAD+) signifi-cantly increased mRNA expression of Abcc2 and Abcc3 inlean mouse hepatocytes (Fig. 7a and Supplementary Fig. 1).As opposed to lean hepatocytes, AICAR and NAD+ treat-ment decreased Abcc2 and 3 mRNA expression in steatotichepatocytes, thus reversing their expression back to normallevels (Supplementary Fig. 1). The effect of AICAR, Metfor-min, and NAD+ treatment on NR expression was alsoevaluated (Fig. 7b). Car mRNA expression was increasedabout 50% above control in hepatocytes isolated from OBmice compared to lean mice (Fig. 7a), which is similar towhat was observed in intact livers from lean and OB mice ofthe same age (10). Fxr, Nrf2, and Pxr expression was equiv-ocal between lean andOBmice, which is different from whatwas observed in intact livers from lean and OB mice of thesame age (10). AICAR, Metformin, NAD+ treatment in-creased CAR, decreased Nrf2, and did not change Fxr
Table III Summary of Gene Expression Changes in Lean and Obese MiceFollowing Caloric Restriction
Transcript Lean CR OB CR
Transcription factors and metabolic regulators
Car 1.15 1.15
Hnf1alpha −1.12 1.09
Keap1 1.08 1.00
Lrh −1.06 −1.31
Nrf1 1.17 1.83
Nrf2 −2.22 1.03
Pepck 3.32 1.85
Pgc-1 alpha 2.03 −1.18
Ppar alpha 1.11 1.58
Shp −1.06 1.03
Srebp1c −1.83 −1.07
Phase-I biotransformation enzymes
Cyp1a1 −1.5 1.31
Cyp2b10 6.97 1.23
Cyp3a11 1.12 1.00
Cyp4a14 13.77 1.78
Cyp7b1 −6.27 −1.75
Cyp7a1 1.05 1.56
Antioxidant enzymes
Gclc −1.41 −1.64
Gsta1 2.09 −1.65
Ho1 1.03 −1.75
Nqo1 1.51 −1.01
Sod1 1.44 1.12
Uptake Transporters
Oatp1a1 −14.91 1.02
Oatp1a4 2.26 1.43
Oatp1b2 −1.46 1.11
Efflux transporters (ABC family)
Abcb4 1.79 1.08
Abcb11 −1.54 1.22
Abcc1 1.28 −2.48
Abcc2 1.19 1.98
Abcc3 −1.59 −1.31
Abcc4 1.29 1.07
Abcc5 1.11 −1.51
Abcc6 1.16 −1.08
Abcg2 −1.45 −1.14
The following table represents fold changes (increase or decrease) inexpression of various drug metabolizing and transporter genes in livers oflean and OB mice upon 40% CR. The data is represented as fold change ingene expression over the respective ad libitum fed controls
2238 Kulkarni, Xu, Donepudi and Slitt
expression in lean hepatocytes. In lean hepatocytes, Pxrexpression slightly decreased with Metformin treatment,
and did not change with AICAR or NAD+ treatment.In OB hepatocytes, Car expression was not affected by
Cyp2b10 Cyp3a11 Cyp4a14 Cyp7a1 cyp7b10
10000
20000
30000
40000
50000
60000
500000
1000000LEAN ALLEAN CROB AL
OB CR
Gclc Gsta-1 Ho1 Nqo1 Sod10
7000
14000
21000
28000
35000
200000
400000 LEAN ALLEAN CROB ALOB CR
a a
bb
a
b bb
aa
b
a
a
b
c
c
a
b
c d
a a
b
a
a bc c
ab
c
a
ab
c
d
a
ba a
mR
NA
exp
ress
ion
Ave
rag
e R
LU
/ 10µ
g t
ota
l RN
Am
RN
A e
xpre
ssio
nA
vera
ge
RL
U/ 1
0µg
to
tal R
NA
0.0
0.2
0.4
0.6
0.8 LEAN ALLEAN CROB ALOB CRa
b
a
c
uM
ole
sG
SH
/mg
tis
sue
wei
gh
t
Glutathione levels
a
b
c
Fig. 3 Effect of CR on expression of Phase-I and-II biotransformation enzymes and antioxidant genes in lean and obese mouse livers. mRNA expression wasquantified by the Branched DNA signal amplification assay. (a) Expression of Phase-I biotransformation enzymes in lean and OB mouse livers after CR. (b)Changes in expression of Phase-II biotransformation antioxidant enzymes in lean and OB mouse livers after CR. The data is represented as average ± SEM(n=7 for AL and n=10 for CR). Means with the same letter are not significantly different from each other (P<0.05). (c) Effect of CR on hepatic glutathione(GSH) levels in lean and OB mice. The data is represented as average ± SEM moles GSH/mg tissue (n=7 for AL and n=10 for CR). Groups without acommon letter are considered significantly different from each other (p≤0.05).
Caloric Restriction and Transporters 2239
AICAR or NAD+ treatment, but slightly decreased byMetformin treatment. AICAR decreased Fxr, but Met-formin and NAD+ did not in OB hepatocytes. AICAR,Metformin, and NAD+ treatment decreased Nrf2mRNA expression in OB hepatocytes. In OB hepatocytes,Pxr expression was decreased by NAD+ treatment, but notAICAR or Metformin treatment.
DISCUSSION
The study herein demonstrates that CR affects the expres-sion of some drug transporters in conjunction with alter-ations in NR binding and NR-target gene expression. AsCR is known to activate AMPK and Sirt1 activity, the workherein demonstrates that CR mimetics, such as AICAR,Metformin, and NAD+ can modulate transporter and NRexpression in hepatocytes from lean and OB mice. Treat-ment with AICAR, Metformin, and NAD+ indicated thatAMPK and Sirt1 are potential upstream regulators of NRand Abcc transporter expression in hepatocytes. Lastly, ourwork illustrates that CR produced different gene expressionpatterns in the lean or obese condition in vivo, and that leptin-associated regulation for some transporters (e.g. Oatp1a1)was present, but not for others (e.g. Abcc2)
In lean mice, CR increased Cyp2b10 and Cyp4a14mRNA expression, which is similar to previously published
observations (19,32). Consistent with induction of Cyp2b10,Car mRNA expression was increased in lean mice, and in-duced in hepatocytes from leanmice treated with AICAR andNAD+, consistent with a previous report (33). Cyp7a1mRNAexpression was unchanged in livers from lean mice after CR,which corresponded to minimal or no changes observed inFxr mRNA expression of hepatocytes treated with AICAR,NAD+, or Metformin. In lean mice, mRNA expression ofPhase-II and antioxidant enzymes, such as Gsta-1, Nqo1, andSod1 increased after CR, whereas Gclc expression decreasedand Ho-1 mRNA expression remained unchanged. Inductionof Nqo1 and (Gsta-1) in livers of lean mice is consistent with aprevious report (34). CR decreased mRNA expression ofOatp1a1, Oapt1a4 and Oatp1b2 in lean mice, with proteinexpression following a similar trend in general. These observa-tions, in part, agree with previously published data by (19).mRNA expression of efflux transporters of the ABC family didnot follow a consistent pattern. For example, in lean mice,Abcb4 and Abcc4 mRNA expression increased after CR,whereas Abcb11 and Abcg2 expression decreased and Abcc1,5 and 6 expression remained unchanged. On the other hand,Abcc2 and 4 protein expression in livers from lean caloricallyrestricted mice increased. Abcg2 protein expression was sim-ilar to the observed mRNA expression, being decreased inexpression after CR.
The effect of CR on transporter expression in liver dif-fered in OB mice compared to leans. In livers of OB mice,
Oatp1a1
Lean-AL Lean-CR OB-AL OB-CR
Gapdh
a
b
a
b b b
a
b
b b
aa a a
mR
NA
exp
ress
ion
Ave
rag
e R
LU
/ 10
g t
ota
l RN
A
0
0.2
0.4
0.6
0.8
1
1.2
1.4
Oatp1a1
OB ALOB CR
LEAN ALLEAN CRa
b b bFo
ld c
han
ge
ove
r co
ntr
ol
Fig. 4 Effect of CR on liver uptaketransporter expression in lean andobese mice. (a) Relative mRNAexpression was quantified by theBranched DNA signal amplificationassay. The data is represented asmean relative light units (RLU)/10 μg total RNA ± SEM (n=7 forAL and n=10 for CR) and groupswithout a common letter areconsidered significantly differentfrom each other (p≤0.05). (b)Membrane proteins were isolatedfrom livers of AL and CR lean andOB mice. Protein expression ofOatp1a1 was quantified bywestern blot. The data isrepresentative of three individualprotein quantifications.
2240 Kulkarni, Xu, Donepudi and Slitt
Lean-AL Lean-CR OB-AL OB-CR
Abcc2
Abcg2
Abcc3
Abcc4
Gapdh
b
0
1
2
3
4
5
6
7
Abcc2 Abcc3 Abcc4 Abcg2
aa
ba a
a
c
d
a
b
c c
ab c c
OB ALOB CR
LEAN ALLEAN CR
Fo
ld c
han
ge
ove
r co
ntr
ol
Abcb4 Abcb11 Abcc1 Abcc2 Abcc3 Abcc4 Abcc5 Abcc6 Abcg20
3500
7000
50000
100000
150000
200000250000
500000 LEAN ALLEAN CROB ALOB CR
a a
b
a
a
a
b
a
a bc a
a a
b b a a
b
a
a a a a
a
bc c
a
cc
ab
a c
mR
NA
exp
ress
ion
Ave
rag
e R
LU
/ 10µ
g t
ota
l RN
Aa
b
Fig. 5 Effect of CR on liver efflux transporter mRNA and protein expression in lean and obese mice. (a) Abcb4, Abcb11, Abcc1-6, Abcg2 mRNA wasquantified by the Branched DNA signal amplification assay. The data is represented as mean relative light units (RLU)/10 μg total RNA ± SEM (n=7 for ALand n=10 for CR). (b) Relative Abcc2-4 and Abcg2 protein expression quantified by western blot. The data is representative of three individual proteinquantifications. Groups without a common letter are considered significantly different from each other (p≤0.05).
a
a
b
a
b
a
b
a
b
aa
b
a
aa
c ca
b ccM
FI/
10µ
g L
iver
Nu
clea
r E
xtra
ct
b
LEAN OB
AhR
Car
Fxr
Ppar
Nrf2
Pxr
Cyp1a1
Oatp1a1
Cyp2b10
Abcc6
Gsta1
Abcc2
Abcc4
Abcc5
Cyp7a1
Abcb11shp
Nqo1
Ho1
Gclc
Abcc3
Abcg2
Abcc1
Abcc4
Sod1
Cyp4a14
Cyp3a11Oatp1a4
Fold Change
-14 +14
Fig. 6 Effect of CR on transcription factor activity and relative expression patterns of prototypical target genes of transcription factors in livers of lean andobese mice. (a) CR changes the transcription factor binding activity in livers of lean and obese (OB) mice. Ahr, Creb, Fxr, Nrf2 and Pxr binding activity innuclear fractions was determined using a Procarta TF binding assay. The data is represented as average mean fluorescence intensity (MFI)/10 μg protein ±SEM (n=7 for AL and n=10 for CR) fold change over the fed controls. Groups without a common letter are considered significantly different from each other(p≤0.05). (b) CR differentially affects expression of prototypical target genes of transcription factors in lean and OB mouse livers. Heat maps were created forvisual pattern analysis using R statistical software. Gene expression is represented as fold change of lean and OB CR mice over respective AL groups.
Caloric Restriction and Transporters 2241
CR did not cause marked changes in mRNA expression ofPhase-I enzymes or some transporters as compared to ALlivers. For example, Cyp2b10, Cyp3a11, Cyp4a14, Oatp1a1,Oatp1a4 and Oatp1b2, Abcb4, Abcb11, Abcc4 and Abcc6mRNA expression remained unchanged in livers of OB miceafter CR. In addition, CR decreased the expression of
multiple Nrf2 regulated genes, such as Gsta-1, Gclc, Ho-1,Abcc1, 3, and 5 in livers of OB mice.
The Nrf2-ARE pathway is an upstream regulator of var-ious Phase-II biotransformation enzymes, as well as, Abctransporters along with a battery of genes responsive tooxidative stress. It has been previously reported that CR
Gclc
Nqo1
Abcc2
Abcc3
Pxr
Nrf2
Fxr
CarAICAR AICARNAD+ NAD+ METMET
Lean Hepatocytes OB Hepatocytes
a
mR
NA
exp
ress
ion
(Fo
ld c
han
ge
ove
r co
ntr
ol)
0
0.5
1
1.5
2
2.5
Car Fxr Nrf2 Pxr
b
a
b
b
b
a
aa
a
a aa
a
b
a
b
OB CONOB AICAR
LEAN CONLEAN AICAR
b
0
0.5
1
1.5
2
2.5
Car Fxr Nrf2 Pxr
a
bb
a a
aa
a
a
aa
b
a
b
a
b
OB CONOB NAD+
LEAN CONLEAN NAD+
mR
NA
exp
ress
ion
(Fo
ld c
han
ge
ove
r co
ntr
ol)
0
0.5
1
1.5
2
Car Fxr Nrf2 Pxr
a
b
b b
a
a
a
a
a
b
a
a
a
b
a
c
OB CONOB MET
LEAN CONLEAN MET
mR
NA
exp
ress
ion
(Fo
ld c
han
ge
ove
r co
ntr
ol)
Fold Change-0.5 +3.5
Fig. 7 Effect of AMPK pathwayactivation on transcription factorexpression in hepatocytes fromlean and obese mice. (a) AMPKactivators differentially transcriptionfactor expression in lean and OBmice. Heat maps represent as foldchange of lean and OB CR miceover respective AL groups. (b)mRNA quantification oftranscription factor expression.Primary hepatocytes wereobtained from lean and obese(OB) mouse livers and treated withmedia alone, AICAR (0.5 mM),NAD+(5 mM), or Metformin(1 mM) for 6 h. Total RNA wasisolated 6 h after treatment andCar, Fxr, Nrf2, and Pxr mRNAexpression was quantified usingquantitative PCR. The data isrepresented as fold change overthe fed controls and target geneexpression was normalized to 18SrRNA. Groups without a commonletter are considered significantlydifferent from each other(p≤0.05).
2242 Kulkarni, Xu, Donepudi and Slitt
restriction induces Nqo1 expression via an Nrf2 dependentmechanism (34). The present study had similar observationsin lean mice that underwent CR, which were consistent withthe latter study – induction of Nqo1 in liver. However, thepresent observations point to decreased Nrf2 target geneexpression and Nrf2 binding in livers of OB mice after CR.First, Ob/ob mice exhibit increased Nrf2 gene expressionand markers of oxidative stress, which can be decreased bytreatment with antioxidant compounds (20,35). CR de-creases markers of lipid oxidation in obese mice (36) There-fore, a likely reason in our study is that CR decreased fatcontent and inflammation-induced oxidative stress, which inturn, decreased Nrf2 activation. Second, AMPK and Sirt1can potentially modulate Nrf2 binding activity. For example,Sirt1 has been described to decrease Nrf2 binding and anti-oxidant response element activation (37), whereas P300 ac-tivators increase Nrf2 target gene activation (38). This couldbe through acetylation sites present on the Nrf2 protein (38).So, perhaps, CR induced Sirtuin activity, which resulted indecreased Nrf2 acetylation along with Nrf2 binding to var-ious antioxidant response elements. The effect of CR onAbcc3, Abcg2, Gclc was similar between OB and lean mouselivers, despite lack of Pgc-1α induction in OB mice. Third,decreased recruitment of Pgc-1α to the Nrf2 transcriptionalcomplex could result in decreased Nrf2 binding. Additional-ly, recruitment of different cofactors within the transcription-al complex of Nrf2 at the promoters of target transporterssuch as GCN5 (39), p300/cbp (38) in the OB livers, couldaffect activation of Pgc-1α and thus the target gene transcrip-tion. Last, as significant cross-talk between the AhR and Nrf2transcriptional pathways has been decribed (40), it should beconsidered whether decreased AhR binding could result indecreased Nrf2 target gene expression or vice versa. As in-creased AhR activity has been implicated in steatosis (41),thus the effect of CR mimetics on AhR activity should beconsidered.
Activation of metabolic pathways during CR is mediatedphysiologically by hormones, such as glucagon, insulin, andleptin. CR is known to increase serum glucagon, decreaseinsulin, as well as, reverse increased leptin levels present inobesity (42). These conditions of low glucose, increased py-ruvate, NAD+/NADH ratio, and glucagon levels duringCR lead to activation of Sirt1/Pgc-1α cascade which in turnactivates the expression of fatty acid oxidation regulatorssuch as Pparα along with gluconeogenic genes such as Pepck(43,44). The AMPK pathway is regarded as one of the majorsecondary pathways delegating intracellular signals of CR,inhibiting gluconeogenic pathway activity and increasingfatty acid oxidation, as well, as glucose uptake into cells.Sirt1/Pgc-1α cascade and AMPK pathway can regulateactivation of one another by phosphorylation and acetyla-tion dependent mechanisms as shown by (45–47). Pparα andγ regulate pathways responsible for fatty acid oxidation and
synthesis respectively (48,49). PPARα is activated in modelsof CR via activation by Pgc-1 α via Protein Kinase A andAMPK secondary messenger pathways (43). In the studyherein, CR likely activated Pparα, as observed by increasedmRNA expression of Pparα target gene Cyp4a14 in leanmouse liver along with an important coactivator Pgc-1α(18,32). With leptin signaling being non-functional in OBmice, the signal transduction is hampered and henceCyp4a14 and Pgc-1α (Figs. 1c and 3a) were induced in OBlivers, as previously described (50). Consistent with theseobservations, CR increased Abcc4 protein expression inlivers of wild type mice, which could suggest Pparα as anupstream regulator of Abcc4 expression during CR. Previ-ous studies have described Pparα mediated induction ofAbcc4 protein expression in mouse liver (51). As endogenousmetabolites, such as cAMP and cGMP, are substrates Abcc4(52), the increased Abcc4 protein expression could be inresponse to increased liver concentrations of these substratesduring CR (53). In OB mice, CR does not increase Cyp4a14levels, which is likely due to lack of a functional leptin axis.The leptin axis is needed for proper liver responses to nutri-ent deprivation, as previously described (50). Lack of Abcc4induction in OB mice after CR is consistent with lack ofCyp4a14 and Pgc1a induction, suggesting that a functionalleptin axis is needed for Abcc4 induction. Biotransformationenzymes and transporters are regulated by various nuclearreceptors and transcription factors such as Ahr, Car, Fxr,Pxr, and (29). Apart from metabolic pathways, activation ofPgc-1α during CR is likely a critical factor in also regulatingexpression biotransformation enzymes. Pgc-1α is a knownco-activator of Car, Fxr, Hnf4α, Pxr pathways (32). In leanmice, CR induced mRNA expression of Car, Cyp2b10. Caris known to activate Abcc2 by certain xenobiotic compounds(21). As observed in Fig. 5a, Abcc2 expression follows apattern similar to Car and Cyp2b10 (Fig. 3).
The heatmap analyses illustrate that the CR elicits adifferent gene expression pattern in livers of lean and OBmice. As leptin deficient OB mice, were used to modelobesity and steatosis, the differential expression could bedue to the influence of leptin on the overall regulation ofNR activity, expression, and regulation of the downstreamtargets. The data suggest an importance of the leptin axis inregulating downstream effects of CR on expression of tran-scription factors and drug processing genes. Serum levels ofleptin are known to correlate with the severity of steatosis(54,55). Hepatic and central leptin resistance is known tocause insulin resistance and obesity (56). CR and exercisebeing AASLD recommended regimen to reverse NAFLD, theobservations with leptin deficient models demonstrates a po-tential difference in the steatotic human population responseto drug biotransformation enzyme and transporter changesafter CR. Liver fat content markedly decreased in the steatoticliver after CR, but the biotransformational pathways are not
Caloric Restriction and Transporters 2243
completely reversed in these models, suggesting that a func-tional leptin axis is needed for reversal to occur. This couldpotentially explain why differences in effects on gene expres-sion were observed between in vivo experiments compared tohepatocytes treated with AMPK activators.
Mimicking CR in vitro is deemed difficult to mimic due tothe complex nature of signaling pathways involved in theeffect. Studies have demonstrated that sera obtained fromanimals undergoing CR, mimic CR induced resistance tooxidative stress in hepatocytes (57). AMPK activators havebeen used to mimic AMPK activation and AMPK dependentSirt1 activation during CR and their convergent beneficialdownstream effects (44). Differences in NR and transporterexpression were not entirely consistent between CR data fromthe in vivo study and in hepatocytes treated with caloric restric-tion mimetic compounds. When comparing both sets of ex-periments, CR induced Cyp2B10 and Car in livers of leanmice with virtually no expression change observed in livers ofOB mice, which was consistent with increased Car expressionin the hepatocytes treated with AMPK activators. However,in general, CR did not markedly affect the expression of manybiotransformation, antioxidant enzyme or transporter genesin lean mice (e.g. expression change was less than 1 fold),whereas treatment of hepatocytes with AMPK or Sirt1
activators resulted in some decreased expression of Fxr, Nrf2and Pxr expression. A potential reason for this observationcould be the presence of high levels of glucose in the mediadiminishing the responsiveness of the hepatocytes to AMPKactivation. In vivo, multiple hormone and signaling pathwayselicited by CR converge to have an effect, and many have tobe considered, whereas in vitro, additional of a single chemicalactivator may better reflect a potential regulation by AMPKor Sirt1. Overall, it is appreciated that modeling the CR effectin hepatocytes from lean and obese mice is complex.
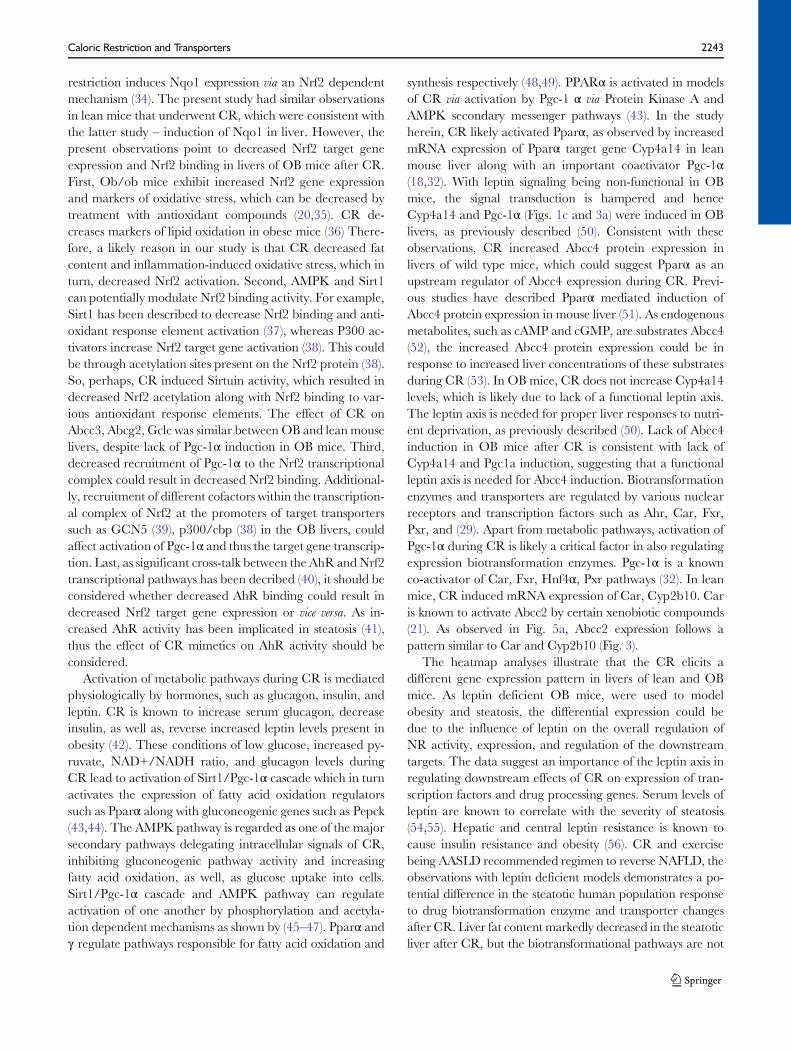
Figure 8 depicts the observed changes in binding, geneexpression and the potentialmechanism bywhich the regulationmight be occur in livers of lean and obese mice after CR in vivo.First, CR is known to increase AMP/ATP ratios, resulting inincreased AMPK activity. In lean mice, CR decreased Ahr, Fxrand Nrf2 binding activity to known consensus sequences, withno observed change in Pxr binding activity, and increased Carpathway activity. It has been previously reported that althoughaltered, the AMPK-Sirt1 pathway is functional in OBmice andcan be targeted for therapeutic interventions (58,59). However,CR induces Pgc-1α expression in livers of lean mice, but not inOB mice. Fasting mediated Pgc-1α induction has been de-scribed to be dependent upon the leptin receptor (60). In OBmice, decreased Nrf2 and Ahr activity with no marked change
Fig. 8 CR-mediated biotransformation enzyme and transporter expression differs in liver differs for lean and obese mice. The observed effects of caloricrestriction (CR) on liver gene expression differed between lean and obese (OB) mice. The figure depicts potential regulation based on nuclear receptorbinding and mRNA expression data from the in vivo study. CR is described to activate the AMPK pathway and induce Sirtuin 1 (Sirt1) activation. CR inducedPgc-1α mRNA expression in livers of lean mice, consistent with previous reports, but did not do so in OB mice. Based on previous reports, Pgc-1 and Sirt1are known to regulate some NRs at the level of mRNA expression and binding to responsive elements. In general, receptor binding and downstream geneexpression differed in the lean and OB mice after CR, suggesting that perhaps Sirt1, leptin, and perhaps Pgc-1α, are upstream modulators of biotransfor-mation and excretion processes.
2244 Kulkarni, Xu, Donepudi and Slitt
in Car, Pxr, or Fxr activity. CR decreased Nrf2 binding activityin livers OB mice, which was associated with decreased Ho-1,Gclc, Abcb11, Abcc1, Abcc3, Abcg2.
Understanding how these results translate to differentialhuman exposure to medications or chemicals through occu-pation or environmental is challenging because few studiesaddress weight loss and chemical clearance. There are limitedstudies, some of which evaluate nutritional status and hepaticclearance, but some exist that use dyes to measure hepaticclearance. For example, indocyanine green (ICG) is a dye andorganic anion used to evaluate hepatic clearance, and mostlikely a substrate for OATPs (61) and ABCC2 because itundergoes biliary excretion via Mrp2-mediated transport(62,63). ICG hepatic clearance was decreased in swine thatwere fasted to have weight loss for 20% of their body weight(64). Our results also indicated that CR increased MRP2expression, which is also consistent with observations thatICG clearance is increased humans and rats after fasting (65).
All the above observations indicate that activation of CRpathways can only partly reverse the changes in drug bio-transformation enzyme and transporter expression that oc-curs with obesity induced by leptin deficiency. Overall, lep-tin, AMPK, and Sirt1 can modulate biotransformation en-zyme and transporter expression.
ACKNOWLEDGMENTS
This work was presented, in part, at the annual Society ofToxicology (SOT) meeting, March 7-11, 2010, Salt LakeCity, Utah
This work was supported by grants to from the NationalInstitute of Health [4R01ES016042 and 5K22ES013782 toALS], and also supported, in part, by Rhode Island IDeANetwork of Biomedical Research Excellence [Award #P20RR016457] from the National Center for Research Re-sources, National Institute of Health.
REFERENCES
1. Edmisonand J, McCullough AJ. Pathogenesis of non-alcoholicsteatohepatitis: human data. Clin Liver Dis. 2007;11:75–104. ix.
2. McCullough AJ. Pathophysiology of nonalcoholic steatohepatitis. JClin Gastroenterol. 2006;40 Suppl 1:S17–29.
3. Wang Y, Beydoun MA, Liang L, Caballero B, Kumanyika SK.Will all Americans become overweight or obese? estimating theprogression and cost of the US obesity epidemic. Obesity (SilverSpring). 2008;16:2323–30.
4. Browning JD, Szczepaniak LS, Dobbins R, Nuremberg P, HortonJD, Cohen JC, et al. Prevalence of hepatic steatosis in an urban popu-lation in the United States: impact of ethnicity. Hepatology(Baltimore,Md). 2004;40:1387–95.
5. Abernethyand DR, Greenblatt DJ. Drug disposition in obesehumans. An update. Clin Pharmacokinet. 1986;11:199–213.
6. Barshop NJ, Capparelli EV, Sirlin CB, Schwimmer JB, Lavine JE.Acetaminophen pharmacokinetics in children with nonalcoholicfatty liver disease. J Pediatr Gastroenterol Nutr. 2011;52:198–202.
7. Schrieber SJ, Hawke RL, Wen Z, Smith PC, Reddy KR, WahedAS, et al. Differences in the disposition of silymarin between patientswith nonalcoholic fatty liver disease and chronic hepatitis C. DrugMetab Dispos. 2011;39:2182–90.
8. More VR, Wen X, Thomas PE, Aleksunes LM, Slitt AL. Severediabetes and leptin resistance cause differential hepatic and renaltransporter expression in mice. Comp Hepatol. 2012;11:1.
9. Fisher CD, Lickteig AJ, Augustine LM, Ranger-Moore J, JacksonJP, Ferguson SS, et al. Hepatic cytochrome P450 enzyme alterationsin humans with progressive stages of nonalcoholic fatty liver dis-ease. Drug Metab Dispos. 2009;37:2087–94.
10. Xu J, Kulkarni SR, Li L, Slitt AL. UDP-glucuronosyltransferaseexpression in mouse liver is increased in obesity- and fasting-inducedsteatosis. Drug Metab Dispos: Biol Fate Chem. 2012;40:259–66.
11. Chalasani N, Younossi Z, Lavine JE, Diehl AM, Brunt EM, Cusi K,et al. The diagnosis and management of non-alcoholic fatty liverdisease: practice guideline by the American GastroenterologicalAssociation, American Association for the Study of Liver Diseases,and American College of Gastroenterology. Gastroenterology.2012;142:1592–609.
12. Larson-Meyer DE, Newcomer BR, Heilbronn LK, Volaufova J,Smith SR, Alfonso AJ, et al. Effect of 6-month calorie restriction andexercise on serum and liver lipids and markers of liver function.Obesity (Silver Spring). 2008;16:1355–62.
13. Kistler KD, Brunt EM, Clark JM, Diehl AM, Sallis JF, SchwimmerJB. Physical activity recommendations, exercise intensity, andhistological severity of nonalcoholic fatty liver disease. Am JGastroenterol. 2011;106:460–8. quiz 469.
14. Chaudharyand N, Pfluger PT. Metabolic benefits from Sirt1 andSirt1 activators. Curr Opin Clin Nutr Metab Care. 2009;12:431–7.
15. Fulcoand M, Sartorelli V. Comparing and contrasting the rolesof AMPK and SIRT1 in metabolic tissues. Cell Cycle. 2008;7:3669–79.
16. Ha SK, Kim J, Chae C. Role of AMP-activated protein kinase andadiponectin during development of hepatic steatosis in high-fatdiet-induced obesity in rats. J Comp Pathol. 2011;145:88–94.
17. Corton JC, Apte U, Anderson SP, Limaye P, Yoon L, LatendresseJ, et al. Mimetics of caloric restriction include agonists of lipid-activated nuclear receptors. J Biol Chem. 2004;279:46204–12.
18. Maglich JM, Watson J, McMillen PJ, Goodwin B, Willson TM,Moore JT. The nuclear receptor CAR is a regulator of thyroidhormone metabolism during caloric restriction. J Biol Chem.2004;279:19832–8.
19. Zhang YK, Saupe KW, Klaassen CD. Energy restriction does notcompensate for the reduced expression of hepatic drug-processinggenes in mice with aging. Drug Metab Dispos. 2010;38:1122–31.
20. Cheng Q, Aleksunes LM, Manautou JE, Cherrington NJ, SchefferGL, Yamasaki H, et al. Drug-metabolizing enzyme and transporterexpression in a mouse model of diabetes and obesity. Mol Pharm.2008;5:77–91.
21. Aleksunesand LM, Klaassen CD. Coordinated regulation of hepat-ic phase I and II drug-metabolizing genes and transporters usingAhR-, CAR-, PXR-, PPARalpha-, and Nrf2-null mice. DrugMetab Dispos. 2012;40:1366–79.
22. Maher JM, Dieter MZ, Aleksunes LM, Slitt AL, Guo G, Tanaka Y,et al. Oxidative and electrophilic stress induces multidrug resistance-associated protein transporters via the nuclear factor-E2-relatedfactor-2 transcriptional pathway. Hepatology. 2007;46:1597–610.
23. Maher JM, Cheng X, Slitt AL, Dieter MZ, Klaassen CD. Inductionof the multidrug resistance-associated protein family of transporters
Caloric Restriction and Transporters 2245
by chemical activators of receptor-mediated pathways in mouseliver. Drug Metab Dispos: Biol Fate Chem. 2005;33:956–62.
24. Aleksunes LM, Scheffer GL, Jakowski AB, Pruimboom-Brees IM,Manautou JE. Coordinated expression of multidrug resistance-associated proteins (Mrps) in mouse liver during toxicant-inducedinjury. Toxicol Sci. 2006;89:370–9.
25. Moreand VR, Slitt AL. Alteration of hepatic but not renal trans-porter expression in diet-induced obese mice. Drug Metab Dispos.2011;39:992–9.
26. Sloan C, Tuinei J, Nemetz K, Frandsen J, Soto J, Wride N, et al.Central leptin signaling is required to normalize myocardial fattyacid oxidation rates in caloric-restricted ob/ob mice. Diabetes.2011;60:1424–34.
27. Bordoneand L, Guarente L. Calorie restriction, SIRT1 and me-tabolism: understanding longevity. Nat Rev Mol Cell Biol.2005;6:298–305.
28. Waxman DJ. P450 gene induction by structurally diversexenochemicals: central role of nuclear receptors CAR, PXR, andPPAR. Arch Biochem Biophys. 1999;369:11–23.
29. Xu C, Li CY, Kong AN. Induction of phase I, II and III drugmetabolism/transport by xenobiotics. Arch Pharm Res.2005;28:249–68.
30. Itoh K, Tong KI, Yamamoto M. Molecular mechanism activatingNrf2-Keap1 pathway in regulation of adaptive response to electro-philes. Free Radic Biol Med. 2004;36:1208–13.
31. Hardwick RN, Fisher CD, Canet MJ, Lake AD, Cherrington NJ.Diversity in antioxidant response enzymes in progressive stages ofhuman nonalcoholic fatty liver disease. Drug Metab Dispos.2010;38:2293–301.
32. Cortonand JC, Brown-Borg HM. Peroxisome proliferator-activated receptor gamma coactivator 1 in caloric restriction andother models of longevity. J Gerontol A Biol Sci Med Sci.2005;60:1494–509.
33. Rencurel F, Foretz M, Kaufmann MR, Stroka D, Looser R,Leclerc I, et al. Stimulation of AMP-activated protein kinase isessential for the induction of drug metabolizing enzymes byphenobarbital in human and mouse liver. Mol Pharmacol.2006;70:1925–34.
34. Pearson KJ, Lewis KN, Price NL, Chang JW, Perez E, Cascajo MV,et al. Nrf2 mediates cancer protection but not prolongevity inducedby caloric restriction. Proc Natl Acad Sci U S A. 2008;105:2325–30.
35. Park HJ, DiNatale DA, Chung MY, Park YK, Lee JY, Koo SI, et al.Green tea extract attenuates hepatic steatosis by decreasing adiposelipogenesis and enhancing hepatic antioxidant defenses in ob/obmice. J Nutr Biochem. 2011;22:393–400.
36. Park S, Park NY, Valacchi G, Lim Y. Calorie restriction with ahigh-fat diet effectively attenuated inflammatory response and ox-idative stress-related markers in obese tissues of the high diet fedrats. Mediat Inflamm. 2012;2012:984643.
37. Kawai Y, Garduno L, Theodore M, Yang J, Arinze IJ. Acetylation-deacetylation of the transcription factor Nrf2 (nuclear factor ery-throid 2-related factor 2) regulates its transcriptional activity andnucleocytoplasmic localization. J Biol Chem. 2011;286:7629–40.
38. Sun Z, Chin YE, Zhang DD. Acetylation of Nrf2 by p300/CBPaugments promoter-specific DNA binding of Nrf2 during the anti-oxidant response. Mol Cell Biol. 2009;29:2658–72.
39. Lerin C, Rodgers JT, Kalume DE, Kim SH, Pandey A, Puigserver P.GCN5 acetyltransferase complex controls glucose metabolism throughtranscriptional repression of PGC-1alpha. CellMetab. 2006;3:429–38.
40. Shin S, Wakabayashi N, Misra V, Biswal S, Lee GH, Agoston ES,et al. NRF2 modulates aryl hydrocarbon receptor signaling: influ-ence on adipogenesis. Mol Cell Biol. 2007;27:7188–97.
41. Lee JH, Wada T, Febbraio M, He J, Matsubara T, Lee MJ, et al. Anovel role for the dioxin receptor in fatty acid metabolism andhepatic steatosis. Gastroenterology. 2010;139:653–63.
42. Takemori K, Kimura T, Shirasaka N, Inoue T, Masuno K, Ito H.Food restriction improves glucose and lipid metabolism throughSirt1 expression: a study using a new rat model with obesity andsevere hypertension. Life Sci. 2011;88:1088–94.
43. Rodgers JT, Lerin C, Gerhart-Hines Z, Puigserver P. Metabolicadaptations through the PGC-1 alpha and SIRT1 pathways. FEBSLett. 2008;582:46–53.
44. Cantoand C, Auwerx J. PGC-1alpha, SIRT1 and AMPK, anenergy sensing network that controls energy expenditure. CurrOpin Lipidol. 2009;20:98–105.
45. Hou X, Xu S, Maitland-Toolan KA, Sato K, Jiang B, Ido Y, et al.SIRT1 regulates hepatocyte lipid metabolism through activatingAMP-activated protein kinase. J Biol Chem. 2008;283:20015–26.
46. Lan F, Cacicedo JM, Ruderman N, Ido Y. SIRT1 modulation ofthe acetylation status, cytosolic localization, and activity of LKB1.Possible role in AMP-activated protein kinase activation. J BiolChem. 2008;283:27628–35.
47. Canto C, Gerhart-Hines Z, Feige JN, Lagouge M, Noriega L,Milne JC, et al. AMPK regulates energy expenditure by modulatingNAD+ metabolism and SIRT1 activity. Nature. 2009;458:1056–60.
48. Tontonozand P, Spiegelman BM. Fat and beyond: the diversebiology of PPARgamma. Annu Rev Biochem. 2008;77:289–312.
49. Pyper SR, Viswakarma N, Yu S, Reddy JK. PPARalpha: energycombustion, hypolipidemia, inflammation and cancer. NuclRecept Signal. 2010;8:e002.
50. Yoon JC, Puigserver P, Chen G, Donovan J, Wu Z, Rhee J, et al.Control of hepatic gluconeogenesis through the transcriptionalcoactivator PGC-1. Nature. 2001;413:131–8.
51. Maher JM, Aleksunes LM, Dieter MZ, Tanaka Y, Peters JM,Manautou JE, et al. Nrf2- and PPAR alpha-mediated regulationof hepatic Mrp transporters after exposure to perfluorooctanoicacid and perfluorodecanoic acid. Toxicol Sci. 2008;106:319–28.
52. Sassi Y, Lipskaia L, Vandecasteele G, Nikolaev VO, Hatem SN,Cohen Aubart F, et al. Multidrug resistance-associated protein 4regulates cAMP-dependent signaling pathways and controls hu-man and rat SMC proliferation. J Clin Invest. 2008;118:2747–57.
53. Jeninga EH, Schoonjans K, Auwerx J. Reversible acetylation ofPGC-1: connecting energy sensors and effectors to guarantee met-abolic flexibility. Oncogene. 2010;29:4617–24.
54. Ayonrinde OT, Olynyk JK, Beilin LJ, Mori TA, Pennell CE, deKlerk N, et al. Gender-specific differences in adipose distributionand adipocytokines influence adolescent nonalcoholic fatty liverdisease. Hepatology (Baltimore, Md). 2011;53:800–9.
55. Lebensztejn DM, Wojtkowska M, Skiba E, Werpachowska I,Tobolczyk J, Kaczmarski M. Serum concentration of adiponectin,leptin and resistin in obese children with non-alcoholic fatty liverdisease. Adv Med Sci. 2009;54:177–82.
56. Scarpaceand PJ, Zhang Y. Leptin resistance: a prediposing factorfor diet-induced obesity. Am J Physiol Regul Integr Comp Physiol.2009;296:R493–500.
57. de Cabo R, Furer-Galban S, Anson RM, Gilman C, Gorospe M,Lane MA. An in vitro model of caloric restriction. Exp Gerontol.2003;38:631–9.
58. Li Y, Xu S, Giles A, Nakamura K, Lee JW, Hou X, et al. Hepaticoverexpression of SIRT1 in mice attenuates endoplasmic reticulumstress and insulin resistance in the liver. FASEB J. 2011;25:1664–79.
59. Foretz M, Ancellin N, Andreelli F, Saintillan Y, Grondin P, KahnA, et al. Short-term overexpression of a constitutively active form ofAMP-activated protein kinase in the liver leads to mild hypoglyce-mia and fatty liver. Diabetes. 2005;54:1331–9.
2246 Kulkarni, Xu, Donepudi and Slitt
60. Kakuma T,Wang ZW, PanW, Unger RH, Zhou YT. Role of leptinin peroxisome proliferator-activated receptor gamma coactivator-1expression. Endocrinology. 2000;141:4576–82.
61. Cui Y, Konig J, Leier I, Buchholz U, Keppler D. Hepatic uptake ofbilirubin and its conjugates by the human organic anion transporterSLC21A6. J Biol Chem. 2001;276:9626–30.
62. Sathirakul K, Suzuki H, Yasuda K, Hanano M, Tagaya O, HorieT, et al. Kinetic analysis of hepatobiliary transport of organic anionsin Eisai hyperbilirubinemic mutant rats. J Pharmacol Exp Ther.1993;265:1301–12.
63. Hosokawa S, Tagaya O, Mikami T, Nozaki Y, Kawaguchi A,Yamatsu K, et al. A new rat mutant with chronic conjugatedhyperbilirubinemia and renal glomerular lesions. Lab Anim Sci.1992;42:27–34.
64. Kudsk KA, Kisor DF, Waters B, Mirtallo JM, Campbell 3rd AJ,Wooding-Scott RA. Effect of nutritional status on organic anionclearance by the swine liver. Surgery. 1992;111:188–94.
65. Ohkubo H,Musha H, Okuda K. Effects of caloric restriction on thekinetics of indocyanine green in patients with liver diseases and inthe rat. Am J Dig Dis. 1978;23:1017–24.
Caloric Restriction and Transporters 2247