Embed Size (px)
Citation preview

Effect of Biochar Amendment on Soil Nitrous Oxide Emission
Hongyuan Deng
Department of Bioresource Engineering,
McGill University, Montreal
December 2013
A thesis submitted to McGill University in partial fulfillment of the requirement of the degree Master of Science
©Hongyuan Deng 2013
i
ABSTRACT
In Canada, agricultural soils are the source of about 70% of the total emissions of nitrous
oxide (N2O), a potent greenhouse gas (298 times CO2 equivalent) and ozone-depleting
substance. The denitrification reaction that occurs in soils under anoxic conditions (e.g.,
after rainfall and snowmelt) is responsible for converting nitrate (NO3-) from fertilizer
into N2O gas. Biochar is a soil amendment that is proposed to mitigate soil N2O emission
by altering soil physical, chemical and biological properties, although the mechanism
responsible for N2O reduction in biochar-amended soil is still not known. The aim of this
study was to determine if biochar-amended soil resulted in lower soil N2O emissions
from denitrification and whether changes in soil chemistry could explain the biochar
effect on denitrification. Two experiments were conducted to measure denitrification in
soils under controlled laboratory conditions. The first experiment with a sandy loam soil
(topsoil and subsoil layers) evaluated actual (N2O only) and potential N2O (N2O + N2)
production after 6 h of incubation, with or without acetylene blocking at 80% water
filled pore space (WFPS). The highest biochar treatment (30 g kg-1 soil) reduced actual
and potential N2O production in topsoil by 80% and 88%, respectively. A supplemental
nitrate (NO3-) addition did not reverse the biochar-induced effect, indicating that the
reduction in N2O production was not due to adsorption of inorganic N by biochar. In the
next experiment, soil moisture was adjusted to 90% WFPS and the effect of biochar on
basal (without supplemental C and N) and potential (with supplemental C and N)
denitrification rates in the topsoil layer from sandy and loamy soils were determined.
The change in soil pH after the addition of biochar was measured. The results showed
ii

that sandy soil did not favor denitrification and the denitrification rate was not affected
by the biochar amendment; however, the biochar amendment significantly (p<0.0001)
increased soil pH and increased the potential denitrification rate in the loamy soil. In
conclusion, soil pH is a critical factor in controlling the potential denitrification rate in
loamy soils, and the increase in soil pH following the addition of biochar to acidic soils
could decrease N2O production from the topsoil layer.
iii

RÉSUMÉ
Au Canada les terres agricoles sont la source de près de 70% des émissions d'oxyde
nitreux (N2O). Un puissant gaz à effet de serre, près de trois cent fois plus actif que le
CO2, il appauvrit aussi la couche d'ozone. Après une pluie ou un dégel, la réaction de
dénitrification qui a lieu en conditions anoxiques dans le sol, est responsable de la
conversion des nitrates (NO3-), provenant d’apports en engrais, en gaz N2O. Quoique le
mode d’action du biochar ne soit pas connu, son utilisation comme amendement du sol,
par voie d’une modification des caractéristiques physiques, chimiques et biologiques du
sol, semble permettre d’atténuer les émissions de N2O. La présente étude tentera
d’établir si un sol enrichi de biochar présente un taux d’émissions de N2O provenant de
dénitrification moins élevé qu’un sol sans amendement, et si l’effet d’une modification
chimique du sol sur la dénitrification en est responsable. En laboratoire, sous des
conditions contrôlées, la dénitrification dans le sol fut mesurée sous deux conditions.
Dans une première expérience la production réelle (N2O seulement) et potentielle (N2O
+ N2) de N2O fut évaluée après 6 h d’incubation dans un loam sableux (couche arable et
sous-sol) avec une proportion de pores remplis d’eau (PPRE) de 80%, avec ou sans
blocage par l’acétylène. L’amendement en biochar le plus élevé (30 g kg-1 sol) réduisit la
production réelle et potentielle de N2O dans la couche arable de 80% et 88%,
respectivement, par rapport à un sol sans amendement. L’ajout de NO3− ne renversa pas
l’effet du biochar, indiquant que la réduction de la production en N2O par le biochar
n’était pas lié à son adsorption d’azote inorganique. Dans une seconde expérience,
l’humidité du sol fut ajustée à 90% PPRE et l’effet d’un ajout de biochar sur le taux de
iv
dénitrification de base (sans ajout de C ou N) et potentiel (ajouts de C et N) fut évalué
pour une couche arable sablonneuse et une limoneuse. L’effet de l’ajout de biochar sur
le pH du sol fut aussi évalué. L’ajout de biochar n’altéra pas le taux de dénitrification
dans un sol sablonneux, déjà défavorable à la dénitrification, mais augmenta à la fois le
pH et le taux de dénitrification potentiel (P < 0.0001) du sol limoneux. Notant que le pH
du sol semble être un important facteur déterminant le taux de dénitrification potentiel
du sol limoneux, et il est suggéré que l’augmentation du pH du sol suivant un ajout de
biochar pourrait diminuer le taux de production de N2O du sol arable.
v

CONTRIBUTION OF AUTHORS
The thesis consists of a general introduction, a literature review and 2 manuscripts.
Chapter 1 is the general introduction, written by the candidate. Chapter 2 is the
literature review, written by the candidate and edited by his supervisors Dr. Joann K
Whalen, Dr. Shiv O Prasher and writing group members of the soil ecology lab. Chapter
3, the manuscript on N2O production from soil-biochar mixture, was co-authored by the
candidate, his supervisors Dr. Joann K Whalen and Dr. Shiv O Prasher. Chapter 4, the
manuscript on biochar application influencing denitrification rate, was co-authored by
the candidate, Dr. Joann K Whalen and Dr. Shiv O Prasher. The incubation experiment
described in Chapter 3 was designed by Dr. Joann K Whalen and the candidate. The
candidate finished the experiment, collected the data, and performed the data analysis.
The lab experiments described in Chapter 4 were designed by the candidate and Dr.
Joann K Whalen. The candidate completed the laboratory experiments and the data
analysis. Overall direction for the thesis research and editorial assistance was under the
supervision of Dr. Joann K Whalen and Dr. Shiv O Prasher. The candidate was
responsible for data collection, laboratory manipulation and the analysis, statistics, data
interpretation, and preparation of both manuscripts.
vi

ACKNOWLEDGEMENTS
First and foremost I would like to thank this great country for giving me the opportunity
to fulfill my passions, dreams and goals. I am grateful to my family and appreciate the
effort they made to send me aboard for higher education at McGill University. Thank
you for giving me the encouragement and comfort, when needed, so that I could focus
on my studies.
I also owe my appreciation to my supervisors Dr. Joann Whalen and Dr. Shiv
Prasher for their patient guidance and unconditional support. Their dedication to their
students is immeasurable. I want thank them for letting me work and learn in their lab
and giving me the opportunity to attend the AQSSS and NABEC conference. Thank you
for advice and for encouraging me to complete the challenges and achieve my goals.
Without this training and help, I would barely have been able to achieve anything.
Secondly, I would like to thank all of my colleagues Bethany, Chen, Vanita, Jinghan,
Jieping, Helen, Pryanka, Tahmid and Maria for all their help. Many thanks to the soil
ecology lab group, for every smile they gave me and all kinds of help and tutoring in the
lab. Lots of thanks to Hélène Lalande; I love your lab. At last, I would like to thank D.
Smith (PI), F. Berruti, A. Dalai, J. Neufeld and J. Whalen for providing me with funding
from the NSERC Strategic Project "Biochar-biofuels help themselves".
Thank you all so much! I really appreciate it! I enjoyed every moment with you at
McGill, may you all achieve every goal and have a wonderful career in the future.
vii

Table of Contents
ABSTRACT ............................................................................................................................ ii
RÉSUMÉ .............................................................................................................................. iv
CONTRIBUTION OF AUTHORS ............................................................................................ vi
ACKNOWLEDGEMENTS ..................................................................................................... vii
LIST OF TABLES ................................................................................................................... xi
LIST OF FIGURES ................................................................................................................ xii
CHAPTER I GENERAL INTRODUCTION ................................................................................ 1
1.1 Problem statement ....................................................................................................... 1
1.2 Biochar as a proposed solution .................................................................................... 2
1.3 Objectives and hypotheses........................................................................................... 2
1.4 Scope ............................................................................................................................ 3
CHAPTER II LITERATURE REVIEW ........................................................................................ 4
2.1 Background information ............................................................................................... 4
2.1.1 The history of biochar............................................................................................ 4
2.1.2 Biochar to mitigate climate change ....................................................................... 4
2.2 Biochar: production, characteristics and use as a soil amendment ............................. 7
2.2.1 Biochar production ................................................................................................ 7
2.2.2 Biochar Characterization ....................................................................................... 8
2.2.3 Biochar application to soil: effects on soil properties ......................................... 10
2.2.3.1. Soil physical properties ................................................................................ 11
2.2.3.2. Biochar and soil chemical properties .......................................................... 12
2.2.3.3. Soil biological properties ............................................................................. 13
2.3 Soil N cycle and response to biochar application: implications for N2O emissions ... 14
2.3.1 Soil N cycle ........................................................................................................... 15
2.3.2. N2O emissions from soil ..................................................................................... 16
2.3.2.1 Reactions that produce N2O in soil .............................................................. 16
2.3.2.2 N2O produced from aerobic processes ........................................................ 17
2.3.2.3 N2O produced from anaerobic process........................................................ 20
2.3.3 Biochar influences N2O emissions ....................................................................... 23
viii

2.4 Current research needs .............................................................................................. 26
CHAPTER III SLOW PYROLYSIS BIOCHAR REDUCES NITROUS OXIDE EMISSION FROM DENITRIFICATION IN A SANDY LOAM SOIL UNDER LABORATORY CONDITIONS .............. 36
3.1 Abstract ...................................................................................................................... 36
3.2 Introduction ................................................................................................................ 37
3.3 Material and methods ................................................................................................ 39
3.3.1 Soil and Biochar ................................................................................................... 39
3.3.2 Experimental design ............................................................................................ 40
3.3.3 Procedure and calculations ................................................................................. 41
3.3.4 Soil analysis .......................................................................................................... 45
3.3.5 Statistical analysis ................................................................................................ 45
3.4 Results ........................................................................................................................ 46
3.4.1 Actual N2O production ........................................................................................ 46
3.4.2 Potential N2O production .................................................................................... 46
3.4.3 Nitrate retention ................................................................................................. 47
3.5 Discussion ................................................................................................................... 47
3.6 Conclusion .................................................................................................................. 50
CONNECTING PARAGRAPH ............................................................................................... 61
CHAPTER IV BIOCHAR EFFECTS ON BASAL DENITRIFICATION AND DENITRIFICATION POTENTIAL IN LABORATORY ............................................................................................................... 62
4.1 Abstract ...................................................................................................................... 62
4.2 Introduction ................................................................................................................ 63
4.3 Material and method.................................................................................................. 65
4.3.1 Soils and biochar.................................................................................................. 65
4.3.2 Experimental design ............................................................................................ 66
4.3.3 Procedures and calculations ................................................................................ 67
4.3.3.1 Denitrification rate ....................................................................................... 67
4.3.3.2 Gas analysis .................................................................................................. 69
4.3.3.3 Soil pH measurement ................................................................................... 70
4.3.4 Statistical analysis ................................................................................................ 71
4.4 Results ........................................................................................................................ 71
4.4.1 Biochar and soil pH .............................................................................................. 71
ix

4.4.2 Effect of biochar on denitrification rates ............................................................ 72
4.4.3 Correlation between between pH and denitrification rate ................................ 72
4.5 Discussion ................................................................................................................... 73
4.6 Conclusion .................................................................................................................. 74
CHAPTER V SUMMARY AND CONCLUSIONS..................................................................... 81
BIBLIOGRAPHY .................................................................................................................. 84
Appendix A. N2O concentration in treatments at all sampling times and ammonium concentrations after gas sampling ................................................................................... 95
Appendix B. N2O production after 6 h of incubation ..................................................... 100
x

LIST OF TABLES
CHAPTER 2
Table 2.1 Product yields from feedstocks under different pyrolysis conditions. Source: Bridgewater (2007) ........................................................................................................... 28 Table 2.2 Method of analysis for biochar physico-chemical characterization ................. 29
CHAPTER 3
Table 3.1 Biochar proximate analysis and elemental decomposition results .................. 51 Table 3.2 Treatments effect on actual N2O production in topsoil ................................... 52 Table 3.3 Treatments effect on potential N2O production in topsoil .............................. 53 Table 3.4 Treatment effects on actual N2O production in subsoil ................................... 54
CHAPTER 4
Table 4.1 Soil properties ................................................................................................... 76 Table 4.2 Denitrification rates affected by biochar amendments in sandy and loamy soils77 Table 4.3 Correlation between soil pH and denitrification rates ..................................... 78
APPENDIX A
Table A1 Actual N2O-N concentration in subsoil at all sampling times (25, 26, 28 and 30 h after acetylene injection). ......................................................................................................... 96 Table A2 Actual N2O-N concentration in topsoil at all sampling times (25, 26, 28 and 30 h after acetylene injection). ......................................................................................................... 97
xi

LIST OF FIGURES
CHAPTER 2
Figure 2.1 Electron micrograph of E. coli adsorbed to activate charcoal cloth with Mg2+ and K+ overpotential supplied ..................................................................................................... 31 Figure 2.2 Visual observation of microorganism colonization on biochar ....................... 32 Figure 2.3 Soil N cycle (adapted from Canfield et al. (2010)) ........................................... 33 Figure 2.4 Possible pathways of N2O emissions from soil (adapted from Hu et al. (2012))34 Figure 2.5 Changes in soil physic-chemical properties and biological processes following biochar addition and the consequent impacts on the soil N cycle ............................................... 35
CHAPTER 3
Figure 3.1 Actual N2O production from denitrification in topsoil (30 h after acetylene injection) with and without supplemental nitrate ........................................................................... 55 Figure 3.2 Actual N2O production from denitrification in subsoil (30 h after acetylene injection) with and without supplemental nitrate ........................................................................... 56 Figure 3.3 Potential N2O production from denitrification in topsoil (30 h after acetylene injection) with and without supplemental nitrate ........................................................................... 57 Figure 3.4 Potential N2O production in subsoil (30 h after acetylene injection) with and without supplemental nitrate ........................................................................................................ 58 Figure 3.5 Nitrate concentrations remaining at the end of the headspace gas sampling period (30 h after adding acetylene to pre-incubated (24h) soil-biochar mixtures) in topsoil with and without supplemental N ................................................................................................... 59 Figure 3.6 Nitrate concentrations remaining at the end of the headspace gas sampling period (30 h after adding acetylene to pre-incubated (24h) soil-biochar mixtures) in subsoil with and without supplemental N ................................................................................................... 60
CHAPTER 4
Figure 4.1 Change in soil pH following biochar application. Soil-biochar mixtures were incubated at 20 oC for 24 h prior to measuring pH. .......................................................................... 79 Figure 4.2 Potential denitrification rate in loamy and sandy soils with different biochar treatments ........................................................................................................................ 80
APPENDIX A
Figure A1 Ammonium concentrations remaining at the end of the headspace gas sampling period (30 h after adding acetylene to pre-incubated (24h) soil-biochar mixtures) in topsoil for potential N2O production measurement with and without supplemental N. ................. 98
xii

Figure A2 Ammonium concentrations remaining at the end of the headspace gas sampling period (30 h after adding acetylene to pre-incubated (24h) soil-biochar mixtures) in subsoil for potential N2O production measurement with and without supplemental N. ................. 99
APPENDIX B
Figure B1 N2O production at 6 h after incubation in sandy and loamy soils ................. 101
xiii
CHAPTER I GENERAL INTRODUCTION
1.1 Problem statement
Climate change due to the release of greenhouse gases is a serious issue
worldwide. Of all the greenhouse gases, N2O is of special concern because of its
high global warming potential (298 times CO2 equivalent) and also it acts as an
ozone-depleting substrate which remains nearly permanently in the atmosphere
(Ravishankara et al., 2009). In Canada, 70% of this harmful gas is generated from
the agricultural sector (Environment Canada, 2006), due to fertilization and
rainfall which favors reactions producing N2O such as denitrification (Bergaust et
al., 2010).
Denitrification is an anaerobic process which converts nitrate (NO3-) to
di-nitrogen gas (N2) while releasing N2O as a by-product. Bacteria, archaea and
some fungi are involved in this biological transformation. The microbial mediated
reaction as well as the N2O produced from denitrifaction is largely governed by
soil properties such as soil temperature, moisture, substrate availability and pH
level (Ryden, 1983, Čuhel and Šimek, 2011). Generally, denitrification reactions
produce less N2O with less substrate and higher pH values. As it is one of the
most important contributors of N2O from agricultural soils under anoxic
conditions, the wish to reduce the N2O production from denitrification can
probably be achieved through modifying soil properties that are critical for this
process and this may result in promising benefits in mitigating climate change.
1

1.2 Biochar as a proposed solution
Biochar is an emerging carbon rich material produced from the pyrolysis of
biomass. It exhibits a clear influence on the physical, chemical and biological
properties of soil (Topoliantz and Ponge, 2005; Cheng et al., 2008; Lehmann et
al., 2003; Steiner et al., 2008) and can be used as a soil amendment. Biochar
induced changes such as nutrient adsorption and pH plays an important role in
denitrification, and previous studies reported reduced N2O production following
biochar application (Singh et al., 2010b; Taghizadeh-Toosi et al., 2011; Bruun et
al., 2011b). Thus, reducing N2O emissions from denitrification through biochar
amendment is highly desirable.
1.3 Objectives and hypotheses
The mechanisms on the way in biochar affects denitrification and influences N2O
production are still poorly understood. The objective of this thesis to analyze the
potential for biochar to reduce N2O emission from denitrification and to
examine the influences of the biochar induced changes in soil pH and NO3-
availability.
Three hypotheses are proposed: i) Biochar adsorption results in low
substrate availability for denitrifiers and suppress the production of N2O. ii) The
increased pH after the biochar application suppresses N2O production from
denitrification. iii) Higher rates of biochar application results in a greater
2

reduction of N2O. A series of lab experiments were conducted to test these
hypotheses.
1.4 Scope
The thesis study consist of two laboratory experiments, the effect of biochar was
only tested in a sandy soil, a sandy loam soil and a loamy soil. Because of the
diverse interactions between biochar and different soils, these results should be
considered with caution when biochar is used for other soils. Also, these results
need to be backed up with field studies to be more conclusive.
3
CHAPTER II LITERATURE REVIEW
2.1 Background information
2.1.1 The history of biochar
Biochar is a manmade charcoal generated by pyrolysis of biomass. It has been
used as a soil amendment for at least 2000 years in the Amazon basin (Mann,
2002). Soils in this region are defined as Oxisols and are generally acidic, red, thin,
and infertile. However, the “Terra Preta” soils containing biochar are alkaline and
were produced by adding charcoal and other organic materials (e.g. fish and
animal bones, plant, animal feces) to the soil. Terra Preta soils are richer in
nutrients such as nitrogen (N), Sulfur (S), calcium (Ca), and phosphorus (P) and
retain more water than unamended Oxisols. Other features of Terra Preta soils
are a higher level of soil microbial activity, and less nutrient leaching than
unamended soils (Mann, 2002). Scientific attention has focused on the way in
which biochar modifies soil properties and whether it functions in the same way
in regions other than the Amazon.
2.1.2 Biochar to mitigate climate change
Biochar has positive effects on agricultural productivity in Oxisols and other
tropical soils (Lehmann and Joseph, 2009). Biochar is a relatively stable carbon (C)
pool that can persist for hundreds to thousands of years when added to soil,
which means that it serves as a perfect C sink (Lehmann and Joseph, 2009;
Verheijen et al., 2010). Consequently, the potential for biochar to boost crop
4

yield and mitigate climate change in temperate regions has attracted the interest
of scientists and entrepreneurs.
How can biochar mitigate climate change? To answer this question, we
need to understand the process of soil C sequestration, which describes how
atmospheric CO2 is transformed to soil C. Plants capture atmospheric CO2
through photosynthesis and a portion of the plant biomass will enter the soil (e.g.
un-harvested residues and roots). Decomposition of plant residues results in the
return of CO2 to the atmosphere. The mean residence time of plant residue in
soil ranges from months to years depending on the size of soil aggregates (Jha et
al., 2012). In contrast, the C sequestrated by biochar can remain in the soil for
hundreds or even thousands of years (Lehmann and Joseph, 2009). If plant
biomass can be transformed into biochar that decomposes more slowly, it will
thus divert C from the fast biological cycle into the much slower biochar cycle
(Cheng et al., 2008). Preston and Schmidt (2006) found that the more
recalcitrant compounds in pyrogenic biochar created by wildfire and therefore of
a woody feedstock can be expected to have a half-life of 5000 to 7000 years in
cold and wet environments.
Carbon sequestration in biochar-amended soils not only counter-
balances the CO2 lost from soils through plant residue and soil organic matter
decomposition, but it is also considered an offset for atmospheric CO2 and other
greenhouse gases produced by fossil fuel burning and other sources. Among the
most potent of greenhouse gases is N2O, which has a global warming potential
5

298 times greater than CO2 and remains in the atmosphere almost permanently.
In addition, it is reported to be the most important ozone-depleting gas and
likely to remain so throughout the 21st century (Ravishankara et al., 2009).
Anthropogenic sources of N2O contributed 3 Giga tons of CO2e (carbon dioxide
equivalents), about 8% of global emissions in 2004, and agriculture was
responsible for 42% of the total N2O emission (Denman, 2007). If N2O emissions
can be reduced, this can mitigate the negative impact of agriculture on climate
change. Besides serving as an offset for N2O emission, biochar addition to
agricultural soil can directly reduce N2O emissions. For instance, Yanai et al.
(2007) applied a large amount of biochar (approximately 150 t ha-1) to a Typic
Hapludand soil in a laboratory study. The maximum N2O-N emission was
reduced by 85% in biochar-amended soil after rewetting the soil to 73% WFPS,
when compared to the control soil without biochar. Singh et al. (2010b) applied
4 biochars (wood biochar produced at 400 oC and 550 oC; poultry manure
biochar produced at 400 oC and 550 oC) to an Alfisol and a Vertisol at a rate of 10
t ha-1. After 3 wetting-drying cycles, all biochar treatments reduced N2O
production, cumulatively by 14 to 73% from the Alfisol and by 23 to 52% from
the Vertisol. Van Zwieten et al. (2010) applied 5% (weight basis) of biosolid
biochar to a flooded Ferrosol, which reduced N2O emission to 518 mg N2O-N m-2
compared to 3165 mg N2O-N m-2 in the control soil.
The reduction in soil N2O production and emissions following biochar
application may be due to increased plant N use efficiency, which leaves less
6

nitrate (NO3--N) in the soil for denitrification, or there may be some direct
influence on the soil physical and chemical properties that are critical to soil N
transformations. However, the most likely reason is biochar can alter soil
microbial activities that play a crucial role in N2O emission (e.g. denitrification).
Nevertheless, the reduction of N2O is not constant for all biochars and all soils
amended with biochar. Applying various biochars to different soils has shown
that the reduction of N2O varies greatly (Singh et al., 2010b; Van Zwieten et al.,
2010). This review aims to provide insight into the way in which biochar
functions in soil. First, I will explain how biochar is produced, the general physical
and chemical characteristics of the material, and its interaction with soil. Then,
the soil N cycle and processes leading to N2O emissions will be described. Finally,
the connection will be made between biochar, biochar-amended soils and soils
N2O production, which enhance our knowledge of the contribution of biochar to
N dynamics in the soil-plant system.
2.2 Biochar: production, characteristics and use as a soil amendment
2.2.1 Biochar production
Biochar is made by pyrolysis, the thermochemical decomposition of organic
materials at elevated temperatures under anaerobic conditions. Biochar can be
produced from animal manure, crop residue, biosolids, paper mill waste and
many other types of feedstocks. Biochar yield is controlled by pyrolysis
conditions such as time, temperature and carrier gas (Antal and Gronli, 2003;
7

Guo and Rockstraw, 2007). Because pyrolysis of biomass produces biochar as
well as condensable vapor and gas, overall biochar yields can vary from 10-35%,
depending on the reaction conditions, as shown in Table 2.1.
2.2.2 Biochar Characterization
Early studies did not emphasize biochar characterization, thus making it difficult
to understand how biochar was functioning in soil. Pyrolysis conditions
(particularly temperature) and feedstock choice can affect the properties of the
resulting biochar significantly. For example, Hossain et al. (2011) found an
increase in pH and N concentration with higher pyrolysis temperature in biochar
converted from waste water sludge at temperatures ranging from 300 oC to
700 oC. In some cases, biochar made from different feedstocks may have a
different functional capacity, for instance, Abit et al. (2012) observed an increase
in Escherichia coli (E. coli) transport using poultry litter biochar produced under
350 oC, but the transport reduced for pine chip biochar produced at the same
temperature. Singh et al. (2010a) found a higher total C, lower total N, P, K, S, Ca,
Mg, Al, Na, and Cu contents, lower ash content and lower potential cation
exchange capacity (CEC) and exchangeable cations in wood biochars than in the
manure-derived biochars, with intermediate values in leaf biochars. In addition,
biochar properties can be quite dependent on the pyrolysis temperature.
Uchimiya et al. (2011) found that ash content in cottonseed hull derived biochar
increased with an increasing pyrolysis temperature (from 200 oC to 800 oC),
8

while volatile matter content yields declined at greater pyrolysis temperature.
Ash content and volatile matter content in biochar affects its function in soil,
more specifically, the ash content of biochar impacts soil elemental composition
and pH, while the volatile matter content of biochar increases soil respiration
and N immobilization (Deenik and McClellan, 2011). Wang et al. (2011b) also
found that increasing pyrolysis temperature leads to increasing loss of C and N in
biochar during pyrolysis. Thus, biochar must be characterized before it is used in
the laboratory use or as a field amendment.
In addition to information on the feedstock and the pyrolysis
temperature, the minimum data required to characterize biochar includes
knowledge of specific surface area (SSA), total elemental composition and
proximate analysis as they are key to understanding the physical composition,
chemical reactivity and nutrient concentration of biochar. Lehmann and Joseph
(2009) suggest that greater biochar SSA offers more habitats for microorganisms
in the soil. Total elemental composition measures the total C, H, N, S, and O
content and shows the chemical decomposition of biochar. The amount of labile
C can be determined, although the labile fraction is minor (around 5%) since
biochar is composed mostly of stable C forms. It is important to quantify the
labile C fraction in some studies as it strongly influences the short-term
degradability of biochar and may induce a “priming” effect on soil microbial
communities soon after biochar is applied to soil (Zimmerman, 2010; Bruun et al.,
2011a). Proximate analysis includes the measurement of moisture, ash, volatile
9

matter and fixed C content. Knowledge of the surface functional group chemistry
and pH are also necessary as they are closely related to biochar reactivity in the
soil environment. In some cases, cation exchange capacity (CEC), point of zero
charge (pHpcz), dissolved organic carbon (DOC), and powder XRD patterns are
also measured. Common methods of analysis for these parameters are described
in Table 2.2.
2.2.3 Biochar application to soil: effects on soil properties
When biochar is added to soil, it can alter soil physical properties such as texture,
pore size distribution, structure, and bulk density with implications for water
holding capacity, soil water retention, soil aeration, plant growth and soil
workability (Downie et al., 2009). Some soil chemical properties can be
influenced after biochar addition as well, such as lower acidity of soil (Topoliantz
and Ponge, 2005), increased cation exchange capacity (CEC) (Cheng et al., 2008)
and enhanced N retention (Lehmann et al., 2003; Steiner et al., 2008). There is
also experimental evidence that microbial activities are directly affected by the
addition of biochar to soils (Ogawa, 1994; Rondon et al., 2007; Warnock et al.,
2007; Steiner et al., 2008). In agricultural soils with improved soil water retention,
lower acidity, higher CEC and enhanced microbial activity, greater crop yield can
often be expected. For example, biochar application was shown to boost wheat
yield by 30% (Vaccari et al., 2011), and rice yield by 40% (Weiming and Wenfu,
2011). Major et al. (2010) applied 20 t ha-1 biochar to a Colombian savanna
10

Oxisol under maize-soybean rotation for 4 years and found an increase in yield of
28, 30 and 140% in the second, third and fourth year, respectively. In these
studies, part of the crop response to biochar was attributed to nutrients
contained in the biochar, which served as a source of nutrition to crops. For
instance, Major et al. (2010) attributed the greater crop yield and nutrient
uptake in their 4 year field trial to 77-320% more Ca and Mg in soil where
biochar was applied. The general improvement in fertility of biochar-amended
soils, due to changes in soil properties, will be explained in the next sections.
2.2.3.1. Soil physical properties
The physical structure of feedstock and pyrolysis temperature influences the
structure and SSA of biochar. For instance, biochar produced from apple wood
chips had a large surface area of 70-340 m2 g-1, while biochar produced from
corn stover had a smaller surface area (5-70 m2 g-1) (Sun et al., 2010). Liang et al.
(2006) found the SSA of an Anthrosol collected in the Amazon basin was 4.8
times greater when compared to the adjacent Oxisols that never received
biochar. Pore size of biochar can alter key soil physical properties such as
aggregation, porosity, etc. and this, in turn, alters certain soil functions. Larger
macro pores increase soil aeration, hydrology and also provide a habitat for
microbes, whereas smaller pores improve molecule adsorption and allow soil to
store and hold more water and nutrients (Atkinson et al., 2010). Biochar also
modifies the soil structure by improving soil aggregation, as Tanaka et al. (2011)
11
found the soil aggregation was developed by using biochar and suggested that
the soil was aggregated with microorganisms proliferated on the surface of the
aggregate in the soil.
2.2.3.2. Biochar and soil chemical properties
Most biochars have neutral to basic pH values (Singh et al., 2010a; Verheijen et
al., 2010), and many field trials show an increase in soil pH after the addition of
biochar when the initial soil pH is low (acid soil). Verheijen et al. (2010)
conducted a meta-analysis of the experimental studies using different biochar
rates and biochar produced from various feedstocks. Overall, the results suggest
an average pH of 5.3 before and 6.2 after biochar amendment. Poultry litter
biochar (pH 13) applied on acidic soils (pH 4.5) at the rate of 50 t ha-1 increased
the pH to 7.8 within 6 weeks (Chan et al., 2008), thus, indicating that the pH
change from applying biochar can occur rapidly. The CECs of biochar range from
nearly 0 to about 40 cmol g-1. Soil CEC changes after the biochar is incorporated
into the soil; this effect is enhanced over time as a result of gradual surface
oxidation (Cheng et al., 2006; Liang et al., 2006; Cheng et al., 2008) or a process
of leaching of hydrophobic compounds from biochar (Briggs et al., 2005). Some
authors suggest that applying biochar to soil will provide reactive surfaces
(within pores and on the biochar surface) that are effective in binding both
cations and anions (Liang et al., 2006; Chan and Xu, 2009), thus reducing nutrient
leaching from soil.
12

2.2.3.3. Soil biological properties
During decades of study in Japan, where George and Davies (1988) found the
adhension of Escherichia coli (E. coli) on activated C (AC) with the occurrence of
precipitates from added Mg2+ under application of a negative potential (Figure
2.1) was due to the extreme porosity of AC. AC was also widely used as a
contaminant absorbent due to its porous nature. Although biochar and AC are
not the same, the differences between them are subtle since both are acquired
from the heating of C-rich material (Sohi et al., 2009).Biochar may also exhibit
great porosity depending on the feedstock and pyrolysis conditions (Novak et al.,
2009) and scientists consider that the porosity of biochar provides a refuge for
microorganisms and stimulates microbial growth (Saito and Marumoto, 2002;
Warnock et al., 2007; Thies and Rillig, 2009). Microbial canonizations have been
found in biochar pores as shown in Figure 2.2. Biochar has also been shown to
alter soil microbial activities, biological community composition and
abundance(Pietikäinen et al., 2000; Kim et al., 2007; O’Neill et al., 2009;
Grossman et al., 2010; Jin, 2010; Liang et al., 2010). These changes may in turn
have an impact on the nutrient cycles (Steiner et al., 2008). A certain amount of
stimulation or increase in microbial population and growth may be attributed to
the small labile C fraction in biochar that can be utilized by microbes in the short-
term, that is, within weeks or months of the biochar application (Deenik et al.,
2010). There is also experimental evidence that the addition of biochar to soil
13

increases N2 fixation by both free-living and symbiotic N-fixing bacteria (Ogawa,
1994; Rondon et al., 2007). Other than habitat provided by biochar, this might
also be attributed to alteration of soil physic-chemical properties, i.e. more
nutrient absorption leading to higher nutrient availability to microbes. Some
biochar contains a fraction of nutrients such as N and P (Singh et al., 2010a); the
nutrient can also explain this microbial reaction. Due to these direct or indirect
alterations in soil biological properties after the biochar application, changes in
soil N cycle, which is largely mediated by microorganisms, can be expected.
2.3 Soil N cycle and response to biochar application: implications for N2O emissions
Biochar can be used as a soil amendment, producing changes in soil physical,
chemical and biological properties, as described in section 2. Some of these
changes will affect soil microbial activity and therefore, have an impact on the N
cycle, which is largely controlled by microbially-mediated reactions.
Denitrification reactions that result in N2O emissions are of particular interest, as
mentioned in section 1 and section 2.3.3. In this section, the soil N cycle will be
described followed by an explanation of the reactions that lead to the release of
N2O in soil. Finally, evidence will be provided from laboratory experiments that
measured N2O production and flux from soil amended with biochar.
14

2.3.1 Soil N cycle
Nitrogen is an essential component of protein, DNA and RNA and therefore, it is
one of the major elements for the growth and development of organisms.
Nitrogen on earth exists in both inorganic (ammonia, N2, NO3-, NOx, etc.) and
organic (amino and nucleic acids, etc.) forms; however, most organisms cannot
use the largest N pool - atmospheric N2 which represents 78% of the
atmosphere. The N cycle is a set of biogeochemical processes by which
atmospheric N2 undergoes chemical reactions, changes forms and transfers
through different reservoirs on earth including living organisms. A typical soil N
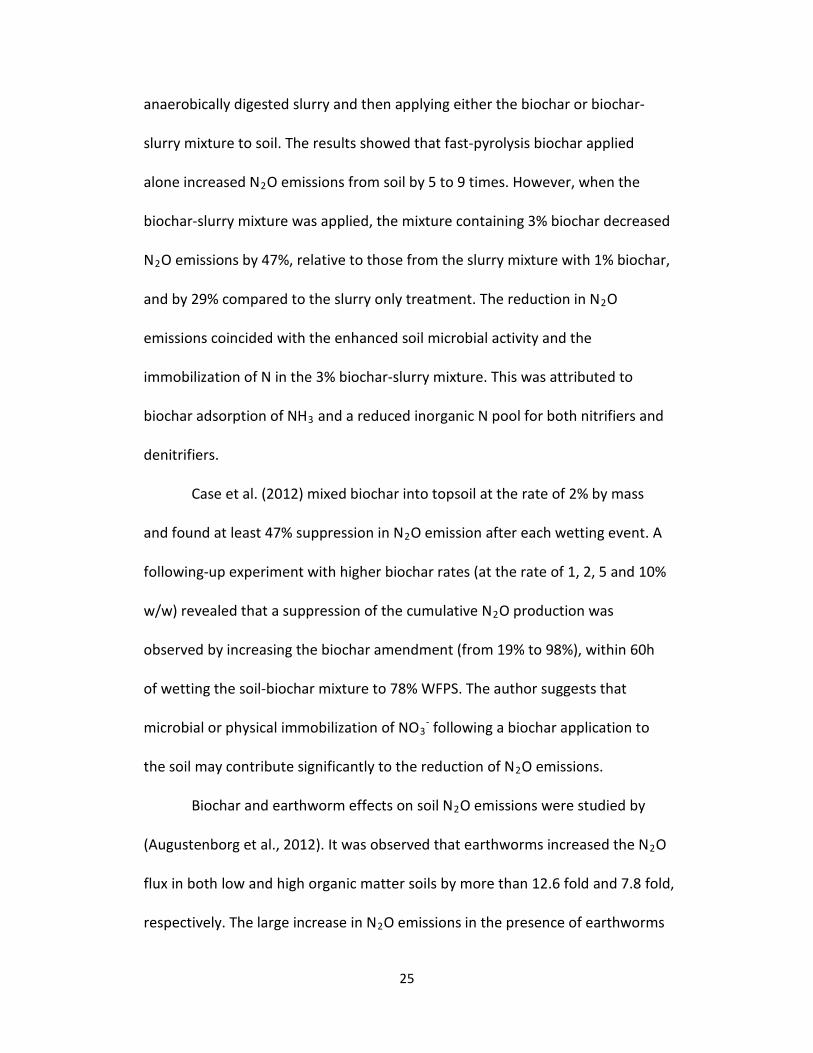
cycle is shown in Figure 2.3. There are several key processes in the N cycle
including N2 fixation, mineralization, ammonia (NH4+) oxidation, nitrification,
assimilation and denitrification. Soil microorganisms and fauna, especially
bacteria, play major roles in all of these N transformations. As a result, factors
such as temperature and moisture that influence microbial activities also affect
the soil N cycle.
Nitrogen fixation is the process that converts N2 to NH4+. This occurs
either through biological N2 fixation carried out by N2 fixing bacteria as well as
some non-biological N2 fixation processes that occur in nature or from
anthropogenic activities like lightning, fossil fuel combustion, and synthetic N
fertilizer production. Another source of NH4+ is from N mineralization, the
transformation of organic N to NH4+ by soil decomposing organisms (primarily
microorganisms). The resulting NH4+ binds to soil particles or remains in the soil
15

solution and undergoes ammonia oxidation by bacteria and archaea to form
hydroxylamine (NH2OH). After that, certain bacteria, archaea and fungi carry out
the nitrification, which converts NH2OH to nitrite (NO2-) and finally NO3
-. While
NO3- can be converted back to NH4
+ through a process called dissimilatory
reduction of NO3- to ammonium (DRNA) in waterlogged soils, most of the NO3
-
in aerated soils will be immobilized by plants and living organisms. When they
die, the decomposers in soil consume the organic N and convert them to NH4+ or
NO3- again. Any NO3
- that is not assimilated by plants can be utilized by
denitrifiers under anaerobic conditions; the denitrificaiton process eventually
converts NO3- into N2, which reverts back to the atmospheric N pool. The
denitrification reaction intermediate nitric oxide (NO (g)) and N2O (g) are of
interest because they are the reactive N forms lost from soil into the atmosphere.
Other than denitrification, anammox acts as an alternative route whereby NH4+
and NO are converted to N2 but N2O is not produced (Hu et al., 2011).
2.3.2. N2O emissions from soil
2.3.2.1 Reactions that produce N2O in soil
It is widely acknowledged that N2O can be an intermediate product of
nitrification, nitrifier-denitrification and denitrification in agricultural soils (Fig.
2.4). When the soil is aerobic, N2O may be a byproduct of nitrification through
hydroxylamine oxidation (Bateman and Baggs, 2005). Furthermore, some
heterotrophic microorganisms, such as Alcaligenes faecalis, can nitrify organic
16

and inorganic N compounds and produce N2O in pure cultures (Papen et al.,
1989; Anderson et al., 1993). There is also evidence that ammonia oxidisers are
able to reduce NO2− to N2O or N2 under short-term O2 limitation (nitrifier-
denitrification) (Poth and Focht, 1985; Pathak, 1999; Wrage et al., 2001; Kool et
al., 2011), But when the soil is anaerobic and soil WFPS is over 70%,
denitrification becomes the predominant source of N2O emitted from soil
(Khahil and Baggs, 2005; Opdyke et al., 2009). Recent advances in measuring soil
N dynamics show other pathways for N2O production such as co-denitrification
and NO3- ammonification (Baggs, 2011). However, the kinetics and processes
involved are poorly understood; moreover, NO3- ammonification has only been
detected in arable soils after the addition of glucose and a reducing agent
making it less important in N2O production (Schmidt et al., 2011).
2.3.2.2 N2O produced from aerobic processes
When soil is aerobic, N2O can be produced from nitrification (shown in the
aerobic part of figure 2.3), as a byproduct of ammonia oxidation or from nitrifier-
denitrification (Kool et al., 2011). Nitrification is the aerobic biological conversion
of NH4+ to NO3
- carried out by bacteria, archaea and fungi. The main reactions
are:
NH3 + O2 + 2H+ + 2e- → NH2OH + H2O (Equation 1)
NH2OH + H2O → NO2− + 5H+ + 4e− (HNO NO N2O) (Equation 2)
NO2− + 5H+ + 4e− → NO3
− + 2H+ + 2e− (Equation 3)
17

Kool et al. (2011) found that nitrification and nitrifier-denitrification
under aerobic conditions can be responsible for up to 34% and 49.9% of the total
N2O emission, respectively. In nitrification, NH4+ is first oxidized to
hydroxylamine by organisms containing the enzyme ammonium monooxygenase
(Equation 1), then hydroxylamine is subsequently oxidized to NO2− by
hydroxylamine oxidoreductase (Equation 2), and NO2− is finally oxidized to NO3
−
by nitrite oxidoreductase (Equation 3) (Canfield et al., 2010). The first two steps
(Equation 1 and 2) are catalyzed by bacteria and archaea, while the last step is
catalyzed by bacteria and fungi. N2O is a byproduct of hydroxylamine oxidization,
making nitrification an important source of N2O emission (Dore and Popp, 1998).
Due to the diversity in metabolism and life histories of microorganisms involved
in these reactions (both autotrophic and heterotrophic microorganisms from
three kingdoms are involved), it is hard to imagine soil conditions that would
inhibit these reactions. Some general observations about factors influencing
nitrification are provided below.
Climate determines soil moisture and temperature and it is the
predominant influence in nitrification. Nitrification is optimal below the soil field
capacity, at around 60-70% WFPS because oxygen is required in nitrification. Any
management factor that improves soil aeration, such as tillage or adding organic
matter, will optimize nitrification. Nitrifiers are also sensitive to temperature.
Breuer et al. (2002) found gross nitrification was positively correlated with
increasing temperature from 14 oC to 22 oC. The optimal temperature range for
18

nitrification is from 35 oC to 38 oC (Grunditz and Dalhammar, 2001), although
nitrification can occur between 5 and 45oC (Grunditz and Dalhammar, 2001).
Maag and Vinther (1996) indicate that in nitrification, the percentage of N2O-N
produced increased with rising soil moisture from 40% field capacity to 100%
field capacity; they also found that by increasing temperature from 5 oC to 20 oC,
the percentage of N2O-N decreased indicating there was greater efficiency of
conversion of NH2OH to NO2-.
Soil pH has an impact on nitrification. The optimal pH for nitrification is
near neutral (Paul and Clark, 1996; Lehmann et al., 2011), but the process may
occur over a fairly wide range of pH, with thresholds occurring under extremely
acidic and alkaline conditions. For example, when the pH drops below 5.5, the
acidity of the soil has a detrimental effect on the prokaryotic (bacterial) nitrifiers
(Alexander, 1965; Sahrawat, 1982; Schmidt, 1982), thus reducing nitrification.
Interestingly, nitrification itself is an acid producing process and will lower the
soil pH. Denitrification utilizes the hydrogen ion produced by nitrification and
balances the soil pH (Simek and Cooper, 2002). Law et al. (2011) found the N2O
production rate was highly pH dependent and observed an increase in N2O
production from pH 6 to 8.
Furthermore, Otte et al. (1999) found the N2O production in nitrification
correlates positively with the amount of hydroxylamine (NH2OH) since it is the
direct substrate for N2O produced in nitrification.
19
Nitrifier-denitrification occurs in both aerobic and anaerobic conditions.
When NO2- is available from NH4
+ oxidation, ammonia oxidizing bacteria could
reduce NO2- with NH4
+ as an electron source as well as performing ‘normal’ NH4+
oxidation with O2 (nitrification) to obtain energy. Consequently, nitrifier-
denitrification is not necessarily inhibited by aerobic conditions. For instance,
Ritchie and Nicholas (1972) found Nitrosomonas europaea indeed reduced NO2-
to N2O both aerobically and anaerobically. Shaw et al. (2006) found all strains of
ammonia oxidizing bacteria tested were capable of nitrifier-denitrification under
aerobic conditions. Usually nitrifier-denitrification is much less important than
the classical nitrate-driven denitrification. However, when soil moisture is sub-
optimal for denitrification, it may be a major contributor to N2O emission from
soil (Kool et al., 2011). For example, when the soil is at 50% WFPS, nitrifier-
denitrification could contribute to 56.9% of the total N2O production and up to
71.1% of the NH4+ derived N2O production (Kool et al., 2011).
2.3.2.3 N2O produced from anaerobic process
Denitrification is the dominant source of N2O production under anaerobic soil
conditions (Kool et al., 2010; Kool et al., 2011). It is the biological reduction of
NO3- to N2 (Equation 4) as a final product by a taxonomically diverse group of
bacteria and fungi (Fig 2.3). In denitrification, NO3- is first converted to NO2
- by
nitrate reductase, then NO2- is converted to NO by nitrite reductase, nitric oxide
reductase will convert NO to N2O, while N2O can be reduced to N2 by nitrous
20

oxide reductase (Canfield et al., 2010). Anammox is considered another type of
denitrification that serves as an alternative route from NH4+ to N2 without
producing N2O.
NO3− → NO2
− → NO (g) → N2O (g) → N2 (g) (Equation 4)
Denitrifiers include over 60 genera of bacteria and archaea as well as
some eukaryotes (e.g., fungi, protozoa, and benthic Foraminifera and Gromiida)
(Canfield et al., 2010). Usually, they prefer NO3- as a terminal electron acceptor
over other intermediates of the denitrification process, which is why the reaction
intermediates (e.g. N2O (g)) are produced in large quantities when the NO3-
supply is sufficient (Swerts et al., 1996; Miller et al., 2008).
The Denitrification reaction is sensitive to soil moisture and temperature
as well. Typically oxygen is considered as the most important regulator for
biological denitrification, because O2 not only inhibits denitrifying enzyme
activity, but also suppresses the denitrifying enzyme synthesis (Smith and Tiedje,
1979; Knowles, 1981; Tiedje, 1988; Mckenney et al., 1994). The reductive
enzymatic steps in the process are most active under anaerobic conditions.
Generally, denitrification occurs when soil moisture is over 50% WFPS and
increases rapidly over 80% WFPS (Linn and Doran, 1984; Kool et al., 2011).
Moreover, water content plays an important role in N2O production from
denitrification, 92.1% of the total N2O was from denitrification under 90% WFPS
(Kool et al., 2011).However, some organisms are known to respire O2 and
denitrify simultaneously (Robertson and Kuenen, 1991; Ottow and Benckiser,
21

1994). Isotope labeled 15N was recovered as N2O produced by denitrification in
a study where the WFPS was 20% (Bateman and Baggs, 2005). This suggests that
either denitrification was proceeding in anaerobic microsites in this treatment or
that aerobic denitrification was occurring (Carter et al., 1995; Patureau et al.,
2000). The optimum temperature for denitrification is similar to the optimum
temperature for nitrifying microorganisms, which is 35 oC-38 oC. The
denitrification rate increases linearly with temperatures ranging from 10 oC to
45 oC and declines rapidly below 10 oC (Stanford et al., 1975; Dorland and
Beauchamp, 1991; Pfenning and McMahon, 1997). Furthermore, the N2O/ N2
ratio can be decreased exponentially by increasing temperature (Maag and
Vinther, 1996).
Denitrifying microorganisms are sensitive to pH. The optimal range for
denitrification is between 7.0 and 8.0 (Knowles, 1982; Hiscock et al., 1991;
Thomas et al., 1994). Denitrification rates will be significantly reduced by a pH
less than 6 or higher than 8.6 (Lee and Rittmann, 2003). Denitrification processes
can raise the soil pH by consuming the hydrogen ions produced in nitrification
and balance soil pH dynamics (Simek and Cooper, 2002). Bergaust et al. (2010)
found soil pH also exerts a strong influence on N2O/ N2 ratio from denitrification
(high ratios at low pH). The reason might be because pH exerted a strong
influence on the N2O reductase activity due to an unsuccessful
assemblage/folding of the protein due to low pH.
22

2.3.3 Biochar influences N2O emissions
Some soil properties (soil aeration, pH, water and nutrient retention, CEC, etc.)
that can be altered by biochar addition are closely related to the microbial
mediated processes of nitrification and denitrification. Therefore, it is expected
that biochar will promote N retention in the soil-plant system and reduce N2O
emissions (Fig. 2.5). This section provides experimental evidence to support the
model in Figure 2.5, and whenever data was available, the reasons for biochar-
amended effects on soil N2O emissions.
The influence of four biochars on N2O emission from an Alfisol and a
Vertisol was studied by Singh et al. (2010b). Wood and poultry manure were
used to produce biochar at 400 oC and 550 oC (W400, W550, PM400, PM550). In
the first wet-dry cycle, PM400 produced higher N2O emissions than the control
(no biochar applied). The author attributes the initial, greater N2O emission from
the PM400-amended soils to its higher labile N content than that of other
biochars. During the third wet-dry cycle, all biochar treatments consistently
decreased N2O emissions, cumulatively by 14 to 73% from the Alfisol and by 23
to 52% from the Vertisol, relative to the unamended control soils. The author
suggests the result may due to oxidation of the biochar surface, which increased
the NH4+ and NO3
- adsorption by biochar, thus, leaving less substrate for
conversion to N2O. Nevertheless, the wetting event at 80% to 85% WFPS implies
the N2O was produced by denitrification.
23
Biochar made from biosolids and applied at 5% by weight was found to
efficiently reduce N2O emissions from an acidic Ferrosol, an 84% reduction in
N2O-N production was observed in biochar amended soil compared to the
control (Zwieten et al., 2010). This reduction was attributed to increased
adsorption of NO3- as well as increased pH which can promote denitrification to
the end product, N2 (g), in flooded soils (100% WFPS).
Taghizadeh-Toosi et al. (2011) found that pasture soil amended with
ruminant urine patches had lower N2O emission with increasing biochar
applications during an 86 day spring-summer period. The N2O fluxes from 15N
labeled ruminant urine patches were reduced by > 50% after applying 30 t ha-1
biochar. The results were attributed to the biochar adsorption of NH3, due to a
lower extractable NO3--N concentration and a greater NH4
+-N concentration
when more biochar was applied.
However, in the study by Taghizadeh-Toosi et al. (2011), the geometric
mean of N2O emissions was affected by different biochar rates observed
between day 4 and day 35 (a decreasing trend following an increasing biochar
rate), coincident with the relatively high moisture content (>60% WFPS) due to
irrigation and rainfall in the first 35 days. As denitrification is much less
important at WFPS lower than 60% (Bateman and Baggs, 2005), this implies the
reduction of N2O from denitrification in the first 35 days.
Bruun et al. (2011b) examined N2O emissions after combining a fast-
pyrolysis biochar at low (1% by mass) and high (3%) concentrations with
24
anaerobically digested slurry and then applying either the biochar or biochar-
slurry mixture to soil. The results showed that fast-pyrolysis biochar applied
alone increased N2O emissions from soil by 5 to 9 times. However, when the
biochar-slurry mixture was applied, the mixture containing 3% biochar decreased
N2O emissions by 47%, relative to those from the slurry mixture with 1% biochar,
and by 29% compared to the slurry only treatment. The reduction in N2O
emissions coincided with the enhanced soil microbial activity and the
immobilization of N in the 3% biochar-slurry mixture. This was attributed to
biochar adsorption of NH3 and a reduced inorganic N pool for both nitrifiers and
denitrifiers.
Case et al. (2012) mixed biochar into topsoil at the rate of 2% by mass
and found at least 47% suppression in N2O emission after each wetting event. A
following-up experiment with higher biochar rates (at the rate of 1, 2, 5 and 10%
w/w) revealed that a suppression of the cumulative N2O production was
observed by increasing the biochar amendment (from 19% to 98%), within 60h
of wetting the soil-biochar mixture to 78% WFPS. The author suggests that
microbial or physical immobilization of NO3- following a biochar application to
the soil may contribute significantly to the reduction of N2O emissions.
Biochar and earthworm effects on soil N2O emissions were studied by
(Augustenborg et al., 2012). It was observed that earthworms increased the N2O
flux in both low and high organic matter soils by more than 12.6 fold and 7.8 fold,
respectively. The large increase in N2O emissions in the presence of earthworms
25

was reduced significantly with the addition of 3 different biochars. This was
attributed to improved aeration after the biochar application. Earthworm gut
and casts can be anaerobic hot spots of denitrification activities (Karsten and
Drake, 1997; Speratti and Whalen, 2008), which suggests N2O produced from
earthworms is also linked to the activity of denitrifiers. Thus, the N2O reduction
in the presence of biochar and earthworms can possibly be attributed to biochar
interactions with the denitirfication processes.
Although in some studies, biochar amendment increased N2O emission;
in others, reduced emissions of N2O were observed. This dichotomy may have
been the result of the complexity of biochar characteristics since they may be
made with different feedstock and applied to soils with various properties. An
initial increase of N2O emissions can be found when biochar made from manure
is applied due to its labile intrinsic N content (Singh et al., 2010b). In the studies
discussed above, observations of suppressed N2O emission mostly coincided
with a relatively high WFPS (from 60% to 80%), in which the anaerobic
environment was favored by denitrification, a dominant source of N2O emission
in soils. It may be assumed that a reduction in N2O emissions after a biochar
amendment of the soil is closely related to denitrification.
2.4 Current research needs
Biochar application to soils may have various effects, both positive and negative.
This might due to the interaction between various soil types and biochar made
26

from different feedstock, different biochar application rates as well as
environmental factors such as rainfall, temperature etc. Positive effects such as
increased soil fertility, improved nutrient retention and reduced greenhouse gas
emissions have been observed in many lab scale experiments and in large scale
field trials. The potential for biochar to reduce greenhouse gas (mainly N2O)
emissions is largely based on observational studies; however, the underlying
mechanisms are poorly understood at this stage (Clough and Condron, 2010).
Hypotheses under current understanding are biochar’s influences on pH;
improved soil aeration; shifts in the N2O/N2 ratio during denitrification and
NH3/NH4+ adsorption to negatively charged biochar surfaces (Van Zwieten et al.,
2009; Clough and Condron, 2010). In this thesis, some of the current hypotheses
for the reduction in N2O production from denitrification in biochar amended soil
will be evaluated.
27

Table 2.1 Product yields from feedstocks under different pyrolysis conditions. Source: Bridgewater (2007)
Pyrolysis
Mode Conditions
Liquid
(Bio-oil)
(%)
Solid
(Biochar)
(%)
Gases
(Syngas)
(%)
Fast Moderate temperature~500 ℃
Short vapor residence time~1 sec 75 12 13
Moderate
Moderate temperature~500 ℃
Moderate vapor residence time~10-
20 sec
50 20 30
Slow
Moderate temperature~500 ℃
Very long vapor residence time~5-30
min
30 35 35
Gasification
High temperature > 750 ℃
Moderate vapor residence time~10-
20 sec
5 10 85
28

Table 2.2 Method of analysis for biochar physico-chemical characterization Physical characterization of biochar
Parameters Method of analysis
Specific surface area (SSA) The specific surface area of biochar was measured by N surface sorption, using a Carlo Erba Sorptomatic 1900 and the Brunauer, Emmett, and Teller (BET) method on 0.2 g of previously degassed sample at 80oC for 24 h (Cabrera et al., 2011).
Proximate analysis (moisture, ash, volatile matter and fixed
C)
Moisture, ash, volatile matter, and fixed C contents of biochars were determined in duplicate by following American Society for Testing and Materials (ASTM) method D5142 using a LECO thermogravimetric analyzer (TGA701, LECO, St. Joseph, MI) (Uchimiya et al., 2012).
Dissolved organic carbon (DOC)
Dissolved organic carbon (DOC) from amendments was characterized and extracted by treatment of 1 g of the sorbent with 20 mL of 0.01 M CaCl2. Suspensions were shaken overnight, centrifuged at 10000 rpm during 10 min, and filtered through a 0.45 μm pore nylon filter. DOC of the extracts was measured with a Shimadzu TOC-V CSH analyzer (Cabrera et al., 2011).
Powder XRD patterns Powder XRD patterns of the prepared biochars were analyzed on a Bruker AXS D8 Advance X-ray diffractiometer (in Bragg-Brentano configuration) equipped with a NaI scintillation detector and diffracted beam graphite monochromator. Cu K R 1, 2 radiation was generated at 40 kV and 40 mA (Yu et al., 2011).
Chemical characterization of biochar
Total elemental composition Elemental composition (CHNSO) was determined by dry combustion using Perkin-Elmer 2400 Series II CHNS/O analyzer (Perkin-Elmer, Shelton, CT)
29

(Uchimiya et al., 2011).
Surface functional group chemistry
Raw biochars were analyzed using a Perkin-Elmer Spectrum 100 ATR-FTIR spectrometer. Briefly, a sample was ground into powder using an agate mortar and then air-dried overnight in an oven at 40oC before each analysis. Scanning of each sample was conducted at a resolution of 2 cm-1. The relative intensities of the spectra allow semi-quantitative analysis on the functional groups, as each run was conducted with a comparable amount of sample in contact with the diamond, coupled with a constant force of 80 N being applied on the sample. Basic data processing included ATR correction, biomass correction, and automatic data smoothing (Wu et al., 2011)
pH The pH was determined by a 1:5 biochar to deionized water slurry (Cabrera et al., 2011).
Cation exchange capacity (CEC)
Cation exchange capacity of the biochars was calculated from the amount of K+ adsorbed at pH 7 (Harvey et al., 2011).
Point of zero charge (pHpcz) The point of zero charge (pHpzc) was determined by a pH drift method. Briefly, 5 mM CaCl2 solution was boiled to remove CO2 and cooled to room temperature. Char sample (0.06 g) was added to 20 mL of the resulting CaCl2 solution preadjusted to pH 4, 6, 8, and 10 using 0.5 M HCl or NaOH, and equilibrated for 24 h by constant stirring in capped glass vials prior to pH measurements. The pHpzc of char was determined as the pH at which the initial pH equals the final pH (Uchimiya et al., 2011).
30

Figure 2.1 Electron micrograph of E. coli adsorbed to activate charcoal cloth with Mg2+ and K+ overpotential supplied Multilayering of cells (white arrow) and the presence of a precipitated material (black arrow) are demonstrated (George and Davies, 1988).
31

Figure 2.2 Visual observation of microorganism colonization on biochar (a) fungal hyphae associated with fresh biochar (Lehmann and Joseph, 2009); (b) microorganisms in fresh corn biochar pores (arrows) (Jin, 2010); (c) 100-year-old char from a forest fire isolated from a frigid entic Haplorthod (Hockaday et al., 2007); (d) 350-year-old char from a forest fire in a Boreal forest soil (Zackrisson et al., 1996).
32
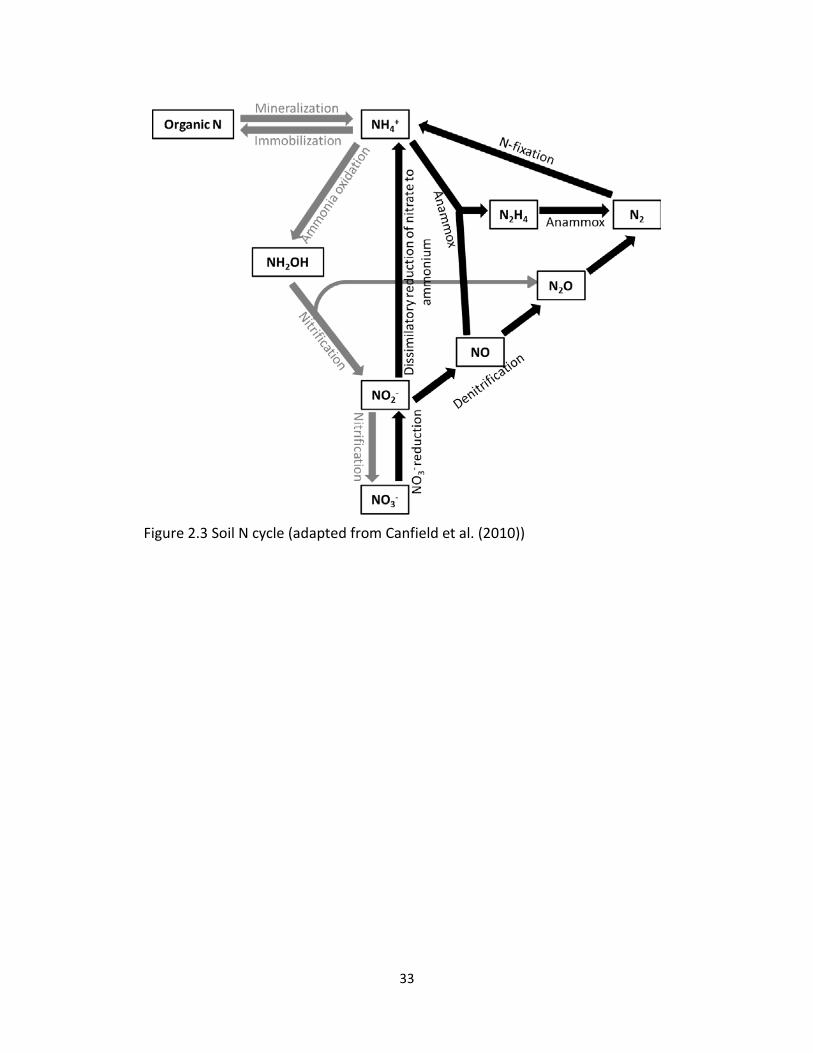
Figure 2.3 Soil N cycle (adapted from Canfield et al. (2010))
33

Figure 2.4 Possible pathways of N2O emissions from soil (adapted from Hu et al., (2012))
34

Figure 2.5 Changes in soil physic-chemical properties and biological processes following biochar addition and the consequent impacts on the soil N cycle
35

CHAPTER III SLOW PYROLYSIS BIOCHAR REDUCES NITROUS OXIDE EMISSION FROM DENITRIFICATION IN A SANDY LOAM
SOIL UNDER LABORATORY CONDITIONS
3.1 Abstract
Biochar as a soil amendment not only benefits agriculture but also the
environment. By reducing the emission of nitrous oxide (N2O), it has great
potential to mitigate climate change, thus there is considerable interest in
applying biochar to agricultural soils. Biochar application modifies the chemical,
physical and biological properties of soil. However, there is limited knowledge on
the biological mechanisms mediated by biochar that control denitrification in
soils. The aim of this study was to determine the influence of pinewood chip
biochar on denitrification in a sandy loam soil, under controlled laboratory
conditions. The experimental unit was a flask containing 20 g of soil (Chicot
sandy loam) mixed with biochar, with the following treatments: 4 biochar rates
(0, 10, 20 and 30 g kg-1 soil), 2 rates of supplemental nitrogen (0 and 5 g NO3--N
kg-1 soil), soil samples from 2 depths (5-30 cm and 40-60 cm), arranged as a full
factorial with 5 replicates. Soil moisture content was adjusted to 80% water-
filled pore space, headspace was flushed with argon and acetylene (10%
headspace) added to half of the experimental units for potential N2O production
measurement and flasks were incubated at 20 oC for 24 hours. Headspace gases
were sampled from each flask at 1, 2, 4 and 6 hours after the incubation ended
and the N2O concentration was measured with a gas chromatograph. In topsoil,
36

there was a maximum reduction of 56% and 88% in potential N2O production
with 30 g kg-1 biochar amendment with, and without, supplemental N,
respectively. Biochar also reduced actual N2O production by around 80% in
topsoil. However, the results did not replicate in subsoil due to a smaller
denitrifier population. The results suggested that the reduction in N2O
production was not due to insufficient NO3--N. Another possible mechanism
such as a pH change may have been induced by the biochar; this should be
investigated further.
3.2 Introduction
Nitrous oxide (N2O) is an important greenhouse gas that has a global warming
potential that is 298 times greater than carbon dioxide over a period of 100
years (Forster et al., 2007). It is also the most important ozone-depleting gas in
the atmosphere and it is expected to remain so throughout the 21st century
(Ravishankara et al., 2009). The level of atmospheric N2O concentration
increased from 270 ± 7 ppm (pre-industrial level) to 314 ppm in 1998 and has
been increasing linearly (by about 0.26 ppm yr-1) since then (Forster et al., 2007).
Anthropogenic sources are responsible for 96% of the total N2O emitted to the
atmosphere, and agricultural soils are the main contributor (USEPA, 2008). For
instance, N2O released from Canadian agricultural soils was responsible for 70%
of the total N2O emissions in 2005 (Environment Canada, 2006). Consequently,
the agricultural sector is searching for innovative ways to reduce soil N2O
37

emissions. N2O is a product of at least three biochemical reactions – ammonia-
oxidation (nitrification); nitrifier-denitrification and denitrification. The first two
reactions occur in aerobic soils, whereas denitrification is the dominant source of
N2O under anaerobic conditions. For instance, Kool et al. (2011) found 92.1% of
the total N2O production was released from denitrification under 90% WFPS.
Since peak N2O fluxes from agricultural soils in the field occur following rainfall
or snowmelt (Speratti et al., 2007; St. Luce et al., 2011), the denitrification
reaction is generally targeted for mitigation of N2O emissions in the field.
Biochar is a soil amendment that has the potential to alter microbial-
mediated reactions leading to N2O production in soils, by modifying soil physical
and -chemical properties or the microbial community structure and functions
(Lehmann and Joseph, 2009). After incubation of an acidic Ferrosol with biochar
made from biosolids (5% by weight), there was an 84% reduction in N2O
production in biochar amended soil compared to the control (Zwieten et al.,
2010). This was attributed to increased adsorption of NO3- by biochar, thus
depleting the NO3- substrate for denitrification in soil solution, as well as an
increase in soil pH. Wang et al. (2011a) incorporated rice husk biochar to paddy
soil, and after 60 days the N2O emission decreased by 51% to 94%, compared to
unamended soils, due to a reduction of soil NH4+-N and NO3
--N concentrations.
Similarly, Taghizadeh-Toosi et al. (2011) found that N2O emissions diminished
with increasing bichar application to a pasture soil amended with ruminant urine
patches during an 86 day spring-summer period. They proposed that the soil
38

inorganic N pool was reduced following the addition of biochar as a result of the
adsorption of NH4+ by biochar. Other studies indicate an inconsistent reduction
or increase in N2O production following the application of biochar. For example,
Singh et al. (2010) found an increase in N2O production during the first 2
wetting-drying cycles and a decrease in N2O production in a subsequent wetting-
drying cycle following the application of poultry manure biochar to an Alfisol and
a Vertisol. This was attributed to the oxidation of the biochar surface over the
study period that could potentially enhance the N adsorption capacity of
biochars. In summary, the evidence to date suggest that a biochar application
may alter the substrate availability (e.g. NO3--N), thereby, changing the efficiency
of denitrification in transforming NO3--N to N2O and N2.
This study aimed to determine (1) if a biochar application could reduce
soil N2O production from denitrification and (2) if NO3--N substrate availability
would affect the production of N2O. The experiment was repeated in topsoil and
subsoil from the same field, which had different initial NO3--N levels and
denitrifier activity. I hypothesize that i) a biochar application to soil leads to
reduced N2O production. ii) Less N2O production is due to insufficient NO3--N.
3.3 Material and methods
3.3.1 Soil and Biochar
Soil from surface (5-30 cm) and subsurface (40-60 cm) was collected in the
autumn of 2009 from a field under corn production for the previous two years,
39

at the Emile A. Lods Agronomy Research Centre of McGill University in Sainte
Anne de Bellevue, Quebec, Canada (45o24’N, 73o56’W). The soil was a Chicot
sandy loam soil (Grey Brown Podzol; fine-loamy, mixed, frigid Typic Hapludalf).
Field-moist soil was passed through a 2 mm mesh sieve, placed in a plastic
container and stored in an unheated building (-5 to 15 oC) for 5 months prior to
the start of the incubation experiment. Topsoil (from 5-30 cm depth) with a
sandy-loam texture (661 g kg-1 sand and 159 g kg-1 clay) was collected by digging
with a shovel. The soil had 11.6 g organic C kg-1, 1.5 g total N kg-1and a pH of 5.4.
Subsoil (from 40-60 cm depth) was excavated using a backhoe. It has a sandy
clay loam texture (623 g kg-1 sand and 214 g kg-1 clay) and contained 4.0 g
organic C kg-1, 0.3 g total N kg-1 and had a pH of 5.6.
The biochar used in this study was made from pinewood chips through a
slow pyrolysis (500 oC for 12 min). Before mixing the biochar with soil, it was
dried at 60 oC for 18 h and finely ground to pass through a 1 mm mesh sieve. The
biochar had a pH of 7.75; other characteristics are reported in Table 3.1.
3.3.2 Experimental design
The laboratory experiment was designed as a full factorial (2 x 4 x 2) with
treatments arranged in a completely randomized block design. The factorial
treatments were: 2 soil types (topsoil from 5-30 cm, subsoil from 40-60 cm), 4
biochar rates (0 g kg-1, 10 g kg-1, 20 g kg-1, and 30 g kg-1) and nitrogen fertilizer
was added as KNO3 solution at 2 rates (0 and 100 mg NO3--N kg-1). Each factorial
40

treatment was replicated 10 times, for a total of 160 experimental units. The
acetylene block method (Balderston et al., 1976; Yoshinari et al., 1977) was used
to block the conversion of N2O to N2, where 10% acetylene was added to half of
the experimental units for potential N2O production measurement. The actual
N2O production was measured in the remaining experimental units.
3.3.3 Procedure and calculations
The experimental unit was a 250 ml Erlenmeyer flask, containing 20 g of oven
dried (105 oC) soil. Soils were moistened to 75% WFPS using distilled water and
pre-incubated at 20 oC for 1 week. Then, biochar treatments (0 g, 10 g, 20 g and
30 g biochar kg-1 soil) were applied to soil and mixed by shaking manually, finally
0.5 ml potassium nitrate solution (KNO3) was added as N source to treatments
receiving 0 and 100 mg NO3--N kg-1 soil. After that distilled water was added to
the soil-biochar mixture to adjust the moisture content to 80% WFPS in all flasks
and the experimental unit was sealed with a suba seal. The headspace of each
flask was flushed with 99% argon for 30 min to create an anaerobic environment.
Half of the replicates in each factorial treatment (n=5) did not receive any
acetylene, which was defined as the actual N2O production. The potential N2O
production was defined as the N2O + N2 production. This was achieved by
removing 10% of the headspace gas with a gas tight syringe and replacing it with
acetone-free acetylene, which was obtained by passing acetylene through a
concentrated sulfuric acid solution followed by a distilled water wash to remove
41

any organic impurities such as acetone, which may serve as a carbon substrate
for denitrifiers (Hyman and Arp, 1987).
Because the flask was sealed (a closed system), the volume of headspace
gas removed by the syringe caused a pressure drop that must be taken into
account in order to collect the desired headspace volume from the flask. This
pressure change was due to the increased volume when the syringe was inserted
into the flask and the headspace gas was extracted. Using the ideal gas law and a
constant temperature between sampling times, the sample volume that must be
collected by the syringe was given by
𝑉𝑠 = 𝐶(100−𝐶)
Vh; C<100 (Equation 1)
where Vs (ml) is the required syringe sample volume, C (%) is the desired
percentage of flask headspace volume to be collected, and Vh (ml) is the
headspace volume of the flask. Hence, if the desired removal percentage is 10%,
with a headspace volume of 236.45ml, the required headspace sample volume is
𝑉𝑠 = 10(100−10)
× 236.45 ml = 26.27 ml
Once the headspace sample was removed, sufficient acetylene was
injected into the flask to adjust the flask headspace to its original pressure. The
volume of acetylene injected, Va, (ml) was given by
Va= 𝐶100
Vh (Equation 2)
In this study, Va= 10100
× 236.45 ml = 23.65 ml
42

The required amount of acetylene and replaced headspace volume was
calculated according to Drury et al. (2007). Headspace volume Vh (ml) was
calculated as the total volume of the incubation flask Vtotal (254 ml) minus the
volumes of soil (Vsoil, 20 g soil divided by particle density of 2.65 g cm-3) and
water (Vwater, on average 10 ml) in the flask (Equation 3). Vtotal (ml) was
determined by subtracting the weight of the empty Erlenmeyer flask and suba
seal from the weight of the weight when the flask was completely filled with
distilled water and the suba seal inserted. A needle was inserted in the suba seal
to help remove the trapped air.
Vh = Vtotal – (Vsoil + Vwater) (Equation 3)
All flasks containing soil-biochar mixtures with and without acetylene
were incubated at 20 oC for 24 h in the dark. Then the flasks were moved to the
laboratory (20 oC) and after 1, 2, 4 and 6 h, headspace gas (9 ml) was taken from
each flask with a gas tight syringe and stored in a pre-evacuated 5.9 ml exetainer
(Labco, Wycombe, UK) with an extra 60 mil Teflon-silicone septa (National
Scientific, Rockwood, TN, USA). They are capable of maintaining 98% of the
vacuum after 136 days of storage (Rochette and Bertrand, 2003). Gas samples
and standards were subsequently analyzed by a Hewlett-Packard-HP 6890 GC
System (Agilent Technologies Inc., Santa Clara, CA, USA) equipped with HP-
PLOT/Q 30 m fused capillary column, 535 µm diameter, with a film thickness of
40 µm (Agilent Technologies Inc., Santa Clara, CA, USA). Helium was used as the
carrier gas with the flow rate of 4.9 ml min-1. The inlet and ECD detector
43

temperature was set at 35 oC and 300 oC, respectively. The oven temperature
was set at a constant of 40 oC for 4 min.
After 24 h incubation, denitrification reached a stable state and the N2O
concentration reached a plateau, thus the N2O concentration was similar at all
headspace gas sampling times (1, 2, 4 and 6 h after the incubation ended,
Appendix A). Here we use the concentration of N2O-N in the headspace gas
collected at 6 h after the incubation ended to calculate the N2O production.
According to Tiedje (1982), the Bunsen absorption coefficient (α=0.632
ml-1 N2O ml-1 water at 20 oC) was used to adjust the volume of N2O evolved to
account for dissolved N2O in soil solution. The volume of N2O evolved at the 6 h
sampling 𝑉𝑁2𝑂 (ml) was given by
𝑉𝑁2𝑂 = 𝐶6[𝑉ℎ + (𝑉𝑤𝑎𝑡𝑒𝑟𝛼)] × 1𝐿1000𝑚𝑙
(Equation 4)
where 𝐶6 (𝜇𝐿 𝑁2𝑂 𝐿−1) is the N2O gas concentration in the gas phase at 6 h after
the incubation ended, 𝑉𝑤𝑎𝑡𝑒𝑟 (ml) is the volume of water in the soil during the
incubation, and α (ml-1 N2O ml-1 water) is the Bunsen absorption coefficient.
The concentration of N2O-N was then calculated using the ideal gas law:
N2O-N = 𝑉𝑁2𝑂 ×𝑃 ×(28.0134 𝑔 N2O−N 𝑚𝑜𝑙−1 )
𝑅 ×𝑇 ×𝑀𝑠 (Equation 5)
where N2O-N (µg N2O-N g-1) is the concentration of N2O-N at 6 h after
incubation ended, 𝑉𝑁2𝑂 (µL) is the volume of N2O in the flask (Equation 4), P is
the pressure in kPa and is assumed to be atmospheric pressure, T is the
temperature in K, and Ms (g) is the oven-dry mass of soil.
44

3.3.4 Soil analysis
Following the last gas sampling (6 h after incubation ended), 100 ml of 2M KCl
was added to the soil-biochar mixture, put on an orbital Shaker and shaken for 1 h
at the speed of 120 rpm, then filtered through Fisherbrand Q5 filter paper
(equivalent to Whatman 42). The extract was analyzed colorimetrically using
Lachat Quick-Chem autoanalyzer (Lachat Instruments, Milwaukee, WI, USA) to
determine of NO3--N concentration (mg NO3
--N L-1). The amount of NO3--N in the
soil SoilNO3−N (mg NO3--N kg-1 soil) was calculated as
SoilNO3−N = �Cs – Cb� × (Vs + Vm)1000 × Ms
(Equation 6)
where Cs is the amount of NO3--N in the extraction (mg NO3
--N L-1), Cb is the
amount of NO3--N in the blank (mg NO3
--N L-1), Vs (L) is the volume of KCl
solution added and Vm (L) is the water content in soil before extraction.
3.3.5 Statistical analysis
Measured N2O-N and NO3--N concentrations obtained from the incubation were
tested for normality using a Shapiro-Wilk test prior to the analysis of variance.
Then the effects of biochar, supplemental N and their interactions on actual and
potential N2O production, and soil NO3--N, were evaluated using the two-way
ANOVA with JMP 8 software (SAS Institute, Inc, Cary, NC, USA). Least square
mean values of significant main effects and interactive effects were compared
with a Tukey's HSD test at P < 0.05.
45

3.4 Results
3.4.1 Actual N2O production
In topsoil, there was a significant reduction in actual N2O production with the
biochar amendment of 20 g and 30 g kg-1 soil, but not in the 10 g kg-1 biochar
treatment, compared to the control; furthermore, supplemental N also exerts a
significant effect on actual N2O production in topsoil (Fig. 3.1, Table 3.2). In
subsoil, no significant effect of biochar or supplemental N was found, but there
was an interactive effect (p=0.026) of biochar and supplemental N on the N2O
production such that the highest N2O production occurred in 20 g kg-1 biochar
treatment with supplemental N and the lowest N2O production was measured in
supplemental N treatment without biochar (Fig. 3.2, Table 3.4). The actual N2O
production was 2 to 5 times less in subsoil than in topsoil.
3.4.2 Potential N2O production
In topsoil, all biochar treatments decreased the potential of N2O production, and
less N2O was produced with increasing the biochar application. There was up to
88.1% reduction in N2O-N with 30 g kg-1 biochar treatment compared to soil
without biochar. Even with 100 mg NO3--N kg-1 supplemental N, 30 g kg-1 biochar
treatment achieved a N2O-N reduction of 56.3% compared to soil without
biochar (Fig. 3.3). Furthermore, the 20 g kg-1 biochar treatments had virtually an
identical efficiency compared to the highest biochar treatments (30 g kg-1) when
46

supplemental nitrogen was added. ANOVA results demonstrated that the
biochar addition had a significant effect on (p=0.0008) N2O production and
supplemental N has the second largest influence (p=0.0044); however, there was
no cross correlation (p=0.3873) between biochar and supplemental N treatment
(Table 3.3).
However, in subsoil, neither biochar nor supplemental N (Table 3.4, Fig.
3.4) affected the N2O production. Different biochar rates had no significant
influence on N2O production whether or not supplemental N was added (Fig.
3.4). The total N2O production was 2 to 8 times greater in topsoil than in subsoil.
3.4.3 Nitrate retention
The NO3--N concentration in topsoil without supplemental NO3
--N was around
30 mg NO3--N kg-1 soil and with supplemental NO3
--N, it was 140 – 150 mg NO3--
N kg-1 soil. There was no difference in NO3--N in topsoil due to biochar
amendment (Fig 3.5). In subsoil without supplemental N, NO3--N was around 17
mg NO3--N kg-1 soil while treatments with supplemental N had around 125 mg
NO3--N kg-1 soil (Fig. 3.6), and there was no change in the NO3
--N concentration
due to biochar treatments.
3.5 Discussion
Biochar reduced both the actual and potential N2O production in the topsoil, but
there was no effect from biochar found in the subsoil. The N2O production was
47

about 3 times less in subsoil (0.85 µg N2O-N g-1 soil) than in topsoil (2.4 µg N2O-
N g-1 soil). While supplemental N increased N2O in topsoil, there was no effect of
biochar or supplemental N on either the actual or potential N2O production in
subsoil. Similar N2O production in subsoil both with and without supplemental
N suggests there might be less denitrification activity due to some limitations
(e.g. insufficient substrate) in the lower soil profile (Fierer et al., 2003; Hunt et al.,
2004).
In topsoil, biochar application had a large impact on actual N2O
production with a maximum reduction of 75%, and with a maximum reduction of
88% on potential N2O production, which is similar to a maximum reduction of 74%
under wetting-drying cycles that was found by Singh et al. (2010), the 50%
reduction in N2O production during spring-summer period reported by
Taghizadeh-Toosi et al. (2011), and a suppression of cumulative N2O production
by 19% to 98% at 78% WFPS found by Case et al. (2012).
Some previous studies attributed the reduction of N2O in biochar-
amended soil to enhanced microbial immobilization (Bruun et al., 2011; Case et
al., 2012). However, no evidence was found in this study since the NO3--N
concentration at the end of the measurement period was not affected by
biochar addition (Fig. 3.5 and 3.6). Other studies proposed that adsorption of
NH4+ by biochar would lower the soil NO3
--N concentration by reducing
nitrification (Singh et al., 2010; Taghizadeh-Toosi et al., 2011). Although I found
that biochar-amended topsoil had lower NH4+ concentration than the control,
48

the result was not replicated in the subsoil (Appendix A), as NH4+ adsorption by
biochar was not conclusive in this study. Still, NH4+ adsorption by biochar in
topsoil did not affect the NO3--N supply (as shown in Fig. 3.5). Since the study
was conducted under anaerobic conditions and in the presence of acetylene, I
expected that nitrification (an aerobic process) would be completely inhibited.
Therefore, the adsorption of NH4+-N by biochar did not affect the NO3
--N
concentration and the resulting N2O production.
In this study, the completely anaerobic condition ensured the inhibition
of aerobic reactions in the N cycle, thus N2O was generated from the
denitrification process. Soil factors that influence denitrification are oxygen
(which is regulated by soil water content), temperature, pH and supply of nitrate
and organic carbon (Mosier et al., 2002). There was ample NO3--N to support
denitrification (25-30 mg NO3--N kg-1 soil), since the threshold for denitrification
occurs below 5 mg NO3--N kg-1 soil (Ryden, 1983); therefore, the reduction in
N2O was not due to insufficient NO3--N. Even when supplemental N was applied,
which gave 30 times more NO3--N than needed for denitrification, biochar
reduced both the actual and the potential N2O production in topsoil. The
reduction of N2O might be due to a change in pH induced by biochar; however,
this requires further investigation.
49

3.6 Conclusion
Our study demonstrated that biochar amendment of soil can reduce the N2O
emission from a denitrification reaction. Biochar had the capacity to adsorb
ammonia (in topsoil) but not the nitrate in either topsoil or subsoil and therefore,
nitrate adsorption was not responsible for reducing N2O production.
Furthermore, no evidence of enhanced N immobilization due to biochar
amendment of soil was found. It is possible that biochar affects the
denitrification process indirectly, by changing the soil pH. This topic will be
addressed in the next chapter.
50
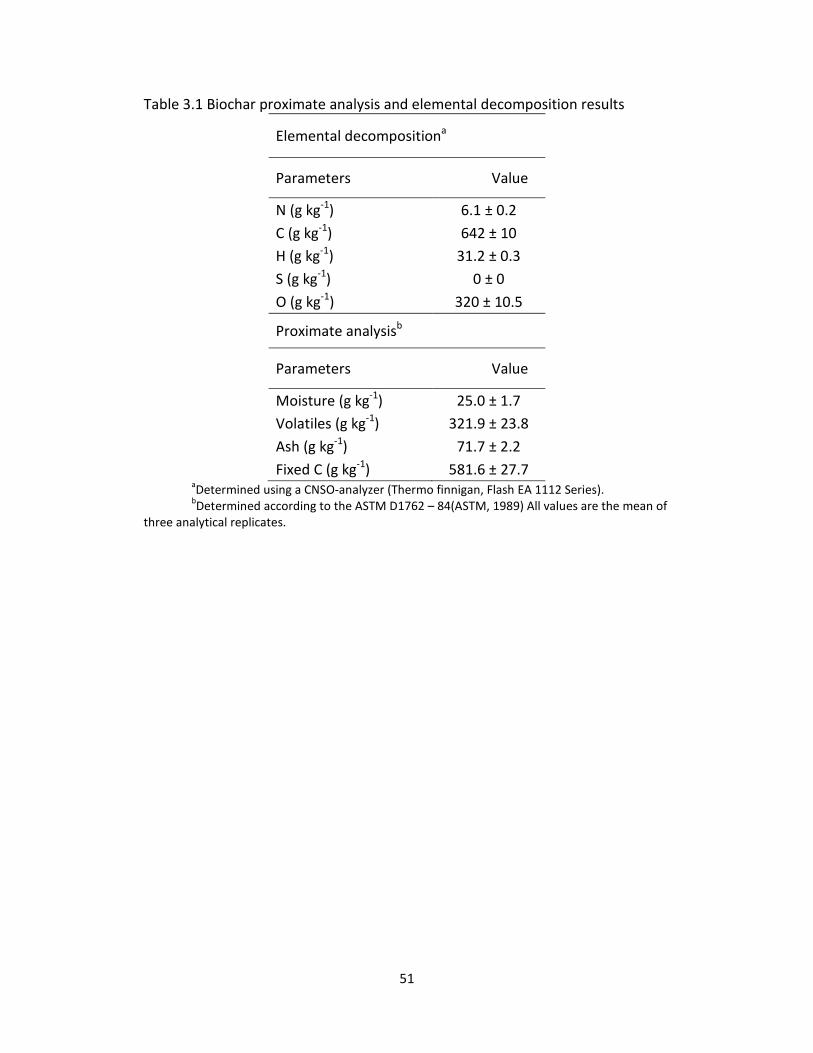
Table 3.1 Biochar proximate analysis and elemental decomposition results
Elemental decompositiona
Parameters Value
N (g kg-1) 6.1 ± 0.2 C (g kg-1) 642 ± 10 H (g kg-1) 31.2 ± 0.3 S (g kg-1) 0 ± 0 O (g kg-1) 320 ± 10.5
Proximate analysisb
Parameters Value
Moisture (g kg-1) 25.0 ± 1.7 Volatiles (g kg-1) 321.9 ± 23.8 Ash (g kg-1) 71.7 ± 2.2 Fixed C (g kg-1) 581.6 ± 27.7
aDetermined using a CNSO-analyzer (Thermo finnigan, Flash EA 1112 Series). bDetermined according to the ASTM D1762 – 84(ASTM, 1989) All values are the mean of
three analytical replicates.
51

Table 3.2 Treatments effect on actual N2O production in topsoil Factors DF F ratio p>F Biochar 3 18.94 <0.0001** Supplemental N 1 5.37 0.0036* Biochar × Supplemental N 3 0.49 0.6952
52

Table 3.3 Treatments effect on potential N2O production in topsoil Factors DF F ratio p>F Biochar 3 7.32 0.0008** Supplemental N 1 9.44 0.0044* Biochar × Supplemental N 3 1.04 0.3873
53

Table 3.4 Treatment effects on actual N2O production in subsoil Factors DF F ratio p>F Biochar 3 0.39 0.7578 Supplemental N 1 1.02 0.3213 Biochar × Supplemental N 3 1.42 0.2556
54

Figure 3.1 Actual N2O production from denitrification in topsoil (30 h after acetylene injection) with and without supplemental nitrate Treatments labeled with different letters are significantly different (p<0.05, Tukey's HSD test).
55

Figure 3.2 Actual N2O production from denitrification in subsoil (30 h after acetylene injection) with and without supplemental nitrate Treatments labeled with different letters are significantly different (p<0.05, Tukey's HSD test).
56

Figure 3.3 Potential N2O production from denitrification in topsoil (30 h after acetylene injection) with and without supplemental nitrate Treatments labeled with different letters are significantly different (p<0.05, Tukey's HSD test).
57
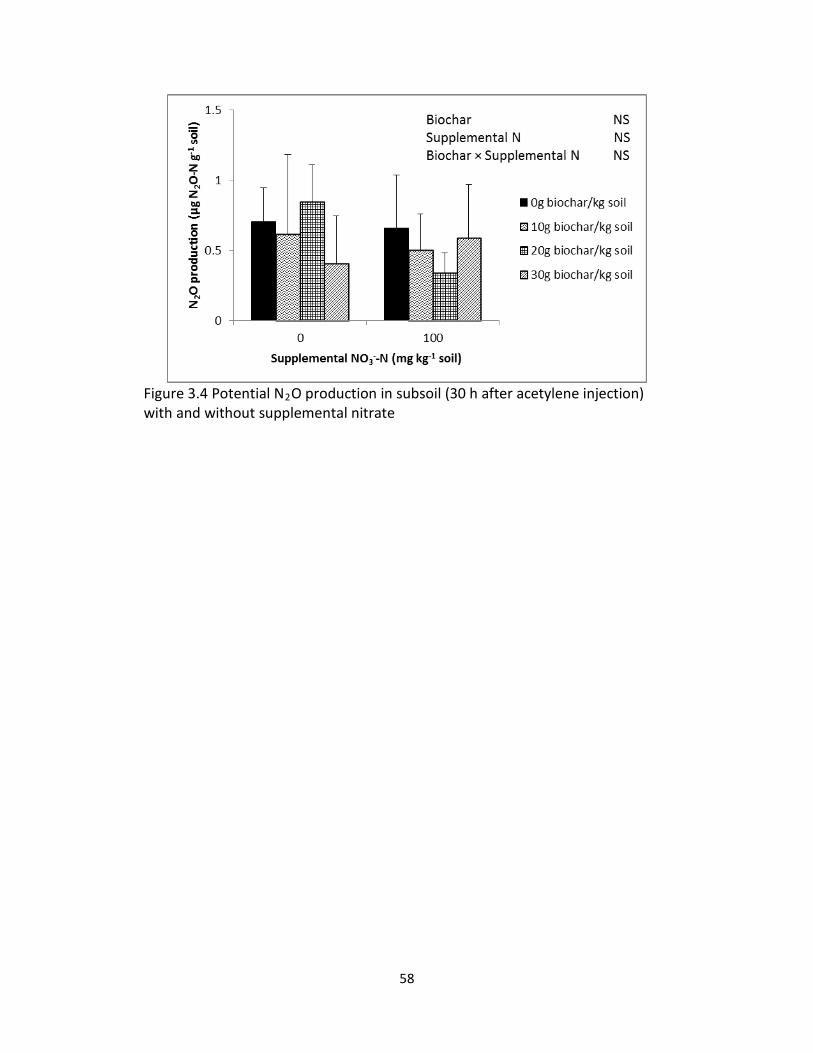
Figure 3.4 Potential N2O production in subsoil (30 h after acetylene injection) with and without supplemental nitrate
58

Figure 3.5 Nitrate concentrations remaining at the end of the headspace gas sampling period (30 h after adding acetylene to pre-incubated (24h) soil-biochar mixtures) in topsoil with and without supplemental N
59
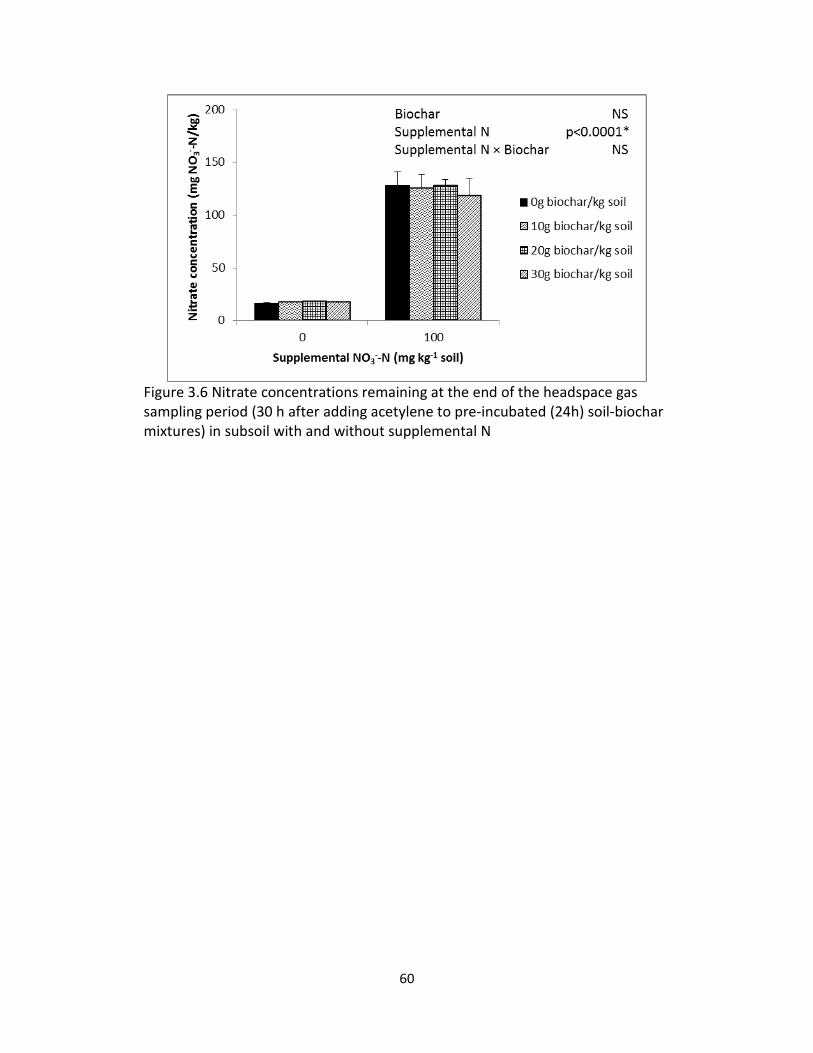
Figure 3.6 Nitrate concentrations remaining at the end of the headspace gas sampling period (30 h after adding acetylene to pre-incubated (24h) soil-biochar mixtures) in subsoil with and without supplemental N
60

CONNECTING PARAGRAPH
In chapter 3, it was determined that soil denitrification leading to N2O
production was influenced by biochar amendment, which is consistent with
reports in the scientific literature. Other authors have proposed that greater
microbial N immobilization and more adsorption of NO3- and NH4
+ in the
presence of biochar would leave less inorganic N for soil denitrifiers. The results
of my study indicate that there was no extra N immobilization in biochar-
amended soil, nor was the level of mineral N (NO3- and NH4
+) reduced, and
therefore, the proposed mechanism does not explain the lower N2O production
in the biochar-amended soil. Biochar induces a change in the soil pH and was
responsible for lowering N2O production from denitrification, and the next
chapter will focus on the way in which soil pH may be controlling soil
denitrification activity in biochar-amended soil.
61

CHAPTER IV BIOCHAR EFFECTS ON BASAL DENITRIFICATION AND DENITRIFICATION POTENTIAL IN LABORATORY
4.1 Abstract
Denitrification leads to the release of nitrous oxide (N2O), a potent greenhouse
gas and ozone-depleting substance. The denitrification rate and the resulting
N2O production in soil is largely mediated by substrate availability; however, soil
pH can directly or indirectly affect microbial denitrifiers and alter N2O
production. The purpose of this study was to determine whether biochar could
alter soil pH and thereby change the potential and basal denitrification rates in
soil. The laboratory experiment was conducted in flasks containing 25 g of
topsoil (0-15 cm) mixed with biochar, with the following treatments: 4 biochar
rates (0, 10, 20 and 30 g kg-1 soil), 2 types of soil (loamy and sandy), arranged as
a full factorial with 5 replicates. A mixed solution (containing 300 µg glucose-C g-1
soil and 50 µg NO3--N g-1 soil) was added to half of the flasks for potential
denitrification (PD) measurement, and basal denitrification (BD) group was
amended with the same amount of distilled water to adjust the soil-biochar
mixture to 90% WFPS. The addition of biochar increased soil pH from 6.08 to
6.44 in the loamy soil and from 5.71 to 6.19 in the sandy soil. Potential
denitrification rate (PDR) and basal denitrification rate (BDR) were not affected
by the biochar amendment in the sandy soil. In loamy soil, PDR was increased
significantly following biochar addition while BDR was not affected. In conclusion,
62
biochar induced an increase in soil pH, which can affect the denitrification rates;
however, this effect is soil-specific.
4.2 Introduction
Denitrification is a microbial mediated process carried out mainly by bacteria,
arhaea and some eukaryotes (e.g., fungi, protozoa, and benthic Foraminifera and
Gromiida) (Canfield et al., 2010). It is governed by various factors such as soil
temperature, moisture, substrate such as nitrate (NO3-) and soil pH, which are
critical for denitrifiers. Biochar is a soil amendment that has the potential to alter
denitrification and reduce N2O production in soils, by modifying the physical and
chemical properties of soil, including the soil pH (Lehmann and Joseph 2009).
Reduced N2O production following the biochar application was attributed to
enhanced microbial N immobilization (Bruun et al., 2011, Case et al., 2012) while
other studies have proposed biochar adsorption of inorganic N (Singh et al., 2010,
Taghizadeh-Toosi et al., 2011). However, in this study, there was no evidence for
microbial immobilization of N or a reduction in NO3--N concentration in biochar-
amended soil (Chapter 3), which lead to the investigation of the effect of biochar
on other factors affecting denitrification.
Soil pH exerts a strong influence in controlling denitrifying enzyme
activity (DEA), potential denitrification and N2O/N2 ratio in this process
(Bergaust et al., 2010). However, the optimal pH range for denitrifiers may differ
among soils (Simek et al., 2002). There was a significant reduction in the
63

denitrification rate with a pH less than 6 or higher than 8.6 (Lee and Rittmann,
2003). Šimek and Hopkins (1999) found the DEA and denitrification potential
increased when the soil was limed. This can be attributed to the pH effect on
denitrification enzymes. Moreover, key enzymes in denitrification which control
the N2O production (nitrite reductase) may be more sensitive to pH changes
(Čuhel et al., 2010). Further study by Cuhel and Simek (2011) found that the
relative N2O production at various pH values did not differ among the soils,
regardless the native denitrifier communities and their intrinsic capability to
reduce NO3- all the way to N2, suggested that the N2O/N2 ratio was not soil
specific but pH specific. These studies implied soil pH played an important role in
controlling N2O production from denitrification. In a study by Ellis et al. (2001),
nitrite reductase from Alcaligenes xylosoxidans was found to have optimum
activity at pH 5.2 which decreased to negligible at pH 8. Hütsch et al. (2002)
found the highest N2O production occurred at pH 5.2 and 5.9 in a sandy and a
loamy arable soil, respectively. Interesting findings by Bergaust et al. (2010)
attributed the inhibition from N2O to N2 to a hinder during the protein synthesis
of N2O reductase due to low pH. However, there was not enough literature to
confirm this.
Biochar exhibit a various range of pH due to diverse production
conditions, most biochars have a neutral to alkaline pH and can increase soil pH
following application to acidic soils (Verheijen et al., 2009, Hass et al., 2012). In
64
summary, to increase denitrification and mitigate the resulting N2O production
through biochar application is applicable.
The objective of this study was to determine the effect of biochar on soil
pH, and to ascertain if biochar-induced changes in soil pH were related to an
increase in soil denitrification rate (basal and potential). The hypothesis of this
study is that the application of biochar to an acidic soil increases the
denitrification rate by increasing the soil pH.
4.3 Material and method
4.3.1 Soils and biochar
Topsoil was collected in the summer of 2012 from an unamended buffer zone
adjacent to two switch grass fields (sandy and loamy), from the Emile A. Lods
Agronomy Research Centre of McGill University in Sainte Anne de Bellevue,
Quebec, Canada (45o24’N, 73o56’W). The sandy soil was classified as a Dystric
Glyeysol while the loamy soil was a Melanic Brunisol. The properties of these
two soils are shown in Table 4.1.
The biochar was the same as that used in the incubation process in
chapter 3, and was grounded to pass through a 1 mm mesh sieve before use.
Detailed biochar characterizations are shown in Table 3.1.
65

4.3.2 Experimental design
The experiment was carried out in 250 ml Erlenmeyer flasks and separated into 2
groups, one was for measuring the denitrification potential (DP), which was
amended with a mixed solution of dextrose and potassium nitrate (300 µg
glucose-C g-1 soil and 50 µg NO3--N g-1 soil) and the other for basal denitrification
(BD) without substrate solution. Both were designed as a full factorial (2 x 4)
with treatments arranged in a completely randomized block design. The
treatments were: 2 soil types (sandy soil and loamy soil), 4 biochar rates (0 g, 10
g, 20 g and 30 g kg-1). Each factorial treatment was replicated 5 times; namely,
there were 40 experimental units in both the BD group and the DP group.
About 25 g of wet soil was weighted to each flask to obtain a sufficient
amount of 20 g dry soil, then the biochar treatments were applied, after that,
the DP group was treated with a mixed solution containing 6.6 mg dextrose
(organic C source) and 1.1 mg potassium nitrate (inorganic N source) to achieve a
nutrient concentration of 300 mg dextrose-C kg-1 soil and 50 mg NO3--N kg-1 soil
and to adjust the moisture content to 90% WFPS. The BD group received no
supplemental C and N. The basal and the potential denitrification rate (BDR and
PDR) were measured as N2O flux and the acetylene block method (Balderston et
al., 1976; Yoshinari et al., 1977) was used to inhibit the conversion of N2O to N2.
66

4.3.3 Procedures and calculations
4.3.3.1 Denitrification rate
The soil- biochar mixtures for the DP and the BD groups were pre-incubated at
20 oC for 24 h. Then, the DP group was moistened with a mixed solution
containing dextrose and potassium nitrate while the BD group received only
water. Due to the different bulk density of the two soils, different amounts of
mixed solution or water were added to adjust the soils to 90% WFPS (9 ml for
loamy soil and 11.5 ml for sandy soil). All flasks were sealed with suba seals. The
headspace of each flask was flushed with 99% argon for 60 min before 10% of
the headspace gas was replaced with acetone-free acetylene which was
obtained by passing acetylene through a concentrated sulfuric acid solution
followed by a distilled water wash to remove any organic impurities such as
acetone, which may serve as a C substrate for denitrifiers (Hyman and Arp, 1987).
Because the flask was sealed (a closed system), the volume of headspace
gas removed by syringe caused a pressure drop that must be taken into account
when collecting the desired headspace volume from the flask. This pressure
change was due to the increased volume when the syringe was inserted into the
flask and the headspace gas was extracted. Using the ideal gas law and a
constant temperature between sampling times, the sample volume that must be
collected by the syringe was given by
𝑉𝑠 = 𝐶(100−𝐶)
Vh; C<100 (Equation 1)
67

where Vs (ml) is the required syringe sample volume, C (%) is the desired
percentage of flask headspace volume to be collected, and Vh (ml) is the
headspace volume of the flask. Hence, if desired removal percentage is 10%,
with a headspace volume of 236.45 ml, the required syringe sample volume is
𝑉𝑠 = 10(100−10)
× 236.45 ml = 26.27 ml
Once the sample was removed, sufficient acetylene was calculated
according to the sample volume and injected back into the flask to adjust the
flask to its original pressure. The volume of acetylene injected, Va, (ml) was given
by
Va= 𝐶100
Vh (Equation 2)
In this study, Va= 10100
× 236.45 ml = 23.65 ml
The required amount of acetylene and replaced headspace volume was
calculated according to Drury et al. (2007). Headspace volume Vh (ml) was
calculated as the total volume of the incubation flask Vtotal (254 ml) minus the
volume of soil (Vsoil, 20 g soil divided by particle density of 2.65 g cm-3) and water
(Vwater, on average 10 ml) in the flask (Equation 3). Vtotal (ml) was determined by
subtracting the weight of the empty Erlenmeyer flask and suba seal from the
weight of the flask when it was completely filled with distilled water and the
suba seal inserted. A needle was inserted into the suba seal to help remove the
trapped air.
Vh = Vtotal – (Vsoil + Vwater) (Equation
3)
68
After acetylene injection, the DP group was shaken to maximize the
utilization of the added carbon and nitrogen. Flasks were shaken on a rotary
shaker at 120 rpm after the argon flush and acetylene replacement were
complete. The shaker was stopped at 1, 2, 3 and 5 h for gas sampling from the
DP group. Since no dextrose or nitrate solution was added in the BD group, the
flasks were incubated and samples were taken without shaking. Gas samples
were taken at 1, 2, 4 and 6 h after the acetylene injection. At every sampling
time, 9 ml headspace gas was taken from each flask using an air-tight syringe.
4.3.3.2 Gas analysis
All the gas samples taken were stored in a pre-evacuated 5.9 ml Labco exetainer
(Labco, Wycombe, UK) with an extra 60 mil Teflon-silicone septa (National
Scientific, Rockwood, TN, USA). They are capable of maintaining 98% of the
vacuum after 136 days of storage (Rochette and Bertrand, 2003). Gas samples
and standards were subsequently analyzed by a gas chromatograph 450-GC
System (Bruker crop., Billerica, MA. USA) equipped with a HAYESED D 2 m
packed column, 200 µm internal diameter, with outer diameter of 1/8 inch
(Agilent Technologies Inc., Santa Clara, CA, USA). An ECD (set at 350 oC) was used
for N2O measurement. Argon was used as the carrier gas with the flow rate of 10
ml min-1. The oven temperature was set constantly at 80 oC for a run time of 4.5
min. Data were recorded and analyzed using the integrated Bruker software
Compas CDS (Version 3.0.0.68)
69

According to Tiedje (1982), the Bunsen absorption coefficient (α=0.632
ml-1 N2O ml-1 water at 20 oC) was used to adjust the volume of N2O evolved to
account for dissolved N2O in the soil solution. The volume of N2O evolved at
time t was given by
VN2Ot = Ct[Vh + (Vwaterα)] × 1 L1000 ml
(Equation 4)
where VN2Ot (µL) is the volume of N2O emitted from soil at time t, Ct
(µL N2O L−1) is the N2O gas concentration in the gas phase at time t (readings
from GC), Vwater (ml) is the volume of water in the soil during the incubation,
and α is the Bunsen absorption coefficient.
The concentration of N2O-N at time t was then calculated using the ideal
gas law:
N2O-Nt = VN2Ot
×P ×(28.0134 g N2O−N mol−1 )
R ×T ×Ms (Equation 5)
where N2O-Nt (µg N2O-N g-1) is the concentration of N2O-N at time t, VN2Ot (µL)
is the volume of N2O in the flask (Equation 4), P is the pressure in kPa and is
assumed to be atmospheric pressure, T is the temperature in K, and Ms (g) is the
oven-dry mass of soil and biochar. Lastly, the N2O-N flux for PDR and BDR (µg
N2O-N g-1 h-1) was calculated as the slope of the linear relationship of N2O-N
concentration with time.
4.3.3.3 Soil pH measurement
To analyze the biochar effect on soil pH, sufficient soil (50 g) was weighed for
each soil type (sandy and loamy) with 0%, 1%, 2% and 3% biochar amendment
70

(treatment S0, S1, S2, S3, L0, L1, L2 and L3). The soil-biochar mixtures were
manually mixed and incubated at 20 oC for 24 hours, which was the same for
both the BD and DP experiments. After that, 3 replications of the 7 g mixture
were weighed out of each treatment and the pH was measured using 1:2 ratio of
soil to deionized water with a pH meter (Fisher Scientific, Accumet pH meter 25,
Ontario, CA).
4.3.4 Statistical analysis
Measured pH and N2O-N concentrations obtained from the incubation were
tested for normality using Shapiro-Wilk test prior to the analysis of variance.
Then the effects of biochar on pH; biochar and pH on basal and potential
denitrification rate were evaluated using the two-way ANOVA with JMP 8
software (SAS Institute, Inc, Cary, NC, USA). Least square mean values of
significant main effects and interactive effects were compared with a Tukey's
HSD test at P < 0.05.
4.4 Results
4.4.1 Biochar and soil pH
The native soil pH was 6.08 and 5.71, respectively, in the loamy and sandy soil,
the biochar addition significantly (p<0.0001) affected the soil pH. There was a
linear increase in soil pH from 6.08 to 6.44 in the loamy soil and from 5.71 to
6.19 in the sandy soil, with more biochar added (Fig 4.1).
71

4.4.2 Effect of biochar on denitrification rates
In the loamy soil, the addition of biochar (10 g, 20 g and 30 g kg-1 soil) exerted a
linear relationship on PDR (p<0.0001), with a 59%, 107%, and 129% increase in
potential denitrification rate relative to the control, the highest rate of 0.6 µg
N2O-N g-1 h-1 observed in the flask containing 30 g kg-1 biochar (Fig 4.2). However,
the result did not replicate in the sandy soil, the PDR was significantly lower
(p<0.05) in the sandy soil than in the loamy soil, the average rate was around 0.2
µg N2O-N g-1 h-1 regardless of the amount of biochar applied. (Fig 4.2, Table 4.2).
The basal denitrification rate was not affected by biochar amendments
(p=0.2648) in the loamy soil, while the rate ranged from 0.003 µg N2O-N g-1 h-1
to 0.011 µg N2O-N g-1 h-1 (Table 4.2). In the sandy soil either (p=0.7456), where
the basal denitrification ranged from 0.007 µg N2O-N g-1 h-1 to 0.05 µg N2O-N g-1
h-1 (Table 4.2). As no substrate was added, the basal denitrification rate was
more than 10 times lower than the potential denitrification rate.
4.4.3 Correlation between between pH and denitrification rate
Non parametric correlations of soil pH and denitrification rates were done using
Hoeffding’s D test. A significant correlation (p<0.0001) was only found between
soil pH and potential denitrification rate in the loamy soil (Table 4.3).
72

4.5 Discussion
In this study, the biochar addition significantly affected the pH in both the loamy
and the sandy soil. This was in agreement with Rodríguez et al. (2012) who found
a pH increase of 0.5 following 50 t ha-1 biochar application and Van Zwieten et al.
(2010) who found soil pH increased with the addition of biochars made from
different feedstock and at a different temperature.
In the loamy soil, PDR but not BDR was significantly increased by biochar;
this was in agreement with Drury et al. (1991) who found basal denitrification
was only correlated to organic C but not pH. However, they claimed that
potential denitrification was not affected by soil pH. Still, the relation between
increased soil pH and increased denitrification potential has been demonstrated
in many studies (S�imek et al., 2000; Čuhel and Šimek, 2011). The increase in PDR
correlated with the increased soil pH following the biochar addition in this study;
this implies that the pH change might be the reason for the higher PDR. Despite
the higher rate of potential denitrification, the N2O production was also
decreased in this study as described in chapter 3. This could be explained as the
higher soil pH reduced the N2O/N2 ratio from denitrification (Čuhel et al., 2010),
as a result of lower nitrite reductase activity due to higher pH (Lojou et al., 2003).
This was confirmed by Ellis et al. (2001) who found the Nitrite reductase from
Alcaligenes xylosoxidans has an optimum activity at pH 5.2 which decreases to a
negligible level at pH 8. However, pH influences on nitrite reductase activity may
require time to occur, and the N2O production at 6 h in the loamy soil increased
73

in this experiment (Appendix B). Further investigation is needed to determine
the time required for this inhibition to take place.
In sandy soil, neither the PDR nor the BDR was affected by biochar
amendment, and the relatively low rate suggested a low DEA. This would
indicate that the denitrification rate response to the biochar addition was also
soil specific. Kunickis et al. (2010) suggested that soil texture had an influence on
soil redox potential and sandy textured soils generally had redox values too high
for denitrification, while clayey textured soils provided lower redox values that
were within the range for this process. Thus, the soil redox value should be taken
into account and measured in future studies to evaluate the biochar influence on
soils.
4.6 Conclusion
In conclusion, PDR in loamy soils increase significantly following biochar
application. Both denitrification potential and basal denitrification were inhibited
in sandy soil regardless of the biochar amendment. The increased PDR in loamy
soil correlated with an increased soil pH induced by biochar which implied the
effect of biochar on PDR was due to the increased pH as had been hypothesized
in this study. Other than a direct influence on soil pH and consequently
denitrification enzyme activity, the biochar might also affect denitrification
indirectly through modifying other soil properties. Thus, more studies are
74

needed to determine other kinetics that may play a role in the denitrification
reaction.
75

Table 4.1 Soil properties
Sand
(g kg-1) Clay
(g kg-1) Bulk density
(g cm-1) pH Sandy
soil 892 14 1.04 5.71 ± 0.02 Loamy
soil 582 165 1.19 6.08 ± 0.02
76
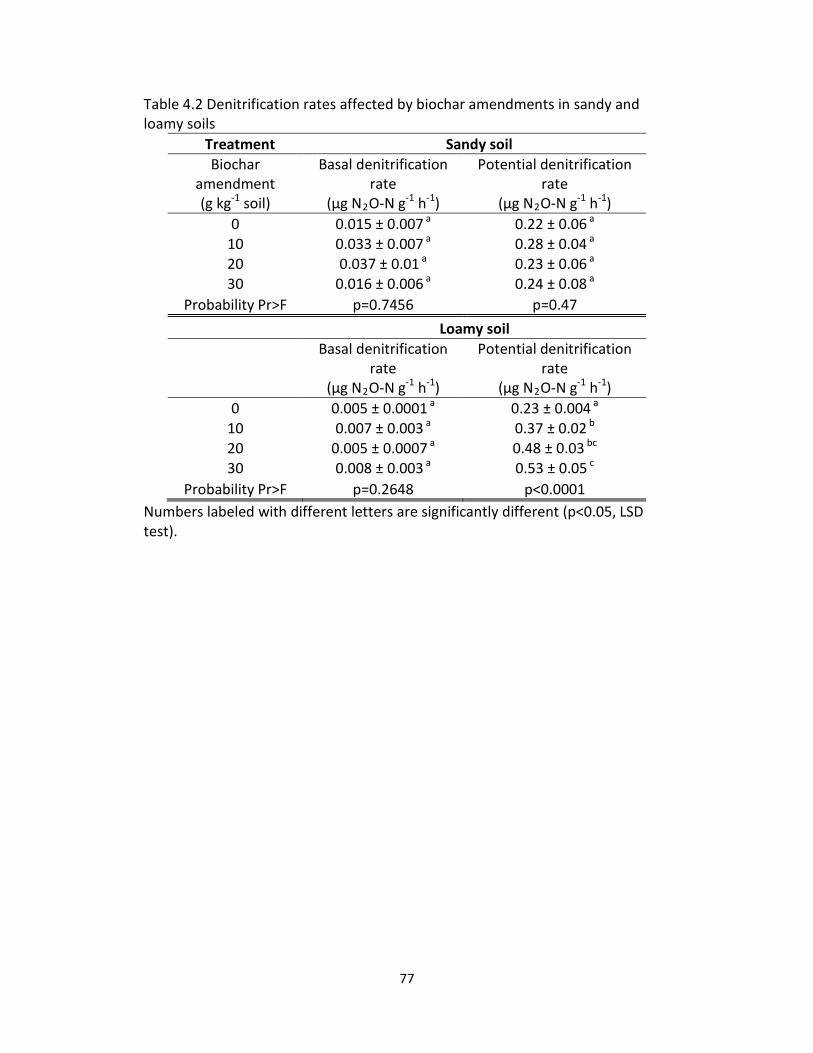
Table 4.2 Denitrification rates affected by biochar amendments in sandy and loamy soils
Treatment Sandy soil Biochar
amendment (g kg-1 soil)
Basal denitrification rate
(µg N2O-N g-1 h-1)
Potential denitrification rate
(µg N2O-N g-1 h-1) 0 0.015 ± 0.007 a 0.22 ± 0.06 a
10 0.033 ± 0.007 a 0.28 ± 0.04 a 20 0.037 ± 0.01 a 0.23 ± 0.06 a 30 0.016 ± 0.006 a 0.24 ± 0.08 a
Probability Pr>F p=0.7456 p=0.47
Loamy soil
Basal denitrification rate
(µg N2O-N g-1 h-1)
Potential denitrification rate
(µg N2O-N g-1 h-1) 0 0.005 ± 0.0001 a 0.23 ± 0.004 a
10 0.007 ± 0.003 a 0.37 ± 0.02 b 20 0.005 ± 0.0007 a 0.48 ± 0.03 bc 30 0.008 ± 0.003 a 0.53 ± 0.05 c
Probability Pr>F p=0.2648 p<0.0001 Numbers labeled with different letters are significantly different (p<0.05, LSD test).
77

Table 4.3 Correlation between soil pH and denitrification rates pH sandy pH loamy
Potential denitrification rate r=-0.0355 r=0.4439*
Basal denitrification rate r=-0.0347 r=-0.0204
* indicate significance at p<0.05
78

Figure 4.1 Change in soil pH following biochar application. Soil-biochar mixtures were incubated at 20 oC for 24 h prior to measuring pH.
79

Figure 4.2 Potential denitrification rate in loamy and sandy soils with different biochar treatments
80

CHAPTER V SUMMARY AND CONCLUSIONS
Biochar is known to increase soil pH and the potential denitrification rate and, it
also reduces N2O emissions from agricultual fields in many cases. Despite a small
increase in the N2O production in the first few hours, biochar’s liming effect can
cause the reduction of N2O production from acidic soils a short time after its
application. The increased soil pH after the application of biochar may play an
important role in denitrification and the production of N2O gas.
The overal objective was to evaluate the efficiency of biochar in reducing
N2O production from Canadian soils and the determination of the contribution
of biochar induced changes in soil properties. The objective was met by carrying
out two laboratory incubation experiments. The first hypothesis that biochar
application to soil leads to reduced N2O production was validafied by the
laboratory experiment in Chapter 3. It was also hypothesized in chapter 3 that
the reduction of N2O production was due to insufficient inorganic N, however, it
was rejected afterwards. The third hypothesis in this thesis was that the
application of biochar to an acidic soil increases the denitrification rate by
increasing the soil pH and as a result of the experiment in chapter 4, and it
turned out to be true.
As the biochar effect on N2O production was seen to be soil dependent,
more soil types should be included in furture research. As a next step, this
experiment should be repeated with more soil types and also with different
crops to confirm the theory proposed in this study. The biochar amendments
81

were found to efficiently reduce the N2O production from the upper profile of
sandy loam soil after 30 h but did not affect the lower soil profile. Furthermore,
biochar affected the denitrification rate in loamy soil but not in sandy soil and
this suggests the biochar effect on N2O production was soil dependent, probably
due to a smaller denitrifier population in subsoil and sandy soil. Thus, the
microbial population should be taken into account in future studies. Another
explanation for unaffected denitrification in the sandy soil proposed by Kunickis
et al. (2010) was the high redox value in sandy soil, which should also be
considered. The reduction of N2O seemed to take place after a certain period of
time following the biochar appication, since NO3- avaiability was not responsible
for less N2O production. Future experiments should focus more on the N2O
production dynamics and use more sampling times to determine the time
requied for the reduction to occur. There also needs to be more field trials on a
larger scale and in natural environmental condition.
Thogether, the results implied the biochar amendment increased the
potential denitrification rate in loamy soil as well as increasing the soil pH; it
inhibited the activity of key enzymes responsible for N2O production from
denitrification, which results in less N2O production. This suggests famers in
Canada may use biochar as an alternative to the conventional liming reagent and
reduce N2O production from acidic soils. Together with biochar’s role in C
sequestrtion, the application of biochar may have a great impact in mitigating
climate change. However, soil with diverse textures may respond differently to
82
biochar amendment. Moreover, biochar induced changes such as changing the
soil pH may have an impact on other soil microorganisms and in turn, it may
influence other soil biological transformations that contribute to the global N
cycle and C cycle. Further investigation is still needed as broader implications
might be discovered with further study of biochar.
83

BIBLIOGRAPHY
Abit, S. M., C. H. Bolster, P. Cai, and S. L. Walker. 2012. Influence of Feedstock and Pyrolysis Temperature of Biochar Amendments on Transport of Escherichia coli in Saturated and Unsaturated Soil. Environ Sci Technol 46: 8097-8105.
Alexandcr, M. 1965. Nitriñcatìon. In W. V. Bartholomew and F. E. Clark (ed.) Soil nitrogen. Agronomy 10:309-335. Am. Soc. of Madison, Wis.Anderson, I. C., M. Poth, J. Homstead, and D. Burdige. 1993. A Comparison of NO and N2O Production by the Autotrophic Nitrifier Nitrosomonas-Europaea and the Heterotrophic Nitrifier Alcaligenes-Faecalis. Appl Environ Microbiol 59: 3525-3533.
Antal, M. J., and M. Gronli. 2003. The art, science, and technology of charcoal production. Ind Eng Chem Res 42: 1619-1640.
Atkinson, C. J., J. D. Fitzgerald, and N. A. Hipps. 2010. Potential mechanisms for achieving agricultural benefits from biochar application to temperate soils: a review. Plant Soil 337: 1-18.
Augustenborg, C. A., S. Hepp, C. Kammann, D. Hagan, O. Schmidt, and C. Müller. 2012. Biochar and Earthworm Effects on Soil Nitrous Oxide and Carbon Dioxide Emissions. J. Environ. Qual. 41: 1203-1209.
Baggs, E. M. 2011. Soil microbial sources of nitrous oxide: recent advances in knowledge, emerging challenges and future direction. Curr Opin Env Sust 3: 321-327.
Balderston, W. L., B. Sherr, and W. J. Payne. 1976. Blockage by Acetylene of Nitrous-Oxide Reduction in Pseudomonas-Perfectomarinus. Appl Environ Microbiol 31: 504-508.
Bateman, E. J., and E. M. Baggs. 2005. Contributions of nitrification and denitrification to N2O emissions from soils at different water-filled pore space. Biol Fert Soils 41: 379-388.
Bergaust, L., Y. J. Mao, L. R. Bakken, and A. Frostegard. 2010. Denitrification Response Patterns during the Transition to Anoxic Respiration and Posttranscriptional Effects of Suboptimal pH on Nitrous Oxide Reductase in Paracoccus denitrificans (vol 76, pg 6387, 2010). Appl Environ Microbiol 76: 8285-8285.
Breuer, L., R. Kiese, and K. Butterbach-Bahl. 2002. Temperature and moisture effects on nitrification rates in tropical rain-forest soils. Soil Sci Soc Am J 66: 834-844.
Bridgewater. 2007. Typical Pyrolysis and Gasification System Characteristics. Briggs, C. M., J. Breiner, and R. C. Graham. 2005. Contributions of Pinus
Ponderosa Charcoal to Soil Chemical and Physical Properties, The ASA-CSSA-SSSA International Annual Meetings Salt Lake City, U.S.A.
Bruun, E. W., D. Muller-Stover, P. Ambus, and H. Hauggaard-Nielsen. 2011a. Application of biochar to soil and N2O emissions: potential effects of
84

blending fast-pyrolysis biochar with anaerobically digested slurry. Eur J Soil Sci 62: 581-589.
Bruun, E. W., H. Hauggaard-Nielsen, N. Ibrahim, H. Egsgaard, P. Ambus, P. A. Jensen, and K. Dam-Johansen. 2011b. Influence of fast pyrolysis temperature on biochar labile fraction and short-term carbon loss in a loamy soil. Biomass and Bioenergy 35: 1182-1189.
Cabrera, A., L. Cox, K. A. Spokas, R. Celis, M. C. Hermosin, J. Cornejo, and W. C. Koskinen. 2011. Comparative Sorption and Leaching Study of the Herbicides Fluometuron and 4-Chloro-2-methylphenoxyacetic Acid (MCPA) in a Soil Amended with Biochars and Other Sorbents. J Agric Food Chem 59: 12550-12560.
Canada, E., G. G. Division, and U. N. F. C. o. C. C. (Organization). 2006. National inventory report : greenhouse gas sources and sinks in Canada. Environment Canada, Ottawa.
Canfield, D. E., A. N. Glazer, and P. G. Falkowski. 2010. The Evolution and Future of Earth's Nitrogen Cycle. Science 330: 192-196.
Carter, J. P., Y. S. Hsiao, S. Spiro, and D. J. Richardson. 1995. Soil and Sediment Bacteria Capable of Aerobic Nitrate Respiration. Appl Environ Microbiol 61: 2852-2858.
Case, S. D. C., N. P. McNamara, D. S. Reay, and J. Whitaker. 2012. The effect of biochar addition on N2O and CO2 emissions from a sandy loam soil – The role of soil aeration. Soil Biology and Biochemistry 51: 125-134.
Chan, K. Y., and Z. H. Xu. 2009. Biochar: nutrient properties and their enhancement, pp. 67-84. In L. J and J. S (eds.), Biochar for environmental management science and technology. Earthscan, London.
Chan, K. Y., L. Van Zwieten, I. Meszaros, A. Downie, and S. Joseph. 2008. Using poultry litter biochars as soil amendments. Aust J Soil Res 46: 437-444.
Cheng, C.-H., J. Lehmann, and M. H. Engelhard. 2008. Natural oxidation of black carbon in soils: Changes in molecular form and surface charge along a climosequence. Geochimica et Cosmochimica Acta 72: 1598-1610.
Cheng, C.-H., J. Lehmann, J. Thies, S. D. Burton, and M. H. Engelhard. 2006. Oxidation of black carbon by biotic and abiotic processes. Organic Geochemistry 37: 1477-1488.
Clough, T. J., and L. M. Condron. 2010. Biochar and the Nitrogen Cycle: Introduction. J Environ Qual 39: 1218-1223.
Čuhel, J., and M. Šimek. 2011. Effect of pH on the denitrifying enzyme activity in pasture soils in relation to the intrinsic differences in denitrifier communities. Folia Microbiologica 56: 230-235.
Čuhel, J., M. Šimek, R. Laughlin, D. Bru, D. Chèneby, C. Watson, and L. Philippot. 2010. Insights into the effect of soil pH on N2O and N2 emissions and denitrifier community size and activity. Appl Environ Microbiol 76: 1870-1878.
85

Deenik, J. L., and A. T. McClellan. Year. Published. The use of biochar as a fertility amendment in tropical soils, pp. 99-105. In, Western nutrient management conference, March 3-4 2011, Reno, Nevada.
Deenik, J. L., T. McClellan, G. Uehara, M. J. Antal, and S. Campbell. 2010. Charcoal Volatile Matter Content Influences Plant Growth and Soil Nitrogen Transformations. Soil Sci. Soc. Am. J. 74: 1259-1270.
Denman, K. L., Brasseur, G., Chidthaisong, A., Ciais, P., Cox, P.M.,Dickinson, R.E., Hauglustaine, D., Heinze, C., Holland, E., Jacob, D., Lohmann, U., Ramachandran, S., Da Silva Dias, P.L., Wofsy, S.C., Zhang, X. 2007. Coupling between changes in the climate system and biogeochemistry.
Dore, J. E., and B. N. Popp. 1998. A large source of atmospheric nitrous oxide from subtropical North Pacific surface waters. Nature 396: 63.
Dorland, S., and E. G. Beauchamp. 1991. Denitrification and Ammonification at Low Soil Temperatures. Canadian Journal of Soil Science 71: 293-303.
Downie, A., A. Crosky, and P. Munroe. 2009. Physical properties of biochar. In J. Lehmann and S. Joseph (eds.), Biochar for Environmental Management: Science and Technology. Earthscan.
Drury, C. F., D. J. McKenney, and W. I. Findlay. 1991. Relationships between denitrification, microbial biomass and indigenous soil properties. Soil Biology and Biochemistry 23: 751-755.
Drury, C. F., D. D. Myrold, E. G. Beauchamp, and W. D. Reynolds. 2007. Denitrification techniques for soils, pp. 471-480. In M. R. Carter and E. G. Gregorich (eds.), Soil Sampling and Methods of Analysis, 2 ed. Taylor & Francis Group, LLC.
Ellis, M. J., F. E. Dodd, R. W. Strange, M. Prudencio, G. Sawers, R. R. Eady, and S. S. Hasnain. 2001. X-ray structure of a blue copper nitrite reductase at high pH and in copper-free form at 1.9 angstrom resolution. Acta Crystallogr D 57: 1110-1118.
Fierer, N., J. P. Schimel, and P. A. Holden. 2003. Variations in microbial community composition through two soil depth profiles. Soil Biology and Biochemistry 35: 167-176.
Forster, P. V. Ramaswamy, P. Artaxo, T. Berntsen, R. Betts, D. W. Fahey, J. Haywood, J. Lean, D. C. Lowe, G. Myhre, J. Nganga, R. Prinn, G. Raga, M. Schulz, and R. Van Dorland. 2007. Changes in Atmospheric Constituents and in Radiative Forcing. In: Climate Change 2007: The Physical Science Basis. In S. Solomon, D. Qin, M. Manning, Z. Chen, M. Marquis, K. B. Averyt, M.Tignor and H. L. Miller [eds.], Contribution of Working Group I to the Fourth Assessment Report of the Intergovernmental Panel on Climate Change. Cambridge University Press, Cambridge, United Kingdom; New York, NY, USA.
George, N., and J. T. Davies. 1988. Parameters Affecting Adsorption of Microorganisms on Activated-Charcoal Cloth. J Chem Technol Biot 43: 173-186.
86

Grossman, J. M., B. E. O'Neill, S. M. Tsai, B. Q. Liang, E. Neves, J. Lehmann, and J. E. Thies. 2010. Amazonian Anthrosols Support Similar Microbial Communities that Differ Distinctly from Those Extant in Adjacent, Unmodified Soils of the Same Mineralogy. Microbial Ecol 60: 192-205.
Grunditz, C., and G. Dalhammar. 2001. Development of nitrification inhibition assays using pure cultures of Nitrosomonas and Nitrobacter. Water Res 35: 433-440.
Guo, Y. P., and D. A. Rockstraw. 2007. Physicochemical properties of carbons prepared from pecan shell by phosphoric acid activation. Bioresource Technology 98: 1513-1521.
Harvey, O. R., B. E. Herbert, R. D. Rhue, and L. J. Kuo. 2011. Metal Interactions at the Biochar-Water Interface: Energetics and Structure-Sorption Relationships Elucidated by Flow Adsorption Microcalorimetry. Environ Sci Technol 45: 5550-5556.
Hass, A., J. M. Gonzalez, I. M. Lima, H. W. Godwin, J. J. Halvorson, and D. G. Boyer. 2012. Chicken manure biochar as liming and nutrient source for acid Appalachian soil. J Environ Qual 41: 1096-1106.
Hiscock, K. M., J. W. Lloyd, and D. N. Lerner. 1991. Review of Natural and Artificial Denitrification of Groundwater. Water Res 25: 1099-1111.
Hockaday, W. C., A. M. Grannas, S. Kim, and P. G. Hatcher. 2007. The transformation and mobility of charcoal in a fire-impacted watershed. Geochimica Et Cosmochimica Acta 71: 3432-3445.
Hossain, M. K., V. Strezov, K. Y. Chan, A. Ziolkowski, and P. F. Nelson. 2011. Influence of pyrolysis temperature on production and nutrient properties of wastewater sludge biochar. J Environ Manage 92: 223-228.
Hu, B. L., L. D. Shen, X. Y. Xu, and P. Zheng. 2011. Anaerobic ammonium oxidation (anammox) in different natural ecosystems. Biochemical Society transactions 39: 1811-1816.
Hu, Z., J. W. Lee, K. Chandran, S. Kim, and S. K. Khanal. 2012. Nitrous Oxide (N2O) Emission from Aquaculture: A Review. Environ Sci Technol 46: 6470-6480.
Hunt, P. G., T. A. Matheny, and K. C. Stone. 2004. Denitrification in a coastal plain riparian zone contiguous to a heavily loaded swine wastewater spray field. J Environ Qual 33: 2367-2374.
Hütsch, B. W., S. Zhang, K. Feng, F. Yan, and S. Schubert. 2002. Effect of pH on denitrification losses from different arable soils, pp. 962-963. In W. J. Horst, M. K. Schenk, A. Bürkert, N. Claassen, H. Flessa, W. B. Frommer, H. Goldbach, H. W. Olfs, V. Römheld, B. Sattelmacher, U. Schmidhalter, S. Schubert, N. Wirén and L. Wittenmayer (eds.), Plant Nutrition, vol. 92. Springer Netherlands.
Hyman, M. R., and D. J. Arp. 1987. Quantification and Removal of Some Contaminating Gases from Acetylene Used to Study Gas-Utilizing Enzymes and Microorganisms. Appl. Environ. Microbiol. 53: 298-303.
87

Jha, P., N. Garg, B. L. Lakaria, A. K. Biswas, and A. S. Rao. 2012. Soil and residue carbon mineralization as affected by soil aggregate size. Soil and Tillage Research 121: 57-62.
Jin, H. 2010. Characterization Of Microbial Life Colonizing Biochar And Biochar-Amended Soils. PhD PhD Dissertation, Cornell University Ithaca, NY.
Karsten, G. R., and H. L. Drake. 1997. Denitrifying bacteria in the earthworm gastrointestinal tract and in vivo emission of nitrous oxide (N2O) by earthworms. Appl Environ Microbiol 63: 1878-1882.
Khahil, M. I., and E. M. Baggs. 2005. CH4 oxidation and N2O emissions at varied soil water-filled pore spaces and headspace CH4 concentrations. Soil Biol Biochem 37: 1785-1794.
Kim, J. S., G. Sparovek, R. M. Longo, W. J. De Melo, and D. Crowley. 2007. Bacterial diversity of terra preta and pristine forest soil from the Western Amazon. Soil Biol Biochem 39: 684-690.
Knowles, R. 1981. Denitrification, pp. 315-329. In F. E. Clark and T. Rosswall (eds.), Terrestrial nitrogen cycles: processes, ecosystem strategies, and management impacts. Swedish Natural Science Research Council.
Knowles, R. 1982. Denitrification. Microbiol Rev 46: 43-70. Kool, D. M., J. Dolfing, N. Wrage, and J. W. Van Groenigen. 2011. Nitrifier
denitrification as a distinct and significant source of nitrous oxide from soil. Soil Biol Biochem 43: 174-178.
Kool, D. M., N. Wrage, S. Zechmeister-Boltenstern, M. Pfeffer, D. Brus, O. Oenema, and J. W. Van Groenigen. 2010. Nitrifier denitrification can be a source of N2O from soil: a revised approach to the dual-isotope labelling method. Eur J Soil Sci 61: 759-772.
Kunickis, S. H., J. W. Gilliam, R. O. Evans, and M. Dukes. 2010. Soil characteristics and their role in developing conditions favorable for denitrification, 19th World Congress of Soil Science, Soil Solutions for a Changing World, Brisbane, Australia.
Law, Y., P. Lant, and Z. G. Yuan. 2011. The effect of pH on N2O production under aerobic conditions in a partial nitritation system. Water Res 45: 5934-5944.
Lee, K. C., and B. E. Rittmann. 2003. Effects of pH and precipitation on autohydrogenotrophic denitrification using the hollow-fiber membrane-biofilm reactor. Water Res 37: 1551-1556.
Lehmann, J., and S. Joseph. 2009. Biochar for environmental management : science and technology, Earthscan, London ; Sterling, VA.
Lehmann, J., D. C. Kern, B. Glaser, and W. I. Woods. 2003. Amazonian Dark Earths: Origin, Properties and Management. In K. A. Publishers [ed.]. The Netherlands.
Lehmann, J., M. C. Rillig, J. Thies, C. A. Masiello, W. C. Hockaday, and D. Crowley. 2011. Biochar effects on soil biota – A review. Soil Biology and Biochemistry 43: 1812-1836.
88

Liang, B., J. Lehmann, D. Solomon, J. Kinyangi, J. Grossman, B. O’Neill, J. O. Skjemstad, J. Thies, F. J. Luizão, J. Petersen, and E. G. Neves. 2006. Black carbon increases cation exchange capacity in soils. Soil Sci Soc Am J 70: 1719-1730.
Liang, B. Q., J. Lehmann, S. P. Sohi, J. E. Thies, B. O'Neill, L. Trujillo, J. Gaunt, D. Solomon, J. Grossman, E. G. Neves, and F. J. Luizao. 2010. Black carbon affects the cycling of non-black carbon in soil. Organic Geochemistry 41: 206-213.
Linn, D. M., and J. W. Doran. 1984. Effect of Water-Filled Pore-Space on Carbon-Dioxide and Nitrous-Oxide Production in Tilled and Nontilled Soils. Soil Sci Soc Am J 48: 1267-1272.
Lojou, E., F. Cutruzzola, M. Tegoni, and P. Bianco. 2003. Electrochemical study of the intermolecular electron transfer to Pseudomonas aeruginosa cytochrome cd(1) nitrite reductase. Electrochim Acta 48: 1055-1064.
Maag, M., and F. P. Vinther. 1996. Nitrous oxide emission by nitrification and denitrification in different soil types and at different soil moisture contents and temperatures. Appl Soil Ecol 4: 5-14.
Major, J., M. Rondon, D. Molina, S. Riha, and J. Lehmann. 2010. Maize yield and nutrition during 4 years after biochar application to a Colombian savanna oxisol. Plant Soil 333: 117-128.
Mann, C. C. 2002. Agriculture - The real dirt on rainforest fertility. Science 297: 920-923.
Mckenney, D. J., C. F. Drury, W. I. Findlay, B. Mutus, T. Mcdonnell, and C. Gajda. 1994. Kinetics of Denitrification by Pseudomonas-Fluorescens - Oxygen Effects. Soil Biol Biochem 26: 901-908.
Miller, M. N., B. J. Zebarth, C. E. Dandie, D. L. Burton, C. Goyer, and J. T. Trevors. 2008. Crop residue influence on denitrification, N2O emissions and denitrifier community abundance in soil. Soil Biol Biochem 40: 2553-2562.
Mosier, A. R., J. W. Doran, and J. R. Freney. 2002. Managing soil denitrification. J Soil Water Conserv 57: 505-513.
Novak, J. M., I. Lima, B. Xing, J. W. Gaskin, C. Steiner, K. C. Das, M. Ahmedna, D. Rehrah, D. W. Watts, W. J. Busscher, and H. Schomberg. 2009. Characterization of Designer Biochar Produced at Different Temperatures and Their Effects on a Loamy Sand. Northeastern University.
O’Neill, B., J. Grossman, M. Tsai, J. Gomes, J. Lehmann, J. Peterson, E. Neves, and J. Thies. 2009. Bacterial Community Composition in Brazilian Anthrosols and Adjacent Soils Characterized Using Culturing and Molecular Identification. Microbial Ecol 58: 23-35.
Ogawa, M. 1994. Symbiosis of people and nature in the tropics. Farming Japan 28: 10-34.
Opdyke, M. R., N. E. Ostrom, and P. H. Ostrom. 2009. Evidence for the predominance of denitrification as a source of N2O in temperate agricultural soils based on isotopologue measurements. Global Biogeochem Cy 23.
89

Otte, S., J. Schalk, J. G. Kuenen, and M. S. M. Jetten. 1999. Hydroxylamine oxidation and subsequent nitrous oxide production by the heterotrophic ammonia oxidizer Alcaligenes faecalis. Appl Microbiol Biotechnol 51: 255-261.
Ottow, J. C. G., and G. Benckiser. 1994. Effect of ecological conditions on total denitrification and N2O release from soils, pp. 251-262, NF 70, Nr. Nova Acta Leopoldina.
Papen, H., R. Vonberg, I. Hinkel, B. Thoene, and H. Rennenberg. 1989. Heterotrophic Nitrification by Alcaligenes-Faecalis - NO2
-, NO3-, N2O, and
NO Production in Exponentially Growing Cultures. Appl Environ Microbiol 55: 2068-2072.
Pathak, H. 1999. Emissions of nitrous oxide from soil. Curr Sci India 77: 359-369. Patureau, D., E. Zumstein, J. P. Delgenes, and R. Moletta. 2000. Aerobic
denitrifiers isolated from diverse natural and managed ecosystems. Microbial Ecol 39: 145-152.
Paul, E. A., and F. E. Clark. 1996. Soil microbiology and biochemistry, 2nd ed. Academic Press, San Diego.
Pfenning, K. S., and P. B. McMahon. 1997. Effect of nitrate, organic carbon, and temperature on potential denitrification rates in nitrate-rich riverbed sediments. Journal of Hydrology 187: 283-295.
Pietikäinen, J., O. Kiikkilä, and H. Fritze. 2000. Charcoal as a Habitat for Microbes and Its Effect on the Microbial Community of the Underlying Humus. Oikos 89: 231-242.
Poth, M., and D. D. Focht. 1985. N-15 Kinetic-Analysis of N2O Production by Nitrosomonas-Europaea - an Examination of Nitrifier Denitrification. Appl Environ Microbiol 49: 1134-1141.
Preston, C. M., and M. W. I. Schmidt. 2006. Black (pyrogenic) carbon: a synthesis of current knowledge and uncertainties with special consideration of boreal regions. Biogeosciences 3: 397-420.
Ravishankara, A. R., J. S. Daniel, and R. W. Portmann. 2009. Nitrous oxide (N2O): the dominant ozone-depleting substance emitted in the 21st century. Science 326: 123-125.
Ritchie, G. A. F., and D. J. D. Nicholas. 1972. Identification of the sources of nitrous oxide produced by oxidative and reductive processes in Nitrosomonas europaea. Biochemical Journal 126: 1181-1191.
Robertson, L. A., and J. G. Kuenen. 1991. Physiology of nitrifying and denitrifying bacteria, pp. 189-199. In J. E. Rogers and W. B. Whitman (eds.), Microbial production and consumption of greenhouse gases: Methane, nitrogen oxides, and halomethanes. Am. Soc. of Microbiol., Washington, DC.
Rochette, P., and N. Bertrand. 2003. Soil air sample storage and handling using polypropylene syringes and glass vials. Canadian Journal of Soil Science 83: 631-637.
90

Rodríguez, L., P. Salazar, and T. R. Preston. 2012. Effect of biochar and biodigester effluent on growth of maize in acid soils. Livestock Research for Rural Development 21.
Rondon, M. A., J. Lehmann, J. Ramírez, and M. Hurtado. 2007. Biological nitrogen fixation by common beans (Phaseolus vulgaris L.) increases with bio-char additions. Biol Fert Soils 43: 699-708.
Ryden, J. C. 1983. Denitrification loss from a grassland soil in the field receiving different rates of nitrogen as ammonium nitrate. Journal of Soil Science 34: 355-365.
Sahrawat, K. L. 1982. Nitrification in Some Tropical Soils. Plant Soil 65: 281-286. Saito, M., and T. Marumoto. 2002. Inoculation with arbuscular mycorrhizal fungi:
the status quo in Japan and the future prospects. Plant Soil 244: 273-279. Schmidt. 1982. Nitrification in soil, ASA, CSSA, SSSA, Madison. Schmidt, C. S., D. J. Richardson, and E. M. Baggs. 2011. Constraining the
conditions conducive to dissimilatory nitrate reduction to ammonium in temperate arable soils. Soil Biology and Biochemistry 43: 1607-1611.
Shaw, L. J., G. W. Nicol, Z. Smith, J. Fear, J. I. Prosser, and E. M. Baggs. 2006. Nitrosospira spp. can produce nitrous oxide via a nitrifier denitrification pathway. Environmental Microbiology 8: 214-222.
Simek, M., and J. E. Cooper. 2002. The influence of soil pH on denitrification: progress towards the understanding of this interaction over the last 50 years. Eur J Soil Sci 53: 345-354.
Simek, M., L. Jsova, and D. W. Hopkins. 2002. What is the so-called optimum pH for denitrification in soil? Soil Biology and Biochemistry 34: 1227-1234.
Šimek, M., and D. W. Hopkins. 1999. Regulation of potential denitrification by soil pH in long-term fertilized arable soils. Biol Fert Soils 30: 41-47.
S�imek, M., J. E. Cooper, T. Picek, and H. S�antrůck̆ová. 2000. Denitrification in arable soils in relation to their physico-chemical properties and fertilization practice. Soil Biology and Biochemistry 32: 101-110.
Singh, B., B. P. Singh, and A. L. Cowie. 2010a. Characterisation and evaluation of biochars for their application as a soil amendment. Aust J Soil Res 48: 516-525.
Singh, B. P., B. J. Hatton, S. Balwant, A. L. Cowie, and A. Kathuria. 2010b. Influence of biochars on nitrous oxide emission and nitrogen leaching from two contrasting soils. J Environ Qual 39: 1224-1235.
Smith, M. S., and J. M. Tiedje. 1979. Phases of Denitrification Following Oxygen Depletion in Soil. Soil Biol Biochem 11: 261-267.
Sohi, Loez-Capel, Krull, and Bol. 2009. Biochar's roles in soil and climate change: A review of research needs. In E. Krull [ed.], CSIRO Land and Water Science Report. CSIRO.
Speratti, A. B., and J. K. Whalen. 2008. Carbon dioxide and nitrous oxide fluxes from soil as influenced by anecic and endogeic earthworms. Appl Soil Ecol 38: 27-33.
91

Speratti, A. B., J. K. Whalen, and P. Rochette. 2007. Earthworm influence on carbon dioxide and nitrous oxide fluxes from an unfertilized corn agroecosystem. Biol Fert Soils 44: 405-409.
St. Luce, M., J. K. Whalen, N. Ziadi, and B. J. Zebarth. 2011. Nitrogen dynamics and indices to predict soil nitrogen supply in humid temperate soils, pp. 55-102, Advances in Agronomy, vol. 112.
Stanford, G., S. Dzienia, and R. A. Vanderpol. 1975. Effect of Temperature on Denitrification Rate in Soils. Soil Sci Soc Am J 39: 867-870.
Steiner, C., B. Glaser, W. G. Teixeira, J. Lehmann, W. E. H. Blum, and W. Zech. 2008. Nitrogen retention and plant uptake on a highly weathered central Amazonian Ferralsol amended with compost and charcoal. Journal of Plant Nutrition and Soil Science 171: 893-899.
Sun, H., W. C. Hockaday, C. A. Masiello, and K. Zygourakis. 2010. Published. Physical and Chemical Structure of Biochars Produced From Different Feedstocks and Under a Variety of Pyrolysis Conditions. In, Catalysis and Reaction Engineering Division, November 7-12 2010, Salt Lake City, UT.
Swerts, M., R. Merckx, and K. Vlassak. 1996. Denitrification, N-2-fixation and fermentation during anaerobic incubation of soils amended with glucose and nitrate. Biol Fert Soils 23: 229-235.
Taghizadeh-Toosi, A., T. J. Clough, L. M. Condron, R. R. Sherlock, C. R. Anderson, and R. A. Craigie. 2011. Biochar Incorporation into Pasture Soil Suppresses in situ Nitrous Oxide Emissions from Ruminant Urine Patches. J Environ Qual 40: 468-476.
Tanaka, Mineki, and GotoYoshizawa. 2011. Soil aggregation by using biochar and/or compost in farmland, Asia Pacific Biochar Conference, Kyoto, Japan.
Thies, J. E., and M. C. Rillig. 2009. Characteristics of Biochar - Biological Properties, pp. 85-106. In J. Lehmann and J. S. (eds.), Biochar for Environmental Management: Science and Technology. Earthscan, London, UK.
Thomas, K. L., D. Lloyd, and L. Boddy. 1994. Effects of Oxygen, Ph and Nitrate Concentration on Denitrification by Pseudomonas Species. Fems Microbiol Lett 118: 181-186.
Tiedje, J. M. 1982. Denitrification, pp. 1011-1026. In A. Klute and A. L. Page (eds.), Methods of soil analysis, 2nd ed. American Society of Agronomy : Soil Science Society of America, Madison, Wis.
Tiedje, J. M. 1988. Ecology of denitrification and dissimilatory nitrate Kramer, M., and R. Conrad. 1991. Influence of oxygen on production reduction to ammonium, pp. 179-244. In A. J. B. Zehnder (ed.), Biology of anaerobic microorganisms. John Wiley & Sons, New York.
Topoliantz, S., and J. F. Ponge. 2005. Charcoal consumption and casting activity by Pontoscolex corethrurus (Glossoscolecidae). Applied Soil Ecology 28: 217-224.
92

Uchimiya, M., D. I. Bannon, and L. H. Wartelle. 2012. Retention of Heavy Metals by Carboxyl Functional Groups of Biochars in Small Arms Range Soil. J Agric Food Chem.
Uchimiya, M., L. H. Wartelle, K. T. Klasson, C. A. Fortier, and I. M. Lima. 2011. Influence of Pyrolysis Temperature on Biochar Property and Function as a Heavy Metal Sorbent in Soil. J Agric Food Chem 59: 2501-2510.
USEPA. 2008. Inventory of U.S. greenhouse gas emissions and sinks : 1990-2010. U.S. Environmental Protection Agency, Washington, D.C.
Vaccari, F. P., S. Baronti, E. Lugato, L. Genesio, S. Castaldi, F. Fornasier, and F. Miglietta. 2011. Biochar as a strategy to sequester carbon and increase yield in durum wheat. Eur J Agron 34: 231-238.
Van Zwieten, L., B. Singh, S. Jospeh, S. Kimber, A. Cowie, and K. Y. Chan. 2009. Biochar and emissions of non-CO2 greenhouse gases from soil, pp. 227-249. In J. Lehmann and S. Joseph (eds.), Biochar for environmental anagement: Science and technology. Earthscan, London, UK.
Van Zwieten, L., S. Kimber, S. Morris, A. Downie, E. Berger, J. Rust, and C. Scheer. 2010. Influence of biochars on flux of N2O and CO2 from Ferrosol. Aust J Soil Res 48: 555-568.
Verheijen, S. Jeffery, A.C. Bastos, M. van der Velde, and I. Diafas. 2010. Biochar Application to Soils: A Critical Scientific Review of Effects on Soil Properties, Processes and Functions.
Verheijen, F. G. A., S. Jeffery, A. C. Bastos, M. van der Velde, and I. Diafas. 2009. Biochar Application to Soils - A Critical Scientific Review of Effects on Soil Properties, Processes and Functions. Joint Research Centre scientific and technical reports: 149.
Wang, J., M. Zhang, Z. Xiong, P. Liu, and G. Pan. 2011a. Effects of biochar addition on N2O and CO2 emissions from two paddy soils. Biol Fert Soils 47: 887-896.
Wang, T., M. Camps-Arbestain, M. Hedley, and P. Bishop. 2011b. Nitrogen forms and availability in biochars: results from a short-term incubation study pp. Sept 15-18, Asia Pacific Biochar Conference, Kyoto, Japan.
Warnock, D. D., J. Lehmann, T. W. Kuyper, and M. C. Rillig. 2007. Mycorrhizal responses to biochar in soil- Concepts and mechanisms. Plant and Soil 300: 9-20.
Weiming, Z., and C. Wenfu. 2011. Application Effect of Biochar on Rice. New Technology of Agricultural Engineering (ICAE)
Wrage, N., G. L. Velthof, M. L. van Beusichem, and O. Oenema. 2001. Role of nitrifier denitrification in the production of nitrous oxide. Soil Biol Biochem 33: 1723-1732.
Wu, H., K. Yip, Z. Kong, C.-Z. Li, D. Liu, Y. Yu, and X. Gao. 2011. Removal and Recycling of Inherent Inorganic Nutrient Species in Mallee Biomass and Derived Biochars by Water Leaching. American Chemical Society.
93

Yanai, Y., K. Toyota, and M. Okazaki. 2007. Effects of charcoal addition on N2O emissions from soil resulting from rewetting air-dried soil in short-term laboratory experiments. Soil Science & Plant Nutrition 53: 181-188.
Yoshinari, T., R. Hynes, and R. Knowles. 1977. Acetylene inhibition of nitrous oxide reduction and measurement of denitrification and nitrogen fixation in soil. Soil Biology and Biochemistry 9: 177-183.
Yu, J. T., A. M. Dehkhoda, and N. Ellis. 2011. Development of Biochar-based Catalyst for Transesterification of Canola Oil. Energ Fuel 25: 337-344.
Zackrisson, O., M. C. Nilsson, and D. A. Wardle. 1996. Key ecological function of charcoal from wildfire in the Boreal forest. Oikos 77: 10-19.
Zimmerman, A. R. 2010. Abiotic and Microbial Oxidation of Laboratory-Produced Black Carbon (Biochar). Environ Sci Technol 44: 1295-1301.
Zwieten, L. v., S. Kimber, S. Morris, A. Downie, E. Berger, J. Rust, and C. Scheer. 2010. Influence of biochars on flux of N2O and CO2 from Ferrosol. Aust J Soil Res 48: 555-568.
94

Appendix A. N2O concentration in treatments at all sampling times and ammonium concentrations after gas sampling
95

Table A1 Actual N2O-N concentration in subsoil at all sampling times (25, 26, 28 and 30 h after acetylene injection).
SUBSOIL Actual N2O-N production at each sampling time 25 26 28 30
0%biochar 0.67 ± 0.37 0.27 ± 0.12 0.84 ± 1.08 0.23 ± 0.17 0%biochar+N 0.11 ± 0.09 0.02 ± 0.01 0.21 ± 0.14 0.37 ± 0.24 1%biochar 0.18 ± 0.13 0.12 ± 0.12 0.19 ± 0.13 0.19 ± 0.12 1%biochar+N 0.29 ± 0.27 0.43 ± 0.34 0.29 ± 0.26 0.32 ± 0.27 2%biochar 0.3 ± 0.17 0.33 ± 0.15 0.17 ± 0.11 0.18 ± 0.12 2%biochar+N 0.60 ± 0.41 0.72 ± 0.30 0.52 ± 0.21 0.53 ± 0.20 3%biochar 0.97 ± 1.20 1.07 ± 1.16 0.21 ± 0.15 0.21 ± 0.13 3%biochar+N 0.25 ± 0.19 0.29 ± 0.27 0.11 ± 0.15 0.12 ± 0.16
Potential N2O-N production at each sampling time 25 26 28 30 0%biochar 0.63 ± 0.43 0.56 ± 0.15 0.52 ± 0.14 0.70 ± 0.24 0%biochar+N 0.88 ± 1.01 0.55 ± 0.35 0.69 ± 0.42 0.66 ± 0.38 1%biochar 0.48 ± 0.23 0.42 ± 0.44 0.58 ± 0.57 0.62 ± 0.56 1%biochar+N 0.45 ± 0.29 1.07 ± 1.02 0.46 ± 0.23 0.50 ± 0.26 2%biochar 0.50 ± 0.19 1.32 ± 1.40 0.80 ± 0.26 0.85 ± 0.26 2%biochar+N 0.38 ± 0.19 0.39 ± 0.19 0.36 ± 0.15 0.34 ± 0.15 3%biochar 0.34 ± 0.22 0.40 ± 0.22 0.36 ± 0.31 0.41 ± 0.34 3%biochar+N 0.34 ± 0.27 0.47 ± 0.31 0.52 ± 0.34 0.59 ± 0.38
96

Table A2 Actual N2O-N concentration in topsoil at all sampling times (25, 26, 28 and 30 h after acetylene injection).
TOPSOIL Actual N2O-N production at each sampling time 25 26 28 30
0%biochar 1.27 ± 0.45 1.39 ± 0.57 1.53 ± 0.65 1.38 ± 0.55 0%biochar+N 2.85 ± 0.97 2.46 ± 0.48 2.73 ± 0.57 2.57 ± 0.45 1%biochar 2.53 ± 1.00 1.69 ± 0.67 1.88 ± 0.69 1.67 ± 0.58 1%biochar+N 2.93 ± 0.43 2.64 ± 0.53 N/A 2.70 ± 0.42 2%biochar 0.57 ± 0.37 0.74 ± 0.22 0.56 ± 0.28 0.51 ± 0.29 2%biochar+N 0.61 ± 0.41 1.20 ± 1.06 0.60 ± 0.42 0.53 ± 0.45 3%biochar 0.31 ± 0.22 0.78 ± 0.63 0.35 ± 0.25 0.32 ± 0.20 3%biochar+N 0.89 ± 0.55 0.92 ± 0.60 0.91 ± 0.58 0.84 ± 0.54
Potential N2O-N production at each sampling time 25 26 28 30 0%biochar 1.92 ± 0.66 2.03 ± 0.76 2.19 ± 0.92 1.94 ± 0.83 0%biochar+N 2.41 ± 0.57 2.28 ± 0.49 2.87 ± 0.69 2.39 ± 0.59 1%biochar 1.51 ± 0.79 1.82 ± 1.58 1.56 ± 0.84 1.36 ± 0.65 1%biochar+N 1.51 ± 0.63 1.51 ± 0.62 1.59 ± 0.71 1.54 ± 0.57 2%biochar 0.54 ± 0.20 0.70 ± 0.12 0.60 ± 0.19 0.52 ± 0.24 2%biochar+N 1.48 ± 0.78 2.02 ± 0.68 1.70 ± 0.91 1.58 ± 0.86 3%biochar 0.22 ± 0.08 0.37 ± 0.11 0.26 ± 0.11 0.11 ± 0.11 3%biochar+N 1.33 ± 0.86 1.33 ± 0.87 1.22 ± 0.86 1.22 ± 0.81
97

Figure A1 Ammonium concentrations remaining at the end of the headspace gas sampling period (30 h after adding acetylene to pre-incubated (24h) soil-biochar mixtures) in topsoil for potential N2O production measurement with and without supplemental N.
98

Figure A2 Ammonium concentrations remaining at the end of the headspace gas sampling period (30 h after adding acetylene to pre-incubated (24h) soil-biochar mixtures) in subsoil for potential N2O production measurement with and without supplemental N.
99

Appendix B. N2O production after 6 h of incubation
100

Figure B1 N2O production at 6 h after incubation in sandy and loamy soils
101