Embed Size (px)
Citation preview

NASATechnical Memorandum 87237
USAAVSCOMTechnical Report 85-C-21
Effect of Area Ratio on the Performance of a5.5:1 Pressure Ratio Centrifugal Impeller
(NASA-TM-87237) E F F E C T OF * f c £ A aATIO ON Till, N b b - 1 9 2 9 0P E R F O R M A N C E Of A 5.5: 1 P R E S b U E F , RATIOC E N T R I F U G A L I K P E L L E R ( N A S A ) 40 pHC A 0 3 / M F &01 CSCL 0 1A Unclas
G3/02 05562
Lawrence F. Schumann and David A. ClarkPropulsion DirectorateU.S. Army Aviation Research and Technology Activity—AVSCOMLewis Research CenterCleveland, Ohio
and
Jerry R. WoodLewis Research CenterCleveland, Ohio
Prepared for the31st International Gas Turbine Conference and Exhibitionsponsored by the American Society of Mechanical EngineersDusseldorf, West Germany, June 8-12, 1986
NASA
https://ntrs.nasa.gov/search.jsp?R=19860009819 2020-05-12T03:36:59+00:00Z

EFFECT OF AREA RATIO ON THE PERFORMANCE OF A 5.5:1 PRESSURE
f ' ' . 'RAT 10 -CENTRIFUGAL IMPELLER1
Lawrence F. Schumann and David A. ClarkPropulsion Directorate . .
U. S. Army Aviation Research and Technology' Activity - AVSCOMLewis Research CenterCleveland, Ohio 44135
and
Jerry R.' WoodNational Aeronautics and Space Administration
Lewis Research CenterCleveland, Ohio 44135
SUMMARY
A centrifugal Impeller which was Initially designed for a pressure ratioof approximately 5.5 and a mass flow rate of 0.959 kg/sec was tested with avaneless dlffuser for a range of design point Impeller area ratios from 2.322to 2.945. The Impeller area ratio was changed by successively cutting, back theImpeller exit axial width from an Initial value of 7.57 mm to a final value of5.97 mm. In all, four separate area ratios were tested. For each area ratioa series of Impeller exit axial clearances was also tested. Test results arebased on impeller exit surveys of total pressure, total temperature, and flowangle at a radius 1.115 times the Impeller exit radius.
Results of the tests at design speed, peak efficiency, and an exit tipclearance of 8 percent of exit blade height show that, the impeller equivalentpressure recovery coefficient peaked at a design point area ratio of approxi-mately 2.748 while the Impeller aerodynamic efficiency peaked at a lower valueof area ratio of approximately 2.55. The variation of impeller efficiencywith clearance showed expected trends with a loss of approximately 0.4, pointsin impeller efficiency for each percent increase in exit axial tip clearancefor all Impellers tested. The data also Indicated that the impeller wouldprobably separate at design area ratios greater than 2.748. An analysis wasperformed with a quasi- three-dimensional invlscid computer code which, con-firmed that a minimum velocity ratio was attained near this area ratio thusindicating separation. This data can be used to verify impeller flow modelswhich attempt to account for very high diffusion and possible separation.
NOMENCLATURE
A geometric area, m?
AR impeller equivalent area ratio at design flow rate, ^p
AIJ impeller Inlet tip flow area, iri
b Impeller blade height, mm
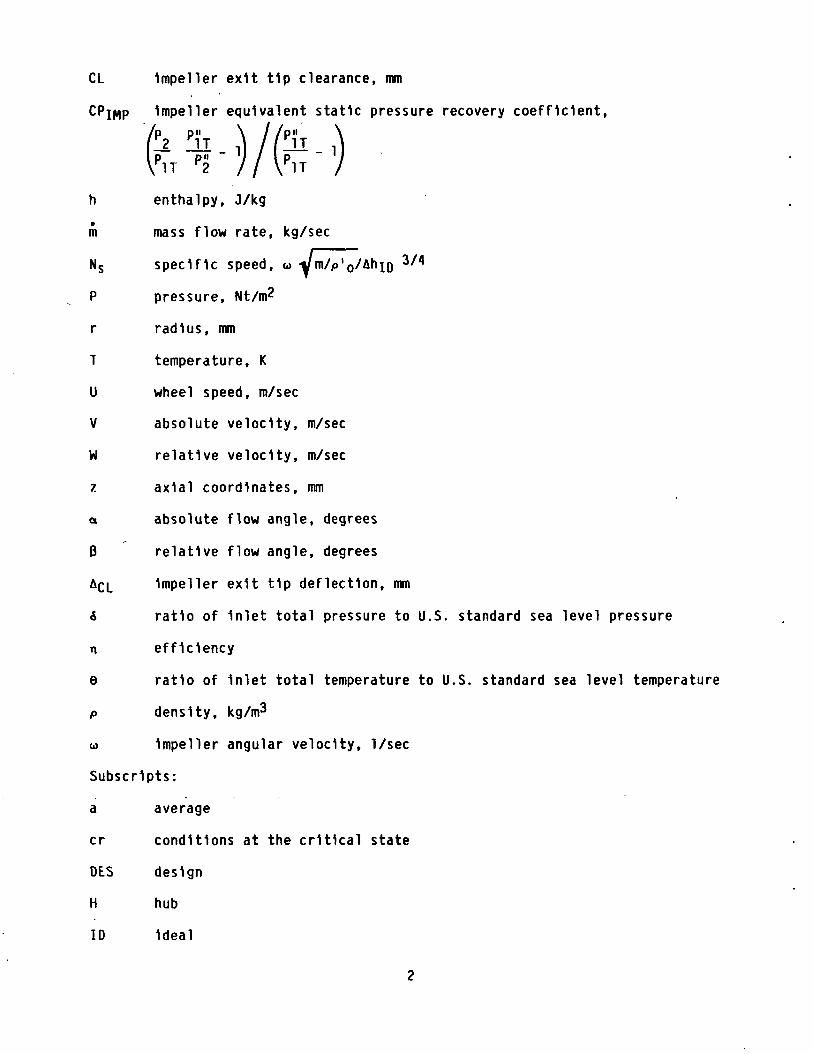
CL Impeller exit tip clearance, mm
Impeller equivalent static pressure recovery coefficient,
\f
h enthalpy, J/kg
m mass flow rate, kg/sec
Ns specific speed, o> •ym/pl0/Ahio
P pressure, Nt/m2
r radius, mm
T temperature, K
U wheel speed, m/sec
V absolute velocity, m/sec
W relative velocity, m/sec
z axial coordinates, mm
a absolute flow angle, degrees
0 relative flow angle, degrees
ACL Impeller exit tip deflection, mm
6 ratio of Inlet total pressure to U.S. standard sea level pressure
n efficiency
e ratio of Inlet total temperature to U.S. standard sea level temperature
P density, kg/m3
w Impeller angular velocity, I/sec
Subscripts:
a average
cr conditions at the critical state
OES design
H hub
10 Ideal

IMP Impeller
M mean
STD U.S. standard sea level pressure, 101325 Nt/m2 and temperature,288.15 K
T tip
0 station at bellmouth Inlet (ambient)
1 Impeller Inlet
2 Impeller exit
3 survey location
4 downstream measuring station
1-14 shroud static tap numbers
Superscripts:
' absolute total conditions
" relative total conditions
INTRODUCTION
In the design of centrifugal Impellers, several geometric parameters mustbe specified. Some of these, such as Impeller Inlet and exit rad11, are fixedby design constraints of pressure ratio, mass flow and any geometrical limitsImposed by the configuration. Others such as Impeller exit blade height,Impeller exit blade sweepback, number of blades, and Impeller rotative speedcan be chosen by the designer 1n order to optimize the particular stage withinlimits dictated by stress or turbine matching considerations. Studies havebeen done 1n the past which Indicate the trends of Impeller efficiency withspecific speed (refs. 1 and 2), with Impeller backsweep (ref. 2), and withImpeller relative velocity distribution (ref. 3).
The subject of this paper 1s the variation of Impeller performance withImpeller area ratio. The data should be useful for evaluating the ability ofan advanced computer code to calculate the outlet flow field of a series ofImpellers which have only a single geometric parameter varied. The area ratiowas varied over a large range because data was desired that would Include theeffect of a large global separation 1n the Impeller. These type of data wouldbe useful 1n developing flow models that can describe the flow behavior 1n anImpeller that approaches or operates with large amounts of separation. Thedata on clearance effects should also be useful for checking clearance models.
The equivalent area ratio 1s defined as the geometric area ratio neededto provide the equivalent amount of relative diffusion for a rotating Impelleras 1n a nonrotatlng dlffuser. Thus a change 1n equivalent area ratio 1s Indic-ative of a change 1n relative velocity ratio. For a low diffusion Impeller
(I.e., a low ratio of Inlet tip relative Mach number to exit relative Machnumber), the boundary layer growth 1n the Impeller will be small but the Machnumber levels will be high. Also, since less diffusion 1s done 1n the Impel-ler, more diffusion must be done 1n the diffusing system to achieve the samestatic pressure level.
On the other hand, for high diffusion Impellers, although Mach numberlevels and clearance losses may be less, the Impeller boundary layer growth maybe large. For excessively large area ratios, the Impeller boundary layers mayseparate and cause a decrease 1n Impeller performance and, thus, a negativeeffect on dlffuser performance. Therefore, the trade-offs Involved 1n choosingbetween low diffusion and high diffusion Indicate that an optimum area ratiomay exist.
For this study, the exit passage width of an Impeller with a nominal totalpressure ratio of 5.5 was successively cut back while maintaining the same tipcontour. This effectively reduced the equivalent area ratio of the Impellerfrom an Initial value of 2.945 to a final value of 2.322. For each of the fourImpeller configurations, three values of Impeller exit tip clearance weretested to establish the effect of clearance on overall performance and on theflow profiles at Impeller exit.
Comparisons were made among the four Impeller exit spanwlse survey meas-urements to determine the effect of area ratio and clearance on Impeller per-formance. Comparisons are based on derived Impeller exit total pressure andefficiency and mass-averaged performance parameters at the downstream surveylocation.
IMPELLER AERODYNAMIC DESIGN
The baseline Impeller 1s a scaled-up (scale factor = 1.2588) version ofan Impeller designed for use 1n an automotive gas turbine engine. The originalversion of the Impeller had 18 blades and Its aerodynamic design 1s described1n reference 4. The Impeller was subsequently modified to Include a splitterblade 1n order to reduce Impeller blade loading. This modified Impeller wasalso reduced 1n exit radius 1n order to maintain the same work Input; however,the Impeller main blade shapes and hub and shroud contours were not changed.The splitter blade leading edge was biased toward the suction surface of themain blade 1n order to equalize the mass flow rate 1n the splitter channels.The splitter blade shape was then faired Into the main blade shape at a speci-fied distance downstream from the splitter leading edge. The computer code ofreference 5 was used to determine the bias and fairing schedule that wouldproduce reasonable splitter leading edge velocities with an equal mass flowrate split. The detailed blade coordinates and Impeller mechanical design forthe baseline Impeller are presented 1n reference 6.
The Initial build of the Impeller had an exit radius and exit blade height2.54 mm larger than the baseline Impeller (fig. 1). The blade shape wasobtained by extrapolating the baseline blade. The overall geometry of theInitial build of the Impeller was as follows:

Number of main blades/splitterblades 18/18
Inlet tip diameter, mm 112.52Inlet hub/tip ratio 568Exit tip diameter, mm 208.02Exit blade height, mm 7.57Backsweep angle, deg 30.20Design axial clearance/exit
blade height 034
Estimated performance; characteristics for Impeller A are as follows:
Equivalent mass flow rate,mV§/6, kg/sec 0.959
Impeller total pressure ratio,P'2/P'o 5.50
Impeller static pressure ratio,P2/P'0 2.85
Impeller Inlet aerodynamic blockage . . .02Impeller total efficiency, n? 903Equivalent speed, N/\/e, rpm . . . 45,337.0Specific speed, Ns .518
The Impeller design point velocity diagrams for the four Impellers areshown 1n figure 2. .A meridional view of the flow path and Instrumentationlocations 1s shown 1n figure 3. The flow.from the backswept centrifugalImpeller 1s reduced 1n velocity 1n a constant area vaneless space before beingdumped Into a plenum at a radius ratio of r/r2 = 1.177. The width of boththe vaneless space and dump region change as the exit blade height of theImpeller 1s changed and as the clearance 1s changed.
APPARATUS, INSTRUMENTATION, AND PROCEDURE
Test Facility
A schematic of the test facility 1s shown 1n figure 4. The compressor andturbine are on a common shaft: Compressor mass flow rate was measured with acalibrated bellmouth on the compressor Inlet. Compressor discharge pressurewas manually controlled with a remotely operated valve 1n the compressor dis-charge line. Drive turbine speed was manually controlled by a valve on theturbine Inlet line. Turbine discharge pressure was manually controlled by aremotely operated valve 1n the turbine discharge line.
Instrumentation
The compressor Instrumentation stations are shown 1n figure 3. Sinceambient air enters the compressor Inlet, local barometric pressure was usedfor the Inlet total pressure. Inlet total temperature was measured with threebare-wire copper-constantan thermocouples spaced 120° apart and attached tothe bell-mouth. The downstream measurement station 4 was Instrumented withsix combination total temperature and total pressure probes evenly spaced aboutthe circumference. The thermocouples were bare-wire chromel-alumel probeswhich were calibrated for Mach number effects. The total pressure tubes were

chamfered to decrease angle sensitivity. The -probes were set at an angle ofapproximately 80° from radial so as to be oriented 1n the approximate directionof the highly swirling flow.
Static pressures were measured along the Impeller shroud and through thevaneless space to the dump. A single row of taps was used on the shroud withan additional five taps spaced 6° apart drcumferentlally just downstream ofthe Impeller trailing edge (r/r2 = 1.014). At station 3 (r3/r2 = 1.115) wheresurvey data was taken, six static taps were spaced 6° apart. Three staticpressure taps were equally spaced at the downstream measurement station 4. Theradial locations of the static taps are shown on figure 3.
Survey data at station 3 was taken using a miniature combination probehaving total pressure, total temperature, and angle sensors. The pressuretubes were made from 0.508 mm diameter tubing and the total temperature probewas made from a 0.16 mm diameter chromel-alumel bare wire. The probe was non-nulling so 1t was necessary to calibrate 1t 1n a flow tunnel to determine cor-rections for total pressure, angle, and temperature versus Indicated pressuresfrom the angle sensor. The thermocouple was also calibrated for Mach number.
All thermocouple readings are referenced to an Ice-bath temperature andare accurate to within +0.5 °F. Pressures were measured with a scannlvalvesystem and were dynamically calibrated with a dead weight tester. The measuredpressures should be accurate to within ̂ 0.06 Nt/cm^. For this study, repeat-ability of measurements 1s more Important than absolute accuracy since trendsare the desired result. Repeatability was judged to be good for this test.
Impeller Configurations
The Impeller diffusion ratio was varied by changing the Impeller exitblade height (b-w1dth) and thus equivalent area ratio. This was done by suc-cessively modifying the Impeller as shown 1n figure 1. The exit b-w1dth waschanged by axlally translating the fabricating template for the Impeller tipcontour thus maintaining the same tip contour for all configurations. In all,four Impeller exit b-w1dths were tested corresponding to four Impeller diffu-sion ratios as shown 1n figure 1. In order to maintain the same Impeller exitclearance, the shroud shims (shown 1n figure 3) had to be changed for eachImpeller exit b-w1dth. Thus the vaneless dlffuser width and the dump regionwidth changed as the Impeller b-w1dth changed. The Impeller exit clearance wasalso changed using the shroud shims. For each Impeller b-w1dth tested, threeImpeller exit clearances were tested. A 11st of the four Impeller configura-tions tested along with the calculated area ratios and clearances tested foreach Impeller are shown 1n table I.
Tip Clearance
Impeller exit tip clearance was measured using graphite rub probes. TheImpeller tip deflected toward the shroud as Impeller rotative speed Increased.A plot of Impeller deflection versus rotative speed 1s shown 1n figure 5. Theactual clearance was obtained by subtracting the Impeller deflection from the

cold set-up clearance. The deflection versus rotative speed curve was thesame for all configurations tested.
Impeller Test
Ambient test cell air was used for the working fluid for all tests.Therefore, the Inlet pressure was barometric and the Inlet temperature wasapproximately 295 K. Data was taken at speeds of 50, 80, 90, and TOO percentof the design rotative speed. Mass flow rate was varied from open throttle tosurge. Surge was Indicated by an audible noise from the test cell. At50 percent speed, no audible noise was detected and therefore surge could notbe accurately determined.
Surveys
Impeller exit surveys were taken at a location downstream of the Impellertrailing edge (r3/r2 = 1.115). Data was taken every 0.51 mm from hub totip, therefore more survey data points were taken for the high b-wldth Impel-lers than for the low b-w1dth Impellers. Surveys were conducted at selectedmass flow rates at speeds from 50 to 100 percent of design. Surveys were takenat approximately the same mass flow rates for each Impeller configurationtested so that comparisons could be made. At each point 1n the survey, totaltemperature, total pressure, and flow angle were measured using the combinationprobe.
Impeller Performance Calculation Procedure
Based on calculated quantities. - The overall Impeller map was derivedfrom a calculated total pressure at the Impeller exit and the measured down-stream total temperature. This procedure was used since the time required tocomplete one survey was considerable and overall performance could be reason-ably compared using this method since all the data was taken on the same testrig using the same Instrumentation. Consequently, trends observed from thesemeasurements should be correct for the configurations described herein. Thetotal pressure was calculated from the measured Impeller exit static pressure(an arithmetic average of the values from six static pressure taps), themeasured downstream total temperature, Impeller exit annulus area, and conti-nuity assuming no Impeller exit aerodynamic blockage. Results obtained withthe survey probes Indicate a heat loss between the survey location and thedownstream measurement station. The temperature difference for the threeclearances measured at each of the four b-w1dths varied from 0.5 to 1.5 percentof the mass average of the survey temperatures. The trends observed for tem-perature ratio versus area ratio and clearance were the same for both the massaverage survey temperatures and measured downstream temperatures. A comparisonof the temperatures measured at the downstream measurement station (station 4)and those based on mass averaged data at the survey location (station 3) forthe four Impeller configurations at design speed are shown 1n figure 6.
Another measure of Impeller performance 1s given by the equivalent pres-sure recovery coefficient. This quantity 1s a measure of the static pressurerecovery of the Impeller. It 1s defined 1n such a way as to remove the centri-fugal contribution to the static pressure recovery and thus 1s a measure of the
Impeller's performance as a diffusing element. The equivalent pressurerecovery coefficient 1s calculated for the tip streamline and thus values ofthe static pressure at the Impeller Inlet tip are required. These calculationswere done using an axisymmetric duct calculation procedure at the ImpellerInlet. This procedure was also used 1n defining the Impeller Inlet tip flowarea for use 1n the definition of Impeller equivalent area ratio.
Based on survey measurements. - Survey measurements of total temperature,total pressure, and flow angle were taken downstream of the Impeller trailingedge (r3/r2 = 1.115). Static pressure was obtained from an arithmetic averageof six static taps on the shroud side of the dlffuser at the same radius as thesurvey probe. The static pressure was assumed to be constant across the dlf-fuser passage at a constant radius. From the measured static and total pres-sures and total temperatures local values of velocity were obtained. Thesevelocities together with the angle measurements from the survey and the geo-metric area allowed an Integrated mass flow to be calculated. This Integratedmass flow was compared to the measured mass flow and the measured flow angleswere adjusted by a constant value across the passage until agreement wasobtained. This was done since 1t was judged that the angle measurements weremore uncertain than the other measurements taken. The amount of correctionvaried from 2.0 to 3.5° for all flow points surveyed. Local values of radialand tangential velocities were then calculated from the calculated velocitiesand the corrected flow angles. Local efficiencies were calculated from themeasured total pressures and total temperatures using curve fits on tables ofgas properties. Averaged values of total efficiency, total pressure, velocity,and angle were then calculated using procedures described 1n the Appendix. Theeffect of the angle correction on the averaged efficiency was less than 0.25points (a point Is 1 percent 1n efficiency) and 0.5 percent 1n total pressure.
RESULTS AND DISCUSSIONS
Overall Measurements
For this Investigation, four Impeller configurations were tested. Theconfigurations differed from each other only 1n the size of the exit b-w1dth.All of the remaining geometry remained the same. For each value of Impellerexit b-w1dth, three separate values of Impeller tip clearance were tested.
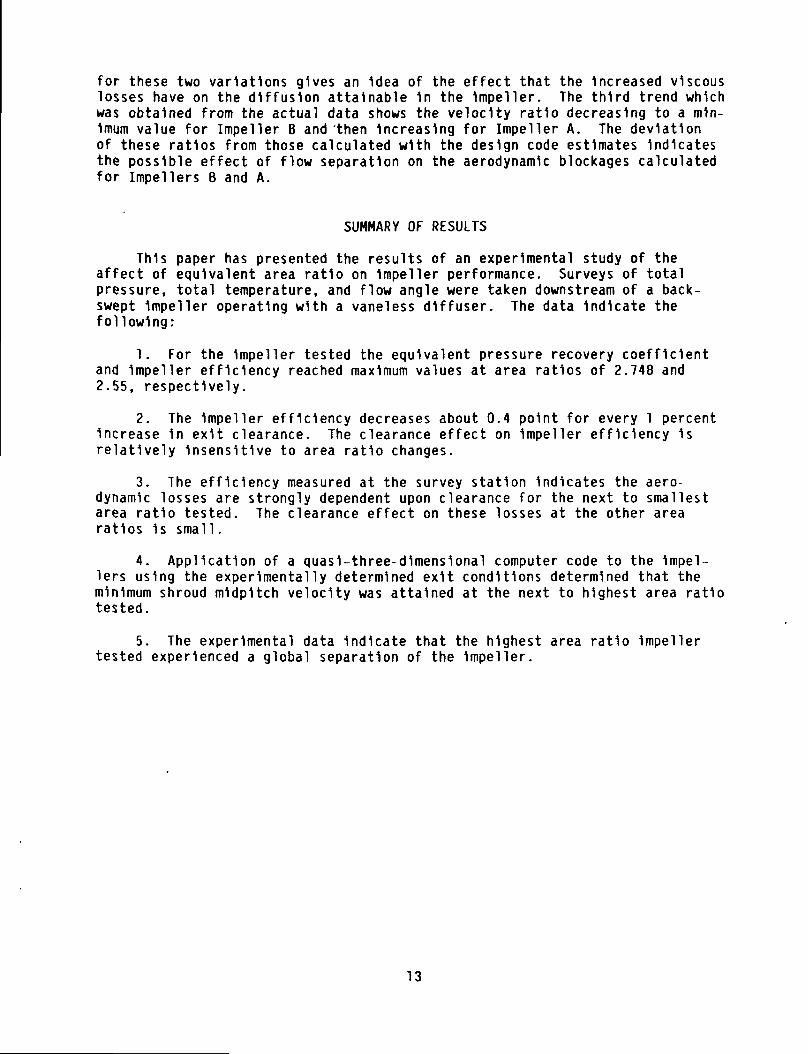
The overall Impeller performance for the Impeller with the highest b-w1dth(designated Impeller A) and smallest clearance 1s shown 1n figure 7. The per-formance maps for the other Impeller configurations and other clearances arenot shown since they are similar. The temperatures shown were for measurementsat the downstream measurement station (station 4). Also shown are the massaveraged temperatures from the survey probe located at station 3. These meas-urements were taken at selected mass flows and Indicated temperatures whichwere up to 1-1/2 percent higher than those measured by the downstream thermocouples. The compressor was surged for each of the speed lines shown; however,at 50 percent speed no audible surge was detected and therefore some datapoints may He 1n a stalled region of the map. The calculated total pressureratio peaked at a value of 5.75 for Impeller A at a mass flow near surge(90 percent design mass flow rate) for the smallest clearance tested(CL/b2 = 0.023) at 100 percent design speed. Calculated Impeller efficiencyat 100 percent design speed also peaked at this mass flow rate and clearance

at a value of 0.915. For this reason all comparisons for Impeller configura-tions were made at design speed and at a mass flow of 90 percent design massflow. Also, comparisons at other mass flow rates and rotative speeds werefound to be similar to those at the selected rotational speed and mass flowrate.
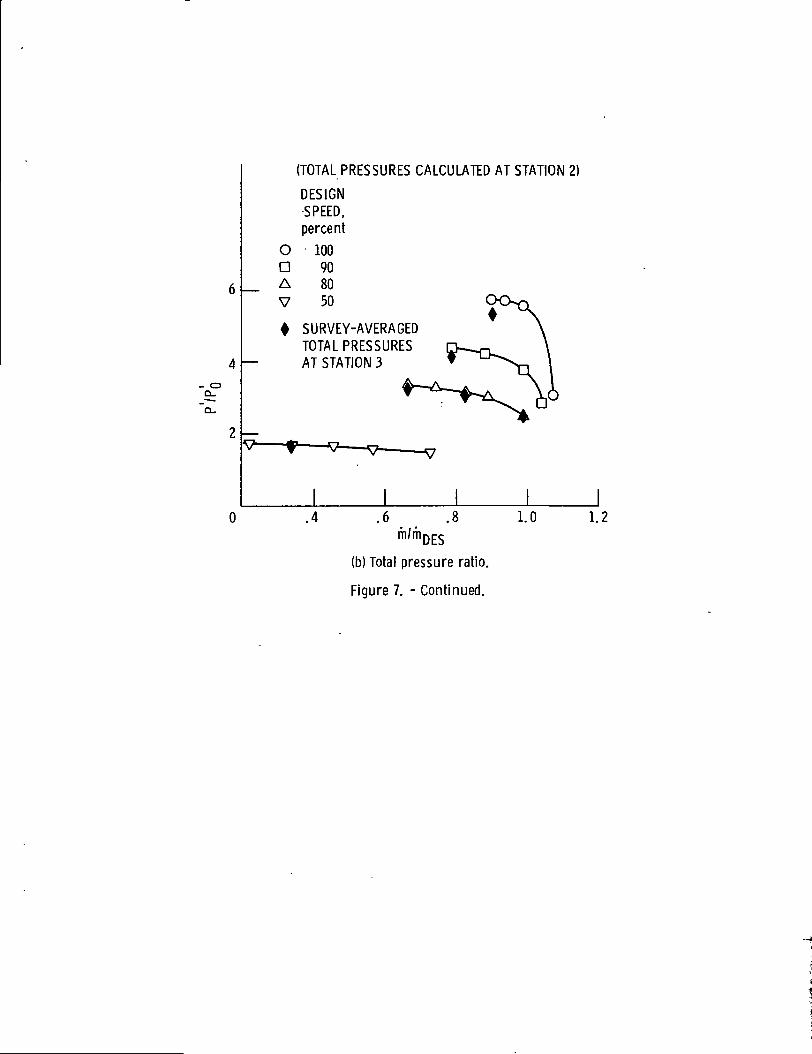
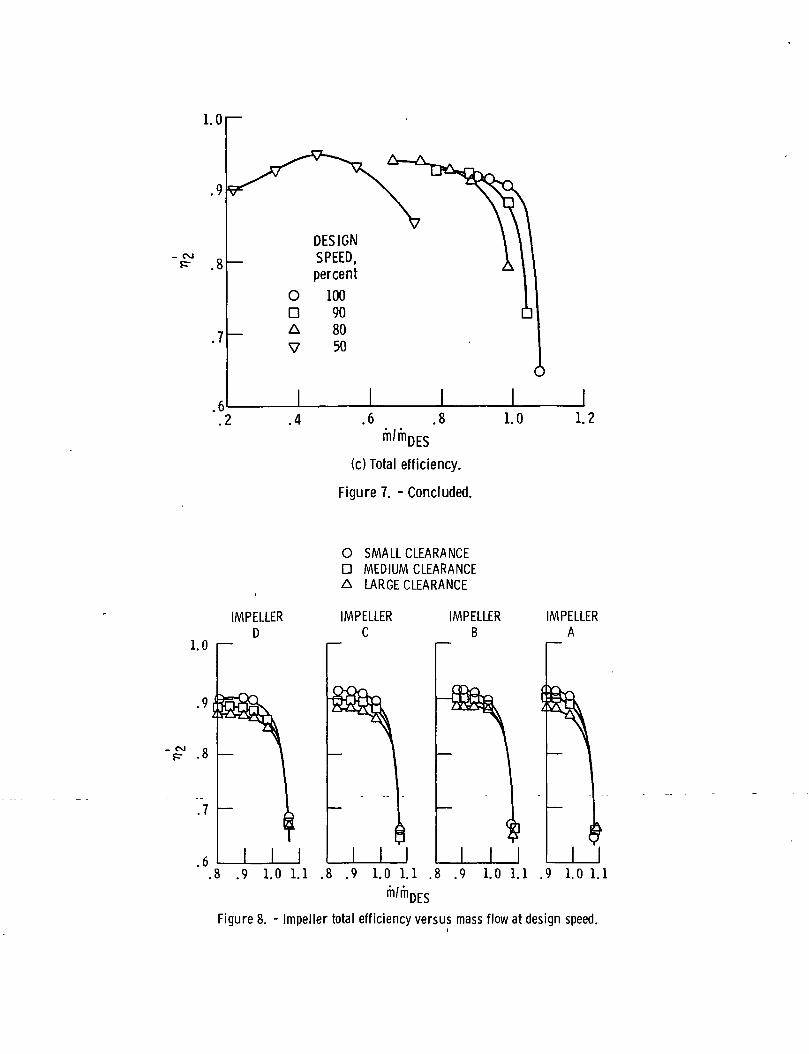
The variations of Impeller efficiency and Impeller equivalent pressurerecovery coefficient with clearance and mass flow are shown 1n figures 8 and 9for each of the four Impeller configurations. The figures show an Increase 1npressure recovery coefficient and efficiency with decreasing clearance for eachof the four Impellers tested. The figures also show an Increase 1n flow rangefrom a value of about 17 percent for Impeller A to a value of about 25 percentfor Impeller D at 100 percent design speed. There 1s no appreciable change 1nflow range with clearance for any of the Impellers tested.
The data from figures 8 and 9 are cross plotted 1n figure 10 which showsthe variation of efficiency and pressure recovery coefficient with clearance ata constant mass flow (near surge) for the four Impeller configurations. Theslopes of the curves are nearly Identical for the four Impeller configurations.The slopes of the Impeller efficiency versus clearance curve shows a loss ofapproximately 0.4 points for every percent Increase 1n with tip clearance.This agrees well with the value obtained for a 6-1 pressure ratio Impellertested previously (ref. 7).
In order to compare the four Impeller configurations, 1t 1s necessary tocompare them at the same value of percent clearance at exit. Therefore, thedata from the four Impellers 1s cross-plotted to yield comparisons at nominalvalues of CL/b2 of 0.08 and 0.06. The results of this procedure are shown1n figure 11 where the following parameters are plotted as a function of arearatio: calculated Impeller efficiency; Impeller equivalent pressure recoverycoefficient; total temperature ratio; static and total pressure ratio; totalefficiency; and average flow angle. With the exception of the pressure recov-ery coefficient and calculated Impeller efficiency, these parameters areobtained from averages of survey measurements at station 3.
The equivalent pressure recovery coefficient Increases rapidly up to anarea ratio of 2.55, continues to rise slightly up to an area ratio of 2.748,then decreases from an area ratio of 2.748 to 2.945. This 1s behavior typicalfor a stationary dlffuser 1f area ratio 1s Increased with no comparableIncrease 1n length. The pressure recovery coefficient Increases rapidly untilthe dlffuser approaches separation where peak recovery generally occurs. Asarea ratio continues to Increase, pressure recovery falls as the dlffuserexperiences larger amounts of separation. From the equivalent pressure recov-ery curve, 1t can be concluded that global separation occurs 1n the Impellerbetween the area ratios of 2.55 and 2.748. An examination of the temperatureratio plot also Indicates a dramatic change 1n Impeller behavior between thesetwo area ratios (temperatures measured at station 4 were consistent with theaveraged temperatures obtained at station 3 and Indicated that the observedtrends were not a result of scatter 1n the data) which 1s consistent with theonset of global separation. The static and total pressure ratios measured atstation 3 are consistent with this observation. A dramatic effect is alsoobserved for the averaged efficiency at station 3 for the 2.55 area ratioimpeller. The curve shows a drop of about 0.8 points between the 2.322 and2.55 area ratio Impellers at 8 percent clearance and then an Increase by 0.7points from 2.55 to 2.748 area ratio. This drop 1n efficiency does not occur

for the 6 percent clearance case and the average efficiency 1s relatively con-stant from 2.322 to 2.748 area ratio and then drops by several points at thehighest area ratio. This behavior Indicates a stronger effect of clearance at2.55 than for the other area ratios tested. The behavior manifests Itself 1nthe average efficiency at station 3 but does not appear to affect the calcu-lated Impeller efficiency. This Implies one of two things: (1) either thevaneless space losses are more sensitive to clearance effects for this arearatio than they are for the other area ratios; or (2) the Impeller, because ofIts proximity to Its peak recovery point, 1s extremely sensitive to any per-turbation such as an Increased clearance and, since the calculated Impellerefficiency 1s derived from the measured temperature and calculated Impellerexit total pressure, the effect on calculated Impeller efficiency 1s masked.The survey profiles for this area ratio Indicate a dramatic effect with clear-ance as will be shown later. In figure 12 the Impeller shroud static pressure1s plotted versus mass flow ratio for the smallest clearance tested for eachof the four Impellers. Near the Impeller exit, the plots for the two lowerarea ratio Impellers (0 and C) show a negative slope of pressure with mass flowrate while the plots for the higher area ratio Impellers (A and B) show a zeroslope near surge. In fact, the highest area ratio Impeller shows a zero slopevery close to the Inducer region. This Indicates that these two Impellers maybe separated at the low clearance.
Survey Measurements
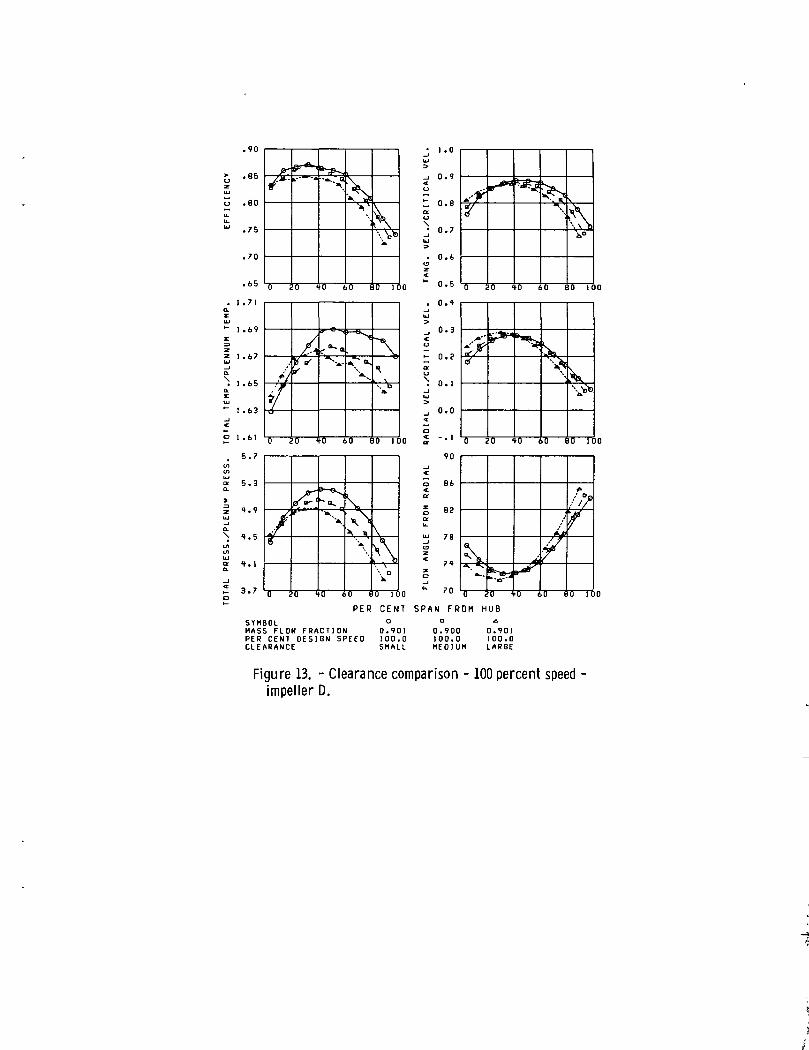
The results of the surveys of total temperature, total pressure and flowangle are shown 1n figures 13 to 16 for the four Impellers tested. The com-parison point was chosen to be 100 percent design speed at a mass flow of90 percent design mass flow. The figures show the measured values of totaltemperature, total pressure, and flow angle as well as the derived values ofefficiency, radial velocity, and tangential velocity for each of the threeclearances tested.
The survey results for the lowest area ratio tested (Impeller D, fig. 13)show profiles which are typical for nonseparated fully developed flow. There1s an accumulation of low momentum fluid along the shroud which Increases asthe Impeller tip clearance 1s Increased. This causes the profiles to be skewedtoward the hub side of the channel. The flow angles show that the flow remainsattached although separation may be Imminent near the shoud. The axial clear-ance near the shroud drastically affects the flow total pressure and totaltemperature over 80 percent of the channel height.
For the next higher area ratio tested (Impeller C, fig. 14) the flowappears to remain attached for the smallest clearance tested although the flowalong the hub has become more deficit causing a more symmetric profile. Forthe medium and large clearances, however, a large separation apparently occursalong the shroud which causes a large drop 1n total pressure and efficiency.This 1s probably what causes the large drop 1n efficiency 1n the cross-plotteddata (fig. ll(f)) going from Impeller D to Impeller C. If a smaller clearancehad been chosen for the cross plot, this drop In efficiency would have beenmuch less and may not have occurred at all.
10

The profiles for the Impellers with the two highest area ratios tested(Impellers A and B) are similar. Both Impellers show fairly symmetric profileswith some slight skewing toward the hub as clearance 1s Increased. The flowangle measurements show no significant regions of separation although separa-tion 1s probably imminent on both hub and shroud. Another possible explanationof the profiles 1s that Impeller separation has already occurred on both thehub and shroud and turbulent mixing has caused the profiles to assume a sym-metric character.
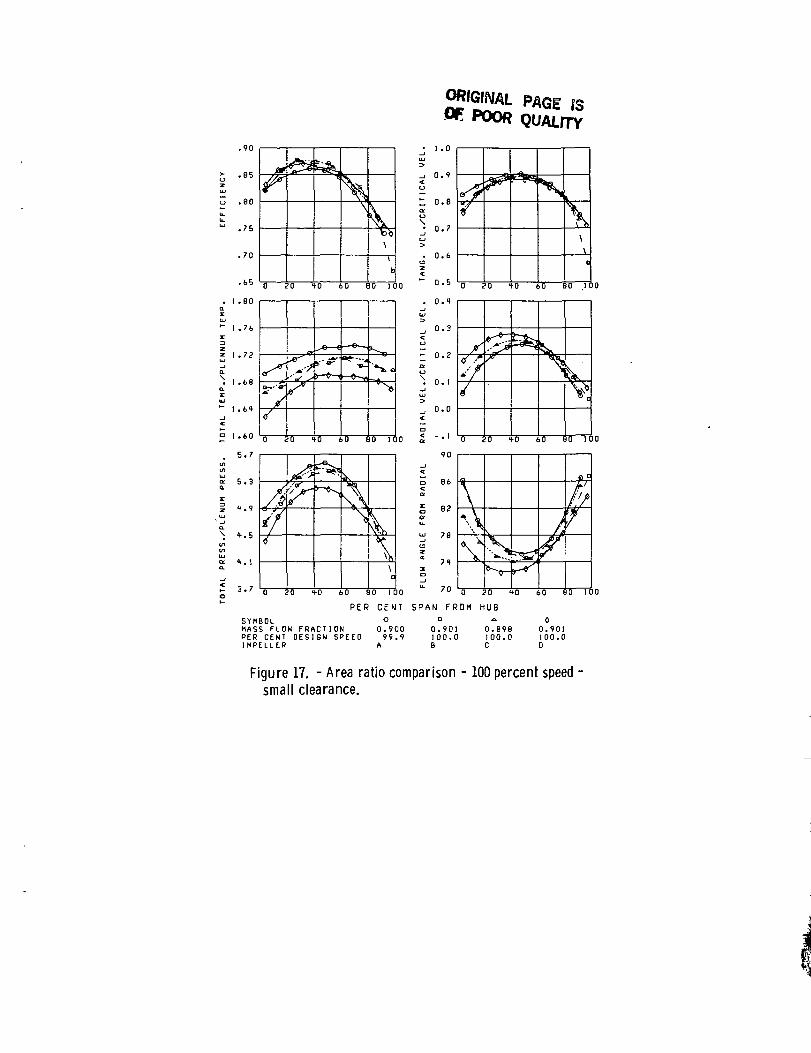
A comparison of the survey profiles for the four Impellers at the smallestclearances tested 1s shown 1n figure 17. The profiles are similar for the fourImpellers tested although the hub becomes more deficit as the b-w1dth 1sIncreased. An examination of the temperature profiles shows that the tempera-ture Increases from Impellers D to C and also from Impellers B to A. Thiswould be expected since an Increased b-w1dth causes a decreased meridionalvelocity. For a backswept Impeller with a constant deviation angle, this wouldcause the absolute tangential velocity to Increase with Increasing b-w1dth.From Euler's work equation, this would cause an Increase 1n Impeller tempera-ture rise.
However, going from Impellers C to B, there 1s actually a slight decrease1n Impeller temperature rise. This 1s probably due to a global Impeller sep-aration somewhere between an area ratio of 2.55 and 2.748 as discussed pre-viously. An Impeller separation would cause an Increase 1n Impeller losses andtherefore an Increased Impeller exit mixed-out meridional velocity. Therefore,for the same reasoning as above, the temperature would decrease. As the Impel-ler area ratio 1s further Increased, the temperature would once again Increaseprovided the separated zone did not increase 1n area. This 1s precisely thebehavior observed.
Impeller Loading Diagrams
The hub and shroud loading diagrams for the four Impellers at CL/b2 = 0.08are shown in figure 18. The flow point chosen for comparison was design speedat 90 percent of design flow. This corresponds to the flow points surveyed atdesign speed. The loading diagrams were obtained from the MERIDL code (ref. 8)and are representative of the invlscid core flow. The exit conditions forMERIDL (total pressure, absolute swirl, and blockage) were obtained by assumingan Ideal core flow which produced the same static pressure rise and aerodynamicblockage as was obtained from the experiment. The Ideal relative velocity atthe exit of the impeller was calculated from the measured exit static pressureand the Ideal relative total pressure. The ideal relative flow angle was cal-culated by assuming that the slip velocity of the 1nv1scid core was the same asthat for the mixed-out state at impeller exit as described under data reduction,tlon. The Impeller exit aerodynamic blockage was then obtained from one-dimensional continuity. The MERIDL code was modified to accept an input aero-dynamic blockage by reducing the tangential spacing between the blades by ablockage factor which was assumed to varly linearly between the leading andtrailing edges. No total pressure loss was assumed for the core flow.
Ihe impeller exit blockages calculated for the four impellers varied from60.7 percent for Impeller A to 49.7 percent for Impeller D. The calculatedexit Ideal relative critical velocity ratios varied from 0.570 for Impeller A
11

to 0.591 for Impeller D. The shroud static pressures from leading to trailingedge calculated by MER1DL using this method agreed with the experimental valueseverywhere within 3 percent.
Although these blockages seem high, they are typical for fully developedflow at Impeller exit. For example, for a fully developed a flow with a powerlaw velocity profile exponent of 1/2 (shape factor = 2) 1n both axial and tan-gential directions, the blockage would be 55.6 percent. This would correspondto a nearly separated flow.
If Impeller separation did not occur, 1t would be expected that theImpeller deceleration would Increase uniformly as the Impeller area ratio 1sIncreased. The loading diagrams for the shroud show that this 1s not the casefor this Impeller. The diagrams show tha.t a limiting value of deceleration 1sreached. For this Impeller configuration, the limiting velocity ratio alongthe mldpltch line at the shroud (Wmir/
wlt) ^s reached for Impeller B at avalue of 0.64. The shroud loading diagrams seem to Indicate that globalImpeller separation does not occur for Impellers D and C, possibly occurs forImpeller B and probably occurs for Impeller A since the minimum velocityattained decreases from Impellers 0 to B then Increases for Impeller A. Thetrend 1s somewhat the same for the hub loading diagram but the minimum mldpltchvelocity for Impellers B and A are about the same. The minimum velocity ratiosattained would seem to Imply that calculations that yield lower values of themldpltch velocity ratio may have conditions at exit that are too optimistic.Obviously, the values of minimum velocity ratio quoted for this Impeller maynot be generally applicable and confirmation of some limiting ratio wouldrequire analysis of a range of Impellers with different geometries and designconditions.
In order to determine how much the minimum velocity change was affectedby the Increased viscous effects and separation as area ratio Increased, theMERIDL code was run twice more for each area ratio. For the first variationthe Intent was to determine how the minimum velocity varied only as a resultof the area ratio change from Impellers D to A. The blockage calculated forImpeller D was used with the slip velocity determined experimentally forImpellers C, B, and A to establish the downstream Input conditions for theMERIDL code. The second variation was to estimate the Increase 1n viscouslosses due to Increased diffusion but eliminate the effects of separation. Acentrifugal compressor design code which utilized Internal boundary layer cal-culations to estimate viscous losses was used without a separation criterion(the shape factor used to Indicate separation was set to a high value) toestablish the slope 1n total temperature and static pressure rise from Impel-lers D to A. The predictions were normalized with the experimental valuesobtained for Impeller D (the predicted values were close to the experimentalvalues for Impeller D). MERIDL exit conditions for Impellers C, B, and A werethen obtained from the adjusted total temperature and static pressure. Thesetwo variations as well as the results obtained with the test data are shown 1nfigure 19 as curves of minimum mldpltch velocity at the shroud divided by theInlet mldpltch velocity. This ratio should be representative of the amount ofglobal diffusion attained 1n the Impeller passages. As expected the trendobtained with the blockage held constant shows the velocity ratio continuallydecreasing with Increasing area ratio. The trend obtained with the total tem-perature and static pressure estimated with the design code for Impellers Band A also shows a continually decreasing velocity ratio but not as fast asfor the constant blockage case. The differing levels of minimum velocity ratio
12
for these two variations gives an Idea of the effect that the Increased viscouslosses have on the diffusion attainable 1n the Impeller. The third trend whichwas obtained from the actual data shows the velocity ratio decreasing to a min-imum value for Impeller B and 'then Increasing for Impeller A. The deviationof these ratios from those calculated with the design code estimates Indicatesthe possible effect of flow separation on the aerodynamic blockages calculatedfor Impellers B and A.
SUMMARY OF RESULTS
This paper has presented the results of an experimental study of theaffect of equivalent area ratio on Impeller performance. Surveys of totalpressure, total temperature, and flow angle were taken downstream of a back-swept Impeller operating with a vaneless dlffuser. The data Indicate thefollowing:
1. For the Impeller tested the equivalent pressure recovery coefficientand Impeller efficiency reached maximum values at area ratios of 2.748 and2.55, respectively.
2. The Impeller efficiency decreases about 0.4 point for every 1 percentIncrease 1n exit clearance. The clearance effect on Impeller efficiency 1srelatively Insensitive to area ratio changes.
3. The efficiency measured at the survey station Indicates the aero-dynamic losses are strongly dependent upon clearance for the next to smallestarea ratio tested. The clearance effect on these losses at the other arearatios 1s small.
4. Application of a quasi-three-dimensional computer code to the Impel-lers using the experimentally determined exit conditions determined that theminimum shroud mldpltch velocity was attained at the next to highest area ratiotested.
5. The experimental data Indicate that the highest area ratio Impellertested experienced a global separation of the Impeller.
13

APPENDIX
AVERAGING PROCEDURE FOR SURVEY QUANTITIES
The purpose of the Integrated average values was to obtain single quanti-ties that represented the energy transfer and Inefficiency associated with thecompression process. A procedure 1s described below which restricts the quan-tities averaged to extensive properties only. Other quantities are derivedfrom these two averages so that the resultant averaged velocity triangle 1srepresentative of the energy transferred to the fluid and continuity. Overallmass flow rate was calculated by determining the mass flux, pV cos a, at eachspanwlse location. This quantity was set equal to zero at the walls and acubic spline used to Integrate the fluxes across the span to obtain the massflow rate. Total enthalpy and Ideal total enthalpy (obtained from the measuredtotal pressure) were mass averaged 1n order to get overall quantities repre-sentative of the flow. Average total temperature was obtained from the averagetotal enthalpy and average total pressure was obtained from the average Idealtotal enthalpy. Static pressure was assumed constant across the channel andwas used with the averaged total pressure to calculate an average criticalvelocity ratio (see eq. (1-61) of ref. 9). Average static density was calcu-lated from the average critical velocity ratio, average total pressure, andaverage total temperature. With the known Integrated mass flow rate, a flowangle consistent with continuity could be obtained.
14

REFERENCES
1. Balje, O.E.: "A Study On Design Criteria and Matching of Turbomachlnes;Part B - Compressor and Pump Performance and Matching of Turbocomponents."Journal Engineering for Power. Vol. 84, No. 1, Jan. 1962, pp. 103-114.
2. Rodgers, C.: "Specific Speed and Efficiency of Centrifugal Impellers,"Performance Prediction of Centrifugal Pumps and Compressors. ASME,New York, 1980, pp. 191-200.
3. Mlshina, H. and N1sh1da H.: "Effect of Relative Velocity Distribution onEfficiency and Exit Flow of Centrifugal Impellers," ASME Paper 83-G1-74,Mar. 1983.
4. Galvas, M.R.: "A Compressor Designed for the Energy Research and Development Agency Automotive Gas Turbine Program," NASA TM-X-71719, 1975.
5. Katsanls, T. and McNally, W.D.: "Fortran Program for Calculating Velodties and Streamlines on a Blade-to-Blade Stream Surface of a landem BladeTurbomachlne," NASA TN-D-5044, 1969.
6. Pampreen, R.C.: "SpHtter-Bladed Centrifugal Compressor Impeller Designedfor Automotive Gas Turbine Application," NASA CR-135237, 1977.
7. Klassen, H.A., Wood, J.R., and Schumann, L.F.: "Experimental Performanceof a I6.l0-Cent1meter-I1p-D1ameter Sweptback Centrifugal CompressorDesigned for a 6:1 Pressure Ratio," NASA TM-X-3552, 1977.
8. Katsanls, T. and McNally, W.D.: "Revised Fortran Program for CalculatingVelocities and Streamlines on the Hub-Shroud Mldchannel Stream Surface ofan Axial-, Radial-, or Mixed-Flow Turbomachlne or Annular Duct: Part I -User's Manual," NASA TN-D-8430, 1977.
9. Glassman, A.J.: "Turbine Design and Application," NASA SP-290, Vol. I,1972.
15

TABLE I. - IMPELLER CONFIGURATIONS
Impeller
A
B
C
D
b2/r2
0.0728
.0679
.0630
.0574
ARIMp
designpoint
2.945
2.748
2.550
2.322
Clearance
SmallMediumLarge
SmallMediumLarge
SmallMediumLarge
SmallMediumLarge
CL/b2designspeed
0.023.057.090
.047
.083
.115
.054
.093
.128
.072
.115
.153

IMPELLER
r A
-I
1,'rCIllr*
BASELINE IMPELLERIMPELLER WITH
ADDITIONAL STOCK
104.01 mm
101.47mm
v SPLITTERLEADINGEDGE
37.02mm
AXIS OF
ROTATION
Figure 1. - Impeller configurations and geometry.

INLET (ALL IMPELLERS, OUTSIDE BLADE ROW)
WiVcrl = 310.65 m/sec
ul/vcrl vl'vcrl wl/wcrl
HUB 0.494MEAN . 730TIP .872
P1/PSTD T1/TSTD
0.398.487.562
0.597.827.977
51.1156.2757.21
1.01.01.0
1.01.01.0
IMPELLER
EXIT (MEAN, OUTSIDE BLADE ROW)
V
u2 = 493.8 m/sec
W2/Wcr2
DCBA
1.1.1.1.
239236234231
0.989.990.994.998
0.455.427.404.383
75.6377.78.79.
132825
48.50.52.53.
83842032
5.5.5.5.
162269385501
1.6831.6901.6971.704
Figure 2. - Design point impeller velocity diagrams at design mass flow rate.

SHIM HERE TOCHANGE CLEARANCE
DOWNSTREAM MEASUREMENTSTATION 4; r = 148.33mm:
6 TOTAL TEMPERATURES6 TOTAL PRESSURES —3 STATIC PRESSURES
SURVEY STATION 3; r -116.0mm:(TOTAL TEMPERATURE
COBRA PROBED TOTAL PRESSURELANGLE
6 STATIC PRESSURES
STATION 2; r = 105.5mm:
6 IMPELLER EXIT STATIC PRESSURES
SHROUDSTATIC
TAPNUMBER
123456789
1011121314
LOCATION
r(mm) z(mm)
56.58
57.0058.4761.4765.8671.4677.7584.3691.0997.90
104.71105.51116. 03148.34
33.95
27.23
20.6314.539.385.593.101.55.67.18
0000
Figure 3. - Compressor flow path and instrumentation stations.

CALIBRATEDBELLMOUTHn
ATMO-SPHERIC •*-AIR
\
-o VACUUM-U*—. EXHAUSTER
t /-TURBINE/ DRIVE
•»-
vu-YTHROHLEi VALVES
B=--_^ VACUUMEXHAUSTER
Figure 4. - Small centrifugal compressor facility.
ROTATIVE SPEED/DESIGN ROTATIVE SPEED, U/UDES
Figure 5. - Impeller tip deflection versus rotative speed.

IMPELLER T3a/T0 T4/TQ
A G OB D 0C A 0D V 0
1.7
1.6.04 .08
CUb2
.12 .16
Figure 6. - Impeller temperature rise versus clearance.100 percent design speed; m/mDES = 0.90.

1.81
1.61
(TEMPERATURES MEASURED AT STATION 4)DESIGNSPEED,percent
O 100D 90A 80V 50
f SURVEY-AVERAGEDTEMPERATURESAT STATION 3
1.2
l .Ol.2 .4 .6 .8 1.0 1.2
lin/mDES
(a) Temperature ratio.
Figure 7. - Performance characteristics for impeller A(CUb2 = 0.023).
- oQ_
(TOTAL PRESSURES CALCULATED AT STATION 2)
DESIGNSPEED,percent
O 100D 90A 80V 50
f SURVEY-AVERAGEDTOTAL PRESSURESAT STATION 3
.6m/m
.8 1.0 1.2DES
(b) Total pressure ratio.
Figure 7. - Continued.
l.Or-
.9
.8
.7
.2
DESIGNSPEED,percent
O 100D 90A 80V 50
.6m/iin
.8
DES
(c) Total efficiency.
Figure 7. - Concluded.
1.0 1.2
1.0 i—
IMPELLERD
O SMALL CLEARANCED MEDIUM CLEARANCEA LARGE CLEARANCE
IMPELLERC
IMPELLERB
IMPELLERA
.8 .9 1.0 1.1 .8 .9 1.0 1.1 .8 .9 1.0 1.1 .9 1.0 1.1m/mDES
Figure 8. - Impeller total efficiency versus mass flow at design speed.
IMPELLERD
O SMALL CLEARANCED MEDIUM CLEARANCEA LARGE CLEARANCE
IMPELLERC
IMPELLERB
I I HI
IMPELLERA
.9 1.0 1.1 .8 .9 1.0 1.1 .8 .9 1.0 1.1 .9 1.0 1.1m/mD E S
Figure 9. - Impeller equivalent static pressure coefficient versus' mass flow at design speed.

. COpr
.92
.91
.90
.89
.88
.87
O-g
Q-
IMPELLER
.61—
(a) Impeller total efficiency.
.04 .08CL/b,
.12 .16
(b) Impeller equivalent static pressure recovery coefficient.
Figure 10. - Impeller performance characteristics versusclearance for design speed and m/mnES = 0.90.

Q_O
.56
.52
.48
.44
CL7b2
D 0.06O .08
D
O
D
O
I(a) Impeller equivalent static pressure
recovery coefficient.
.94r—
.90
.86
D— o 8 D
0
1 i(b) Calculated impeller aerodynamic efficiency.
1.70
8
8
1 fifi
DO
(c) Total
3.2
. o
%, 3.1D_
^ n
—
—
D
° 1
1 1temperature ratio.
D
Oo o
1 1 12.2 2.4 . 2.6 2.8
EQUIVALENT AREA RATIO
(d) Static pressure ratio.
3.0
Figure 11. - Performance parameters forconstant percent clearance versusimpeller equivalent area ratio.

. oQ-
O-
ro- r«iJ^
5.4
5.2
5.0
4.8
.85
.84
.82
82
~~ CUb2
D 0.060 .08 U
~ D
O D
O
~~ D
O
1 1 1 1(e) Total pressure ratio.
—
g n @O
1 1 I R'l(f) Total efficiency.
l —
80en
TD
78
76
Q
§
1 1 12.2 2.4 2.6 2.8 3.0
EQUIVALENT AREA'RATrO.
(g) Flow angle. •
Figure 11. - Concluded.

4 I—
TAPNUMBER
14 O
- oQ_
4 I—
TRAIL-INGEDGEi
1(a) Impeller D.
.78 .86 .94 1.02 1.10m/mDES
(b) Impeller C.
Figure 12. - Shroud static pressure distribution for designspeed and small clearance.

TAPNUMBER
TRAILINGEDGE
I I
- oQ_
(c) Impeller B.
TRAILINGEDGE
I I.78 .86 .94 1.02 1.10
m/mDES
(d) Impeller A.
Figure 12. - Concluded.
.90
.85
.80
.75
.70
.65 0 20 t O 6 0 80 100
3.7 * H ! 6 0 8 0 T O O
SYMBOL °MASS FLOW FRACTION 0.90]PER CENT DESIGN SPEED 100.0CLEARANCE SMALL
0.9
o.e
0.7
0.6
0.5
0.3
0.2
0.1
0.0
-.1
90
86
> 82
78
70
"AN FRD
0.900100.0M E O I U
rf
V
***
0 20 ^
#cf
*3?3vN •̂
^jb
*.°
0 60 0 10
"Xx
0 20 10 60 !
K'-- r^3
A
/
s*7
\•'->
0 10
f'?y
0 20 tO 60 80 10
OH HUB
0.901100.0
M L A R G E
Figure 13. - Clearance comparison -100 percent speed -impeller D.

.85
.80
.75
.70
.65
1 .75
1.73
1 . 7 1
1 .69
1.67
1.65
5.7
5.3
4.9
4.5
4. 1
3.7
SIMMASPERCLE
f
rx6—
""•-. ^'a
0 20 ^
^«r
e/
-^
'
^s
:-->\\
X\ \
\
\\. O
0 60 80 1C
X8"1
•Q^
""""
"*->(
*~ -t,k.
\\
O
0 20 40 60 80 1C
D-
/
'̂•m
^
^\
\XS
\6
D
0.9
0.8
0.7
0.6
0 °'5
0.4
0.3
0.2
O.I
0.0
0 "' '
90
86
82
78
74
rf
4
0 i
«•
/
^2
0 4
^
0 20 4
\JX.
J
0 20 40 60 80 100 '"0 20 4
PER C E N T S P A N F R O M HUBSOL o o «.5 F L O H F R A C T I O N 0.898 0.897 0.899
C E N T DESIGN SPEED 100.0 100.0 99.9F R A N C E SMALL MEDIUM LARGE
Figure 14. - Clearance comparison -100 percent speed -impeller C.

> .85zUJ
U.u_UJ 7t
tf
f
0
V tf
*Ao ;
tf/?̂/A
0 2
£3
0 *
J/"0 1
/X*
^-
0 1
^N
0 <
r^fa- '
K> (
r-^V
-A. 1
"*^
0 k
\
0
<K
- a.
^t ~4
0
•y\̂\'j
0 £
VV\
0 1C
^s,•o
*"lk
J O 1 C
K\\
0 1C
_lUJI>
«0
a0
\
_, °-7. ^
3>
0z«
0 °'6
_1UJ
I>
•3
<:CJ
a0
N n i_jUJ•>
•°<E
O
o S "•'
_j<
<a
x fl.o 86
aLL.
CDz* 7flX0_JU. 7(i
0 7*
^«!•̂
o ;
jr
^/y
o ;
\<\
<
0 I
0 '
^/^
'0
0̂ 1
•^s
to <
-̂ a
fO <
^0 i
N
>0 i
N\H!\\\
"t
,0 f
4
//••*/ 1
f0 E
>,\:^
0 1 0
^"^0 10
/
k<i
;'/7
a ic
P E R C E N T S P A N F R O M H U B
S Y M B O L o = ^M A S S F L O W F R A C T I O N 0 . 9 0 ] 0.90! 0.903P E R C E N T D E S I G N S P E E D 100 .0 100.0 99.9C L E A R A N C E S M A L L M E D I U M L A R G E
Figure 15. - Clearance comparison -100 percent speed -impeller B.

o '8b
zUJ
u.u.UJ ?c
3.7
e^A
o ;
"̂•''
o ;
/x.
^•'
ft-*£--Br
0
- #•^ .
X
0 '
x£
i'̂ '
-e^
^*!
fO (
^1^
* A
0 (
"̂"̂ .
X
>0 (
^^
Nfc
0 E
\
\r'\
*•-.
^\ "
\
\
10 1 (
^».X, •
0 1C
\
(''*\
UJ
oru\
sID2
o o-5
UJ
_, 0.3
CJ
\ n ,
UJ
oo 2 "• J
x Q,o 8*>oru.
0z< 700
U. 7n
^
0
fri
o ;
\
X
'**
0
^^
'0 '
~
to
™*i
to t
•
^
\
0 E
s^
V
>0 £
$•y>
\ ^
\\,
90 10
sa
0 10
p
/
/6
P E R C E N T S P A N F R O M H U BS Y M B O L o D ^MASS F L O W F R A C T I O N 0.900 0.900 0.902PER C E N T D E S I G N S P E E D 99.9 100.0 100.0C L E A R A N C E S M A L L M E D I U M L A R G E
Figure 16. - Clearance comparison -100 percent speed -impeller A.
.90
ISPOOR QUALFTY
"o fo ' to 6 0 a f t Too
90
86
82
78
T,
\
V~5 25 "fO 60 80 TOO
PER CENT SPAN F R O M HUBSYMBOL o o ^ oMASS FLOH FRftCTlON 0.900 0.90] 0.898 0.90JPER CENT DESIGN SPEED 99.9 100.0 100. 0 100. 0I M P E L L E R A B C 0
Figure 17. - Area ratio comparison - 100 percent speed -small clearance.

o
1
500 —
400
300
200
100
IMPELLER
0 .012 .024 .036 .048 .060 .072 .084 .096 .108MERIDIONAL DISTANCE, m
(a) Tip.
Figure 18. - Impeller loading diagrams for 100 percent designspeed, m/mDES = 0.9, CL/b2 = 0.08.

oQ
350
300
250
200
150
100
50
IMPELLER
ABCD
.012 .024 .036 .048 .060 .072 .084 .096 .108MERIDIONAL DISTANCE, m
(b) Hub.
Figure 18. - Concluded.

.75
X<u
.70
2 .65
-60
.55
O DATAD DESIGN CODE PREDICTION (ADJUSTED)A CONSTANT BLOCKAGE
,502.50 2.75 3.00 3.25
IMPELLER AREA RATIO3.50
Figure 19. - Velocity ratio versus area ratio for designspeed, m/mpE$ =0.90, CL/b2 = 0.08.

1 Report NO. NASA TM-87237USAAVSCOM-TR-85-C-21
2. Government Accession No. 3. Recipient's Catalog No.
4. Title and Subtitle
Effect of Area Ratio on the Performance of a 5.5:1Pressure Ratio Centrifugal Impeller
5. Report Date
6 Performing Organization Code
505-62-227. Author(s)
Lawrence F. Schumann, David A. Clark, andJerry R. Wood
8. Performing Organization Report No.
E-2190
10. Work Unit No.
9. Performing Organization Name and Address
NASA Lewis Research Center and Propulsion Directorate,U.S. Army Aviation Research and Technology Activity -AVSCOM, Cleveland, Ohio 44135
11. Contract or Grant No.
12. Sponsoring Agency Name and Address
National Aeronautics and Space AdministrationWashington, D.C. 20546 and U.S. Army AviationSystems Command, St. Louis, Mo. 63120
13. Type of Report and Period Covered
Technical Memorandum
14 Sponsoring Agency Code
15. Supplementary Notes
Prepared for the 31st International Gas Turbine Conference and Exhibition, spon-sored by the American Society of Mechanical Engineers, Dusseldorf, West Germany,June 8-12, 1986. Lawrence F. Schumann and David A. Clark, Propulsion Directorate,U.S. Army Aviation Research and Technology Activity - AVSCOM; Jerry R. Wood, NASALewis Research Center.
16. AbstractA centrifugal Impeller which was Initially designed for a pressure ratio ofapproximately 5.5 and a mass flow rate of 0.959 kg/sec was tested with a Vanelessdlffuser for a range of design point Impeller area ratios from 2.322 to 2.945.The Impeller area ratio was changed by successively cutting back the Impellerexit axial width from an Initial value of 7.57 mm to a final value of 5.97 mm.In all, four separate area ratios were tested. For each area ratio a series ofImpeller exit axial clearances was also tested. Test results are based on Impel-ler exit surveys of total pressure, total temperature, and flow angle at a radius1.115 times the Impeller exit radius. Results of the tests at design speed, peakefficiency, and an exit tip clearance of 8 percent of exit blade height show thatthe Impeller equivalent pressure recovery coefficient peaked at a design pointarea ratio of approximately 2.748 while the Impeller aerodynamic efficiencypeaked at a lower value of area ratio of approximately 2.55. The variation ofImpeller efficiency with clearance showed expected trends with a loss of approxi-mately 0.4 points 1n Impeller efficiency for each percent Increase 1n exit axialtip clearance for all Impellers tested. The data also Indicated that the Impel-ler would probably separate at design area ratios greater than 2.748. An ana-lysis was performed with a quasi-three-dimensional 1nv1sc1d computer code whichconfirmed that a minimum velocity ratio was attained near this area ratio thusIndicating separation. This data can be used to verify Impeller flow modelswhich attempt to account for very high diffusion and possible separation.
17 Key Words (Suggested by Author(s))
Centrifugal compressor; Area ratio;Clearance; Eff iciency; Separation
19. Security Classif (of this report)
Unclassif ied
18. Distribution Statement
Unclassif ied - unlimitedSTAR Category 02
20. Security Classif. (of this page)
Unclassified21. No. of pages 22 Price*
*For sale by the National Technical Information Service, Springfield, Virginia 22161

National Aeronautics andSpace Administration
Lewis Research CenterCleveland. Ohio 44135
Official BusinessPenalty for Private Use $300
SECOND CLASS MAIL
ADDRESS CORRECTION REQUESTED
Postage and Fees PaidNational Aeronautics andSpace AdministrationNASA-451
NASA