Embed Size (px)
Citation preview
Effect of Abrahamson Ground Motion Coherency Functions for Hard Rock onResponse of Simplified Representation of Nuclear Power Plant Structure: Summary
James J. JohnsonStephen A. Short
May 11, 2007
General
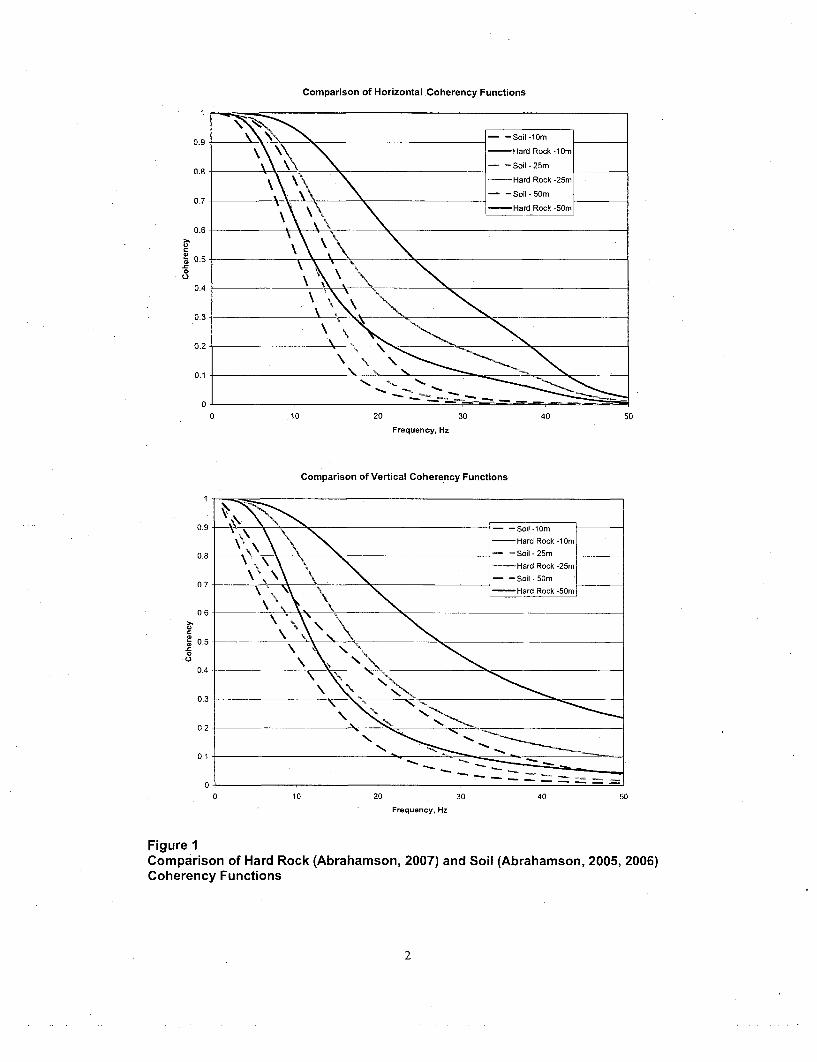
An extensive study was performed on the effect of seismic wave incoherence onfoundation and structure response (EPRI, 2006). The study evaluated the effects ofincoherence on the response of rigid, massless foundations and for.example structuralmodels. The starting points for the study were the ground motion coherency functionsdeveloped by Dr. Abrahamson (Abrahamson, 2005, 2006). These coherency functionsremain applicable to soil sites for surface foundations. Recently, these ground motioncoherency functions were revised considering only ground motion data recorded at rocksites. The resulting revisions are applicable to rock sites (Abrahamson, 2007) for surfaceand embedded foundations. These "Hard Rock" coherency functions were implementedin CLASSIinco, the version of CLASSI used to calculate incoherency transfer functions(ITFs) of the rigid, massless foundation and in-structure response. The soiland hard rockcoherency functions are compared in Figure 1. The effects of changes to the coherencyfunctions have been assessed and representative results are presented herein.
SSI and Structure Response
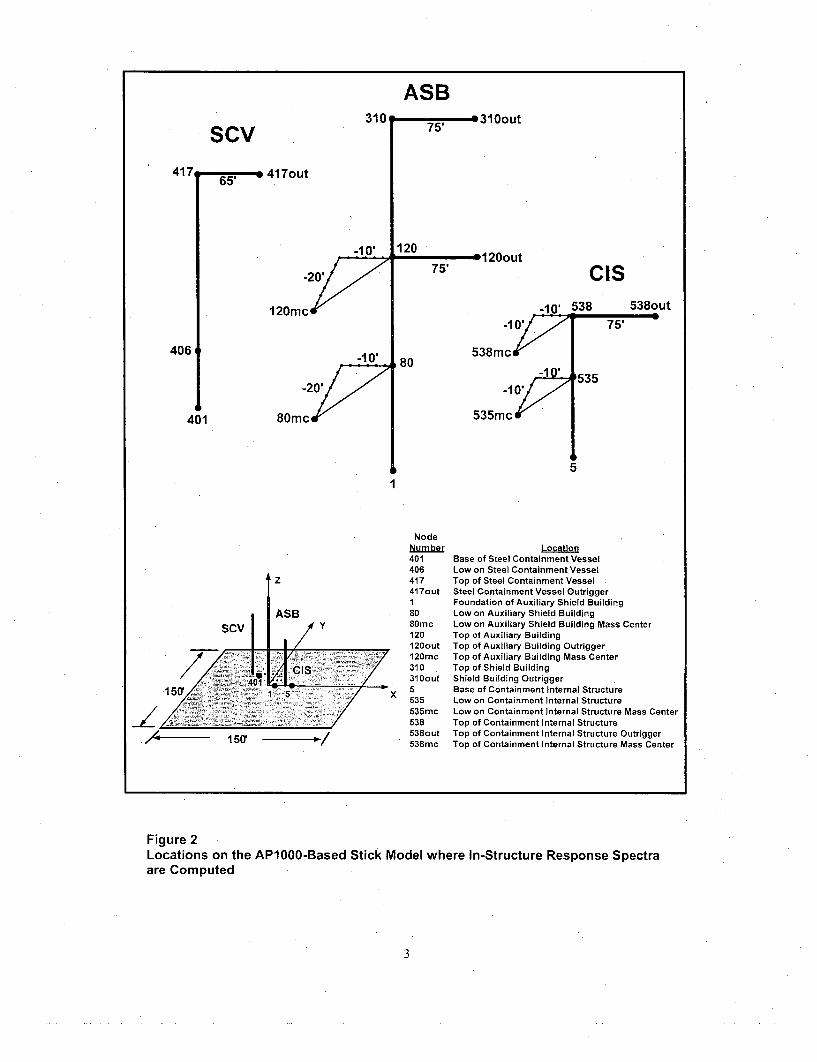
The subject of these analyses is the response of the representative nuclear power plantstructure studied previously (EPRI, 2006). The relevant parameters of the analyses aredescribed in detail in Chapter 2, EPRI (2006): the rock site profile; the 15-ft thick, 150-ftsquare foundation; and the simplified structure model based on some of the AP1000properties. The structure model is comprised of three sticks with limited inter-connectivity at upper elevations. The free-field ground motion of interest is that motioncompatible with the rock site profile, i.e., exhibiting significant high-frequency motion.For all analyses, spectrum compatible time histories defined the free-field ground motion.All analyses considered three directions of simultaneous earthquake input motion. Figure2 shows a schematic of the structure model with response locations identified.
00
Comparison of Horizontal .Coherency Functions
0_ __ - -Soil-10m0.9
-Hard Rock -10m
- -Soil-25m
- Hard Rock -25m
0.7 \ \-Soil - 50m-Hard Rock -50m
0.6
0.5
0.4
ý3~
0.2
o.1\\ \
0.
0 10 20 30 40 50Frequency, Hz
Comparison of Vertical Coherency Functions
0.9
0.8
0.7
0.6
t 0.50
0.4
0.3
0.2
0.1
10 20 30 40
Frequency, Hz
50
Figure 1Comparison of Hard Rock (Abrahamson, 2007) and Soil (Abrahamson, 2005, 2006)Coherency Functions
2
ASB310 -5310out75'
sCv417
406
40
417out
-10'
-20'
l2Omc
-10'
-20'
80mc;
120 0120out
75' Cis_10, 538 538out
-10m 75'
538mc--V80
535mc:
1535
5I
z
ASBscv Y
NodeNumber401406417417out1
8080mc120120out120mc310310out
535
535mc538538out538mc
LocationBase of Steel Containment VesselLow on Steel Containment VesselTop of Steel Containment VesselSteel Containment Vessel OutriggerFoundation of Auxiliary Shield Building,Low on Auxiliary Shield BuildingLow on Auxiliary Shield Building Mass CenterTop of Auxiliary BuildingTop of Auxiliary Building OutriggerTop of Auxiliary Building Mass CenterTop of Shield BuildingShield Building OutriggerBase of Containment Internal StructureLow on Containment Internal StructureLow on Containment Internal Structure Mass CenterTop of Containment Internal StructureTop of Containment Internal Structure OutriggerTop of Containment Internal Structure Mass Center
_-Z150r -"-/
Figure 2Locations on the AP1000-Based Stick Model where In-Structure Response Spectraare Computed
3
Three sets of analyses have been performed for the example structural model:
1. SSI analysis with coherent input motion (dark blue curves in response spectrafigures); identical results to those reported in Chapter 5, EPRI (2006).
2. SSI analysis with incoherent input motion; ground motion coherency functions - soil,surface foundations (Abrahamson, 2005, 2006) (green curves in response spectrafigures - denoted NAA 2005-2006); identical results to those reported in Chapter 5,EPRI (2006).
3. SSI analysis with incoherent input motion; ground motion coherency functions - hardrock, surface and embedded foundations (Abrahamson, 2007) (red curves in responsespectra figures - denoted NAA 2007).
To evaluate the effects of hard rock ground motion coherency functions on in-structureresponse, response spectra were calculated and compared for the various analyses at thetops of the structure sticks, at lower elevations on the structure sticks, and on outriggersextending 65 or 75-ft. from the top of each stick in the X direction (these dimensionswere selected to approximately correspond to the AP1000 design dimensions).
SSI and Incoherence
As background, the fixed-base modes of the three structure sticks provide some insightinto the dynamic behavior. The ASB has predominate modes with frequencies less than10 Hz with fundamental modes in the horizontal directions of 3.2 Hz (X-direction) and3.0 Hz (Y-direction); the fundamental mode in the vertical direction of frequency 9.9 Hz(Z-direction). Many modes participate in the response of the ASB. The predominatemodes of the SCV in the horizontal directions also have frequencies less than 10 Hz - thelowest frequency of an important X-direction mode being 5.5 Hz; Y-direction modebeing 6.14 Hz; the lowest frequency of an important vertical mode being 16 Hz. As withthe ASB, many modes participate in the response of the SCV. The predominant modesof the CIS have frequencies greater than 10 Hz. Many modes also participate in theresponse of the CIS.
The total mass of the structures is apportioned approximately ASB - 86%, CIS - 11%,and SCV - 3%, i.e., ignoring the mass of the foundation. The dynamic behavior of thethree stick model is coupled through the inter-connectivity of the sticks and naturaltorsion is induced throughout the three structures due to the eccentricities assumed in theASB and CIS structures.
Results presented are in-structure response spectra (5% damping) at the foundation and atpoints on each of the three models (ASB, SCV, CIS) as shown in Figure 2. Responses at*the top of each model and at approximately mid-height (referred to as "low on" aparticular structure within Figure 2), are calculated and compared. The near mid-heightlocations were selected to investigate the potential effect of incoherence on points wherehigher modes more fully participate in the response. Note that the ASB stick representsboth the auxiliary building and the shield building. The combined auxiliary and shieldbuilding extends up to the top of the auxiliary building at Node 120. Above this node andelevation, the ASB stick only represents the shield building. Hence, in addition to the topof the shield building and low in the combined ASB model, output was calculated and is
4
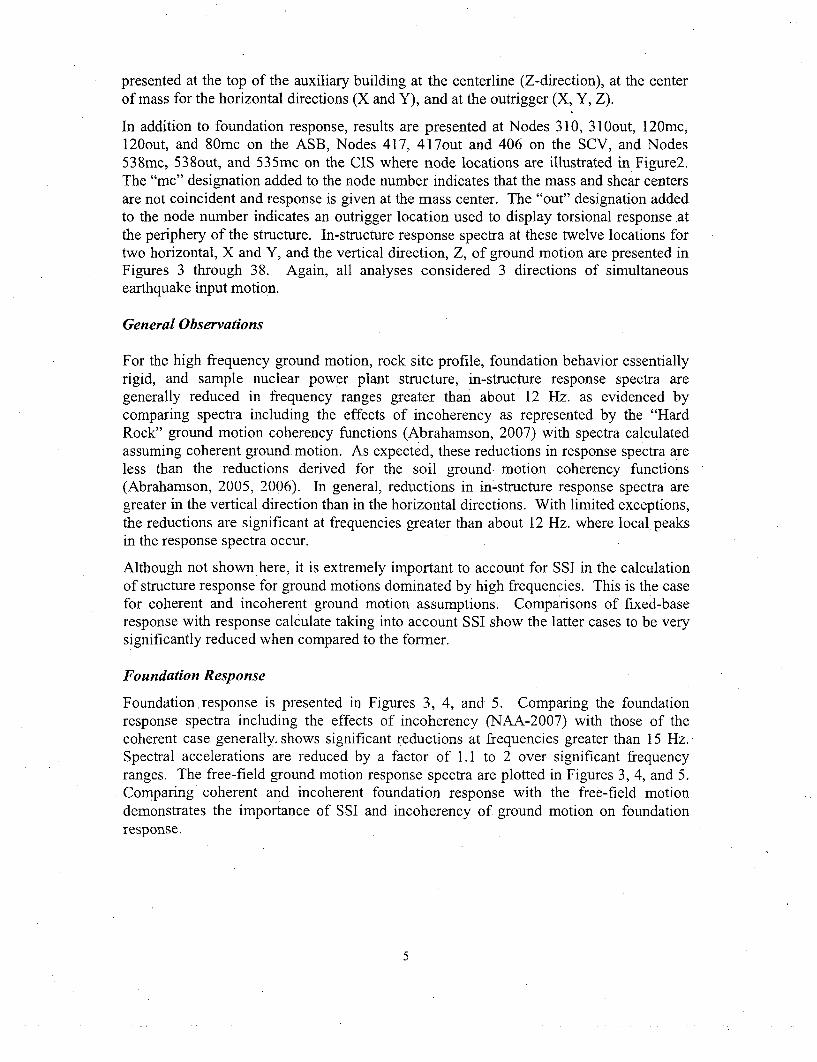
presented at the top of the auxiliary building at the centerline (Z-direction), at the centerof mass for the horizontal directions (X and Y), and at the outrigger (X, Y, Z).
In addition to foundation response, results are presented at Nodes 310, 310out, 120mc,120out, and 80mc on the ASB, Nodes 417, 417out and 406 on the SCV, and Nodes538mc, 538out, and 535mc on the CIS where node locations are illustrated in Figure2.The "mc" designation added to the node number indicates that the mass and shear centersare not coincident and response is given at the mass center. The "out" designation addedto the node number indicates an outrigger location used to display torsional response atthe periphery of the structure. In-structure response spectra at these twelve locations fortwo horizontal, X and Y, and the vertical direction, Z, of ground motion are presented inFigures 3 through 38. Again, all analyses considered 3 directions of simultaneousearthquake input motion.
General Observations
For the high frequency ground motion, rock site profile, foundation behavior essentiallyrigid, and sample nuclear power plant structure, in-structure response spectra aregenerally reduced in frequency ranges greater than about 12 Hz. as evidenced bycomparing spectra including the effects of incoherency as represented by the "HardRock" ground motion coherency functions (Abrahamson, 2007) with spectra calculatedassuming coherent ground motion. As expected, these reductions in response spectra areless than the reductions derived for the soil ground motion coherency functions(Abrahamson, 2005, 2006). In general, reductions in in-structure response spectra aregreater in the vertical direction than in the horizontal directions. With limited exceptions,the reductions are significant at frequencies greater than about 12 Hz. where local peaksin the response spectra occur.
Although not shown here, it is extremely important to account for SSI in the calculationof structure response for ground motions dominated by high frequencies. This is the casefor coherent and incoherent ground motion assumptions. Comparisons of fixed-baseresponse with response calculate taking into account SSI show the latter cases to be verysignificantly reduced when compared to the former.
Foundation Response
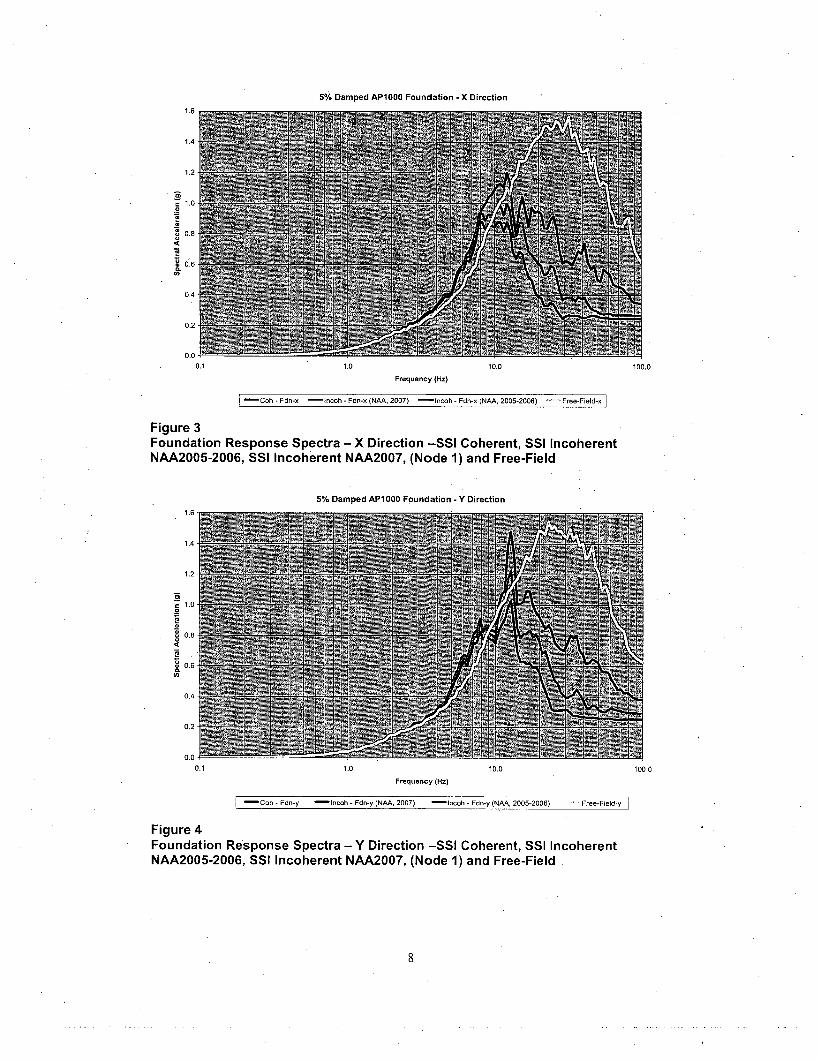
Foundation response is presented in Figures 3, 4, and 5. Comparing the foundationresponse spectra including the effects of incoherency (NAA-2007) with those of thecoherent case generally. shows significant reductions at frequencies greater than 15 Hz.Spectral accelerations are reduced by a factor of 1.1 to 2 over significant frequencyranges, The free-field ground motion response spectra are plotted in Figures 3, 4, and 5.Comparing coherent and incoherent foundation response with the free-field motiondemonstrates the importance of SSI and incoherency of ground motion on foundationresponse.
5
Auxiliary and Shield Building (ASB)
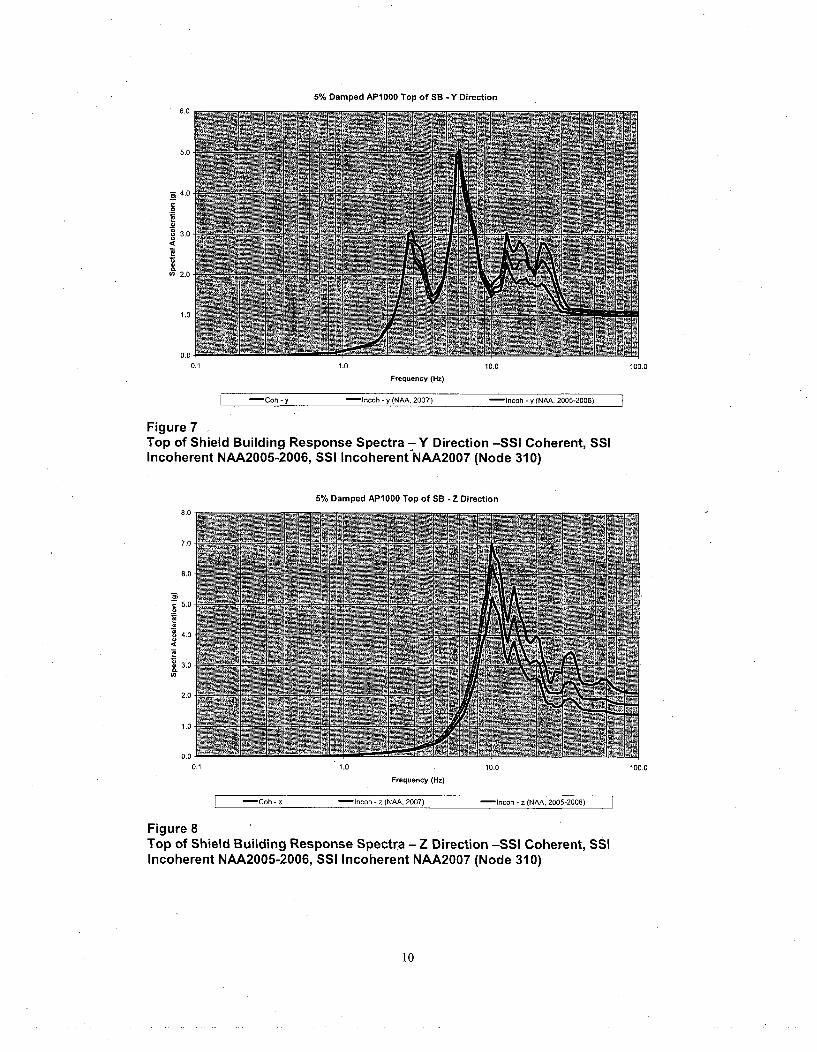
* Top of Shield Building. Responses at the top of the coupled auxiliary and shieldbuilding (ASB) are presented in Figures 6, 7, and 8. Comparing the response spectradue to incoherency effects (Analysis 3) with those of Analysis 1, generally, showsreductions due to incoherency for frequencies greater than '12 Hz. For horizontaldirections, the reductions are range from no reduction to a factor of about 2. For thevertical direction, reductions are observed in the frequency range above 10 Hz,including at the ZPA frequency.
At a frequency of peak amplification less than 10 Hz (X-direction 6.5 Hz; Y-direction6 Hz), slight increases in spectral accelerations of the incoherent case above thecoherent case are observed. As for Analysis Case 2, this is attributed to the effect ofinduced rotations of the foundation.
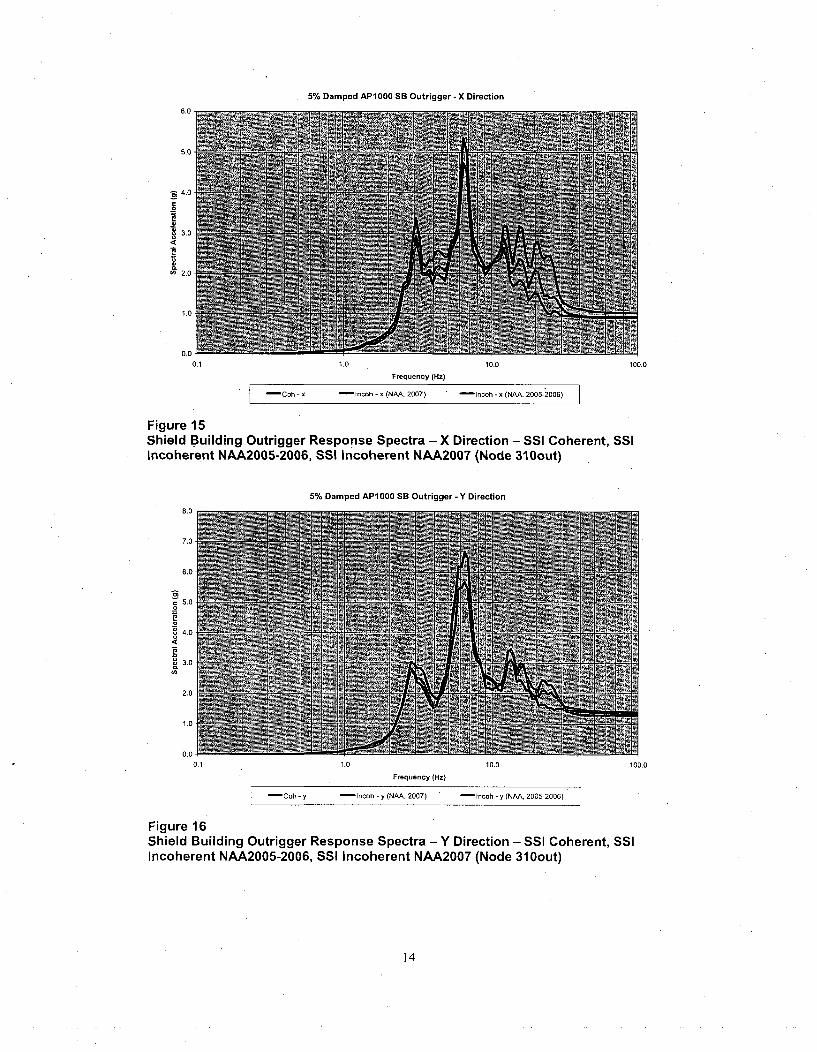
The responses of the outrigger, extending 75-ft. in the X-direction, are presented inFigures 15, 16, and 17. The reductions in response spectral accelerations generallyfollow the trend of the values on the centerline, but the reductions are observed to beless. The effects of incoherence induced torsion are shown in Figure 16 Y-directionresponse, where the responses calculated due to coherence and incoherence (blue andred curves) are relatively close for frequencies above 12 Hz. At frequencies of peakamplification less than 10 Hz (X- and Y-directions 6.5 Hz.), slight increases inspectral accelerations of the incoherent case above the coherent case are observed.This is attributed to the effect of induced rotations of the foundation.
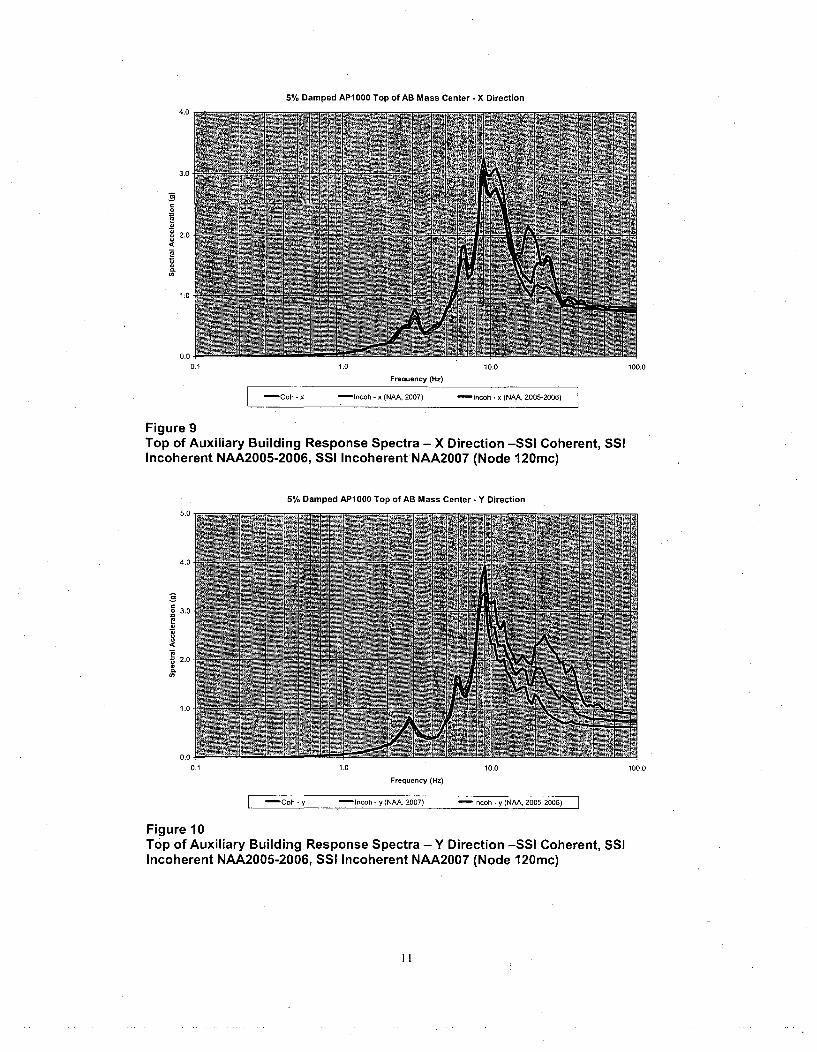
Top of Auxiliary Building. Responses at the top of the auxiliary building arepresented in Figures 9, 10, and 11. In the X-direction, spectral accelerations arereduced by a factor of 1 (no reduction) to about 1.4 due to incoherence forfrequencies greater than about 14 Hz. In the Y-direction, reductions in the responseare observed for frequencies greater than 10 Hz up to and including the ZPA. Thereare no observed low-frequency exceedances of the incoherent responses at thislocation.
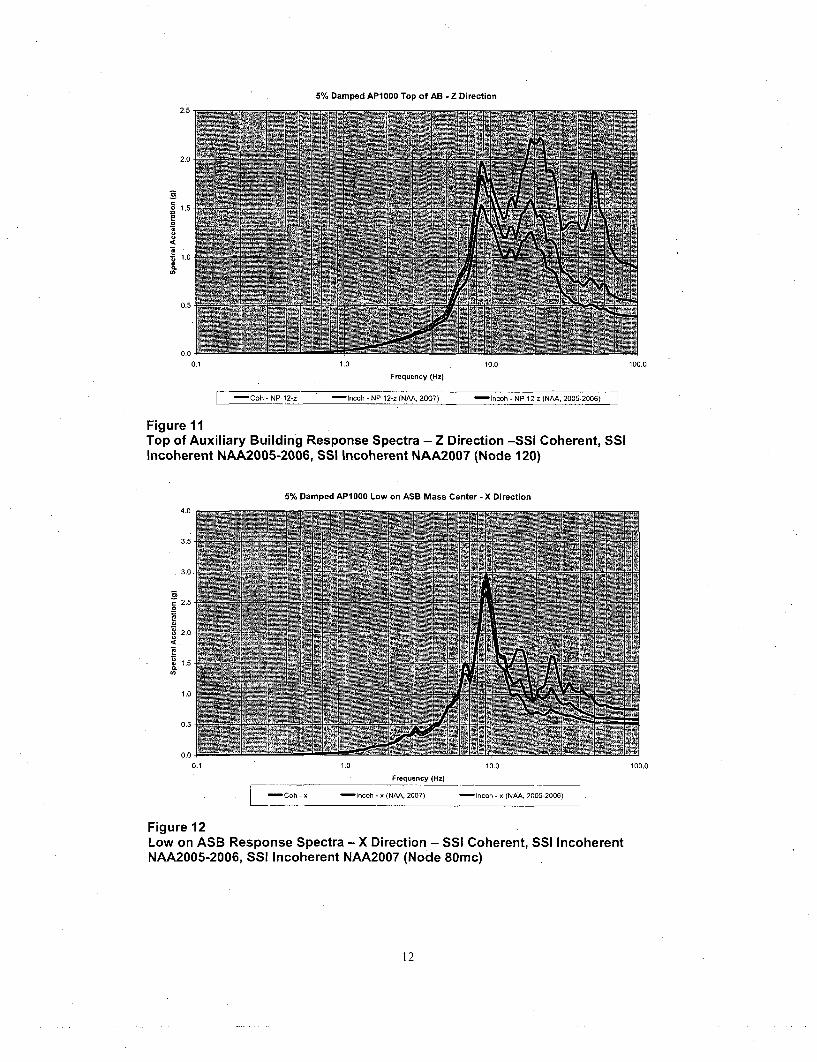
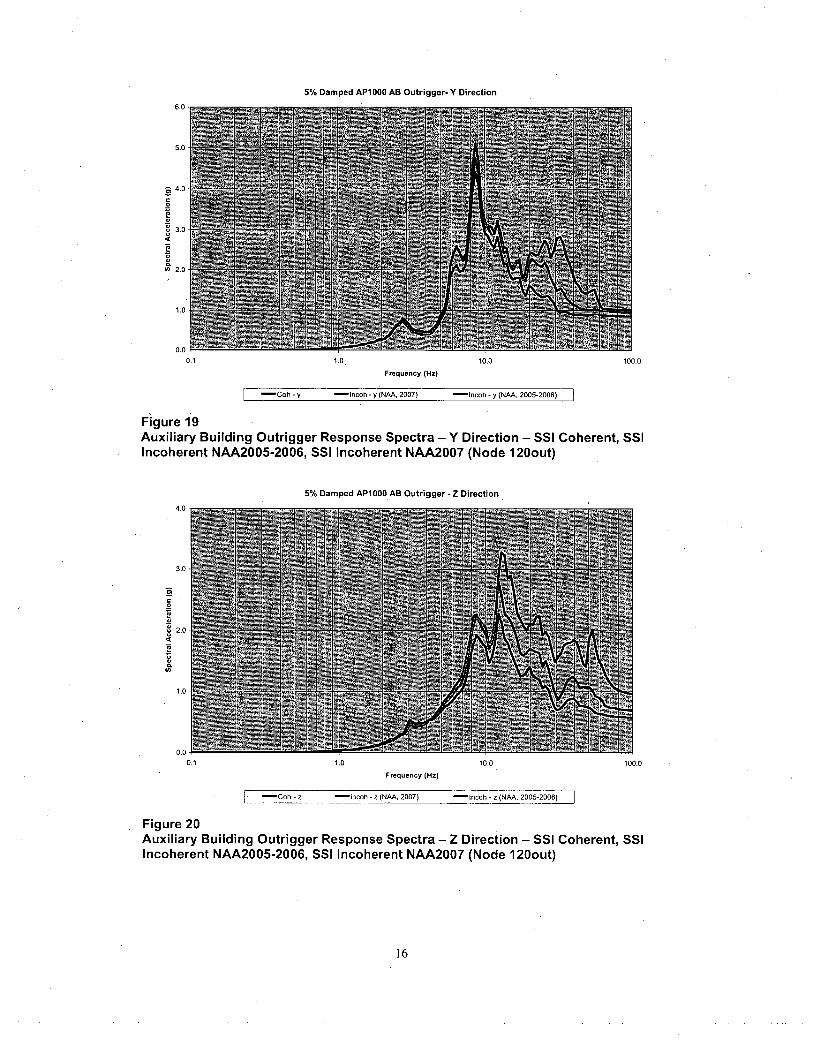
The responses of the outrigger, extending 75-ft. in the X-direction, are presented inFigures 18, 19, and 20. Thereductions in response spectral accelerations generallyfollow the trend of the values of the points at the mass centers, but the reductions areobserved to be less. The X-direction response is close to the same as the response atthe center of mass. The Y-direction response demonstrates the effects of inducedtorsion when compared to the response at the center of mass. The Y-directionresponse has significant reductions incoherent to coherent in the frequency range of20 - 60 Hz. Vertical response spectra are significantly reduced for frequenciesgreater than about 12 Hz.
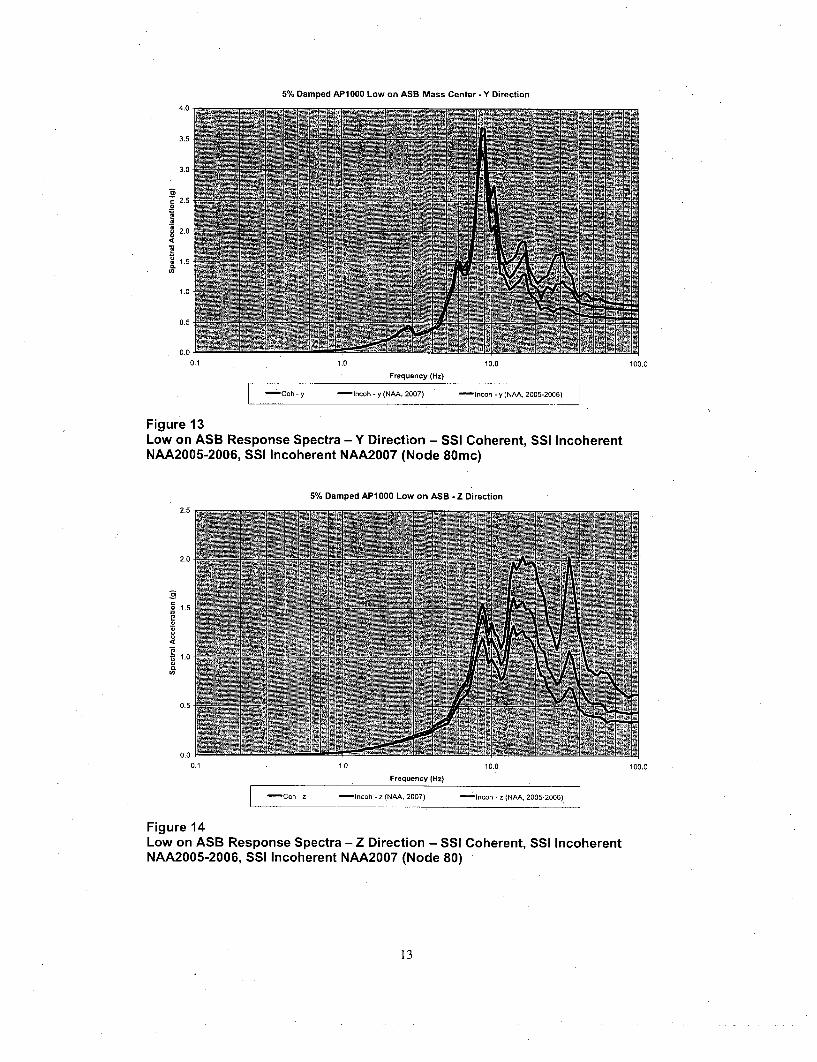
Low in ASB. Responses at a lower elevation of the coupled auxiliary and shieldbuilding (ASB) are presented in Figures 12, 13, and 14. Generally, these spectra inthe horizontal directions demonstrate reductions in the spectral accelerations atfrequencies greater than 20 Hz. Generally, the response reductions in the verticaldirection are significant for frequencies greater than 12 Hz.
6
Steel Containment Vessel (SCV)
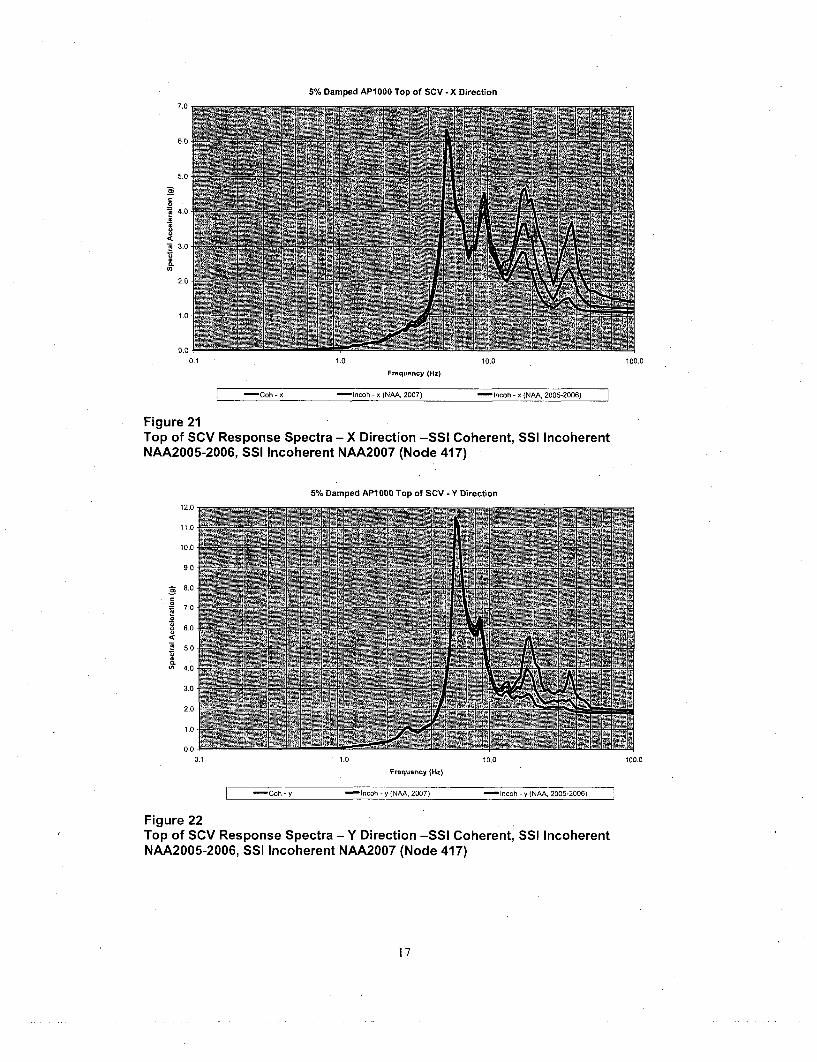
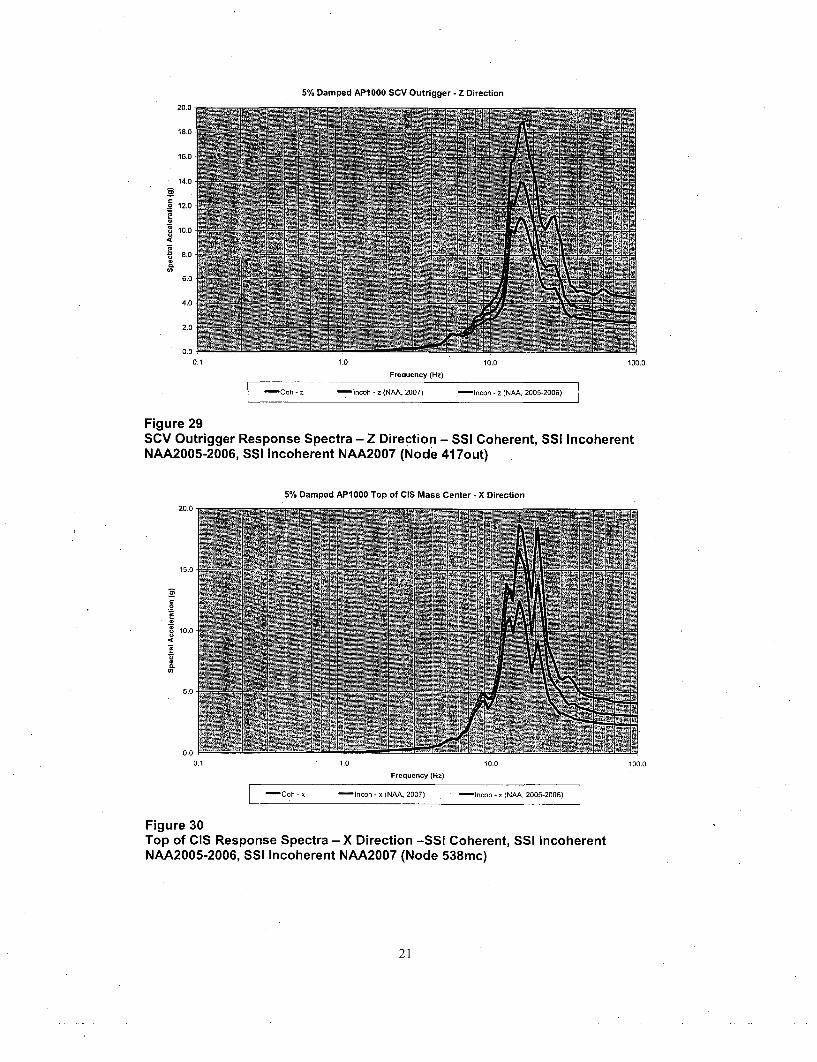
* Top of SCV. Response at the top of the steel containment vessel (SCV) at thecenterline is.presented in Figures 21, 22, and 23. Comparing the response spectra dueto incoherency effects (Analysis 3) with those of Analysis 1, generally, showsignificant reductions in response for frequencies greater than about 15 Hz with lessreduction at the ZPA. In the vertical direction, significant reductions are observed forall frequencies greater than 12 Hz.
The responses of the outrigger extending 65-ft in the X direction from the top of thesteel containment vessel (SCV) are presented in Figures 27, 28, and 29. Reductionsin response spectral accelerations are observed for frequencies greater than about 15Hz in the X-direction. The Y-direction response demonstrates the effect of inducedtorsion coupled with a significant torsional mode at about 12 Hz. - the incoherentresponse exceeds the coherent response by about a factor of 1.15. At higherfrequencies in the Y-direction response, the peak spectral accelerations are reducedwhen accounting for incoherency. Significant reductions in the vertical direction areobserved for frequencies greater than about 12 Hz.
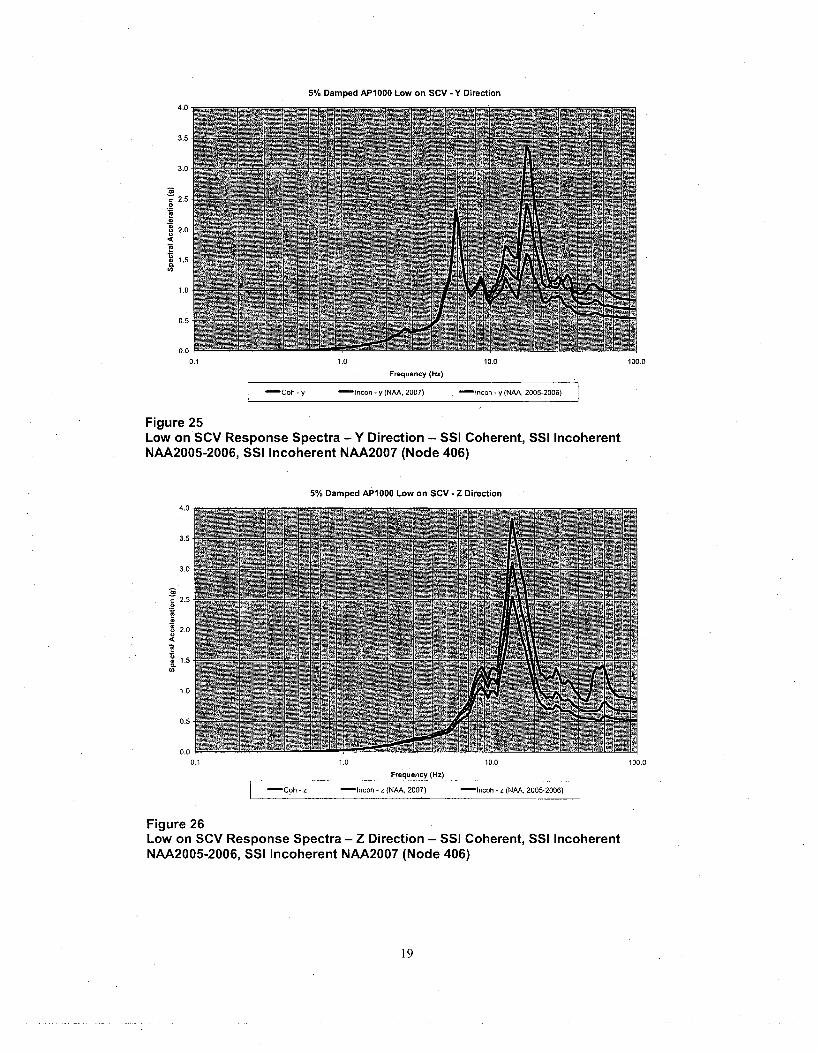
* Low in the SCV. Responses at lower elevations of the steel containment vessel(SCV) are presented in Figures 24, 25, and 26. These spectra demonstrate similarbehavior to that seen on the centerline at the top of the SCV.
Containment Internal Structure (CIS)
" Top of CIS. Responses at the top of the containment internal structure (CIS) at thecenter of mass are presented in Figures 30, 31, and 32. Comparing the responsespectra due to incoherency effects (Analysis 3) with those of Analysis 1, generally,shows significant reductions over those due to coherent SSI effects at frequenciesgreater than about 12 Hz. These reductions range from factors of 1.0 (no reduction)to 1.5. For vertical response, significant reductions occur for frequencies greater thanabout 15 Hz.
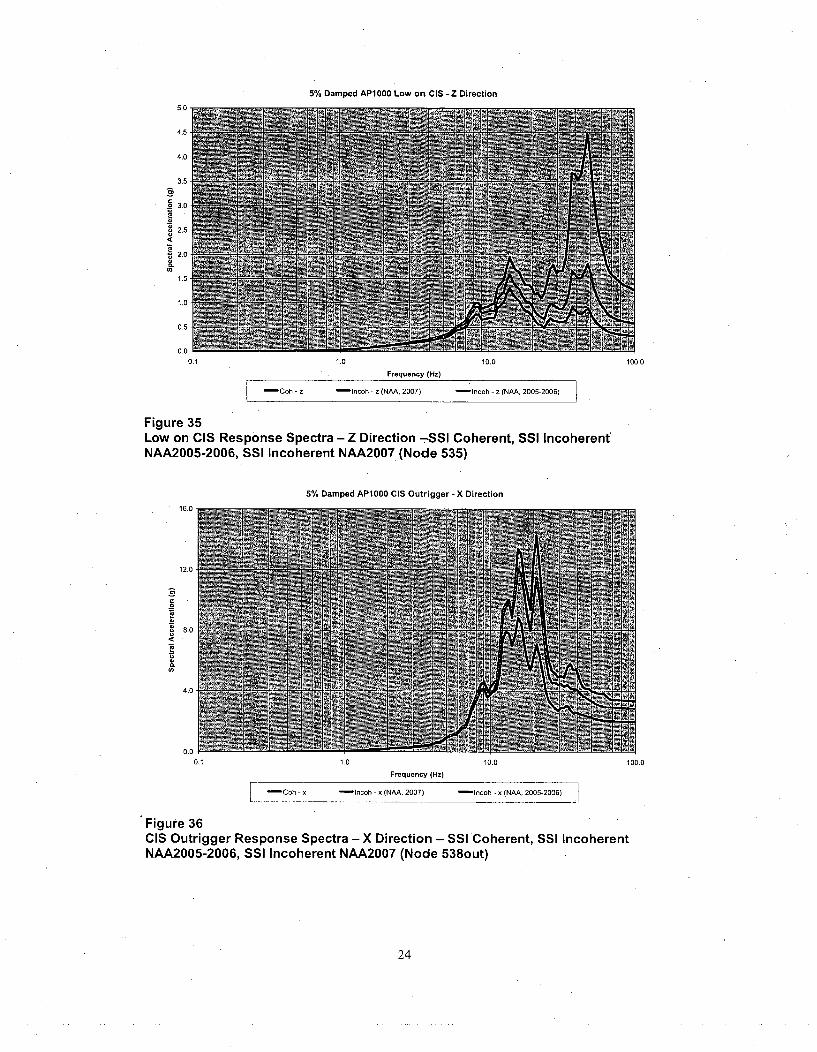
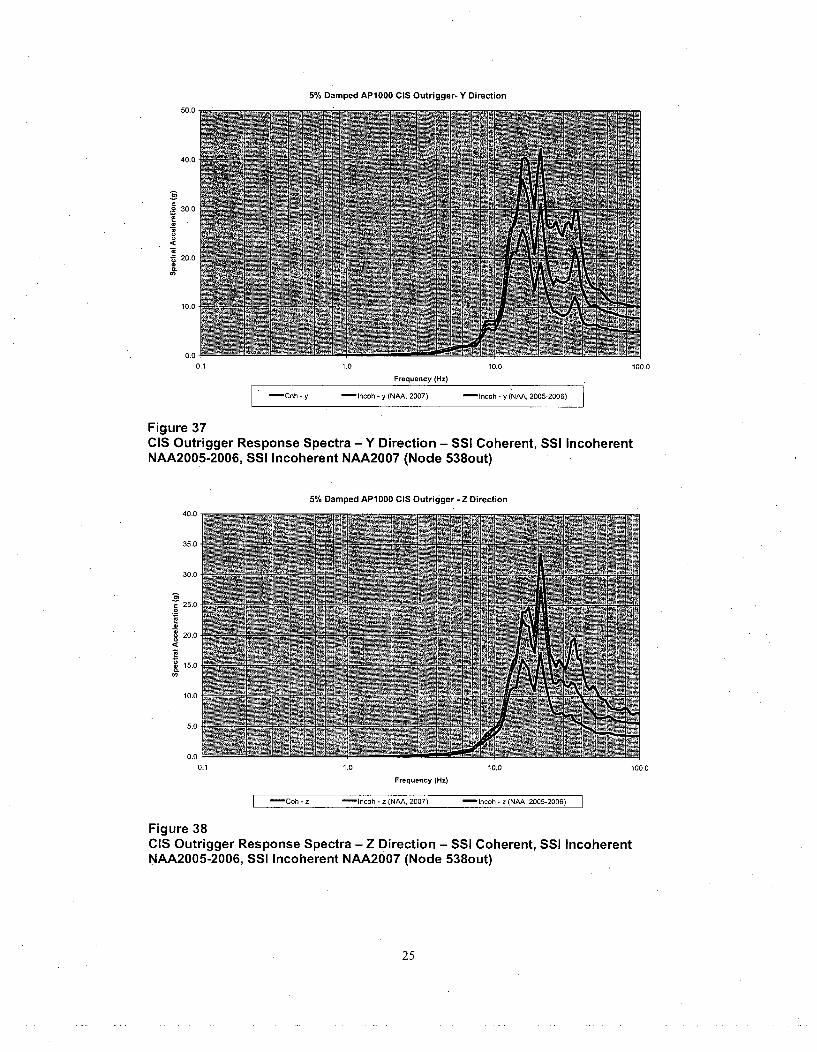
Responses of the outrigger extending 75-ft in the X direction from the top of thecontainment internal structure (CIS) are presented in Figures 36, 37, and 38.Reductions in response spectral accelerations are observed in all three directions atthis location at frequencies greater than about 12 Hz. Reductions range from factorsof 1.0 (no reduction) to about a factor of 2.
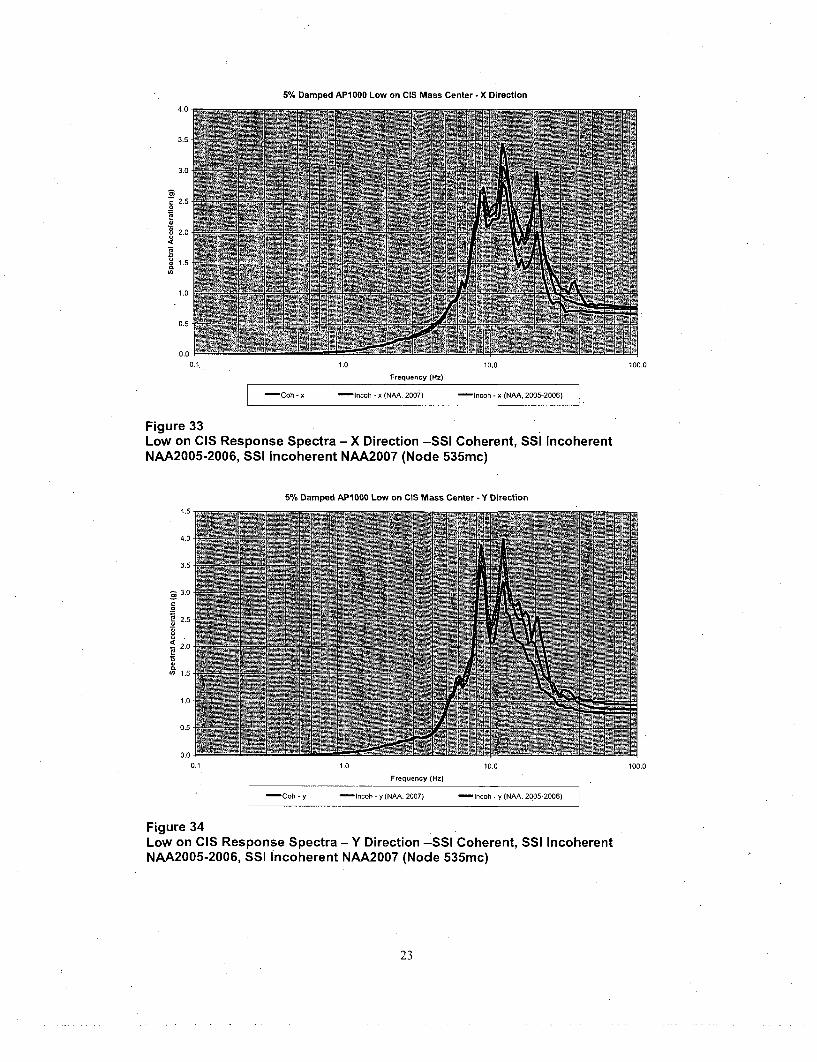
" Low in the CIS. Responses at lower elevations of the containment internal structure(CIS) are presented in Figures 33, 34, and 35. Generally, responses in the horizontal,directions show minimal reductions compared to the coherent case. For the verticaldirection significant reductions occur for frequencies greater than about 11 Hz.
Conclusions
The fundamental conclusion is that there are significant reductions in high-frequencyresponse due to seismic wave incoherence even for the "Hard Rock" ground motioncoherency functions.
7
5% Damped AP1000 Foundation - X Direction
1.4-
1.2-
S1.0-
6.6.
0.4-
0.2.
0.0-
0.1 1.0 10.0
Frequency (Hz)
Coh- Fdn-x -lncoh- Fdn-x (NAA, 2007) -lncoh- Fdn-x (NAA,2005-2006) Free-Fied-x
Figure 3Foundation Response Spectra - X Direction -SSI Coherent, SSI IncoherentNAA2005-2006, SSI Incoherent NAA2007, (Node 1) and Free-Field
5% Damped AP1000 Foundation - Y Direction1.6
1.4
1.2
z1.0
0.8u
,<A
S0.6
0.4-r
0.2
0.0,0.1 1.0 10.0
Frequency (Hz)
Coh- Fdn-y - Incoh - Fdn-y (NAA, 2007) -ncoh - Fdn-y (NAA, 2005-2006) Free-Field o
Figure 4Foundation Response Spectra - Y Direction -SSI Coherent, SSI IncoherentNAA2005-2006, SSl Incoherent NAA2007, (Node 1) and Free-Field
100.0
100.0
8

5% Damped AP1000 Foundation - Z Direction
1.6
1.4
1.2
u 1.0
u 0.8
a 0.6
0.4
0.2
0.00.1 1.0 10.0
Frequency (Hz)
100.0
I -Coh - Fdn-z -lncoh - Fdn-z (NAA, 2007) -lncoh - Fdn-z (NAA, 2005-2006) SFree-Field-z I
Figure 5Foundation Response Spectra - Z Direction -SSI Coherent, SSI IncoherentNAA2005-2006, SSI Incoherent NAA2007, (Node 1) and Free-Field
5% Damped AP1000 Top of SB - X Direction
8.0
7.0
6.0
= 5.0.2o
u 4.0u
a 3.0
2.0
1.0
0.0 ,0.1 1.0 10.0 100.0
Frequency (Hz)
I Coh - x Incoh - x (NAA, 2007) -- Incoh - x (NAA, 2005-2006)
Figure 6Top of Shield Building Response Spectra - X Direction -SSI Coherent, SSIIncoherent NAA2005-2006, SSI Incoherent NAA2007 (Node 310)
9
5% Damped AP1000 Top of SB -Y Direction
6.0
5.0"
4.0-
u 3.0 .
S2.0-
0.0,
0.1 1.0 10.0
Frequency (Hz)
44Coh - y ,lncoh -y (NAA, 2007) ,lncoh - y (NAA, 2005-2006) 3
Figure 7Top of Shield Building Response Spectra - Y Direction -SSI Coherent, SSIIncoherent NAAo2005-2006, SSI Incoherent NAA•2007 (Node 310)
5% Damped AP1 000 Top of SB - Z Direction
8.0
7.0
6.0
S5.0-
. 4.0
4.03 .0
2.0
1.0
0.0 ,
0.1 1.0 10.0
Frequency (Hz)
Coh - Z -Incoh -z (NAA, 2007) -. Incoh - z (NAA, 2005-2006)
Figure 8Top of Shield Building Response Spectra - Z Direction -SSI Coherent, SSIIncoherent NAA2005-2006, SSI Incoherent NAA2007 (Node 310)
100.0
100.0
10
5% Damped AP1000 Top of AB Mass Center - X Direction
4.0
3.0
8= 2.0
10
2.0
0.00.1 1.0 10.0 100.0
Frequency (Hz)
Coh - x -lncoh - x (NAA, 2007) -lncoh - x (NAA, 2005-2006)
Figure 9Top of Auxiliary Building Response Spectra - X Direction -SSI Coherent, SSIIncoherent NAA2005-2006, SSI Incoherent NAA2007 (Node 120mc)
5% Damped AP1000 Top of AB Mass Center -Y Direction
5.0
4.0
0 3.0
1 2.0
1.0
0.00.1 1.0 10.0
Frequency (Hz)
-Coh - y -Incoh - y (NAA, 2007) -lncoh - y (NAA, 2005-2006)
100.0
Figure 10Top of Auxiliary Building Response Spectra - Y Direction -SSI Coherent, SSIIncoherent NAA2005-2006, SSI Incoherent NAA2007 (Node 120mc)
I1
5% Damped AP1000 Top of AB - Z Direction
2.5
2.0
o 1.5
S1.0
0.5
0.0
0.1 1.0 10.0 100.0
Frequency (Hz)
-Coh - NP 12-z -lncoh - NP 12-z (NAA, 2007) -lncoh - NP 12-z (NAA, 2005-2006) 7
Figure 11Top of Auxiliary Building Response Spectra - Z Direction -SSI Coherent, SSIIncoherent NAA2005-2006, SSI Incoherent NAA2007 (Node 120)
5% Damped AP1000 Low on ASB Mass Center -X Direction
4.0
3.5
3.0
c 2.5
o 2.0
u 1.5
1.0
0.5
0.0
0.1 1.0 10.0
Frequency (Hz)
F Coh - x lncoh - x (NAA, 2007) -lncoh - x (NAA, 2005-2006)
Figure 12Low on ASB Response Spectra - X Direction - SSI Coherent, SSI IncoherentNAA2005-2006, SS! Incoherent NAA2007 (Node 80mc)
100.0
12
5% Damped AP1 000 Low on ASB Mass Center -Y Direction
4.0
3.5
3.0
c 2.5
8 2.0
, 1.5
1.0
0.5
0.00.1 1.0 10.0 100.0
Frequency (Hz)
-- ooh - y - ncoh - y (NAA.2007) - lnco - y (NAA, 2005-2006)
Figure 13Low on ASB Response Spectra - Y Direction - SSI Coherent, SSI IncoherentNAA2005-2006, SSI Incoherent NAA2007 (Node 80mc)
5% Damped APN000 Low on ASB -Z Direction
2.5
2.0
0 1.5
1.0
U)
0.5
0.00.1 106 10.0
Frequency (Hz)
Coh - z -lncoh - z (NAA, 2007) -lncoh - z (NAA, 2005-2006)
100.0
Figure 14Low on ASB Response Spectra - Z Direction - SSI Coherent, SSI IncoherentNAA2005-2006, SSI Incoherent NAA2007 (Node 80)
13
5% Damped API000 SB Outrigger - X Direction
6.0
5.0
4.0
, 3.0
O 2.0
1.0
0.0
0.1 1.0 10.0
Frequency (Hz)
Con - x InCoh - x (NAA, 2007) Incoh - x (NAA, 2005-.2006)
100.0
Figure 15Shield Building Outrigger Response Spectra - X Direction - SSI Coherent, SSIIncoherent NAA2005-2006, SSI Incoherent NAA2007 (Node 310out)
5% Damped AP1000 SB Outrigger -Y Direction
8.0
7.0
6.0
5.0.2o
84.o.
3.0.
2.0"
1.0
2.0
0.11.0 10.0 100.0
Frequency (Hz)
Coh - y Irlcoh - y (NAA, 2007) Ilncoh - y (NAA, 2005-2006)
Figure 16Shield Building Outrigger Response Spectra - Y Direction - SSI Coherent, SSIIncoherent NAA2005-2006, SSI Incoherent NAA2007 (Node 310out)
14

5% Damped AP1000 SB Outrigger - Z Direction
12
14.0
13.0
12.0
11.0
10.0
9.0
8.0
7.0
6.0
5.0
4.0
3.0
2.0
1.0
0.00.1 1.0 10.0 100.0
Frequency (Hz)
Coh - z -lncoh - z (NAA, 2007) - lncoh - z (NAA, 2005-2006)
Figure 17Shield Building Outrigger Response Spectra - Z Direction - SSI Coherent, SSIIncoherent NAA2005-2006, SSI Incoherent NAA2007 (Node 310out)
5% Damped AP1 000 AB Outrigger -X Direction
6.0
5.0
4.0
5 3.0
4' 2.0
1.0
0.00.1 1.0 10.0
Frequency (Hz)
- x -Incoh - x (NAA, 2007) - Incoh - x (NAA, 2005-2006)
100.0
Figure 18Auxiliary Building Outrigger Response Spectra - X Direction - SSI Coherent, SSIIncoherent NAA2005-2006, SSI Incoherent NAA2007 (Node 120out)
15
5% Damped AP1000 AB Outrigger- Y Direction
6.0.
5.0
4.0,
3.0
1.0'
0.0
0.1 1.0. 10.0 100.0
Frequency (Hz)
[ Coh - y -Incoh y (NAA, 2007) rlncoh - y (NAA, 2005-2006)
Figure 19Auxiliary Building Outrigger Response Spectra - Y Direction - SSI Coherent, SSIIncoherent NAA2005-2006, SSI Incoherent NAA2007 (Node 120out)
5% Damped AP1 000 AB Outrigger - Z Direction
4.0
3.0
32.0
1.0
0.0 ,",
0.1 1.0 10.0 100.0
Frequency (Hz)
Coh - z Incoh - z (NAA, 2007) tIncoh - z (NAA. 2005-2006)
Figure 20Auxiliary Building Outrigger Response Spectra - Z Direction - SSl Coherent, SSIIncoherent NAA2005-2006, SSl Incoherent NAA2007 (Node 120out)
16
5% Damped APN000 Top of SCV -X Direction
7.0.
6.0¸
5.0
o*4.0
7ý 3.0
2.0
1.0
0.1 1.0 10.0
Frequency (Hz)
Coh - x Incol- x (NAA, 2007) 00ncoh - x (NAA 2005-2006)
Figure 21Top of SCV Response Spectra - X Direction -SSI Coherent, SSI IncoherentNAA2005-2006, SSI Incoherent NAA2007 (Node 417)
5% Damped AP 000 Top of SCV - Y Direction
100.0
o=
12.0
11.0
10.0
9.0
8.0
7.0
6.0
5.0
4.0
3.0
2.0
1.0
0.00.1 1.0 10.0
Frequency (Hz)
[ Coh - y -Incoh - y (NAA, 2007) Incoh - y (NAA, 2005-2006)
Figure 22Top of SCV Response Spectra - Y Direction -SSI Coherent, SSl IncoherentNAA2005-2006, SSl Incoherent NAA2007 (Node 417)
100.0
17

5% Damped AP1000 Top of SCV- Z Direction
18.0
16.0
14.0
- 12.0
0 10.0
8.0
Cf 6.0
4.0
2.0
0.00.1 1.0 10.0 100.0
Frequency (Hz)
- Coh - z -Incoh - z (NAA, 2007) .- lncoh - z (NAA, 2005-2006)
Figure 23Top of SCV Response Spectra - Z Direction -SSI Coherent, SSI IncoherentNAA2005-2006, SSI Incoherent NAA2007 (Node 417)
5% Damped AP1000 Low on SCV - X Direction
2.5
2.0
o 1.0
1.0-
0.5
0.00.1 1.0 10.0 100.0
Frequency (H.)
Coh - x lIncoh - x (NAA, 2007) lIncoh - x (NAA, 2005-2006)
Figure 24Low on SCV Response Spectra - X Direction - SSI Coherent, SSI IncoherentNAA2005-2006, SSI Incoherent NAA2007 (Node 406)
18
5% Damped AP1000 Low on SCV -Y Direction
4.0
3.5
3.0
• 2.5
, 2.0
o1.5
1.0
0.5
0.00.1 1.0 10.0 100.0
Frequency (Hz)
Coh - y - lncoh - y (NAA, 2007) - incoh - y (NAA, 2005-2006)
Figure 25Low on SCV Response Spectra - Y Direction - SSI Coherent, SSI IncoherentNAA2005-2006, SSI Incoherent NAA2007 (Node 406)
5% Damped AP1000 Low on SCV - Z Direction
4.0
3.5
3.0
2.5
5 2.0
o 1.5
1.0
0.5
0.00.1 1.0 10.0
Frequency (Hz)
Coh - z -Incoh - z (NAA, 2007) - lncoh - z (NA, 2005-2006)
100.0
Figure 26Low on SCV Response Spectra - Z Direction - SSI Coherent, SSI IncoherentNAA2005-2006, SSI Incoherent NAA2007 (Node 406)
19

5% Damped AP1000 SCV Outrigger -X Direction
9.0
8.0
7.0
" 6.0
0 5.0
4.0
' 3.0
2.0
1.0
0.00.1
I
1.0 10.0 100.0
Frequency (Hz)
S- x •tncoh - x (NAA, 2007) -lncoh - x (NAA, 2005-2006)
Figure 27SCV Outrigger Response Spectra - X Direction - SSI Coherent, SSI IncoherentNAA2005-2006, SSI Incoherent NAA2007 (Node 417out)
5% Damped AP1000 SCV Outrigger - Y Direction
o=
12.0
11.0
10.0
9.0
8.0
7T0
6.0
5.0
4.0
3.0
2.0
1.0
0.00.1 1.0 10.0 100.0
Frequency (Hz)
Coh - y lncoh - y (NAA. 2007) -lncoh - y (NAA, 2005-2006)
Figure 28SCV Outrigger Response Spectra - Y Direction - SSI Coherent, SSI IncoherentNAA2005-2006, SSI Incoherent NAA2007 (Node 417out)
20
5% Damped AP1000 SCV Outrigger - Z Direction
20.0
18.0
16.0
14.0
.o 12.0
10.0
8.0
6.0
4.0
2.0
0.00.1 1.0 10.0 100.0
Frequency. (Hz)
Coh - z -lncoh - z (NAA, 2007) tIncoh - z (NAA, 2005-2006) 1
Figure 29SCV Outrigger Response Spectra - Z Direction - SSI Coherent, SSI IncoherentNAA2005-2006, SSI Incoherent NAA2007 (Node 417out)
5% Damped AP1000 Top of CIS Mass Center - X Direction
20.0
15.0
o0 10.0
5.0
0.0 4-0.1 1.0 10.0 100.0
Frequency (Hz)
Coh - x -lncoh - x (NAA, 2007) 1 lncoh - x (NAA, 2005-2006)
Figure 30Top of CIS Response Spectra - X Direction -SSI Coherent, SSI IncoherentNAA2005-2006, SSI Incoherent NAA2007 (Node 538mc)
21

5% Damped AP1000 Top of CIS Mass Center - Y Direction
25.0
20.0
o 15.0
• 10.0
5.0
0.00.1 1.0 10.0 100.0
Frequency (Hz)
Coh - y - lncoh - y (NAA. 2007) - Incoh - y (NAA, 2005-2006)
Figure 31Top of CIS Response Spectra - Y Direction -SSI Coherent, SSI IncoherentNAA2005-2006, SSI Incoherent NAA2007 (Node 538mc)
5% Damped AP1000 Top of CIS -Z Direction
8.0
6.0
4.0
2.0
0.00.1 1.0 10.0
Frequency (Hz)
-Coh - z - Incoh - z (NA', 2007) - Incoh - z (NAA. 2005-2006)
Figure 32Top of CIS Response Spectra - Z Direction -SSl Coherent, SSI IncoherentNAA2005-2006, SSl Incoherent NAA2007 (Node 538)
100.0
22
5% Damped APING0 Low on CIS Mass Center -X Direction
4.0
3.5
3.0
. 2.5
2.04
. 1.5
1.0
0.5
0.0
0.1. 1.0 10.0 100.0
Frequency (Hz)
Coh - x -Incoh - x (NAA, 2007) -lncoh - x (NAA, 2005-2006)
Figure 33Low on CIS Response Spectra - X Direction -SSI Coherent, ssi IncoherentNAA2005-2006, SSI Incoherent NAA2007 (Node 535mc)
5% Damped AP1000 Low on CIS Mass Center -Y Direction
4.5
4.0
3.5
3.0
. 2.5
u
- 2.0
00 1.5
1.0
0.5
0.0
0.1 1.0 10.0 100.0
Frequency (Hz)
Coh- y -lncoh - y (NAA, 2007) -lncoh - y (NAA, 2005-2006)
Figure 34Low on CIS Response Spectra - Y Direction -SSI Coherent, SSI IncoherentNAA2005-2006, SSI incoherent NAA2007 (Node 535mc)
23
5% Damped AP1000 Low on CIS -Z Direction
5.0
4.5
4.0
3.5
0 3.0
c 2.5
2.0.
1.5
1.0
0.5
0.00.1 1.0 10.0 100.0
Frequency (Hz)
Coh - z mlncoh - z (NAA, 2007) - lncoh - z (NAA, 2005-2006)
Figure 35Low on CIS Response Spectra - Z Direction -SSI Coherent, SSI IncoherentNAA2005-2006, SSI Incoherent NAA2007 (Node 535)
5% Damped AP1000 CIS Outrigger - X Direction
16.01•
12.0.
S8.0
4.0
0.0
0.1 1.0 10.0
Frequency (Hz)
100.0
F - Coh - x -lncoh - x (NAA, 2007) -lncoh - x (NAA, 2005-2006)I
Figure 36CIS Outrigger Response Spectra - X Direction - SSI Coherent, SSI IncoherentNAA2005-2006, SSI Incoherent NAA2007 (Node 538out)
24
5% Damped AP1000 CIS Outrigger- Y Direction
50.0
40.0
2 30.0
' 20.0
10.0
0.00.1 1.0 10.0 100.0
Frequency (Hz)
Coh - y -lncoh - y (NAA, 2007) lIncoh - y (NAA, 2005-2006)
Figure 37CIS Outrigger Response Spectra - Y Direction - SSI Coherent, SSI IncoherentNAA2005-2006, SSI Incoherent NAA2007 (Node 538out)
5% Damped AP1000 CIS Outrigger - Z Direction
40.0
35.0
30.0
o 25.0
u 20.0
015.
10.0
5.0
0.00.1 1.0 10.0
Frequency (Hz)
Goh - z lncoh - z (NAA, 2007) lncoh - z (NAA, 2005-2006)
100.0
Figure 38CIS Outrigger Response Spectra - Z Direction - SSI Coherent, SSI IncoherentNAA2005-2006, SSI Incoherent NAA2007 (Node 538out)
25
References
Abrahamson, N. (2006). Spatial Coherency for Soil-Structure Interaction, Electric PowerResearch Institute, Final Report 1014101, Palo Alto, CA. August (Draft).
Abrahamson, N. (2005). Spatial Coherency for Soil-Structure Interaction, Electric PowerResearch Institute, Technical Update Report 1012968, Palo Alto, CA. December.
Abrahamson, N. (2007). Hard Rock Coherency Functions Based on the Pinyon FlatData, April 2.
EPRI (2006), Program on Technology Innovation: Effect of Seismic Wave Incoherenceon Foundation and Building Response, Electric Power Research Institute, Final ReportTR-1013504, Palo Alto, CA. November.
26