Embed Size (px)
Citation preview
Effect of a Smart StartPlayground ImprovementGrant on Child CarePlayground Hazards
UNC Smart Start Evaluation TeamAugust 1998
EFFECT OF A SMART START PLAYGROUND IMPROVEMENT GRANT
ON CHILD CARE PLAYGROUND HAZARDS
1998 FPG Child Development Center
Jonathan Kotch and Christine GuthrieDepartment of Maternal and Child HealthSchool of Public HealthUniversity of North Carolina at Chapel Hill
The authors wish to thank Dee Gray, Beth Partington and Adam Zolotor for their work in developing,field testing and implementing the playground safety survey.
For additional copies of this report and other Smart Start evaluation reports, contact Marie Butts at theFrank Porter Graham Child Development Center, 105 Smith Level Road, CB# 8180, UNC-CH,Chapel Hill, NC 27599-8180 or call (919) 966-3871.
500 copies of this document were printed at a cost of $446.00, or $.90 per copy.
Introduction
The North Carolina Early Childhood Initiative, better known as SmartStart, is a partnership among state government, local leaders,service providers, and families to better serve young children. The main goal of
Smart Start is to ensure that all children enter school healthy and prepared to succeed.Smart Start’s innovative approach requires that local community partnerships plan howbest to meet the needs of children and families, by improving and expanding existingprograms and/or designing and implementing new programs. Using funds allocated bythe state legislature and additional funds contributed by the private sector, each partner-ship is working to improve the quality of child and family services.
All partnerships are obliged to spend no less than 70% of their resources on improvingthe availability, accessibility, and quality of child care. Given that recent studies in thehealth and child care literature have called attention to the safety of young children inout-of-home care, twenty five of Smart Start’s 47 partnerships (as of this writing) havechosen to spend some of their funds on reducing injury hazards on child care play-grounds. These 25 partnerships have allocated $4,165,763 for playground improve-ment projects since the initiation of Smart Start. The projects have included playgroundsafety assessment, planning and evaluation, quality enhancements (such as fencing,surfacing, and/or new equipment), and safety programs. In this report, the results ofvisual inspections of child care home and center playgrounds in a Smart Start countywhich invested $675,000 to improve child care playground safety are compared withthe results of similar inspections in a non-Smart Start county.
Effect of a Smart Start PlaygroundImprovement Grant on Child CarePlayground Safety Hazards
BackgroundConcern for the safety of children in out-of-home care is growing along with thenumber of such children. Studies of injuries among children in child care centershave demonstrated that most injuries occur on playgrounds and are the results of fallsaffecting the head and upper limbs. Such injuries appear to be related to reversiblehazards on child care playgrounds.
MethodologyThe Durham County Partnership for Children allocated $675,000 to the Durham DayCare Council for playground safety enhancements in child care centers and familychild care homes in the county. Some of this money was spent on child care play-ground hazard reduction. The Frank Porter Graham Smart Start Evaluation teammatched 17 child care facilities in Durham which used playground safety improve-ment grants with 17 similar facilities in Alamance County, a non-Smart Start county.Specially trained playground safety inspectors completed structured playgroundsafety surveys in all 34 child care facilities. The results were analyzed using t-testsand general linear modeling techniques.
ResultsOn each of 15 safety criteria, the Durham facilities were rated higher than theAlamance facilities. Eleven of these differences were statistically significant. Facili-ties were separated according to whether they were homes or centers, and theDurham facilities again scored consistently higher. Thirteen centers in Durham andno centers in Alamance were licensed at the AA level, but even when this differencewas taken into account, the results significantly favored the Smart Start centers inDurham. Six of the differences, including the total playground safety score, werestatistically significant.
Execu
tive S
um
mary
Execu
tive S
um
mary
DiscussionThe outcomes of this study demonstrate that improved child care playground safety isrelated to receipt of Smart Start playground improvement grants. This study alsodemonstrated the feasibility of conducting abbreviated playground safety surveys withminimal demand on the time of child care staff. A limitation of this study is the lackof a pre-test. It seems logical to conclude that playground safety improvementsresulting from Smart Start grants can reduce the injury rate among children, althoughanswering this question will require a longitudinal study of a larger number of childcare centers.
6 SMART START PLAYGROUND IMPROVEMENT
Effect of a Smart Start PlaygroundImprovement Grant on Child CarePlayground Safety Hazards
BACKGROUND
In response to concern for the safety of the growing number of children in out-of-homecare, some researchers and policy makers have looked at the numbers and rates ofinjuries at child care centers. Others have studied hazards or the adherence to play-ground safety standards in child care centers or family child care homes. Still othershave sought to obtain a comparison of the rate of injuries in out-of-home care versusown-home care in an attempt to answer the question, “Is out-of-home care as safe asown-home care?” These three approaches will be discussed in turn.
Studies have categorized child care injury by type and severity, cause of injury, site ofinjury, body part injured, day of injury, and season of injury. Most have looked only atinjuries that received medical attention. Only two studies attempted to identify minoror non-medically attended injuries. 1, 2 Rates of injury have been calculated for allinjuries in general and also for injuries by severity and age and sex of children. Somecommon conclusions that researchers have drawn are:
• falls, both indoor and outdoor, account for the largest proportion of injuries• 47–67% of injuries occur on the playground• the most severe injuries, such as fractures and concussions, occur as a result
of falls from playground equipment• the peak season for injuries is summer• peak times of day for child care injury are late morning and mid-afternoon• major body parts injured are the head and upper limbs.
Two studies noted that 88–90% of injuries were minor.3, 4 Chang and coworkers alsorecorded that the risk of injury was somewhat higher for boys than girls, particularlyyounger boys (2 to 3 years of age).4
Studies of adherence to playground safety recommendations include two from NorthCarolina. The first, a national survey of child care regulators, concluded that adherenceto national child care safety standards, as those promulgated by the American Associa-tion of Pediatrics and the American Public Health Association among others,5 was very
UNC SMART START EVALUATION 7
variable.6 A second study of a random sample of North Carolina child care centersspecifically demonstrated that, although center directors reported a wide range ofcompliance with the same standards, compliance was best when a standard wasreflected in a state regulation.7
Early reports of hazards and injuries in child care centers (1983-1988) seemed tosuggest that centers and family child care homes were unsafe.8, 9 A few researchers havetried to challenge this assertion. Rivara and coworkers concluded that child carecenters were at least as safe as home environments, if not safer.10 Similarly, Sacks andothers found injury rates in 71 Atlanta child care centers to be lower than publishedchild injury rates for the general population of preschool children.11 Gunn and col-leagues arrived at a similar conclusion.12 However, Kopjar and Wickizer conducted alarge, prospective study looking at child care and home care injury in Stavanger,Norway. They concluded that for children aged 6 months to 2 years, the risk of injury ishigher at home, but for children ages 3 to 6 years, the risk of injury at child care centersis similar to the risk of injury at home (1.3 and 1.5, respectively, per 100,000 child-hours).13 In other words, for the older age group, child care is no safer than home care.Kotch et al. (1997) also concluded, in their telephone survey study of three counties inNorth Carolina, that the rate of serious injury in child care centers is not different fromthe rate of injury occurring in children’s own homes.2
METHODOLOGY
Ideally, children in a safe, professionally supervised environment should experiencelower overall injury rates than children cared for at home. Children cared for at homeare exposed to both home injury hazards and the risk of motor vehicle injury whileaccompanying parents on errands. On the other hand children in out-of-home care,particularly those in centers, are in facilities subject to health and safety inspections atleast once a year for licensing purposes. Mindful that child care playground safetycould be improved, the Durham County Partnership for Children allocated $675,000 tothe Durham Day Care Council to improve playgrounds in Durham County child carecenters and child care homes. Distribution of the funds was at the discretion of theCouncil. The Frank Porter Graham Smart Start Evaluation team was interested in usingthis opportunity as a case study applying a cross-sectional design to the evaluation of aSmart Start health intervention.
PARTICIPANTS
All 17 child care facilities in Durham County that received Smart Start playground
8 SMART START PLAYGROUND IMPROVEMENT
quality enhancement grants from the Durham Day Care Council were recruited for thestudy sample. Alamance County, which was not a Smart Start county at the time, wasselected as the county from which to draw comparison playgrounds because of itsdemographic similarity and proximity to Durham. The child care facilities withinAlamance were selected on the basis of their ratings (AA, A, GS, or S), size (number ofchildren for which the center was licensed), acceptance or rejection of the purchase ofcare, the type of operator (church, independent, public, etc.), and the type of physicalfacility (converted house, built for child care, public school, etc.). Alamance centersand family child care homes were matched with their Durham equivalents based uponthe maximum number of similarities. There were insufficient numbers of AA centers inAlamance to use that criterion for matching.
MEASURES
Members of the Smart Start Health Evaluation team, Frank Porter Graham’s Head StartQuality Research team, and a playground safety consultant designed the playgroundsafety audit form. The form was designed to address the most salient playground haz-ards while being relatively short, easy to learn, and easy to use. The content was basedon the U.S. Consumer Product Safety Commission’s (CPSC) playground safety guide-lines and the American Society for Testing and Material’s (ASTM) “Standard ConsumerPerformance Specification for Playground Equipment for Public Use.” The audit formscontain age-appropriate guidelines for children ages 2 to 5 years old.
In the interest of developing an instrument that could be applied in one hour perplayground, the designers nominated important elements of the CPSC and ASTMguidelines based upon characteristics such as “relative danger” and “commonness ofhazard.” A total of fourteen parameters were selected for evaluation. In order to use theaudit as an evaluation instrument, each parameter of the inspection received a score offrom one to three. A score of three meets the guideline for the parameter; a score of twosignifies minor violations of the guideline; a score of one reflects poor compliance withthe guideline. A summary of the items is included in the Appendix.
PROCEDURES
Observers were systematically trained in the use of the playground safety audit form.Training consisted of a 45 minute educational video presentation, two hours of class-room training, and three hours of applied playground training in the field. The reliabil-ity of the instrument was tested through a complete safety check of a local playgroundby the four safety inspectors in training (two Smart Start evaluators and two Head Start
UNC SMART START EVALUATION 9
quality researchers), including those who developed the instrument. The four inspectorsachieved consensus for all of the scores without consulting with each other. Thisprocess modeled techniques for the inspectors’ judging playground hazards and scoringthe parameters.
All playground inspections for this study were performed by one of the two trained SmartStart inspectors, with the advance permission of the center director, and when no chil-dren were present on the playground. Standard templates for children’s head and torsomeasurements, and gauges to measure protrusions, were obtained from the Iron Moun-tain Forge, Farmington, Missouri. Reliability checks were completed for five centers andranged from 86% - 100%. The study was approved by the Institutional Review Board forthe Protection of Human Rights of the College of Arts and Sciences, UNC-CH.
ANALYSIS
Student’s t-tests were used for unadjusted comparisons of each of the 14 safety criteriaand total hazard scores for the Durham and Alamance child care facilities, and sepa-rately for centers and homes. In addition, general linear modeling was used to compareDurham and Alamance large homes and centers on the same criteria, controlling forlicensing level (A versus AA).
RESULTS
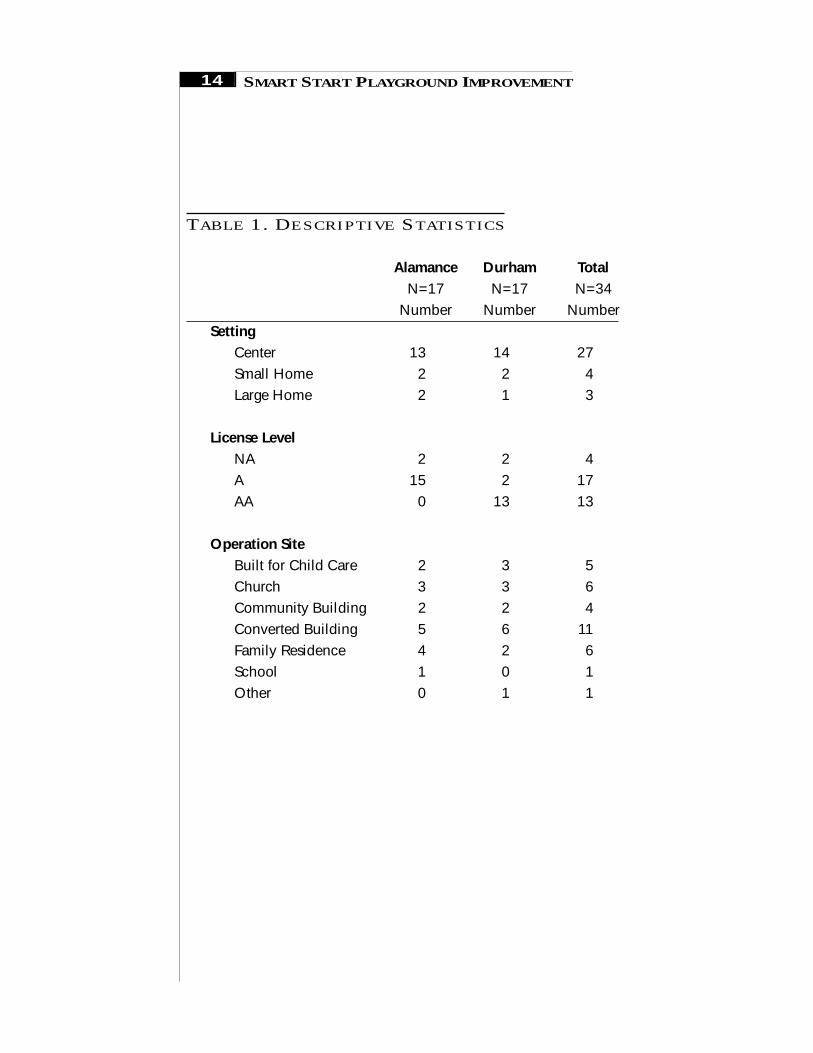
There were 34 child care facilities inspected, 17 in each of the two counties. Twentyseven were centers, 4 were small child care homes, and 3 were large child care homes.Both types of homes were combined into a single category for analysis. (See Table 1.)On most descriptive criteria the Alamance and Durham facilities were similar. The onlyexception was licensing level. All of the AA centers were in Durham.
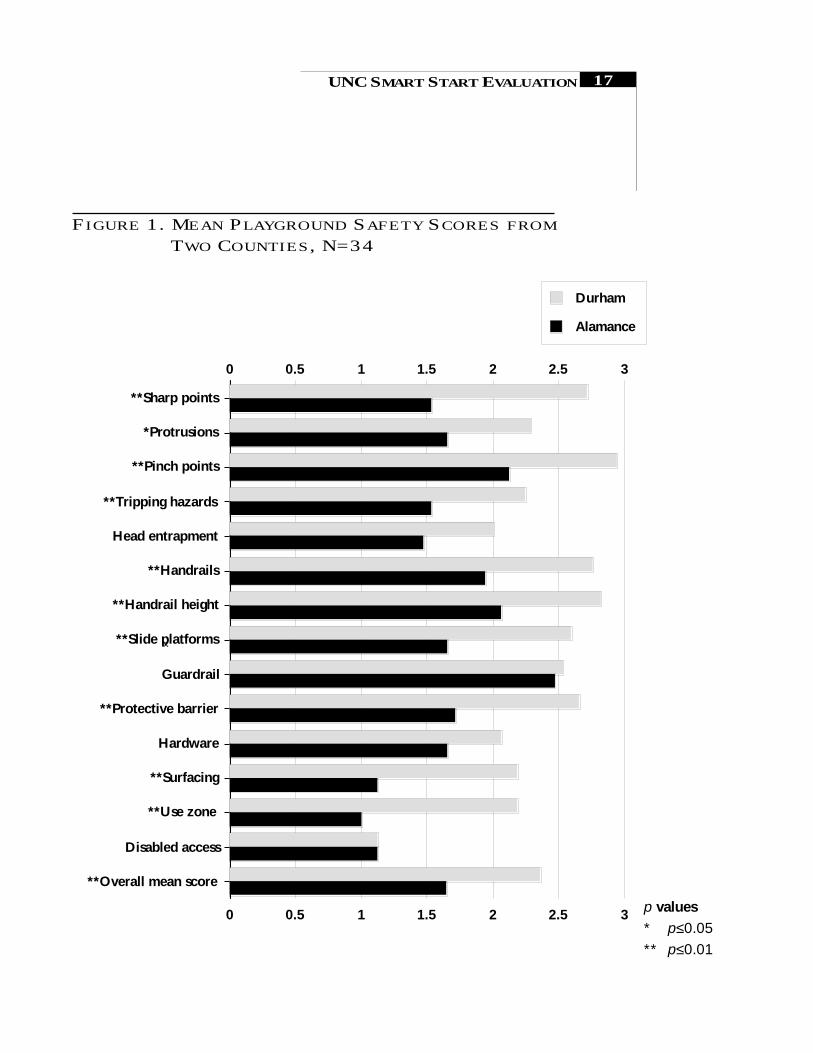
There were 15 criteria for comparison, 14 individual criteria and a total. On each of the15 criteria, the Durham facilities had a higher mean score than did the Alamancefacilities. (See Figure 1.) Eleven of the fifteen differences were statistically significant atthe p≤0.01 or p≤0.05 level.
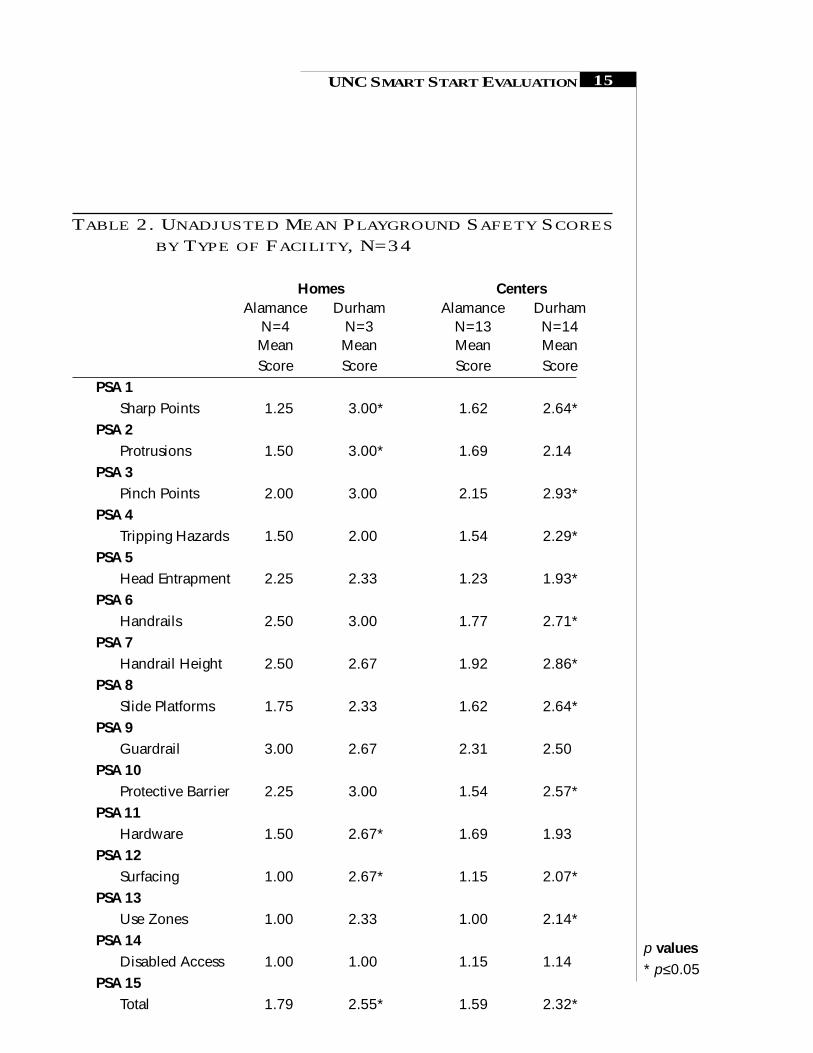
The only descriptive characteristic with sufficient numbers in each category for separatecomparisons was home vs. center. When Alamance and Durham child care facilitieswere compared within each category, Durham facilities again scored consistentlyhigher. Controlling for type of facility (home vs. center), there were three significantdifferences (p≤0.05) in both homes and centers, sharp points, surfacing, and total.
10 SMART START PLAYGROUND IMPROVEMENT
There were an additional two significant differences in homes only and 8 in centersonly. (See Table 2.)
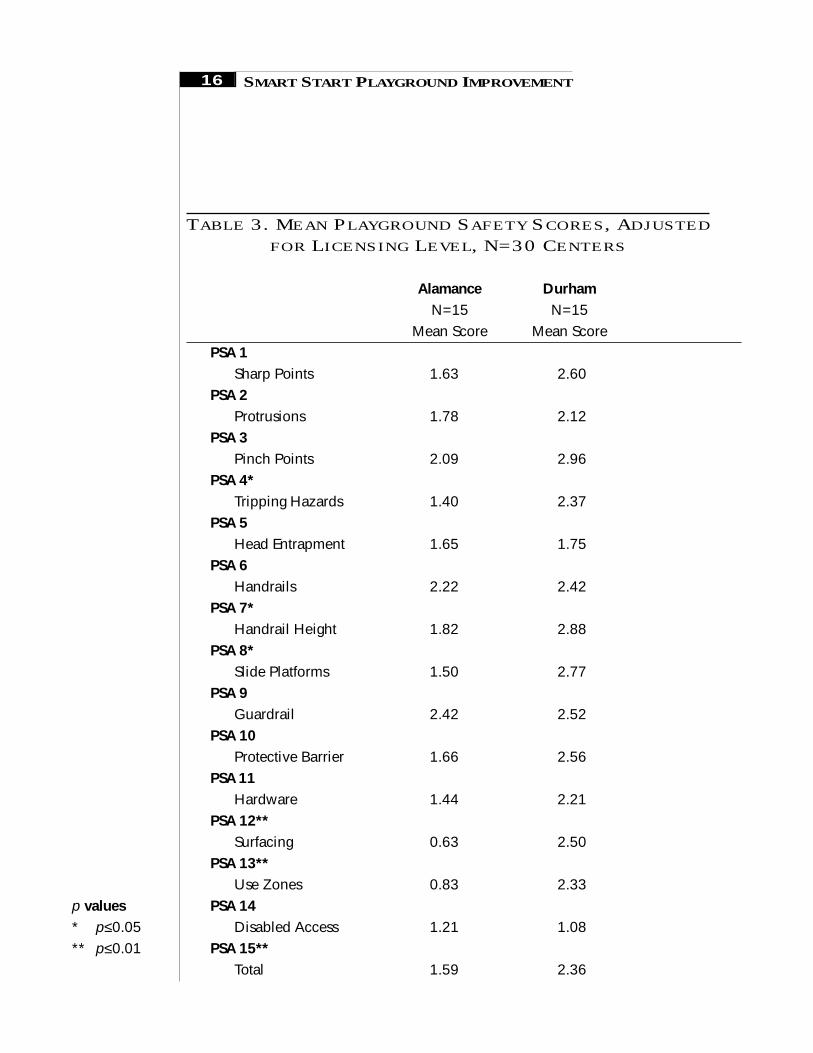
Because the counties differed so much on licensing level (A vs. AA), the analysis wasrepeated using the general linear models procedure. After dropping the homes from theanalysis and controlling for licensing level, there were still six significant differences(three at p≤0.05 and three at p≤0.01) between Smart Start and comparison centers. Oneof these (p≤0.01) was in total playground safety scores. All the differences favored theSmart Start centers. (See Table 3.)
DISCUSSION
OUTCOMES
Child care facilities in a county that used Smart Start funding specifically for the pur-pose of upgrading playgrounds had fewer playground safety hazards than did matchedfacilities in a non-Smart Start county. The differences in all categories of hazard were inthe direction of safer playgrounds in the Smart Start county, and the majority of thesedifferences were statistically significant. Furthermore, the differences hold up evenwithin the sub-categories of homes and centers. These relationships do not “prove” thatSmart Start funding was the sole reason for the difference, since we do not havebaseline data with which to demonstrate that the differences in safety hazards did notexist prior to the playground safety enhancements in the Smart Start county. It is pos-sible that something else, such as the disproportionate number of AA centers inDurham, could explain Durham’s higher playground safety ratings, since AA centers areby and large of higher quality than A centers. However, playground safety is not amongthe criteria used for determining a center’s licensing level, and the differences remainedeven after adjusting for licensing level. Therefore, these results are consistent with theexpectation that the Smart Start child care facilities which received playground safetyenhancement grants would have better safety scores.
PROCESS
In the process of conducting this project, it was found that such an observational studyis feasible with minimal demands on the time of child care staff. In the future, it wouldbe preferable to elicit the cooperation of participating facilities in the study countybefore the monies are distributed and the improvements completed. Surely child carefacilities benefiting from playground safety enhancement grants would be willing toagree to participate in an evaluation before the first dollar changes hands. If possible, abaseline survey prior to playground improvements would be desirable.
UNC SMART START EVALUATION 11
It the case of the non-Smart Start county, providing a copy of the completed playgroundsafety assessment to participating centers and homes was a useful incentive, as allcounties anticipated that more rigorous playground safety regulations might be imple-mented in North Carolina. Having the results of the hazard survey would give thefacilities a head start should they have occasion to implement playground safety en-hancements in the future.
CONCLUSIONS
This study has demonstrated that a brief playground safety audit is a reliable tool formeasuring and comparing child care playground hazards. Trained inspectors can usethe tool to measure playground safety hazards with little to no interference with chil-dren or staff. Hopefully, the tool can be modified further to permit child care staffthemselves to conduct their own periodic audits of child care playground safety.The results also suggest that playground safety enhancement grants, such as thoseallocated by the Durham Partnership for Children (Smart Start), may be associated witha statistically significant reduction in playground hazards. That there is an associationbetween playground hazards and injury has been shown in the US14, New Zealand15,and Canada16. There would not have been enough serious injuries in these two coun-ties to justify a study of injury outcomes.
There are several limitations to this study. First, the evaluation design is not ideal. Thestudy would have been strengthened had pre- and post-tests been administered in boththe study and the comparison counties. Second, the playground safety inspectorsshould have been blinded to the status of the counties. Finally, as mentioned above,injuries themselves were not measured, nor could they have been in so few facilities.Nevertheless, these data indicate that county involvement in Smart Start can contributeto the improvement of playground safety conditions, thereby reducing children’s risk ofunintentional injury. A longitudinal study of the relationship between playground safetyand child care injury is in its early stages.
12 SMART START PLAYGROUND IMPROVEMENT
REFERENCES
1. Sellstrom, E., Bremberg, S., & Chang, A. (1994). Injuries in Swedish day-carecenters. Pediatrics 6(2):1033–1036.
2. Kotch, J.B., Dufort, V.M., Stewart, P., Fieberg, J., McMurray, M., & O’Brien, S,et al. (1997). Injuries among children in home and out-of-home care. InjuryPrevention 3:267–71.
3. Cummings, P., Rivara, F.P., Boase, J., & MacDonald, J.K. (1996). Injuries andtheir relation to potential hazards in child day care. Injury Prevention 2:105–8.
4. Chang, A., Lugg, M.M., & Nebedum, A. (1989). Injuries among preschoolchildren enrolled in day care centers. Pediatrics 83:272–7.
5. American Public Health Association, American Academy of Pediatrics.(1992). Caring for our children: National health and safety performancestandards—Guidelines for out-of-home child care programs. Maternal andChild Health Bureau, Health Resources and Services Administration, U.S.Public Health Service. Arlington, VA: National Center for Education inMaternal and Child Health.
6. Runyan, C.W., Gray, D.E., Kotch, J.B., & Kreuter, M.W. (1991). Analysis ofU.S. child care safety regulations. American Journal of Public Health81:981–85.
7. Browning, K., Runyan, C.W., & Kotch J.B. (1996). A statewide survey ofhazards in child care centers. Injury Prevention 2:202–207.
8. Landman, P., & Landman, G. (1987). Accidental injuries in children in daycare centers. American Journal of Diseases of Children141:292–3
9. Elardo, R., Solomans, H.C., & Snider, B.C. (1987). An analysis of accidents ata day care center. American Journal of Orthopsychiatry 57:60–5.
UNC SMART START EVALUATION 13
10. Rivara, F.P., DiGuiseppi, C., Thompson, R.S., & Calonge, N. (1989). Risk ofinjury to children less than 5 years of age in day care versus home caresettings. Pediatrics 84:1011–6.
11. Sacks, J.J., Smith, J.D., Kaplan, K.M., Lambert, D.A., Sattin, R.W., & Sikes,K. (1989). The epidemiology of injuries in Atlanta day-care centers. Journalof the American Medical Association 262:1641–5.
12. Gunn, W.J., Pinsky, P.F., Sacks, J.J., & Schonberger, L.B. (1991). Injuries andpoisonings in out-of-home child care and home care. American Journal ofDiseases of Children 145:779–81.
13. Kopjar, B., & Wickizer, T. (1996). How safe are day care centers? Day careversus home injuries among children in Norway. Pediatrics 97:43–7.
14. Sacks, J.J., Holt, K.W., Holmgreen, P., Colwell, L.S., Jr, & Brown, J.M., Jr.(1990). Playground hazards in Atlanta child care centers. American Journalof Public Health 80:986–88.
15. Chalmers, D.J., Marshall, S.W., Langley, J., Evan, M.J., Brunton, C.R., &Kelly, A.M., et al. (1996). Height and surfacing as risk factors for injury infalls from playground equipment: A case-control study. Injury Prevention2:98–104.
16. Mowat, D., Wang, F., Pickett, W., & Brison, R.J. (1998). A case-controlstudy of risk factors for playground injury in Kingston and area. Injury Pre-vention 4:39–43.
14 SMART START PLAYGROUND IMPROVEMENT
TABLE 1. DESCRIPTIVE STATISTICS
Alamance Durham TotalN=17 N=17 N=34
Number Number NumberSetting
Center 13 14 27Small Home 2 2 4Large Home 2 1 3
License LevelNA 2 2 4A 15 2 17AA 0 13 13
Operation SiteBuilt for Child Care 2 3 5Church 3 3 6Community Building 2 2 4Converted Building 5 6 11Family Residence 4 2 6School 1 0 1Other 0 1 1
UNC SMART START EVALUATION 15
TABLE 2. UNADJUSTED MEAN PLAYGROUND SAFETY SCORES
BY TYPE OF FACILITY, N=34
Homes CentersAlamance Durham Alamance Durham
N=4 N=3 N=13 N=14Mean Mean Mean MeanScore Score Score Score
PSA 1Sharp Points 1.25 3.00* 1.62 2.64*
PSA 2Protrusions 1.50 3.00* 1.69 2.14
PSA 3Pinch Points 2.00 3.00 2.15 2.93*
PSA 4Tripping Hazards 1.50 2.00 1.54 2.29*
PSA 5Head Entrapment 2.25 2.33 1.23 1.93*
PSA 6Handrails 2.50 3.00 1.77 2.71*
PSA 7Handrail Height 2.50 2.67 1.92 2.86*
PSA 8Slide Platforms 1.75 2.33 1.62 2.64*
PSA 9Guardrail 3.00 2.67 2.31 2.50
PSA 10Protective Barrier 2.25 3.00 1.54 2.57*
PSA 11Hardware 1.50 2.67* 1.69 1.93
PSA 12Surfacing 1.00 2.67* 1.15 2.07*
PSA 13Use Zones 1.00 2.33 1.00 2.14*
PSA 14Disabled Access 1.00 1.00 1.15 1.14
PSA 15Total 1.79 2.55* 1.59 2.32*
p values* p≤0.05
16 SMART START PLAYGROUND IMPROVEMENT
TABLE 3. MEAN PLAYGROUND SAFETY SCORES, ADJUSTED
FOR LICENSING LEVEL, N=30 CENTERS
Alamance DurhamN=15 N=15
Mean Score Mean ScorePSA 1
Sharp Points 1.63 2.60PSA 2
Protrusions 1.78 2.12PSA 3
Pinch Points 2.09 2.96PSA 4*
Tripping Hazards 1.40 2.37PSA 5
Head Entrapment 1.65 1.75PSA 6
Handrails 2.22 2.42PSA 7*
Handrail Height 1.82 2.88PSA 8*
Slide Platforms 1.50 2.77PSA 9
Guardrail 2.42 2.52PSA 10
Protective Barrier 1.66 2.56PSA 11
Hardware 1.44 2.21PSA 12**
Surfacing 0.63 2.50PSA 13**
Use Zones 0.83 2.33PSA 14
Disabled Access 1.21 1.08PSA 15**
Total 1.59 2.36
p values* p≤0.05** p≤0.01
UNC SMART START EVALUATION 17
FIGURE 1. MEAN PLAYGROUND SAFETY SCORES FROM
TWO COUNTIES, N=34
0 0.5 1 1.5 2 2.5 3
0 0.5 1 1.5 2 2.5 3
**Overall mean score
Disabled access
**Use zone
**Surfacing
Hardware
**Protective barrier
Guardrail
**Slide platforms
**Handrail height
**Handrails
Head entrapment
**Tripping hazards
**Pinch points
*Protrusions
**Sharp points
Alamance
Durham
p values* p≤0.05** p≤0.01
18 SMART START PLAYGROUND IMPROVEMENT
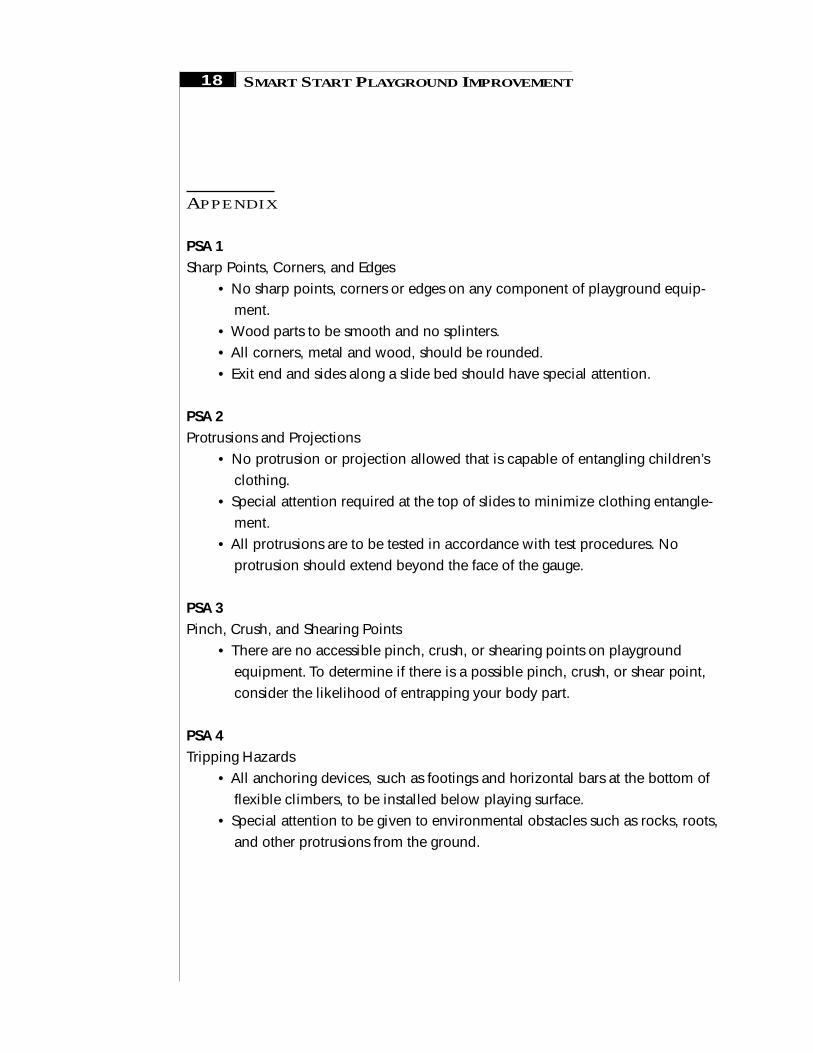
APPENDIX
PSA 1Sharp Points, Corners, and Edges
• No sharp points, corners or edges on any component of playground equip-ment.
• Wood parts to be smooth and no splinters.• All corners, metal and wood, should be rounded.• Exit end and sides along a slide bed should have special attention.
PSA 2Protrusions and Projections
• No protrusion or projection allowed that is capable of entangling children’sclothing.
• Special attention required at the top of slides to minimize clothing entangle-ment.
• All protrusions are to be tested in accordance with test procedures. Noprotrusion should extend beyond the face of the gauge.
PSA 3Pinch, Crush, and Shearing Points
• There are no accessible pinch, crush, or shearing points on playgroundequipment. To determine if there is a possible pinch, crush, or shear point,consider the likelihood of entrapping your body part.
PSA 4Tripping Hazards
• All anchoring devices, such as footings and horizontal bars at the bottom offlexible climbers, to be installed below playing surface.
• Special attention to be given to environmental obstacles such as rocks, roots,and other protrusions from the ground.
UNC SMART START EVALUATION 19
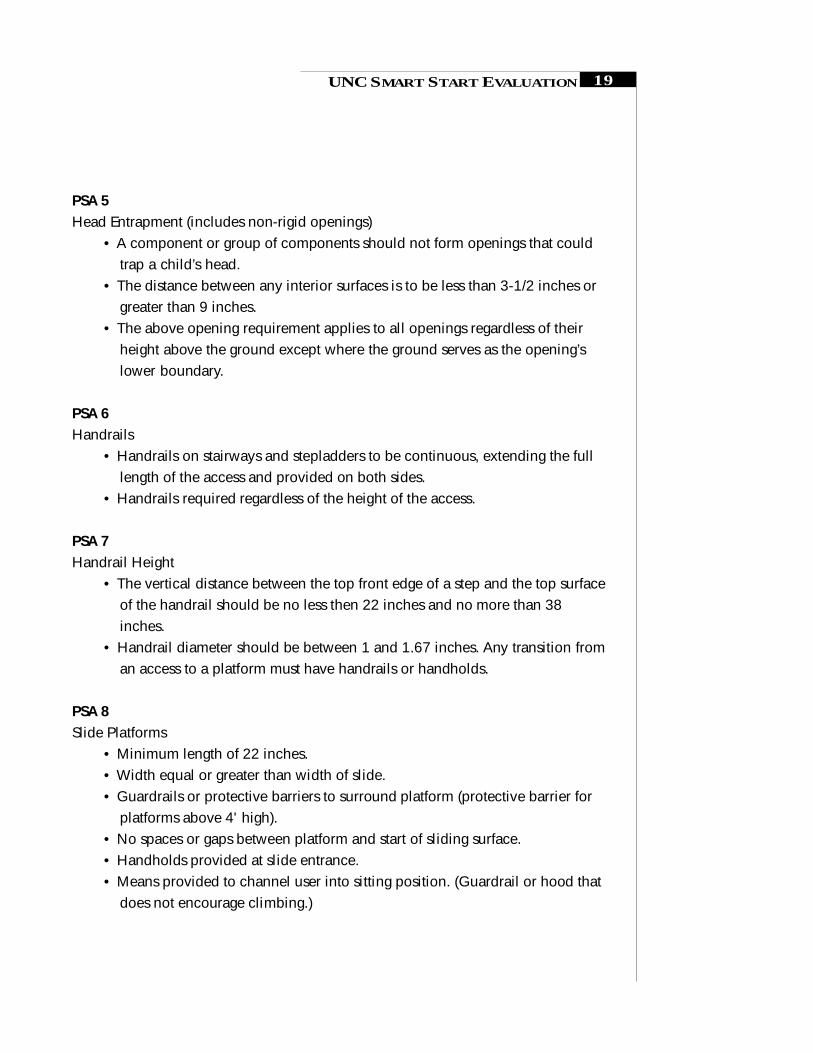
PSA 5Head Entrapment (includes non-rigid openings)
• A component or group of components should not form openings that couldtrap a child’s head.
• The distance between any interior surfaces is to be less than 3-1/2 inches orgreater than 9 inches.
• The above opening requirement applies to all openings regardless of theirheight above the ground except where the ground serves as the opening’slower boundary.
PSA 6Handrails
• Handrails on stairways and stepladders to be continuous, extending the fulllength of the access and provided on both sides.
• Handrails required regardless of the height of the access.
PSA 7Handrail Height
• The vertical distance between the top front edge of a step and the top surfaceof the handrail should be no less then 22 inches and no more than 38inches.
• Handrail diameter should be between 1 and 1.67 inches. Any transition froman access to a platform must have handrails or handholds.
PSA 8Slide Platforms
• Minimum length of 22 inches.• Width equal or greater than width of slide.• Guardrails or protective barriers to surround platform (protective barrier for
platforms above 4' high).• No spaces or gaps between platform and start of sliding surface.• Handholds provided at slide entrance.• Means provided to channel user into sitting position. (Guardrail or hood that
does not encourage climbing.)
20 SMART START PLAYGROUND IMPROVEMENT
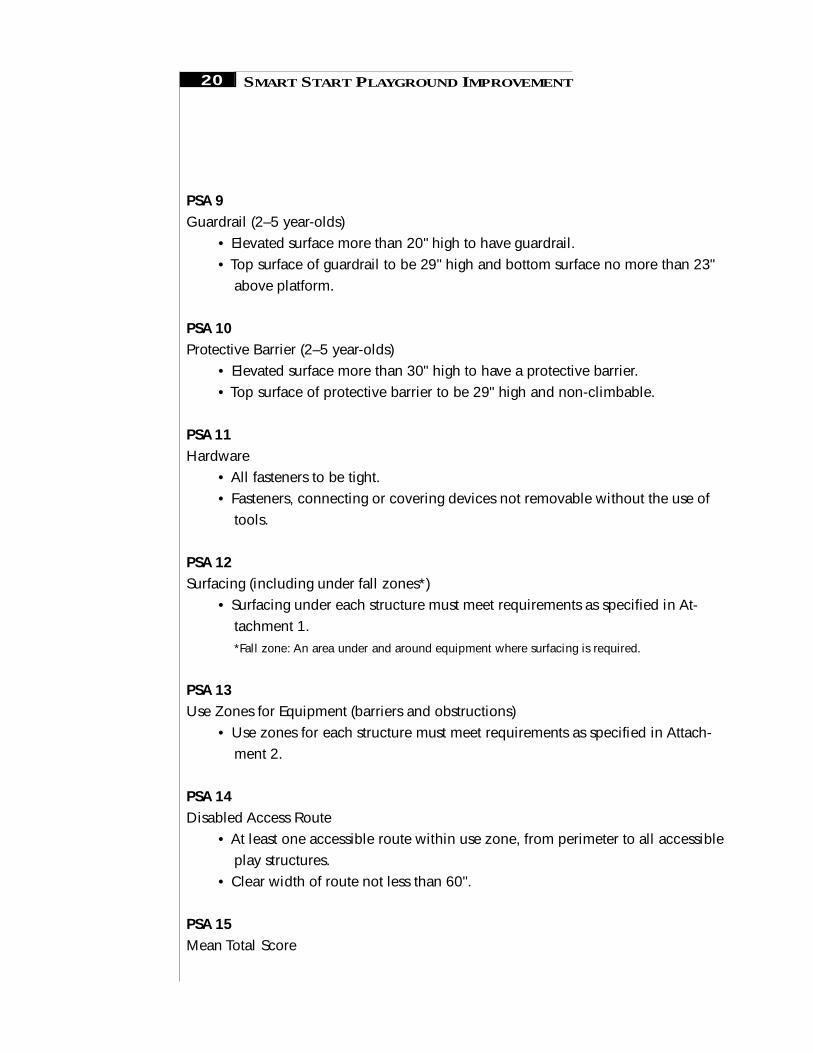
PSA 9Guardrail (2–5 year-olds)
• Elevated surface more than 20" high to have guardrail.• Top surface of guardrail to be 29" high and bottom surface no more than 23"
above platform.
PSA 10Protective Barrier (2–5 year-olds)
• Elevated surface more than 30" high to have a protective barrier.• Top surface of protective barrier to be 29" high and non-climbable.
PSA 11Hardware
• All fasteners to be tight.• Fasteners, connecting or covering devices not removable without the use of
tools.
PSA 12Surfacing (including under fall zones*)
• Surfacing under each structure must meet requirements as specified in At-tachment 1.*Fall zone: An area under and around equipment where surfacing is required.
PSA 13Use Zones for Equipment (barriers and obstructions)
• Use zones for each structure must meet requirements as specified in Attach-ment 2.
PSA 14Disabled Access Route
• At least one accessible route within use zone, from perimeter to all accessibleplay structures.
• Clear width of route not less than 60".
PSA 15Mean Total Score
UNC SMART START EVALUATION 21
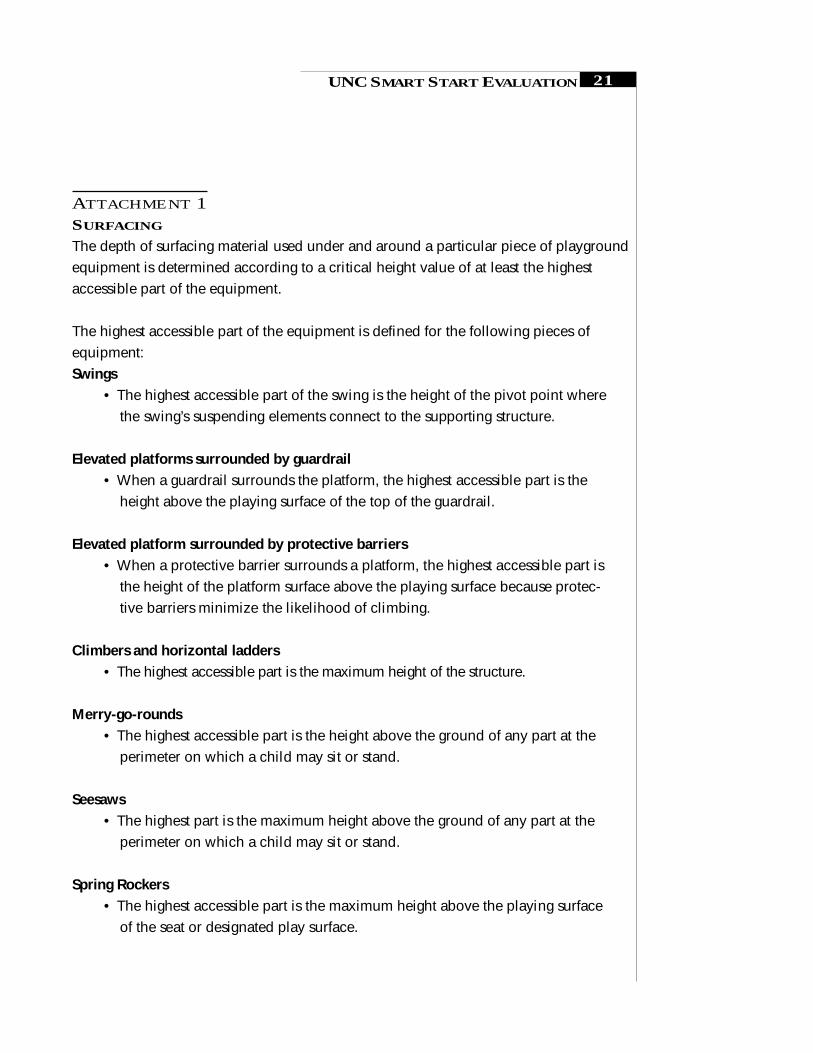
ATTACHMENT 1SURFACING
The depth of surfacing material used under and around a particular piece of playgroundequipment is determined according to a critical height value of at least the highestaccessible part of the equipment.
The highest accessible part of the equipment is defined for the following pieces ofequipment:Swings
• The highest accessible part of the swing is the height of the pivot point wherethe swing’s suspending elements connect to the supporting structure.
Elevated platforms surrounded by guardrail• When a guardrail surrounds the platform, the highest accessible part is the
height above the playing surface of the top of the guardrail.
Elevated platform surrounded by protective barriers• When a protective barrier surrounds a platform, the highest accessible part is
the height of the platform surface above the playing surface because protec-tive barriers minimize the likelihood of climbing.
Climbers and horizontal ladders• The highest accessible part is the maximum height of the structure.
Merry-go-rounds• The highest accessible part is the height above the ground of any part at the
perimeter on which a child may sit or stand.
Seesaws• The highest part is the maximum height above the ground of any part at the
perimeter on which a child may sit or stand.
Spring Rockers• The highest accessible part is the maximum height above the playing surface
of the seat or designated play surface.
22 SMART START PLAYGROUND IMPROVEMENT
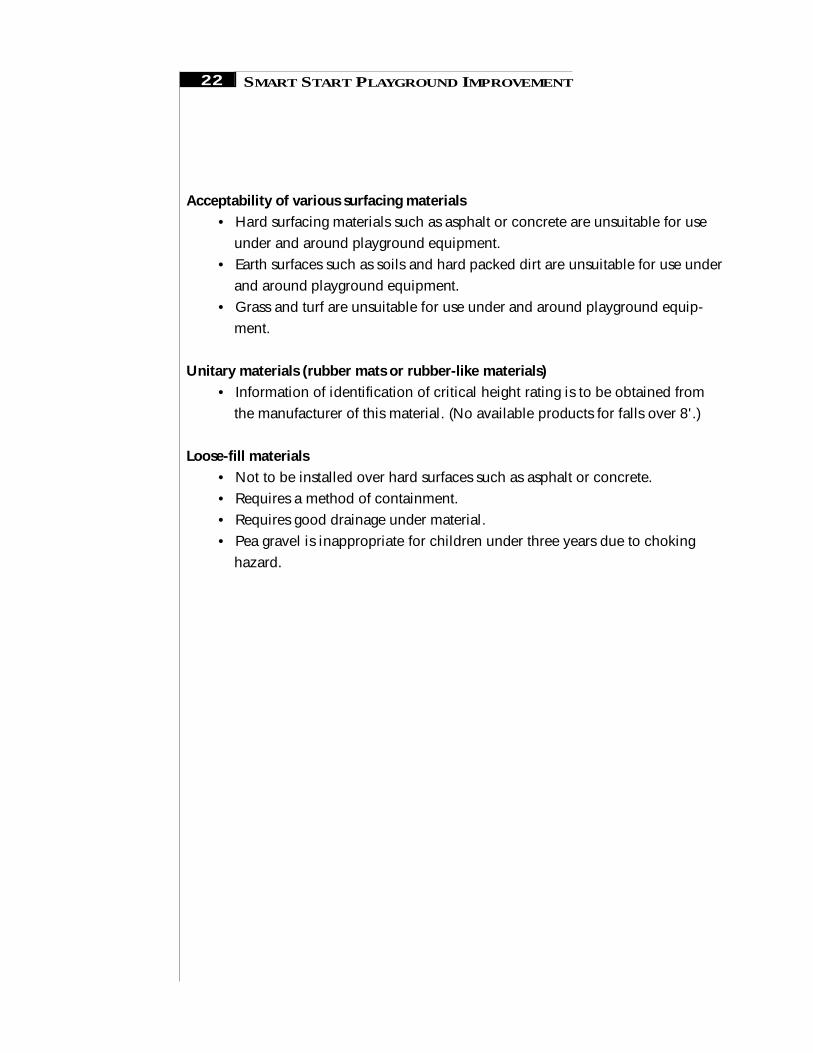
Acceptability of various surfacing materials• Hard surfacing materials such as asphalt or concrete are unsuitable for use
under and around playground equipment.• Earth surfaces such as soils and hard packed dirt are unsuitable for use under
and around playground equipment.• Grass and turf are unsuitable for use under and around playground equip-
ment.
Unitary materials (rubber mats or rubber-like materials)• Information of identification of critical height rating is to be obtained from
the manufacturer of this material. (No available products for falls over 8'.)
Loose-fill materials• Not to be installed over hard surfaces such as asphalt or concrete.• Requires a method of containment.• Requires good drainage under material.• Pea gravel is inappropriate for children under three years due to choking
hazard.
UNC SMART START EVALUATION 23
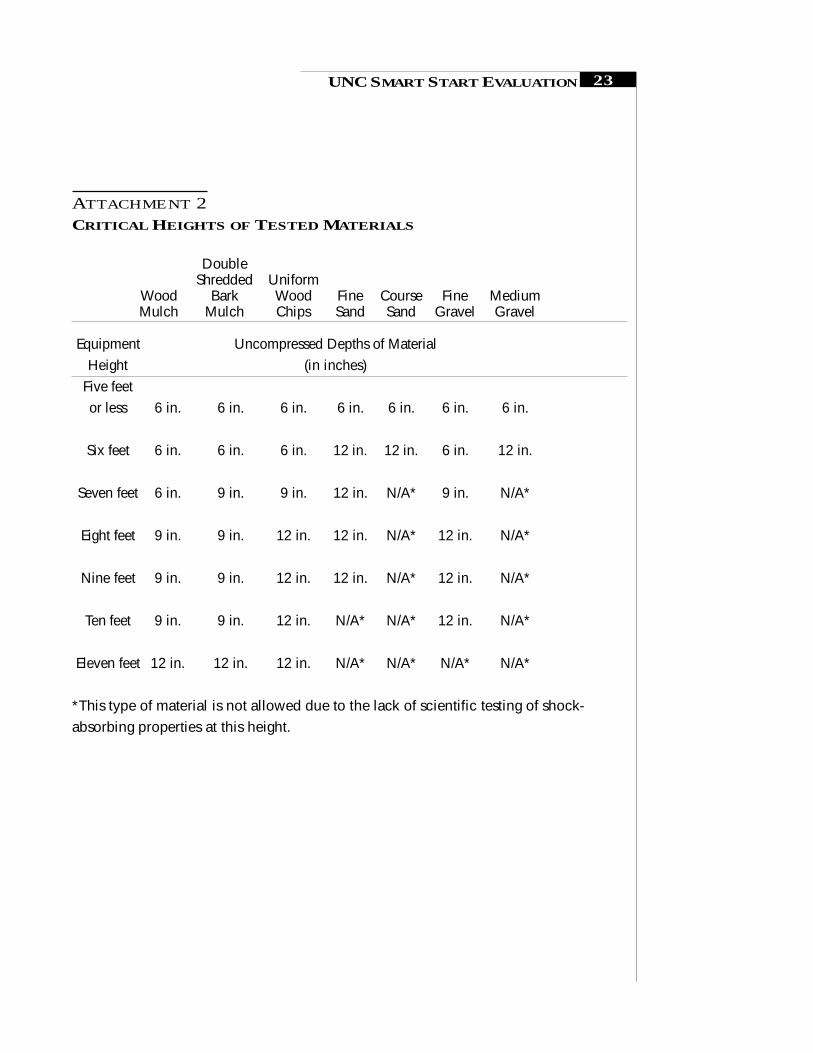
ATTACHMENT 2CRITICAL HEIGHTS OF TESTED MATERIALS
DoubleShredded Uniform
Wood Bark Wood Fine Course Fine MediumMulch Mulch Chips Sand Sand Gravel Gravel
Equipment Uncompressed Depths of MaterialHeight (in inches)
Five feetor less 6 in. 6 in. 6 in. 6 in. 6 in. 6 in. 6 in.
Six feet 6 in. 6 in. 6 in. 12 in. 12 in. 6 in. 12 in.
Seven feet 6 in. 9 in. 9 in. 12 in. N/A* 9 in. N/A*
Eight feet 9 in. 9 in. 12 in. 12 in. N/A* 12 in. N/A*
Nine feet 9 in. 9 in. 12 in. 12 in. N/A* 12 in. N/A*
Ten feet 9 in. 9 in. 12 in. N/A* N/A* 12 in. N/A*
Eleven feet 12 in. 12 in. 12 in. N/A* N/A* N/A* N/A*
*This type of material is not allowed due to the lack of scientific testing of shock-absorbing properties at this height.
24 SMART START PLAYGROUND IMPROVEMENT
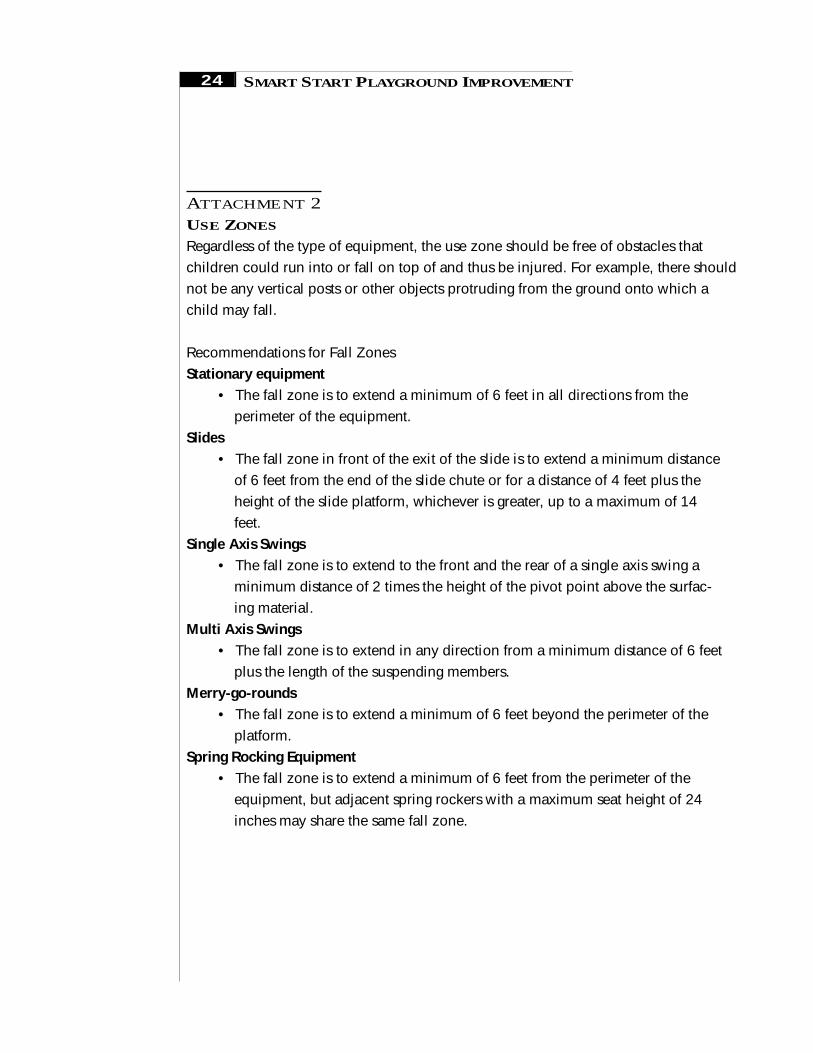
ATTACHMENT 2USE ZONES
Regardless of the type of equipment, the use zone should be free of obstacles thatchildren could run into or fall on top of and thus be injured. For example, there shouldnot be any vertical posts or other objects protruding from the ground onto which achild may fall.
Recommendations for Fall ZonesStationary equipment
• The fall zone is to extend a minimum of 6 feet in all directions from theperimeter of the equipment.
Slides• The fall zone in front of the exit of the slide is to extend a minimum distance
of 6 feet from the end of the slide chute or for a distance of 4 feet plus theheight of the slide platform, whichever is greater, up to a maximum of 14feet.
Single Axis Swings• The fall zone is to extend to the front and the rear of a single axis swing a
minimum distance of 2 times the height of the pivot point above the surfac-ing material.
Multi Axis Swings• The fall zone is to extend in any direction from a minimum distance of 6 feet
plus the length of the suspending members.Merry-go-rounds
• The fall zone is to extend a minimum of 6 feet beyond the perimeter of theplatform.
Spring Rocking Equipment• The fall zone is to extend a minimum of 6 feet from the perimeter of the
equipment, but adjacent spring rockers with a maximum seat height of 24inches may share the same fall zone.

UNC SMART START EVALUATION 25
26 SMART START PLAYGROUND IMPROVEMENT
REPORTS FROM THE UNC SMART START EVALUATION TEAM
Emerging Themes and Lessons Learned: The First Year of Smart Start (August 1994)This report describes the first-year planning process of the pioneer partnerships andmakes some recommendations for improving the process.
Smart Start Evaluation Plan (September 1994)This report describes our comprehensive evaluation plan, designed to capture thebreadth of programs implemented across the Smart Start partnerships and the extent ofpossible changes that might result from Smart Start efforts.
Keeping the Vision in Front of You: Results from Smart Start Key Participant Inter-views (May 1995)This report documents the process as pioneer partnerships completed their planningyear and moved into implementation.
North Carolina’s Smart Start Initiative:1994–95 Annual Evaluation Report (June 1995)This report summarizes the evaluation findings to date from both quantitative andqualitative data sources.
Reinventing Government? Perspectives on the Smart Start Implementation Process(November 1995)This report documents pioneer partnership members’ perspectives on 2 major processgoals of Smart Start: non-bureaucratic decision making and broad-based participation.
Center-based Child Care in the Pioneer Smart Start Partnerships of North Carolina(May 1996)This brief report summarizes the key findings from the 1994-95 data on child carequality.
Effects of Smart Start on Young Children with Disabilities and their Families (Decem-ber 1996)This report summarizes a study of the impact of Smart Start on children with disabili-ties.

UNC SMART START EVALUATION 27
For more information,please contact Marie Butts at(919) 966-4295 or visit our websiteat www.fpg.unc.edu/~smartstart
Bringing the Community into the Process: Issues and Promising Practices for InvolvingParents and Business in Local Smart Start Partnerships (April 1997)This report describes findings from interviews and case studies about the involvementof parents and business leaders in the Smart Start decision-making process.
The Effects of Smart Start on the Quality of Child Care (April 1997)This report presents the results of a 2-year study of the quality of child care in the 12pioneer partnerships.
Kindergartners’ Skills in Smart Start Counties in 1995: A Baseline From Which toMeasure Change (July 1997)This report presents baseline findings of kindergartners’ skills in the 43 Smart Startcounties.
Families and the North Carolina Smart Start Initiative (September 1997)This report presents findings from family interviews of families who participated inSmart Start in the pioneer counties. The interviews included questions about child care,health services, family activities with children, and community services and involve-ment.
Child Care in the Pioneer Partnerships: 1994 and 1996 (December 1997)This report presents more detailed information about child care centers that wereincluded in The Effects of Smart Start on the Quality of Child Care (April 1997).


![[PPT]PowerPoint Presentation - Home | FPG Child …fpg.unc.edu/sites/fpg.unc.edu/files/resources... · Web viewPracticum Student Teaching Clinical Experiences Observation NAEYC Guidance](https://img.pdfslide.us/doc/110x75/5b2646ef7f8b9ac7508b469d/pptpowerpoint-presentation-home-fpg-child-fpguncedusitesfpguncedufilesresources.jpg)


![[PPT]PowerPoint Presentation - Home | FPG Child …fpg.unc.edu/sites/fpg.unc.edu/files/resources... · Web viewPrinciples of Highly Effective Collaboration Be proactive (take initiative](https://img.pdfslide.us/doc/110x75/5af1473f7f8b9ac57a8fae6c/pptpowerpoint-presentation-home-fpg-child-fpguncedusitesfpguncedufilesresourcesweb.jpg)