Embed Size (px)
Citation preview
EFFECT OF A CO-SOLVENT FEEDSTOCK ON THE SYNTHESIS OF BIODIESEL VIA
HETEROGENEOUS CATALYSIS
By
Matthew Jon Littell
Frank Jones
Professor of Engineering
Committee Chair
Bryan J. Ennis
Associate Professor of Engineering
Committee Member
Tricia A. Thomas
Assistant Professor of Engineering
Committee Member
ii
EFFECT OF A CO-SOLVENT FEEDSTOCK ON THE SYNTHESIS OF BIODIESEL
VIA HETEROGENEOUS CATALYSIS
By
Matthew Jon Littell
A Thesis Submitted to the Faculty of the University of
Tennessee at Chattanooga in Partial Fulfillment
of the Requirements of the Degree of Master of
Science: Engineering
The University of Tennessee at Chattanooga
Chattanooga, Tennessee
May, 2015
iii
ABSTRACT
Research has been conducted regarding a single phase feedstock solution to
produce biodiesel. Biodiesel production usually uses a two-phase feedstock which causes
several issues. The two different feed stocks have been compared using several methods.
The single phase feedstock, consisting of soybean oil, free fatty acid, and methanol in a
1:1:1 volume ratio has proven to be successful in all areas of study with the
heterogeneous catalyst nickel oxide.
Microreactors are being used to improve the efficiency of the production of
biodiesel. The smaller scale makes it possible to produce biodiesel in seconds compared
to what industrial biodiesel production requires hours to accomplish. There are
improvements than can be made to the next generation of microreactors to increase the
efficiency.
iv
TABLE OF CONTENTS
ABSTRACT ................................................................................................................................... iii
TABLE OF CONTENTS ............................................................................................................... iv
LIST OF TABLES ........................................................................................................................ vii
LIST OF FIGURES ..................................................................................................................... viii
LIST OF ABBREVIATIONS ........................................................................................................ xi
LIST OF SYMBOLS ................................................................................................................... xiii
CHAPTER
1. INTRODUCTION ...............................................................................................................1
2. BACKGROUND INFORMATION ....................................................................................3
2.1 Biodiesel Chemistry .......................................................................................................3
2.2 Various Microreactors for biodiesel synthesis ...............................................................7
2.2.1 Microtube Reactors .............................................................................................7
2.2.1.1 Biodiesel Production Using Sunflower Oil ................................................7
2.2.1.2 Flow behavior in microtube reactors using waste cooking oil ...................8
2.2.1.3 Biodiesel production using waste cooking oil (WCO) .............................10
2.2.2 Capillary Microreactors .....................................................................................12
2.2.3 Microchannel Reactors ......................................................................................14
2.2.3.1 Slit-Channel Reactors ...............................................................................15
2.2.3.2 Zigzag microchannel reactors ...................................................................16
v
2.3 Factors for Biodiesel Synthesis ................................................................................... 18
2.3.1 Reaction Temperature........................................................................................18
2.3.2 Microchannel Size .............................................................................................20
2.3.3 Residence Time .................................................................................................22
2.4 Mixing ......................................................................................................................... 24
2.4.1 Diffusion ............................................................................................................24
2.4.2 Zigzag Geometry ...............................................................................................24
2.4.3 Ultrasonic...........................................................................................................25
2.5 Catalysts for Biodiesel Production.............................................................................. 25
2.5.1 Homogeneous ....................................................................................................25
2.5.1.1 Acid ..........................................................................................................26
2.5.1.2 Base ..........................................................................................................27
2.5.2 Heterogeneous ...................................................................................................29
2.5.3 Catalyst-Free ......................................................................................................29
2.6 UTC Biodiesel Synthesis ............................................................................................ 30
3. METHODOLOGY ........................................................................................................... 32
3.1 Measuring Density ...................................................................................................... 32
3.2 Measuring Viscosity ................................................................................................... 33
3.3 Stirred-Tank Reactors ................................................................................................. 35
3.4 Stainless Steel Vials .................................................................................................... 36
3.4.1 Heating Time .....................................................................................................38
3.5 Purification .................................................................................................................. 38
3.6 Microreactors .............................................................................................................. 40
3.7 Analytical Chemistry .................................................................................................. 43
3.7.1 Gas Chromatography .........................................................................................43
3.7.2 Acid Number Analysis ......................................................................................47
vi
4. RESULTS ......................................................................................................................... 49
4.1 Density ........................................................................................................................ 49
4.2 Viscosity ..................................................................................................................... 50
4.3 Reynold’s Number of Microreactors in This Study .................................................... 52
4.4 Stirred-Tank Reactors ................................................................................................ 53
4.5 Stainless Steel Vials .................................................................................................... 56
4.5.1 Heating Time ....................................................................................................56
4.5.2 180°C Reactions ................................................................................................58
4.5.3 65°C Reactions .................................................................................................60
4.6 Microreactors .............................................................................................................. 62
5. DISCUSSION ................................................................................................................... 65
5.1 Stirred-tank Reactors .................................................................................................. 65
5.1.1 Effect of Co-Solvent with Respect to Equilibrium Conversion ........................65
5.1.2 Effect of Co-Solvent with Respect to Initial Conversion Rates ........................67
5.2 Stainless Steel Vials .................................................................................................... 70
5.2.1 Effect of Co-Solvent with Respect to Equilibrium Conversion ........................70
5.2.2 Effect of Co-Solvent with Respect to Initial Conversion Rates ........................72
5.3 Microreactors .............................................................................................................. 73
5.3.1 Suggestions for Improvement ............................................................................76
6. CONCLUSION ................................................................................................................. 78
REFERENCES ............................................................................................................................. 79
VITA ............................................................................................................................................. 83
vii
LIST OF TABLES
1 Zigzag Type Reactors19
..................................................................................................18
2 Viscosity Range of Each Material in Gilmont Viscometer Number 2 ..........................34
3 Density of Soybean Oil at 20°C .....................................................................................49
4 Soybean Oil Viscosity at 20°C ......................................................................................51
5 Reactor 1 Results with 1:1:1 (SBO: FFA: MeOH), Under Boiling Point .....................62
6 Reactor 2 with 1:1:1 (SBO: FFA: MeOH), Under Boiling Point ..................................62
7 Reactor 2 with 1:1:1 (SBO: FFA: MeOH), Above Boiling Point .................................63
8 Reactor 2 with 1:1 (FFA: MeOH), Below Boiling Point ...............................................64
viii
LIST OF FIGURES
1 18 Carbon FAME Molecule8 .............................................................................................. 3
2 Petroleum Derived Diesel Molecule9 .................................................................................. 4
3 Emissions data for biodiesel10
............................................................................................. 5
4 Transesterification Reaction with a Triglyceride11
............................................................. 5
5 Reaction Scheme to Produce Three Biodiesel Molecules .................................................. 6
6 1 and 2) Syringe pumps for methanol and sunflower oil, 3)Syringe pump for acetic
acid, 4) T-Mixer, 5) Oil bath, 6) FEP microtubule reactor, 7) Collection bottle14
...... 8
7 Visualization of flow patterns using WCO for the production of FAME using
different diameters: a) 0.96 mm b) 0.86 mm, c) 0.68 mm, d) 0.46 mm15
.................. 10
8 Experimental setup for microtube reactor—Two step process2 ....................................... 11
9 Slit-channel reactor 18
....................................................................................................... 15
10 Configuration of the zigzag microchannel reactor 20
........................................................ 17
11 Oil conversion as a function of temperature. Oil to methanol ratios of 1:23.9,
1:11.3, and 1:4.614
...................................................................................................... 19
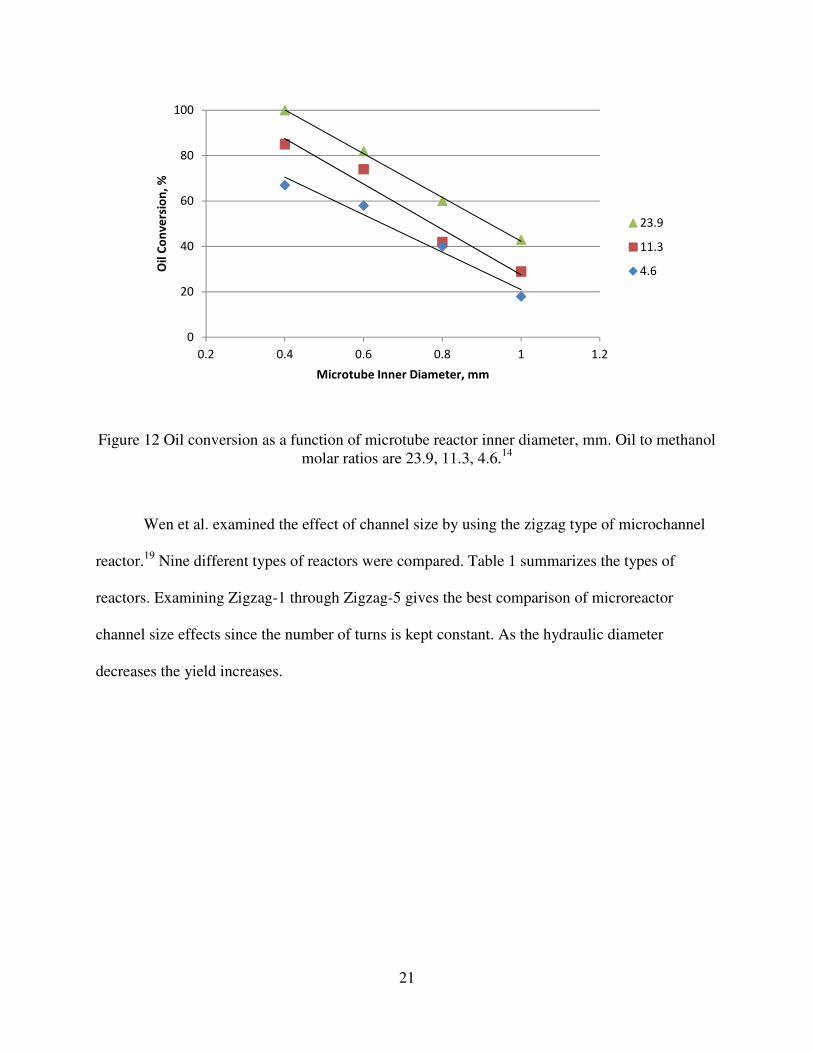
12 Oil conversion as a function of microtube reactor inner diameter, mm. Oil to
methanol molar ratios are 23.9, 11.3, 4.6.14
............................................................... 21
13 Droplet size distribution of Zigzag-1 and Zigzag-3 with oil to methanol molar
ratio of 1:6 and reaction temperature of 60°C19
......................................................... 22
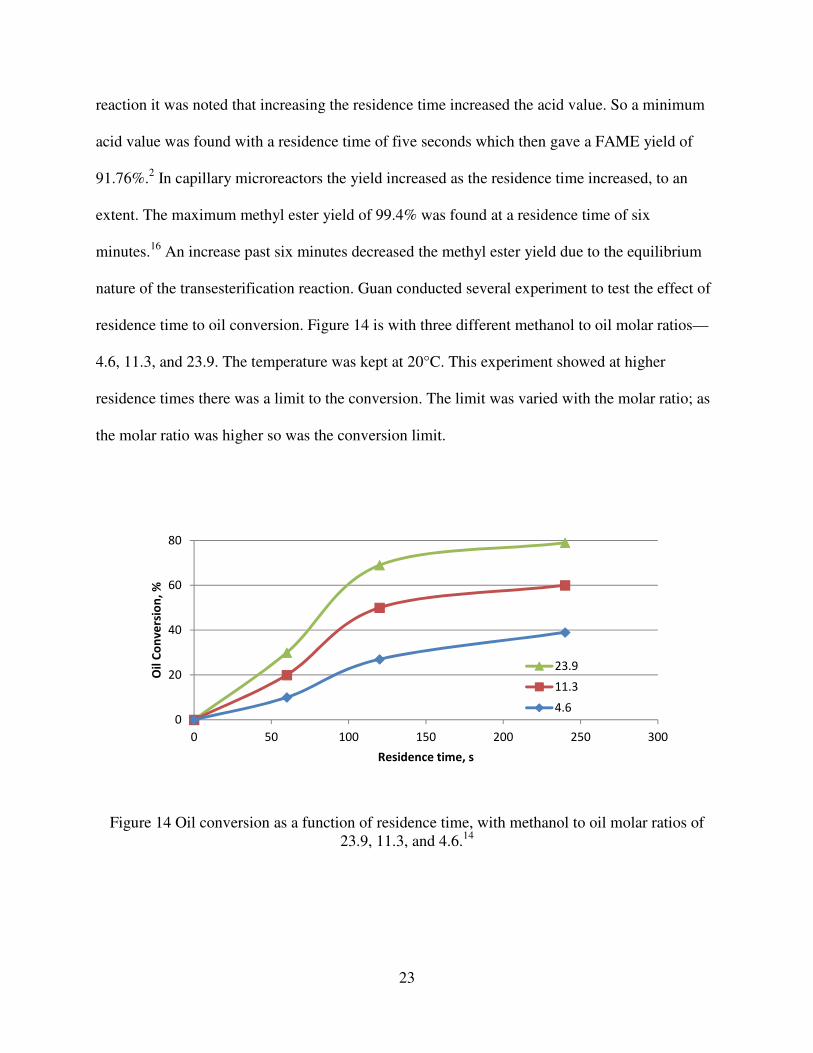
14 Oil conversion as a function of residence time, with methanol to oil molar ratios
of 23.9, 11.3, and 4.6.14
.............................................................................................. 23
ix
15 Acid catalyzed esterification mechanism23
....................................................................... 26
16 Base catalyst mechanism 11
............................................................................................... 27
17 Reaction scheme for biodiesel transesterification24
.......................................................... 28
18 Transesterification Reaction with a Free Fatty Acid6 ....................................................... 31
19 Gilmont Viscometer in Water Bath .................................................................................. 35
20 Gilmont Viscometer .......................................................................................................... 35
21 Stirred-tank Reactor Setup ................................................................................................ 36
22 Stainless Steel Vials .......................................................................................................... 37
23 Hermule Z206A Centrifuge .............................................................................................. 39
24 Wavy Microreactor ........................................................................................................... 40
25 Straight Microreactor ........................................................................................................ 41
26 Top picture, is the experimental set up with reactor horizontal. Middle picture
is a wavy reactor with the inlets on the left, and the outlet on the right. The
bottom picture is the resistance heater that is attached the microreactor ................... 42
27 Vertical Apparatus with One Inlet Plumbed and No Outlet Plumbed .............................. 43
28 SRI 8610C GC for FAME Analysis from Triglycerides .................................................. 45
29 Indicator Orange Color in the Presence of Free Fatty Acid .............................................. 48
30 Indicator Green Color in the Presence of a Base .............................................................. 48
31 Density vs Temperature of 1:1:1 (SBO:FFA:MeOH) Solution ........................................ 50
32 Viscosity vs Temperature of the 1:1:1 (SBO:FFA:MeOH) Solution ............................... 51
33 Reynold’s number vs Volumetric Flow Rate with Temperature comparison .................. 53
x
34 Stirred-tank Reactor, 1:1:1 (SBO: FFA: MeOH), SBO Conversion ................................ 54
35 Stirred-tank Reactor, 1:1:1 (SBO: FFA: MeOH), FFA Conversion ................................. 55
36 Heating Data with Stainless Steel Vials............................................................................ 57
37 Stainless Steel Vial, 1:1:1 (SBO: FFA: MeOH), 180°C, SBO Conversion ...................... 58
38 Stainless Steel Vial, 1:1:1 (SBO: FFA: MeOH), 180°C, FFA Conversion ...................... 59
39 Stainless Steel Vial, 1:1:1 (SBO: FFA: MeOH), 65°C, SBO Conversion ........................ 60
40 Stainless Steel Vial, 1:1:1 (MeOH: SBO: FFA), 65°C, FFA conversion ......................... 61
41 Conversion of SBO in Stirred-tank Reactors, 2 Phase Feedstock6 ................................... 66
42 Comparison of Initial Reaction Rates, One-Phase Feedstock vs. 2-Phase
Feedstock in the Stirred Tank Reactors7 .................................................................... 68
43 Effect of FAME Co-solvent on the Initial Rates of Conversion to FAME52
.................... 69
44 Conversion of SBO to FAME at 180°C7 .......................................................................... 71
45 Comparison of Initial Rate of Feedstock in Stainless Steel Vials at 180°C ..................... 73
46 Comparison of Microreactor (Green) and Stirred-tank (Blue) Soybean Oil Conversion6 74
xi
LIST OF ABBREVIATIONS
FAME, Fatty Acid Methyl Ester
FAEE, Fatty Acid Ethyl Ester
NREL, National Renewal Energy Laboratory
CO2, Carbon Dioxide
FEP, Fluorinated Ethylene-Propylene
WCO, Waste Cooking Oil
PTFE, Polytetrafluoroethylene
KOH, Potassium Hydroxide
NaOH, Sodium Hydroxide
FFA, Free Fatty Acid
MeOH, Methanol
SBO, Soybean Oil
HPLC, High Pressure Liquid Chromatography
H2SO4, Sulfuric Acid
ID, Inner Diameter
xii
C, Celsius
CaO, Calcium Oxide
UTC, University of Tennessee at Chattanooga
NiO, Nickel Oxide
RBF, Round Bottom Flask
RPM, Revolutions per Minute
GC, Gas Chromatography
FID, Flame Ionization Detector
CBG, Combined Bound Glycerin
MSTFA, n-methyl-n-(trimethylsilyl) trifluoroacetamide
MW, Molecular Weight
cp, Centipoise
g, Grams
mL, Milliliters
Re, Reynold’s Number
NMR, Nuclear Magnetic Resonance
SSV, Stainless Steel Vial

xiii
LIST OF SYMBOLS
µ, Viscosity
r, Density
1
CHAPTER 1
INTRODUCTION
The world is in constant demand for fuels and relies heavily on fossil-based fuels.
However, there is a growing concern that burning the fossil-based fuels contributes to global
warming due to carbon emissions.1 To address this concern, research into biofuels is being
conducted. Biofuels are fuels that are derived from renewable resources. One type of biofuel is
biodiesel.
Biodiesel is biodegradable, non-flammable, non-toxic, and has a favorable combustion-
emission profile. It produces less carbon-monoxide, sulfur dioxide and unburned hydrocarbons
compared to petroleum based diesel.2. The current process in industry involves agitating a
methanol-oil mix in a large batch reactor for an hour while heating and reacting. Then the
mixture must sit for several hours to cool. Finally, the catalyst must be neutralized and the
byproduct, glycerol, must be separated from biodiesel.3 The entire batch process takes several
hours to complete.
Dr. Frank Jones’ research group is focused on finding better, more efficient ways to
produce biodiesel. By improving the efficiency of production more biodiesel could be produced
and help relieve the dependency on fossil based fuels. The research group has focused on micro-
scale production. This has been shown to reduce processing time significantly compared to the
current industrial processes. Previous work has been completed by the research group. Jennifer
2
Lewis (UTC DHON ’10) simulated microreactors for biodiesel production.4 The optimal channel
dimensions were found in this study. Experimental work was done by Trip Dacus (UTC DHON
’10), determined promising heterogeneous catalysts to further speed up the reaction.5
Eric Snider,
(UTC DHON ’12), studied the behavior of microreactors and compared their processing time
compared to stirred tank reactors in the production of biodiesel.6 Ben Kegley determined the
optimal miscibility of a free fatty acid as a co-solvent.7 The research group continually makes
technological advancements on this process. The goal of this thesis is to compare a single phase
feedstock compared to a two-phase feedstock.
BACKGROUND INFORMATION
This section gives an in depth background of the research concerning biodiesel. It is
important to discuss what biodiesel is and why
research is looked at to determine the best route to proceed with the research.
2.1 Biodiesel Chemistry
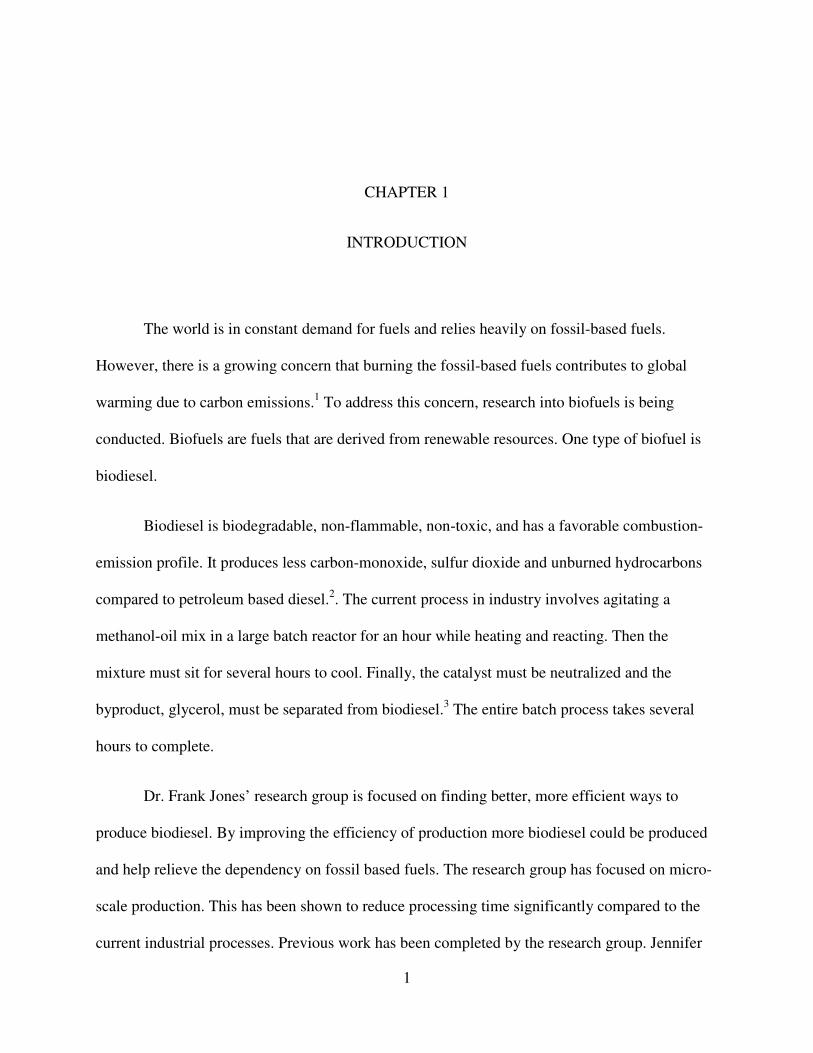
The chemical structure of biodiesel is considered a fatty acid methyl ester or FAME. This
molecule is can be derived from vegetable oils and animal fats. The 18 carbon FAME molecule
is show in Figure 1.
Figure
3
CHAPTER 2
BACKGROUND INFORMATION
depth background of the research concerning biodiesel. It is
ant to discuss what biodiesel is and why research of it is important. Previously published
research is looked at to determine the best route to proceed with the research.
The chemical structure of biodiesel is considered a fatty acid methyl ester or FAME. This
molecule is can be derived from vegetable oils and animal fats. The 18 carbon FAME molecule
Figure 1 18 Carbon FAME Molecule8
depth background of the research concerning biodiesel. It is
it is important. Previously published
The chemical structure of biodiesel is considered a fatty acid methyl ester or FAME. This
molecule is can be derived from vegetable oils and animal fats. The 18 carbon FAME molecule
4
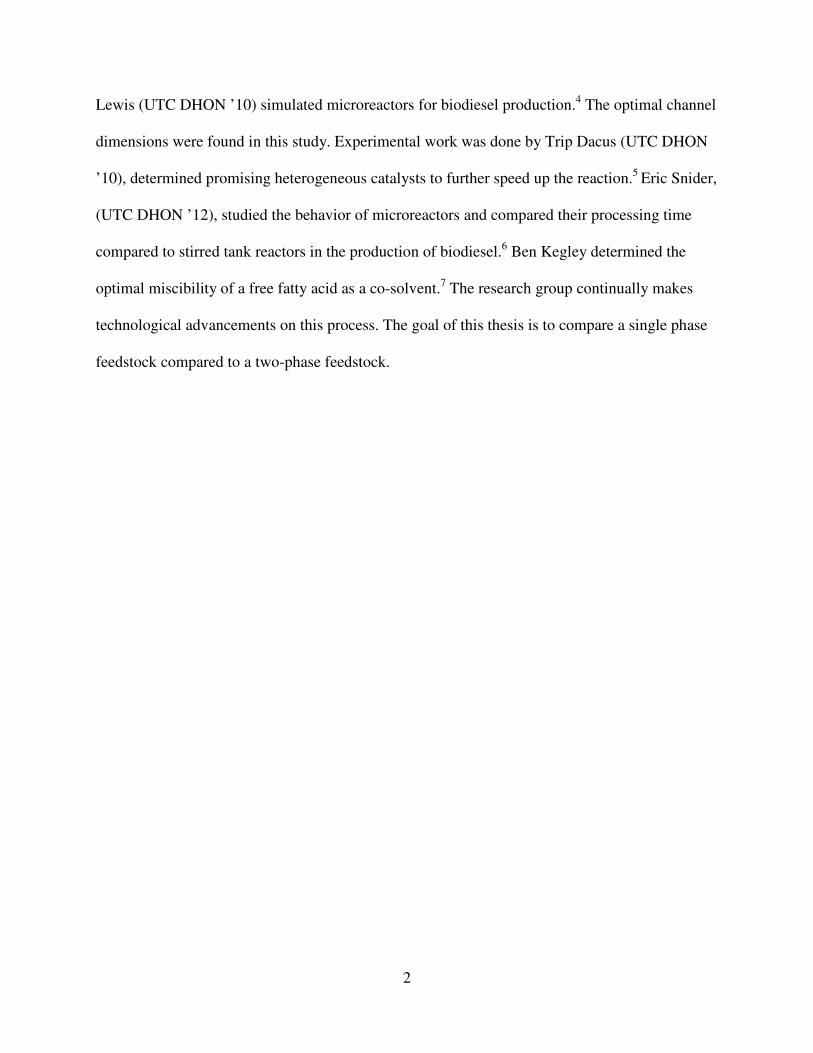
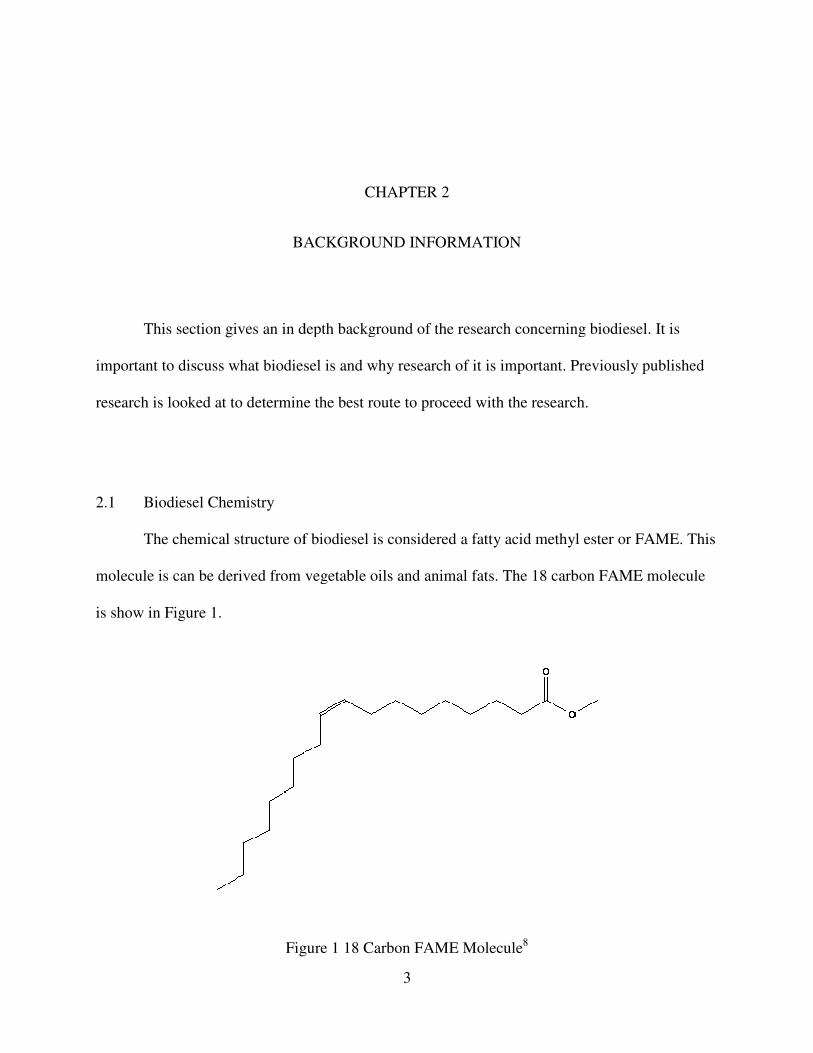
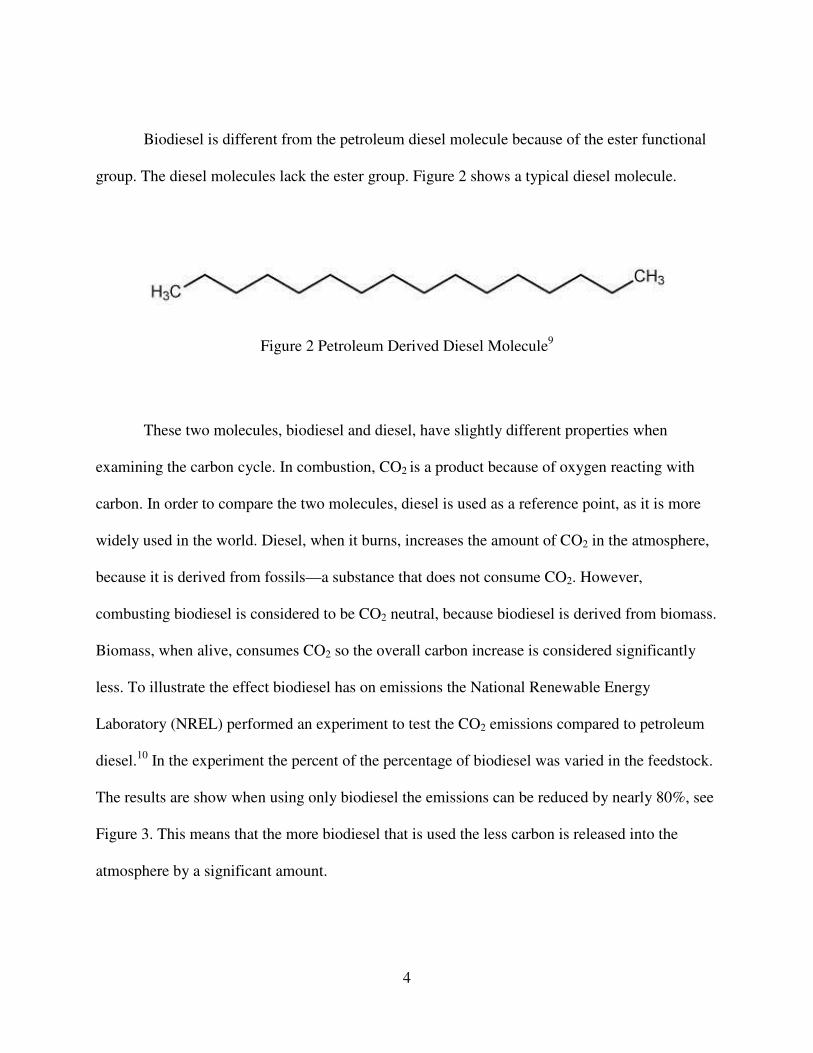
Biodiesel is different from the petroleum diesel molecule because of the ester functional
group. The diesel molecules lack the ester group. Figure 2 shows a typical diesel molecule.
Figure 2 Petroleum Derived Diesel Molecule9
These two molecules, biodiesel and diesel, have slightly different properties when
examining the carbon cycle. In combustion, CO2 is a product because of oxygen reacting with
carbon. In order to compare the two molecules, diesel is used as a reference point, as it is more
widely used in the world. Diesel, when it burns, increases the amount of CO2 in the atmosphere,
because it is derived from fossils—a substance that does not consume CO2. However,
combusting biodiesel is considered to be CO2 neutral, because biodiesel is derived from biomass.
Biomass, when alive, consumes CO2 so the overall carbon increase is considered significantly
less. To illustrate the effect biodiesel has on emissions the National Renewable Energy
Laboratory (NREL) performed an experiment to test the CO2 emissions compared to petroleum
diesel.10
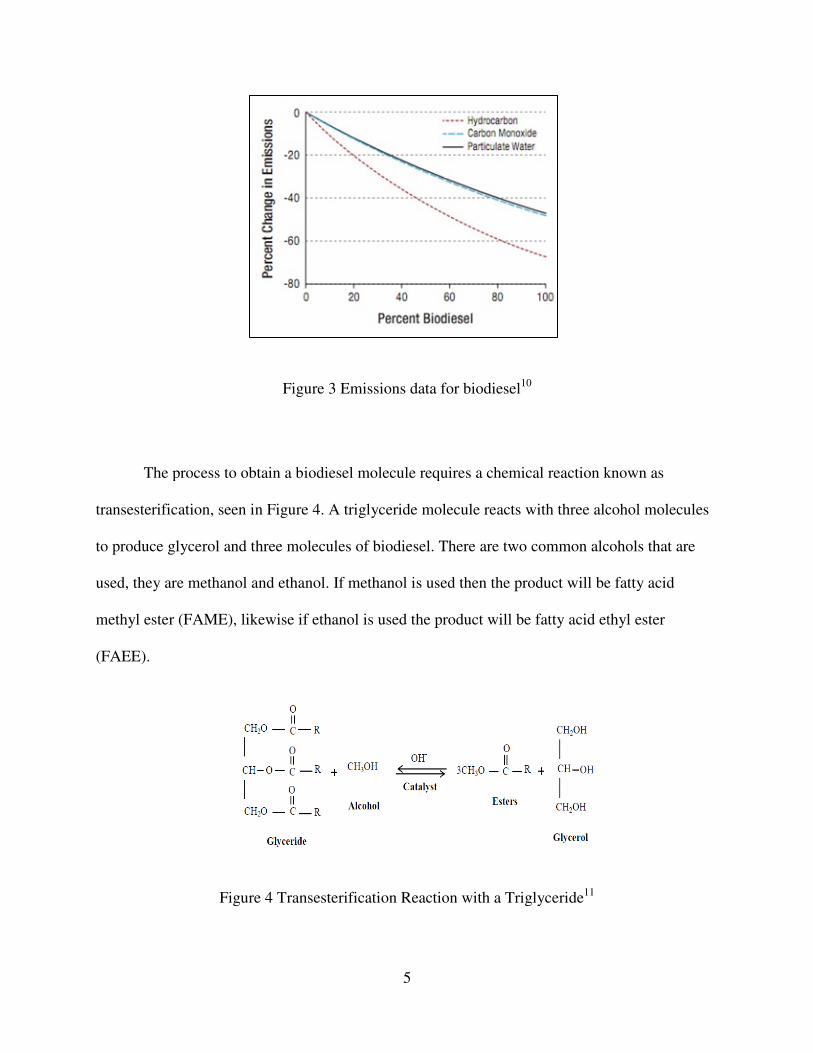
In the experiment the percent of the percentage of biodiesel was varied in the feedstock.
The results are show when using only biodiesel the emissions can be reduced by nearly 80%, see
Figure 3. This means that the more biodiesel that is used the less carbon is released into the
atmosphere by a significant amount.
Figure
The process to obtain a biodiesel molecule requires
transesterification, seen in Figure 4.
to produce glycerol and three molecules of biodiesel.
used, they are methanol and ethanol. If metha
methyl ester (FAME), likewise if
(FAEE).
Figure 4 Transesterification Reaction with a Triglyceride
5
Figure 3 Emissions data for biodiesel10
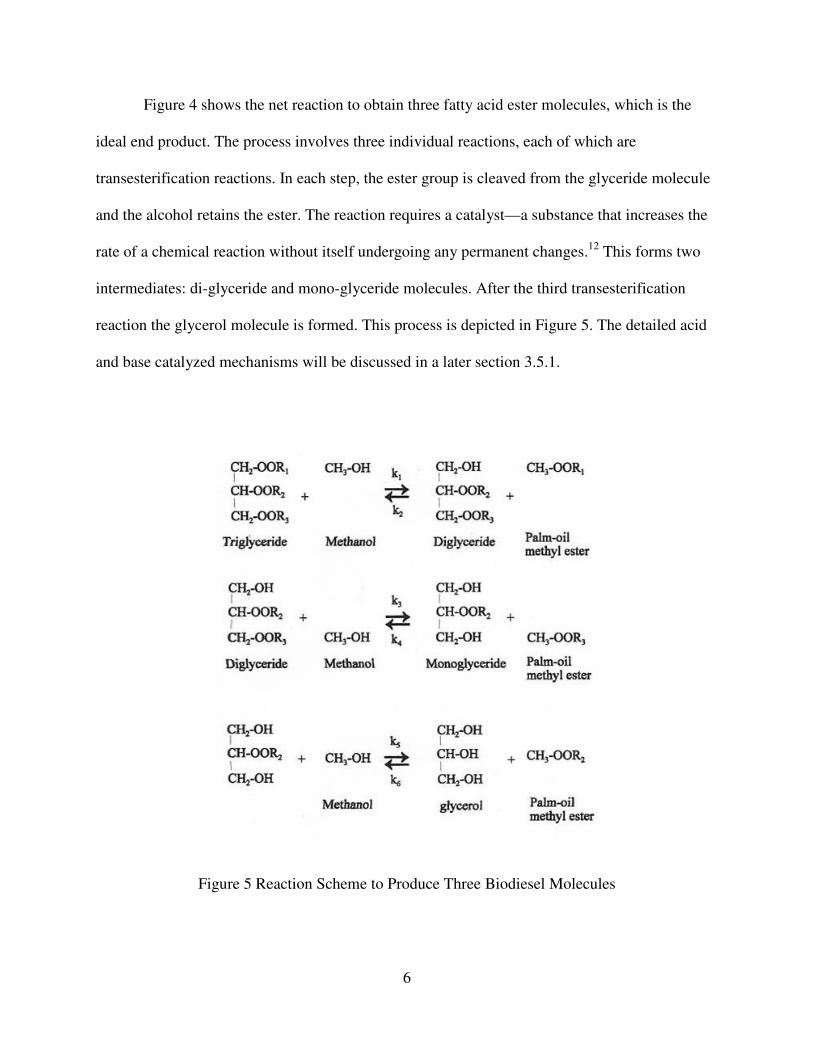
The process to obtain a biodiesel molecule requires a chemical reaction known as
seen in Figure 4. A triglyceride molecule reacts with three alcohol
to produce glycerol and three molecules of biodiesel. There are two common alcohols that are
are methanol and ethanol. If methanol is used then the product will be fatty acid
methyl ester (FAME), likewise if ethanol is used the product will be fatty acid ethyl ester
Transesterification Reaction with a Triglyceride11
known as
with three alcohol molecules
There are two common alcohols that are
be fatty acid
be fatty acid ethyl ester
6
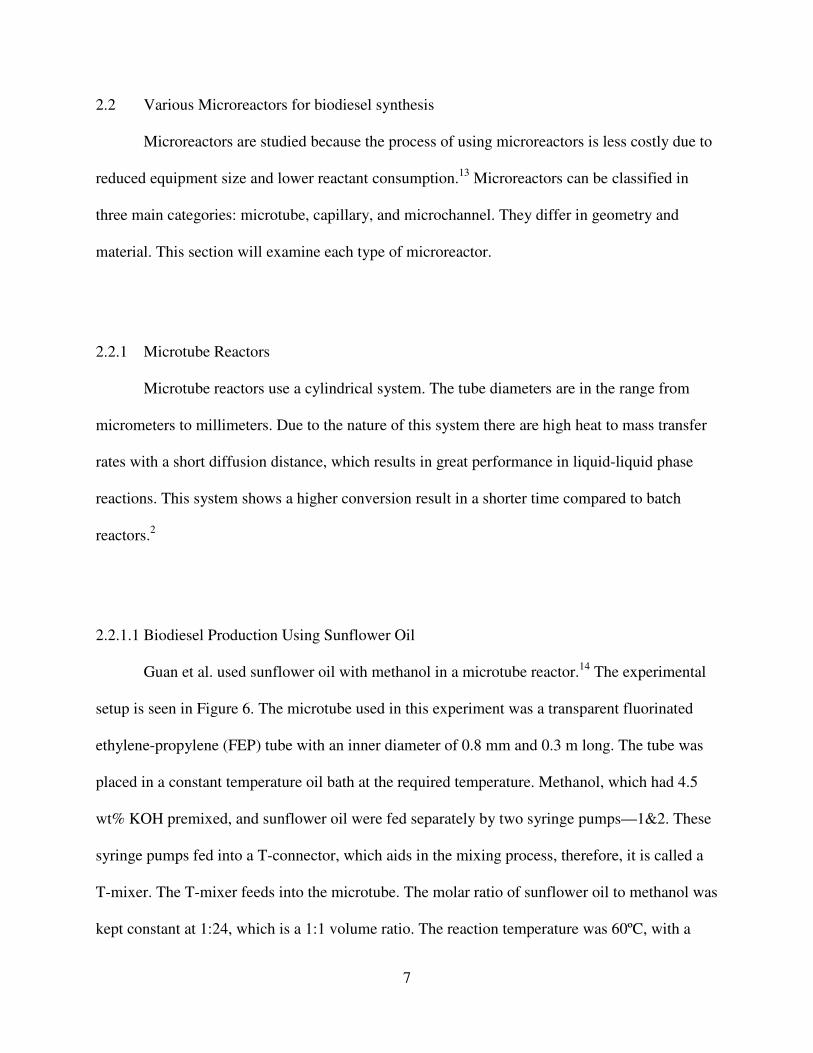
Figure 4 shows the net reaction to obtain three fatty acid ester molecules, which is the
ideal end product. The process involves three individual reactions, each of which are
transesterification reactions. In each step, the ester group is cleaved from the glyceride molecule
and the alcohol retains the ester. The reaction requires a catalyst—a substance that increases the
rate of a chemical reaction without itself undergoing any permanent changes.12
This forms two
intermediates: di-glyceride and mono-glyceride molecules. After the third transesterification
reaction the glycerol molecule is formed. This process is depicted in Figure 5. The detailed acid
and base catalyzed mechanisms will be discussed in a later section 3.5.1.
Figure 5 Reaction Scheme to Produce Three Biodiesel Molecules
7
2.2 Various Microreactors for biodiesel synthesis
Microreactors are studied because the process of using microreactors is less costly due to
reduced equipment size and lower reactant consumption.13
Microreactors can be classified in
three main categories: microtube, capillary, and microchannel. They differ in geometry and
material. This section will examine each type of microreactor.
2.2.1 Microtube Reactors
Microtube reactors use a cylindrical system. The tube diameters are in the range from
micrometers to millimeters. Due to the nature of this system there are high heat to mass transfer
rates with a short diffusion distance, which results in great performance in liquid-liquid phase
reactions. This system shows a higher conversion result in a shorter time compared to batch
reactors.2
2.2.1.1 Biodiesel Production Using Sunflower Oil
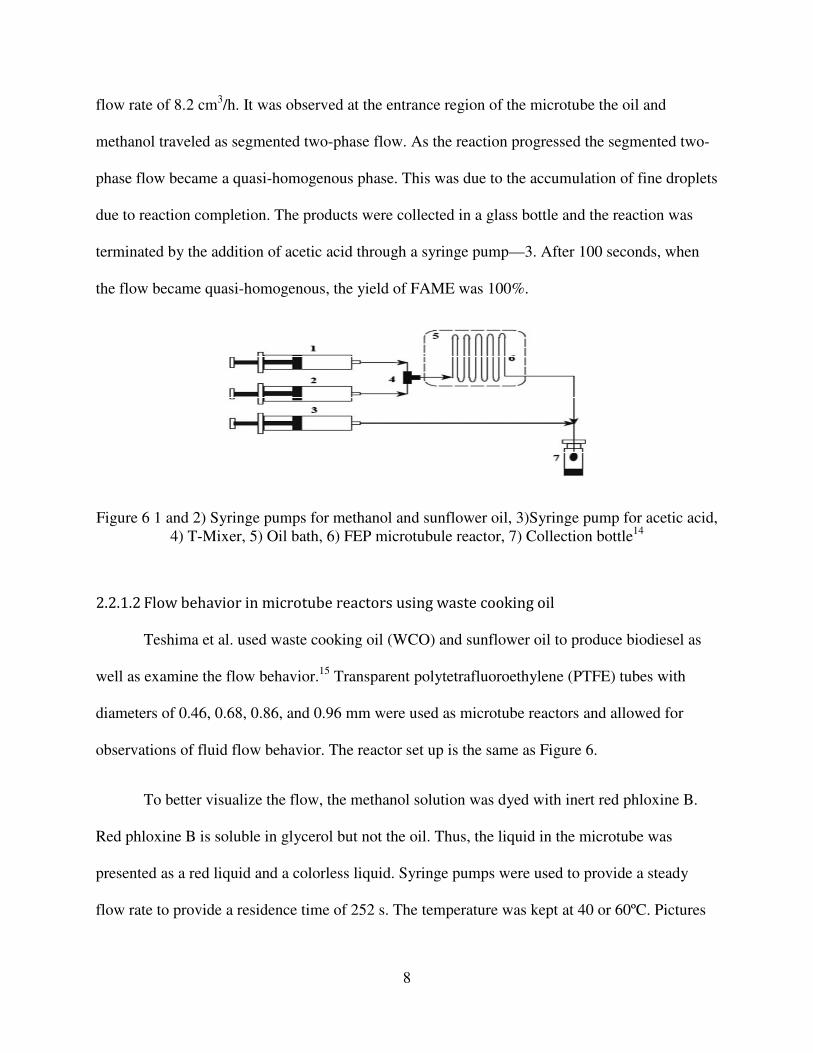
Guan et al. used sunflower oil with methanol in a microtube reactor.14
The experimental
setup is seen in Figure 6. The microtube used in this experiment was a transparent fluorinated
ethylene-propylene (FEP) tube with an inner diameter of 0.8 mm and 0.3 m long. The tube was
placed in a constant temperature oil bath at the required temperature. Methanol, which had 4.5
wt% KOH premixed, and sunflower oil were fed separately by two syringe pumps—1&2. These
syringe pumps fed into a T-connector, which aids in the mixing process, therefore, it is called a
T-mixer. The T-mixer feeds into the microtube. The molar ratio of sunflower oil to methanol was
kept constant at 1:24, which is a 1:1 volume ratio. The reaction temperature was 60ºC, with a
8
flow rate of 8.2 cm3/h. It was observed at the entrance region of the microtube the oil and
methanol traveled as segmented two-phase flow. As the reaction progressed the segmented two-
phase flow became a quasi-homogenous phase. This was due to the accumulation of fine droplets
due to reaction completion. The products were collected in a glass bottle and the reaction was
terminated by the addition of acetic acid through a syringe pump—3. After 100 seconds, when
the flow became quasi-homogenous, the yield of FAME was 100%.
Figure 6 1 and 2) Syringe pumps for methanol and sunflower oil, 3)Syringe pump for acetic acid,
4) T-Mixer, 5) Oil bath, 6) FEP microtubule reactor, 7) Collection bottle14
2.2.1.2 Flow behavior in microtube reactors using waste cooking oil
Teshima et al. used waste cooking oil (WCO) and sunflower oil to produce biodiesel as
well as examine the flow behavior.15
Transparent polytetrafluoroethylene (PTFE) tubes with
diameters of 0.46, 0.68, 0.86, and 0.96 mm were used as microtube reactors and allowed for
observations of fluid flow behavior. The reactor set up is the same as Figure 6.
To better visualize the flow, the methanol solution was dyed with inert red phloxine B.
Red phloxine B is soluble in glycerol but not the oil. Thus, the liquid in the microtube was
presented as a red liquid and a colorless liquid. Syringe pumps were used to provide a steady
flow rate to provide a residence time of 252 s. The temperature was kept at 40 or 60ºC. Pictures
9
were taken with an optical microscope equipped with a digital camera or just the digital camera,
where appropriate.
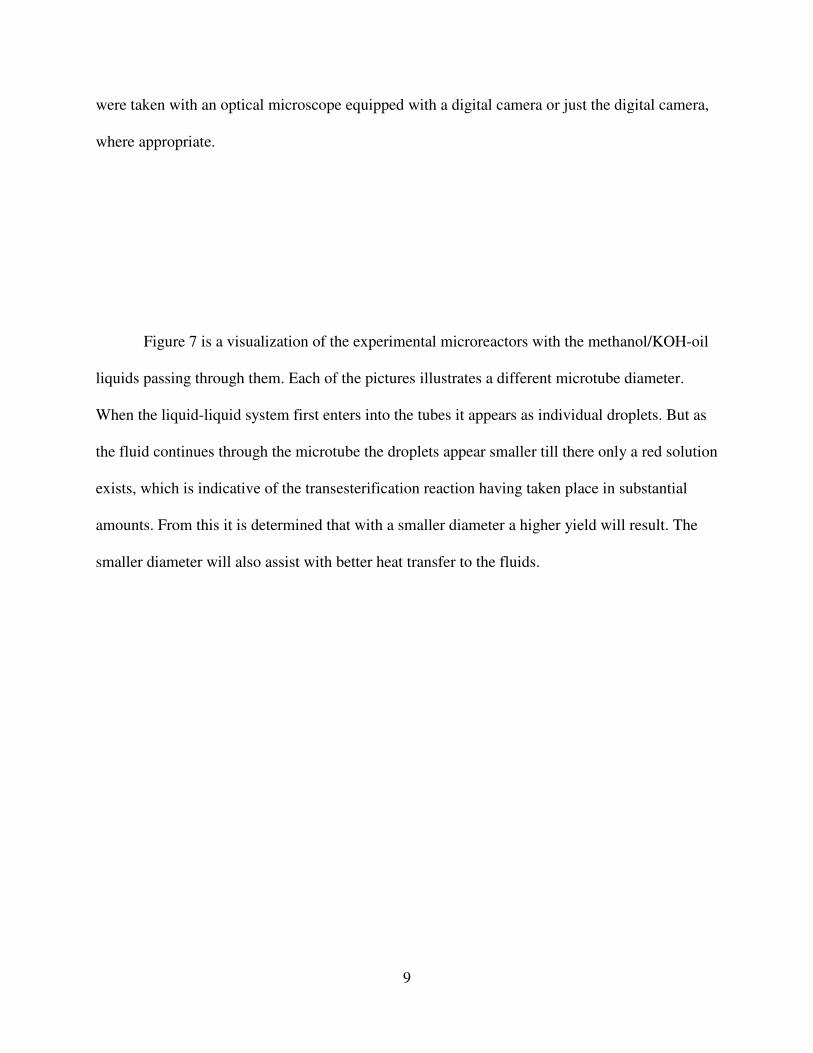
Figure 7 is a visualization of the experimental microreactors with the methanol/KOH-oil
liquids passing through them. Each of the pictures illustrates a different microtube diameter.
When the liquid-liquid system first enters into the tubes it appears as individual droplets. But as
the fluid continues through the microtube the droplets appear smaller till there only a red solution
exists, which is indicative of the transesterification reaction having taken place in substantial
amounts. From this it is determined that with a smaller diameter a higher yield will result. The
smaller diameter will also assist with better heat transfer to the fluids.
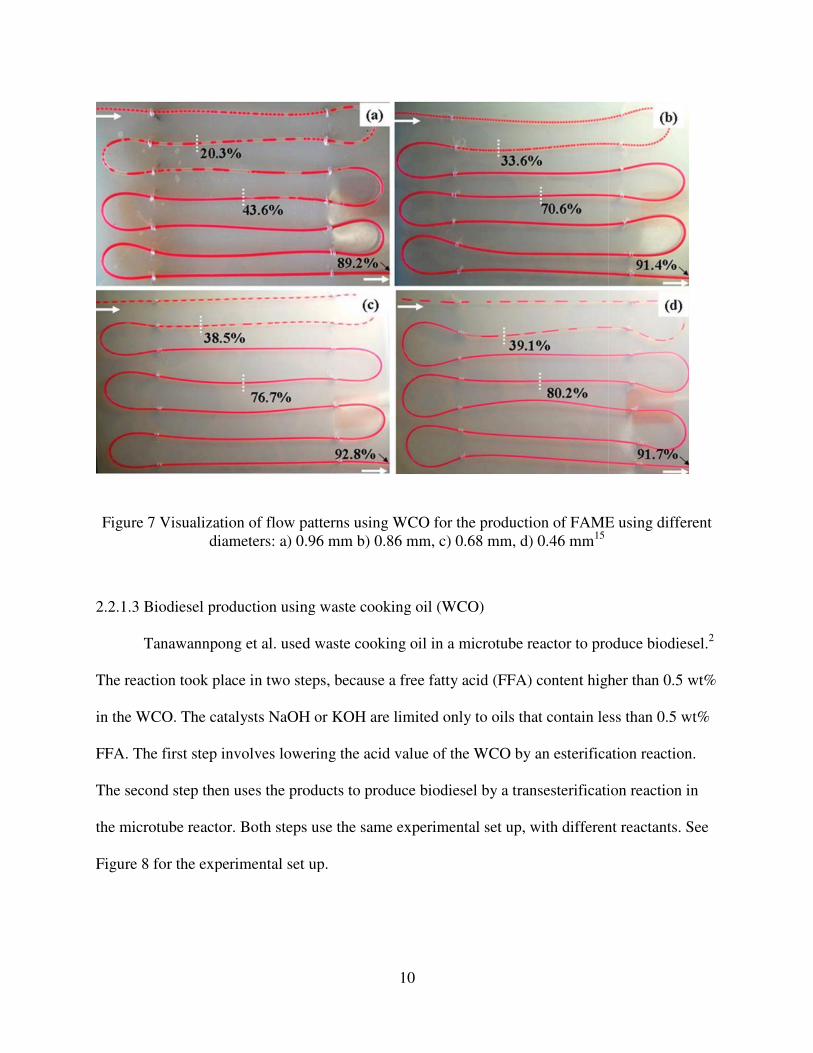
Figure 7 Visualization of flow patterns using WCO for the production of FAME using different
diameters: a) 0.96 mm b) 0.86 mm, c) 0.68 mm, d) 0.46 mm
2.2.1.3 Biodiesel production using waste cooking oil (WCO)
Tanawannpong et al. used waste cooking oil in a microtube reactor to produce biodiesel.
The reaction took place in two steps, because
in the WCO. The catalysts NaOH or KOH are limited only to oils that contain less than 0.5 wt%
FFA. The first step involves lowering the acid value of the WCO by an esterification reaction.
The second step then uses the products to produce biodiesel
the microtube reactor. Both steps use the same experimental set up, with different reactants.
Figure 8 for the experimental set up.
10
Visualization of flow patterns using WCO for the production of FAME using different
diameters: a) 0.96 mm b) 0.86 mm, c) 0.68 mm, d) 0.46 mm15
Biodiesel production using waste cooking oil (WCO)
Tanawannpong et al. used waste cooking oil in a microtube reactor to produce biodiesel.
k place in two steps, because a free fatty acid (FFA) content higher than
in the WCO. The catalysts NaOH or KOH are limited only to oils that contain less than 0.5 wt%
FFA. The first step involves lowering the acid value of the WCO by an esterification reaction.
The second step then uses the products to produce biodiesel by a transesterification reaction in
Both steps use the same experimental set up, with different reactants.
for the experimental set up.
Visualization of flow patterns using WCO for the production of FAME using different
Tanawannpong et al. used waste cooking oil in a microtube reactor to produce biodiesel.2
a free fatty acid (FFA) content higher than 0.5 wt%
in the WCO. The catalysts NaOH or KOH are limited only to oils that contain less than 0.5 wt%
FFA. The first step involves lowering the acid value of the WCO by an esterification reaction.
by a transesterification reaction in
Both steps use the same experimental set up, with different reactants. See
11
Figure 8 Experimental setup for microtube reactor—Two step process2
The microtube was made of polytetrafluoroethylene (PTFE) with an inner diameter of
0.508 mm and a length of 1.2 m. This microtube was placed in a hot water jacket in order to
control the reaction temperature. At the entrance, a T-mixer was used to connect the WCO and
the methanol—mixed with the catalyst. The reactants were pumped via a HPLC pump. At the
exit the microtube was placed in a cold water jacket to terminate the reaction. Then finally, the
product collection flask was placed in an ice bath.
The optimal conditions were determined for the acid-catalyzed pretreatment step to have
a molar ratio of methanol-to-oil ratio of 9:1, a 1 wt% sulfuric acid, a reaction time of 5 seconds,
and a reaction temperature of 65ºC. The products collected appeared in two phases, methanol at
the top and oil at the bottom. The oil was then washed with deionized water and dried at 107ºC
12
for 30 minutes. After the esterification reaction, the WCO product had an acid value of 0.89 mg
KOH/g compared the value at the starting point of 3.96 mg KOH/g. This is an acceptable amount
to use KOH as the catalyst for the transesterification process. The difference between the
esterification and transesterification reactions can be seen in section 3.5.1.
For the transesterification reaction the optimal condition are the same as for the
esterification reaction, except 1 wt% KOH is now used instead of the H2SO4. The process
remained the same. This resulted in a methyl ester yield of 91.76%.
2.2.2 Capillary Microreactors
The difference between a microtube reactor and capillary reactor is the type of material
the tube is made of and the length of the tube. Capillary microreactors are made out of either
quartz or stainless steel. They will have an inner diameter (ID) of either 0.25 mm or 0.53 mm
with a length of 30 m. The inlet side of this reactor is connected to a high performance liquid
chromatography (HPLC) with the outlet connected to a collection vial. This microreactor is kept
immersed in a water bath to maintain the temperature during the experiment.16
Sun et al. used unrefined rapeseed oil and cottonseed oil with methanol and KOH as a
catalyst to produce biodiesel.16
A mixture of oil, methanol, and KOH was prepared before
entering the microreactor, by vigorous stirring. The mixture was then injected into the
microreactor at a constant flow rate and temperature. The products appeared in three phases: the
top was methanol, the middle was methyl ester, and the bottom was glycerol. The methanol was
evaporated off and the methyl ester phase was removed and washed with DI water. Three
experiments were conducted to find the optimal conditions for methyl ester yields.
13
The first experiment used rapeseed oil in a quartz capillary with an ID of 0.53 mm. The
optimal conditions for methyl ester yield were determined to be when the molar ratio of oil to
methanol was 1:6 with 1 wt% KOH, a temperature of 60ºC, and a residence time of 8.2 minutes.
This resulted in a methyl ester yield of 96.7%.
The second experiment used rapeseed oil in a quartz capillary with an ID of 0.25 mm.
The optimal conditions for methyl ester yield were determined to be when the molar ratio of oil
to methanol was 1:6 with 1 wt% KOH, a temperature of 60ºC, and a residence time of 6 minutes.
This resulted in a methyl ester yield of 98.8%. It was found that the smaller diameter capillary
tube resulted in a higher yield with a lower residence time.
The third experiment was performed to investigate the transesterification reaction using
microchannels. The experiments used cottonseed oil and a microchannel reactor assembled by
two parallel stainless steel capillary tubes with an ID of 0.25 mm.16
The optimal condition for
methyl ester yield was determined to be when the molar ratio of oil to methanol was 1:6, with 1
wt% KOH, a temperature of 60ºC, and a residence time of 6 minutes. The methyl ester yield was
found to be 95%. The experiment concluded that microchannel reactors can be used in the
synthesis of biodiesel. However, the reactants were premixed, so the benefits of this kind of
microreactor have to still be determined.16
These results are similar to the microtube reactors with respect to percent yield. However,
the residence time is significantly longer. The microtube reactors had optimal residence times of
14
several seconds; the capillary reactors had residence times in the minutes. The shorter residence
time is better for production of biodiesel.
2.2.3 Microchannel Reactors
The difference between microtube and microchannel reactors is the geometry of the area
where the solution is flowing. A microtube has a cylindrical geometry while a microchannel has
a rectangular geometry with respect to the channels.
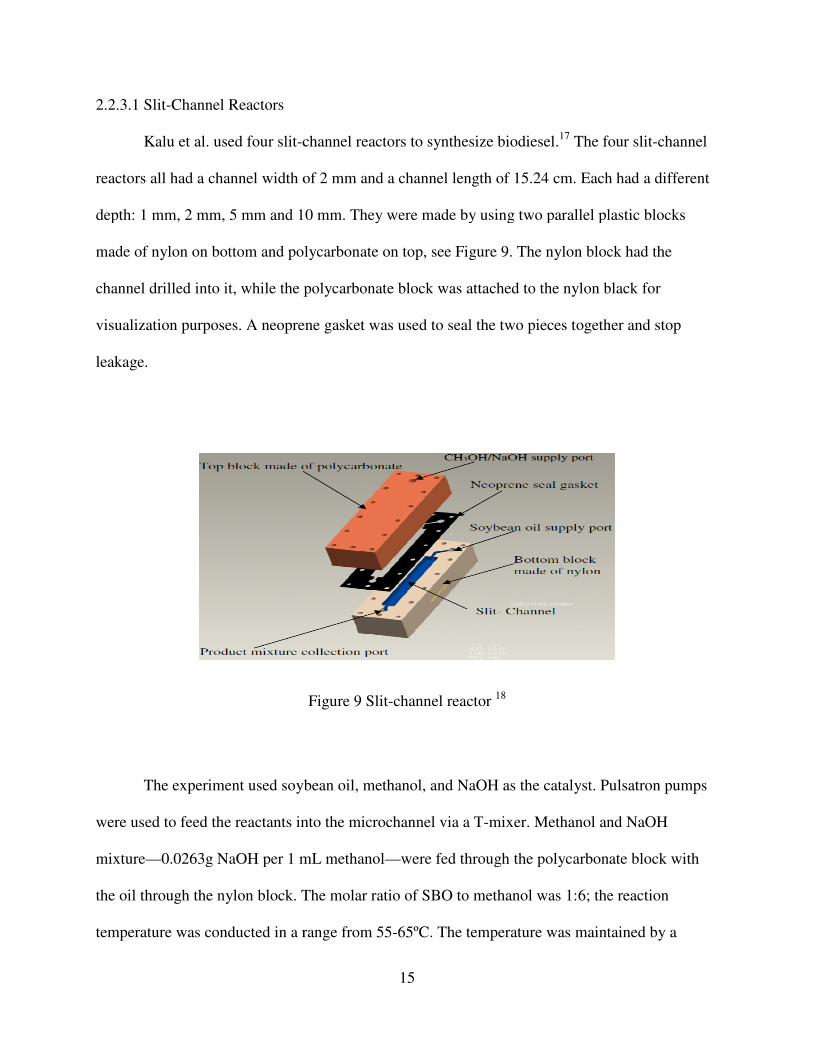
2.2.3.1 Slit-Channel Reactors
Kalu et al. used four slit-channel reactors to synthesize biodiesel.
reactors all had a channel width of 2 mm and a channel length of 15.24 cm. Each had a different
depth: 1 mm, 2 mm, 5 mm and 10 mm. They were made by using two parallel plastic blocks
made of nylon on bottom and polycarbonate on top, see Figure 9
channel drilled into it, while the polycarbonate block was attached to the nylon black for
visualization purposes. A neoprene gasket was used to seal the two pieces together and stop
leakage.
The experiment used soybean oil, methanol, and NaOH as the catalyst. Pulsatron pumps
were used to feed the reactants into the microchannel via a T
mixture—0.0263g NaOH per 1 mL methanol
the oil through the nylon block. The molar ratio of SBO to methanol was
temperature was conducted in a range from 55
15
channel reactors to synthesize biodiesel.17
The four slit
reactors all had a channel width of 2 mm and a channel length of 15.24 cm. Each had a different
depth: 1 mm, 2 mm, 5 mm and 10 mm. They were made by using two parallel plastic blocks
lycarbonate on top, see Figure 9. The nylon block had the
polycarbonate block was attached to the nylon black for
visualization purposes. A neoprene gasket was used to seal the two pieces together and stop
Figure 9 Slit-channel reactor 18
The experiment used soybean oil, methanol, and NaOH as the catalyst. Pulsatron pumps
were used to feed the reactants into the microchannel via a T-mixer. Methanol and
0.0263g NaOH per 1 mL methanol—were fed through the polycarbonate block with
the oil through the nylon block. The molar ratio of SBO to methanol was 1:6; the reaction
temperature was conducted in a range from 55-65ºC. The temperature was maintained by
The four slit-channel
reactors all had a channel width of 2 mm and a channel length of 15.24 cm. Each had a different
depth: 1 mm, 2 mm, 5 mm and 10 mm. They were made by using two parallel plastic blocks
. The nylon block had the
polycarbonate block was attached to the nylon black for
visualization purposes. A neoprene gasket was used to seal the two pieces together and stop
The experiment used soybean oil, methanol, and NaOH as the catalyst. Pulsatron pumps
mixer. Methanol and NaOH
were fed through the polycarbonate block with
the reaction
tained by a
16
shaker bath. The products where fed in to a container placed in an ice bath to terminate the
reaction. It was determined that the yield of FAME is a function of channel depth and residence
time. As channel depth decreases along with residence time the biodiesel yield increases. No
quantitative results were published.
2.2.3.2 Zigzag microchannel reactors
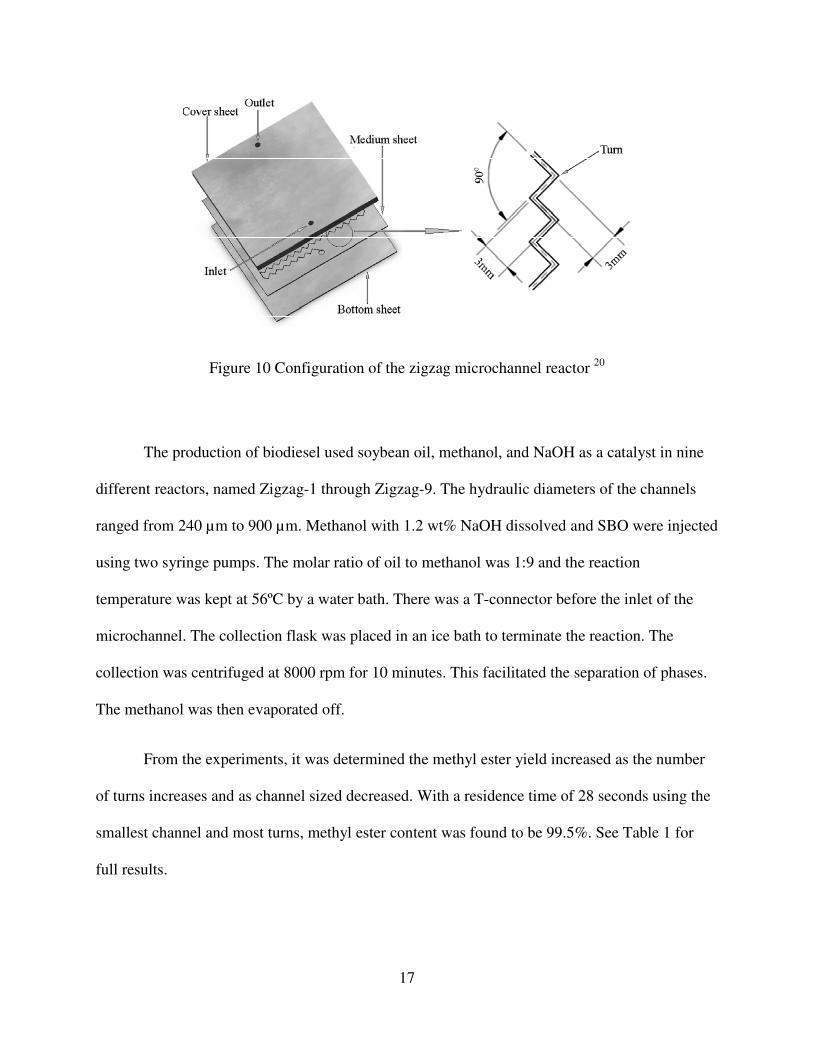
Wen et al. used microchannels on a steel plate to produce biodiesel.19
These channels are
made of stainless steel (SS316L). The channel was created in the steel by using an electric spark
process. The channels are rectangular in shape with a total length in the steel of 1.07 m. The
reactor has three main parts, as seen in Figure 10. The top sheet has inlet and outlet holes. The
middle sheet has wells for the inlet and outlet along with the channels. The bottom sheet is for
stability of the entire reactor.
To assemble the reactor the three sheets are polished to a roughness of 2 µm, followed by
a cleaning with acetone. A diffusion bonding process is then carried out at 1000ºC, at 10 MPa of
pressure, and in a vacuum for three hours. After this process the reactor is cooled to room
temperature. Two ferrule fittings are then bonded on the outlet and inlet of the cover sheet for
plumbing.19
17
Figure 10 Configuration of the zigzag microchannel reactor 20
The production of biodiesel used soybean oil, methanol, and NaOH as a catalyst in nine
different reactors, named Zigzag-1 through Zigzag-9. The hydraulic diameters of the channels
ranged from 240 µm to 900 µm. Methanol with 1.2 wt% NaOH dissolved and SBO were injected
using two syringe pumps. The molar ratio of oil to methanol was 1:9 and the reaction
temperature was kept at 56ºC by a water bath. There was a T-connector before the inlet of the
microchannel. The collection flask was placed in an ice bath to terminate the reaction. The
collection was centrifuged at 8000 rpm for 10 minutes. This facilitated the separation of phases.
The methanol was then evaporated off.
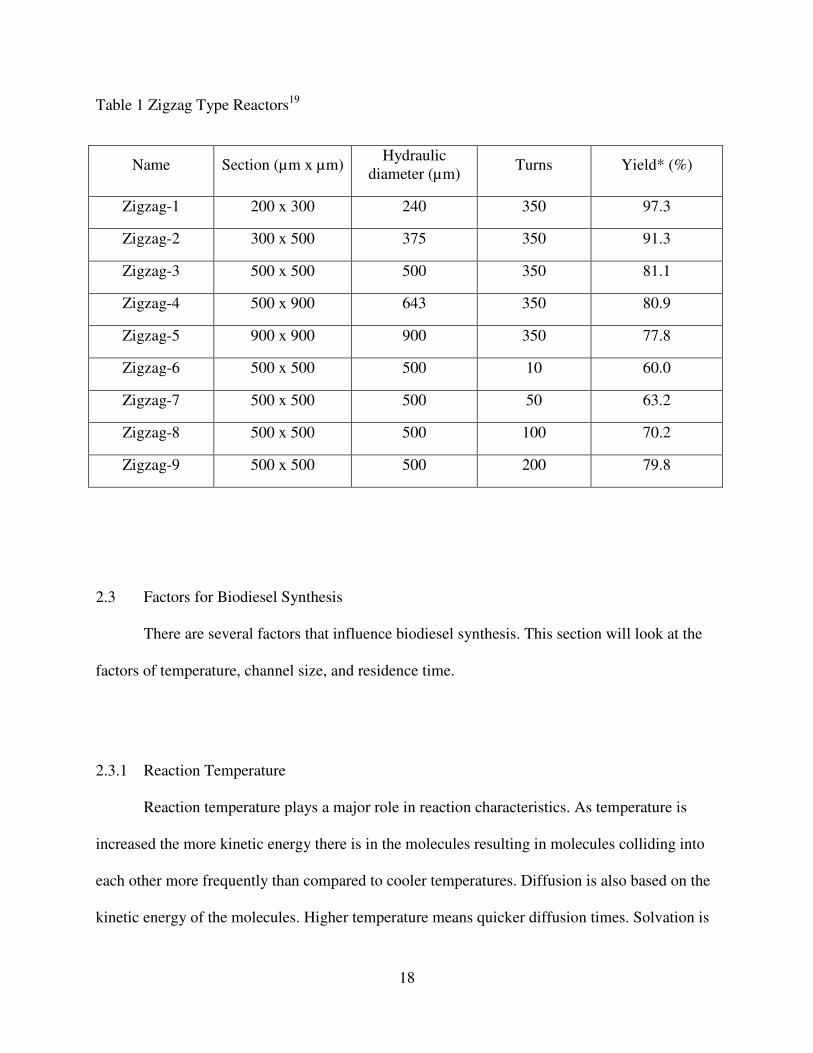
From the experiments, it was determined the methyl ester yield increased as the number
of turns increases and as channel sized decreased. With a residence time of 28 seconds using the
smallest channel and most turns, methyl ester content was found to be 99.5%. See Table 1 for
full results.
18
Table 1 Zigzag Type Reactors19
Name Section (µm x µm) Hydraulic
diameter (µm) Turns Yield* (%)
Zigzag-1 200 x 300 240 350 97.3
Zigzag-2 300 x 500 375 350 91.3
Zigzag-3 500 x 500 500 350 81.1
Zigzag-4 500 x 900 643 350 80.9
Zigzag-5 900 x 900 900 350 77.8
Zigzag-6 500 x 500 500 10 60.0
Zigzag-7 500 x 500 500 50 63.2
Zigzag-8 500 x 500 500 100 70.2
Zigzag-9 500 x 500 500 200 79.8
2.3 Factors for Biodiesel Synthesis
There are several factors that influence biodiesel synthesis. This section will look at the
factors of temperature, channel size, and residence time.
2.3.1 Reaction Temperature
Reaction temperature plays a major role in reaction characteristics. As temperature is
increased the more kinetic energy there is in the molecules resulting in molecules colliding into
each other more frequently than compared to cooler temperatures. Diffusion is also based on the
kinetic energy of the molecules. Higher temperature means quicker diffusion times. Solvation is
19
also dependent on temperature. The high temperatures will result in more molecules being
solvated. Thus, the molecules will have a more favorable interaction. This will also decrease the
needed residence time to reach the optimal yield. These ideas are useful for both homozygous
and heterozygous catalysis.
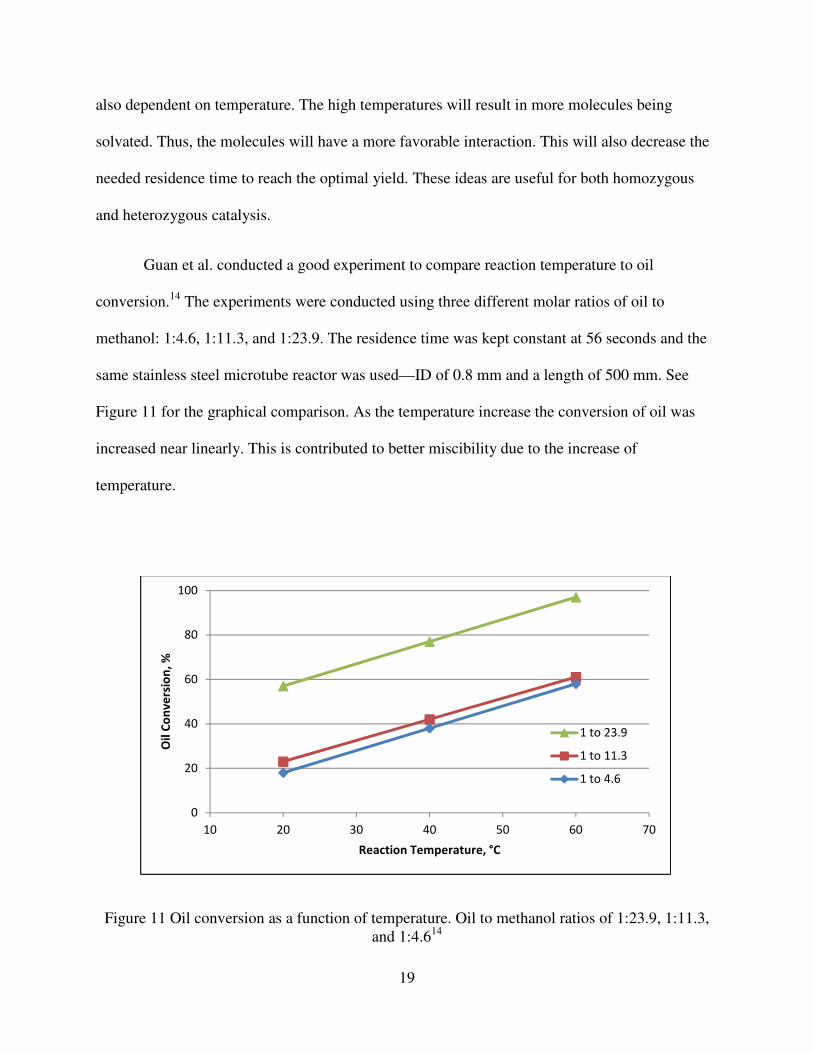
Guan et al. conducted a good experiment to compare reaction temperature to oil
conversion.14
The experiments were conducted using three different molar ratios of oil to
methanol: 1:4.6, 1:11.3, and 1:23.9. The residence time was kept constant at 56 seconds and the
same stainless steel microtube reactor was used—ID of 0.8 mm and a length of 500 mm. See
Figure 11 for the graphical comparison. As the temperature increase the conversion of oil was
increased near linearly. This is contributed to better miscibility due to the increase of
temperature.
Figure 11 Oil conversion as a function of temperature. Oil to methanol ratios of 1:23.9, 1:11.3,
and 1:4.614
0
20
40
60
80
100
10 20 30 40 50 60 70
Oil
Co
nv
ers
ion
, %
Reaction Temperature, °C
1 to 23.9
1 to 11.3
1 to 4.6
20
Sun et al. increased the reaction temperature above the boiling point of methanol
(65.7°C), which was used in the transesterification reaction.16
The conclusion of having a
temperature hotter than the boiling point was a reduction in methyl ester yield. At 60°C the
methyl ester yield was 99.4% and at 70°C the yield was 99.1%. This is only a slight decrease;
however this decrease can be attributed to the flow changing from a liquid-liquid to a liquid-gas
flow. The changing of methanol to a gas will decrease the available methanol that can be
solubilized and react. This also increases the rate of saponification of the glycerides by the
alkaline catalyst.16
2.3.2 Microchannel Size
Guan et al. conducted an experiment that compares the ID of microtube reactors to oil
conversion.14
In the experiment, the temperature was kept constant at 60°C. There were three
different methanol to oil molar ratios compared: 4.6, 11.3, and 23.9. Four microtube reactors
were used with lengths and IDs of 1000 mm for 0.4 mm ID, 444 mm for 0.6 mm ID, 250 mm for
0.8 mm ID, and 160mm for 1.0 mm ID. The lengths were changed in order to keep the same
residence time, 26 seconds, and volumetric flow rate. Figure 12 summarizes the findings of the
experiment. As the microtube ID decreased the velocity of the fluid was increased to maintain
the flow rate.
21
Figure 12 Oil conversion as a function of microtube reactor inner diameter, mm. Oil to methanol
molar ratios are 23.9, 11.3, 4.6.14
Wen et al. examined the effect of channel size by using the zigzag type of microchannel
reactor.19
Nine different types of reactors were compared. Table 1 summarizes the types of
reactors. Examining Zigzag-1 through Zigzag-5 gives the best comparison of microreactor
channel size effects since the number of turns is kept constant. As the hydraulic diameter
decreases the yield increases.
0
20
40
60
80
100
0.2 0.4 0.6 0.8 1 1.2
Oil
Co
nv
ers
ion
, %
Microtube Inner Diameter, mm
23.9
11.3
4.6
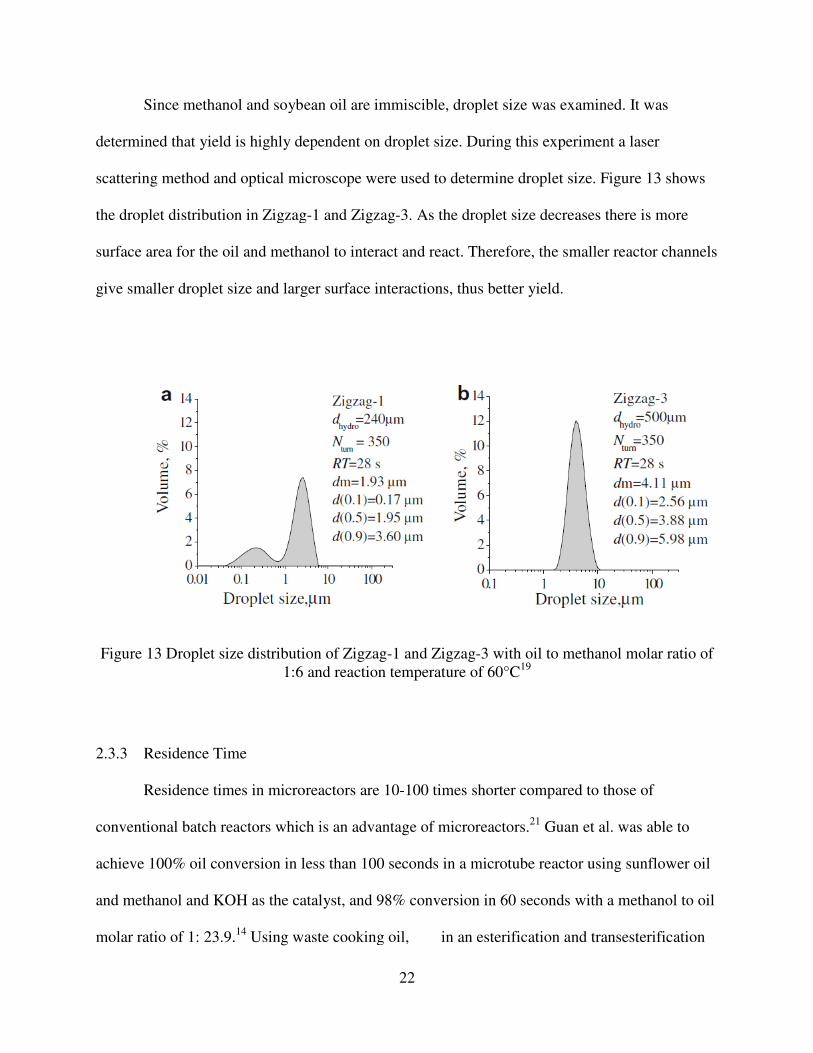
Since methanol and soybean oil are immiscible
determined that yield is highly dependent on droplet size. During this experiment a laser
scattering method and optical microscope were
the droplet distribution in Zigzag
surface area for the oil and methanol to interact and react. Therefore, the smaller reactor channels
give smaller droplet size and larger surface interactions, thus better yield.
Figure 13 Droplet size distribution of Zigzag
1:6 and reaction temperature of 60°C
2.3.3 Residence Time
Residence times in microreactors are 10
conventional batch reactors which i
achieve 100% oil conversion in less than 100 seconds in a microtube reactor using sunflower oil
and methanol and KOH as the catalyst, and 98% conversion in 60 seconds with a methano
molar ratio of 1: 23.9.14
Using waste cooking oil,
22
Since methanol and soybean oil are immiscible, droplet size was examined. It was
determined that yield is highly dependent on droplet size. During this experiment a laser
method and optical microscope were used to determine droplet size. Figure 13
the droplet distribution in Zigzag-1 and Zigzag-3. As the droplet size decreases there is more
for the oil and methanol to interact and react. Therefore, the smaller reactor channels
and larger surface interactions, thus better yield.
Droplet size distribution of Zigzag-1 and Zigzag-3 with oil to methanol molar ratio of
1:6 and reaction temperature of 60°C19
Residence times in microreactors are 10-100 times shorter compared to those of
conventional batch reactors which is an advantage of microreactors.21
Guan et al. was able to
less than 100 seconds in a microtube reactor using sunflower oil
and methanol and KOH as the catalyst, and 98% conversion in 60 seconds with a methano
waste cooking oil, in an esterification and transesterification
droplet size was examined. It was
determined that yield is highly dependent on droplet size. During this experiment a laser
ine droplet size. Figure 13 shows
3. As the droplet size decreases there is more
for the oil and methanol to interact and react. Therefore, the smaller reactor channels
3 with oil to methanol molar ratio of
100 times shorter compared to those of
Guan et al. was able to
less than 100 seconds in a microtube reactor using sunflower oil
and methanol and KOH as the catalyst, and 98% conversion in 60 seconds with a methanol to oil
in an esterification and transesterification
23
reaction it was noted that increasing the residence time increased the acid value. So a minimum
acid value was found with a residence time of five seconds which then gave a FAME yield of
91.76%.2 In capillary microreactors the yield increased as the residence time increased, to an
extent. The maximum methyl ester yield of 99.4% was found at a residence time of six
minutes.16
An increase past six minutes decreased the methyl ester yield due to the equilibrium
nature of the transesterification reaction. Guan conducted several experiment to test the effect of
residence time to oil conversion. Figure 14 is with three different methanol to oil molar ratios—
4.6, 11.3, and 23.9. The temperature was kept at 20°C. This experiment showed at higher
residence times there was a limit to the conversion. The limit was varied with the molar ratio; as
the molar ratio was higher so was the conversion limit.
Figure 14 Oil conversion as a function of residence time, with methanol to oil molar ratios of
23.9, 11.3, and 4.6.14
0
20
40
60
80
0 50 100 150 200 250 300
Oil
Co
nv
ers
ion
, %
Residence time, s
23.9
11.3
4.6
24
2.4 Mixing
There are several ways to mix solutions together. This section discusses a few of the
possibilities: diffusion, zigzag geometry, and ultrasonic.
2.4.1 Diffusion
Diffusion is the process of one type of molecule migrating through a solution of another
type. This is based on the kinetic energy, solubility, and concentration of the molecules. As the
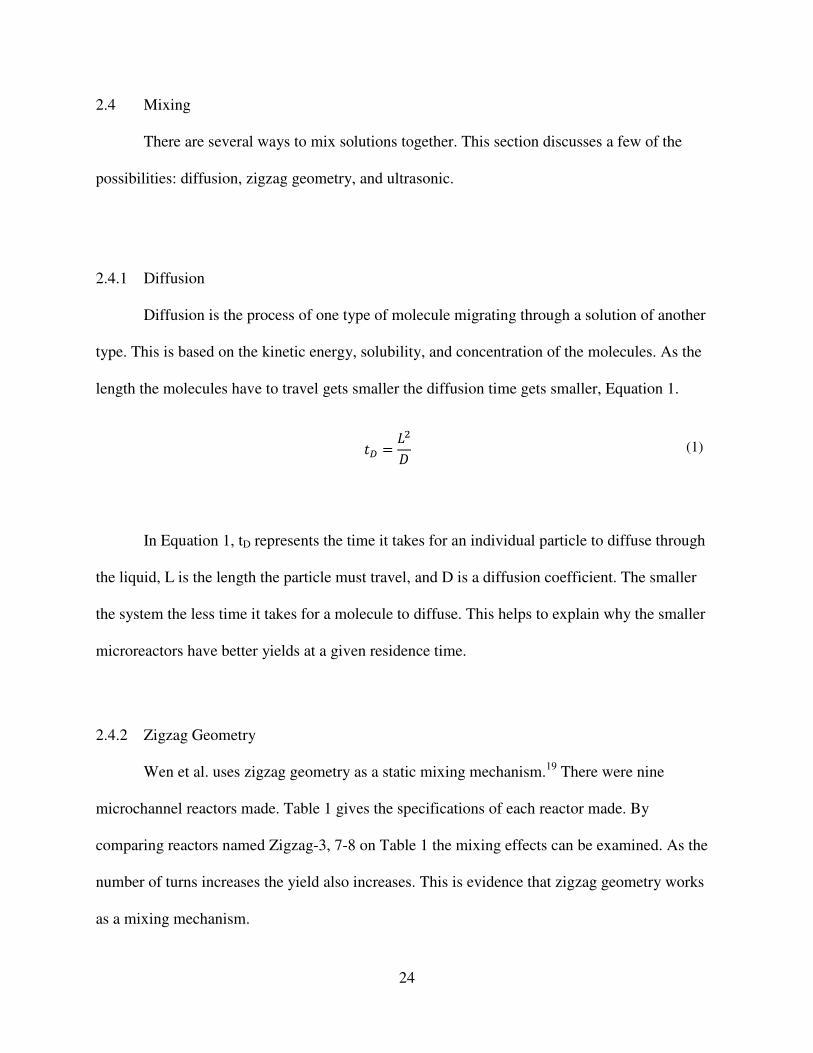
length the molecules have to travel gets smaller the diffusion time gets smaller, Equation 1.
�� �
��
� (1)
In Equation 1, tD represents the time it takes for an individual particle to diffuse through
the liquid, L is the length the particle must travel, and D is a diffusion coefficient. The smaller
the system the less time it takes for a molecule to diffuse. This helps to explain why the smaller
microreactors have better yields at a given residence time.
2.4.2 Zigzag Geometry
Wen et al. uses zigzag geometry as a static mixing mechanism.19
There were nine
microchannel reactors made. Table 1 gives the specifications of each reactor made. By
comparing reactors named Zigzag-3, 7-8 on Table 1 the mixing effects can be examined. As the
number of turns increases the yield also increases. This is evidence that zigzag geometry works
as a mixing mechanism.
25
2.4.3 Ultrasonic
Ultrasonic mixing was shown to be an effective method of mixing in microchannels.22
Ultrasound waves alternately compress and stretch the molecular spacing of the medium through
which it passes. This can cause cavitation to occur. When the cavity collapses energy is
generated for chemical and mechanical effects. This causes mass transfer though the fluids.
Thus, mixing occurs
The effects of the ultrasonic mixing were found to have a conversion to FAME near 96%
with a residence time of two minutes. A FAME yield of100% was obtained at 45 min at 60ºC
with a methanol to oil molar ratio of 4.5:1.
2.5 Catalysts for Biodiesel Production
The reactions used to produce biodiesel require a catalyst in most cases. There are two
reactions esterification and transesterification. Several catalysts can be used for these reactions
which can be broken into two groups: homogenous and heterogeneous. Homogenous catalysts
are a liquid and mix in with the alcohol phase. Heterogeneous catalysts are solid that do not
dissolve with the reactants.
2.5.1 Homogeneous
A homogeneous catalyst will be dissolved in the alcohol phase of the reactants. These
catalysts can be either a strong acid or a strong base. The most common acids used are sulfuric
acid and hydrochloric acid; and the most common bases used are NaOH and KOH. The
mechanisms for the production of biodiesel differ for a base and acid.
26
2.5.1.1 Acid
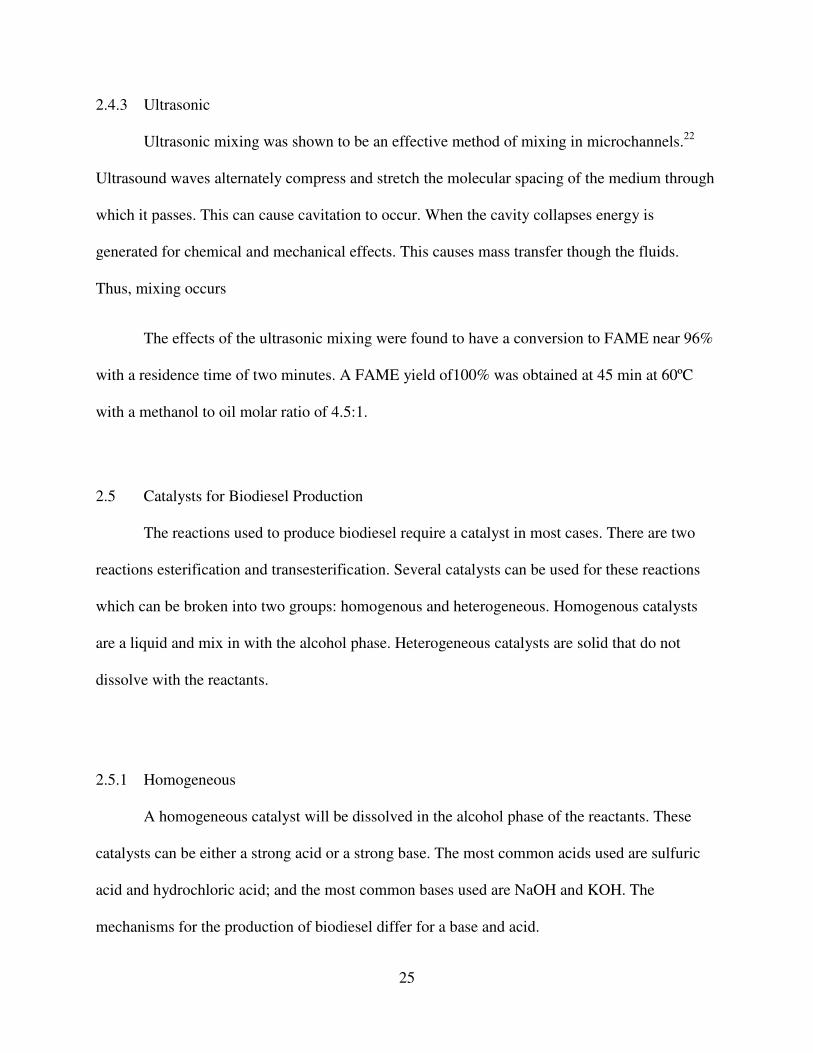
When an acid is used there are several steps, outlined in Figure 15. 1) There is a proton
transfer from the acid catalyst to the carbonyl oxygen. This increases the electrophilicity of the
carbonyl carbon. 2) The carbonyl carbon is then attacked by the nucleophilic oxygen atom of the
alcohol. 3) Tautomerism, the migration of a proton. 4) The loss of water with this oxonium ion
and subsequent deprotonation gives the ester.
Figure 15 Acid catalyzed esterification mechanism23
Tanawannapong et al. used sulfuric acid as a catalyst in order to reduce the acid value of
the WCO.2 The first step of the process was an esterification reaction with the free fatty acid.
The acid number must be less than 1 mg KOH/g in order to use KOH to catalyze the
transesterification reaction of the WCO, specifically the triglycerides. The process was
successful and reached at 91.76% yield. Sun et al. also used this two-step process.16
The highest
yield of FAME was achieved when transesterification of cottonseed oil with methanol at 120ºC
with a residence time of 20 minutes. This was well above the boiling point of methanol at
atmospheric conditions. Because of this
lower availability of methanol.
2.5.1.2 Base
When a base catalyst is used
system there will be an undesirable hyd
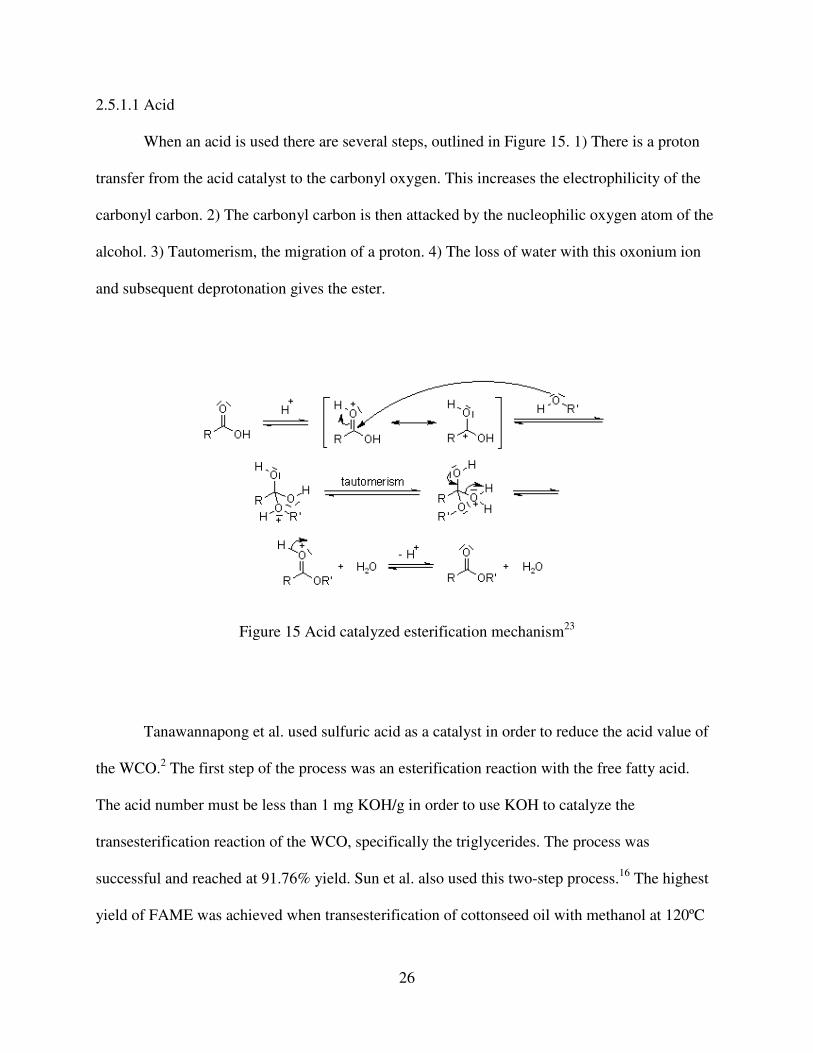
The reaction takes place as in Figure 16
nucleophile attacks the carbonyl carbon, forcing the electrons to the oxygen. 3) The oxonium ion
electrons come back down to the carbonyl carbon kicking off the original RO
RO- group attacks the water molecule that originally deprotonated the alcohol, thus reforming the
base catalyst.
Figure
However, when making biodiesel this transesterification
times. The first reaction will reduce the triglyceride to a
Then the reaction will reduce the diglyceride to a monoglyceride and biodiesel molecule. Finally
the reaction will occur a third time reducing the monoglyceride to glycerol and biodiesel
27
with a residence time of 20 minutes. This was well above the boiling point of methanol at
itions. Because of this a longer residence time would be needed
When a base catalyst is used, the base will deprotonate the alcohol. If there is water in the
system there will be an undesirable hydrolysis. Therefore, the reaction needs to be kept dry.
tion takes place as in Figure 16. 1) The base deprotonates the alcohol. 2) The
nucleophile attacks the carbonyl carbon, forcing the electrons to the oxygen. 3) The oxonium ion
ack down to the carbonyl carbon kicking off the original RO- group. 4) The free
group attacks the water molecule that originally deprotonated the alcohol, thus reforming the
Figure 16 Base catalyst mechanism 11
However, when making biodiesel this transesterification reaction must take place three
times. The first reaction will reduce the triglyceride to a diglyceride and biodiesel molecule.
Then the reaction will reduce the diglyceride to a monoglyceride and biodiesel molecule. Finally
time reducing the monoglyceride to glycerol and biodiesel
with a residence time of 20 minutes. This was well above the boiling point of methanol at
a longer residence time would be needed due to the
the base will deprotonate the alcohol. If there is water in the
he reaction needs to be kept dry.
. 1) The base deprotonates the alcohol. 2) The
nucleophile attacks the carbonyl carbon, forcing the electrons to the oxygen. 3) The oxonium ion
group. 4) The free
group attacks the water molecule that originally deprotonated the alcohol, thus reforming the
reaction must take place three
and biodiesel molecule.
Then the reaction will reduce the diglyceride to a monoglyceride and biodiesel molecule. Finally
time reducing the monoglyceride to glycerol and biodiesel
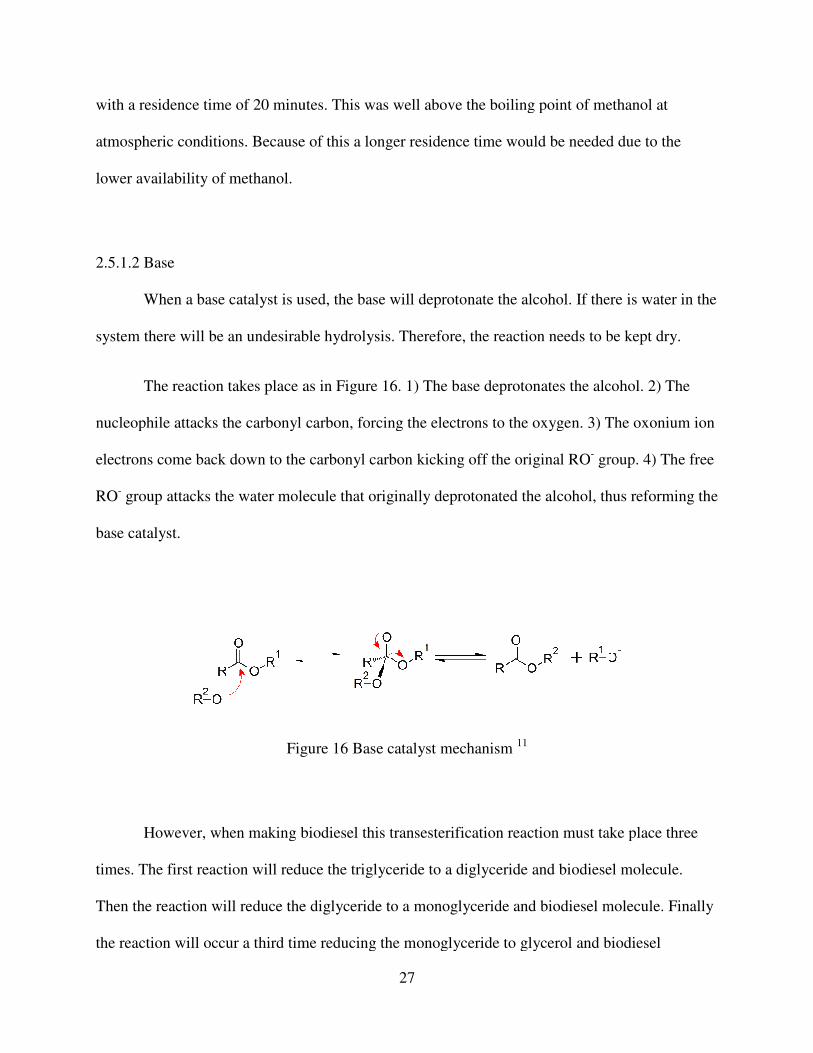
molecule. This results in the consumption of three alcohol molecules and an oil molecule and
produces three biodiesel molecules and a glycerol. The catalyst was consumed and then
generated again in each of these steps. Figure 1
Figure 17 Reaction scheme for biodiesel transesterification
Similarly to the batch reaction the optimal
is about 1 wt%.21
The reaction temperature with base catalyst is usually kept low, as when
temperature increases in this reaction more saponi
the catalyst with a 6:1 methanol to oil molar ratio and a reaction time of 15.71 minutes in a
microtube reactor to obtain an ethyl ester content of 96.0%.
97.3% yield in Zigzag-1 using 6:1 molar ration of me
catalyst.19
28
molecule. This results in the consumption of three alcohol molecules and an oil molecule and
produces three biodiesel molecules and a glycerol. The catalyst was consumed and then
each of these steps. Figure 17 illustrates this process.
Reaction scheme for biodiesel transesterification24
o the batch reaction the optimal concentration of homogeneous base catalysts
The reaction temperature with base catalyst is usually kept low, as when
temperature increases in this reaction more saponification occurs. Richard et al. used EtONa as
the catalyst with a 6:1 methanol to oil molar ratio and a reaction time of 15.71 minutes in a
microtube reactor to obtain an ethyl ester content of 96.0%.13
Wen et al. was able to achieve a
1 using 6:1 molar ration of methanol to oil at 60ºC and KOH as
molecule. This results in the consumption of three alcohol molecules and an oil molecule and
produces three biodiesel molecules and a glycerol. The catalyst was consumed and then
concentration of homogeneous base catalysts
The reaction temperature with base catalyst is usually kept low, as when
fication occurs. Richard et al. used EtONa as
the catalyst with a 6:1 methanol to oil molar ratio and a reaction time of 15.71 minutes in a
Wen et al. was able to achieve a
thanol to oil at 60ºC and KOH as the
29
2.5.2 Heterogeneous
Heterogeneous catalysts do not involve mixing any substance in with the alcohol, but
rather are fixed to the surface of the walls of the microreactor. This is a less costly and simpler
separation process. With the homogeneous base catalyst, soap is formed from the reaction and
must be separated out. By using heterogeneous catalysts there is no soap formed; therefore, there
are less separation costs. There is still glycerol that is a byproduct of all the transesterification
reactions with a triglyceride as a reactant. The heterogeneous catalyst is preferred, because of the
resulting simpler and cheaper separation processes.21
Usage of heterogeneous catalysts in a microreactor is hardly seen, though CaO has been
used for biodiesel production.21
This however turned out to be problematic. The calcium gets
dissolved into the alcohol, and then would need a separation reaction. Leaving the calcium in the
product would not be an option as calcium will build up in an engine if burned.
2.5.3 Catalyst-Free
Trentin et al. performed transesterification of soybean oil (SBO) at supercritical ethanol
conditions in a continuous catalyst free process using carbon dioxide as a co-solvent.25, 26
The
reaction was conducted by using two microtube reactors with an internal volume of 37.9 mL and
24.9 mL with an internal diameter of 0.775 mm and 0.571 mm, respectively. These microtubes
were made of stainless steel with an outer diameter of 1/16”.
The reaction involved placing the ethanol and oil in an Erlenmeyer flask and mixing the
liquids together via a mechanical mixing device. The molar ratio of oil to ethanol was 1:20. The
liquid mix was fed into the microtube reactor via a HPLC pump at a flow rate of 0.8 mL/min.
30
Using a syringe pump, carbon dioxide was fed into the system as a co-solvent at a specific rate.
The microtube reactor was placed in a furnace where the temperature could be measured and
adjusted as needed. A glass vial was used to collect the products. The optimal conditions for the
highest yield of ethyl ester were determined to be at a reaction temperature and pressure of 598K
and 20 MPa and using a carbon dioxide to liquid mixture mass ratio of 0.20:1. The smaller
diameter microtube reactor showed to have a higher FAEE yield compared to the larger diameter
reactor.
This experiment has proven to be successful in producing FAEE. However, this process
involves a high cost to maintain and large energy usage. This process is less cost effective than
other processes to synthesize biodiesel.
2.6 UTC Biodiesel Synthesis
At UTC the microreactor research group uses vegetable oil and methanol as reactants and
nickel oxide (NiO) as a solid heterogeneous catalyst. This poses the problem of having a two-
phase system. Nonetheless, the system was studied with positive results, using stirred-tank
reactors and high temperature stainless steel vials.6, 7
To try and overcome the phase barrier a co-
solvent is used to mix the soybean oil and methanol into one phase. The co-solvent used is oleic
acid, a free fatty acid.27
31
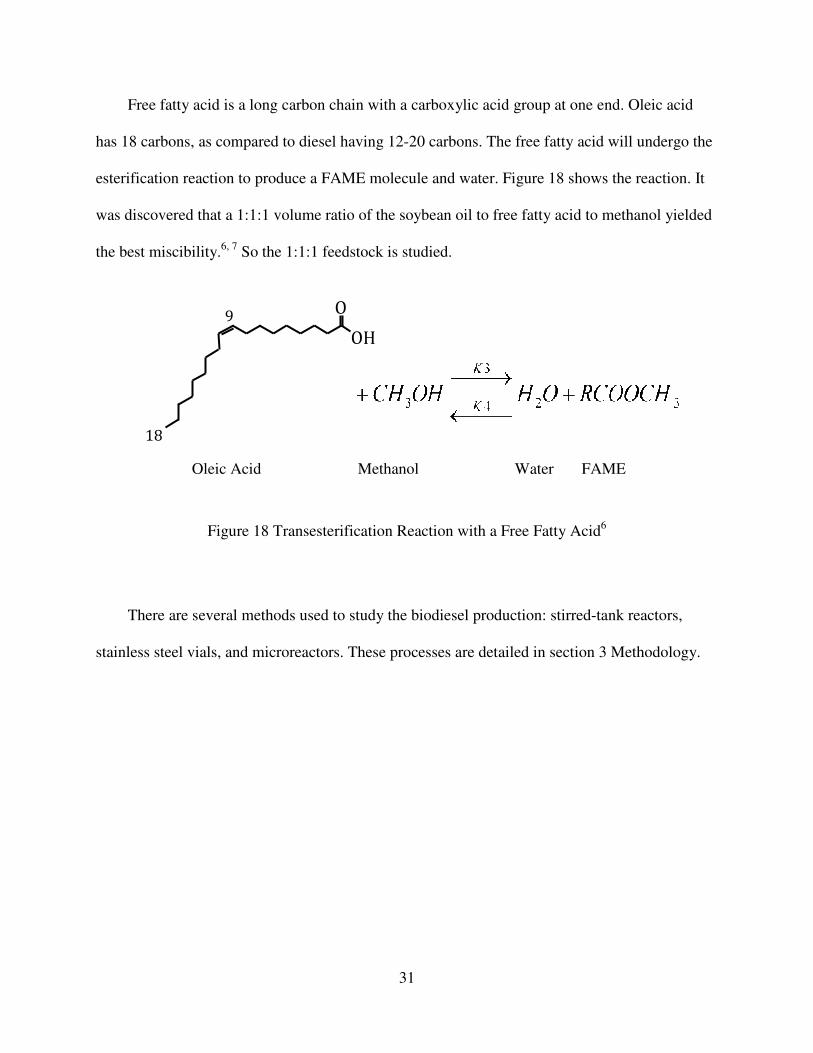
Free fatty acid is a long carbon chain with a carboxylic acid group at one end. Oleic acid
has 18 carbons, as compared to diesel having 12-20 carbons. The free fatty acid will undergo the
esterification reaction to produce a FAME molecule and water. Figure 18 shows the reaction. It
was discovered that a 1:1:1 volume ratio of the soybean oil to free fatty acid to methanol yielded
the best miscibility.6, 7
So the 1:1:1 feedstock is studied.
Figure 18 Transesterification Reaction with a Free Fatty Acid6
There are several methods used to study the biodiesel production: stirred-tank reactors,
stainless steel vials, and microreactors. These processes are detailed in section 3 Methodology.
Oleic Acid Methanol Water FAME
18
9 O
OH
32
CHAPTER 3
METHODOLOGY
In this section the methods to collect data will be discussed. The methods include
measuring density, viscosity, stirred-tank reactors, stainless steel reactors, purification,
microreactors, and analytical chemistry.
3.1 Measuring Density
The one-phase feedstock is a mixture of soybean oil, free fatty acid, and methanol28
in a
1:1:1 volume ratio. The method of measuring a known amount of volume and weighing that
volume was used. This volume was measured using a 2 mL class A glass analytical pipet, then
weighed on a scale. The procedure is as follows.
1) Heat a water bath to the desired temperature, room temperature to 64°C, using the
EchoTherm Programmable Multi-position Stirring Hot Plate.
2) Place the vial of liquid in the water bath and let the temperature equilibrate. Test the
temperature of the liquid in the vial compared to the water bath.
3) Tare the 2 mL class A pipet, and fill pipet with vail liquid to the appropriate mark.
4) Weigh the pipet with liquid
5) Clean and dry the pipet and repeat the process at each desired temperature.
33
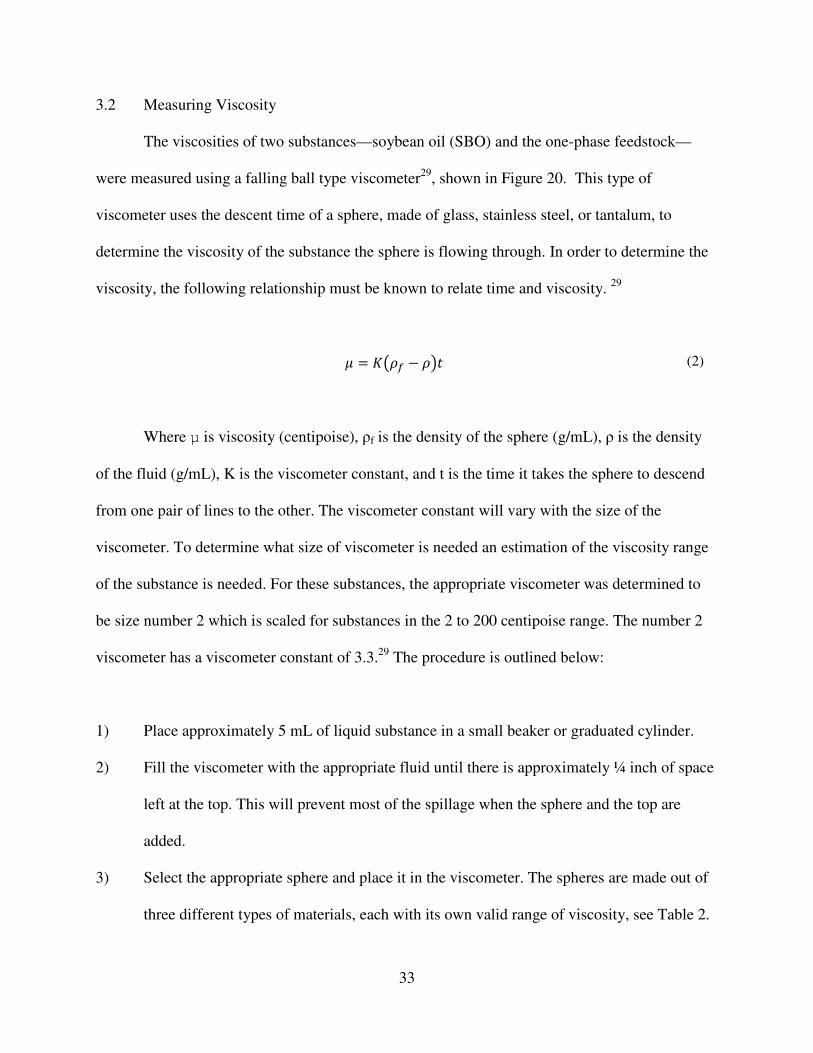
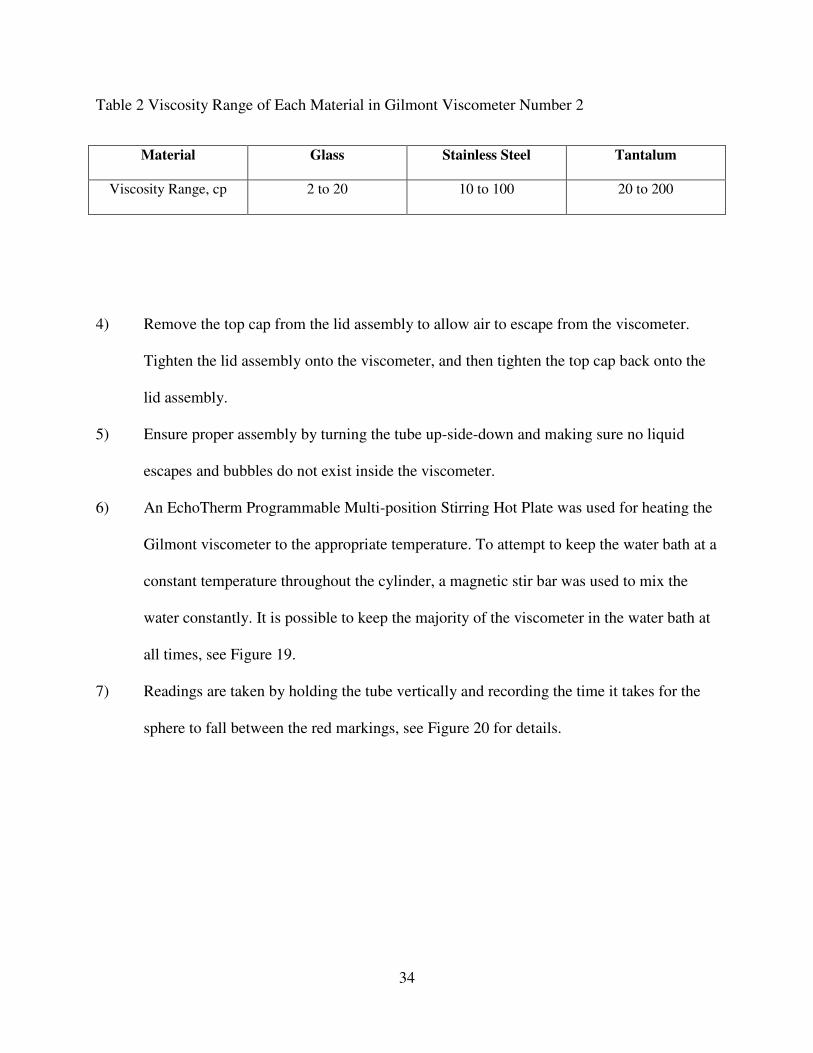
3.2 Measuring Viscosity
The viscosities of two substances—soybean oil (SBO) and the one-phase feedstock—
were measured using a falling ball type viscometer29
, shown in Figure 20. This type of
viscometer uses the descent time of a sphere, made of glass, stainless steel, or tantalum, to
determine the viscosity of the substance the sphere is flowing through. In order to determine the
viscosity, the following relationship must be known to relate time and viscosity. 29
� � �� � � (2)
Where µ is viscosity (centipoise), ρf is the density of the sphere (g/mL), ρ is the density
of the fluid (g/mL), K is the viscometer constant, and t is the time it takes the sphere to descend
from one pair of lines to the other. The viscometer constant will vary with the size of the
viscometer. To determine what size of viscometer is needed an estimation of the viscosity range
of the substance is needed. For these substances, the appropriate viscometer was determined to
be size number 2 which is scaled for substances in the 2 to 200 centipoise range. The number 2
viscometer has a viscometer constant of 3.3.29
The procedure is outlined below:
1) Place approximately 5 mL of liquid substance in a small beaker or graduated cylinder.
2) Fill the viscometer with the appropriate fluid until there is approximately ¼ inch of space
left at the top. This will prevent most of the spillage when the sphere and the top are
added.
3) Select the appropriate sphere and place it in the viscometer. The spheres are made out of
three different types of materials, each with its own valid range of viscosity, see Table 2.
34
Table 2 Viscosity Range of Each Material in Gilmont Viscometer Number 2
Material Glass Stainless Steel Tantalum
Viscosity Range, cp 2 to 20 10 to 100 20 to 200
4) Remove the top cap from the lid assembly to allow air to escape from the viscometer.
Tighten the lid assembly onto the viscometer, and then tighten the top cap back onto the
lid assembly.
5) Ensure proper assembly by turning the tube up-side-down and making sure no liquid
escapes and bubbles do not exist inside the viscometer.
6) An EchoTherm Programmable Multi-position Stirring Hot Plate was used for heating the
Gilmont viscometer to the appropriate temperature. To attempt to keep the water bath at a
constant temperature throughout the cylinder, a magnetic stir bar was used to mix the
water constantly. It is possible to keep the majority of the viscometer in the water bath at
all times, see Figure 19.
7) Readings are taken by holding the tube vertically and recording the time it takes for the
sphere to fall between the red markings, see Figure 20 for details.
35
Figure 19 Gilmont Viscometer in Water Bath
Figure 20 Gilmont Viscometer
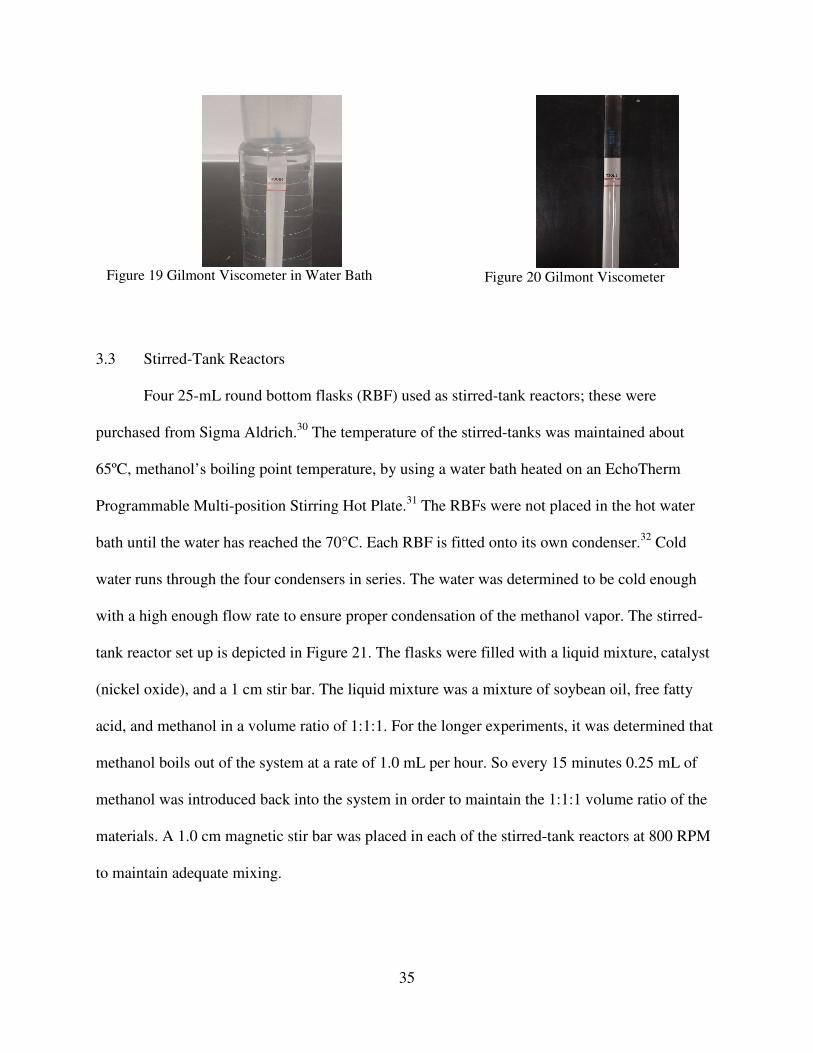
3.3 Stirred-Tank Reactors
Four 25-mL round bottom flasks (RBF) used as stirred-tank reactors; these were
purchased from Sigma Aldrich.30
The temperature of the stirred-tanks was maintained about
65ºC, methanol’s boiling point temperature, by using a water bath heated on an EchoTherm
Programmable Multi-position Stirring Hot Plate.31
The RBFs were not placed in the hot water
bath until the water has reached the 70°C. Each RBF is fitted onto its own condenser.32
Cold
water runs through the four condensers in series. The water was determined to be cold enough
with a high enough flow rate to ensure proper condensation of the methanol vapor. The stirred-
tank reactor set up is depicted in Figure 21. The flasks were filled with a liquid mixture, catalyst
(nickel oxide), and a 1 cm stir bar. The liquid mixture was a mixture of soybean oil, free fatty
acid, and methanol in a volume ratio of 1:1:1. For the longer experiments, it was determined that
methanol boils out of the system at a rate of 1.0 mL per hour. So every 15 minutes 0.25 mL of
methanol was introduced back into the system in order to maintain the 1:1:1 volume ratio of the
materials. A 1.0 cm magnetic stir bar was placed in each of the stirred-tank reactors at 800 RPM
to maintain adequate mixing.
36
Figure 21 Stirred-tank Reactor Setup
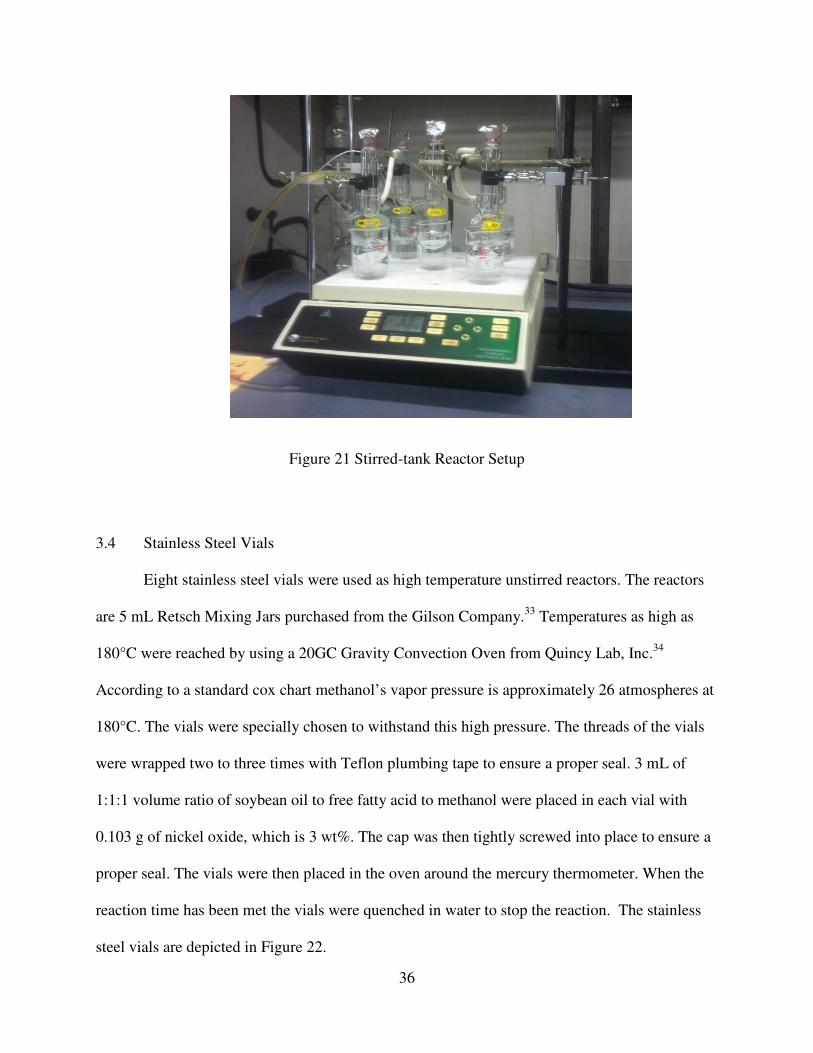
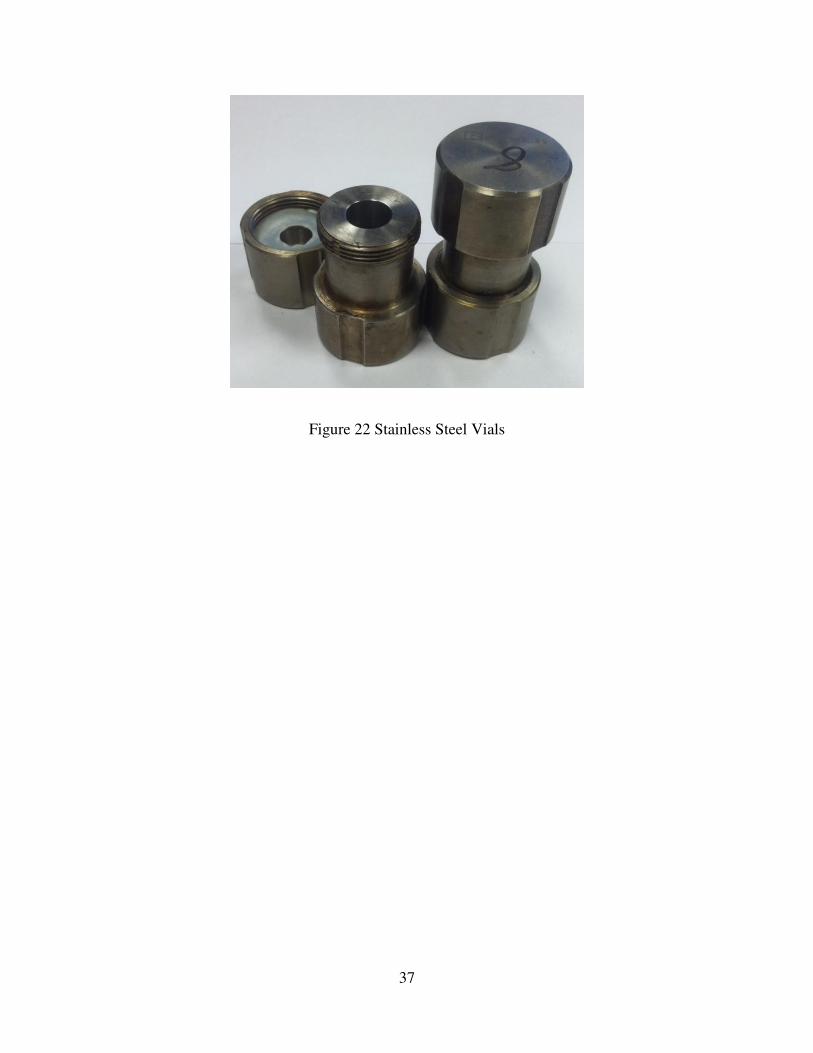
3.4 Stainless Steel Vials
Eight stainless steel vials were used as high temperature unstirred reactors. The reactors
are 5 mL Retsch Mixing Jars purchased from the Gilson Company.33
Temperatures as high as
180°C were reached by using a 20GC Gravity Convection Oven from Quincy Lab, Inc.34
According to a standard cox chart methanol’s vapor pressure is approximately 26 atmospheres at
180°C. The vials were specially chosen to withstand this high pressure. The threads of the vials
were wrapped two to three times with Teflon plumbing tape to ensure a proper seal. 3 mL of
1:1:1 volume ratio of soybean oil to free fatty acid to methanol were placed in each vial with
0.103 g of nickel oxide, which is 3 wt%. The cap was then tightly screwed into place to ensure a
proper seal. The vials were then placed in the oven around the mercury thermometer. When the
reaction time has been met the vials were quenched in water to stop the reaction. The stainless
steel vials are depicted in Figure 22.
37
Figure 22 Stainless Steel Vials
38
3.4.1 Heating Time
For using the stainless steel vials an important part of the analysis is time it takes to heat
up to temperature. The following approach was used.
1. Fill the vials with 3 mL of soybean oil.
2. Place the vials in the pre heated oven, either 65 or 180°C, without the caps on them
3. Place the mercury thermometer in the liquid, checking that the thermometer is not
touching the metal, only in the liquid.
4. Take readings of the temperature every minute till it equilibrates.
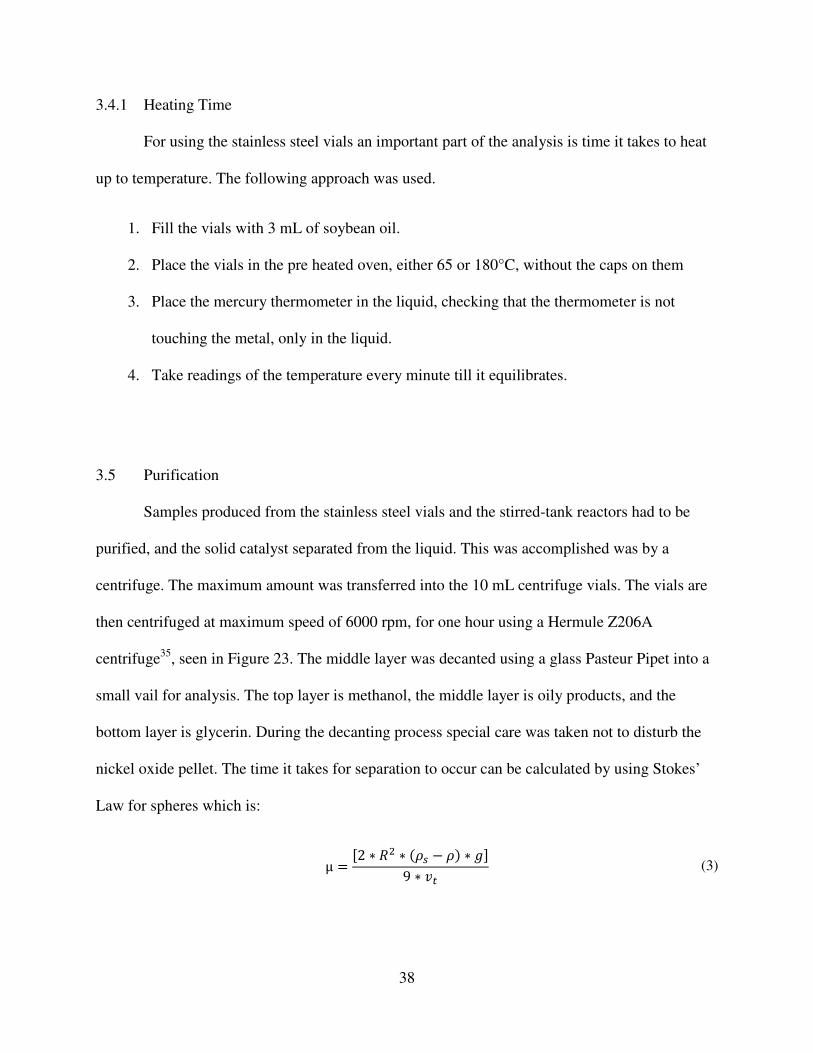
3.5 Purification
Samples produced from the stainless steel vials and the stirred-tank reactors had to be
purified, and the solid catalyst separated from the liquid. This was accomplished was by a
centrifuge. The maximum amount was transferred into the 10 mL centrifuge vials. The vials are
then centrifuged at maximum speed of 6000 rpm, for one hour using a Hermule Z206A
centrifuge35
, seen in Figure 23. The middle layer was decanted using a glass Pasteur Pipet into a
small vail for analysis. The top layer is methanol, the middle layer is oily products, and the
bottom layer is glycerin. During the decanting process special care was taken not to disturb the
nickel oxide pellet. The time it takes for separation to occur can be calculated by using Stokes’
Law for spheres which is:
μ ��2 � �� � �� � � � ��
9 � �� (3)
39
In equation 3, µ is the viscosity of the fluid, R is the radius of the falling particle, ρs is the
density of the particle, ρ is the density of the fluid, g is gravity, and vt is the terminal velocity. By
solving for the terminal velocity, the time can be determined for how long it will take a particle
to fall. This equation can only be used if the Reynold’s number is less than 1, which implies
creeping flow.36
The nickel oxide catalyst has a particle size less than 50 nm. In this case
creeping flow is an adequate assumption.
Figure 23 Hermule Z206A Centrifuge
To purify the samples for analysis, the methanol that is in solution still must be removed.
Due to the fact that oil and methanol have a significantly different boiling point, the methanol is
boiled out of solution. When the solution temperature rises above 65°C methanol is fully
removed. The samples are then cooled and await analysis.
40
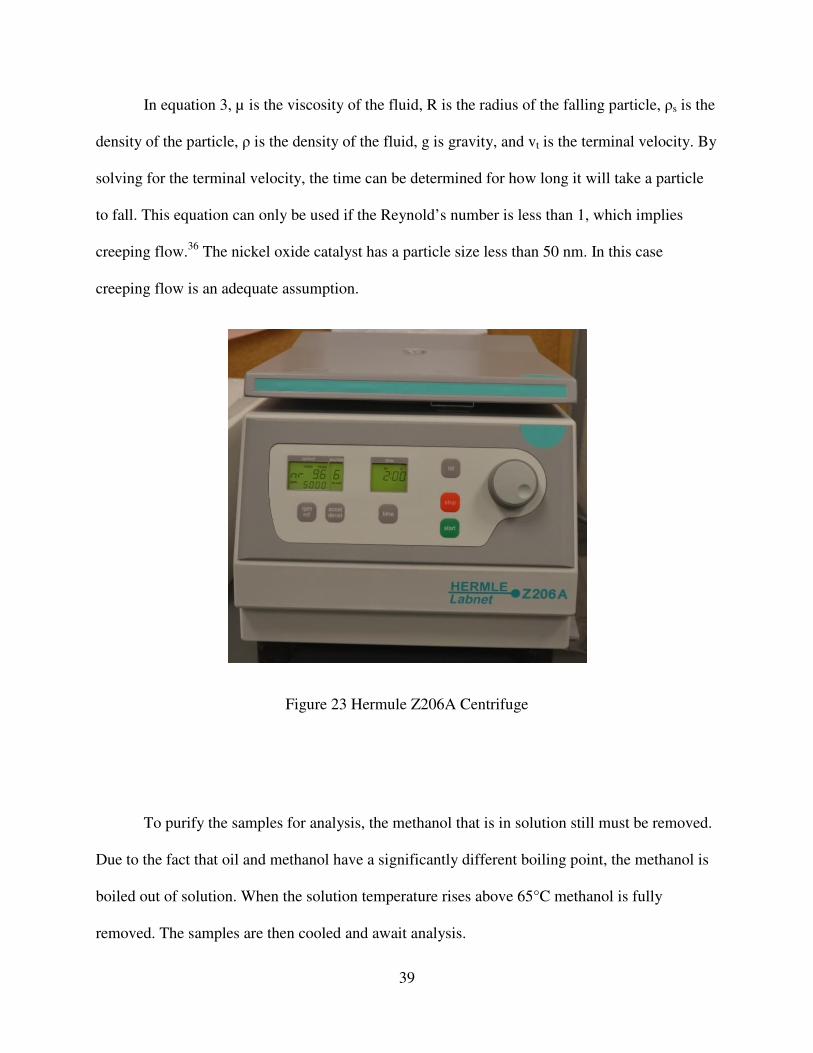
3.6 Microreactors
Microreactors were manufactured by Johns Hopkins University using designs from the
UTC microreactor research group.4 The channels of the microreactors are coated with Nickel (II)
Oxide, a base catalyst. The nickel oxide was applied using a technique known as magnetron
sputtering. Three microreactors were made; two of them are considered wavy reactors, and the
other one is a straight channel. These are seen in Figures 24 and 25. In all the reactors the
microchannel size is 50 µm by 500 µm. The length of the wavy reactor channels are 15 cm, and
the straight reactor channel length is 3 cm. In each of the straight parts of the reactors there are
triangular shaped objects that assist in mixing.4
Figure 24 Wavy Microreactor
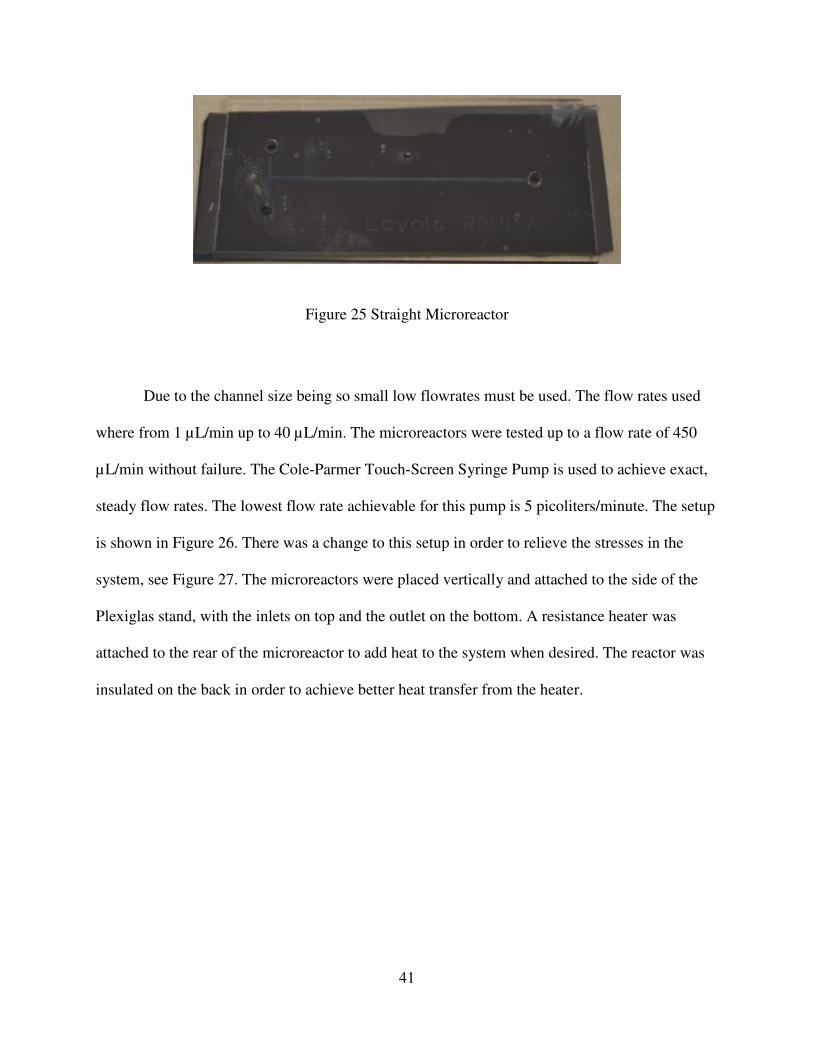
41
Figure 25 Straight Microreactor
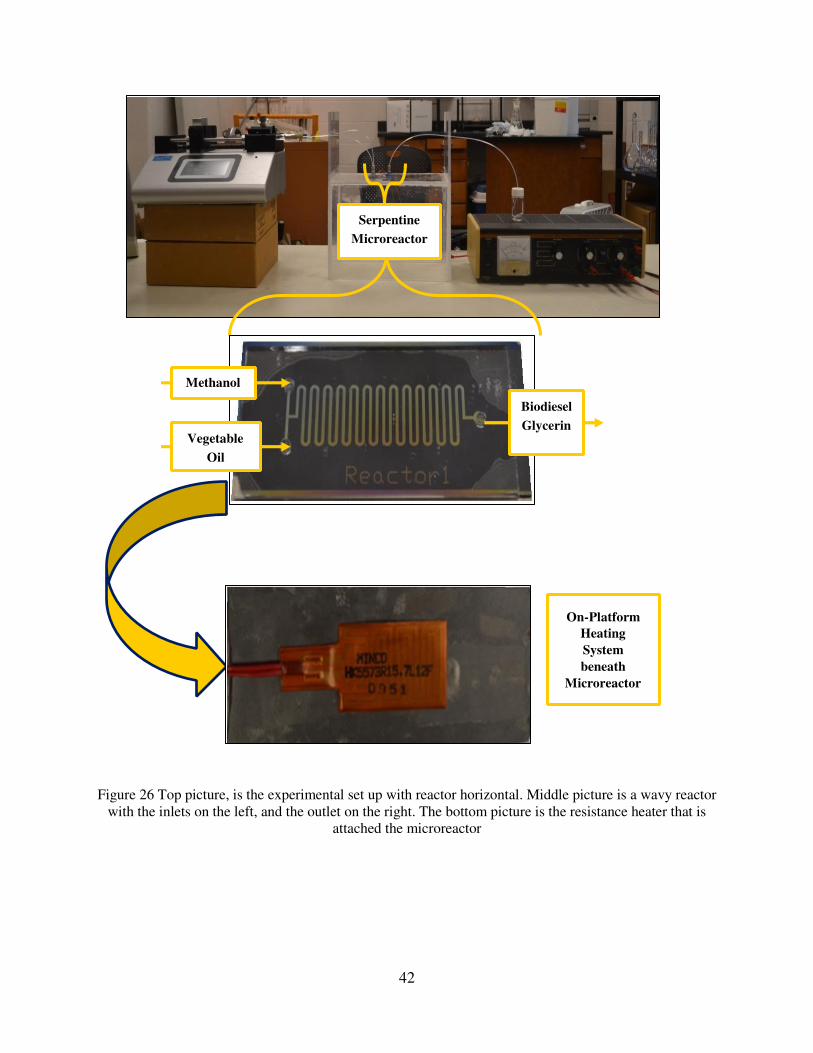
Due to the channel size being so small low flowrates must be used. The flow rates used
where from 1 µL/min up to 40 µL/min. The microreactors were tested up to a flow rate of 450
µL/min without failure. The Cole-Parmer Touch-Screen Syringe Pump is used to achieve exact,
steady flow rates. The lowest flow rate achievable for this pump is 5 picoliters/minute. The setup
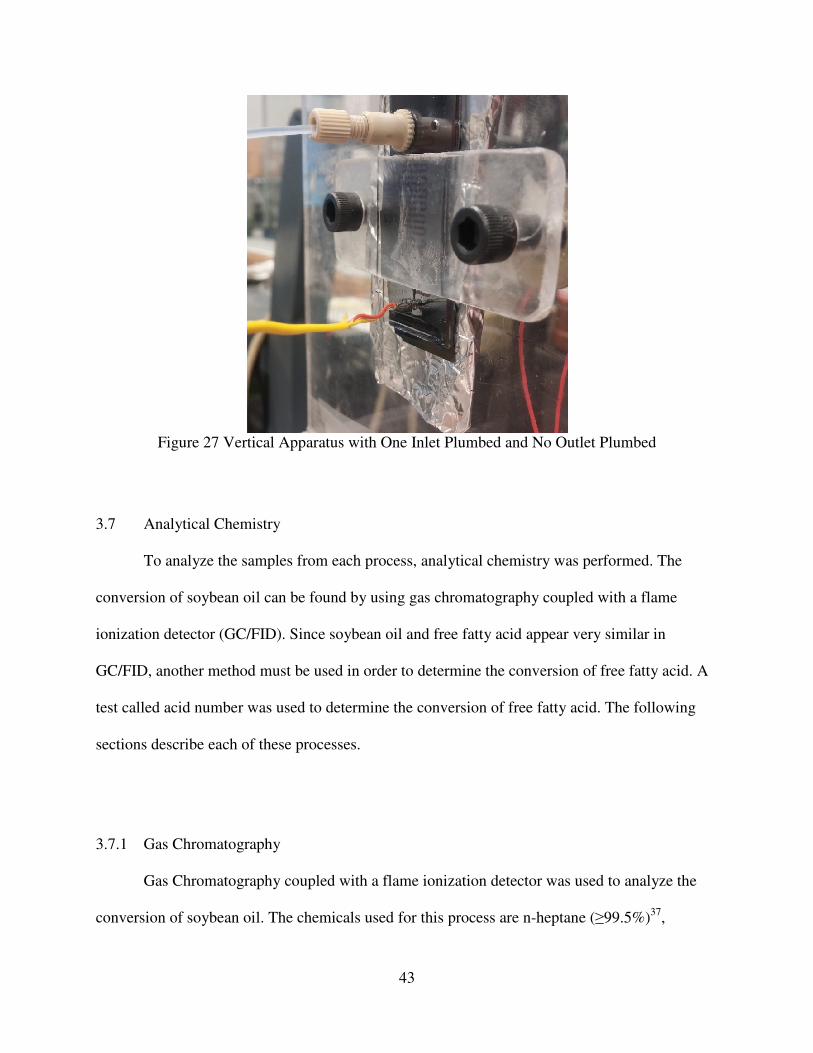
is shown in Figure 26. There was a change to this setup in order to relieve the stresses in the
system, see Figure 27. The microreactors were placed vertically and attached to the side of the
Plexiglas stand, with the inlets on top and the outlet on the bottom. A resistance heater was
attached to the rear of the microreactor to add heat to the system when desired. The reactor was
insulated on the back in order to achieve better heat transfer from the heater.
42
Figure 26 Top picture, is the experimental set up with reactor horizontal. Middle picture is a wavy reactor
with the inlets on the left, and the outlet on the right. The bottom picture is the resistance heater that is
attached the microreactor
Serpentine
Microreactor
Vegetable
Oil
Biodiesel
Glycerin
Methanol
On - Pl atform Heating System beneath
Microreactor
43
Figure 27 Vertical Apparatus with One Inlet Plumbed and No Outlet Plumbed
3.7 Analytical Chemistry
To analyze the samples from each process, analytical chemistry was performed. The
conversion of soybean oil can be found by using gas chromatography coupled with a flame
ionization detector (GC/FID). Since soybean oil and free fatty acid appear very similar in
GC/FID, another method must be used in order to determine the conversion of free fatty acid. A
test called acid number was used to determine the conversion of free fatty acid. The following
sections describe each of these processes.
3.7.1 Gas Chromatography
Gas Chromatography coupled with a flame ionization detector was used to analyze the
conversion of soybean oil. The chemicals used for this process are n-heptane (≥99.5%)37
,
44
tricaprin (GC ≥99%)38
, and pyridine (anhydrous, 99.8%)39
, all from by Sigma Aldrich. The
column used was a MXT-Biodiesel TG column, 15 m length and 0.32 mm inner diameter.40
In
order to standardize the analysis process, ASTM D6584 was referenced.41
When the sample is injected into the gas chromatograph column the substances are
separated based on boiling points and how much the sample attaches itself to the coating on the
column. In this case the inner coating is siltek. This allows the larger glycerides to stick longer in
the column, thus giving the ability to distinguish biodiesel, monoglyceride, diglyceride, and
trigylcerides from each other. The sample is forced through the column by helium, a carrier gas
which is inert to the samples and the detector. Peak Simple software is used to convert the
millivolt reading from the FID into the corresponding concentration. What this does not allow
for is distinguishability of biodiesel from free fatty acid. An alternate method will be used to
analyze free fatty acid conversion.
Since biodiesel and free fatty acid are so close in structure and cannot be distinguished
from each other via GC/FID, the amounts of chemically bound glycerin (CBG) was examined.
To determine the soybean oil conversion the CBG of the initial sample was compared to the
CBG of the sample after a reaction.42
The CBG is calculated using Equation 4.
��� �
��� �!"#$� %$& ' � �!"#$� %$& ' ()*)�!"#$� %$&��� #+,� *
(4)
Equation 4 explains that the sums of the each of the glycerides are divided by the area of
the tricaprin peak generated from the GC/FID and Peak Simple software. Using this equation to
determine the CBG, the conversion of can then be calculated by Equation 5.
��� �)*�$�& )* �%� �
����/ � ��������/
(5)
45
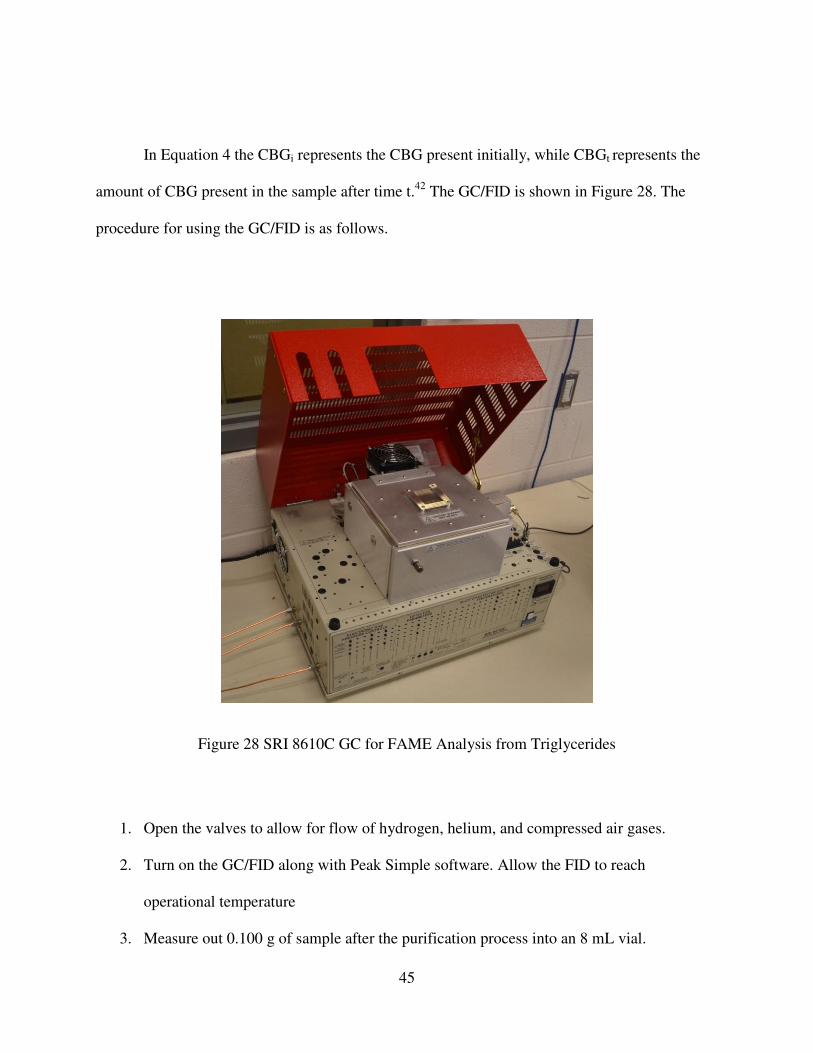
In Equation 4 the CBGi represents the CBG present initially, while CBGt represents the
amount of CBG present in the sample after time t.42
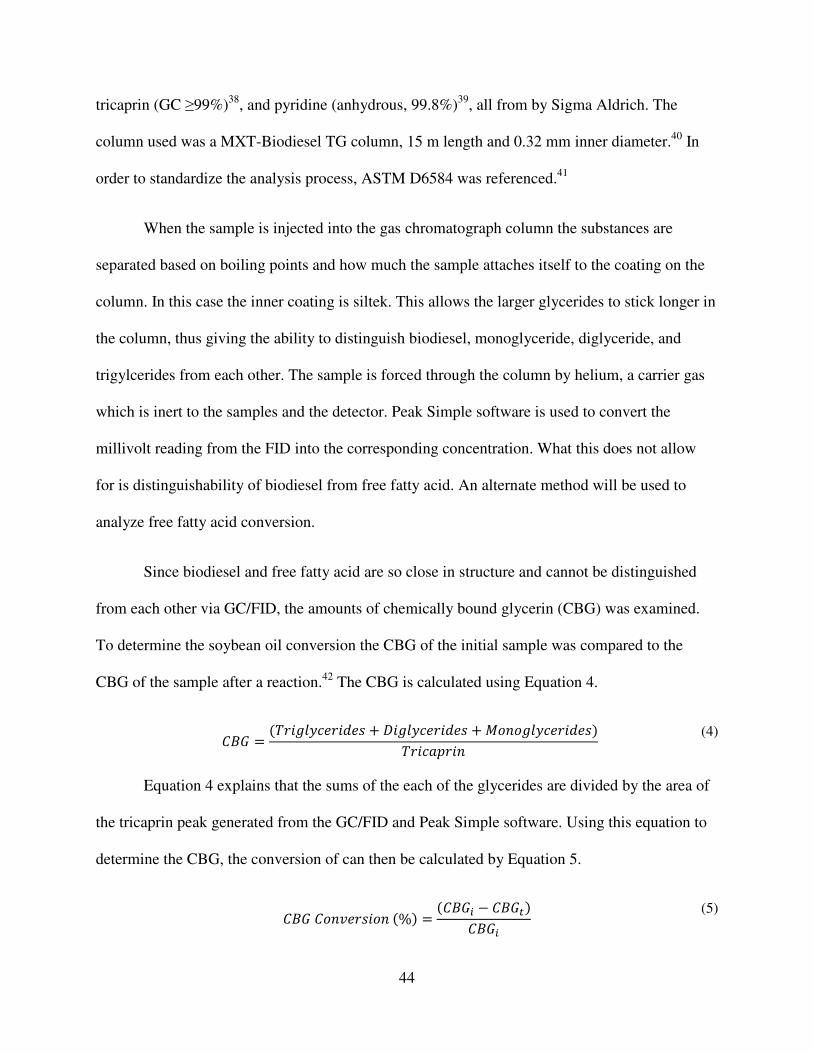
The GC/FID is shown in Figure 28. The
procedure for using the GC/FID is as follows.
Figure 28 SRI 8610C GC for FAME Analysis from Triglycerides
1. Open the valves to allow for flow of hydrogen, helium, and compressed air gases.
2. Turn on the GC/FID along with Peak Simple software. Allow the FID to reach
operational temperature
3. Measure out 0.100 g of sample after the purification process into an 8 mL vial.
46
4. To the 8 mL vial add 100 µL of tricaprin an internal standard
5. Also add 100 µL of n-methyl-n-(trimethylsilyl) trifluoroacetamide, MSTFA.43
This step
is critical because certain functional groups are known to cause problems with this
column inner coating. The groups consist of carboxylic acids, amines, thiols, and
hydroxyl groups. MSTFA will undergo a reaction replacing these functional groups with
an alkylsiyl group such as SiMe3. This makes compounds with these functional groups
more stable and less volatile, helping improve GC analysis.44
6. Let the mixture react for 20 minutes
7. Add 8.0 mL of n-heptane to the vial and mix.
8. Measure 1.0 µL of the sample and inject into the GC.
9. Start the Peak Simple software analysis.
10. When Peak Simple analysis is complete export the area data into Excel using the CBG
equations determine the CBG conversion.
47
3.7.2 Acid Number Analysis
Since free fatty acid cannot be distinguished from FAME on the GC/FID an alternate
method must be used to determine how much free fatty acid persists in the samples. This is done
using a method of acid number analysis, defined by ASTM D974.45
This method was slightly
adjusted to be more accurate for the small quantities. The 0.1 N potassium hydroxide was diluted
to 0.01 N.46
The acid number is determined by neutralizing the free fatty acid in the sample, a
titration with potassium hydroxide. All the chemical used were supplied by Sigma Aldrich: 0.1 N
potassium hydroxide in isopropanol, 2-propanol (anhydrous, 99.5%)47
, toluene (anhydrous,
99.8%)48
, and α-naphtholbenzein.49
Acid number and free fatty acid conversion are defined in
Equations 6 and 7.
0# % 1234$� �3� �56
� 0*+!"�$
(6)
770 �)*�$�& )* �01/ � 01�
01/
(7)
In order to titrate, an indicator must be used to determine when the all of the free fatty acid
has been used up. This process used 0.01 N potassium hydroxide, KOH, to neutralize the free
fatty acid. The indicator used was α-naphtholbenzein, which in the presence of free fatty acid
appears as an orange color, Figure 29, and in the presence of a base appears as a green, Figure
30. A titration solvent must be prepared before analysis. This solvent consists of toluene,
isopropyl alcohol, and water in a ratio of 100: 99: 1. The analysis follows these outlined steps:
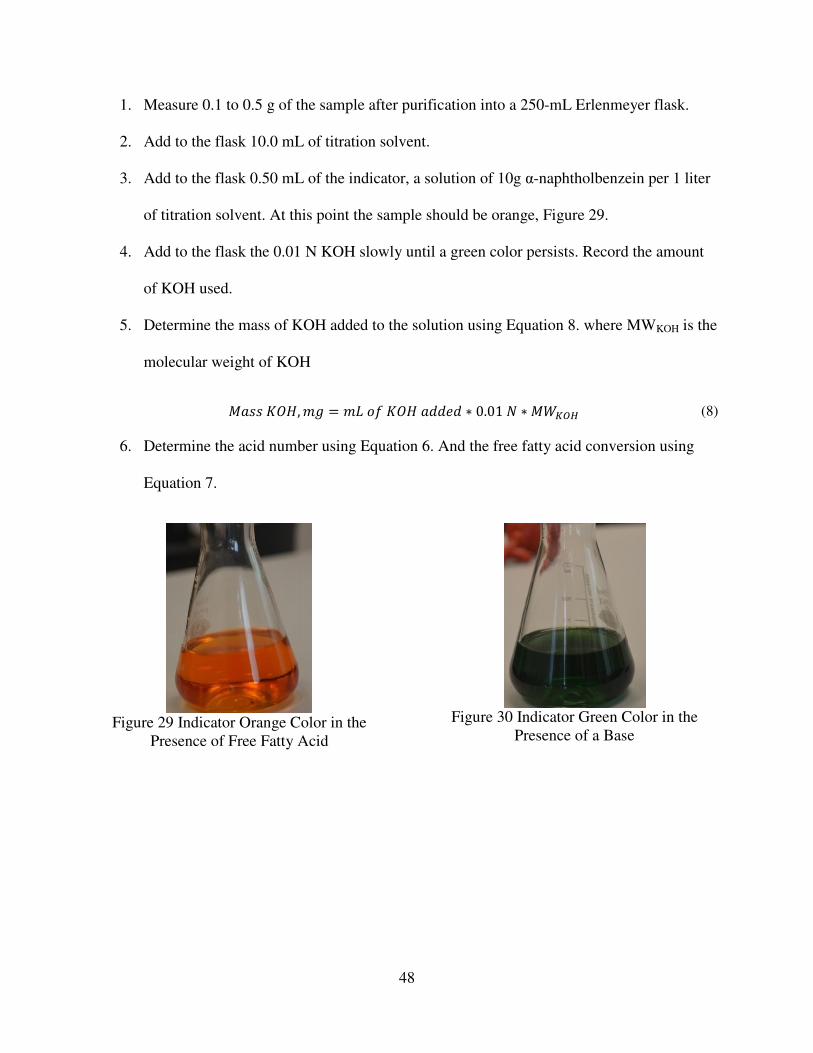
48
1. Measure 0.1 to 0.5 g of the sample after purification into a 250-mL Erlenmeyer flask.
2. Add to the flask 10.0 mL of titration solvent.
3. Add to the flask 0.50 mL of the indicator, a solution of 10g α-naphtholbenzein per 1 liter
of titration solvent. At this point the sample should be orange, Figure 29.
4. Add to the flask the 0.01 N KOH slowly until a green color persists. Record the amount
of KOH used.
5. Determine the mass of KOH added to the solution using Equation 8. where MWKOH is the
molecular weight of KOH
(+&& �56, 3� � 3� )9 �56 +%%$% � 0.01 1 � (=>?@ (8)
6. Determine the acid number using Equation 6. And the free fatty acid conversion using
Equation 7.
Figure 29 Indicator Orange Color in the
Presence of Free Fatty Acid
Figure 30 Indicator Green Color in the
Presence of a Base
49
CHAPTER 4
RESULTS
4.1 Density
The densities of the 1:1:1 (soybean oil: free fatty acid: methanol) mixture and pure
soybean oil were determined by following the procedure outlined in section 3.1. The soybean oil
was measured at 20°C, with four samples being taken and the average of them being reported in
Table 3.
Table 3 Density of Soybean Oil at 20°C
Temperature Density
Soy Bean Oil 20°C 0.881 ± 0.02g/mL
For the 1:1:1 (SBO:FFA:MeOH) feedstock the temperature varied between 25°C and
64°C. In most cases only one measurement was taken. The data is found in Figure 31. It can be
seen that as the temperature increases the density decreases. This is expected as temperature is
inversely related to the density.
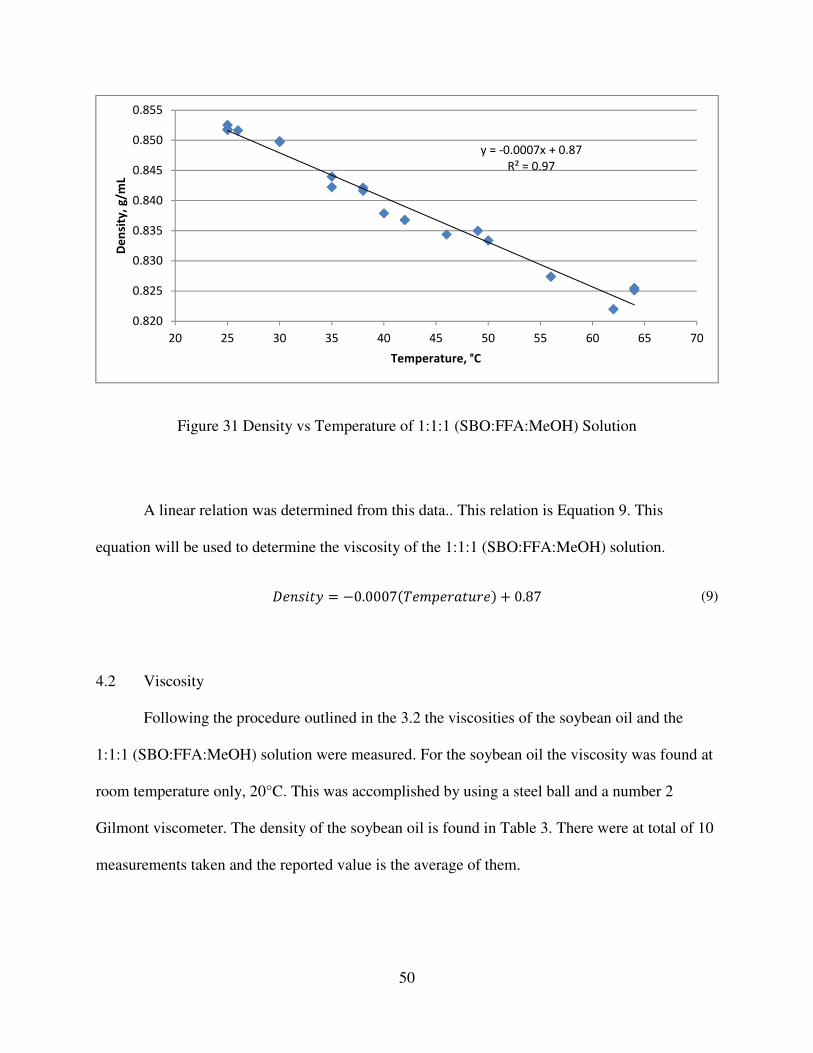
50
Figure 31 Density vs Temperature of 1:1:1 (SBO:FFA:MeOH) Solution
A linear relation was determined from this data.. This relation is Equation 9. This
equation will be used to determine the viscosity of the 1:1:1 (SBO:FFA:MeOH) solution.
�$*& �" � �0.0007��$3,$�+�2�$� ' 0.87 (9)
4.2 Viscosity
Following the procedure outlined in the 3.2 the viscosities of the soybean oil and the
1:1:1 (SBO:FFA:MeOH) solution were measured. For the soybean oil the viscosity was found at
room temperature only, 20°C. This was accomplished by using a steel ball and a number 2
Gilmont viscometer. The density of the soybean oil is found in Table 3. There were at total of 10
measurements taken and the reported value is the average of them.
y = -0.0007x + 0.87
R² = 0.97
0.820
0.825
0.830
0.835
0.840
0.845
0.850
0.855
20 25 30 35 40 45 50 55 60 65 70
De
nsi
ty,
g/m
L
Temperature, °C
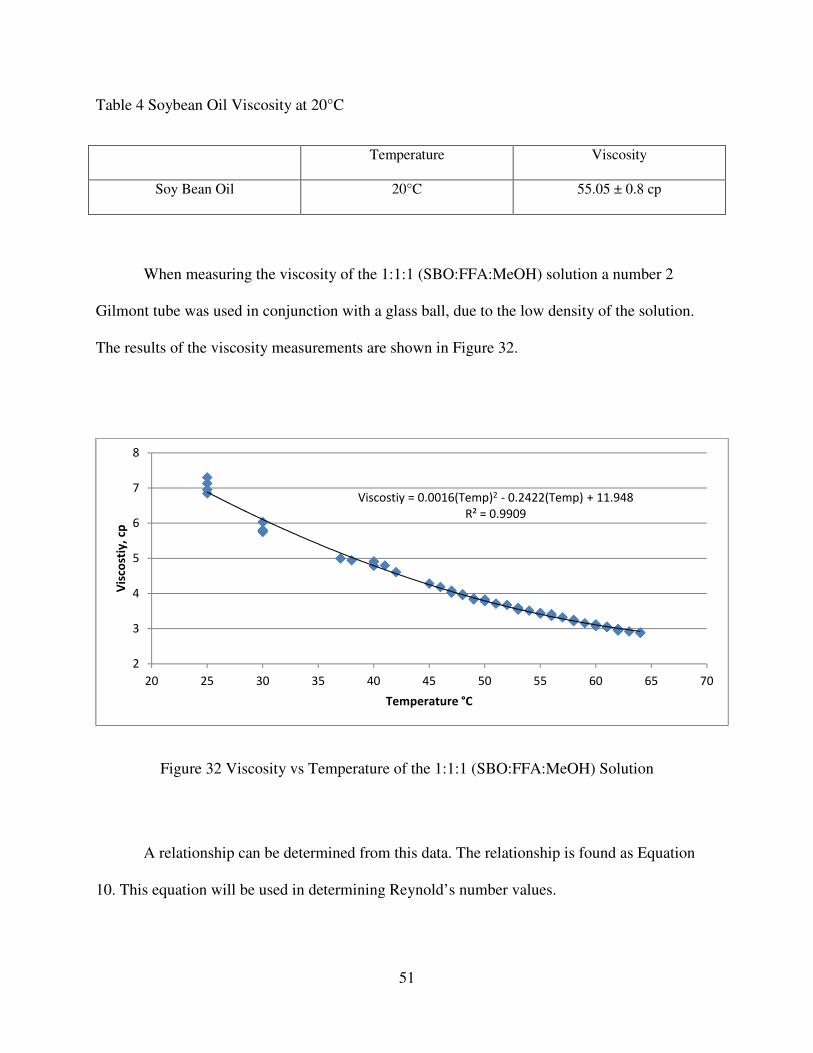
51
Table 4 Soybean Oil Viscosity at 20°C
Temperature Viscosity
Soy Bean Oil 20°C 55.05 ± 0.8 cp
When measuring the viscosity of the 1:1:1 (SBO:FFA:MeOH) solution a number 2
Gilmont tube was used in conjunction with a glass ball, due to the low density of the solution.
The results of the viscosity measurements are shown in Figure 32.
Figure 32 Viscosity vs Temperature of the 1:1:1 (SBO:FFA:MeOH) Solution
A relationship can be determined from this data. The relationship is found as Equation
10. This equation will be used in determining Reynold’s number values.
Viscostiy = 0.0016(Temp)2 - 0.2422(Temp) + 11.948
R² = 0.9909
2
3
4
5
6
7
8
20 25 30 35 40 45 50 55 60 65 70
Vis
cost
iy,
cp
Temperature °C
52
C &#)& �" � 0.0016�Temperature�� � 0.2422�Temperature� ' 11.948 (10)
4.3 Reynold’s Number of Microreactors in This Study
Reynold’s number is a dimensionless group that characterizes fluid flow. The range of
interest is the lowest values of Reynold’s number, below 1. This range is considered to be
creeping flow. To calculate Reynold’s number Equation 11 was used.
�$ �
�%�
(11)
In Equation 11, ρ is the density of the fluid, µ is the viscosity of the fluid, d is the
diameter, and v is the velocity of the fluid. Since the microreactor is not a cylinder the diameter
chosen is for a wide duct system,50
specifically twice the distance from the bottom to the top
plates—100 µm. The flow rates vary from 1 uL/min to 50 uL/min which are the microreactor’s
practical flow limits. To use Equation 11 for Reynold’s number the flow rates need be converted
into velocities. This is done by dividing the flow rates by the area of the inlet to the microreactor,
50 um by 500 um or 25,000 um2. Reynold’s numbers are calculated for each temperature and
flow rate shown in Figure 33.
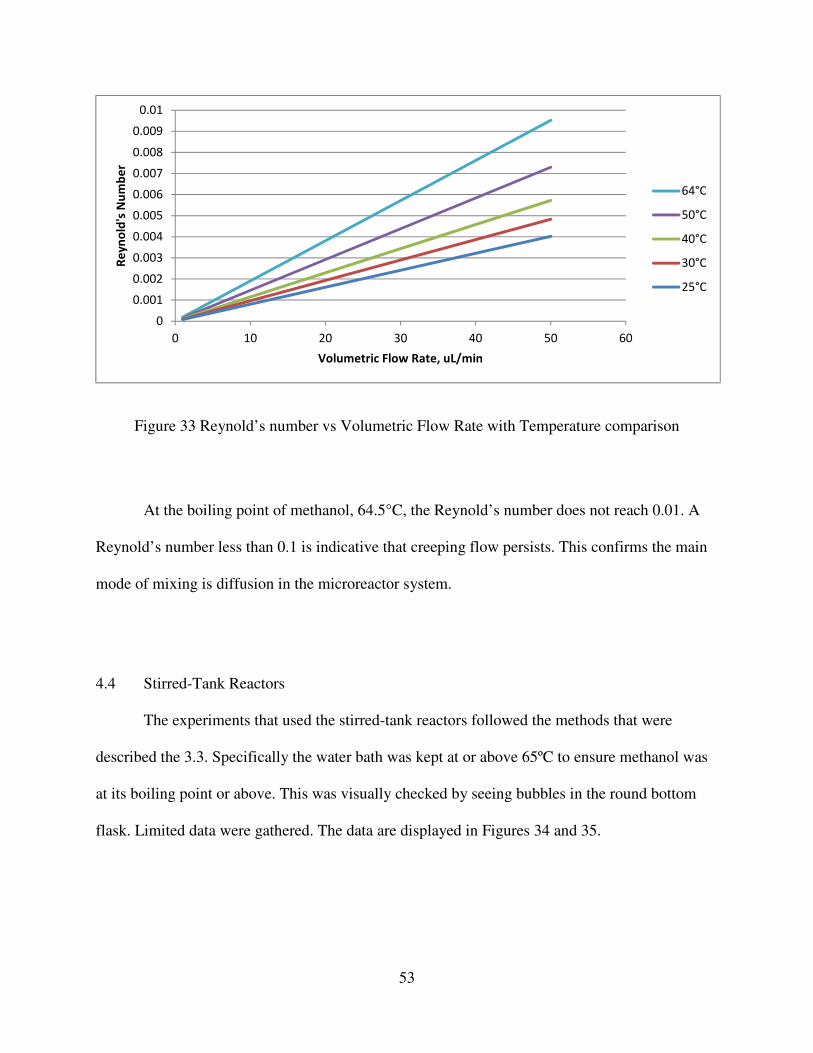
53
Figure 33 Reynold’s number vs Volumetric Flow Rate with Temperature comparison
At the boiling point of methanol, 64.5°C, the Reynold’s number does not reach 0.01. A
Reynold’s number less than 0.1 is indicative that creeping flow persists. This confirms the main
mode of mixing is diffusion in the microreactor system.
4.4 Stirred-Tank Reactors
The experiments that used the stirred-tank reactors followed the methods that were
described the 3.3. Specifically the water bath was kept at or above 65ºC to ensure methanol was
at its boiling point or above. This was visually checked by seeing bubbles in the round bottom
flask. Limited data were gathered. The data are displayed in Figures 34 and 35.
0
0.001
0.002
0.003
0.004
0.005
0.006
0.007
0.008
0.009
0.01
0 10 20 30 40 50 60
Re
yn
old
's N
um
be
r
Volumetric Flow Rate, uL/min
64°C
50°C
40°C
30°C
25°C
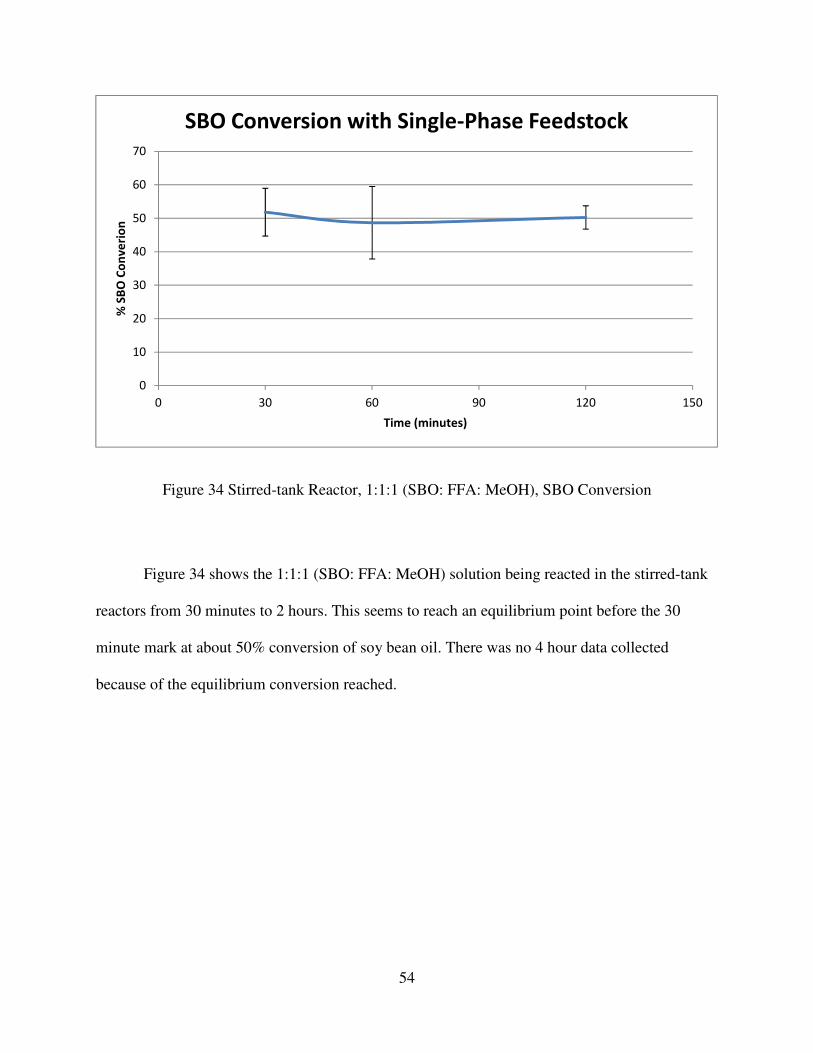
54
Figure 34 Stirred-tank Reactor, 1:1:1 (SBO: FFA: MeOH), SBO Conversion
Figure 34 shows the 1:1:1 (SBO: FFA: MeOH) solution being reacted in the stirred-tank
reactors from 30 minutes to 2 hours. This seems to reach an equilibrium point before the 30
minute mark at about 50% conversion of soy bean oil. There was no 4 hour data collected
because of the equilibrium conversion reached.
0
10
20
30
40
50
60
70
0 30 60 90 120 150
% S
BO
Co
nv
eri
on
Time (minutes)
SBO Conversion with Single-Phase Feedstock
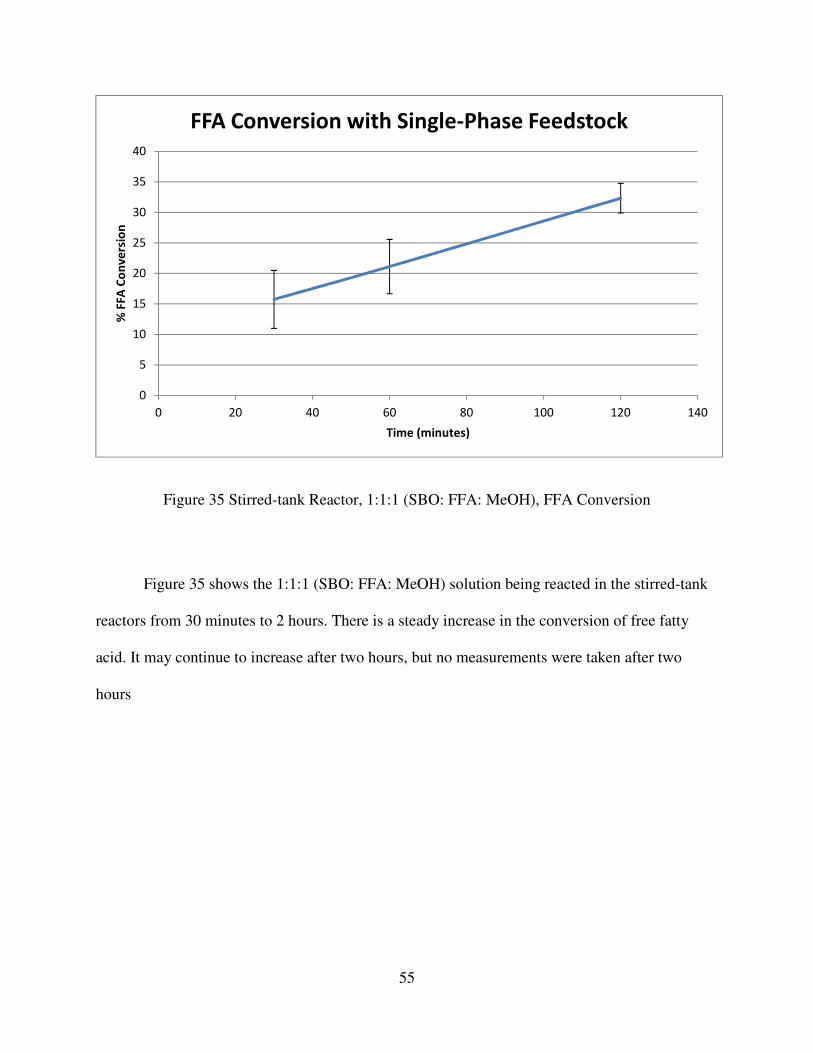
55
Figure 35 Stirred-tank Reactor, 1:1:1 (SBO: FFA: MeOH), FFA Conversion
Figure 35 shows the 1:1:1 (SBO: FFA: MeOH) solution being reacted in the stirred-tank
reactors from 30 minutes to 2 hours. There is a steady increase in the conversion of free fatty
acid. It may continue to increase after two hours, but no measurements were taken after two
hours
0
5
10
15
20
25
30
35
40
0 20 40 60 80 100 120 140
% F
FA
Co
nv
ers
ion
Time (minutes)
FFA Conversion with Single-Phase Feedstock
56
4.5 Stainless Steel Vials
The procedure outlined in section 3.4 was followed in order to obtain the conversions in
stainless steel vials.
4.5.1 Heating Time
The heating tests are a rough estimate of the actual temperatures obtained inside the
stainless steel vials over time. They may not be completely accurate because the conditions were
changed. Some notable differences is that the caps are left off in order to get the temperature of
the liquid, and the liquid is completely made up of soybean oil and not the 1:1:1 (SBO: FFA:
MeOH) solution. The liquid choice is because when the temperature rises above 65°C the
methanol in solution will evaporate thus lowering the systems mass. In order to keep the volume
the same, only soybean oil was chosen. So without the cap may increase the rate the temperature
is increased due to convection directly with the liquid; but using only soybean oil will decrease
the rate the temperature increases due to more mass. With these ideas in mind, the results are
shown Figure 36. With the cap on the pressure will increase, this is another condition that was
changed.
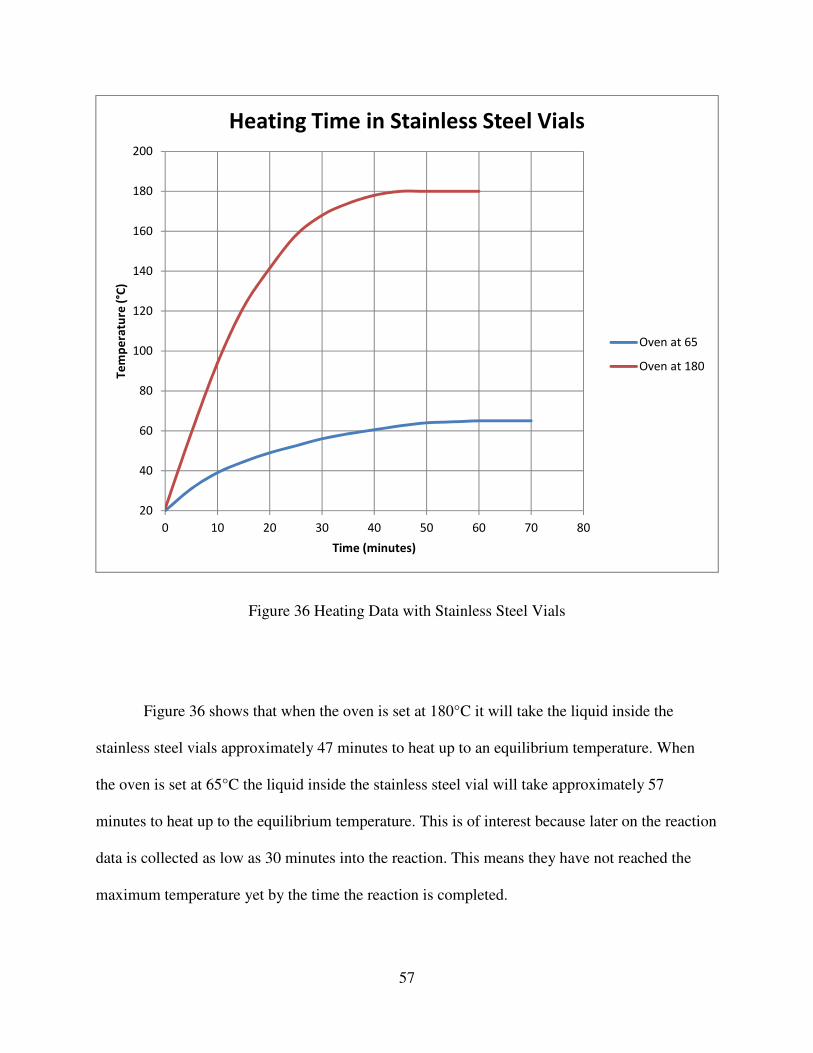
57
Figure 36 Heating Data with Stainless Steel Vials
Figure 36 shows that when the oven is set at 180°C it will take the liquid inside the
stainless steel vials approximately 47 minutes to heat up to an equilibrium temperature. When
the oven is set at 65°C the liquid inside the stainless steel vial will take approximately 57
minutes to heat up to the equilibrium temperature. This is of interest because later on the reaction
data is collected as low as 30 minutes into the reaction. This means they have not reached the
maximum temperature yet by the time the reaction is completed.
20
40
60
80
100
120
140
160
180
200
0 10 20 30 40 50 60 70 80
Te
mp
era
ture
(°C
)
Time (minutes)
Heating Time in Stainless Steel Vials
Oven at 65
Oven at 180
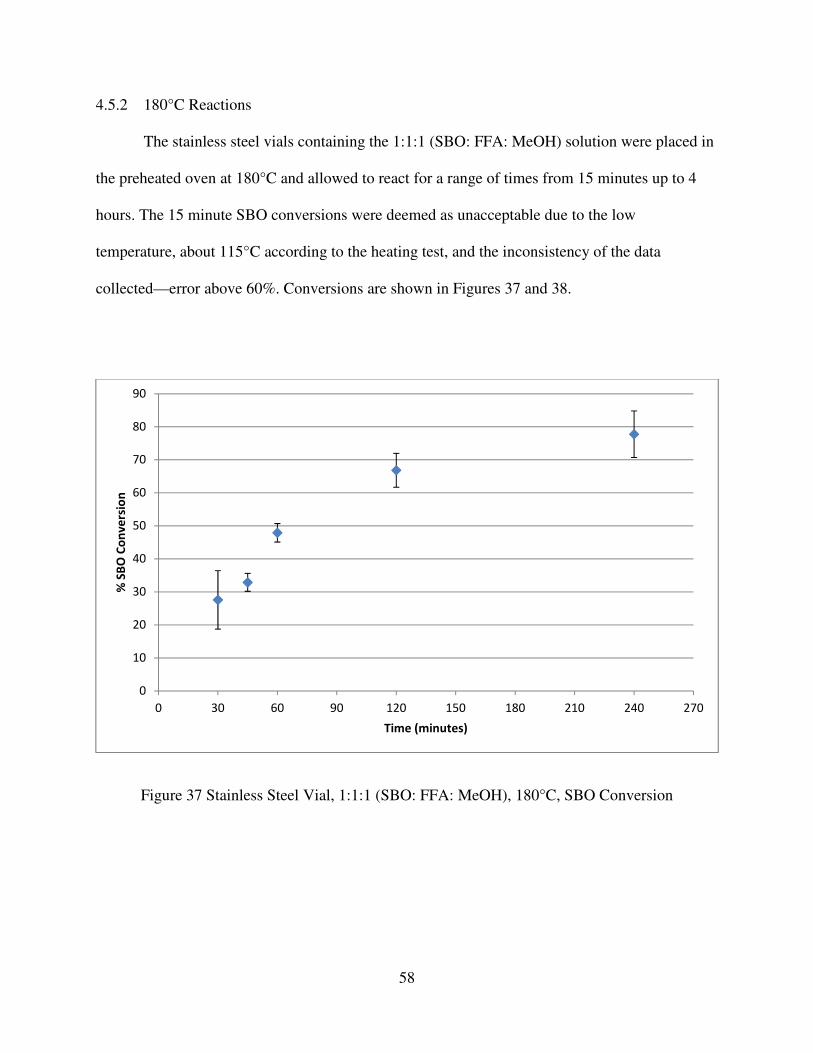
58
4.5.2 180°C Reactions
The stainless steel vials containing the 1:1:1 (SBO: FFA: MeOH) solution were placed in
the preheated oven at 180°C and allowed to react for a range of times from 15 minutes up to 4
hours. The 15 minute SBO conversions were deemed as unacceptable due to the low
temperature, about 115°C according to the heating test, and the inconsistency of the data
collected—error above 60%. Conversions are shown in Figures 37 and 38.
Figure 37 Stainless Steel Vial, 1:1:1 (SBO: FFA: MeOH), 180°C, SBO Conversion
0
10
20
30
40
50
60
70
80
90
0 30 60 90 120 150 180 210 240 270
% S
BO
Co
nv
ers
ion
Time (minutes)
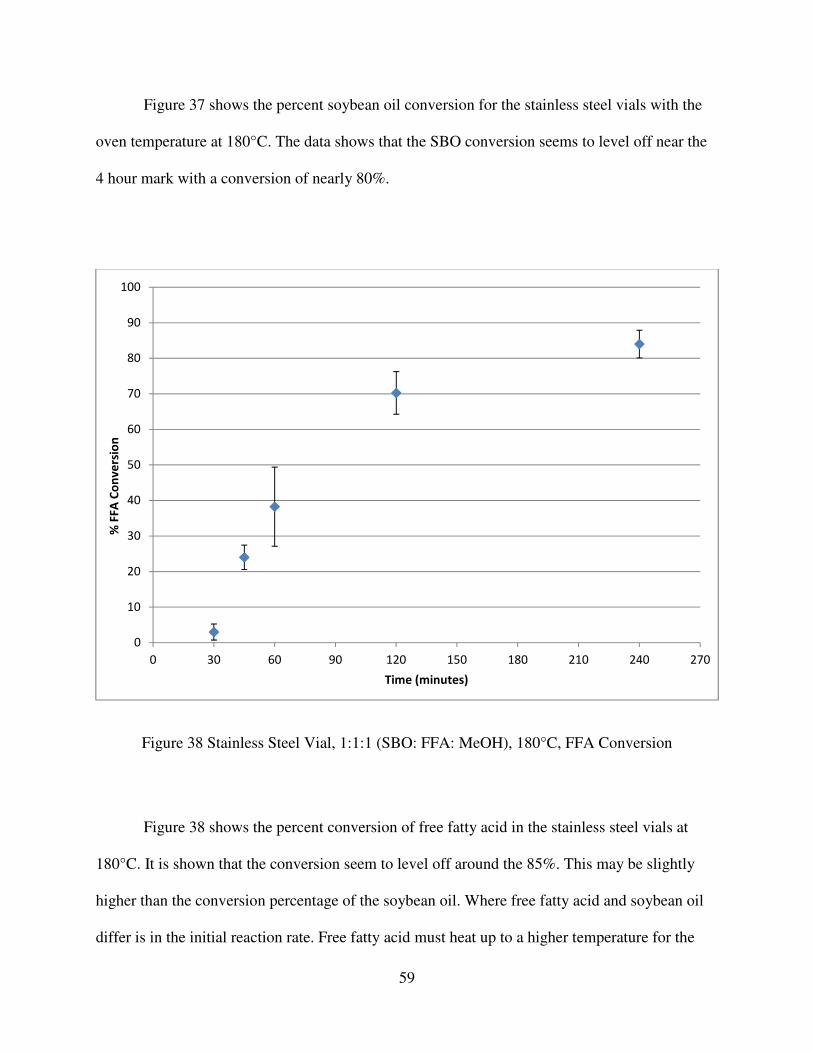
59
Figure 37 shows the percent soybean oil conversion for the stainless steel vials with the
oven temperature at 180°C. The data shows that the SBO conversion seems to level off near the
4 hour mark with a conversion of nearly 80%.
Figure 38 Stainless Steel Vial, 1:1:1 (SBO: FFA: MeOH), 180°C, FFA Conversion
Figure 38 shows the percent conversion of free fatty acid in the stainless steel vials at
180°C. It is shown that the conversion seem to level off around the 85%. This may be slightly
higher than the conversion percentage of the soybean oil. Where free fatty acid and soybean oil
differ is in the initial reaction rate. Free fatty acid must heat up to a higher temperature for the
0
10
20
30
40
50
60
70
80
90
100
0 30 60 90 120 150 180 210 240 270
% F
FA
Co
nv
ers
ion
Time (minutes)
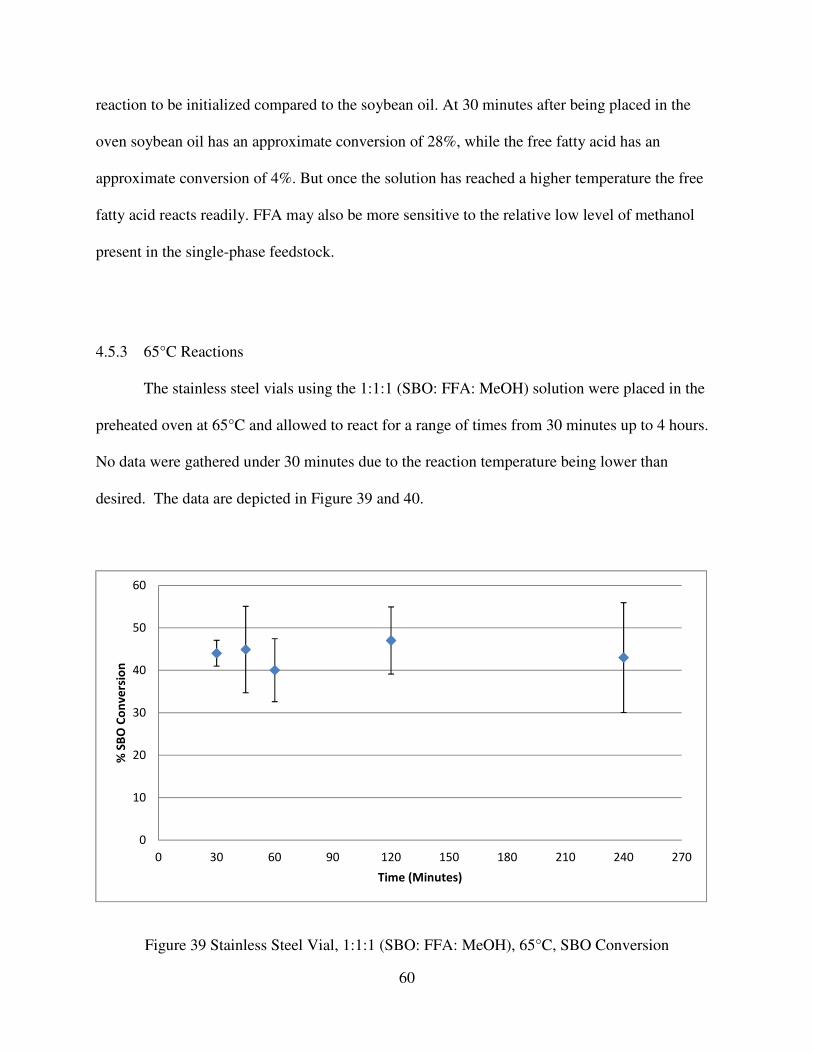
60
reaction to be initialized compared to the soybean oil. At 30 minutes after being placed in the
oven soybean oil has an approximate conversion of 28%, while the free fatty acid has an
approximate conversion of 4%. But once the solution has reached a higher temperature the free
fatty acid reacts readily. FFA may also be more sensitive to the relative low level of methanol
present in the single-phase feedstock.
4.5.3 65°C Reactions
The stainless steel vials using the 1:1:1 (SBO: FFA: MeOH) solution were placed in the
preheated oven at 65°C and allowed to react for a range of times from 30 minutes up to 4 hours.
No data were gathered under 30 minutes due to the reaction temperature being lower than
desired. The data are depicted in Figure 39 and 40.
Figure 39 Stainless Steel Vial, 1:1:1 (SBO: FFA: MeOH), 65°C, SBO Conversion
0
10
20
30
40
50
60
0 30 60 90 120 150 180 210 240 270
% S
BO
Co
nv
ers
ion
Time (Minutes)
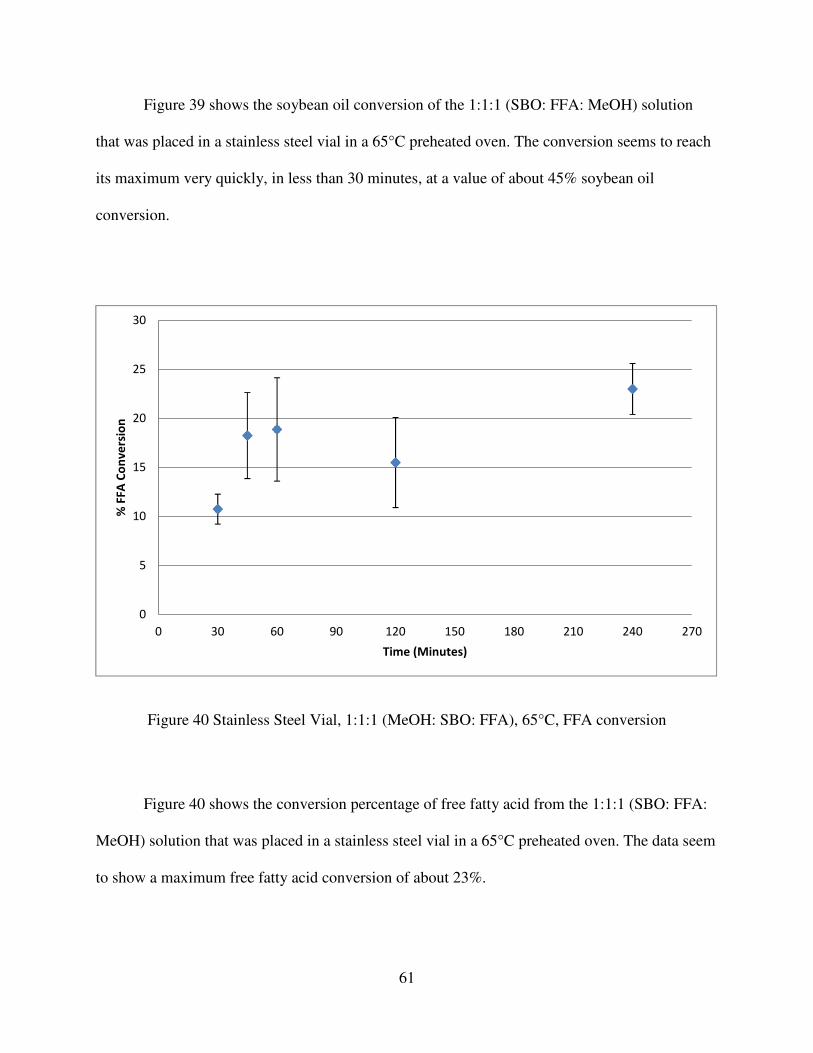
61
Figure 39 shows the soybean oil conversion of the 1:1:1 (SBO: FFA: MeOH) solution
that was placed in a stainless steel vial in a 65°C preheated oven. The conversion seems to reach
its maximum very quickly, in less than 30 minutes, at a value of about 45% soybean oil
conversion.
Figure 40 Stainless Steel Vial, 1:1:1 (MeOH: SBO: FFA), 65°C, FFA conversion
Figure 40 shows the conversion percentage of free fatty acid from the 1:1:1 (SBO: FFA:
MeOH) solution that was placed in a stainless steel vial in a 65°C preheated oven. The data seem
to show a maximum free fatty acid conversion of about 23%.
0
5
10
15
20
25
30
0 30 60 90 120 150 180 210 240 270
% F
FA
Co
nv
ers
ion
Time (Minutes)
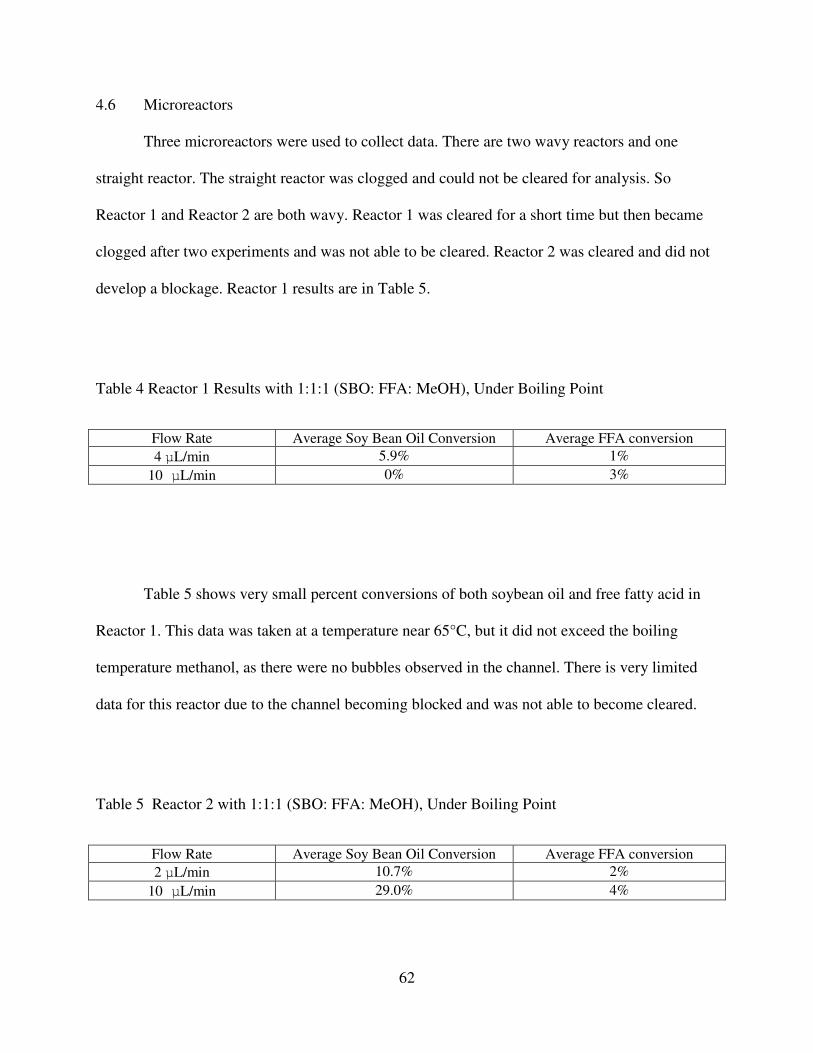
62
4.6 Microreactors
Three microreactors were used to collect data. There are two wavy reactors and one
straight reactor. The straight reactor was clogged and could not be cleared for analysis. So
Reactor 1 and Reactor 2 are both wavy. Reactor 1 was cleared for a short time but then became
clogged after two experiments and was not able to be cleared. Reactor 2 was cleared and did not
develop a blockage. Reactor 1 results are in Table 5.
Table 4 Reactor 1 Results with 1:1:1 (SBO: FFA: MeOH), Under Boiling Point
Flow Rate Average Soy Bean Oil Conversion Average FFA conversion
4 µL/min 5.9% 1%
10 µL/min 0% 3%
Table 5 shows very small percent conversions of both soybean oil and free fatty acid in
Reactor 1. This data was taken at a temperature near 65°C, but it did not exceed the boiling
temperature methanol, as there were no bubbles observed in the channel. There is very limited
data for this reactor due to the channel becoming blocked and was not able to become cleared.
Table 5 Reactor 2 with 1:1:1 (SBO: FFA: MeOH), Under Boiling Point
Flow Rate Average Soy Bean Oil Conversion Average FFA conversion
2 µL/min 10.7% 2%
10 µL/min 29.0% 4%
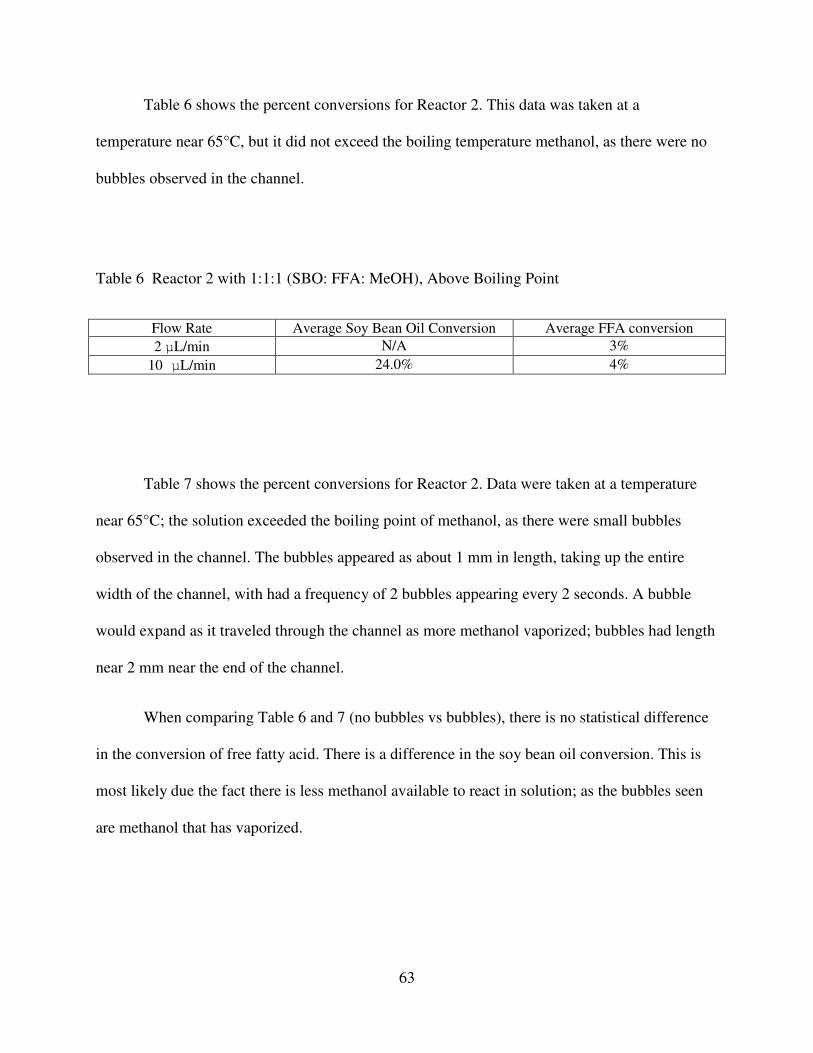
63
Table 6 shows the percent conversions for Reactor 2. This data was taken at a
temperature near 65°C, but it did not exceed the boiling temperature methanol, as there were no
bubbles observed in the channel.
Table 6 Reactor 2 with 1:1:1 (SBO: FFA: MeOH), Above Boiling Point
Flow Rate Average Soy Bean Oil Conversion Average FFA conversion
2 µL/min N/A 3%
10 µL/min 24.0% 4%
Table 7 shows the percent conversions for Reactor 2. Data were taken at a temperature
near 65°C; the solution exceeded the boiling point of methanol, as there were small bubbles
observed in the channel. The bubbles appeared as about 1 mm in length, taking up the entire
width of the channel, with had a frequency of 2 bubbles appearing every 2 seconds. A bubble
would expand as it traveled through the channel as more methanol vaporized; bubbles had length
near 2 mm near the end of the channel.
When comparing Table 6 and 7 (no bubbles vs bubbles), there is no statistical difference
in the conversion of free fatty acid. There is a difference in the soy bean oil conversion. This is
most likely due the fact there is less methanol available to react in solution; as the bubbles seen
are methanol that has vaporized.
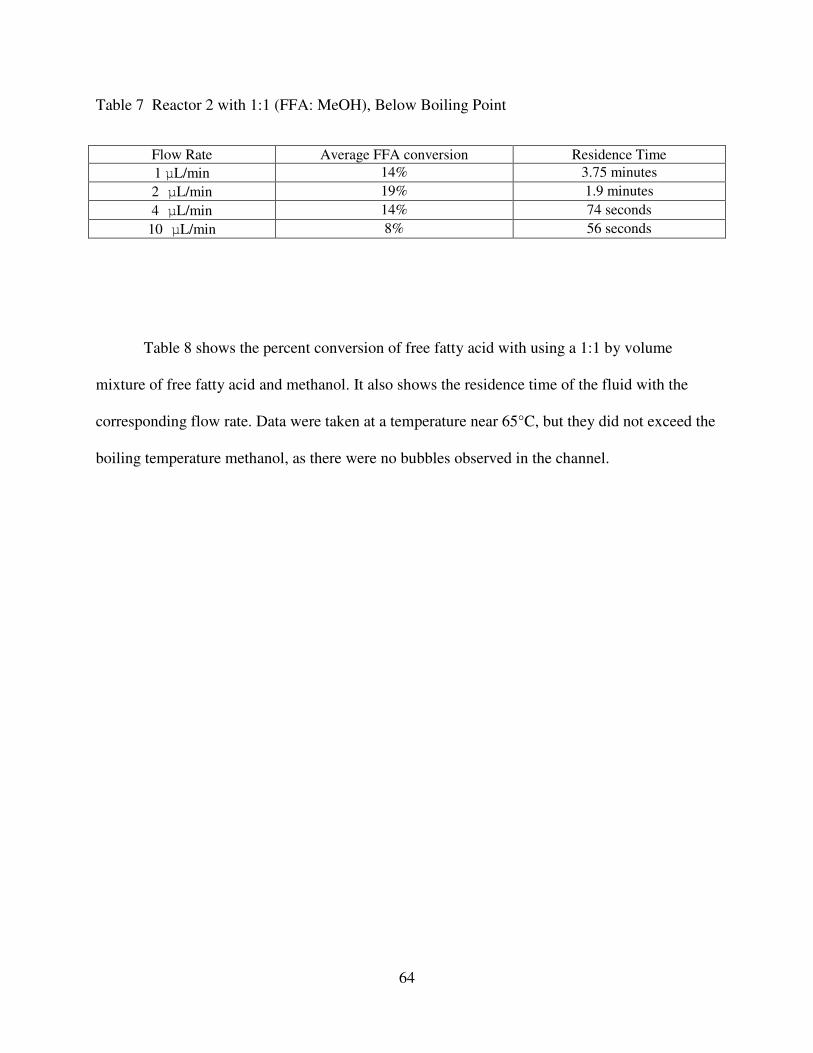
64
Table 7 Reactor 2 with 1:1 (FFA: MeOH), Below Boiling Point
Flow Rate Average FFA conversion Residence Time
1 µL/min 14% 3.75 minutes
2 µL/min 19% 1.9 minutes
4 µL/min 14% 74 seconds
10 µL/min 8% 56 seconds
Table 8 shows the percent conversion of free fatty acid with using a 1:1 by volume
mixture of free fatty acid and methanol. It also shows the residence time of the fluid with the
corresponding flow rate. Data were taken at a temperature near 65°C, but they did not exceed the
boiling temperature methanol, as there were no bubbles observed in the channel.
65
CHAPTER 5
DISCUSSION
5.1 Stirred-tank Reactors
When studying the stirred-tank reactors, two items were examined. First is the effect the
co-solvent—free fatty acid—has on the equilibrium conversion of soybean oil. Second is the
effect this has on the initial conversion rates. These items are compared between the one-phase
(1:1:1, SBO: FFA: MeOH) and two-phase (1:1, SBO: MeOH) feedstocks.
5.1.1 Effect of Co-Solvent with Respect to Equilibrium Conversion
The UTC microreactor research group previously conducted research using the stirred-
tank reactors.6 This was done under the same conditions but used a two-phase feedstock made up
of soybean oil and methanol only. The data is shown in Figure 41.
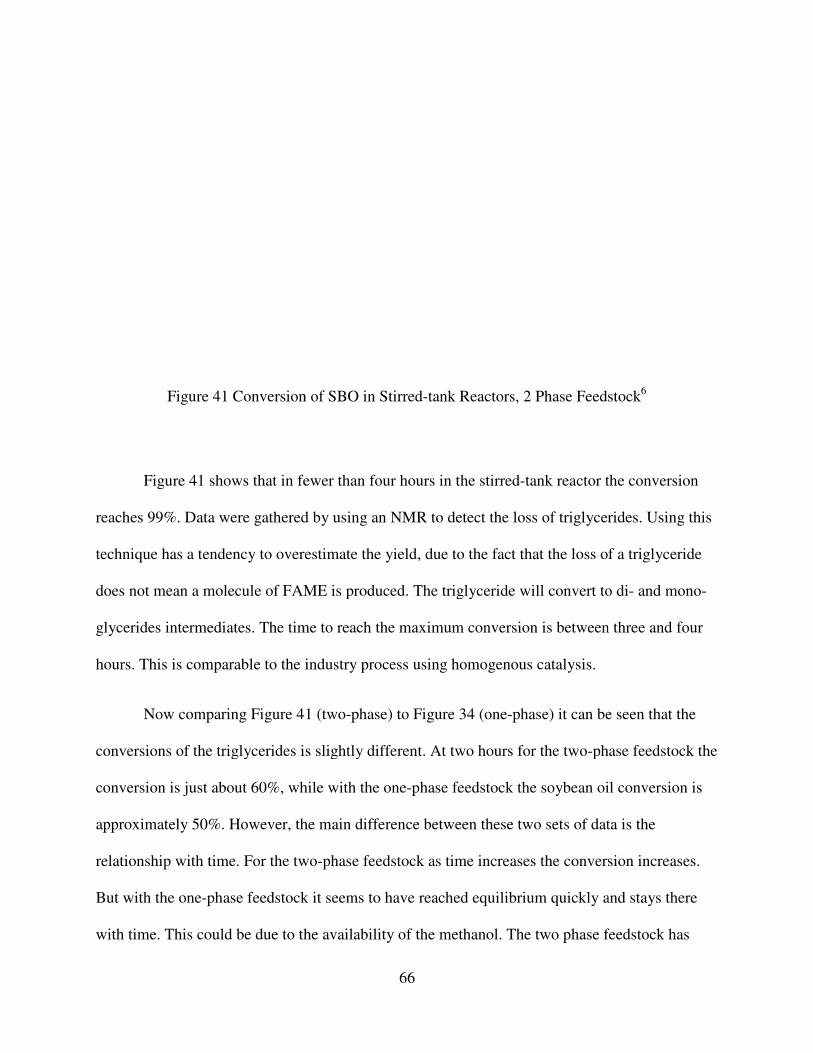
Figure 41 Conversion of SBO in
Figure 41 shows that in fewer than
reaches 99%. Data were gathered by using an NMR to detect the loss of triglycerides. Using this
technique has a tendency to overestimate the yield, due to the fact that the loss of a triglyceride
does not mean a molecule of FAME is produced. The triglyceride will convert to di
glycerides intermediates. The time to reach the maximum conversion is between three and four
hours. This is comparable to the industry process using homogenous catalysis
Now comparing Figure 41
conversions of the triglycerides is slightly different.
conversion is just about 60%, while with the one
approximately 50%. However, the main difference between these two sets of data is the
relationship with time. For the two
But with the one-phase feedstock
with time. This could be due to the availability of the methanol. The two phase
66
Conversion of SBO in Stirred-tank Reactors, 2 Phase Feedstock
fewer than four hours in the stirred-tank reactor the conversion
gathered by using an NMR to detect the loss of triglycerides. Using this
technique has a tendency to overestimate the yield, due to the fact that the loss of a triglyceride
not mean a molecule of FAME is produced. The triglyceride will convert to di
glycerides intermediates. The time to reach the maximum conversion is between three and four
arable to the industry process using homogenous catalysis.
mparing Figure 41 (two-phase) to Figure 34 (one-phase) it can be seen that the
of the triglycerides is slightly different. At two hours for the two-phase
conversion is just about 60%, while with the one-phase feedstock the soybean oil conversion is
approximately 50%. However, the main difference between these two sets of data is the
relationship with time. For the two-phase feedstock as time increases the conversion increases.
feedstock it seems to have reached equilibrium quickly and stays there
with time. This could be due to the availability of the methanol. The two phase feedstock
Reactors, 2 Phase Feedstock6
reactor the conversion
gathered by using an NMR to detect the loss of triglycerides. Using this
technique has a tendency to overestimate the yield, due to the fact that the loss of a triglyceride
not mean a molecule of FAME is produced. The triglyceride will convert to di- and mono-
glycerides intermediates. The time to reach the maximum conversion is between three and four
it can be seen that the
phase feedstock the
the soybean oil conversion is
approximately 50%. However, the main difference between these two sets of data is the
as time increases the conversion increases.
quickly and stays there
feedstock has
67
more methanol per oil molecule in the system than the one-phase feedstock. Lower conversions
may be due to the competition for the methanol. The methanol in the two-phase feedstock only
reacts with the soybean oil—glyceride family, while in the one-phase system the methanol must
react with the soybean oil and the free fatty acid. So, not only is there not as much methanol in
feedstock in the one-phase feedstock but it must also react with more substances.
The results agree with the Le Chatelier’s Principle.51
This principle states, for an
equilibrium process, as the concentration of reactants is increased the equilibrium will shift
towards the product. In this case when there is a higher concentration of methanol in the system
there will be more biodiesel produced.
5.1.2 Effect of Co-Solvent with Respect to Initial Conversion Rates
The UTC microreactor research group previously conducted research using stirred-tank
reactors.7 The data to analyze the initial rates of conversion is shown in Figure 42.
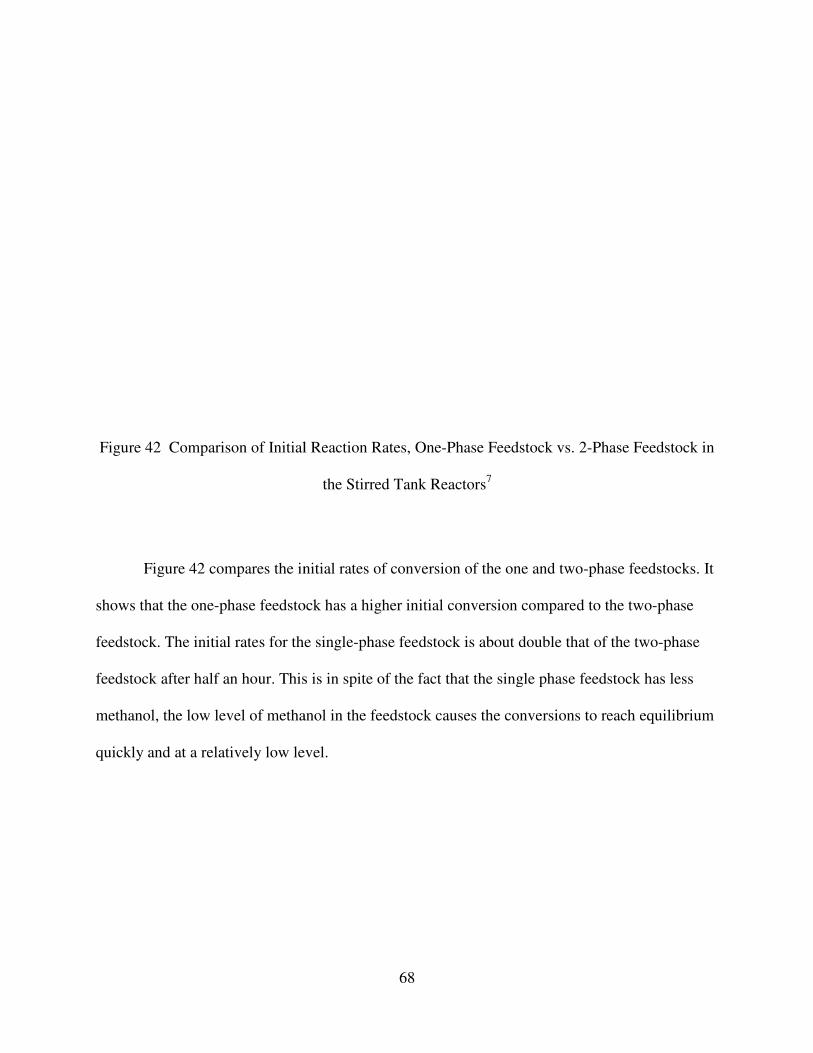
Figure 42 Comparison of Initial Reaction Rates, One
Figure 42 compares the initial rates o
shows that the one-phase feedstock
feedstock. The initial rates for the single
feedstock after half an hour. This is in spite of the fact that the single phase feedstock has less
methanol, the low level of methanol in the feedstock causes the conv
quickly and at a relatively low level.
68
of Initial Reaction Rates, One-Phase Feedstock vs. 2-Phase Feedst
the Stirred Tank Reactors7
compares the initial rates of conversion of the one and two-phase
feedstock has a higher initial conversion compared to the two
The initial rates for the single-phase feedstock is about double that of the two
feedstock after half an hour. This is in spite of the fact that the single phase feedstock has less
methanol, the low level of methanol in the feedstock causes the conversions to reach equilibrium
quickly and at a relatively low level.
Phase Feedstock in
phase feedstocks. It
the two-phase
phase feedstock is about double that of the two-phase
feedstock after half an hour. This is in spite of the fact that the single phase feedstock has less
ersions to reach equilibrium
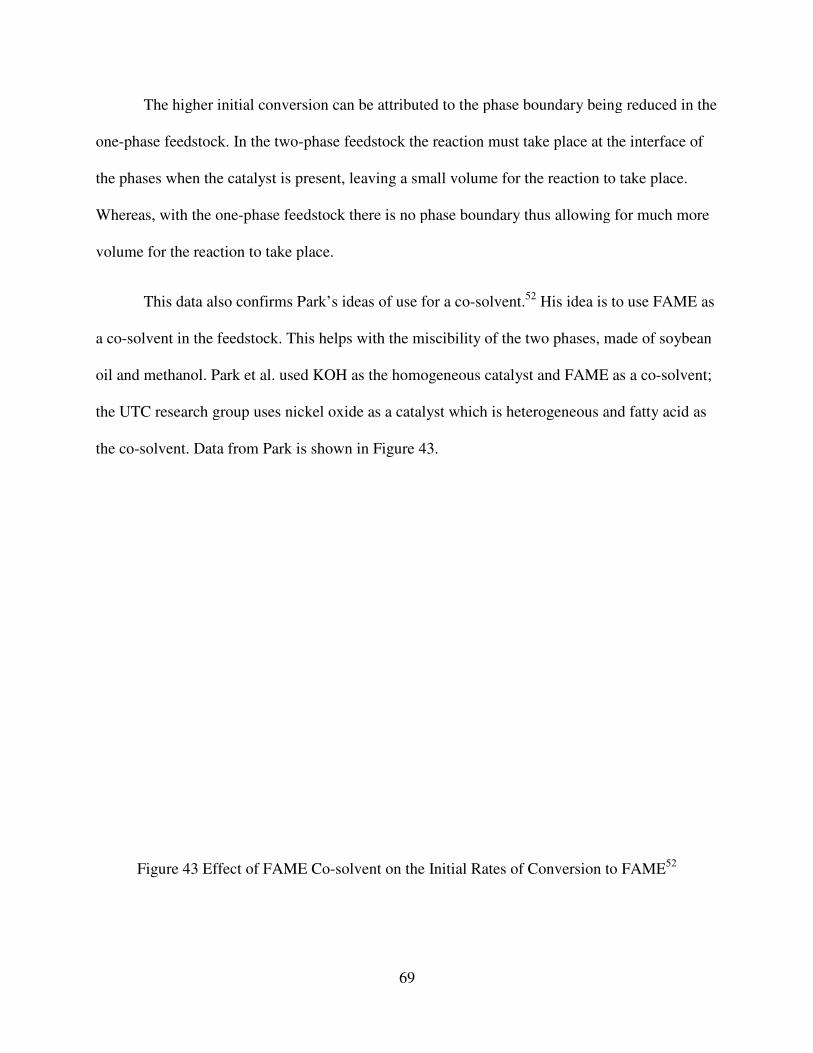
The higher initial conversion can
one-phase feedstock. In the two-phase
the phases when the catalyst is present, leaving a small volume for the reaction to take place.
Whereas, with the one-phase feedstock
volume for the reaction to take place.
This data also confirms Pa
a co-solvent in the feedstock. This helps with the miscibility of the two phases, made of soybean
oil and methanol. Park et al. used KOH as the
the UTC research group uses nickel oxide as a catalyst which is heterogeneous and fatty acid as
the co-solvent. Data from Park is
Figure 43 Effect of FAME Co
69
The higher initial conversion can be attributed to the phase boundary being reduced in the
phase feedstock the reaction must take place at the interface o
the phases when the catalyst is present, leaving a small volume for the reaction to take place.
feedstock there is no phase boundary thus allowing for much more
volume for the reaction to take place.
Park’s ideas of use for a co-solvent.52
His idea is to use FAME a
. This helps with the miscibility of the two phases, made of soybean
Park et al. used KOH as the homogeneous catalyst and FAME as a co
the UTC research group uses nickel oxide as a catalyst which is heterogeneous and fatty acid as
. Data from Park is shown in Figure 43.
Effect of FAME Co-solvent on the Initial Rates of Conversion to FAME
attributed to the phase boundary being reduced in the
at the interface of
the phases when the catalyst is present, leaving a small volume for the reaction to take place.
there is no phase boundary thus allowing for much more
His idea is to use FAME as
. This helps with the miscibility of the two phases, made of soybean
FAME as a co-solvent;
the UTC research group uses nickel oxide as a catalyst which is heterogeneous and fatty acid as
solvent on the Initial Rates of Conversion to FAME52
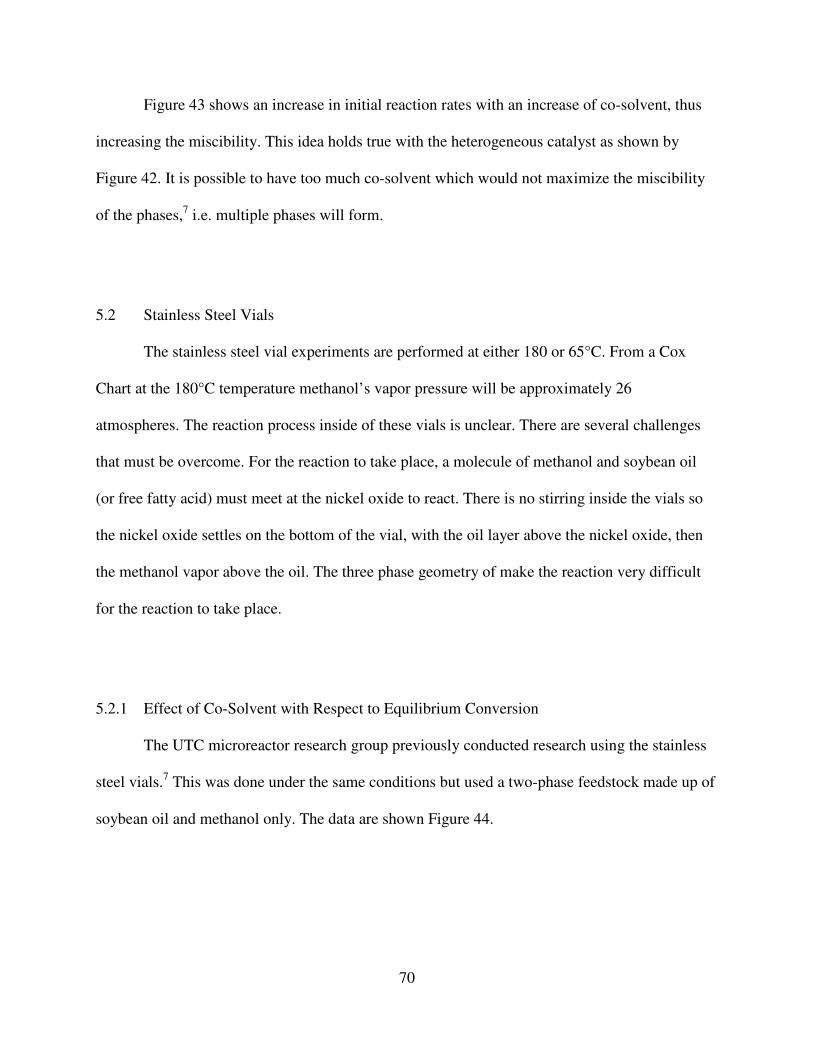
70
Figure 43 shows an increase in initial reaction rates with an increase of co-solvent, thus
increasing the miscibility. This idea holds true with the heterogeneous catalyst as shown by
Figure 42. It is possible to have too much co-solvent which would not maximize the miscibility
of the phases,7 i.e. multiple phases will form.
5.2 Stainless Steel Vials
The stainless steel vial experiments are performed at either 180 or 65°C. From a Cox
Chart at the 180°C temperature methanol’s vapor pressure will be approximately 26
atmospheres. The reaction process inside of these vials is unclear. There are several challenges
that must be overcome. For the reaction to take place, a molecule of methanol and soybean oil
(or free fatty acid) must meet at the nickel oxide to react. There is no stirring inside the vials so
the nickel oxide settles on the bottom of the vial, with the oil layer above the nickel oxide, then
the methanol vapor above the oil. The three phase geometry of make the reaction very difficult
for the reaction to take place.
5.2.1 Effect of Co-Solvent with Respect to Equilibrium Conversion
The UTC microreactor research group previously conducted research using the stainless
steel vials.7 This was done under the same conditions but used a two-phase feedstock made up of
soybean oil and methanol only. The data are shown Figure 44.
Figure 44
From Figure 44 its can be seen that the conversion using the two
approximately 98% conversion after three hours. There i
from the first two data points. This may be attrib
to heat up to a reaction temperature;
135°C. Another reason for this “S” type behavior may be due to the initial three phase
oil, methanol—structure that must be overcome.
71
44 Conversion of SBO to FAME at 180°C7
its can be seen that the conversion using the two-phase feedstock
approximately 98% conversion after three hours. There is an initial lag in reaction rate, shown
from the first two data points. This may be attributed to a couple factors. First is the time it takes
at up to a reaction temperature; after only 20 minutes in the oven the solution just reaches
reason for this “S” type behavior may be due to the initial three phase
structure that must be overcome.
feedstock reaches
s an initial lag in reaction rate, shown
is the time it takes
after only 20 minutes in the oven the solution just reaches
reason for this “S” type behavior may be due to the initial three phase—catalyst,
72
Comparing Figure 44 to the Figure 37, the reaction equilibrium can be compared. In
Figure 37 (180 SSV reaction), the reaction used the one-phase feedstock (1:1:1; SBO: FFA:
MeOH), seems to reach equilibrium at just under 80% after four hours, compared to the two-
phase feedstock which reaches equilibrium of about 98% after three hours. So, the reaction using
the one-phase solution is not as fast to reach equilibrium, by one hour, and it does not reach as
high equilibrium as when using the two-phase solution in the stainless steel reactor. This is due
to the fact there is less methanol available to react with in the system.
Comparing Figures 37 and 38 to Figure 38 and 40 (reaction temperature of 180°C vs
65°C) a significant difference can be observed. If we look at the equilibrium the hotter
temperature has a better conversion. La Chatelier’s Principle states that as pressure increases in
the system, a higher temperature in this case, the equilibrium shifts toward the products. This is
why the equilibrium conversion is lower at 65°C than at 180°C.
5.2.2 Effect of Co-Solvent with Respect to Initial Conversion Rates
The initial conversion rates of the two feedstocks were compared in the stainless steel
vials. Like in the stirred tank reactors, the single phase feedstock increased the initial conversion
rates. The data are seen in Figure 45.
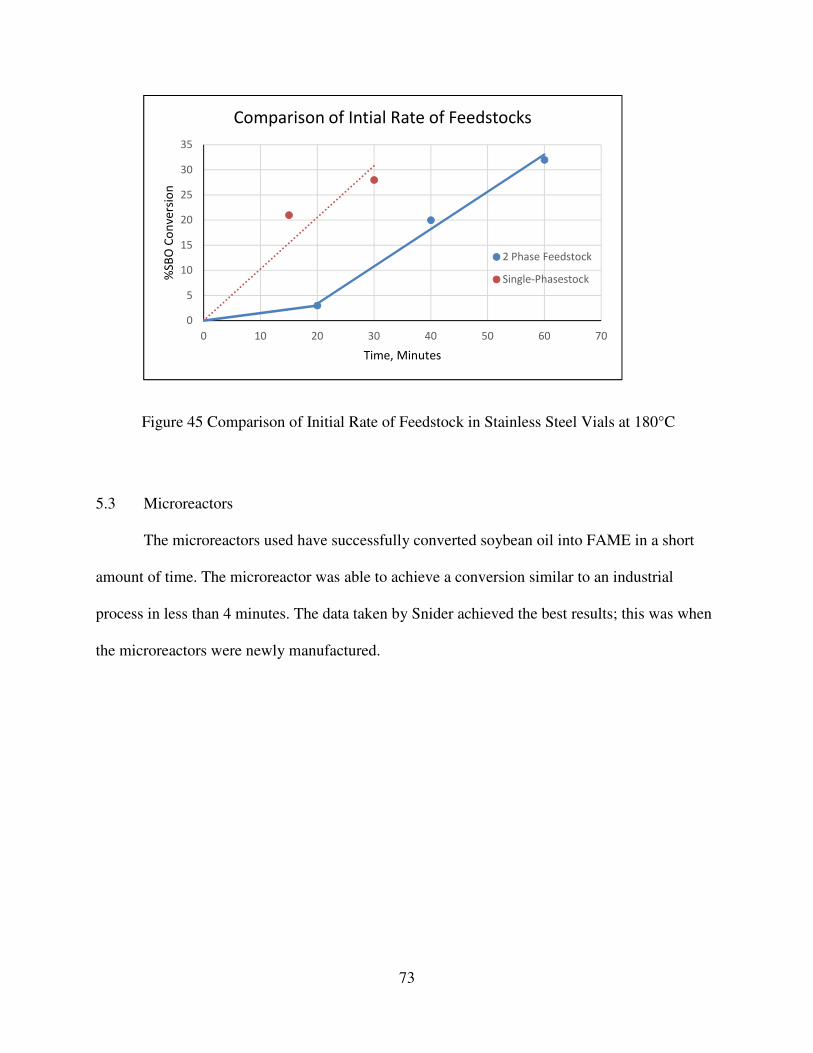
73
Figure 45 Comparison of Initial Rate of Feedstock in Stainless Steel Vials at 180°C
5.3 Microreactors
The microreactors used have successfully converted soybean oil into FAME in a short
amount of time. The microreactor was able to achieve a conversion similar to an industrial
process in less than 4 minutes. The data taken by Snider achieved the best results; this was when
the microreactors were newly manufactured.
0
5
10
15
20
25
30
35
0 10 20 30 40 50 60 70
%SB
O C
on
vers
ion
Time, Minutes
Comparison of Intial Rate of Feedstocks
2 Phase Feedstock
Single-Phasestock
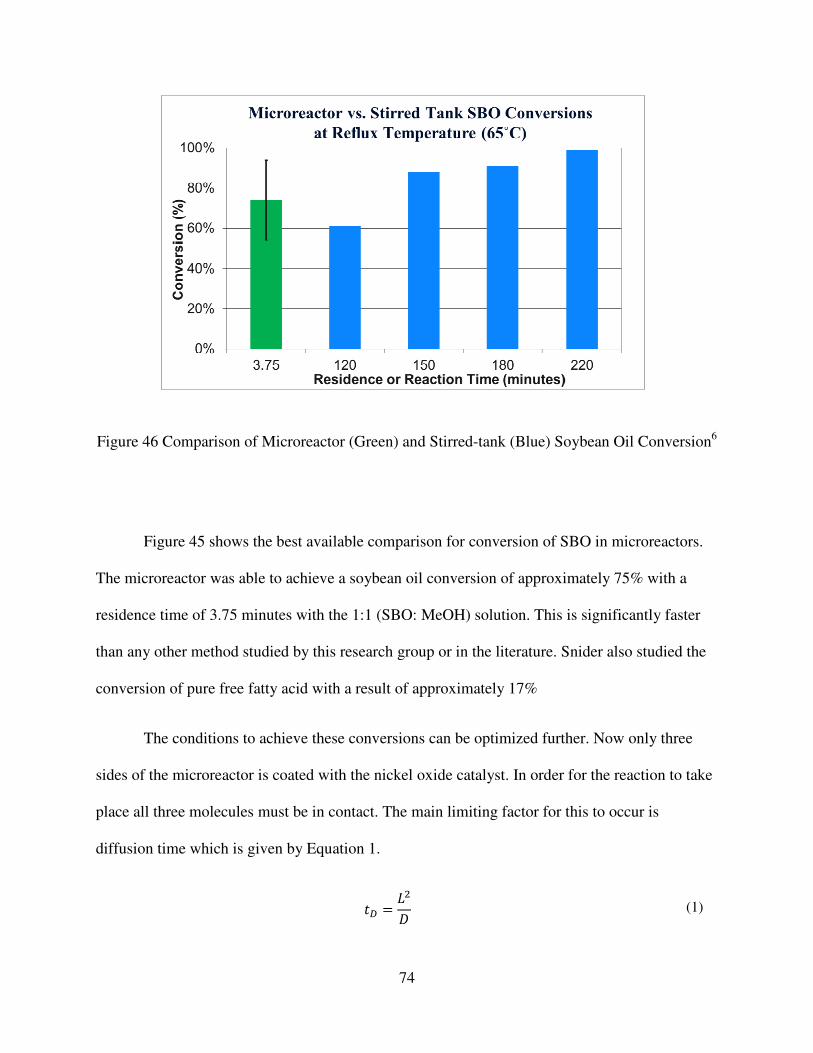
74
Figure 46 Comparison of Microreactor (Green) and Stirred-tank (Blue) Soybean Oil Conversion6
Figure 45 shows the best available comparison for conversion of SBO in microreactors.
The microreactor was able to achieve a soybean oil conversion of approximately 75% with a
residence time of 3.75 minutes with the 1:1 (SBO: MeOH) solution. This is significantly faster
than any other method studied by this research group or in the literature. Snider also studied the
conversion of pure free fatty acid with a result of approximately 17%
The conditions to achieve these conversions can be optimized further. Now only three
sides of the microreactor is coated with the nickel oxide catalyst. In order for the reaction to take
place all three molecules must be in contact. The main limiting factor for this to occur is
diffusion time which is given by Equation 1.
�� �
��
� (1)
75
In Equation 1, tD represents the time it takes for an individual particle to diffuse through
the liquid to the catalyst covered surface, L is the length the particle must travel, and D a
diffusion coefficient. The diffusion coefficient is 1 x 10⁻⁹
m2/s.
7 Right now, only the bottom and
the side walls are sputtered with nickel oxide catalyst. The longest length a particle has to diffuse
to react is from the top to the bottom, 50 µm. But if the top was sputtered also, the longest length
a particle would have to diffuse to react is 25 µm. Thus the diffusing time would be quartered.
The same reactors that Snider used are the same reactors that were used in this study.
However, the results were significantly different. There could be several reasons for this. The
reactors have been stored at ambient conditions open to the air. The air may have had a catalytic
poisoning effect. Also the design of the reactors required the plumbing ports be attached via
adhesive. It was discovered that Superglue worked the best to adhere the ports to the
microreactor. However, if not careful, the glue would seep into the inlets and clog the system.
The recommended solvent to dissolve Superglue is acetone. At the beginning of the studies in
2014, all of the reactors were clogged. So to clear the channels acetone was used, with some
success. However, acetone seemed to be a catalytic poison.
76
It is expected that the one-phase feedstock will result in a lower conversion due to the
availability of methanol, compared to the one-phase feedstock. However, it is expected to be
higher than the reported data, which suggests time or acetone played a part in deterioration of the
microreactors. It is unclear whether time or acetone was the culprit in poisoning the nickel oxide
that was sputtered on the microreactor walls, it is evident that the microreactors do not have the
same activity as when they were first manufactured. The highest yield achieved in this study,
2014, was 29% soybean oil conversion. This is significantly less than the 75% soybean oil
conversion immediately after manufacturing the microreactors in 2012.
5.3.1 Suggestions for Improvement
As with any design process, there are improvements that can be made for the next
generation of microreactors. The specific improvements are to the reactor, not the channel
design. The main operational problem is the plumbing. Leaks occur frequently and blockages
occur when the plumbing adhesive seeps into the inlet ports. The top is glass and the bottom is a
silicon wafer. So for the next generation of reactors, it is suggested that the inlets and outlets be
part of the reactor itself. The reactor could have screw type ports so that the lines are a direct
connect, thus eliminating the need for adhesive.
77
Another suggestion is to replace the glass with the same material as the bottom, currently
silicon. That way, the top of the channel could be sputtered with catalyst and higher yields could
results. Diffusion is the main source of particle mixing with a creeping flow system.36
So having
sputtering on the top would decrease the time of diffusion significantly. Having an opaque top
has a drawback of not being able to see the channel. This is important because if the temperature
it too high then bubbles form in the system. There is not a way to get an accurate temperature
inside of the channel. This visual check helps to determine optimal operational temperature. But
with proper care the solid top may prove to be a larger asset than hindrance.
78
CHAPTER 6
CONCLUSION
It has been shown that the 1:1:1 (SBO: FFA: MeOH) by volume feedstock will react
successfully with nickel oxide, with both the soybean oil and the free fatty acid converting to
biodiesel. The percent conversion of soybean oil may not be as high as with the two phase
system (1:1 volume ratio of SBO:MeOH) but this could be due to higher competitiveness with
the methanol.
The initial rates of conversion are increased by using the single phase feedstock as
compared to the two phase feedstock. This is due to a phase boundary being eliminated, which
helps the reaction proceed quicker. The single phase feedstock also had a lower equilibrium
conversion was reached compared to the two phase feedstock. This is due the lower availability
of the methanol in the feedstock.
The microreactors have been either clogged or have been catalytically poisoned. Due to this
fact, little data were collect with them. When the microreactors were new, they performed
exceptionally. With a better design for the microreactors higher conversion will be obtained.
79
REFERENCES
1. Biofuels The Original Car Fuel. 2015 [cited 2015 February 19]; Available from:
http://environment.nationalgeographic.com/environment/global-warming/biofuel-
profile/http://environment.nationalgeographic.com/environment/global-warming/biofuel-
profile/.
2. Tanawannapong, Y., A. Kaewchada, and A. Jaree, Biodiesel production from waste
cooking oil in a microtube reactor. JIEC Journal of Industrial and Engineering
Chemistry, 2013. 19(1): p. 37-41.
3. Canter, N., Making Biodiesel in a microreactor. Tribology and Lubrication Technology,
2006. 62(8): p. 15-17.
4. Lewis, J., Design Studies of Heterogeneous Catalysis in Microchannels. 2010, The
University of Tennessee at Chattanooga.
5. Dacus, R., A Kinetic Study of the Production of Biodiesel Fuel from Algae Oil. 2010, The
University of Tennessee at Chattanooga.
6. Snider, E., Catalyst Studies with Implication on the Design and Fabrication of
Microreactors. 2012, The University of Tennessee at Chattanooga.
7. Kegley, B., The Effect of Co-Solvent and Ordered Latice Structure on Catalysis of
Biodiesel Production in Microreactors. 2014, The University of Tenneessee at
Chattanooga.
8. 9-Octadecenoic Acid (Z)-Methyl Ester. 2014.
9. Hexadecane. 2014; Available from:
http://pubchem.ncbi.nlm.nih.gov/compound/hexadecane.
10. Nonpetroleum Based Fuels - Bidiesel and Use Guide. Available from:
http://www.nrel.gov/vehiclesandfuels/pdfs/42672.pdf.
11. H. Bhatti, et al., Acid and Base Catalyzed Transesterification of Animal Fats to Biodiesel.
Iran Journal of Chemical Engineering, 2008. 27(4): p. 41-49.
12. Catalyst Definition. 2015 [cited 2015 February].
80
13. R. Richard, et al., On-line monitoring of the transesterification reaction carried out in
microreactors using near infrared spectroscopy. Fuel, 2013. 104: p. 318-325.
14. Guan, G., et al., Transesterification of sunflower oil with methanol in a microtube
reactor. Ind. Eng. Chem. Res. Industrial and Engineering Chemistry Research, 2009.
48(3): p. 1357-1363.
15. Guan, G., et al., Two-phase flow behavior in microtube reactors during biodiesel
production from waste cooking oil. AIC AIChE Journal, 2010. 56(5): p. 1383-1390.
16. Sun, J., et al., Synthesis of biodiesel in capillary microreactors. Ind. Eng. Chem. Res.
Industrial and Engineering Chemistry Research, 2008. 47(5): p. 1398-1403.
17. Kalu, E.E., K.S. Chen, and T. Gedris, Continuous-flow biodiesel production using slit-
channel reactors. BITE Bioresource Technology, 2011. 102(6): p. 4456-4461.
18. E. Kalu, K.C., T. Gedris, Continuous-flow biodiesel production using slit-channel
reactors. BIoresource Technology, 2011. 102: p. 4456-4461.
19. Wen, Z., et al., Intensification of biodiesel synthesis using zigzag micro-channel reactors.
Bioresource technology, 2009. 100(12): p. 3054-60.
20. Z. Wen, X.Y., S. Tu, J. Yan, E. Dahlquist., Intensification fo biodiesel synthesis using
zigzag micro-channel reactors. Bioresource Technology, 2009. 100: p. 3054-3060.
21. Tianming Xie, Lixiong Zhang, and N. Xu, Biodiesel synthesis in microreactors. Green
Process Synthesis, 2012: p. 61-70.
22. Colucci, J., E. Borrero, and F. Alape, Biodiesel from an alkaline transesterification
reaction of soybean oil using ultrasonic mixing. Journal of the American Oil Chemists'
Society, 2005. 82(7): p. 525-530.
23. Organic Chemistry Portal. [cited 2014 November 18]; Available from:
http://www.organic-chemistry.org/namedreactions/fischeresterification.shtm.
24. Thiebaud-Roux, S., R. Richard, and L. Prat, Modelling the kinetics of transesterification
reaction of sunflower oil with ethanol in microreactors. Chemical Engineering Science,
2013. 87: p. 258-269.
25. Trentin, C.M., et al., Continuous catalyst-free production of fatty acid ethyl esters from
soybean oil in microtube reactor using supercritical carbon dioxide as co-solvent. The
Journal of Supercritical Fluids The Journal of Supercritical Fluids, 2011. 56(3): p. 283-
291.
26. Trentin, C.M., et al., Continuous production of soybean biodiesel with compressed
ethanol in a microtube reactor using carbon dioxide as co-solvent. Fuel Processing
Technology, 2011. 92(5).
81
27. MWV: Tall Oil Fatty Acids. 2014 [cited 2014 January]; Available from:
http://www.meadwestvaco.com/SpecialtyChemicals/PineChemicals/MWV0 02127.
28. Methanol. 2014 [cited 2014 January]; Available from: http://www.fishersci.com.
29. GIlmont Falling Ball Viscometer 2013 [cited 2015 February]; Available from:
http://www.coleparmer.com/Category/Gilmont_Falling_Ball_Viscometer/7137.
30. 25 mL Round Bottom FLask. [cited 2014 January]; Available from:
http://www.sigmaaldrich.com/catalog/product/aldrich/z100641?lang=en&re gion=US.
31. EchoTherm Programmable Hot Plate.
32. Reflux Condenser. [cited 2014 January]; Available from:
http://www.sigmaaldrich.com/catalog/product/aldrich/z568953?lang=en&re gion=US.
33. 5 mL Mixing Jar. [cited 2014 January]; Available from:
https://www.globalgilson.com/productdisplay.asp?model=RTA-52.
34. 20GC Gravity Convection Oven. [cited 2014 January]; Available from:
http://www.labdepotinc.com/Product_Details~id~779~pid~13532.aspx.
35. Hermle Compact Variable-speed Universal Centrifuge - 115V; 50/60 Hz.
36. Creeping FLow. Available from: http://www.engineering.uiowa.edu.
37. n-Heptane. [cited 2014 January]; Available from:
http://www.sigmaaldrich.com/catalog/product/sial/34873?lang=en®ion= US.
38. Tricaprin. [cited 2014 January]; Available from:
http://www.sigmaaldrich.com/catalog/product/sigma/t7517?lang=en®ion =US.
39. Pyridine. [cited 2014 January]; Available from:
http://www.sigmaaldrich.com/catalog/product/sial/270970?lang=en®ion =US.
40. MXT-Biodiesel TG Column. [cited 2014 October]; Available from:
http://www.restek.com/catalog/view/7715.
41. ASTM D6584 - 10ae1. Standard Test Method for Determination of Toatl Monoglyceride,
Total Diglyceride, Total Triglyceride, and Free and Total Glycerin in B 100 Biodiesel
Methyl Esters by Gas Chromatography]. Available from: www.astm.org.
42. Baig, A. and F.T.T. Ng, A Single-Step Solid Acid-Catalyzed Process for the Production
of Biodiesel from High Free Fatty Acid Feedstocks. ENERGY AND FUELS, 2010.
24(5): p. 4712-4720.
82
43. MSTFA- N-methyl-N-(trimethylsilyl) trifluoroacetamide. 2014 [cited 2014 October];
Available from:
http://www.sigmaaldrich.com/catalog/product/sigma/m7891?lang=en®ion=US.
44. Derivatization Reagent: Silylation. [cited 2014 January]; Available from:
http://www.sigmaaldrich.com/analytical-
chromatography/analyticalreagents/derivatization-reagents/silylation.html.
45. ASTM Standard D974. 2008; Standard Test Method for Acid and Base Number by Color-
Indicator Titration]. Available from: www.astm.org.
46. Baig, A. and F.T.T. Ng, Determination of acid number of biodiesel and biodiesel blends.
JAOCS J Am Oil Chem Soc JAOCS, Journal of the American Oil Chemists' Society,
2011. 88(2): p. 243-253.
47. 2-proanol (Iso-Propanol). [cited 2014 Januarty]; Available from:
http://www.sigmaaldrich.com/catalog/product/sial/278475?lang=en®ion
48. Toluene. [cited 2014 January]; Available from:
http://www.sigmaaldrich.com/catalog/product/sial/244511?lang=en®ion =US.
49. α-Naphtholbenzein. [cited 2014 January]; Available from:
http://www.sigmaaldrich.com/catalog/product/fluka/70480?lang=en®ion =US.
50. R. W. McDonald, A. T. Pritchard, and P. J, Indroduction to Fluid Mechanics. 2004: John
Wiley and Sons.
51. Le Chatelier's Principle. [cited 2015 February]; Available from:
http://www.chemguide.co.uk/physical/equilibria/lechatelier.html.
52. Park, J.-Y., et al., Fast Biodiesel Production with One-Phase Reaction. Applied
Biochemistry and Biotechnology, 2009. 154(1-3): p. 1-3.
83
VITA
Matthew Littell was born in Portland, Tennessee, USA to his parents Michael and
Rhonda Littell. He has two older brothers named Adam and Kyle. His family is a huge support
and gave him a desire for the pursuit of knowledge. Upon graduation from high school in
Portland, TN Matthew moved to Collegedale, TN to attend Southern Adventist University where
he obtained a Bachelor’s of Science Degree in Chemistry with an Emphasis in Biochemistry. He
continued his education at the University of Tennessee at Chattanooga to pursue a Master’s
Degree in Engineering: Chemical Sciences. While at UTC, he was a graduate assistant for the
Chemical Engineering Department. There he worked with Frank Jones on biodiesel production
with heterogeneous catalysis. He graduated from UTC in May 2015.