Embed Size (px)
Citation preview

Efect of Information Presentation on Fairness Perceptions ofMachine Learning Predictors
Niels van Berkel Jorge Goncalves Daniel [email protected] [email protected] [email protected]
Aalborg University University of Melbourne Aalborg UniversityAalborg, Denmark Melbourne, Australia Aalborg, Denmark
Simo Hosio Mikael B. [email protected] [email protected] of Oulu Aalborg University
Oulu, Finland Aalborg, Denmark
ABSTRACTThe uptake of artifcial intelligence-based applications raises con-cerns about the fairness and transparency of AI behaviour. Conse-quently, the Computer Science community calls for the involvementof the general public in the design and evaluation of AI systems.Assessing the fairness of individual predictors is an essential stepin the development of equitable algorithms. In this study, we evalu-ate the efect of two common visualisation techniques (text-basedand scatterplot) and the display of the outcome information (i.e.,ground-truth) on the perceived fairness of predictors. Our resultsfrom an online crowdsourcing study (N = 80) show that the chosenvisualisation technique signifcantly alters people’s fairness percep-tion and that the presented scenario, as well as the participant’sgender and past education, infuence perceived fairness. Based onthese results we draw recommendations for future work that seeksto involve non-experts in AI fairness evaluations.
CCS CONCEPTS• Human-centered computing → Human computer interac-tion (HCI); Collaborative and social computing; Empirical stud-ies in collaborative and social computing.
KEYWORDSArtifcial intelligence, fairness, transparency, crowdsourcing, ma-chine learning, predictor selection, layperson, visualisation, AI, ML.
ACM Reference Format:Niels van Berkel, Jorge Goncalves, Daniel Russo, Simo Hosio, and MikaelB. Skov. 2021. Efect of Information Presentation on Fairness Perceptionsof Machine Learning Predictors. In CHI Conference on Human Factors inComputing Systems (CHI ’21), May 8–13, 2021, Yokohama, Japan. ACM, NewYork, NY, USA, 13 pages. https://doi.org/xx.xxxx/xxxxxxxx.xxxxxxxx
Permission to make digital or hard copies of all or part of this work for personal orclassroom use is granted without fee provided that copies are not made or distributedfor proft or commercial advantage and that copies bear this notice and the full citationon the frst page. Copyrights for components of this work owned by others than theauthor(s) must be honored. Abstracting with credit is permitted. To copy otherwise, orrepublish, to post on servers or to redistribute to lists, requires prior specifc permissionand/or a fee. Request permissions from [email protected] ’21, May 8–13, 2021, Yokohama, Japan© 2021 Copyright held by the owner/author(s). Publication rights licensed to ACM.https://doi.org/xx.xxxx/xxxxxxx.xxxxxxx
1 INTRODUCTION Technological developments have led to an increase in the deploy-ment of artifcial intelligence (AI) based decision-support solutions. Having moved beyond theoretical solutions or theories, such sys-tems now have a profound efect on both individuals and society at large [25, 57]. The use of AI spans across a variety of application do-mains, including high-impact areas such as loan approval [16, 36], policing and law enforcement [29, 31], and hiring processes [14, 46]. Although AI technology promises more efcient decision technol-ogy, the use of automated decision systems also raises questions and risks concerning their fairness and equity. Notable examples of these include the COMPAS recidivism risk prediction system, which was found to have racial biases and was deployed in several U.S. states [2, 29], and an AI-powered recruitment tool previously used at Amazon that showed bias against women [14].
The rising concerns regarding the fairness of AI systems have led to the development of novel and interactive visualisation tools to probe machine learning (ML) models. These interpretability tools al-low ML practitioners to answer questions such as, ‘what if [...]? ’ [62], ‘what is a feature’s efect on [...]? ’ [33], and ‘why?’/‘why not?’ [38]. Simultaneously, Human-Computer Interaction (HCI) literature ar-gues strongly for the involvement of stakeholders and the general public in the development of AI applications [22, 56, 66], moti-vated by e.g. the ability to capture stakeholder insights [66] and to safeguard end-user acceptance [56]. Involving stakeholders in the early stages of algorithm design, i.e. during predictor selection, has been identifed as critical due to the ability to avoid biases in initial design choices [66]. The aforementioned algorithm prob-ing tools are primarily designed with ML professionals in mind, and it is unclear whether such tools can be appropriated by those without knowledge of the jargon and technical underpinnings of algorithm development. The involvement of members from the general public introduces new considerations to the way in which we study algorithmic fairness. These considerations have not been sufciently addressed in the literature. Although several studies have explored ways to capture people’s opinions and perceptions of AI systems [22, 56, 65], these studies have largely ignored the efect of information presentation (i.e., including/excluding certain information, visualisation techniques) and are typically limited to one application scenario (e.g., recidivism). In this work we argue

that how information is presented is at least as important as who itis presented to, and that these factors are interdependent.
Motivated by the increasing need to capture people’s perspec-tives on AI fairness, and the lack of knowledge of the factors thatafect the perceptions of fairness among non-ML experts, we de-signed an online crowdsourcing study to systematically investigatefairness perceptions in an algorithmic decision-making setting.In our study, participants were asked to make a judgement as towhether predictors should be included in an AI-algorithm in a givenscenario. We assess the efects of predictor type (e.g., demographic),presentation technique (text-based vs scatterplot), the inclusion ofground truth data in the information presentation, and applicationscenario on the participants’ judgement. Further, we ask partici-pants to report their perceived fairness, demographics, and overallassessment of the presentation technique. We set out to answer thefollowing research questions:• How does the presentation of data points afect perceived algo-rithmic fairness?
• What is the efect of presenting / not presenting the outcome ofthe predicted variable on perceived algorithmic fairness?
• How do the demographic factors of education and gender afectperceived algorithmic fairness?We fnd that our participants were less likely to include a predic-
tor when it was presented in a scatterplot as opposed to summarisedin writing. Participants were more likely to include variables ina recidivism-related scenario as compared to a lending scenario,regardless of the predictor type. A signifcant interaction efectbetween predictor type and visualisation technique highlights thatdemographic predictors and domain-specifc predictors are afecteddiferently by the presentation technique. Furthermore, our resultshighlight that educational attainment is a signifcant factor in fair-ness perception, with a higher completed education leading to alower average fairness rating. Similarly, we fnd that women per-ceived the predictors as signifcantly less fair as compared to men.Our results show that fairness perceptions are indeed altered byhow information is presented, and that signifcant diferences infairness perceptions between demographic groups exist. This raisesimportant considerations for the future involvement of participantsin the design and evaluation of AI applications, such as how wedisplay (interactive) data to participants. Finally, we present recom-mendations for future studies on AI perceptions.
2 RELATED WORKBoth the HCI and the AI literature highlight an increasing efortand interest towards the active involvement of the general publicand/or end-users in data collection [27], training [17], and the eval-uation [60] of AI applications. We motivate our work by buildingon prior research on fairness perceptions, tools for inspection ofML models, and visualisation and interpretation research.
2.1 Fairness and the PublicA variety of disciplines, including Law, Social Sciences, and Com-puter Science, have proposed numerous defnitions and perspectiveson fairness. Examples include, but are not limited to;• Individual fairness, which states that similar individuals shouldbe treated similarly [15].
• Demographic parity / Group fairness, in which outcomes are equally distributed among each defned group [9, 51].
• Equality of opportunity, which states that individuals with an equal amount of talent and motivation should be ofered the same prospective, regardless of their current position within the social system [24].
• Treatment equality, in which the ratio of false negatives and false positives is the same for each defned group [6].
Recent studies have explored how such theoretical defnitions align with the perspectives of non-experts. Srivastava et al. stud-ied fairness perceptions across two diferent application domains by presenting participants with the results of two hypothetical algorithms side-by-side [51]. Their results highlight that demo-graphic parity is closest in line with people’s perception of fairness. Similarly, Saxena et al. explored how three diferent defnitions of fairness are perceived by the public in the context of loan alloca-tion [48]. The defnitions included are ‘individual fairness’ [15], ‘never favour a worse individual over a better one’ [32], and ‘cali-brated fairness’ [39]. The results from Saxena et al. reveal a pref-erence for calibrated fairness, in which resources (e.g., money) are split between people in accordance with their ‘quality’. Including additional demographic information on the loan applicant’s race infuenced participants’ perceptions, which the authors attribute to afrmative action [48]. Binns et al. explore perceptions of jus-tice in algorithmic decision-making across diferent explanation styles [7]. Their results show explanation styles primarily afect participants’ perceptions when participants are presented with multiple diferent explanation styles. A case-based explanation, in which a representative example from the training data is presented, resulted in the most consistent negative impact on participants’ justice perceptions [7].
Highly relevant to our work is a deception-based study by Wang et al., in which the factors infuencing perceived fairness of crowd-workers on an algorithm designed to determine their eligibility for a ‘Master Qualifcation’ was investigated [60]. Through a between-subjects design, the authors presented participants with diferent scenarios concerning the algorithm’s development (e.g., the open-ness of the algorithm’s development) and performance across dif-ferent demographics. Based on these scenarios, participants pro-vided their expectation as to whether or not they would receive the master classifcation, after which a (random) decision result was presented. Participants subsequently rated the fairness of the algorithm. Wang et al.’s results highlight that participants perceive algorithms as more fair when the algorithm predicts in their favour – even when the algorithm shows severe biases against particular demographics [60]. This efect, known as outcome favourability, was found to be moderated by a number of demographic (e.g., edu-cation) and scenario (e.g., openness) variables.
Pierson collected fairness perceptions among university students prior to and following an hour-long lecture and discussion on algo-rithmic fairness [45]. Pierson’s results show that this intervention changed the perspective of Computer Science students towards algorithmic fairness, and revealed gender diferences in relation to the predictors that should be included in an algorithm. Grgić-Hlača et al. investigated factors infuencing the fairness perceptions of recidivism prediction algorithms [22]. Their results identify eight
properties that predict people’s perceptions towards a predictor (e.g.,perceived reliability, relevance). Expanding the work into collabo-rative interaction, Van Berkel et al. studied the fairness perceptiontowards ML predictors through interactive discussions facilitatedby a chatbot [56], allowing for private voting and public discussion.Their results highlight that being part of a more diverse groupresulted in a stronger agreement with the overall majority vote.Similarly, Van Berkel et al. highlight the gap between theoreticalperspectives on fairness and the public’s perception of fairness asan important obstacle to overcome in the public acceptance of AIapplications [56].
A common fnding in the aforementioned studies is that fairnessperceptions among the general public are infuenced by a variety offactors. Obtaining a better understanding of these factors across avariety of stages in the development process of algorithms is crucialto develop tools and techniques which allow the general public tointeract, inspect, and infuence the development of algorithm-basedapplications. In this paper we focus on one of the initial stepsin algorithm development, identifying the perceived fairness ofpotential algorithmic predictors.
2.2 Inspecting Machine Learning ModelsA range of work has established the notion that ML models oughtto be interpretable, specifcally in order to identify and understandhow the model behaves towards diferent groups [47]. This hasled to the development of a variety of interactive applications thatallow users to inspect ML models. For example, Wexler et al. in-troduce the ‘What-If’ tool, an interactive application which allowsML practitioners to “probe, visualise, and analyze ML systems, withminimal coding” [62]. The authors argue that no coding shouldbe required to increase ones understanding of a model, insteadallowing users to answers ‘what-if’ questions (e.g., ‘how would anincrease in the value of age afect the model’s decision?’) using aninteractive tool. Through an iterative design process with machinelearning researchers and practitioners, Hohman et al. present a vi-sual ML interpretation system named ‘Gamut’ [26]. Gamut presentsan interactive interface with multiple coordinated views, i.e., linecharts on multiple features, waterfall charts to explain the cumula-tive impact of each feature on the fnal decision, and an interactivetable which allows for sorting and fltering of the data.
Kaur et al. studied the use of two existing interpretability toolsby ML practitioners through a contextual inquiry and survey [33].Their results indicate that practitioners misuse interpretability toolsdue to a misalignment between the intended use of these toolsand the participants understanding of their workings. This misuseis fuelled by an over-trust of participants in the visualisations:“participants were excited about the visualizations and took them atface value instead of using them to dig deeper into issues with thedataset or model.” [33].
We note that the majority of these interpretation tools are aimedat ML experts. Although HCI researchers have stressed the need forstakeholders to be involved in the development of algorithms [11,56, 58, 64], a thorough understanding on how users would make useof such tools is still missing – resulting in the absence of adequatetooling for the general public. Liao et al., in exploring the needsof practitioners in creating explainable AI applications, highlight
that “XAI [explainable AI] research still struggles with a lack of understanding of real-world user needs for AI transparency, and by far little consideration of what practitioners need to create explainable AI products” [37]. In this paper, we explore factors afecting non-ML experts in their assessment of algorithmic predictors – a key step in algorithm development. As stated by Wexler et al., “A particular important future direction is to decrease the level of ML and data science expertise necessary to use this type of tool” [62], in order to allow a wider public to participate in discussions surrounding the fairness of AI.
2.3 Visualisation and Interpretation The HCI community has repeatedly shown that the way informa-tion is presented can signifcantly alter the perceptions of infor-mation consumers. Related to the topic of explanations, Wang et al. empirically compare the efectiveness of infographics and ‘data comics’ (a sequence of panels in which a story is conveyed through text and data visuals) [61]. Their results highlight that data comics were not only perceived as more engaging and enjoyable but also increased understanding among the readers. Sultanum et al. found that clinicians had difculty obtaining meaningful information from extensive text-based patient records, and introduced a text-visualisation system which allowed clinicians to more efciently navigate to the required information [52].
On the topic of decision-support algorithms, Cheng et al. studied the ability of diferent explanation interfaces to increase people’s understanding of a university admissions decision system [11]. Through a factorial design, the authors explore the efect of inter-active vs non-interactive explanations and white-box vs black-box explanations. Their results indicate that participants’ objective un-derstanding of the algorithm increased both in the interactive and white-box explanations. Interestingly, participants self-reported un-derstanding did not increase in the white-box scenario, which the authors argue is the result of increased complexity and/or required cognitive load. Furthermore, an increased understanding did not result in an increase in the participants’ trust towards the algo-rithm [11]. Shen et al. explored alternative designs of confusion matrices to support people’s understanding of an algorithm’s per-formance, ultimately identifying fow charts as the most useful due to their ability to point out the direction of reading [49].
Despite the literature highlighting that diferent visualisation techniques signifcantly impact perception and understanding among individuals, the efect of data presentation on the fairness assess-ment of algorithm predictors has not been previously studied. Here, we explore two information presentation techniques used in algo-rithmic assessment; a text-based visualisation and a scatterplot.
3 METHOD In this paper, we set out to evaluate the efect of information pre-sentation on participants’ fairness perceptions and their decision to include or exclude a predictor for an algorithm. We present a mixed-model experimental design, with visualisation techniqe (text-based or scatterplot) and display of outcome variable (shown or not shown) as between-subjects factors, and scenario (recidi-vism or lending) and predictor type (demographic, validation, and

Figure 1: Overview of visualisation techniqe and display of outcome variable as shown to participants.
domain) as within-subjects factors. We frst discuss the between-subject factors introduced in the study. • Visualisation techniqe. We analysed two visualisation tech-niques. The frst technique was a text-based visualisation in which the data was summarised across three sub-groups (Fig-ure 1-C & D), as used e.g. by Yu et al. [65]. The second technique was a scatterplot based visualisation (Figure 1-A & B). Scatter-plots visualise the spread of data points across two variables and are frequently employed in algorithmic inspection applica-tions [42, 62]. Further, scatterplots have been used in other HCI work, including studies involving university students [10] and crowdworkers [28]. Despite the frequent occurrence of scatter-plots in ML inspection applications – including those presented to non-experts [65], literature shows that people are often un-able to correctly interpret scatterplots and the (strength of the) relationship between the two variables displayed [12, 50]. It is therefore critical to understand whether the use of scatterplots in the context of algorithmic fairness is appropriate for novice users. Participants were able to navigate between diferent groups within the data (e.g., race, length of loan duration – see Table 1) in both visualisation techniques.
• Display of outcome variable. Presenting the outcome variable may infuence participants’ decision making, as participants may, for instance, reason that a certain group over- or under-performs
in comparison with other groups. We therefore presented either all data points in one overview (i.e., no outcome variable – Fig-ure 1-B & D), or presented the data as split into two views; one view containing all ‘positive’ outcomes (e.g., did pay back loan) and one view containing all ‘negative’ outcomes (e.g., did not pay back loan). The outcome variable was clearly indicated above each respective data presentation (Figure 1-A & C). Wang et al. identifed that participants evaluate algorithms as less fair when they are biased against a certain demographic [60], but the efect of including the outcome variable during predictor assessment has not been previously assessed [56].
In addition to these between-subject manipulations, we intro-duced two within-subject variables. First, we included two distinct scenarios in order to evaluate whether the presented scenario af-fects participant judgements; one scenario on recidivism and one scenario on loan approval. Second, for each of the two aforemen-tioned scenarios we introduced a total of fve algorithmic predictors – categorised into three predictor typesdemographic, domain-specifc, and validation). The order of scenario presentation was counterbalanced, and the order of the predictors was randomised within each scenario. As such, participants frst completed one sce-nario in full before they proceeded to the second scenario. We next detail the scenarios and their respective predictors.

3.1 Scenarios & PredictorsTo support the external validity of the study, we made use of two ex-isting real-world datasets. The frst dataset is the COMPAS dataseton recidivism1, as obtained by ProPublica [2] and used in vari-ous HCI studies [21, 56, 65]. This dataset contains information oncriminal defendants of Broward County, Florida, including their de-mographic information, prior criminal activities, as well as ground-truth information on whether or not the defendant went on tocommit another crime within two years (i.e., the outcome variable).Following the same procedure as outlined by ProPublica [2], weexcluded incomplete records, ordinary trafc ofences (no jail time),and ofenders who were released from a correctional facility lessthan two years ago.
The second dataset contains data on lending, as published by apeer-to-peer lending company2, and is frequently used as a casestudy in machine learning research [30, 41]. The dataset containsinformation on the amount of money applied for, the status of theloan, as well as limited details on the loan applicant. The datasetcovers the period 2007–2015 and consists of over two million loans.Our frst step was to flter out loans that were still ongoing, leavingus with a binary outcome variable: loans that were either fully paidback or failed to be paid back (defaulted or written of).
Our selection is based on three criteria. First, an identical dis-tribution of predictor types (demographic, domain-specifc, andvalidation) between scenarios. Second, variables as similar as possi-ble (e.g., we could use ‘sex’ in both datasets and created ‘age’ forthe lending dataset). Given the limited number of demographicvariables in the lending dataset (e.g., no information on the appli-cant’s age), we fabricated the lenders’ age by scaling the reportedannual income of lenders (excluding outliers) to an age variableranging from 18 to 86. Furthermore, we mapped the dataset’s infor-mation on the lender’s state to one of four regions as defned bythe United States Census Bureau (i.e., Northeast, Midwest, South,West). Third, a consistent presentation of the variables limited usto continuous variables for the predictor variable and categoricalvariables for the group flter. Therefore, not all predictors from theLending dataset could be included. Following recommendationsfrom earlier work [20, 34, 56], we generated fabricated predictorsfor both datasets to be used as ‘explicitly verifable’ predictors. Wepresent an overview of the variables selected in Table 1. For con-sistency in size between the two scenarios, we randomly sampled5000 records of each dataset.
3.2 Participants & ProcedureParticipants were recruited through Prolifc Academic. To ensuresufcient response quality, we restricted participation to crowd-workers with an acceptance rate of 95% or above. Furthermore,we limited our study sample to participants with a US nationality.Although a wider selection of nationalities would allow for a moreglobal perspective, this restriction aligns with the characteristicsof the datasets. After accepting the task, participants were routedto an online website with an explanation of the task and a shortintroduction to decision-making algorithms by use of an example.Participants received a predetermined amount of money for the full
1Data available at https://github.com/propublica/compas-analysis/.2Data available at https://www.lendingclub.com/info/statistics.action.
completion of the task. Following the US minimum wage of $7.25 per hour at the time of our study and an expected completion time of 20 minutes (as based on our pilot data), we compensated each participant with $3.
To minimise type II errors, we defned the number of partici-pants based on a power calculation using G*Power [18]. Given the exploratory nature of our investigation, we used medium-to-large efect sizes (f 2 = 0.2), an alpha level of 0.05, and a power of 0.8, in line with established methodological recommendations [23]. From our a priori multiple linear regression model with four predictors, the minimum sample size required is 65 participants. To be conser-vative (foreseeing dropouts) and to uphold reliability, we ended up recruiting 80 participants.
Upon accepting the task in the Prolifc crowdsourcing platform, participants were assigned to one of four conditions – following the aforementioned study design. We limited participants from taking part in our experiment more than once, ensuring that each condition consists of twenty unique participants. Each participant completed the following four tasks:
(1) Introduction. The landing page explained the task at hand, including a fctional example of an algorithmic decision appli-cation. At this stage, participants provided their demographic information, which was used to inform the default options for the demographic predictors in task 3.
(2) Background information. Participants frst read a high-level explanation of how algorithms come to a decision. Furthermore, the two scenarios included in the experiment (i.e., recidivism and lending) were introduced. To assess whether participants understood and paid attention while reading this relatively short (~300 words) background information, we included two multiple-choice questions. Participants were allowed to continue with, and receive compensation for, the task regardless of the correct-ness of their answers.
(3) Predictor assessment. For the main task of the experiment, participants were asked to assess a total of ten ‘predictor’– ‘group flter’ pairs (see Table 1). For each predictor variable, participants could explore the data across a set of groups. The default display for the race and sex group flters was deter-mined by the participant’s demographic information (e.g., a male participant will frst see the data of male loan applicants). For the remaining group flter confgurations, a consistent de-fault group was selected. Participants were asked to assess and subsequently motivate whether a predictor variable should be included (binary yes/no decision) in an algorithm predicting either the risk of not paying back a loan or a convicts’ chance of recidivism – as dependent on the current scenario. Furthermore, participants assessed the fairness of including this predictor in an algorithm for the given scenario (scale 0–100%). To recap, for each assessed predictor we kept track of the predictor type, visualisation techniqe, display of outcome variable, and scenario. This allowed us to later model the efect of these parameters on participants decision making.
(4) Graph comprehension & completion. Finally, we assessed the graph literacy of all participants using the Short Graph Literacy (SGL) scale [44]. The SGL is a validated questionnaire consisting of four questions – each including a visual graph.

Recidivism dataset Lending dataset Predictor type Predictor variable Group flter Predictor variable Group flter Age Race Age US Region Demographic Age Sex Age Sex Demographic Nr. prior convictions Degree of charge Loan amount Loan duration Domain-specifc Nr. prior convictions Violent ofence Loan amount Home ownership Domain-specifc Height Dominant hand Weight Vegetarian Validation
Table 1: Overview of predictor variables and the respective group flter through which the display of the data is controlled. The last column shows the predictor type of the predictor variables across the two scenarios.
Furthermore, we collected the participants’ overall perceptions with regards to their decision confdence and perspectives on end-user involvement in algorithm development.
4 RESULTS The average age of our participants was 29.05 years old (SD = 8.06), ranging between 18 and 60 years of age. We provide an overview of the gender, race, and educational attainment of our participant sample in Table 2, and augment this information with data from the 2019 US Census [54, 55]. Our participants’ demographics are closely aligned with the US census. In terms of participants’ race, we see an under-representation of African-Americans and an over-representation of Asians in comparison with the US population – this aligns with prior analysis of the crowdworker population [5].
First, we assessed participants’ answers on the two questions intended to verify whether participants had read and understood
Factor N % sample US Census
Gender
Women Men Non-binary Prefer not to disclose
Race
39 39 1 1
48.8% 48.8% 1.3% 1.3%
49.0% 51.0%
--
African-American Asian Caucasian Hispanic Native American Other Prefer not to disclose
Educational attainment
4 9 48 12 0 6 1
5.0% 11.3% 60.0% 15.0%
0% 7.5% 1.3%
13.4% 5.9% 60.4% 18.3% 1.5% 2.7%
-
Primary education Secondary edu. or high school Bachelor or vocational degree Master’s degree Doctorate or higher
2 26 38 12 2
2.5% 32.5% 47.5% 15.0% 2.5%
8.4% 28.3% 31.1% 10.2% 1.8%
Table 2: Overview of participants’ demographic factors.
the background information provided. For the frst question (‘Al-gorithms calculate the risk of an individual by;’), we found 14 par-ticipants that answered incorrectly. For the second question (‘A recidivist is someone who;’), we found 13 participants who answered incorrectly. Five participants answered incorrectly on both ques-tions, indicating a poor understanding, low participant efort, or automated eforts. These participants were therefore excluded from further analysis, leaving a total of 75 participants. Given this fnal sample size, we report a post-hoc power of 0.867.
Average completion time for the ten primary questions was 18.91, 24.10, 22.57, and 18.77 minutes for the ‘Scatterplot - Outcome’, ‘Scatterplot - No outcome’, ‘Text - Outcome’, and ‘Text - No outcome’ conditions respectively. A two-way ANOVA, using type-III sums of squares to account for the slight imbalance in group size following the aforementioned participant removal, was conducted to examine the efects of visualisation techniqe and display of outcome variable on completion time. There was no statistically signifcant interaction between the efects of visualisation type and inclusion of outcome variable (F (1,71) = 3.243, p = 0.08). Simple main efects analysis also did not show a signifcant efect for visualisation type (p = 0.13) or inclusion of outcome variable (p = 0.14).
Participants’ average graph literacy score, as assessed through the Short Graph Literacy scale (SGL) [44], was 2.77 (SD = 0.94, rang-ing from 1 to 4). This score is slightly higher than the average scores observed by the initial assessment of the SGL on a US population (score of 2.2, N = 495) [44].
4.1 Predictor Assessment In order to identify the efects of predictor type, visualisation techniqe, display of outcome variable, and scenario on the likelihood that participants believed a predictor should be included in an algorithm, we constructed a binomial (include/exclude) gen-eralised linear mixed model. The model is based on the collected participants’ responses to include or exclude the predictor vari-ables presented in Table 1. We limited our model to solely include model parameters which can be obtained without participant in-put, thereby choosing to exclude e.g. demographic factors and the participant’s assessment on the fairness of including a predictor (as recorded from 0–100%), as these factors are not known a priori. For the categorisation of predictor types, we followed the cate-gorisation shown in Table 1: demographic, domain-specifc, and validation. In order to account for variability between participants, we set participant ID as the random factor of the model. The model is constructed using the glmer function in R package lme4 [4].

Include
Predictor type (Validation) −3.92 (0.55)∗∗∗ Predictor type (Domain) −0.37 (0.35)Visualisation technique (Text) −0.82 (0.41)∗ Display of outcome variable (Yes) 0.18 (0.41)Scenario (Recidivism) 1.20 (0.34)∗∗∗ Predictor type (Validation) : Visualisation technique (Text) 1.32 (0.61)∗ Predictor type (Domain) : Visualisation technique (Text) 1.59 (0.44)∗∗∗ Predictor type (Validation) : Display of outcome variable (Yes) −0.10 (0.61)Predictor type (Domain) : Display of outcome variable (Yes) 0.51 (0.43)Scenario (Recidivism) : Visualisation technique (Text) 0.72 (0.41)Scenario (Recidivism) : Display of outcome variable (Yes) −0.93 (0.41)∗ ∗∗∗ ∗∗ ∗ p < 0.001, p < 0.01, p < 0.05
Table 3: The generalised linear model (binomial) of participants’ decision to include or exclude a predictor. For each predictor we report coefcients, standard errors (in brackets), and signifcance indicators.
A likelihood ratio test as compared to the null model showed that our logistic regression model is statistically signifcant (χ2(11) = 265.78, p < .001) [8]. Our model explains 54.1% of the variance in predictor assessment (R = 0.73, R2 = 0.54). To ensure the validity of the model, we checked for the existence of multicollinearity among the model’s parameters. We found a variance infation factor (VIF) of our parameters between 1.76 and 3.34, all below the often-used thresholds of fve or ten to detect multicollinearity [23], indicating the validity of the model. The model outcomes are summarised in Table 3, with the following reference levels; predictor type (Demo-graphic), visualisation techniqe (Scatter), display of outcome variable (No), scenario (Lending).
We discuss the signifcant predictors identifed in our model (Ta-ble 3) in more detail to obtain a better understanding of their efect. We frst present the main efects of predictor type, visualisation techniqe, and scenario, after which the signifcant interaction efects are presented.
Figure 2-A highlights the signifcant diference between Vali-dation predictors and the two remaining predictor types (Demo-graphic and Domain), with participants being substantially less likely to include a Validation predictor. This highlights the Val-idation predictors’ ability to function as an explicitly verifable
question. The main efect of the visualisation type is shown in Fig-ure 2-B. Our results highlight that participants were signifcantly more likely to include a variable when presented in text as opposed to visualised in a scatterplot presentation. The third signifcant main efect, scenario, is visualised in Figure 2-C. These results show that participants were signifcantly less likely to vote for a parameter to be included in the model in the lending scenario. Furthermore, we found that the confdence intervals are substantially narrower for the recidivism scenario as compared to the lending scenario – indicating higher levels of agreement among participants for the recidivism scenario.
Our model highlights two signifcant interactions, the frst one between predictor type and visualisation techniqe, and the second one between scenario and display of outcome variable. The interaction between predictor type and visualisation tech-niqe is shown in Figure 3-A. The signifcant interaction indi-cates that the chosen visualisation techniqe afects partici-pants’ judgement diferently between diferent predictor types. For the Domain-specifc predictors (e.g., loan amount), a text-based visualisation resulted in a higher likelihood to include the vari-able, whereas the efect is reversed for the Demographic predictors. Although the display of outcome variable is not a signifcant pre-dictor of participants’ assessment of predictor inclusion on its own,
●
●
●
0%
25%
50%
75%
100%
Demographic Validation Domain
Incl
ude
varia
ble
A. Predictor type
●
●
0%
25%
50%
75%
100%
Text Scatterplot
B. Visualisation
●
●
0%
25%
50%
75%
100%
Lending Recidivism
C. Scenario
Figure 2: Visualisation of the signifcant main efects of our linear model (Table 3), using ggefects [40].

●
●
●●
●
●
0%
25%
50%
75%
100%
Demographic Validation Domain
Incl
ude
varia
ble
● ●Text Scatterplot
A. Predictor type : Visualisation
●●
●
●
0%
25%
50%
75%
100%
Lending Recidivism
● ●No outcome Outcome
B. Scenario : Outcome
Figure 3: Visualisation of the signifcant interaction efects of our linear model (Table 3), using ggefects [40].
the interaction between the display of outcome variable and scenario is signifcant (Table 3). As shown in Figure 3-B, display-ing the outcome variable reduced the likelihood of a participant to include a parameter in the Recidivism scenario, whereas this efect is nonexistent for the Lending scenario.
4.2 Perceptions of Fairness In addition to a binary assessment of including or excluding a pre-dictor, as presented in the preceding section, we asked participants to assess the fairness of each algorithmic predictor on a scale from 0–100%. As expected, this perceived fairness is closely aligned to the participants’ decision to include/exclude a predictor – with a mean perceived fairness of 25.0% (SD = 28.5) on the predictors participants voted to exclude, and 76.9% (SD = 23.1) on predictors voted to be included. A Mann-Whitney rank-sum test confrmed that the distributions of fairness perceptions (as rated from 0–100%) difered signifcantly between predictors voted to include versus predictors voted to exclude (U = 13765, p < 0.001).
Next, we explored the efect of the participants’ educational attainment on their perceptions of fairness. Given the limited oc-currence of participants with a highest level of education as ‘Pri-mary school’ (2) or ‘Doctorate or higher’ (2) we excluded these
four participants from our analysis. A Kruskal-Wallis rank-sum test showed a signifcant efect of attained education level on perceived fairness (χ2(2) = 15.59, p < 0.001), with the average level of per-ceived fairness decreasing with an increase in attained education. A pairwise comparison using Wilcoxon rank-sum test showed a signifcant diference between ‘Secondary education or high school’ and ‘Bachelor or vocational degree’ (p = 0.006) and between ‘Sec-ondary education or high school’ and ‘Master’s degree’ (p < 0.001). Figure 4 shows these diferences in a density plot. A Kruskal-Wallis test between participant graph literacy score and their perceived fairness was signifcant (χ2(3) = 7.843, p = 0.049), with average fairness perceptions decreasing as graph literacy score increases (mean values of 0.65, 0.62, 0.56, and 0.55 for graph literacy scores 1 to 4 respectively).
Subsequently, we analysed the efect of gender on the partici-pants’ perceived fairness. Our sample consists of one non-binary participant, and one participant who did not wish to disclose their gender – we excluded these participants from our analysis due to their limited representation in our sample. Using a Mann-Whitney test, we found a signifcant diference between the perceived predic-tor fairness by women (mean = 52.9, SD = 34.3) and men (mean = 65.3,
0.0
0.4
0.8
1.2
1.6
0% 25% 50% 75% 100%Perceived fairness
Den
sity
Secondary education or high schoolBachelor or vocational degreeMaster's degree
0.0
0.4
0.8
1.2
1.6
0% 25% 50% 75% 100%Perceived fairness
Den
sity
WomenMen
Figure 4: Fairness ratings by educational attainment (left) and sex (right). Vertical lines indicate mean group values.

Effect of Information Presentation on Fairness Perceptions of Machine Learning Predictors CHI ’21, May 8–13, 2021, Yokohama, Japan
I had all the required information.
100 50 0 50 100
Scatterplot − Outcome
Scatterplot − No outcome
Text − Outcome
Text − No outcome
Percentage
I felt confident in my decisions.
100 50 0 50 100Percentage
I had all the required information.
100 50 0 50 100
Master's degree
Bachelor or vocational degree
Secondary education or high school
Percentage
I felt confident in my decisions.
100 50 0 50 100Percentage
Strongly disagree Disagree Neutral Agree Strongly agree
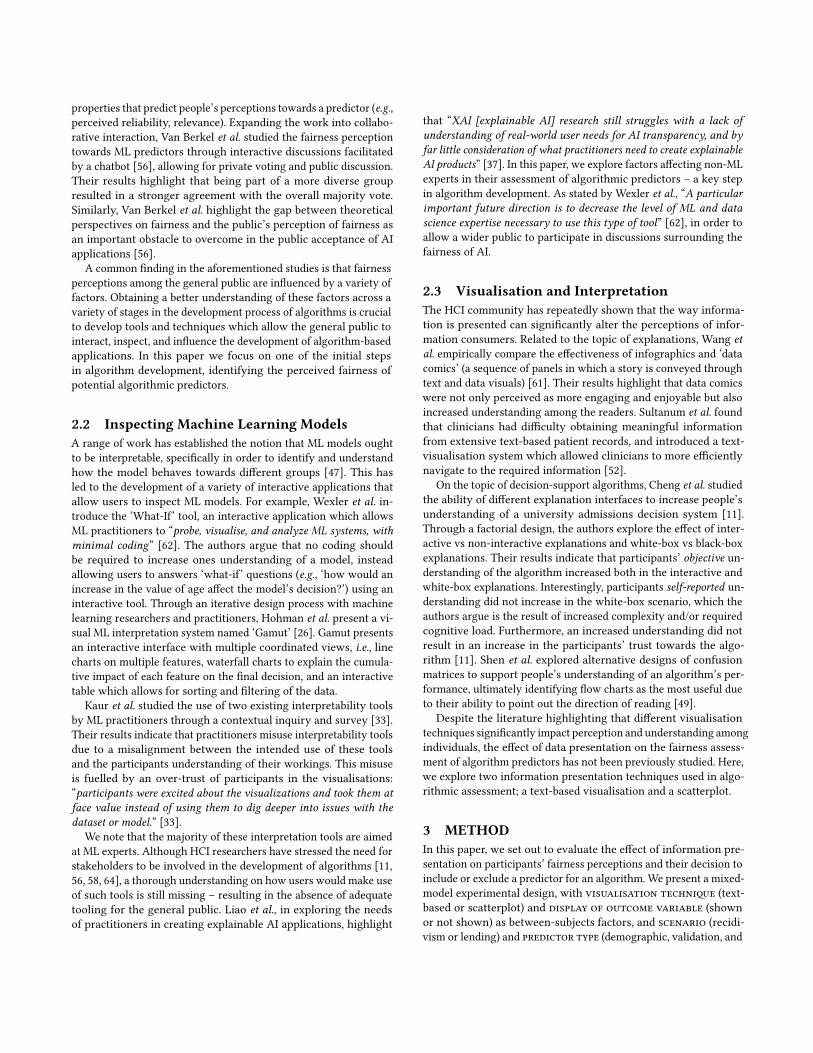
Figure 5: Overview of Likert-responses as split per condition (top) and educational attainment (bottom).
SD = 35.4), U = 13765, p < 0.001, with women reporting signifi-cantly lower perceived fairness levels. We did not find a significantdifference between the women and men in our sample and theireducational attainment (χ2(4) = 2.547, p = 0.636).
4.3 Information Demands and ConfidenceLastly, we present participants’ responses to the Likert statements‘I had all the required information to assess the fairness of the algo-rithm.’ and ‘I feel confident in my decisions’, as collected in the finalstage of the study. Figure 5 presents participants’ answers as splitper condition and level of educational attainment. These resultsshow that participants were largely divided over the fact whetherall required information was presented, and that this division ismore or less equal between conditions. Participants who respondednegatively to the question commented primarily on a lack of back-ground information presented. For example, one participant stated:
“What were people getting these loans for? Some loansand debt are relatively stable and others aren’t. Alsowhat else was included in the algorithm? Anythingbeyond the factors that were discussed? I might have hada different opinion of whether certain factors belongedin the algorithm if I knew what other factors were beingtaken into consideration.” [P56]
Information was presented to participants per predictor, whereasseveral participants requested a wider overview of participant data:
“Hyperfocusing on just one aspect meant that I wasmiss-ing the whole picture, and that meant certain groupswere always going to be unfairly evaluated.” [P60]
In terms of decision confidence, participants leaned towards self-assurance in all conditions, with the exception of the ‘Scatterplot- Outcome’ combination. Participants in this condition dispropor-tionately commented on the difficulty of interpreting the presentedinformation, such as:
“The fact that the graphs were incredibly difficult forme to decipher.” [P13]
“I wasn’t sure if I was reading the graphs entirely cor-rectly.” [P05]
One of the participants which expressed high confidence in theirdecisions stated to find confidence in their existing prejudices:
“Prior experience with individuals in some of the groupsoutlined.” [P33]
In line with the aforementioned fairness perceptions (Figure 4),we found that those with higher educational attainment express astronger need for additional information and generally have lowerconfidence in their decisions.
5 DISCUSSIONThrough the presented studywe aim to understand the effect of datapresentation on people’s fairness perceptions. As an individual’sperception of fairness cannot be classified as inherently ‘right’ or‘wrong’, our work does not aim to identify one optimal presentationtechnique which captures the fairest outcomes. Instead, our work isbased on the call-to-action to the Computer Science community toactively involve the general public in the decision making processof new AI systems [13, 51, 56, 64]. Building on this call and theongoing efforts towards creating interactive tools for inspectingalgorithmic predictors and models [33, 38, 62], we explore the effectof data visualisation technique (text vs scatterplot) and providinginformation on the outcome variable (split data by outcome vari-able vs joint data presentation) on perceptions of ML predictors.From a wider perspective, a better understanding of the public’sperceptions and interpretations of fairness are critical in supportingboth an informed debate between the public and technologists, aswell as giving a voice to non-ML experts in the design of futureapplications.
Following prior work on fairness perceptions [56], we introducea ‘verifiable’ predictor pair in each scenario (‘height–dominanthand’ and ‘weight–vegetarian’) to assess participants’ ability toidentify and exclude these predictors. Our results show that thesepredictors are largely excluded (Figure 2-A) – providing confidence
Figure 5: Overview of Likert-responses as split per condition (top) and educational attainment (bottom).
SD = 35.4), U = 13765, p < 0.001, with women reporting signif-cantly lower perceived fairness levels. We did not fnd a signifcant diference between the women and men in our sample and their educational attainment (χ2(4) = 2.547, p = 0.636).
4.3 Information Demands and Confdence Lastly, we present participants’ responses to the Likert statements ‘I had all the required information to assess the fairness of the algo-rithm.’ and ‘I feel confdent in my decisions’, as collected in the fnal stage of the study. Figure 5 presents participants’ answers as split per condition and level of educational attainment. These results show that participants were largely divided over the fact whether all required information was presented, and that this division is more or less equal between conditions. Participants who responded negatively to the question commented primarily on a lack of back-ground information presented. For example, one participant stated:
“What were people getting these loans for? Some loans and debt are relatively stable and others aren’t. Also what else was included in the algorithm? Anything beyond the factors that were discussed? I might have had a diferent opinion of whether certain factors belonged in the algorithm if I knew what other factors were being taken into consideration.” [P56]
Information was presented to participants per predictor, whereas several participants requested a wider overview of participant data:
“Hyperfocusing on just one aspect meant that I was miss-ing the whole picture, and that meant certain groups were always going to be unfairly evaluated.” [P60]
In terms of decision confdence, participants leaned towards self-assurance in all conditions, with the exception of the ‘Scatterplot - Outcome’ combination. Participants in this condition dispropor-tionately commented on the difculty of interpreting the presented information, such as:
“The fact that the graphs were incredibly difcult for me to decipher.” [P13] “I wasn’t sure if I was reading the graphs entirely cor-rectly.” [P05]
One of the participants which expressed high confdence in their decisions stated to fnd confdence in their existing prejudices:
“Prior experience with individuals in some of the groups outlined.” [P33]
In line with the aforementioned fairness perceptions (Figure 4), we found that those with higher educational attainment express a stronger need for additional information and generally have lower confdence in their decisions.
5 DISCUSSION Through the presented study we aim to understand the efect of data presentation on people’s fairness perceptions. As an individual’s perception of fairness cannot be classifed as inherently ‘right’ or ‘wrong’, our work does not aim to identify one optimal presentation technique which captures the fairest outcomes. Instead, our work is based on the call-to-action to the Computer Science community to actively involve the general public in the decision making process of new AI systems [13, 51, 56, 64]. Building on this call and the ongoing eforts towards creating interactive tools for inspecting algorithmic predictors and models [33, 38, 62], we explore the efect of data visualisation technique (text vs scatterplot) and providing information on the outcome variable (split data by outcome vari-able vs joint data presentation) on perceptions of ML predictors. From a wider perspective, a better understanding of the public’s perceptions and interpretations of fairness are critical in supporting both an informed debate between the public and technologists, as well as giving a voice to non-ML experts in the design of future applications.
Following prior work on fairness perceptions [56], we introduce a ‘verifable’ predictor pair in each scenario (‘height–dominant

hand’ and ‘weight–vegetarian’) to assess participants’ ability toidentify and exclude these predictors. Our results show that thesepredictors are largely excluded (Figure 2-A) – providing confdencein the participants’ understanding and ability to complete the giventask of assessing algorithmic predictors.
5.1 Information PresentationThe presentation of predictors using a text-based visualisation tech-nique, in which data was summarised into three categories, resultedin an increased likelihood of predictors being included as comparedto a scatterplot-based visualisation technique – despite the under-lying data being identical. The literature on risk management has along history of studying the efects of information presentation onparticipant risk perceptions. For example, Gibson et al. found thata stacked bar graph improved participants’ risk understanding ascompared to textual information [19]. Similarly, Tait et al. foundthat pictographs were found to signifcantly increase health riskunderstanding as compared to text and tables [53], regardless ofthe participants’ numerical literacy. Contrasting these fndings toour results, in which a text-based presentation resulted in morevariables being included (i.e., higher perceived levels fairness), wehypothesise that the visual presentation included in the scatterplotsmore clearly communicated diferences between groups (e.g., race,loan duration) within predictors. Although our work was limitedto two visualisation techniques currently used in the Human-AI lit-erature, we consider this an opportunity for future work to explorevisualisation techniques not yet widely considered in AI applica-tions. For example, the use of pictographs, as studied by Tait etal. [53], might be more easily interpretable.
Our results also show that participants felt signifcantly lessconfdent about their decisions in the condition in which data wasvisualised in a scatterplot while data was simultaneously split byoutcome variable – this efect is not apparent in any other combina-tion. Work by Cheng et al. highlights that white-box explanationsdo not increase participants self-reported level of understanding ascompared to a black-box explanation [11] (although their objectiveunderstanding does increase), which the authors attribute to in-creased complexity and required cognitive load. Our results indicatethat a similar efect appears in relation to participants’ confdence,with our most complex design (Scatterplot - Outcome) showinglower levels of decision making confdence (Figure 5). We argue thatthis particular combination (Scatterplot - Outcome) may thereforeexceed the capacity of study participants to fully comprehend theinformation shown.
5.2 Education and GenderOur results highlight that participants with higher educationalattainment signifcantly rated predictors as being less fair (Figure 4).Participants with a higher level of education also felt less confdentin their decisions and were less likely to agree with the statementthat they had all the required information to assess the fairness ofthe predictor. These results point in the direction of the well-knownDunning–Kruger efect [35]. In their seminal paper, Dunning andKruger state that “those with limited knowledge in a domain sufer adual burden: Not only do they reach mistaken conclusions and makeregrettable errors, but their incompetence robs them of the ability
to realize it” [35]. Therefore, future work which aims to involve a wider study population (in contrast to typically highly-educated AI developers) should take note of the fact that a large subset of their sample will not consider the fact that additional information might be required to draw conclusions. Researchers should, therefore, consider to explicitly indicate which information is missing when presenting information to participants.
Furthermore, we found the gender diference in perceived fair-ness of predictors to be particularly noteworthy given the current state of the software industry. According to data from the US Bureau of Labor Statistics, women compose only 26% of the US computing workforce population in 2019 [43]. It is therefore probable that AI systems are primarily developed by men, while our results highlight that the fairness perspectives of women difer signifcantly from that of men. This is refected in prior work in Economics, with e.g. Andreoni & Vesterlund fnding empirical evidence for diferences in altruistic behaviour between men and women under diferent circumstances [1]. We, therefore, align ourselves with earlier calls that expressed the need to collect opinions from a diverse partici-pant sample when assessing perceptions of AI systems [45, 56, 66]. Pierson states; “If demographics predict how we believe algorithms should behave, we need our algorithm designers to be more demo-graphically representative if algorithms are to serve the will of the whole population” [45]. Although we support such endeavours, an analysis by Wang et al. indicates that the gender gap in Computer Science research will not reach parity between men and women until 2137 under the current developments [59], if such parity will ever be reached at all. As such, we consider the input of a more diverse participant sample, as we are able to achieve through the applied method (Table 2), as a requirement when assessing the fairness of algorithmic systems. This aligns with prior work by Williams and her call for gender-neutral software [63].
5.3 Studying AI Perceptions Correll argues that the HCI community has a moral duty to commu-nicate the algorithmic decision-making process to those impacted by the algorithm, stating that current work on assessing and in-terpreting ML models is primarily focused on ML practitioners; “An ethical concern is that we are therefore empowering the creators of ML models, but are not empowering the people afected by these models.” [13]. Although our current study is focused solely on pre-dictor selection, it highlights a number of recommendations for future research into the wider area of AI perceptions among non-ML experts. To support further research into this critical domain, we summarise our recommendations below;
• Limit presentation complexity. Our results show that partici-pant confdence is reduced when presented with overly complex information. As such, we recommend against the direct use of machine learning terminology in studies involving participants from a non-ML background (e.g., we fnd it unlikely that terms such as ‘disparity’ can be understood by the general public [65]). Prior work further points to a better understanding of risks us-ing graphical visualisations rather than a text-based presenta-tion [19, 53], opening the possibility for e.g. pictograph-based communication.

• Tailor information presentation to target audience. Follow-ing the above recommendation, we stress that information pre-sentation should be adjusted to the target audience to ensure thatthe user can fully comprehend the information presented. Assuch, the same style of information presentation used by ML/AIexperts cannot simply be applied to novice users or members ofthe general public.
• Validate results across scenarios/datasets. While prior workhas typically focused on one scenario or dataset at a time (seee.g., [22, 56, 65]), our results show that the presented scenariohas a signifcant efect on the participants’ fairness assessments.Therefore, we recommend studies which aim to make a method-ological contribution (such as ours) to validate fndings across atleast two distinct scenarios.
• Include verifable predictors. Following earlier work and rec-ommendations on including verifable questions [20, 34, 56], weincluded two pairs of verifable predictors. These predictors wereexcluded by a large majority of participants at a signifcantlyhigher rate than other types of predictors (Figure 2). By includ-ing verifable predictors researchers can assess whether the taskwas sufciently understood by participants.
• Instruct and assess participants. Although our goal was ex-plicitly to widen data collection to non-ML experts, we decidedto exclude fve participants due to their incorrect answers on thebackground questions – following prior work by Yu et al. [65].We argue that a basic understanding of the study concepts isrequired to provide reliable input, and it is therefore the respon-sibility of the researchers to carefully instruct participants on theproblem at hand. While it is impossible to state whether the ex-cluded participants were unable to comprehend our explanation,unmotivated to read the background text, or were perhaps auto-mated survey completion bots, we consider all three as harmfulto data collection. Therefore, we recommend excluding partici-pants based on a short assessment of their understanding of thecore concepts of the study following a succinct explanation.
We publicly release the source code of our study application toenable others to replicate and extend our work3.
5.4 LimitationsWe recognise several limitations in our work that should be consid-ered when interpreting the presented results. First, our participantswere presented with either a scatterplot or text-based presentationof the predictor variable. Numerous other visualisation techniquesexist, and they are likely to result in a diferent efect on partici-pants’ fairness perceptions. Future work may assess the efect ofother visualisation techniques. Second, the presented scenarios (i.e.,recidivism, lending) covered distinctly diferent topics with a dis-parate predictor data distribution. It is therefore unsurprising thatparticipants assess the fairness of the individual predictors difer-ently between scenarios, and the inclusion of additional scenarioswould have likely revealed further diferences. Although our resultshighlight similarities in the efects of predictor type and visuali-sation technique, we particularly stress the need for researchersto consider multiple scenarios when assessing human-AI assess-ment tools. Third, our study focused solely on predictor selection3https://github.com/nielsvanberkel/Information-Presentation-Fairness
– one of the several steps in the development of an AI algorithm. We, therefore, call on the HCI research community to expand the study of methodological considerations of non-expert involvement to other phases of AI development. Finally, we note that not one ‘public perception’ of fairness exists, and that results are likely to difer when studying diferent populations. Our study was limited to American crowdworkers, and prior work shows that perceptions towards e.g. AI behaviour and fairness difer signifcantly between geographical and cultural clusters [3, 57].
6 CONCLUSION HCI research and practice builds on a longstanding tradition of end-user involvement. With an increasing focus on Human-AI in-teraction, we must ensure that the methods and tools used for assessing fairness perceptions provide researchers and practition-ers with reliable insights. Through a mixed-model study design, we found that the frequently used scatterplot visualisation technique led to a signifcantly lower fairness perception as compared to a text-based visualisation. Presentation of the outcome variable (i.e., splitting the presented dataset) did not result in a main efect on predictor assessment but did show an interaction efect with the presented scenario. Further, we found a signifcant diference in fair-ness assessments between the two scenarios, highlighting the need for method-based studies to consider more than one scenario when assessing the efect of e.g. data presentation on perceived fairness. Finally, gender and educational attainment signifcantly afected perceived fairness, with women and higher educated participants perceiving the presented predictors as less fair. This highlights the opportunities and needs for future work towards ensuring acces-sible and educational AI evaluation tools in order to reach a wide and diverse segment of the population.
ACKNOWLEDGMENTS We would like to express our gratitude to our study participants and the reviewers of this manuscript. This research is partially funded by the GenZ strategic profling theme at the University of Oulu, supported by the Academy of Finland (project number 318930).
REFERENCES [1] James Andreoni and Lise Vesterlund. 2001. Which is the Fair Sex? Gender
Diferences in Altruism. The Quarterly Journal of Economics 116, 1 (2001), 293– 312. https://doi.org/10.1162/003355301556419
[2] Julia Angwin, Jef Larson, Surya Mattu, and Lauren Kirchner. 2016. Machine Bias: There’s Software Used Across the Country to Predict Future Criminals. And it’s Biased Against Blacks. Retrieved March 11, 2020 from https://www.propublica. org/article/machine-bias-risk-assessments-in-criminal-sentencing
[3] Edmond Awad, Sohan Dsouza, Richard Kim, Jonathan Schulz, Joseph Henrich, Azim Sharif, Jean-François Bonnefon, and Iyad Rahwan. 2018. The Moral Ma-chine experiment. Nature 563, 7729 (2018), 59. https://doi.org/10.1038/s41586-018-0637-6
[4] Douglas Bates, Martin Mächler, Ben Bolker, and Steve Walker. 2015. Fitting Linear Mixed-Efects Models Using lme4. Journal of Statistical Software 67, 1 (2015), 1–48. https://doi.org/10.18637/jss.v067.i01
[5] Adam J. Berinsky, Gregory A. Huber, and Gabriel S. Lenz. 2012. Evaluating Online Labor Markets for Experimental Research: Amazon.com’s Mechanical Turk. Political Analysis 20, 3 (2012), 351–368. https://doi.org/10.1093/pan/mpr057
[6] Richard Berk, Hoda Heidari, Shahin Jabbari, Michael Kearns, and Aaron Roth. 2018. Fairness in Criminal Justice Risk Assessments: The State of the Art. Sociolog-ical Methods & Research (2018), 1–42. https://doi.org/10.1177/0049124118782533
[7] Reuben Binns, Max Van Kleek, Michael Veale, Ulrik Lyngs, Jun Zhao, and Nigel Shadbolt. 2018. “It’s Reducing a Human Being to a Percentage”: Perceptions of Justice in Algorithmic Decisions. In Proceedings of the 2018 CHI Conference

on Human Factors in Computing Systems (CHI ’18). Association for Computing Machinery, 1–14. https://doi.org/10.1145/3173574.3173951
[8] Benjamin M. Bolker, Mollie E. Brooks, Connie J. Clark, Shane W. Geange, John R. Poulsen, M. Henry H. Stevens, and Jada-Simone S. White. 2009. Generalized linear mixed models: a practical guide for ecology and evolution. Trends in Ecology & Evolution 24, 3 (2009), 127–135.
[9] Toon Calders and Sicco Verwer. 2010. Three naive Bayes approaches for discrimination-free classifcation. Data Mining and Knowledge Discovery 21, 2 (2010), 277–292. https://doi.org/10.1007/s10618-010-0190-x
[10] Helen Chen, Sophie Engle, Alark Joshi, Eric D. Ragan, Beste F. Yuksel, and Lane Harrison. 2018. Using Animation to Alleviate Overdraw in Multiclass Scatterplot Matrices. In Proceedings of the 2018 CHI Conference on Human Factors in Computing Systems (CHI ’18). Association for Computing Machinery, 1–12. https://doi.org/10.1145/3173574.3173991
[11] Hao-Fei Cheng, Ruotong Wang, Zheng Zhang, Fiona O’Connell, Terrance Gray, F. Maxwell Harper, and Haiyi Zhu. 2019. Explaining Decision-Making Algorithms through UI: Strategies to Help Non-Expert Stakeholders. In Proceedings of the 2019 CHI Conference on Human Factors in Computing Systems (CHI ’19). Association for Computing Machinery, 1–12. https://doi.org/10.1145/3290605.3300789
[12] William S Cleveland, Persi Diaconis, and Robert McGill. 1982. Variables on scatterplots look more highly correlated when the scales are increased. Science 216, 4550 (1982), 1138–1141. https://doi.org/10.1126/science.216.4550.1138
[13] Michael Correll. 2019. Ethical Dimensions of Visualization Research. In Proceed-ings of the 2019 CHI Conference on Human Factors in Computing Systems (CHI ’19). Association for Computing Machinery, 1–13. https://doi.org/10.1145/3290605. 3300418
[14] Jefrey Dastin. 2018. Amazon scraps secret AI recruiting tool that showed bias against women – Reuters. https://www.reuters.com/article/us-amazon-com-jobs-automation-insight/amazon-scraps-secret-ai-recruiting-tool-that-showed-bias-against-women-idUSKCN1MK08G
[15] Cynthia Dwork, Moritz Hardt, Toniann Pitassi, Omer Reingold, and Richard Zemel. 2012. Fairness through Awareness. In Proceedings of the 3rd Innovations in Theoretical Computer Science Conference (ITCS ’12). Association for Computing Machinery, 214–226. https://doi.org/10.1145/2090236.2090255
[16] Sophie Emerson, Ruairí Kennedy, Luke O’Shea, and John O’Brien. 2019. Trends and applications of machine learning in quantitative fnance. In 8th International Conference on Economics and Finance Research.
[17] Ziv Epstein, Gordon Pennycook, and David Rand. 2020. Will the Crowd Game the Algorithm? Using Layperson Judgments to Combat Misinformation on So-cial Media by Downranking Distrusted Sources. In Proceedings of the 2020 CHI Conference on Human Factors in Computing Systems (CHI ’20). Association for Computing Machinery, 1–11. https://doi.org/10.1145/3313831.3376232
[18] Franz Faul, Edgar Erdfelder, Axel Buchner, and Albert-Georg Lang. 2009. Sta-tistical power analyses using G*Power 3.1: Tests for correlation and regres-sion analyses. Behavior Research Methods 41, 4 (2009), 1149–1160. https: //doi.org/10.3758/BRM.41.4.1149
[19] Jacqueline MacDonald Gibson, Aimee Rowe, Eric R. Stone, and Wandi Bruine de Bruin. 2013. Communicating Quantitative Information About Unexploded Ord-nance Risks to the Public. Environmental Science & Technology 47, 9 (2013), 4004–4013. https://doi.org/10.1021/es305254j
[20] Jorge Goncalves, Denzil Ferreira, Simo Hosio, Yong Liu, Jakob Rogstadius, Hannu Kukka, and Vassilis Kostakos. 2013. Crowdsourcing on the Spot: Altruistic Use of Public Displays, Feasibility, Performance, and Behaviours (UbiComp ’13). Association for Computing Machinery, New York, NY, USA, 753–762. https: //doi.org/10.1145/2493432.2493481
[21] Nina Grgić-Hlača, Christoph Engel, and Krishna P. Gummadi. 2019. Human Decision Making with Machine Assistance: An Experiment on Bailing and Jailing. Proceedings of the ACM on Human Computer Interaction 3, CSCW, Article 178 (2019), 25 pages. https://doi.org/10.1145/3359280
[22] Nina Grgić-Hlača, Elissa M. Redmiles, Krishna P. Gummadi, and Adrian Weller. 2018. Human Perceptions of Fairness in Algorithmic Decision Making: A Case Study of Criminal Risk Prediction. In Proceedings of the 2018 World Wide Web Conference (WWW ’18). International World Wide Web Conferences Steering Committee, 903–912. https://doi.org/10.1145/3178876.3186138
[23] Joseph F Hair, William C Black, Barry J Babin, Rolph E Anderson, and RL Tatham. 2010. Multivariate Data Analysis. Pearson.
[24] Moritz Hardt, Eric Price, and Nathan Srebro. 2016. Equality of Opportunity in Supervised Learning. In Proceedings of the 30th International Conference on Neural Information Processing Systems (NIPS’16). Curran Associates Inc., 3323–3331.
[25] Jeanne G Harris and Thomas H Davenport. 2005. Automated decision making comes of age. MIT Sloan Management Review 46, 4 (2005), 2–10.
[26] Fred Hohman, Andrew Head, Rich Caruana, Robert DeLine, and Steven M. Drucker. 2019. Gamut: A Design Probe to Understand How Data Scientists Understand Machine Learning Models. In Proceedings of the 2019 CHI Conference on Human Factors in Computing Systems (CHI ’19). Association for Computing Machinery, 1–13. https://doi.org/10.1145/3290605.3300809
[27] Simo Hosio, Andy Alorwu, Niels van Berkel, Miguel Bordallo, Mahalakshmy Seetharaman, Jonas Oppenlaender, and Jorge Goncalves. 2019. Fueling AI with
Public Displays? A Feasibility Study of Collecting Biometrically Tagged Con-sensual Data on a University Campus. In Proceedings of the ACM International Symposium on Pervasive Displays (PerDis’19). 14:1–14:7. https://doi.org/10.1145/ 3321335.3324943
[28] Jessica Hullman, Eytan Adar, and Priti Shah. 2011. The Impact of Social Infor-mation on Visual Judgments. In Proceedings of the SIGCHI Conference on Human Factors in Computing Systems (CHI ’11). Association for Computing Machinery, 1461–1470. https://doi.org/10.1145/1978942.1979157
[29] Ellora Thadaney Israni. 2017. When an Algorithm Helps Send You to Prison – New York Times. https://www.nytimes.com/2017/10/26/opinion/algorithm-compas-sentencing-bias.html
[30] Julapa Jagtiani and Catharine Lemieux. 2019. The roles of alternative data and machine learning in fntech lending: Evidence from the LendingClub consumer platform. Financial Management 48, 4 (2019), 1009–1029. https://doi.org/10.1111/ fma.12295
[31] Elizabeth E Joh. 2017. Artifcial intelligence and policing: First questions. Seattle University Law Review 41 (2017), 1139.
[32] Matthew Joseph, Michael Kearns, Jamie H Morgenstern, and Aaron Roth. 2016. Fairness in Learning: Classic and Contextual Bandits. In Advances in Neural Information Processing Systems 29, D. D. Lee, M. Sugiyama, U. V. Luxburg, I. Guyon, and R. Garnett (Eds.). 325–333.
[33] Harmanpreet Kaur, Harsha Nori, Samuel Jenkins, Rich Caruana, Hanna Wal-lach, and Jennifer Wortman Vaughan. 2020. Interpreting Interpretability: Un-derstanding Data Scientists’ Use of Interpretability Tools for Machine Learn-ing. In Proceedings of the 2020 CHI Conference on Human Factors in Comput-ing Systems (CHI ’20). Association for Computing Machinery, 1–14. https: //doi.org/10.1145/3313831.3376219
[34] Aniket Kittur, Ed H. Chi, and Bongwon Suh. 2008. Crowdsourcing User Studies with Mechanical Turk. In Proceedings of the SIGCHI Conference on Human Factors in Computing Systems (CHI ’08). ACM, 453–456. https://doi.org/10.1145/1357054. 1357127
[35] J. Kruger and D. Dunning. 1999. Unskilled and unaware of it: how difculties in recognizing one’s own incompetence lead to infated self-assessments. Journal of Personality and Social Psychology 77, 6 (1999), 1121–1134.
[36] Jef Levin. 2019. Three Ways AI Will Impact The Lending Industry – Forbes. https://www.forbes.com/sites/forbesrealestatecouncil/2019/10/30/three-ways-ai-will-impact-the-lending-industry/
[37] Q. Vera Liao, Daniel Gruen, and Sarah Miller. 2020. Questioning the AI: Informing Design Practices for Explainable AI User Experiences. In Proceedings of the 2020 CHI Conference on Human Factors in Computing Systems (CHI ’20). Association for Computing Machinery, 1–15. https://doi.org/10.1145/3313831.3376590
[38] Brian Y. Lim, Anind K. Dey, and Daniel Avrahami. 2009. Why and Why Not Explanations Improve the Intelligibility of Context-Aware Intelligent Systems. In Proceedings of the SIGCHI Conference on Human Factors in Computing Systems (CHI ’09). Association for Computing Machinery, 2119–2128. https://doi.org/10. 1145/1518701.1519023
[39] Yang Liu, Goran Radanovic, Christos Dimitrakakis, Debmalya Mandal, and David C. Parkes. 2017. Calibrated Fairness in Bandits. arXiv:cs.LG/1707.01875
[40] Daniel Lüdecke. 2018. ggefects: Tidy Data Frames of Marginal Efects from Regression Models. Journal of Open Source Software 3, 26 (2018), 772. https: //doi.org/10.21105/joss.00772
[41] Milad Malekipirbazari and Vural Aksakalli. 2015. Risk assessment in social lending via random forests. Expert Systems with Applications 42, 10 (2015), 4621– 4631. https://doi.org/10.1016/j.eswa.2015.02.001
[42] W. James Murdoch, Chandan Singh, Karl Kumbier, Reza Abbasi-Asl, and Bin Yu. 2019. Defnitions, methods, and applications in interpretable machine learning. Proceedings of the National Academy of Sciences 116, 44 (2019), 22071–22080. https://doi.org/10.1073/pnas.1900654116
[43] US Bureau of Labor Statistics. 2019. Labor Force Statistics from the Current Population Survey. https://www.bls.gov/cps/cpsaat11.htm
[44] Yasmina Okan, Eva Janssen, Mirta Galesic, and Erika A. Waters. 2019. Us-ing the Short Graph Literacy Scale to Predict Precursors of Health Behavior Change. Medical Decision Making 39, 3 (2019), 183–195. https://doi.org/10.1177/ 0272989X19829728
[45] Emma Pierson. 2017. Demographics and discussion infuence views on algorith-mic fairness. arXiv:cs.CY/1712.09124
[46] McKenzie Raub. 2018. Bots, bias and big data: artifcial intelligence, algorithmic bias and disparate impact liability in hiring practices. Arkansas Law Review 71 (2018), 529.
[47] Marco Tulio Ribeiro, Sameer Singh, and Carlos Guestrin. 2016. “Why Should I Trust You?”: Explaining the Predictions of Any Classifer. In Proceedings of the 22nd ACM SIGKDD International Conference on Knowledge Discovery and Data Mining (KDD ’16). Association for Computing Machinery, 1135–1144. https: //doi.org/10.1145/2939672.2939778
[48] Nripsuta Ani Saxena, Karen Huang, Evan DeFilippis, Goran Radanovic, David C. Parkes, and Yang Liu. 2019. How Do Fairness Defnitions Fare? Examining Public Attitudes Towards Algorithmic Defnitions of Fairness. In Proceedings of the 2019 AAAI/ACM Conference on AI, Ethics, and Society (AIES ’19). Association for

Computing Machinery, 99–106. https://doi.org/10.1145/3306618.3314248 [49] Hong Shen, Haojian Jin, Ángel Alexander Cabrera, Adam Perer, Haiyi Zhu, and
Jason Hong. 2020. Designing Alternative Representations of Confusion Matrices to Support Non-Expert Public Understanding of Algorithm Performance. In Proceedings of the ACM 2020 Conference on Computer Supported Cooperative Work (CSCW ’20). Association for Computing Machinery. https://doi.org/10.1145/ 3415224
[50] Varshita Sher, Karen G. Bemis, Ilaria Liccardi, and Min Chen. 2017. An Empirical Study on the Reliability of Perceiving Correlation Indices using Scatterplots. Computer Graphics Forum 36, 3 (2017), 61–72. https://doi.org/10.1111/cgf.13168
[51] Megha Srivastava, Hoda Heidari, and Andreas Krause. 2019. Mathematical Notions vs. Human Perception of Fairness: A Descriptive Approach to Fairness for Machine Learning. In Proceedings of the 25th ACM SIGKDD International Conference on Knowledge Discovery & Data Mining (KDD ’19). Association for Computing Machinery, 2459–2468. https://doi.org/10.1145/3292500.3330664
[52] Nicole Sultanum, Michael Brudno, Daniel Wigdor, and Fanny Chevalier. 2018. More Text Please! Understanding and Supporting the Use of Visualization for Clinical Text Overview. In Proceedings of the 2018 CHI Conference on Human Factors in Computing Systems (CHI ’18). Association for Computing Machinery, 1–13. https://doi.org/10.1145/3173574.3173996
[53] Alan R. Tait, Terri Voepel-Lewis, Brian J. Zikmund-Fisher, and Angela Fagerlin. 2010. The Efect of Format on Parents’ Understanding of the Risks and Benefts of Clinical Research: A Comparison Between Text, Tables, and Graphics. Journal of Health Communication 15, 5 (2010), 487–501. https://doi.org/10.1080/10810730. 2010.492560
[54] U.S. Census Bureau. 2019. Educational Attainment in the United States. https://www.census.gov/data/tables/2019/demo/educational-attainment/ cps-detailed-tables.html.
[55] U.S. Census Bureau. 2019. Population Estimates by Age, Sex, Race and His-panic Origin. https://www.census.gov/newsroom/press-kits/2020/population-estimates-detailed.html.
[56] Niels van Berkel, Jorge Goncalves, Danula Hettiachchi, Senuri Wijenayake, Ryan M. Kelly, and Vassilis Kostakos. 2019. Crowdsourcing Perceptions of Fair Predictors for Machine Learning: A Recidivism Case Study. Proceed-ings of the ACM on Human-Computer Interaction 3, CSCW (2019), 28:1–28:21. https://doi.org/10.1145/3359130
[57] Niels van Berkel, Eleftherios Papachristos, Anastasia Giachanou, Simo Hosio, and Mikael B. Skov. 2020. A Systematic Assessment of National Artifcial Intelligence
Policies: Perspectives from the Nordics and Beyond. In Proceedings of the 11th Nordic Conference on Human-Computer Interaction: Shaping Experiences, Shaping Society (NordiCHI ’20). Association for Computing Machinery, Article 10, 12 pages. https://doi.org/10.1145/3419249.3420106
[58] Niels van Berkel, Benjamin Tag, Jorge Goncalves, and Simo Hosio. 2020. Human-centred artifcial intelligence: a contextual morality perspective. Behaviour & Information Technology 0, 0 (2020), 1–17. https://doi.org/10.1080/0144929X.2020. 1818828
[59] Lucy Lu Wang, Gabriel Stanovsky, Luca Weihs, and Oren Etzioni. 2019. Gender trends in computer science authorship. arXiv:cs.DL/1906.07883
[60] Ruotong Wang, F. Maxwell Harper, and Haiyi Zhu. 2020. Factors Infuencing Perceived Fairness in Algorithmic Decision-Making: Algorithm Outcomes, De-velopment Procedures, and Individual Diferences. In Proceedings of the 2020 CHI Conference on Human Factors in Computing Systems (CHI ’20). Association for Computing Machinery, 1–14. https://doi.org/10.1145/3313831.3376813
[61] Zezhong Wang, Shunming Wang, Matteo Farinella, Dave Murray-Rust, Nathalie Henry Riche, and Benjamin Bach. 2019. Comparing Efectiveness and Engage-ment of Data Comics and Infographics. In Proceedings of the 2019 CHI Conference on Human Factors in Computing Systems (CHI ’19). Association for Computing Machinery, 1–12. https://doi.org/10.1145/3290605.3300483
[62] J. Wexler, M. Pushkarna, T. Bolukbasi, M. Wattenberg, F. Viégas, and J. Wilson. 2020. The What-If Tool: Interactive Probing of Machine Learning Models. IEEE Transactions on Visualization and Computer Graphics 26, 1, 56–65.
[63] Gayna Williams. 2014. Are You Sure Your Software is Gender-Neutral? Interac-tions 21, 1 (2014), 36–39. https://doi.org/10.1145/2524808
[64] Allison Woodruf, Sarah E. Fox, Steven Rousso-Schindler, and Jefrey Warshaw. 2018. A Qualitative Exploration of Perceptions of Algorithmic Fairness. In Pro-ceedings of the 2018 CHI Conference on Human Factors in Computing Systems (CHI ’18). ACM, Article 656, 14 pages. https://doi.org/10.1145/3173574.3174230
[65] Bowen Yu, Ye Yuan, Loren Terveen, Zhiwei Steven Wu, Jodi Forlizzi, and Haiyi Zhu. 2020. Keeping Designers in the Loop: Communicating Inherent Algorithmic Trade-Ofs Across Multiple Objectives. In Proceedings of the 2020 ACM Designing Interactive Systems Conference (DIS ’20). Association for Computing Machinery, 1245–1257. https://doi.org/10.1145/3357236.3395528
[66] Haiyi Zhu, Bowen Yu, Aaron Halfaker, and Loren Terveen. 2018. Value-Sensitive Algorithm Design: Method, Case Study, and Lessons. Proceedings of the ACM on Human-Computer Interaction 2, CSCW, Article 194 (2018), 23 pages. https: //doi.org/10.1145/3274463