Embed Size (px)
Citation preview

County Administration Michael E. Kobza Hall of Justice 990 Terrace Street Muskegon, MI 49442 Phone: 231-724-6571 Fax: 231-724-6673 Email: www.co.muskegon.mi.us
EEQQUUAALL EEMMPPLLOOYYMMEENNTT OOPPPPOORRTTUUNNIITTYY SSTTAATTIISSTTIICCAALL RREEPPOORRTT
June 30’ 2011

Board of Commissioners
Ken Mahoney, Chairman District 1
Alan Jager, District 2
I. John Snider II, Vice Chairman
District 3
James J. Derezinski, District 4
Marvin R. Engle , District 5
Lew Collins,
District 6
Scott Plummer, District 7
Anthony Longmire, District 8
Rillastine Wilkins,
District 9
Ben Cross, District 10
Robert Scolnik, District 11
COUNTY OF MUSKEGON

PREFACE TO THE EQUAL EMPLOYMENT POLICY IN SUPPORT OF WORKPLACE
DIVERSITY UPDATE
PREFACE
qual Opportunity is the law. That being said, the Muskegon County Board of Commissioners, in good faith, has adopted a voluntary Equal Employment Policy in support of Workplace Diversity to address some of its
challenges to assuring equal opportunity. The policy provides a framework in which to recognize, analyze, and address racial, gender and other identifiable disparities within our operations.
Opponents of Affirmative Action allege that voluntary equal opportunity policies and programs violate the intent of Equal Opportunity laws. That they advocate decisions without regard to race, color, sex, national origin, age, religion, marital status, disability, etc., they also require some form of assessment and where necessary modification to address disparate results. This perception fails to understand the primary issue at hand, that being, protected class identities is not at question, but human processes resulting in the disparate results. When we fail to acknowledge the presence of flaws in our human processes, we destroy the bridge between our divides. As a matter of practice, many perceive Equal Opportunity policies and programs as merely political rhetoric and/or some type of socialist agenda. Many have also concluded that equal opportunity is already a reality, and that people of color, women and/or others disproportionately affected just aren’t meeting the minimum requirements necessary for performance. This conclusion is based on false historical and cultural factors and does not address the issue of a level playing field. This begs the question, “What is truly required to close disparity gaps, “the true essence behind the nation’s equal opportunity legislation?” I contend the real answers cannot be found in legislation, laws, rules, or regulations but in humanity itself, if we are willing to accept and acknowledge it.
The County’s current Equal Employment Policy in support of Workplace Diversity was adopted by the Board of Commissioners in 2011. It emphasizes nondiscrimination, but recognizes the need to promote an appreciation and respect for workplace diversity and inclusion. Despite numerous court challenges around the country regarding affirmative action, racial preferences, etc. our policies and practices has never been a subject of such challenges. Our efforts, designed with the flexibility to take into account a myriad of challenges, gives way to advancing the goals of equal opportunity from a pragmatic community development and growth perspective. Why? It is simply the right thing to do! Furthermore, who is given greater responsibility for ensuring equal opportunity than those entrusted and charged with shaping, carrying out, and enforcing public policy?
OVERVIEW
he County of Muskegon employed 1184 full and part-time employees as of the pay period ended June 30, 2011 with an average wage of $37,995.75 and average length of service of 10.2 years. The average age of all
employees was 45.7 years. These employees served 34 distinct and unique areas within our governmental operations, delivering services to all of Muskegon County’s 172,188 plus citizens in one form or another. As such, it is and remains imperative that our workforce reflects racial, ethnic, gender and cultural sensitivity to our citizenry. The Muskegon County Board of Commissioners has adopted a voluntary Equal Employment Policy in support of Workplace Diversity and fully expects cooperation from all departments, staff members, etc. to ensure that it is implemented and incorporated in all transactions.
Within the following pages you will discover the latest statistical breakdown of the workforce. This data presents a snapshot of the progress towards ensuring fair and equitable representation. Where disparities are identified, efforts should be made to correct them. Such efforts may include, but are not limited to, increasing recruitment efforts, reviewing selection criteria to ensure that only valid mechanisms are being employed, applying inclusion principles to strengthen outcomes, etc. With our open-competitive recruitment, public solicitation and complaint processing systems we believe we are well prepared to address any obvious inequities. We welcome any comments, suggestions or feedback.
E
T

OVERALL WORKFORCE SYNOPSIS
ccording to the most recent report on the Census of Occupational Attachment of the Civilian Labor Force (CLF) by Race, Gender and EEO Category for the Muskegon-North Shores MSA, female and minority workforce
representation is forty-eight percent (48.0%) females and fourteen and one-tenth percent (14.1%) minority.
These statistics show the County of Muskegon above parity for overall employment of minorities and females when compared to the 2004 Labor Force Status report by Gender and Minority Group for the Muskegon-North Shores MSA, the most recent and comprehensive data available.
Total 1,184 – 100% 89,530 – 100% 172,188 – 100%
Minorities 266 – 22.5% 12,656 – 14.1% 39,056 – 22.7%
Females 783 – 66.1% 42,970 – 48.0% 86,438 – 50.2%
s mentioned above, the County of Muskegon employed approximately 1184 full and part-time employees as of the pay period ending June 30, 2011. Sixty six and one-tenth percent (66.1%) were female and twenty two and one-
half percent (22.5%) minority. Taking into consideration that approximately fifty and two-tenths percent (50.2%) and twenty two and seven-tenths percent (22.7%) of the population are females and minority respectively, it can be said that the County of Muskegon continues to take its obligation of inclusion seriously. However, it should also be noted that according to the 2010 census, the population growth in Muskegon County in the Hispanic or Latino category was 37.7% and in the Asian category 31.4%. When reviewing the data from an earnings standpoint however, females average 82.4% of their male counterpart. Concurrently, African Americans average 72.6%, Hispanic Americans 87.6% and Native Americans 89.1% of their Anglo American counterpart while Asian Americans average 178.7%. Also of note, in 2009 Muskegon had a per capita personal income (PCPI) of $27,792 ranking it 53
rd in the state. This
represented 81% of the state average of $34,315 and 70% of the national average of $39,635. In 1991, Muskegon ranked 40
th in PCPI in the state.
CATEGORICAL HIGHLIGHTS
verall representation of minorities was 22.5% and female representation was 66.1%. Categorical representation as depicted in the charts indicates that eighteen and four-tenths percent (18.4%) of the Officials and
Administrators were minority. Professionals were thirteen and one-tenth percent (13.1%). Technicians were ten and four-tenths percent (10.4%). Protective Services were twenty and seven-tenths percent (20.7%). Para-professionals were forty nine and one-tenth percent (49.1%). Administrative Support was eight and one-half percent (8.5%). Skilled Craft Workers were nine and seven-tenths percent (9.7%). Service/Maintenance was thirty seven and three-tenths percent (37.3%).
Female representation for Officials and Administrators was thirty nine and one-half percent (39.5%). Professionals were sixty six and four-tenth percent (66.4%). Technicians were seventy four percent (74.0%). Protective Services were eighteen and sixth-tenths percent (18.6%). Para-professionals were ninety one and four-tenth percent (91.4%). Administrative Support was ninety eight percent (98.0%). Skilled Craft Workers were three and two-tenths percent (3.2%). Service/Maintenance was forty two and nine-tenth percent (42.9%).
CONCLUSION
uskegon County has taken great strides to ensure inclusion and representation across each of the eight EEO categorical classifications. It remains imperative however that such representation is also reflected in the
A
A
O
M
June 2011 County of Muskegon
Employment
2004 Muskegon-North Shores, MSA
Labor Force
2010 County of Muskegon
Population

managerial ranks and wage distribution. This requires enhanced emphasis during recruitment, selection and/or appointment when hiring at the Officials/Administrators and Professional categories. Subjective decision-making processes are typically associated with these higher-paid classifications and therefore greater consideration must be given to the subject of diversity during those processes. In talking with various Department Heads, administrative and elected, it is evident that enhanced departmental input is also necessary at the front end of our hiring process, to fully appreciate the goals and objectives of our Equal Employment Policy in support of Workplace Diversity.
RACE/ETHNICITY
he County of Muskegon uses the definitions provided by the U.S. Equal Employment Opportunity
Commission for race/ethnic identification. The concept of race as used by the EEOC does not denote clear-
cut scientific definitions of anthropological origins. In addition, the EEOC recognizes the category “Hispanic”,
which is treated as a separate ethnic category in this report, although it is not a true identification.
Anglo-Am (not of Hispanic origin): All persons having origins in any of the original peoples of Europe, North
Africa, or the Middle East.
Afro-Am (not of Hispanic origin): All persons having origins in any of the Black racial groups of Africa.
Hispanic-Am: All persons of Mexican, Puerto Rican, Cuban, Central or South American, or other Spanish
culture or origin, regardless of race.
Asian-Am (or Pacific Islander): All persons having origins in any of the original peoples of the Far East,
Southeast Asia, the Indian Subcontinent, or the Pacific Islands. This area includes, for example, China, India,
Japan, Korea, the Philippine Islands and Samoa.
Native-Am (or Alaskan Native): All persons having origins in any of the original peoples of North America and
who maintain cultural identification through tribal affiliation or community recognition.
JOB CATEGORIES
he County of Muskegon also uses the definitions provided by the EEOC when defining the eight federal job categories.
The Census of Occupational Attachment of the Civilian Labor Force (CFL) by Race, Gender and EEO Category for the
Grand Rapids MSA (including Allegan, Kent, Muskegon and Ottawa Counties) is used to determine availability.
Officials and Administrators: Occupations in which employees set broad policies, exercise overall responsibility for
execution of these policies, direct individual departments or special phases of the agency’s operations, or provide specialized
consultation on a regional, district or area basis. Includes: department heads, bureau chiefs, division chiefs, directors, deputy
directors, controllers, superintendents, police chiefs, fire chiefs and kindred workers.
Professionals: Occupations which require specialized and theoretical knowledge that is usually acquired through college
training or through work experience and other training which provides comparable knowledge. Includes: personnel and labor
relations workers, social workers, doctors, lawyers, systems analyst, accountants, engineers, counselors, librarians,
management analysts, police and fire captains and lieutenants, and kindred workers.
Technicians: Occupations which require a combination of basic scientific or technical knowledge and manual skill which
can be obtained through specialized post-secondary school education or through equivalent on-the-job training. Includes:
computer programmers, drafters, survey and mapping technicians, photographers, technical illustrators, highway technicians,
electronic technicians, police and fire sergeants, and kindred workers.
Protective Services Workers: Occupations in which workers are entrusted with public safety, security, and
protection from destructive forces. Includes: police patrol officers, firefighters, guards, bailiffs, detectives, park rangers and
kindred workers.
Paraprofessionals: Occupations in which workers perform some of the duties of a professional or technician in a
supportive role, which usually requires less formal training and/or experience normally required for professional or technical
status. Such positions may fall within an identified pattern of staff development and promotion. Includes: research
assistants, policy auxiliary service aides, recreations assistants, library assistants and clerks, and kindred workers.
T
T
DEFINITIONS

Administrative Support: Occupations in which workers are responsible for internal and external communication,
recording and retrieval of data and/or information, and other paperwork required in an office. Includes: secretaries,
bookkeepers, messengers, clerk-typist, stenographers, court transcribers, statistical clerks, dispatchers, payroll clerks, office
machine and computer operators, legal assistants and kindred workers.
Skilled Craft Workers: Occupations in which workers perform jobs which require special manual skill and a thorough
and comprehensive knowledge of the processes involved in the work which is acquired through on-the-job training and
experience or through apprenticeship or other formal training programs. Includes: mechanics and repairers, electricians,
heavy equipment operators, stationary engineers, skilled machining occupations, carpenters, compositors and typesetters,
power plant operators, water and sewage treatment plant operators, and kindred workers.
Service/Maintenance: Occupations in which workers perform duties which result in or contribute to the comfort,
convenience, hygiene or safety of the general public or which contribute to the upkeep and care of buildings, facilities or
grounds of public property. Workers in this group may operate machinery. Includes: truck drivers, bus drivers, garage
laborers, custodial employees, gardeners, groundskeepers, refuse collectors, construction laborers, craft apprentices or
trainees, and kindred workers.

June 30, 2011 Officials and Administrators Classifications
Admin Asst Clinical Svs/B 1
Administrator/Brookhaven 1
Airport Manager - Full Ti 1
Asst Family Ct Admin Oper 1
Attorney Magistrate-Dist 2
Child Care Supervisor Ful 1
Cir Ct Admin/Frnd of Cour 1
Clinical Services Manager 1
Community Corrections Man 1
Corrections Services Dire 1
County Administrator 1
Dep Dir/Corrections Servi 1
Deputy Director-CMH Opera 1
Deputy Equalization Dir. 1
Deputy Health Officer Ful 1
Dist Court Admin (Dist Ct 1
Employment & Training Man 1
Equalization Director 1
Facilities Manager-Full T 1
Finance/Mgmt Services Dir 1
Human Res Deputy Director 1
Human Resources Director 1
Info. Systems Manager FT 1
Laboratory Supervisor Ful 1
Mental Health Director 1
Mental Health Finance Spr 1
Nursing Director Asst/BH 2
Park Superintendent Full 1
Probate Ct Admin/Register 1
Public Health Director 1
Public Health Finance Spr 1
Public Works Director 1
Solid Waste Supervisor F 1
Transit Systems Manager F 1
Wastewater Director FT 1
WW Eng Oper & Maint Mgr F 1

June 30, 2011 Professional Classifications
Accountant II Full Time 3
Adm/Marketing Coord 30 hr 1
Administrative Analyst FT 4
Admissions & Utilization 1
Admissions/Marketing Coor 1
Adult Activity Site Super 3
Assessment Admin Spr FT 1
Assistant Prosecutor I F 3
Assistant Prosecutor II F 3
Asst Family Div Admin Leg 1
Asst Information Systems 1
Benefits Anlayst Full Tim 2
Board/EEO Liaison Full Ti 1
Budget Specialist Full Ti 1
Captain - FT 1
Cash Manager - Full Time 1
Chemist Full Time 2
Chief Collections Off DC- 1
Chief Deputy Admin. Clerk 1
Child Psychiatrist 1
Child Support Investigatr 1
Clerical Systems Supervis 1
Client Information Manage 1
Clinical Coordinator/ACT 2
Clinical Services Spr I F 5
Clinical Services Spr II 2
Clinical Spr Family Crt S 1
CMH Clubhouse Rehab Speci 2
Collections Off. Dist Ct 1
Com Corrections Case Mana 2
Com Nutrition Specialist 1
Com Placement Coordinator 3
Community Nutrition Couns 3
Community Nutrition Speci 3
Computer Operations Mgr/C 1
Contract Specialst/CMH FT 1
Customer Services Spec/CM 2
Dental Health Coordinator 1
Dietician Full Time 2
Domestic Violence Special 1
Elections Coordinator FT 1
Emergency Services Therp 4
Employment Coordinator FT 1
Environ Protection Superv 1
Environ Quality Sanitaria 1
Environ. Quality Sanitari 4
Environmental Health Spr 1
Environmental Quality Coo 1
Family Counselor Full Tim 2
Family Division Referee - 1
FOC Caseworker I Full Tim 1
FOC Caseworker II Full Ti 1
FOC Enforcement Attorney 1
FOC Enforcement Officer I 2
FOC Specialized Enf Offic 1
Food Service Sanitarian F 5
General Psychiatrist FT 1
Grants Coordinator FT 1
Info Systems Integrator F 8
Jail Diversion Coordinato 1
Jail Population Coordinat 1
Juvenile Supervisor FT 2
Law Enf Admin Services Ma 1
Lieutenant Full Time 1
Masters Level Clinician 14
Masters Level Clinician 3 1
Maternal/Child Services S 1
Mental Health Claims Supe 2
Mental Health Coordinator 3
Mid-Level Medical Pratiti 2
Network Manager/CMH FT 1
Nursing Supervisor Full T 2
Occupational Therapist FT 3
Office Services Manager F 1
Operations Manager FT 1
Peer Support Specialist F 4
Peer Support Specialist-H 1
PH Emergency Prepared Coo 1
Pretreatment Coordinator 1
Probation Office Manager 1
Probation Officer I Full 4
Probation Officer II Full 8
Probation Officer/DC FT 5
Program Coord/Juv Trans C 1
Projects Manager FT 1
Property Information Anal 1
Property Specialist FT 1
Prosecutor Senior Assista 7
Public Health Education S 1
Public Health Educator FT 4
Public Health Epidemiolog 1
Public Health Improvement 1
Public Health Nurse 11
Public Works Engineer FT 1
Quality Assurance Spec FT 2
Quality Manager/CMH FT 1
Reactive Attachment Thera 1
Recipient Rights Advisor 1
Recipient Rights Officer 1
Recorder Bailiff - Full t 3
Registered Nurse Sheriff 1
Registered Nurse Supr/BH 4
Registered Nurse/BH FT 1
Registered Nurse/CMH Full 16
Registered Nurse/CMH Hour 1
Resident Care Supervisor 8
Residential Services Mana 1
RN Case Manager/BH FT 6
Senior Budget Specialist 1
Senior Nurse/CMH Full Tim 1
Senior Psychologist Full 1
Skills Building Services 1
Sobriety Court Case Manag 2
Social Svs Caseworker/BH 3
Support Coordinator/DD 28 1
Supports Coodinator/DD FT 19
Supports Coordination Man 1
Supports Coordinator/ACT 8
Supports Coordinator/DD H 1
Supports Coordinator/DDFT 1
Supports Coordinator/MI F 24
Sustainability Coordinato 1
Therapeutic Recreation Th 1
Tourism Manager FT 1
Training & Com Res Specia 1
Training Resource Tech 26 1
Trial Lawyer, Chief Full 1
Utilization Specialist FT 3
Wastewater Farm Manager F 1
Water System Supervisor - 1
Workers Comp/Safety Coord 1
Workforce Devel Finance S 1
Workforce Improv Manager 1
Wrap-Around Coordinator F 1
WW Collection Treatment S 1
WW Safety & Technical Coo 1

June 30, 2011 Technician Classifications
Accounting Technician Ful 4
Accounting Technician/NB 3
Appraisal Technician - 35 3
Appraisal Technician FT 5
Appraiser Full Time 3
Appraiser, Senior Full Ti 4
Compliance Specialist FT 1
Fiscal Technician/Brookha 1
Fiscal Technician/CMH 1
GIS Technician - 25 Hours 2
Human Resources Specialis 3
Info Systems Tech I FT 3
Info Systems Tech II FT 1
Info. Systems Tech III FT 5
Irrigation Technician Ful 1
Laboratory Technician Ful 5
LPN Hourly Call-In 7
LPN/Brookhaven 24 Hours 5
LPN/Brookhaven 32 Hours 1
LPN/Brookhaven Full Time 18
LPN/Medical Records 2
Microcomputer Analyst FT 1
Policy Specialist FT 1
Pretreatment Technician F 4
Program Specialist FT 1
Property Tax Specialist F 1
Public Health Technician 7
Wastewater Engr Aide/Seas 1
Water System Eng Aide-Sea 1
WW/Solidwaste Account Cle 1

June 30, 2011 Protective Service Worker Classifications
Animal Control Officer FT 3
Building Security Officer 11
Clerk Bailff /NB - Hourly 1
Clerk Bailiff/NB Full Tim 1
Corrections Offcr/NR-AA D 2
Corrections Offcr/NR-BA D 6
Corrections Officer/NR FT 29
Corrections Officer-FT 5
Corrections Offr.-FT-AA D 1
Corrections Offr.-FT-BA D 2
Crime Victims Right Coord 1
Lieutenant FT - AA Degree 1
LPN/Sheriff Full Time 2
Seasonal Marine Officer 6
Sergeant FT - AA Degree 1
Sergeant FT - BA Degree 3
Sergeant Full Time 4
Sheriff Deputy 1
Sheriff Deputy - Hourly 6
Sheriff Deputy FT - AA De 6
Sheriff Deputy Full BA De 17
Sheriff Deputy Full Time 10
Sheriff Deputy-FT-AA Degr 1
Sheriff Deputy-FT-BA Degr 2
Surveillance Worker Full 4
Victim Services Superviso 1
Vulnerable Victim Specl H 1
Youth Specialist Full Tim 10
Youth Specialist Hrly 10

June 30, 2011 Para-professional Classifications
Activity Aide / BH Full T 4
AFSCME CNA I Hourly Call- 1
Buyer Full Time 2
CENA I/BH 24 Hours 1
CENA I/BH Fulltime 14
Certified Nurse Aide I/BH 74
Certified Nurse Aide/BH 3 2
Child Care Attendant 32 H 3
Child Care Attendant Full 3
Child Care Attendant Hour 9
Child Support Specialist 1
CNA I /BH - Hourly Call-I 1
CNA I Hourly Call-in 8
Consumer Affairs Liaison 1
Consumer Affairs Speciali 1
Court Reporter Full Time 1
Deputy Probate Register F 1
Employment Coordinator As 1
Food Services Supervisor/ 1
Juv. Detention Ctr Shift 4
Lactation Peer Counselor 2
Law Clerk Full Time 1
Mental Health Worker - 28 1
Mental Health Worker Full 6
Mental Health Worker Hour 8
Mental Hlth Aid-Residenti 6
Mental Hlth Aid-Skills Bl 43
Mentl Hlth Aid Residentia 6
Occupational Therapist As 1
Physical Therapist Asst F 1
Restorative Nursing Assis 1
Speech & Language Asst FT 1
Supports Coordinator Asst 4
Therapeutic Rec Asst Spr/ 1
Youth Specialist Call-In 4

June 30, 2011 Administrative Support Classifications
Account Clerk I Full Time 1
Account Clerk II Full Tim 13
Account Clerk II/NB Full 4
Account Clerk II/NB Hourl 2
Account Clerk/BH 1
Account Records Clerk Ful 4
Admin Sec to Co Admin FT 1
Administrative Secretary 7
Assignment Clerk 1
Chief Clerk/District Cour 4
Cir Ct Legal & Sced Secty 9
Circuit Court Clerk - FT 6
Clerical Supervisor/CMH F 1
Clerk II Full Time 22
Clerk II Hourly 1
Clerk II/NB Full Time 6
Clinic Clerk Full Time 7
CMH Administrative Secret 1
Communication Dispatcher 2
Court Clerk/District Cour 21
Court Clerk/District Ct H 4
Court Recorder/District C 6
Court Recorder/Judicial S 2
Court Services Specialist 8
Departmental Clerk Full T 14
Departmental Clerk/NB Ful 2
Facilities Services Aide 1
Family Div Schedl Secreta 1
General Clerk/BH Full Tim 1
Jail Activities Coord Ful 1
Jury Clerk/Assignment Clk 1
Legal Secretary Full Time 5
Legal Secretary II FT 1
Medical Administrative Se 1
Medical Secretary/Brookha 1
Microfilm Operator Full T 1
Probate Court Clerk FT 1
Recep Switchboard Oper Ho 2
Secretary Full Time 1
Secretary/NB Full Time 5
Senior Tourism Aide FT 1
Sheriff Account Clerk II 1
Sheriff Admin Secretary F 1
Sheriff Secretary FT 1
Tourism Information Aide- 2
Transcriptionist Full Tim 16
Typist/NB Full Time 1
Ward Secretary/Brookhaven 1
Weighstation Attendant FT 1
Weighstation Attendant Ho 1

June 30, 2011 Administrative Support Classifications

June 30, 2011 Skilled Craft Worker Classifications
Agricultural Equip Oper F 2
Airport Equipment Mechani 1
Building Maintenanc Mech 4
Building Superintendent/B 1
Electrician/WW Full Time 2
Irrigation Operator Full 3
Maintenance Mechanic Full 2
Master Electrician/Wastew 1
Mechanic/Sheriff Full Tim 1
Operations Maint Mech Ful 6
Solid Waste Disp Site Ope 4
Solid Waste Operator - FT 1
Transit Maintenance Mecha 2
WW Heavy Equipment Oper F 1

June 30, 2011 Service/Maintenance Worker Classifications
Airport Attendant Full Ti 2
Airport Maintenance Worke 4
Bus Operator - Full Time 1
Bus Operator - Seasonal 4
Bus Operator Full Time 15
Bus Operator Hourly 10
Collection Systems Operat 4
Cook/BH Full-Time 4
Cook/BH -Hourly 3
Custodian/BH Full Time 10
Custodian/WW Full Time 1
Delivery Person/NB Full T 1
Drain Inspector - Seasona 3
Grounds Maintenance Spr F 1
Housekeeper Full Time 1
Housekeeper Supervisor FT 1
Kitchen Helper/BH 20 Hour 3
Kitchen Helper/BH Full Ti 7
Kitchen Helper/BH Hourly 6
Lead Custodian Full Time 1
Maintenance I/BH Full Tim 4
Maintenance II/BH Full Ti 3
Paratransit Operator - FT 2
Paratransit Operator - Ho 4
Park Crew Leader/Seasonal 1
Park Ranger 1
Park Ranger/Seasonal 2
Park Ranger/Seasonal (poo 15
Parks Maintenance Spr FT 1
Print Operator/Delivery P 2
Senior Park Ranger - Full 1
Store Keeper/BH Full Time 1
Transit Attendant - FT 1
Transit Supervisor FT 3
Vehicle Specialist FT 1
Wastewater Utility Assist 1
WW Equipment Repair Spr F 1

Accounting as of June 30, 2011
Total White Black Hispanic Asian Total White Black Hispanic Asian
0 0 0 0
Officials and
Administrators0.0%
1 1 1 0 0
Professionals 20.0% 100.0% 100.0%
2 0 2 2 0
Technicians 40.0% 100.0% 100.0%
0 0 0 0
0.0%
0 0 0 0
Para-
Professionals0.0%
2 0 2 2 0
Administrative
Support40.0% 100.0% 100.0%
0 0 0 0
Skilled Craft
Workers0.0%
0 0 0 0
0.0%
Totals 5 1 1 0 0 0 0 4 4 0 0 0 0 0
Percentage 100.0% 20.0% 20.0% 0.0% 0.0% 0.0% 0.0% 80.0% 80.0% 0.0% 0.0% 0.0% 0.0% 0.0%
Total
Minority
Protective
Services
Service/Mainten
ance Workers
Males FemalesGrand
Total
Native
Am
Native
Am

Administration as of June 30, 2011
Total White Black Hispanic Asian Total White Black Hispanic Asian
3 2 1 1 1 1 1
Officials and
Administrators42.9% 66.7% 33.3% 33.3% 33.3% 33.3% 33.3%
3 2 2 1 1 0
Professionals 42.9% 66.7% 66.7% 33.3% 33.3%
0 0 0 0
Technicians 0.0%
0 0 0 0
0.0%
0 0 0 0
Para-
Professionals0.0%
1 0 1 1 0
Administrative
Support14.3% 100.0% 100.0%
0 0 0 0
Skilled Craft
Workers0.0%
0 0 0 0
0.0%
Totals 7 4 3 1 0 0 0 3 3 0 0 0 0 1
Percentage 100.0% 57.1% 42.9% 14.3% 0.0% 0.0% 0.0% 42.9% 42.9% 0.0% 0.0% 0.0% 0.0% 14.3%
Total
Minority
Protective
Services
Service/Mainten
ance Workers
Males FemalesGrand
Total
Native
Am
Native
Am

Airport as of June 30, 2011
Total White Black Hispanic Asian Total White Black Hispanic Asian
1 1 1 0 0
Officials and
Administrators10.0% 100.0% 100.0%
0 0 0 0
Professionals 0.0%
0 0 0 0
Technicians 0.0%
0 0 0 0
0.0%
0 0 0 0
Para-
Professionals0.0%
2 0 2 2 0
Administrative
Support20.0% 100.0% 100.0%
1 1 1 0 0
Skilled Craft
Workers10.0% 100.0% 100.0%
6 4 4 2 1 1 2
60.0% 66.7% 66.7% 33.3% 16.7% 16.7% 33.3%
Totals 10 6 6 0 0 0 0 4 2 1 1 0 0 2
Percentage 100.0% 60.0% 60.0% 0.0% 0.0% 0.0% 0.0% 40.0% 20.0% 10.0% 10.0% 0.0% 0.0% 20.0%
Total
Minority
Protective
Services
Service/Mainten
ance Workers
Males FemalesGrand
Total
Native
Am
Native
Am

Brookhaven as of June 30, 2011
Total White Black Hispanic Asian Total White Black Hispanic Asian
4 1 1 3 2 1 1
Officials and
Administrators1.9% 25.0% 25.0% 75.0% 50.0% 25.0% 25.0%
20 1 1 19 18 1 1
Professionals 9.3% 5.0% 5.0% 95.0% 90.0% 5.0% 5.0%
34 2 2 32 30 1 1 2
Technicians 15.7% 5.9% 5.9% 94.1% 88.2% 2.9% 2.9% 5.9%
0 0 0 0
0.0%
108 4 2 1 1 104 50 51 3 56
Para-
Professionals50.0% 3.7% 1.9% 0.9% 0.9% 96.3% 46.3% 47.2% 2.8% 51.9%
8 0 8 8 0
Administrative
Support3.7% 100.0% 100.0% 0.0%
1 1 1 0 0
Skilled Craft
Workers0.5% 100.0% 100.0% 0.0%
41 14 11 3 27 14 13 16
19.0% 34.1% 26.8% 7.3% 65.9% 34.1% 31.7% 39.0%
Totals 216 23 18 4 1 0 0 193 122 66 2 3 0 76
Percentage 100.0% 10.6% 8.3% 1.9% 0.5% 0.0% 0.0% 89.4% 56.5% 30.6% 0.9% 1.4% 0.0% 35.2%
Total
Minority
Protective
Services
Service/Mainten
ance Workers
Males FemalesGrand
Total
Native
Am
Native
Am

Child Haven as of June 30, 2011
Total White Black Hispanic Asian Total White Black Hispanic Asian
1 0 1 1 1
Officials and
Administrators6.3% 100.0% 100.0% 100.0%
0 0 0 0
Professionals 0.0%
0 0 0 0
Technicians 0.0%
0 0 0 0
0.0%
15 1 1 14 5 8 1 10
Para-
Professionals93.8% 6.7% 6.7% 93.3% 33.3% 53.3% 6.7% 66.7%
0 0 0 0
Administrative
Support0.0%
0 0 0 0
Skilled Craft
Workers0.0%
0 0 0 0
0.0%
Totals 16 1 0 1 0 0 0 15 5 9 1 0 0 11
Percentage 100.0% 6.3% 0.0% 6.3% 0.0% 0.0% 0.0% 93.8% 31.3% 56.3% 6.3% 0.0% 0.0% 68.8%
Total
Minority
Protective
Services
Service/Mainten
ance Workers
Males FemalesGrand
Total
Native
Am
Native
Am
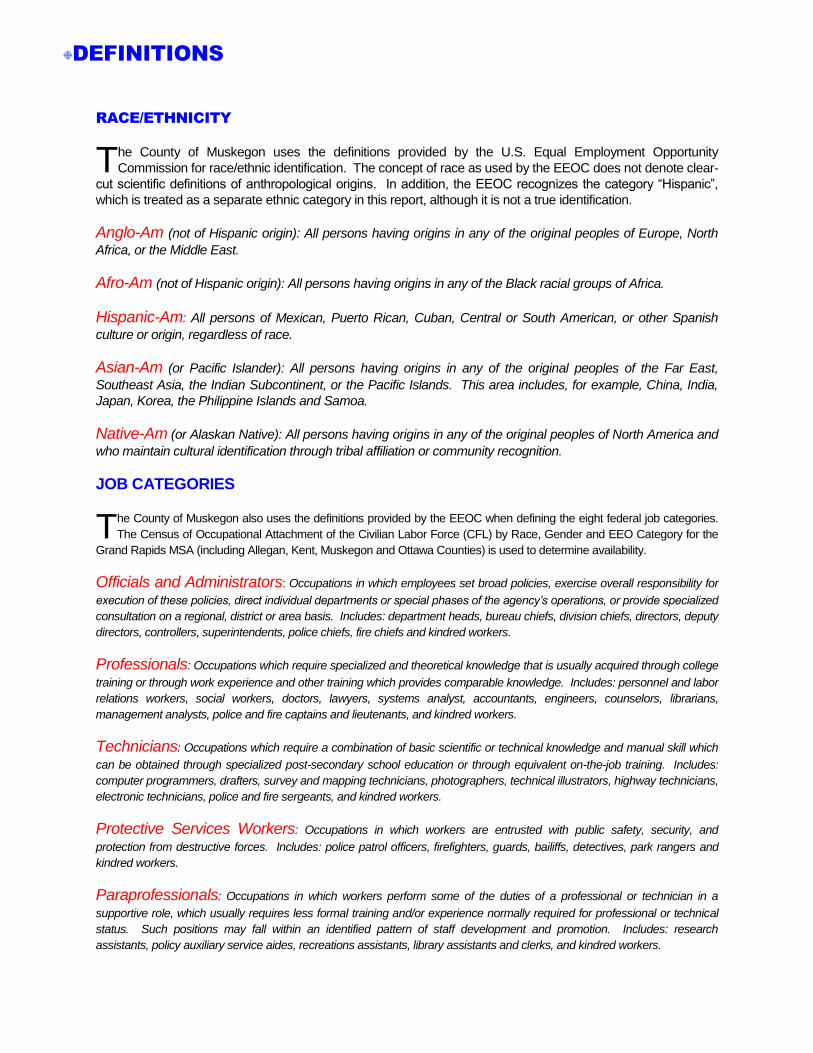
Circuit Court as of June 30, 2011
Total White Black Hispanic Asian Total White Black Hispanic Asian
0 0 0 0
Officials and
Administrators0.0%
3 3 2 1 0 3
Professionals 18.8% 100.0% 66.7% 33.3% 100.0%
0 0 0 0
Technicians 0.0%
2 2 2 0 0
12.5% 100.0% 100.0%
2 1 1 1 1 0
Para-
Professionals12.5% 50.0% 50.0% 50.0% 50.0%
9 0 9 9 0
Administrative
Support56.3% 0.0% 100.0% 100.0%
0 0 0 0
Skilled Craft
Workers0.0%
0 0 0 0
0.0%
Totals 16 6 3 2 1 0 0 10 10 0 0 0 0 3
Percentage 100.0% 37.5% 18.8% 12.5% 6.3% 0.0% 0.0% 62.5% 62.5% 0.0% 0.0% 0.0% 0.0% 18.8%
Protective
Services
Service/Mainten
ance Workers
Total
Minority
Males FemalesGrand
Total
Native
Am
Native
Am
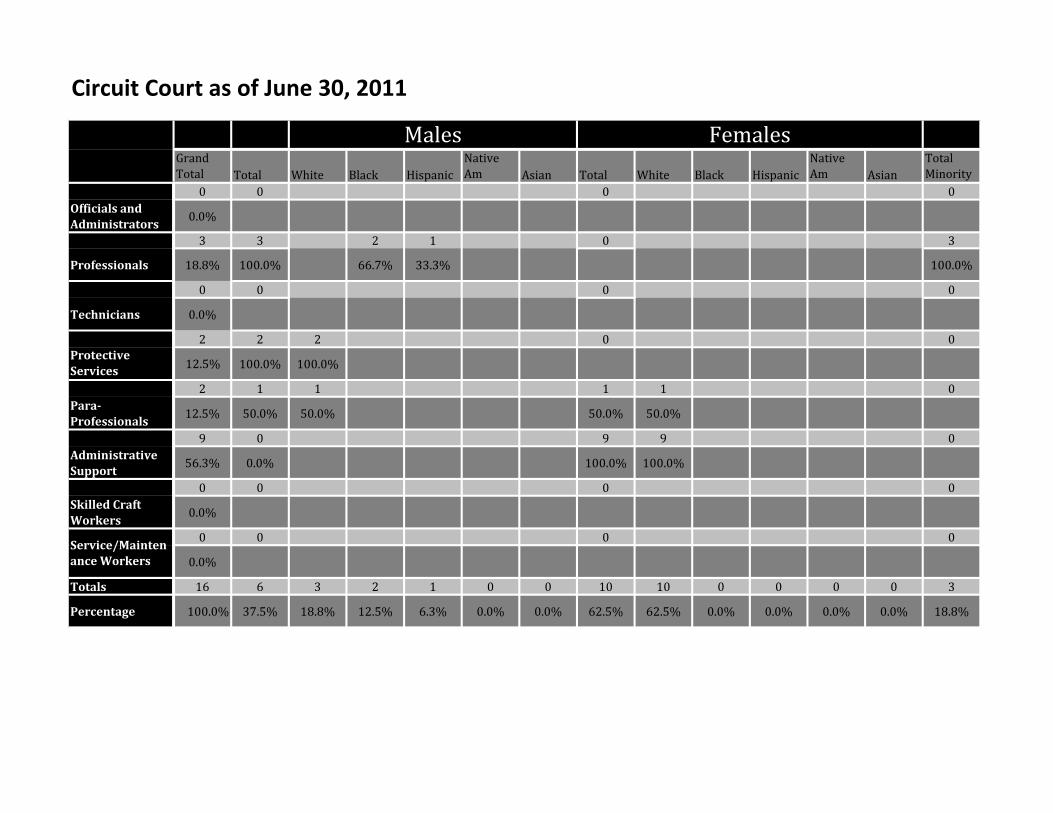
Community Corrections as of June 30, 2011
Total White Black Hispanic Asian Total White Black Hispanic Asian
1 1 1 0 1
Officials and
Administrators25.0% 100.0% 0.0% 100.0% 100.0%
2 2 1 1 0 1
Professionals 50.0% 100.0% 50.0% 50.0% 50.0%
0 0 0 0
Technicians 0.0%
0 0 0 0
0.0%
0 0 0 0
Para-
Professionals0.0%
1 0 1 1 0
Administrative
Support25.0% 100.0% 100.0% 0.0%
0 0 0 0
Skilled Craft
Workers0.0%
0 0 0 0
0.0%
Totals 4 3 1 2 0 0 0 1 1 0 0 0 0 2
Percentage 100.0% 75.0% 25.0% 50.0% 0.0% 0.0% 0.0% 25.0% 25.0% 0.0% 0.0% 0.0% 0.0% 50.0%
Total
Minority
Protective
Services
Service/Mainten
ance Workers
Males FemalesGrand
Total
Native
Am
Native
Am

Convention & Visitors Bureau as of June 30, 2011
Total White Black Hispanic Asian Total White Black Hispanic Asian
0 0 0 0
Officials and
Administrators0.0%
1 0 1 1 0
Professionals 25.0% 100.0% 100.0%
0 0 0 0
Technicians 0.0%
0 0 0 0
0.0%
0 0 0 0
Para-
Professionals0.0%
3 0 3 3 0
Administrative
Support75.0% 100.0% 100.0%
0 0 0 0
Skilled Craft
Workers0.0%
0 0 0 0
0.0%
Totals 4 0 0 0 0 0 0 4 4 0 0 0 0 0
Percentage 100.0% 0.0% 0.0% 0.0% 0.0% 0.0% 0.0% 100.0% 100.0% 0.0% 0.0% 0.0% 0.0% 0.0%
Total
Minority
Protective
Services
Service/Mainten
ance Workers
Males FemalesGrand
Total
Native
Am
Native
Am

County Clerk as of June 30, 2011
Total White Black Hispanic Asian Total White Black Hispanic Asian
0 0 0 0
Officials and
Administrators0.0%
1 0 1 1 0
Professionals 10.0% 100.0% 100.0%
0 0 0 0
Technicians 0.0%
0 0 0 0
0.0%
0 0 0 0
Para-
Professionals0.0%
9 0 9 7 1 1 2
Administrative
Support90.0% 100.0% 77.8% 11.1% 11.1% 22.2%
0 0 0 0
Skilled Craft
Workers0.0%
0 0 0 0
0.0%
Totals 10 0 0 0 0 0 0 10 8 0 1 1 0 2
Percentage 100.0% 0.0% 0.0% 0.0% 0.0% 0.0% 0.0% 100.0% 80.0% 0.0% 10.0% 10.0% 0.0% 20.0%
Total
Minority
Protective
Services
Service/Mainten
ance Workers
Males FemalesGrand
Total
Native
Am
Native
Am

County Parks as of June 30, 2011
Total White Black Hispanic Asian Total White Black Hispanic Asian
1 1 1 0 0
Officials and
Administrators4.5% 100.0% 100.0% 0.0% 0.0% 0.0% 0.0% 0.0% 0.0% 0.0% 0.0% 0.0% 0.0% 0.0%
0 0 0 0
Professionals 0.0%
0 0 0 0
Technicians 0.0%
0 0 0 0
0.0%
0 0 0 0
Para-
Professionals0.0%
0 0 0 0
Administrative
Support0.0%
0 0 0 0
Skilled Craft
Workers0.0%
21 13 11 2 8 8 2
95.5% 61.9% 52.4% 9.5% 38.1% 38.1% 9.5%
Totals 22 14 12 2 0 0 0 8 8 0 0 0 0 2
Percentage 100.0% 63.6% 54.5% 9.1% 0.0% 0.0% 0.0% 36.4% 36.4% 0.0% 0.0% 0.0% 0.0% 9.1%
Total
Minority
Protective
Services
Service/Mainten
ance Workers
Males FemalesGrand
Total
Native
Am
Native
Am

District Court as of June 30, 2011
Total White Black Hispanic Asian Total White Black Hispanic Asian
3 2 2 1 1 0
Officials and
Administrators5.6% 66.7% 66.7% 33.3% 33.3%
12 5 4 1 7 6 1 2
Professionals 22.2% 41.7% 33.3% 8.3% 58.3% 50.0% 8.3% 16.7%
1 1 1 0 0
Technicians 1.9% 100.0% 100.0% 0.0%
0 0 0 0
0.0%
0 0 0 0
Para-
Professionals0.0%
38 0 38 36 1 1 2
Administrative
Support70.4% 100.0% 94.7% 2.6% 2.6% 5.3%
0 0 0 0
Skilled Craft
Workers0.0%
0 0 0 0
0.0%
Totals 54 8 7 0 0 1 0 46 43 2 1 0 0 4
Percentage 100.0% 14.8% 13.0% 0.0% 0.0% 1.9% 0.0% 85.2% 79.6% 3.7% 1.9% 0.0% 0.0% 7.4%
Total
Minority
Protective
Services
Service/Mainten
ance Workers
Males FemalesGrand
Total
Native
Am
Native
Am

Drain Commission as of June 30, 2011
Total White Black Hispanic Asian Total White Black Hispanic Asian
0 0 0 0
Officials and
Administrators0.0%
0 0 0 0
Professionals 0.0%
0 0 0 0
Technicians 0.0%
0 0 0 0
0.0%
0 0 0 0
Para-
Professionals0.0%
0 0 0 0
Administrative
Support0.0%
0 0 0 0
Skilled Craft
Workers0.0%
3 3 3 0 0
100.0% 100.0% 100.0%
Totals 3 3 3 0 0 0 0 0 0 0 0 0 0 0
Percentage 100.0% 100.0% 100.0% 0.0% 0.0% 0.0% 0.0% 0.0% 0.0% 0.0% 0.0% 0.0% 0.0% 0.0%
Total
Minority
Protective
Services
Service/Mainten
ance Workers
Males FemalesGrand
Total
Native
Am
Native
Am

Employment & Training as of June 30, 2011
Total White Black Hispanic Asian Total White Black Hispanic Asian
1 1 1 0 0
Officials and
Administrators9.1% 100.0% 100.0%
4 1 1 3 3 0
Professionals 36.4% 25.0% 25.0% 75.0% 75.0%
4 0 4 2 2 2
Technicians 36.4% 100.0% 50.0% 50.0% 50.0%
0 0 0 0
0.0%
0 0 0 0
Para-
Professionals0.0%
2 0 2 1 1 1
Administrative
Support18.2% 100.0% 50.0% 50.0% 50.0%
0 0 0 0
Skilled Craft
Workers0.0%
0 0 0 0
0.0%
Totals 11 2 2 0 0 0 0 9 6 2 1 0 0 3
Percentage 100.0% 18.2% 18.2% 0.0% 0.0% 0.0% 0.0% 81.8% 54.5% 18.2% 9.1% 0.0% 0.0% 27.3%
Total
Minority
Protective
Services
Service/Mainten
ance Workers
Males FemalesGrand
Total
Native
Am
Native
Am

Equalization as of June 30, 2011
Total White Black Hispanic Asian Total White Black Hispanic Asian
2 1 1 1 1 0
Officials and
Administrators9.1% 50.0% 50.0% 50.0% 50.0%
2 1 1 1 1 0
Professionals 9.1% 50.0% 50.0% 50.0% 50.0%
17 10 10 7 7 0
Technicians 77.3% 58.8% 58.8% 41.2% 41.2%
0 0 0 0
0.0%
0 0 0 0
Para-
Professionals0.0%
1 0 1 1 0
Administrative
Support4.5% 100.0% 100.0%
0 0 0 0
Skilled Craft
Workers0.0%
0 0 0 0
0.0%
Totals 22 12 12 0 0 0 0 10 10 0 0 0 0 0
Percentage 100.0% 54.5% 54.5% 0.0% 0.0% 0.0% 0.0% 45.5% 45.5% 0.0% 0.0% 0.0% 0.0% 0.0%
Total
Minority
Protective
Services
Service/Mainten
ance Workers
Males FemalesGrand
Total
Native
Am
Native
Am

Facilities Management as of June 30, 2011
Total White Black Hispanic Asian Total White Black Hispanic Asian
1 1 1 0 0
Officials and
Administrators11.1% 100.0% 100.0%
0 0 0 0
Professionals 0.0%
0 0 0 0
Technicians 0.0%
0 0 0 0
0.0%
0 0 0 0
Para-
Professionals0.0%
1 0 1 1 0
Administrative
Support11.1% 100.0% 100.0%
4 4 3 1 0 1
Skilled Craft
Workers44.4% 100.0% 75.0% 25.0% 25.0%
3 1 1 2 1 1 1
33.3% 33.3% 33.3% 66.7% 33.3% 33.3% 33.3%
Totals 9 6 5 0 0 1 0 3 2 1 0 0 0 2
Percentage 100.0% 66.7% 55.6% 0.0% 0.0% 11.1% 0.0% 33.3% 22.2% 11.1% 0.0% 0.0% 0.0% 22.2%
Total
Minority
Protective
Services
Service/Mainten
ance Workers
Males FemalesGrand
Total
Native
Am
Native
Am

Family Court as of June 30, 2011
Total White Black Hispanic Asian Total White Black Hispanic Asian
2 0 2 2 0
Officials and
Administrators5.3% 100.0% 100.0% 0.0%
11 3 2 1 8 8 1
Professionals 28.9% 27.3% 18.2% 9.1% 72.7% 72.7% 9.1%
1 1 1 0 0
Technicians 2.6% 100.0% 100.0%
0 0 0 0
0.0%
1 0 1 1 0
Para-
Professionals2.6% 100.0% 100.0%
23 1 1 22 18 1 3 4
Administrative
Support60.5% 4.3% 4.3% 95.7% 78.3% 4.3% 13.0% 17.4%
0 0 0 0
Skilled Craft
Workers0.0%
0 0 0 0
0.0%
Totals 38 5 4 1 0 0 0 33 29 1 3 0 0 5
Percentage 100.0% 13.2% 10.5% 2.6% 0.0% 0.0% 0.0% 86.8% 76.3% 2.6% 7.9% 0.0% 0.0% 13.2%
Total
Minority
Protective
Services
Service/Mainten
ance Workers
Males FemalesGrand
Total
Native
Am
Native
Am

Health Department as of June 30, 2011
Total White Black Hispanic Asian Total White Black Hispanic Asian
3 1 1 2 1 1 1
Officials and
Administrators4.1% 33.3% 33.3% 66.7% 33.3% 33.3% 0.0% 33.3%
43 12 11 1 31 27 1 2 1 5
Professionals 58.9% 27.9% 25.6% 2.3% 72.1% 62.8% 2.3% 4.7% 2.3% 11.6%
10 0 10 8 2 2
Technicians 13.7% 100.0% 80.0% 20.0% 20.0%
3 1 1 2 1 1 1
4.1% 33.3% 33.3% 66.7% 33.3% 33.3% 33.3%
2 0 2 1 1 1
Para-
Professionals2.7% 100.0% 50.0% 50.0% 50.0%
12 0 12 12 0
Administrative
Support16.4% 0.0% 100.0% 100.0%
0 0 0 0
Skilled Craft
Workers0.0%
0 0 0 0
0.0%
Totals 73 14 13 1 0 0 0 59 50 6 2 0 1 10
Percentage 100.0% 19.2% 17.8% 1.4% 0.0% 0.0% 0.0% 80.8% 68.5% 8.2% 2.7% 0.0% 1.4% 13.7%
Total
Minority
Protective
Services
Service/Mainten
ance Workers
Males FemalesGrand
Total
Native
Am
Native
Am

Human Resources as of June 30, 2011
Total White Black Hispanic Asian Total White Black Hispanic Asian
2 0 2 2 0
Officials and
Administrators20.0% 0.0% 100.0% 100.0%
3 0 3 2 1 1
Professionals 30.0% 100.0% 66.7% 33.3% 33.3%
3 0 3 1 1 1 2
Technicians 30.0% 100.0% 33.3% 33.3% 33.3% 66.7%
0 0 0 0
0.0%
0 0 0 0
Para-
Professionals0.0%
2 0 2 2 0
Administrative
Support20.0% 100.0% 100.0%
0 0 0 0
Skilled Craft
Workers0.0%
0 0 0 0
0.0%
Totals 10 0 0 0 0 0 0 10 7 2 1 0 0 3
Percentage 100.0% 0.0% 0.0% 0.0% 0.0% 0.0% 0.0% 100.0% 70.0% 20.0% 10.0% 0.0% 0.0% 30.0%
Total
Minority
Protective
Services
Service/Mainten
ance Workers
Males FemalesGrand
Total
Native
Am
Native
Am
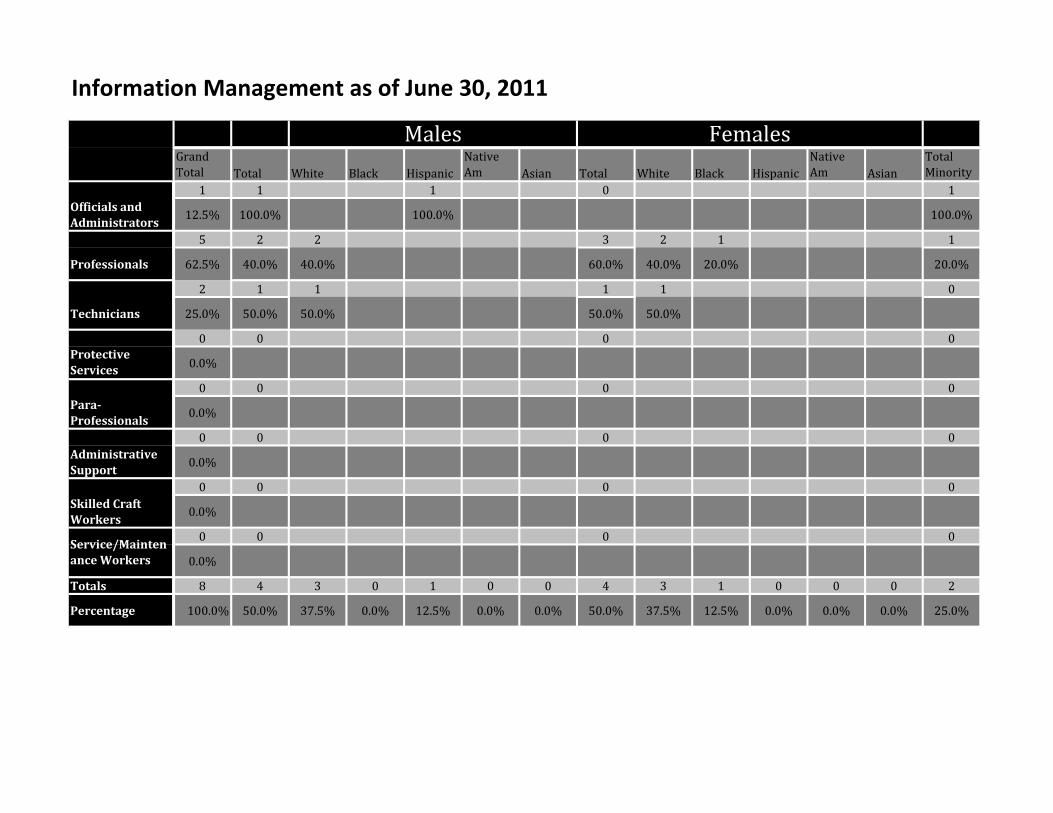
Information Management as of June 30, 2011
Total White Black Hispanic Asian Total White Black Hispanic Asian
1 1 1 0 1
Officials and
Administrators12.5% 100.0% 100.0% 100.0%
5 2 2 3 2 1 1
Professionals 62.5% 40.0% 40.0% 60.0% 40.0% 20.0% 20.0%
2 1 1 1 1 0
Technicians 25.0% 50.0% 50.0% 50.0% 50.0%
0 0 0 0
0.0%
0 0 0 0
Para-
Professionals0.0%
0 0 0 0
Administrative
Support0.0%
0 0 0 0
Skilled Craft
Workers0.0%
0 0 0 0
0.0%
Totals 8 4 3 0 1 0 0 4 3 1 0 0 0 2
Percentage 100.0% 50.0% 37.5% 0.0% 12.5% 0.0% 0.0% 50.0% 37.5% 12.5% 0.0% 0.0% 0.0% 25.0%
Total
Minority
Protective
Services
Service/Mainten
ance Workers
Males FemalesGrand
Total
Native
Am
Native
Am

Juvenile Court as of June 30,. 2011
Total White Black Hispanic Asian Total White Black Hispanic Asian
0 0 0 0
Officials and
Administrators0.0%
16 6 5 1 10 8 2 3
Professionals 59.3% 37.5% 31.3% 6.3% 62.5% 50.0% 12.5% 18.8%
0 0 0 0
Technicians 0.0%
4 3 1 2 1 1 3
14.8% 75.0% 25.0% 50.0% 25.0% 25.0% 75.0%
0 0 0 0
Para-
Professionals0.0%
7 0 7 6 1 1
Administrative
Support25.9% 100.0% 85.7% 14.3% 14.3%
0 0 0 0
Skilled Craft
Workers0.0%
0 0 0 0
0.0%
Totals 27 9 6 2 1 0 0 18 14 2 1 1 0 7
Percentage 100.0% 33.3% 22.2% 7.4% 3.7% 0.0% 0.0% 66.7% 51.9% 7.4% 3.7% 3.7% 0.0% 25.9%
Total
Minority
Protective
Services
Service/Mainten
ance Workers
Males FemalesGrand
Total
Native
Am
Native
Am
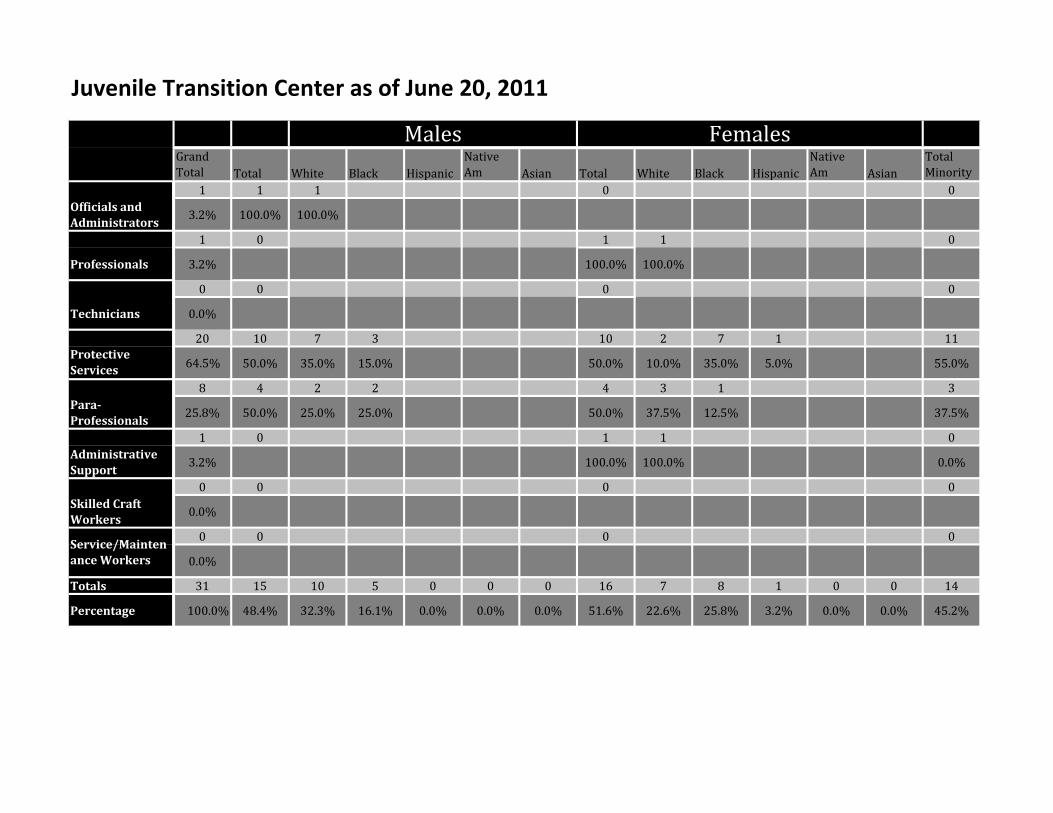
Juvenile Transition Center as of June 20, 2011
Total White Black Hispanic Asian Total White Black Hispanic Asian
1 1 1 0 0
Officials and
Administrators3.2% 100.0% 100.0%
1 0 1 1 0
Professionals 3.2% 100.0% 100.0%
0 0 0 0
Technicians 0.0%
20 10 7 3 10 2 7 1 11
64.5% 50.0% 35.0% 15.0% 50.0% 10.0% 35.0% 5.0% 55.0%
8 4 2 2 4 3 1 3
Para-
Professionals25.8% 50.0% 25.0% 25.0% 50.0% 37.5% 12.5% 37.5%
1 0 1 1 0
Administrative
Support3.2% 100.0% 100.0% 0.0%
0 0 0 0
Skilled Craft
Workers0.0%
0 0 0 0
0.0%
Totals 31 15 10 5 0 0 0 16 7 8 1 0 0 14
Percentage 100.0% 48.4% 32.3% 16.1% 0.0% 0.0% 0.0% 51.6% 22.6% 25.8% 3.2% 0.0% 0.0% 45.2%
Total
Minority
Protective
Services
Service/Mainten
ance Workers
Males FemalesGrand
Total
Native
Am
Native
Am

Mental Health as of June 30, 2011
Total White Black Hispanic Asian Total White Black Hispanic Asian
4 3 3 1 1 0
Officials and
Administrators1.4% 75.0% 75.0% 25.0% 25.0%
166 48 45 3 118 98 14 3 2 1 23
Professionals 57.2% 28.9% 4.0% 1.8% 71.1% 59.0% 8.4% 1.8% 1.2% 0.6% 13.9%
7 2 2 5 4 1 1
Technicians 2.4% 28.6% 28.6% 71.4% 57.1% 14.3% 14.3%
0 0 0 0
0.0%
80 8 4 4 72 37 28 6 1 39
Para-
Professionals27.6% 10.0% 5.0% 5.0% 90.0% 46.3% 35.0% 7.5% 1.3% 48.8%
31 0 31 30 1 1
Administrative
Support10.7% 0.0% 100.0% 96.8% 3.2% 3.2%
0 0 0 0
Skilled Craft
Workers0.0%
2 2 2 0 0
0.7% 100.0% 100.0%
Totals 290 63 56 7 0 0 0 227 170 44 9 3 1 64
Percentage 100.0% 21.7% 19.3% 2.4% 0.0% 0.0% 0.0% 78.3% 58.6% 15.2% 3.1% 1.0% 0.3% 22.1%
Total
Minority
Protective
Services
Service/Mainten
ance Workers
Males FemalesGrand
Total
Native
Am
Native
Am

MSU Extension as of June 30, 2011
Total White Black Hispanic Asian Total White Black Hispanic Asian
0 0 0 0
Officials and
Administrators0.0%
0 0 0 0
Professionals 0.0%
0 0 0 0
Technicians 0.0%
0 0 0 0
0.0%
0 0 0 0
Para-
Professionals0.0%
1 0 1 1 0
Administrative
Support100.0% 100.0% 100.0%
0 0 0 0
Skilled Craft
Workers0.0%
0 0 0 0
0.0%
Totals 1 0 0 0 0 0 0 1 1 0 0 0 0 0
Percentage 100.0% 0.0% 0.0% 0.0% 0.0% 0.0% 0.0% 100.0% 100.0% 0.0% 0.0% 0.0% 0.0% 0.0%
Total
Minority
Protective
Services
Service/Mainten
ance Workers
Males FemalesGrand
Total
Native
Am
Native
Am

Northside Water as of June 30, 2011
Total White Black Hispanic Asian Total White Black Hispanic Asian
0 0 0 0
Officials and
Administrators0.0%
1 1 1 0 0
Professionals 25.0% 100.0% 100.0%
1 0 1 1 0
Technicians 25.0% 100.0% 100.0%
0 0 0 0
0.0%
0 0 0 0
Para-
Professionals0.0%
2 0 2 2 0
Administrative
Support50.0% 100.0% 100.0%
0 0 0 0
Skilled Craft
Workers0.0%
0 0 0 0
0.0%
Totals 4 1 1 0 0 0 0 3 3 0 0 0 0 0
Percentage 100.0% 25.0% 25.0% 0.0% 0.0% 0.0% 0.0% 75.0% 75.0% 0.0% 0.0% 0.0% 0.0% 0.0%
Total
Minority
Protective
Services
Service/Mainten
ance Workers
Males FemalesGrand
Total
Native
Am
Native
Am
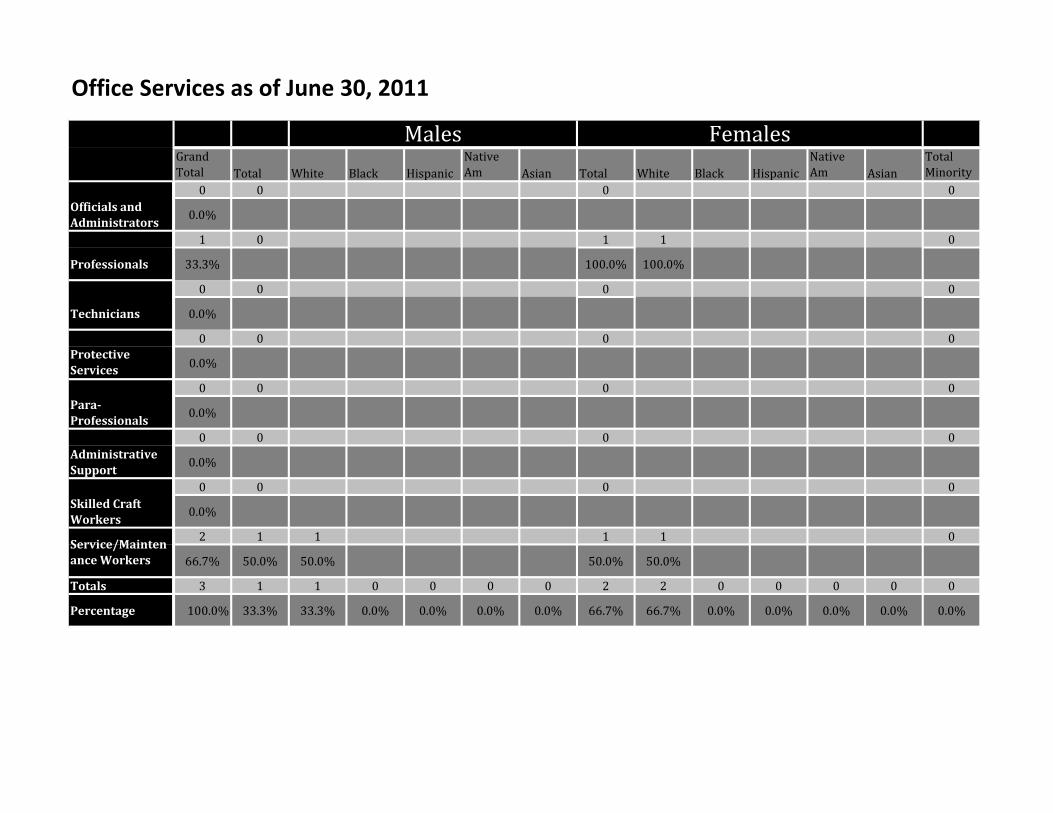
Office Services as of June 30, 2011
Total White Black Hispanic Asian Total White Black Hispanic Asian
0 0 0 0
Officials and
Administrators0.0%
1 0 1 1 0
Professionals 33.3% 100.0% 100.0%
0 0 0 0
Technicians 0.0%
0 0 0 0
0.0%
0 0 0 0
Para-
Professionals0.0%
0 0 0 0
Administrative
Support0.0%
0 0 0 0
Skilled Craft
Workers0.0%
2 1 1 1 1 0
66.7% 50.0% 50.0% 50.0% 50.0%
Totals 3 1 1 0 0 0 0 2 2 0 0 0 0 0
Percentage 100.0% 33.3% 33.3% 0.0% 0.0% 0.0% 0.0% 66.7% 66.7% 0.0% 0.0% 0.0% 0.0% 0.0%
Total
Minority
Protective
Services
Service/Mainten
ance Workers
Males FemalesGrand
Total
Native
Am
Native
Am

Probate Court as of June 30, 2011
Total White Black Hispanic Asian Total White Black Hispanic Asian
1 0 1 1 0
Officials and
Administrators20.0% 100.0% 100.0%
0 0 0 0
Professionals 0.0%
0 0 0 0
Technicians 0.0%
0 0 0 0
0.0%
1 0 1 1 0
Para-
Professionals20.0% 100.0% 100.0%
3 0 3 2 1 1
Administrative
Support60.0% 100.0% 66.7% 33.3% 33.3%
0 0 0 0
Skilled Craft
Workers0.0%
0 0 0 0
0.0%
Totals 5 0 0 0 0 0 0 5 4 1 0 0 0 1
Percentage 100.0% 0.0% 0.0% 0.0% 0.0% 0.0% 0.0% 100.0% 80.0% 20.0% 0.0% 0.0% 0.0% 20.0%
Total
Minority
Protective
Services
Service/Mainten
ance Workers
Males FemalesGrand
Total
Native
Am
Native
Am
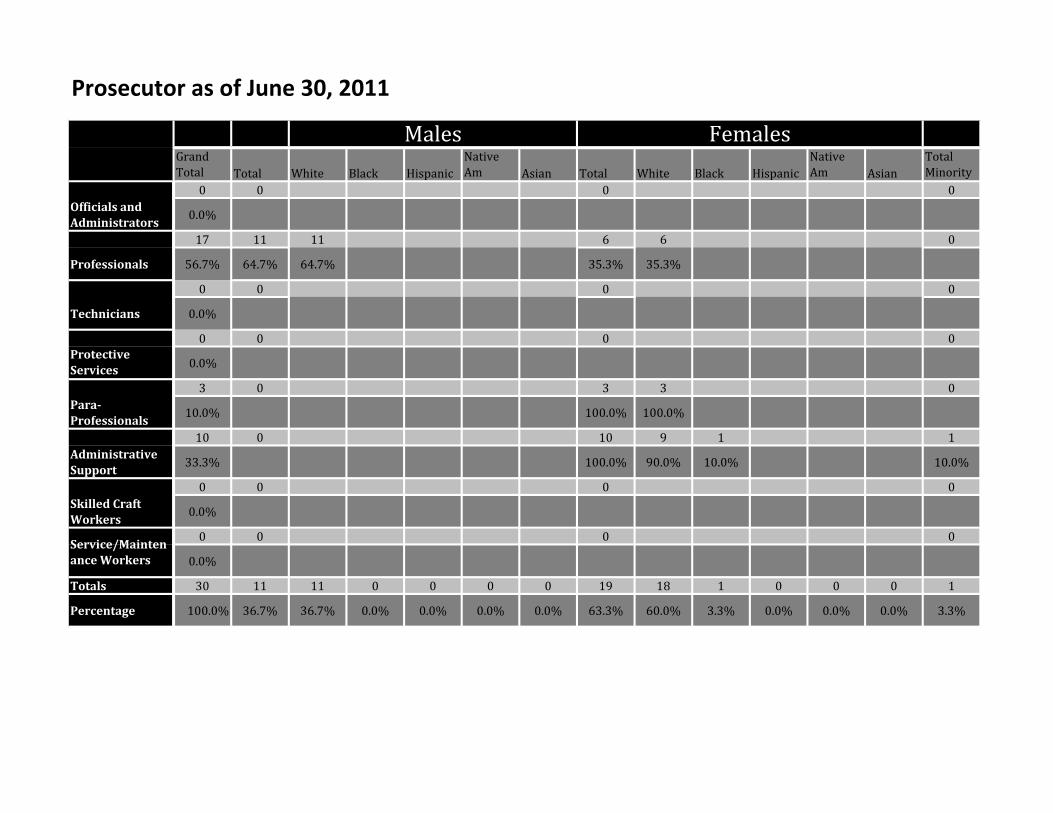
Prosecutor as of June 30, 2011
Total White Black Hispanic Asian Total White Black Hispanic Asian
0 0 0 0
Officials and
Administrators0.0%
17 11 11 6 6 0
Professionals 56.7% 64.7% 64.7% 35.3% 35.3%
0 0 0 0
Technicians 0.0%
0 0 0 0
0.0%
3 0 3 3 0
Para-
Professionals10.0% 100.0% 100.0%
10 0 10 9 1 1
Administrative
Support33.3% 100.0% 90.0% 10.0% 10.0%
0 0 0 0
Skilled Craft
Workers0.0%
0 0 0 0
0.0%
Totals 30 11 11 0 0 0 0 19 18 1 0 0 0 1
Percentage 100.0% 36.7% 36.7% 0.0% 0.0% 0.0% 0.0% 63.3% 60.0% 3.3% 0.0% 0.0% 0.0% 3.3%
Total
Minority
Protective
Services
Service/Mainten
ance Workers
Males FemalesGrand
Total
Native
Am
Native
Am

Purchasing as of June 30, 2011
Total White Black Hispanic Asian Total White Black Hispanic Asian
0 0 0 0
Officials and
Administrators0.0%
0 0 0 0
Professionals 0.0%
0 0 0 0
Technicians 0.0%
0 0 0 0
0.0%
2 1 1 1 1 0
Para-
Professionals66.7% 50.0% 50.0% 50.0% 50.0%
1 0 1 1 1
Administrative
Support33.3% 100.0% 0.0% 100.0% 100.0%
0 0 0 0
Skilled Craft
Workers0.0%
0 0 0 0
0.0%
Totals 3 1 1 0 0 0 0 2 1 0 1 0 0 1
Percentage 100.0% 33.3% 33.3% 0.0% 0.0% 0.0% 0.0% 66.7% 33.3% 0.0% 33.3% 0.0% 0.0% 33.3%
Total
Minority
Protective
Services
Service/Mainten
ance Workers
Males FemalesGrand
Total
Native
Am
Native
Am

Register of Deeds as of June 30, 2011
Total White Black Hispanic Asian Total White Black Hispanic Asian
0 0 0 0
Officials and
Administrators0.0%
0 0 0 0
Professionals 0.0%
0 0 0 0
Technicians 0.0%
0 0 0 0
0.0%
0 0 0 0
Para-
Professionals0.0%
6 0 6 6 0
Administrative
Support100.0% 100.0% 100.0%
0 0 0 0
Skilled Craft
Workers0.0%
0 0 0 0
0.0%
Totals 6 0 0 0 0 0 0 6 6 0 0 0 0 0
Percentage 100.0% 0.0% 0.0% 0.0% 0.0% 0.0% 0.0% 100.0% 100.0% 0.0% 0.0% 0.0% 0.0% 0.0%
Total
Minority
Protective
Services
Service/Mainten
ance Workers
Males FemalesGrand
Total
Native
Am
Native
Am

Sheriff as of June 30, 2011
Total White Black Hispanic Asian Total White Black Hispanic Asian
0 0 0 0
Officials and
Administrators0.0%
4 3 3 1 1 0
Professionals 3.0% 75.0% 75.0% 25.0% 25.0% 0.0%
0 0 0 0
Technicians 0.0%
116 102 90 9 3 14 11 3 15
87.9% 87.9% 77.6% 7.8% 2.6% 12.1% 9.5% 2.6% 12.9%
0 0 0 0
Para-
Professionals0.0%
10 0 10 7 3 3
Administrative
Support7.6% 100.0% 70.0% 30.0% 30.0%
1 1 1 0 0
Skilled Craft
Workers0.8% 100.0% 100.0%
1 1 1 0 0
0.8% 100.0% 100.0%
Totals 132 107 95 9 3 0 0 25 19 6 0 0 0 18
Percentage 100.0% 81.1% 72.0% 6.8% 2.3% 0.0% 0.0% 18.9% 14.4% 4.5% 0.0% 0.0% 0.0% 13.6%
Total
Minority
Protective
Services
Service/Mainten
ance Workers
Males FemalesGrand
Total
Native
Am
Native
Am
Solidwaste as of June 30, 2011
Total White Black Hispanic Asian Total White Black Hispanic Asian
2 2 2 0 0
Officials and
Administrators16.7% 100.0% 100.0%
2 1 1 1 1 0
Professionals 16.7% 50.0% 50.0% 50.0% 50.0%
1 0 1 1 0
Technicians 8.3% 0.0% 100.0% 100.0%
0 0 0 0
0.0%
0 0 0 0
Para-
Professionals0.0%
2 2 2 0 0
Administrative
Support16.7% 100.0% 100.0%
5 5 4 1 0 1
Skilled Craft
Workers41.7% 100.0% 80.0% 20.0% 20.0%
0 0 0 0
0.0%
Totals 12 10 9 0 0 1 0 2 2 0 0 0 0 1
Percentage 100.0% 83.3% 75.0% 0.0% 0.0% 8.3% 0.0% 16.7% 16.7% 0.0% 0.0% 0.0% 0.0% 8.3%
Total
Minority
Protective
Services
Service/Mainten
ance Workers
Males FemalesGrand
Total
Native
Am
Native
Am

Transit as of June 30, 2011
Total White Black Hispanic Asian Total White Black Hispanic Asian
1 1 1 0 0
Officials and
Administrators2.1% 100.0% 100.0%
0 0 0 0
Professionals 0.0%
0 0 0 0
Technicians 0.0%
0 0 0 0
0.0%
0 0 0 0
Para-
Professionals0.0%
4 0 4 4 0
Administrative
Support8.5% 100.0% 100.0%
2 2 2 0 0
Skilled Craft
Workers4.3% 100.0% 100.0%
40 26 11 13 1 1 14 6 8 23
85.1% 65.0% 27.5% 32.5% 2.5% 2.5% 35.0% 15.0% 20.0% 57.5%
Totals 47 29 14 13 1 1 0 18 10 8 0 0 0 23
Percentage 100.0% 61.7% 29.8% 27.7% 2.1% 2.1% 0.0% 38.3% 21.3% 17.0% 0.0% 0.0% 0.0% 48.9%
Total
Minority
Protective
Services
Service/Mainten
ance Workers
Males FemalesGrand
Total
Native
Am
Native
Am

Treasurer as of June 30, 2011
Total White Black Hispanic Asian Total White Black Hispanic Asian
0 0 0 0
Officials and
Administrators0.0%
1 1 1 0 1
Professionals 14.3% 100.0% 100.0% 100.0%
1 0 1 1 0
Technicians 14.3% 100.0% 100.0%
0 0 0 0
0.0%
0 0 0 0
Para-
Professionals0.0%
5 1 1 4 4 0
Administrative
Support71.4% 20.0% 20.0% 80.0% 80.0%
0 0 0 0
Skilled Craft
Workers0.0%
0 0 0 0
0.0%
Totals 7 2 1 1 0 0 0 5 5 0 0 0 0 1
Percentage 100.0% 28.6% 14.3% 14.3% 0.0% 0.0% 0.0% 71.4% 71.4% 0.0% 0.0% 0.0% 0.0% 14.3%
Total
Minority
Protective
Services
Service/Mainten
ance Workers
Males FemalesGrand
Total
Native
Am
Native
Am

Wastewater as of June 30, 2011
Total White Black Hispanic Asian Total White Black Hispanic Asian
3 3 2 1 0 1
Officials and
Administrators6.3% 100.0% 66.7% 33.3% 33.3%
7 6 5 1 1 1 1
Professionals 14.6% 85.7% 71.4% 14.3% 14.3% 14.3% 14.3%
12 8 8 4 3 1 1
Technicians 25.0% 66.7% 66.7% 33.3% 25.0% 8.3% 8.3%
0 0 0 0
0.0%
0 0 0 0
Para-
Professionals0.0%
2 0 2 2 0
Administrative
Support4.2% 0.0% 100.0% 100.0%
17 16 15 1 1 1 1
Skilled Craft
Workers35.4% 94.1% 88.2% 5.9% 5.9% 5.9% 5.9%
7 7 4 2 1 0 3
14.6% 100.0% 57.1% 28.6% 14.3% 42.9%
Totals 48 40 34 3 1 1 1 8 7 1 0 0 0 7
Percentage 100.0% 83.3% 70.8% 6.3% 2.1% 2.1% 2.1% 16.7% 14.6% 2.1% 0.0% 0.0% 0.0% 14.6%
Total
Minority
Protective
Services
Service/Mainten
ance Workers
Males FemalesGrand
Total
Native
Am
Native
Am

Overall Workforce as of June 30, 2011
Total White Black Hispanic Asian Total White Black Hispanic Asian
38 23 19 2 1 0 1 15 12 2 1 0 0 7
Officials and
Administrators3.2% 60.5% 50.0% 5.3% 2.6% 2.6% 39.5% 31.6% 5.3% 2.6% 18.4%
327 110 97 9 2 2 0 217 187 21 5 2 2 43
Professionals 27.6% 33.6% 29.7% 2.8% 0.6% 0.6% 66.4% 57.2% 6.4% 1.5% 0.6% 0.6% 13.1%
96 25 25 0 0 0 0 71 61 8 2 0 0 10
Technicians 8.1% 26.0% 26.0% 74.0% 63.5% 8.3% 2.1% 10.4%
145 118 101 14 3 0 0 27 14 11 2 0 0 30
12.2% 81.4% 69.7% 9.7% 2.1% 18.6% 9.7% 7.6% 1.4% 20.7%
222 19 10 8 1 0 0 203 103 89 7 4 0 109
Para-
Professionals18.8% 8.6% 4.5% 3.6% 0.5% 91.4% 46.4% 40.1% 3.2% 1.8% 49.1%
199 4 4 0 0 0 0 195 178 8 7 2 0 17
Administrative
Support16.8% 2.0% 2.0% 98.0% 89.4% 4.0% 3.5% 1.0% 8.5%
31 30 27 1 0 2 0 1 1 0 0 0 0 3
Skilled Craft
Workers2.6% 96.8% 87.1% 3.2% 6.5% 3.2% 3.2% 9.7%
126 72 49 20 2 1 0 54 30 23 1 0 0 47
10.6% 57.1% 38.9% 15.9% 1.6% 0.8% 42.9% 23.8% 18.3% 0.8% 37.3%
Totals 1184 401 332 54 9 5 1 783 586 162 25 8 2 266
Percentage 100.0% 33.9% 28.0% 4.6% 0.8% 0.4% 0.1% 66.1% 49.5% 13.7% 2.1% 0.7% 0.2% 22.5%
Total
Minority
Protective
Services
Service/Mainten
ance Workers
Males FemalesGrand
Total
Native
Am
Native
Am

77.5%
18.2%
2.9%
1.1% 0.3%
Racial Breakout of All Employees as of June 30, 2011
White Black Hispanic Native Am Asian

OFFICIALS AND
ADMINISTRATORS
3.2%
PROFESSIONALS
27.5%
TECHNICIANS
8.1%
PROTECTIVE SERVICES
12.5%
PARA-PROFESSIONALS
18.7%
ADMINISTRATIVE SUPPORT
16.8%
SKILLED CRAFT WORKERS
2.6%
SERVICE/MAINTENANCE
WORKERS
10.6%
Categorical Breakout of Overall County Workforce as of June 30, 2011
1184 Employees

OFFICIALS AND
ADMINISTRATORS
3.4%
PROFESSIONALS
30.9%
TECHNICIANS
9.4%
PROTECTIVE SERVICES
12.5%
PARA-PROFESSIONALS
12.3%
ADMINISTRATIVE SUPPORT
19.8%
SKILLED CRAFT WORKERS
3.1%
SERVICE/MAINTENANCE
WORKERS
8.6%
Categorical Breakout of White Employees as of June 30, 2011
918 Employees

OFFICIALS AND
ADMINISTRATORS
1.9%
PROFESSIONALS
13.9%
TECHNICIANS
3.7%
PROTECTIVE SERVICES
11.6%
PARA-PROFESSIONALS
44.9%
ADMINISTRATIVE
SUPPORT
3.7%
SKILLED CRAFT WORKERS
0.5%
SERVICE/MAINTENANCE
WORKERS
19.9%
Categorical Breakout of Black Employees as of June 30, 2011
218 Employees

OFFICIALS AND
ADMINISTRATORS
5.9%
PROFESSIONALS
20.6%
TECHNICIANS
5.9%
PROTECTIVE SERVICES
14.7%
PARA-PROFESSIONALS
23.5%
ADMINISTRATIVE SUPPORT
20.6%
SKILLED CRAFT WORKERS
0.0%
SERVICE/MAINTENANCE
WORKERS
8.8%
Categorical Breakout of Hispanic Employees as of June 30, 2011
34 Employees

OFFICIALS AND
ADMINISTRATORS
0.0%
PROFESSIONALS
30.8%
TECHNICIANS
0.0%
PROTECTIVE SERVICES
0.0%
PARA-PROFESSIONALS
30.8%
ADMINISTRATIVE SUPPORT
15.4%
SKILLED CRAFT WORKERS
15.4%
SERVICE/MAINTENANCE
WORKERS
7.7%
Categorical Breakout of Native American Employees as of June 30, 2011
13 Employees

OFFICIALS AND
ADMINISTRATORS
33.3%
PROFESSIONALS
66.7%
TECHNICIANS
0.0%
PROTECTIVE SERVICES
0.0%
PARA-PROFESSIONALS
0.0%
ADMINISTRATIVE
SUPPORT
0.0%
SKILLED CRAFT WORKERS
0.0%
SERVICE/MAINTENANCE
WORKERS
0.0%
Categorical Breakout of Asian Employees as of June 30, 2011
3 Employees

$40,114.75
$29,104.71
$35,151.72
$35,749.92
$71,701.07
Average Salary by Racial Category as of June 30, 2011
White Black Hispanic Native Am Asian

$82,103.50
$52,956.43
$36,196.83
$41,917.35
$25,479.53
$29,541.60
$41,975.89
$23,122.58
Average Salary by Classification White Employees
as of June 30, 2011

$60,923.20
$47,291.02
$34,548.54 $34,921.28
$22,307.10
$33,458.10
$39,686.40
$23,340.31
Average Salary by Classification Black Employees
as of June 30, 2011

$75,509.20
$46,008.11
$31,285.28 $30,339.66
$23,918.96
$33,458.29
$-
$27,418.21
Average Salary by Classification Hispanic Employees as of June 30, 2011

$-
$48,469.72
$- $-
$24,115.52
$28,558.40
$41,631.20
$34,028.80
Average Salary by Classification Native American Employees
as of June 30, 2011

$76,581.44
$69,260.88
$- $- $- $- $- $-
Average Salary by Classification Asian Employees
as of June 30, 2011

$42,984.63
$35,440.78
Average Salary by Gender as of June 30, 2011
Male Female

$44,809.56
$37,454.88
Average Salary by Gender White Employees
as of June 30, 2011

$32,207.03
$28,070.60
Average Salary by Gender Black Employees
as of June 30, 2011
Male Female

$35,650.13
$34,972.29
Average Salary by Gender Hispanic Employees as of June 30, 2011
Male Female

$76,581.44
$69,260.88
Average Salary by Gender Native American Employees
as of June 30, 2011
Male Female

$44,689.63
$30,162.60
Average Salary by Gender Asian Employees
as of June 30, 2011
Male Female


![adjoining allege [e1ed3]](https://img.pdfslide.us/doc/110x75/622c4b8b81cca174c45bb343/adjoining-allege-e1ed3.jpg)