Embed Size (px)
Citation preview
EELS analysis of cation valence states and oxygen vacancies inmagnetic oxides
Z.L. Wang*, J.S. Yin, Y.D. Jiang
School of Materials Science and Engineering, Georgia Institute of Technology, Atlanta, GA 30332-0245, USA
Dedicated to Professor K.H. Kuo on the occasion of his 75th birthday
Abstract
Transition metal oxides are a class of materials that are vitally important for developing new materials with functionality and smartness.The unique properties of these materials are related to the presence of elements with mixed valences of transition elements. Electron energy-loss spectroscopy (EELS) in the transmission electron microscope is a powerful technique for measuring the valences of some transitionmetal elements of practical importance. This paper reports our current progress in applying EELS for quantitative determination of Mn andCo valences in magnetic oxides, including valence state transition, quantification of oxygen vacancies, refinement of crystal structures, andidentification of the structure of nanoparticles.q 2000 Elsevier Science Ltd. All rights reserved.
Keywords: Electron energy-loss spectroscopy; Cation valence states; Oxygen vacancies; Magnetic oxides; White line; Transition metal element
1. Introduction
Transition and rare earth metal oxides are the funda-mental ingredients for the advanced smart and functionalmaterials. Many functional properties of inorganic materialsare determined by the elements withmixed valencesin thestructure unit (Wang and Kang, 1998), by which we meanthat an element has two or more different valences whileforming a compound. The discovery of high-temperaturesuperconductors is a successful example of the mixedvalence chemistry, and the colossal magnetoresistivity(CMR) (von Helmolt et al., 1994; Jin et al., 1994) observedin the perovskite structured La12xAxMnO3 (A � Ca, Sr, orBa) is another example. Transition and rare earth metalelements with mixed valences are mandatory for thesematerials to stimulate electronic, structural and/or chemicalevolution, leading to specific functionality.
The valence states of metal cations in such materials cancertainly be chemically determined using the redox titration,but it is inapplicable to nanophase or nanostructuredmaterials such as thin films. The wet chemistry approachesusually do not provide any spatial resolution. X-ray photo-electron spectroscopy (XPS) can provide information on theaverage distribution of cation valences for nanostructuredmaterials with certain spatial resolution, but the spatial
resolution is nowhere near the desired nanometer scale,and the information provided is limited to a surface layerof 2–5 nm in thickness.
Electron energy-loss spectroscopy (EELS), a powerfultechnique for materials characterization at a nanometerspatial resolution, has been widely used in chemical micro-analysis and the studies of solid state effects (Egerton,1996). In EELS, the L ionization edges of transition-metaland rare-earth elements usually display sharp peaks at thenear-edge region, which are known aswhite lines. Fortransition metals with unoccupied 3d states, the transitionof an electron from 2p state to 3d levels leads to the forma-tion of white lines. The L3 and L2 lines are the transitionsfrom 2p3/2 to 3d3/23d5/2 and from 2p1/2 to 3d3/2, respectively,and their intensities are related to the unoccupied states in the3d bands (Pease et al., 1986; Krivanek and Paterson, 1990).
Numerous EELS experiments have shown that a changein valence state of cations introduces a dramatic change inthe ratio of the white lines, leading to the possibility ofidentifying the occupation number of 3d orbital usingEELS. Morrison et al. (1985) have applied this techniqueto study the valence modulation in FexGe12x alloy as afunction of Ge doping. The 3d and 4d occupations of transi-tion and rare earth elements have been studied systemati-cally (Pearson et al., 1988, 1993; Kurata and Colliex, 1993).The crystal structure of a new compound Mn7.5Br3O10 hasbeen refined in reference to the measured Mn valences(Mansot et al., 1994). The oxidation states of Ce and Pr
Micron 31 (2000) 571–580PERGAMON
0968-4328/00/$ - see front matterq 2000 Elsevier Science Ltd. All rights reserved.PII: S0968-4328(99)00139-0
www.elsevier.com/locate/micron
* Corresponding author. Tel.:11-404-894-8008; fax:11-404-894-9140.E-mail address:[email protected] (Z.L. Wang).
have been determined in an orthophosphate material, inwhich the constituents of Ce and Pr are in the order of100 ppm (Fortner and Buck, 1996). Lloyd et al. (1995)and Yuan et al. (1994) have demonstrated the sensitivityof the Fe white lines to the magnetic momentum of the Felayers.
In this paper, we review our current progresses made inapplying EELS for the quantitative determination of thevalence states of Mn and Co oxides. The fundamentalexperimental approach is given first. The applications of
EELS will be demonstrated for quantifying the valencetransition in Mn and Co oxides, determining the concentra-tion of oxygen vacancies, refining the crystal structure of ananion deficient perovskite, and identifying the crystalstructure of nanoparticles (CoO and Co3O4).
2. Principle of EELS measurements
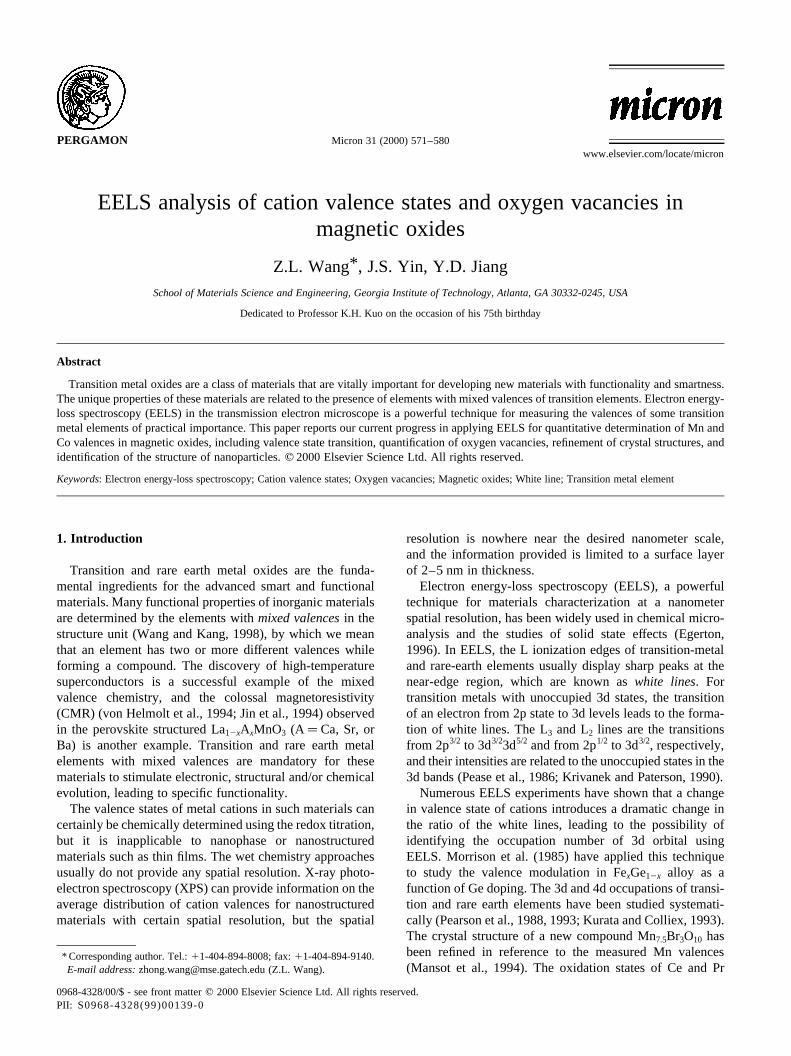
Fig. 1 shows an EELS spectrum of Co oxide acquired at200 kV using a Hitachi HF-2000 transmission electronmicroscope equipped with a Gatan 666 parallel-detectionelectron energy-loss spectrometer. The EELS spectra wereacquired in the image mode at a magnification of 40–100 Kdepending on the required spatial resolution and signalintensity. The EELS data must also be processed first toremove the gain variation introduced by the detectorchannels. A low-loss valence spectrum and the correspond-ing core-shell ionization edge EELS spectrum wereacquired consecutively from the same specimen region.The low energy-loss spectrum was used to remove themultiple-inelastic-scattering effect in the core-loss regionusing the Fourier ratio technique. Consequently, the datapresented here are the results of single inelastic scattering.
Several techniques have been proposed to correlate theobserved EELS signals with the valence states, the ratio ofwhite lines, the normalized white line intensity in referenceto the continuous state intensity located,50–100 eVbeyond the energy of the L2 line, and the absolute energyshift of the white lines. In this study, we use the white lineintensity ratio that is calculated using a method demon-strated in Fig. 1 (Pearson et al., 1988, 1993). The back-ground intensity was modeled by step functions in thethreshold regions. A straight line over a range of approxi-mately 50 eV was fit to the background intensity immedi-ately following the L2 white line. This line was thenmodified into a double step of the same slope with onsetsoccurring at the white-line maxima. The ratio of the stepheights is chosen to be 2:1 in accordance with the multi-plicity of the initial states (four 2p3/2 electrons and two 2p1/2
electrons) (Kurata and Colliex, 1993; Pearson et al., 1993;Botton et al., 1995; Lloyd et al., 1995). Although there existsome disagreements in literature about the calculation of thenormalized white line intensity because the theory behindthe white line and their continuos background is rathercomplex (Thole and van der Laan, 1988), it appears,based on our experience, that the ratio of the white lineintensities is likely to be a reliable and sensitive approach.This background subtraction procedure is followed con-sistently for all of the acquired spectra. The calculated resultof L3/L2 is rather stable and is not sensitive to the specimenthickness nor the noise level in the spectrum.
EELS analysis of valence state is carried out in referenceto the spectra acquired from standard specimens with knowncation valence states. Since the intensity ratio of L3/L2 issensitive to the valence state of the corresponding element,
Z.L. Wang et al. / Micron 31 (2000) 571–580572
Fig. 1. An EELS spectrum acquired from a Co oxide, showing the techniqueused to extract the intensities of white lines.
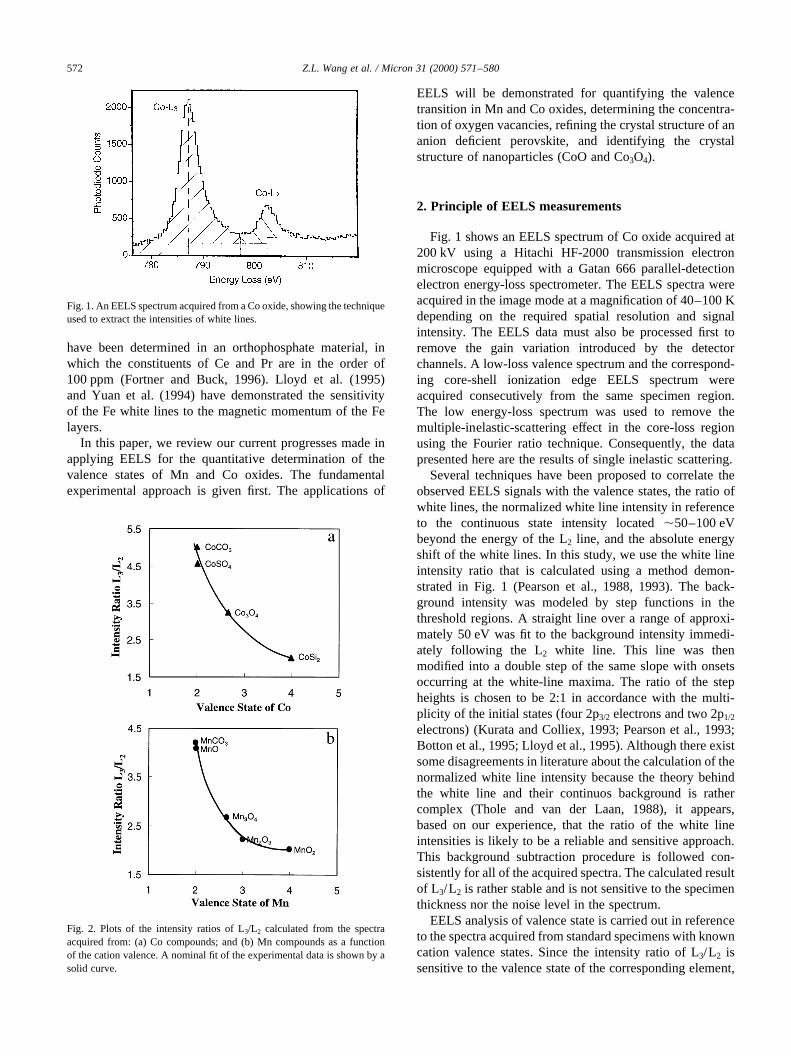
Fig. 2. Plots of the intensity ratios of L3/L2 calculated from the spectraacquired from: (a) Co compounds; and (b) Mn compounds as a functionof the cation valence. A nominal fit of the experimental data is shown by asolid curve.
if a series of EELS spectra are acquired from severalstandard specimens with known valence states, an empiricalplot of these data serves as the reference for determining thevalence state of the element present in a new compound.
The L3/L2 ratios for a few standard Co compounds areplotted in Fig. 2a. EELS spectra of Co–L2,3 ionization edgeswere acquired from CoSi2 (with Co41), Co3O4 (with
Co2.671), CoCO3 (with Co21) and CoSO4 (with Co21). Fig.2b shows a plot of the experimentally measured intensityratios of white lines L3/L2 for Mn. The curves clearly showthat the ratio of L3/L2 is very sensitive to the valence state ofCo and Mn. This is the basis of our experimental approachfor measuring the valence states of Co or Mn in a newmaterial.
Z.L. Wang et al. / Micron 31 (2000) 571–580 573
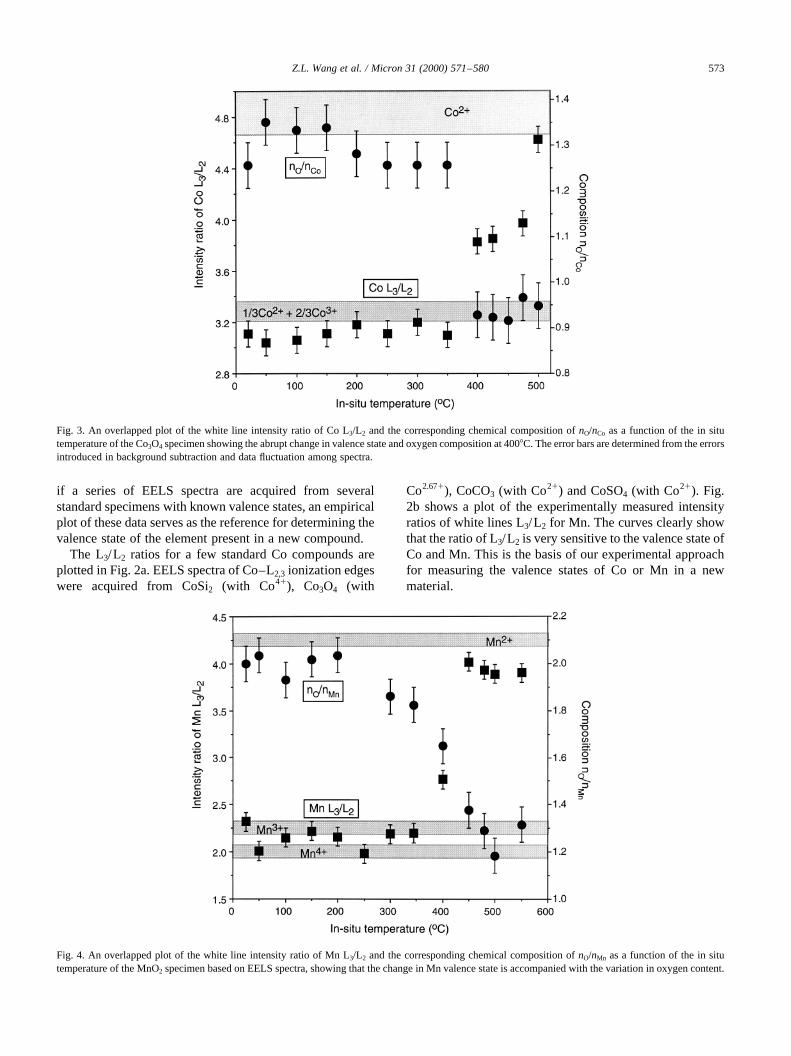
Fig. 3. An overlapped plot of the white line intensity ratio of Co L3/L2 and the corresponding chemical composition ofnO/nCo as a function of the in situtemperature of the Co3O4 specimen showing the abrupt change in valence state and oxygen composition at 4008C. The error bars are determined from the errorsintroduced in background subtraction and data fluctuation among spectra.
Fig. 4. An overlapped plot of the white line intensity ratio of Mn L3/L2 and the corresponding chemical composition ofnO/nMn as a function of the in situtemperature of the MnO2 specimen based on EELS spectra, showing that the change in Mn valence state is accompanied with the variation in oxygen content.
3. In situ observation of valence state transition
For demonstrating the sensitivity and reliability of usingwhite line intensity for the determination of the valencestates in mixed valence compounds (Wang and Yin,1998), the in situ reduction behavior of Co3O4 is examinedfirst. A Gatan TEM specimen heating stage was employed to
carry out the in situ EELS experiments, and the specimentemperature could be increased continuously from roomtemperature to 10008C. The column pressure was kept at 3×1028 Torr or lower during the in situ analysis.
Fig. 3 shows the Co L3/L2 ratio and the relative compo-sition ofnO/nCo for the same piece of crystal as the specimentemperature was increased. The specimen composition was
Z.L. Wang et al. / Micron 31 (2000) 571–580574
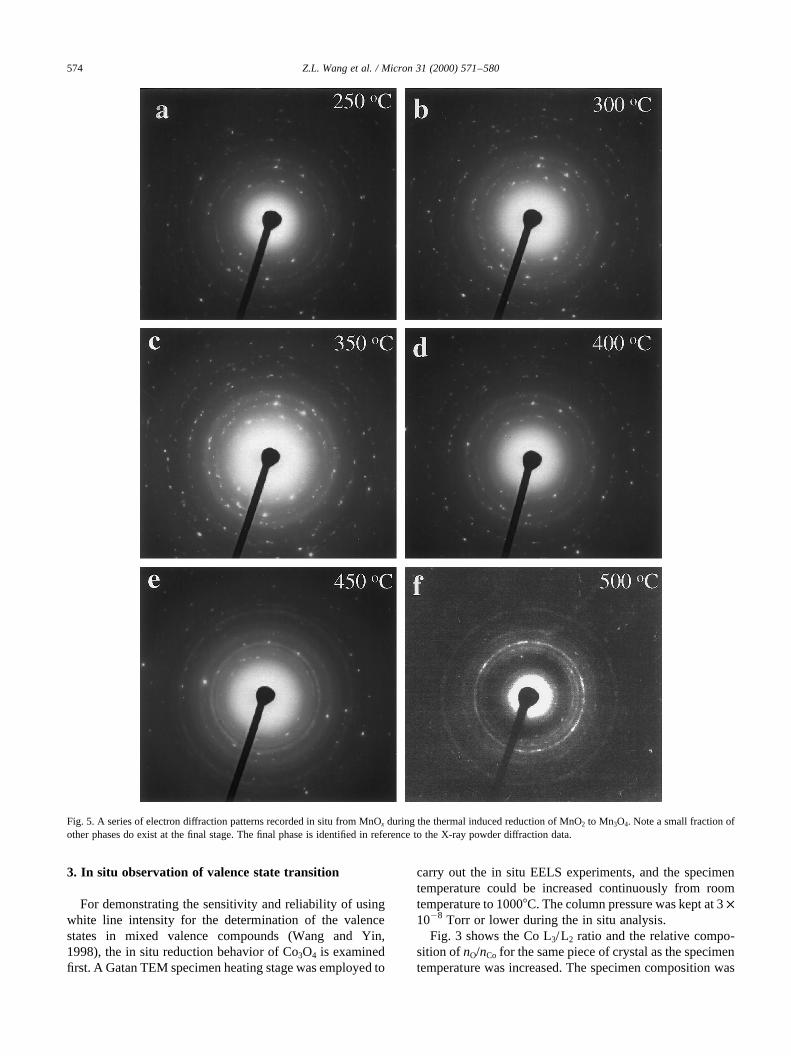
Fig. 5. A series of electron diffraction patterns recorded in situ from MnOx during the thermal induced reduction of MnO2 to Mn3O4. Note a small fraction ofother phases do exist at the final stage. The final phase is identified in reference to the X-ray powder diffraction data.
determined from the integrated intensities of the O–K andCo–L2,3 ionization edges with the use of ionization cross-sections calculated using thesigmak andsigmal programs(Egerton, 1996). The L3/L2 ratios corresponding to Co21
determined from the EELS spectra of CoSO4 and CoCO3
at room temperature, and Co2.671 obtained from Co3O4 aremarked by shadowed bands, the widths of which representexperimental error and the variation among differentcompounds. The Co L3/L2 ratio and the composition,nO/nCo, simultaneously experience a sharp change atT �4008C: The chemical composition changes from O: Co�1:33^ 0:5 to O : Co� 0:95^ 0:5 in accompany to thechange of the average valence state of Co from 2.671 to21 when the temperature is above 4008C.
The second experiment is performed on the reduction ofMnO2. Similarly, the plot of composition,nO/nMn and whiteline intensity, Mn L3/L2, are shown in Fig. 4, where theshadowed bands indicate the white line ratios for Mn21,Mn31 and Mn41 as determined from the standard specimensof MnO, Mn2O3 and MnO2, respectively. The reduction ofMnO2 occurs at 3008C. As the specimen temperatureincreases, the O/Mn ratio drops and the L3/L2 ratioincreases, which indicates the valence state conversion ofMn from 41 to lower valence states. AtT � 4008C; thespecimen contains the mixed valences of Mn41, Mn31 andMn21. As the temperature reaches 4508C, the specimenis dominated by Mn21 and Mn31 and the composition isO=Mn � 1:3^ 0:5; in correspondence of Mn3O4, which isconsistent with the mixed valence of Mn cations and impliesthe uncompleted reduction of MnO2.
To trace the relationship between the valence transitionwith the evolution of crystal structure, electron diffractionpatterns were recorded in situ at different temperatures, as
shown in Fig. 5. The crystal structure is MnO2 (with rutilestructure), and no visible change in crystallography isobserved up to 4008C. From 400 to 4508C, the crystalstructure experiences a rapid change from rutile to spinel,and the final phase at 5008C is identified to be dominatedby Mn3O4, with the presence of a small fraction of otherphases, consistent with the composition measured by EELSin Fig. 4.
Similar analysis has been performed for MnFe2O4 spinelstructured nanocrystals (Wang and Kang, 1998; Zhang etal., 1998). The AB2O4 type of spinel structure has two typesof cation lattice sites: a tetrahedral site A21 formed by fournearest-neighbor oxygen anions, and an octahedral B31 siteformed by six oxygen anions. In MnFe2O4, the percentage ofthe A sites occupied by Fe specifies the degree of valenceinversion. For a general case, the ionic structure of MnFe2O4
is written as�Mn2112xFe21
x ��Fe3112yMn31
y �O4; in which the Aand B sites can be occupied by either Mn or Fe. Themagnetic property of this material depends strongly on thedegree of inversion because the Fe21
A 2 Fe31B super-
exchange interaction is much stronger than theMn21
A 2 Fe31B interaction (Goodenough, 1971). An experi-
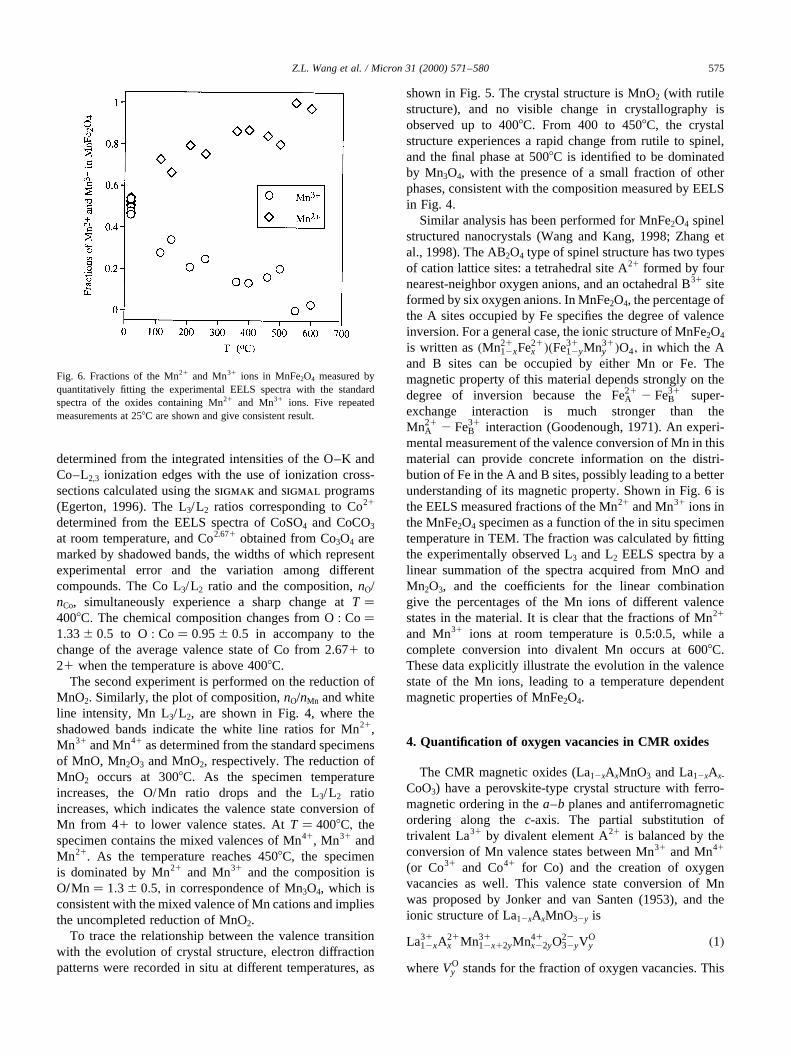
mental measurement of the valence conversion of Mn in thismaterial can provide concrete information on the distri-bution of Fe in the A and B sites, possibly leading to a betterunderstanding of its magnetic property. Shown in Fig. 6 isthe EELS measured fractions of the Mn21 and Mn31 ions inthe MnFe2O4 specimen as a function of the in situ specimentemperature in TEM. The fraction was calculated by fittingthe experimentally observed L3 and L2 EELS spectra by alinear summation of the spectra acquired from MnO andMn2O3, and the coefficients for the linear combinationgive the percentages of the Mn ions of different valencestates in the material. It is clear that the fractions of Mn21
and Mn31 ions at room temperature is 0.5:0.5, while acomplete conversion into divalent Mn occurs at 6008C.These data explicitly illustrate the evolution in the valencestate of the Mn ions, leading to a temperature dependentmagnetic properties of MnFe2O4.
4. Quantification of oxygen vacancies in CMR oxides
The CMR magnetic oxides (La12xAxMnO3 and La12xAx-
CoO3) have a perovskite-type crystal structure with ferro-magnetic ordering in thea–b planes and antiferromagneticordering along thec-axis. The partial substitution oftrivalent La31 by divalent element A21 is balanced by theconversion of Mn valence states between Mn31 and Mn41
(or Co31 and Co41 for Co) and the creation of oxygenvacancies as well. This valence state conversion of Mnwas proposed by Jonker and van Santen (1953), and theionic structure of La12xAxMnO32y is
La3112xA
21x Mn31
12x12yMn41x22yO
2232yV
Oy �1�
whereVOy stands for the fraction of oxygen vacancies. This
Z.L. Wang et al. / Micron 31 (2000) 571–580 575
Fig. 6. Fractions of the Mn21 and Mn31 ions in MnFe2O4 measured byquantitatively fitting the experimental EELS spectra with the standardspectra of the oxides containing Mn21 and Mn31 ions. Five repeatedmeasurements at 258C are shown and give consistent result.
ionization formula is proposed with an assumption that thereis no residual charge trapped in the vacancy sites.
In practice, quantifying of oxygen vacancies is achallenge to the existing microscopy techniques althoughX-ray and neutron diffuse scattering can be used todetermine vacancies in large bulk single crystallinespecimens. Moreover, for thin films grown on a crystallinesubstrate the diffraction analysis may be strongly affected bythe defects at the substrate–film interface and the surfacedisordering. In this section, we show the application ofEELS for quantifying oxygen vacancies.
From Eq. (1), the mean valence state of Mn is
kMnlvs � 3 1 x 2 2y: �2�The amount of dopingx is usually known from energydispersive X-ray microanalysis. ThekMnlvs can bedetermined using EELS based on the white line intensityas illustrated in Section 2. Therefore, the content of oxygenvacanciesy can be obtained ( Wang et al., 1997).
For a La0.67Ca0.33MnO32y thin film grown by metal-organic chemical vapor deposition, the L3/L2 ratio wasmeasured to be 2:052 2:17; thus, the average valence
state of Mn is 3.2–3.5 according to the empirical plotshown in Fig. 2b. Substituting this value into Eq. (2) forx�0:33; yields y # 0:065; which is equivalent to less than2.2 at% of the oxygen content. At the maximum oxygenvacancyymax� 0:065; the atom ratio of Mn41 to Mn31 inthe specimen is 0.25, thus, the charge introduced by Mnvalence conversion is�x 2 2y� � 0:21
; the charge due tooxygen vacancy is 2y� 0:132
; which means that 60% ofthe residual charge introduced by Ca doping is balanced bythe conversion of Mn31 to Mn41 and 40% by oxygenvacancies. Therefore, a small percentage of oxygen vacancycan introduce a large effect in balancing the charge. Quanti-fication of oxygen vacancies by this technique may havehigher sensitivity than the conventional EELS micro-analysis for such a small percentage of vacancies.
5. Refining the crystal structures of non-stoichiometricoxides
La0.5Sr0.5CoO32y is a magnetic oxide that has potentialapplications in fuel cells and ionic conductivity. The cation
Z.L. Wang et al. / Micron 31 (2000) 571–580576
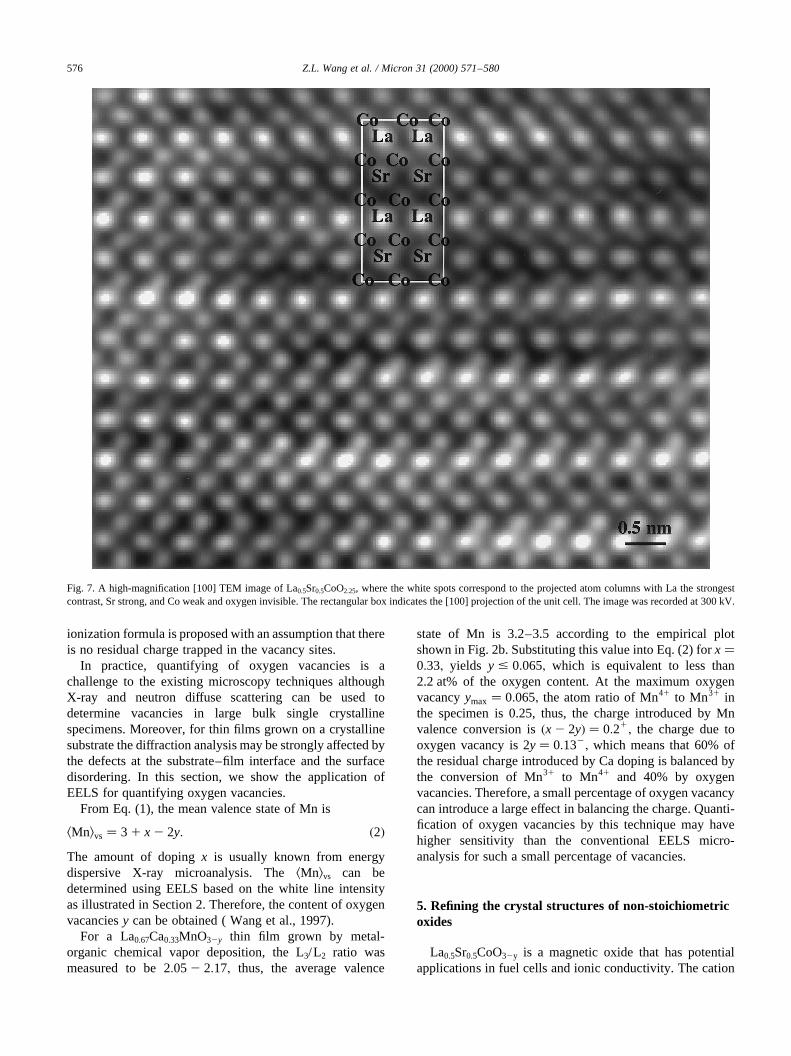
Fig. 7. A high-magnification [100] TEM image of La0.5Sr0.5CoO2.25, where the white spots correspond to the projected atom columns with La the strongestcontrast, Sr strong, and Co weak and oxygen invisible. The rectangular box indicates the [100] projection of the unit cell. The image was recorded at 300 kV.
structure of this material can be determined by high-resolution TEM. Fig. 7 shows a high-magnification TEMimage of the La0.5Sr0.5CoO32y crystal oriented along [100],exhibitingc-axis directional anisotropy structure. This typeof images can directly give the projected position of thecations in the unit cell (Wang and Zhang, 1995,1996),while no information can be provided about the distributionof oxygen anions. The image is also insensitive to thevalence state of Co.
For perovskite structured oxides, the oxygen deficiency,if any, is rather small, thus, the quantification of oxygencontent is difficult using either EELS or EDS microanalysistechnique. Alternatively, one can use EELS to measure themean valence state of Co, then applying the result todetermine the oxygen deficiency. For the specimenLa0.5Sr0.5CoO32y used to record the TEM image given inFig. 7, the mean valence of Co is determined to be 21,hence the ionic structure of this crystal is
La310:5Sr21
0:5Co21O222:25V
O0:75:
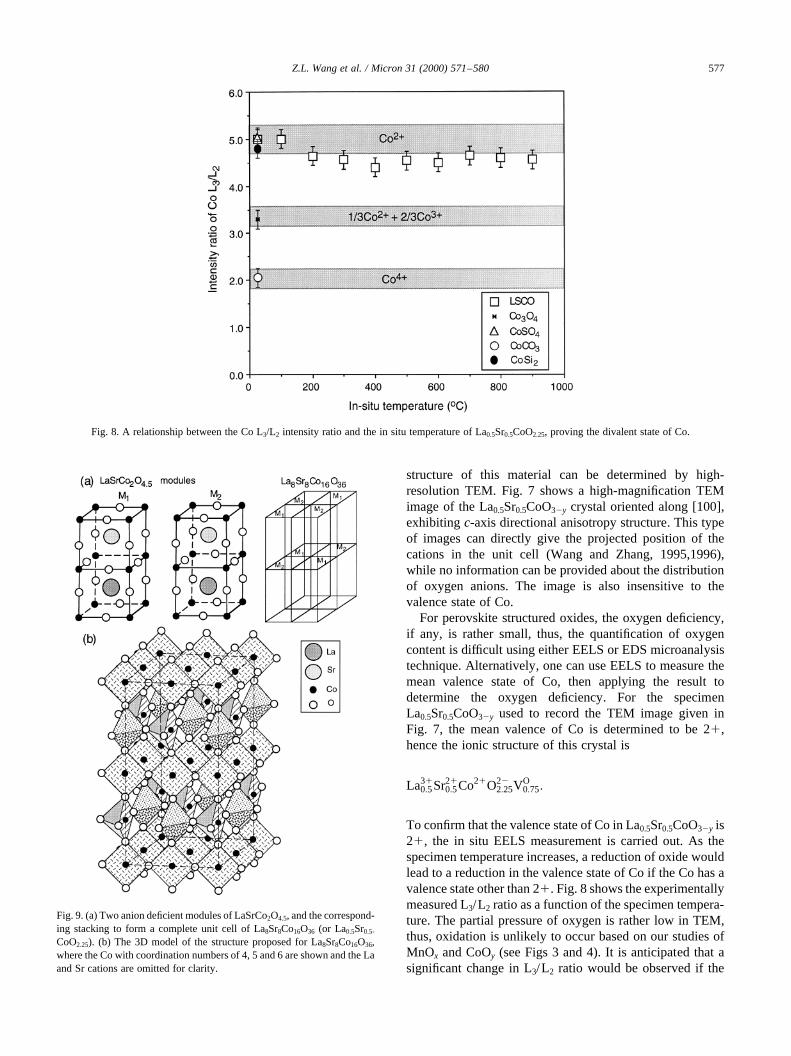
To confirm that the valence state of Co in La0.5Sr0.5CoO32y is21, the in situ EELS measurement is carried out. As thespecimen temperature increases, a reduction of oxide wouldlead to a reduction in the valence state of Co if the Co has avalence state other than 21. Fig. 8 shows the experimentallymeasured L3/L2 ratio as a function of the specimen tempera-ture. The partial pressure of oxygen is rather low in TEM,thus, oxidation is unlikely to occur based on our studies ofMnOx and CoOy (see Figs 3 and 4). It is anticipated that asignificant change in L3/L2 ratio would be observed if the
Z.L. Wang et al. / Micron 31 (2000) 571–580 577
Fig. 8. A relationship between the Co L3/L2 intensity ratio and the in situ temperature of La0.5Sr0.5CoO2.25, proving the divalent state of Co.
Fig. 9. (a) Two anion deficient modules of LaSrCo2O4.5, and the correspond-ing stacking to form a complete unit cell of La8Sr8Co16O36 (or La0.5Sr0.5-
CoO2.25). (b) The 3D model of the structure proposed for La8Sr8Co16O36,where the Co with coordination numbers of 4, 5 and 6 are shown and the Laand Sr cations are omitted for clarity.
valence state of Co changes. In contrast, the experimentallyobserved L3/L2 ratio has little dependence on the tempera-ture and the ratio remains in the Co21 range even when theoxide is totally changed crystallographically at 9008C (Yinand Wang, 1998). Therefore, the valence state of Co isundoubtedly 21. This information is important to confirm
the reliability of the structural mode proposed above. Thesurprisingly high stability of La0.5Sr0.5CoO2.25 is likely to bevery useful for ionic conductor because of the maximumdensity of oxygen vacancies.
Quantitative determination of the structure of this crystalneeds the support of data from X-ray diffraction, electrondiffraction and HRTEM imaging. More importantly, thevalence state of Co measured by EELS is indispensablefor refining the crystal structure because the compound ischemically non-stoichiometric. From electron diffraction,we also know that the oxygen vacancies are ordered in thecrystal. Fig. 9 gives the structural model proposed based onall of the known structure information (Wang and Yin,1998). The unit cell is made of two fundamental structuralmodules M1 and M2 and its crystal structure is La8Sr8-
Co16O36, while the entire structure still preserves the char-acteristics of perovskite framework and is a superstructureinduced by an ordered structure of oxygen vacancies. Thepolyhedra formed by the oxygen anions that coordinate a Coatom can be a planar square (coordination number�CN� �4�; a square-based pyramid�CN� 5�; or a octahedron�CN � 6�: These modules are required to balance thechemical structure of the crystal.
6. Identification of the structure of nanoparticles
Determination of the crystal structure of nanoparticles is achallenge particularly when the particles are smaller than5 nm. The intensity maxim observed in the X-ray or electron
Z.L. Wang et al. / Micron 31 (2000) 571–580578
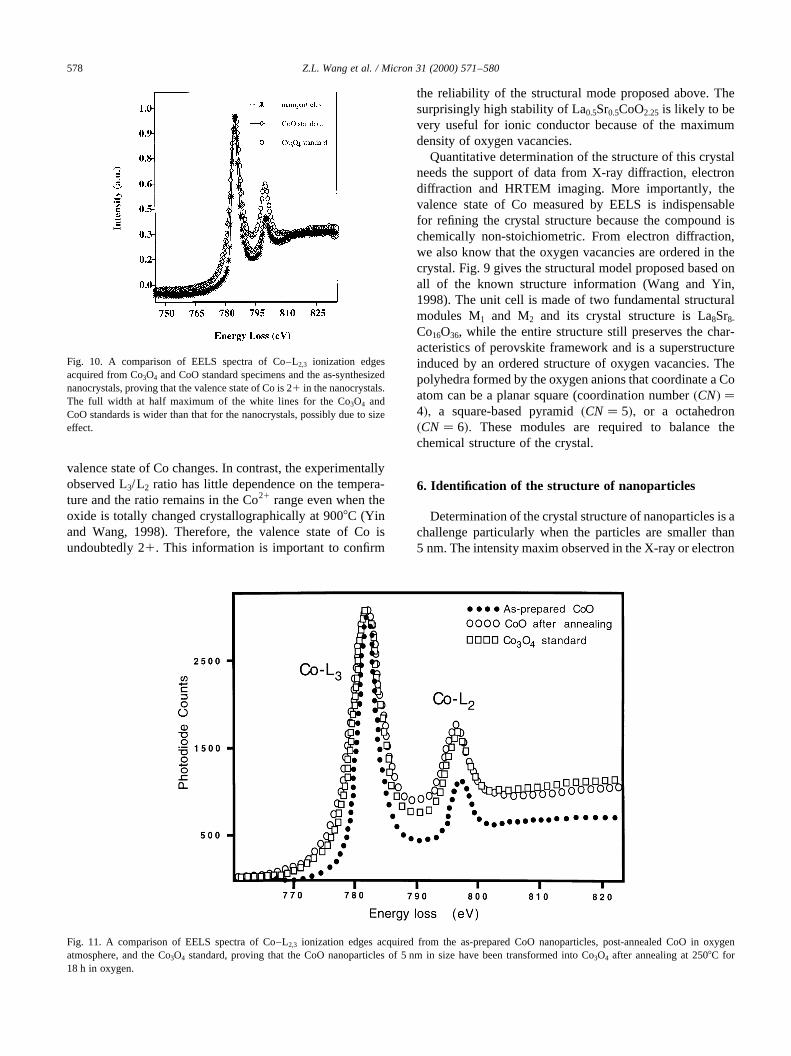
Fig. 10. A comparison of EELS spectra of Co–L2,3 ionization edgesacquired from Co3O4 and CoO standard specimens and the as-synthesizednanocrystals, proving that the valence state of Co is 21 in the nanocrystals.The full width at half maximum of the white lines for the Co3O4 andCoO standards is wider than that for the nanocrystals, possibly due to sizeeffect.
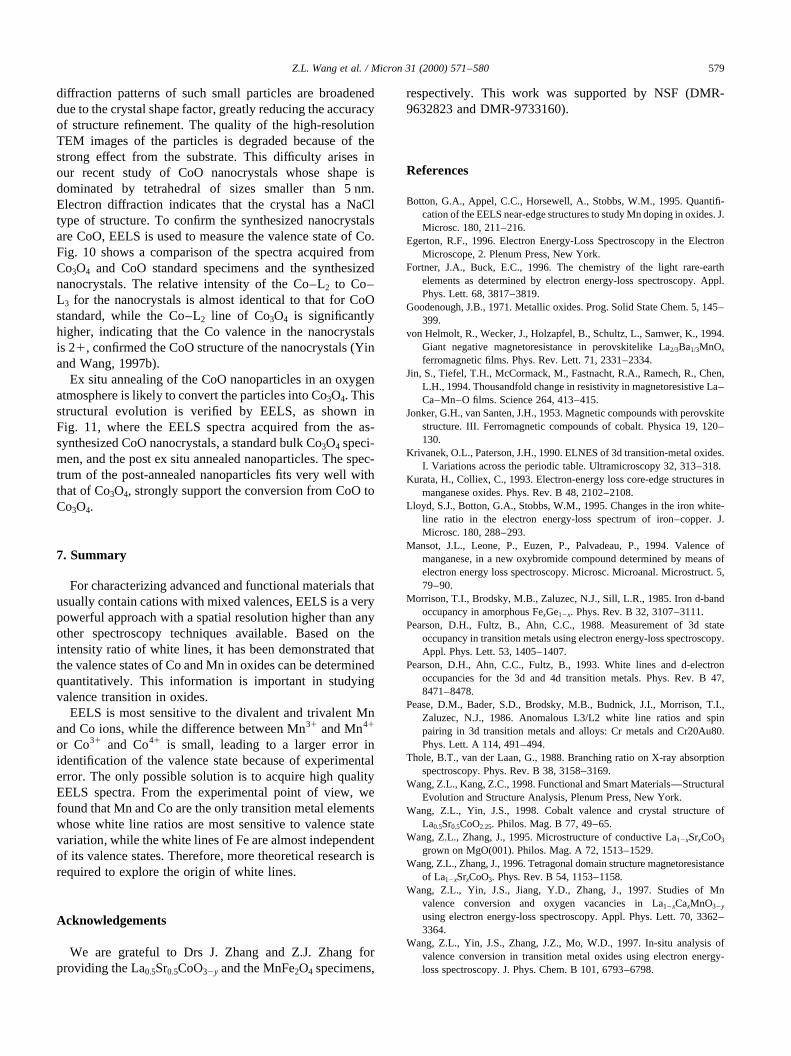
Fig. 11. A comparison of EELS spectra of Co–L2,3 ionization edges acquired from the as-prepared CoO nanoparticles, post-annealed CoO in oxygenatmosphere, and the Co3O4 standard, proving that the CoO nanoparticles of 5 nm in size have been transformed into Co3O4 after annealing at 2508C for18 h in oxygen.
diffraction patterns of such small particles are broadeneddue to the crystal shape factor, greatly reducing the accuracyof structure refinement. The quality of the high-resolutionTEM images of the particles is degraded because of thestrong effect from the substrate. This difficulty arises inour recent study of CoO nanocrystals whose shape isdominated by tetrahedral of sizes smaller than 5 nm.Electron diffraction indicates that the crystal has a NaCltype of structure. To confirm the synthesized nanocrystalsare CoO, EELS is used to measure the valence state of Co.Fig. 10 shows a comparison of the spectra acquired fromCo3O4 and CoO standard specimens and the synthesizednanocrystals. The relative intensity of the Co–L2 to Co–L3 for the nanocrystals is almost identical to that for CoOstandard, while the Co–L2 line of Co3O4 is significantlyhigher, indicating that the Co valence in the nanocrystalsis 21, confirmed the CoO structure of the nanocrystals (Yinand Wang, 1997b).
Ex situ annealing of the CoO nanoparticles in an oxygenatmosphere is likely to convert the particles into Co3O4. Thisstructural evolution is verified by EELS, as shown inFig. 11, where the EELS spectra acquired from the as-synthesized CoO nanocrystals, a standard bulk Co3O4 speci-men, and the post ex situ annealed nanoparticles. The spec-trum of the post-annealed nanoparticles fits very well withthat of Co3O4, strongly support the conversion from CoO toCo3O4.
7. Summary
For characterizing advanced and functional materials thatusually contain cations with mixed valences, EELS is a verypowerful approach with a spatial resolution higher than anyother spectroscopy techniques available. Based on theintensity ratio of white lines, it has been demonstrated thatthe valence states of Co and Mn in oxides can be determinedquantitatively. This information is important in studyingvalence transition in oxides.
EELS is most sensitive to the divalent and trivalent Mnand Co ions, while the difference between Mn31 and Mn41
or Co31 and Co41 is small, leading to a larger error inidentification of the valence state because of experimentalerror. The only possible solution is to acquire high qualityEELS spectra. From the experimental point of view, wefound that Mn and Co are the only transition metal elementswhose white line ratios are most sensitive to valence statevariation, while the white lines of Fe are almost independentof its valence states. Therefore, more theoretical research isrequired to explore the origin of white lines.
Acknowledgements
We are grateful to Drs J. Zhang and Z.J. Zhang forproviding the La0.5Sr0.5CoO32y and the MnFe2O4 specimens,
respectively. This work was supported by NSF (DMR-9632823 and DMR-9733160).
References
Botton, G.A., Appel, C.C., Horsewell, A., Stobbs, W.M., 1995. Quantifi-cation of the EELS near-edge structures to study Mn doping in oxides. J.Microsc. 180, 211–216.
Egerton, R.F., 1996. Electron Energy-Loss Spectroscopy in the ElectronMicroscope, 2. Plenum Press, New York.
Fortner, J.A., Buck, E.C., 1996. The chemistry of the light rare-earthelements as determined by electron energy-loss spectroscopy. Appl.Phys. Lett. 68, 3817–3819.
Goodenough, J.B., 1971. Metallic oxides. Prog. Solid State Chem. 5, 145–399.
von Helmolt, R., Wecker, J., Holzapfel, B., Schultz, L., Samwer, K., 1994.Giant negative magnetoresistance in perovskitelike La2/3Ba1/3MnOx
ferromagnetic films. Phys. Rev. Lett. 71, 2331–2334.Jin, S., Tiefel, T.H., McCormack, M., Fastnacht, R.A., Ramech, R., Chen,
L.H., 1994. Thousandfold change in resistivity in magnetoresistive La–Ca–Mn–O films. Science 264, 413–415.
Jonker, G.H., van Santen, J.H., 1953. Magnetic compounds with perovskitestructure. III. Ferromagnetic compounds of cobalt. Physica 19, 120–130.
Krivanek, O.L., Paterson, J.H., 1990. ELNES of 3d transition-metal oxides.I. Variations across the periodic table. Ultramicroscopy 32, 313–318.
Kurata, H., Colliex, C., 1993. Electron-energy loss core-edge structures inmanganese oxides. Phys. Rev. B 48, 2102–2108.
Lloyd, S.J., Botton, G.A., Stobbs, W.M., 1995. Changes in the iron white-line ratio in the electron energy-loss spectrum of iron–copper. J.Microsc. 180, 288–293.
Mansot, J.L., Leone, P., Euzen, P., Palvadeau, P., 1994. Valence ofmanganese, in a new oxybromide compound determined by means ofelectron energy loss spectroscopy. Microsc. Microanal. Microstruct. 5,79–90.
Morrison, T.I., Brodsky, M.B., Zaluzec, N.J., Sill, L.R., 1985. Iron d-bandoccupancy in amorphous FexGe12x. Phys. Rev. B 32, 3107–3111.
Pearson, D.H., Fultz, B., Ahn, C.C., 1988. Measurement of 3d stateoccupancy in transition metals using electron energy-loss spectroscopy.Appl. Phys. Lett. 53, 1405–1407.
Pearson, D.H., Ahn, C.C., Fultz, B., 1993. White lines and d-electronoccupancies for the 3d and 4d transition metals. Phys. Rev. B 47,8471–8478.
Pease, D.M., Bader, S.D., Brodsky, M.B., Budnick, J.I., Morrison, T.I.,Zaluzec, N.J., 1986. Anomalous L3/L2 white line ratios and spinpairing in 3d transition metals and alloys: Cr metals and Cr20Au80.Phys. Lett. A 114, 491–494.
Thole, B.T., van der Laan, G., 1988. Branching ratio on X-ray absorptionspectroscopy. Phys. Rev. B 38, 3158–3169.
Wang, Z.L., Kang, Z.C., 1998. Functional and Smart Materials—StructuralEvolution and Structure Analysis, Plenum Press, New York.
Wang, Z.L., Yin, J.S., 1998. Cobalt valence and crystal structure ofLa0.5Sr0.5CoO2.25. Philos. Mag. B 77, 49–65.
Wang, Z.L., Zhang, J., 1995. Microstructure of conductive La12xSrxCoO3
grown on MgO(001). Philos. Mag. A 72, 1513–1529.Wang, Z.L., Zhang, J., 1996. Tetragonal domain structure magnetoresistance
of La12xSrxCoO3. Phys. Rev. B 54, 1153–1158.Wang, Z.L., Yin, J.S., Jiang, Y.D., Zhang, J., 1997. Studies of Mn
valence conversion and oxygen vacancies in La12xCaxMnO32y
using electron energy-loss spectroscopy. Appl. Phys. Lett. 70, 3362–3364.
Wang, Z.L., Yin, J.S., Zhang, J.Z., Mo, W.D., 1997. In-situ analysis ofvalence conversion in transition metal oxides using electron energy-loss spectroscopy. J. Phys. Chem. B 101, 6793–6798.
Z.L. Wang et al. / Micron 31 (2000) 571–580 579

Yin, J.S., Wang, Z.L., 1997. Ordered self-assembling of tetrahedral oxidenanocrystals. Phys. Rev. Lett. 79, 2570–2573.
Yin, J.S., Wang, Z.L., 1998. In-situ EELS analysis of cobalt valence inLa12xSrxCoO32y, Proceedings of the Microscopy Society America,Microscopy Society of America, Cleveland, OH.
Yuan, J., Gu, E., Gester, M., Bland, J.A.C., Brown, L.M., 1994. Electron
energy-loss spectroscopy of Fe thin-films on GaAs(001). J. Appl. Phys.75, 6501–6503.
Zhang, Z.J., Wang, Z.L., Chakoumakos, B.C., Yin, J.S., 1998. Temperaturedependence of cation distribution and oxidation state in magnetic Mn–Fe ferrite nanocrystals. J. Am. Chem. Soc. 120, 1800–1804.
Z.L. Wang et al. / Micron 31 (2000) 571–580580