Embed Size (px)
Citation preview

EEI Financial Conference November 7-8, 2016
2
Cautionary Statements Regarding Forward-Looking Information This presentation contains certain forward-looking statements within the meaning of the Private Securities Litigation Reform Act of 1995, that are subject to risks and uncertainties. The factors that could cause actual results to differ materially from the forward-looking statements made by Exelon Corporation, Exelon Generation Company, LLC, Commonwealth Edison Company, PECO Energy Company, Baltimore Gas and Electric Company, Pepco Holdings LLC (PHI), Potomac Electric Power Company, Delmarva Power & Light Company, and Atlantic City Electric Company (Registrants) include those factors discussed herein, as well as the items discussed in (1) Exelon’s 2015 Annual Report on Form 10-K in (a) ITEM 1A. Risk Factors, (b) ITEM 7. Management’s Discussion and Analysis of Financial Condition and Results of Operations and (c) ITEM 8. Financial Statements and Supplementary Data: Note 23; (2) PHI’s 2015 Annual Report on Form 10-K in (a) ITEM 1A. Risk Factors, (b) ITEM 7. Management’s Discussion and Analysis of Financial Condition and Results of Operations and (c) ITEM 8. Financial Statements and Supplementary Data: Note 16; (3) Exelon’s Third Quarter 2016 Quarterly Report on Form 10-Q in (a) Part II, Other Information, ITEM 1A. Risk Factors, (b) Part 1, Financial Information, ITEM 2. Management’s Discussion and Analysis of Financial Condition and Results of Operations and (c) Part I, Financial Information, ITEM 1. Financial Statements: Note 18; and (4) other factors discussed in filings with the SEC by the Registrants. Readers are cautioned not to place undue reliance on these forward-looking statements, which apply only as of the date of this presentation. None of the Registrants undertakes any obligation to publicly release any revision to its forward-looking statements to reflect events or circumstances after the date of this presentation.
3
Non-GAAP Financial Measures Exelon reports its financial results in accordance with accounting principles generally accepted in the United States (GAAP). Exelon supplements the reporting of financial information determined in accordance with GAAP with certain non-GAAP financial measures, including adjusted (non-GAAP) operating earnings, adjusted (non-GAAP) operating and maintenance expense, total gross margin, earnings before interest, taxes, depreciation and amortization (EBITDA), and adjusted cash flow from operations (non-GAAP) or free cash flow. Adjusted (non-GAAP) operating earnings exclude certain costs, expenses, gains and losses and other specified items, including mark-to-market adjustments from economic hedging activities, unrealized gains and losses from nuclear decommissioning trust fund investments, merger and integration costs, certain costs incurred associated with the PHI acquisition, merger commitments related to the settlement of the PHI acquisition, the impairment of certain long-lived assets, plant retirements and divestitures, costs related to the cost management program, and the non-controlling interest in CENG. Adjusted (non-GAAP) operating and maintenance expense excludes regulatory operating and maintenance costs for the utility businesses and direct cost of sales for certain Constellation businesses, decommissioning costs that do not affect profit and loss, and the impact from operating and maintenance expense related to variable interest entities at Generation. Total gross margin (non-GAAP) is defined as operating revenues less purchased power and fuel expense, excluding revenue related to decommissioning, gross receipts tax, Exelon Nuclear Partners, the operating services agreement with Fort Calhoun, variable interest entities and net of direct cost of sales for certain Constellation businesses. EBITDA is defined as earnings before interest, taxes, depreciation and amortization, including nuclear fuel amortization expense. Adjusted cash flow from operations (non-GAAP) or free cash flow primarily includes net cash flows from operating activities and net cash flows from investing activities excluding capital expenditures at ownership and nuclear fuel expense. Due to the forward-looking nature of any forecasted non-GAAP measures, information to reconcile the forecast adjusted (non-GAAP) measures to the most directly comparable GAAP measure is not currently available, as management is unable to project all of these items for future periods.
4
Non-GAAP Financial Measures Continued This information is intended to enhance an investor’s overall understanding of period-over-period financial results and provide an indication of Exelon’s baseline operating performance by excluding items that are considered by management to be not directly related to the ongoing operations of the business. In addition, this information is among the primary indicators management uses as a basis for evaluating performance, allocating resources, setting incentive compensation targets and planning and forecasting of future periods. These non-GAAP financial measures are not a presentation defined under GAAP and may not be comparable to other companies’ presentation. Exelon has provided these non-GAAP financial measure as supplemental information and in addition to the financial measures that are calculated and presented in accordance with GAAP. These non-GAAP measures should not be deemed more useful than, a substitute for, or an alternative to the most comparable GAAP measures provided in the materials presented. Reconciliations of these non-GAAP measures to the most comparable GAAP measures are provided in the footnotes, appendices and attachments to this presentation.
5
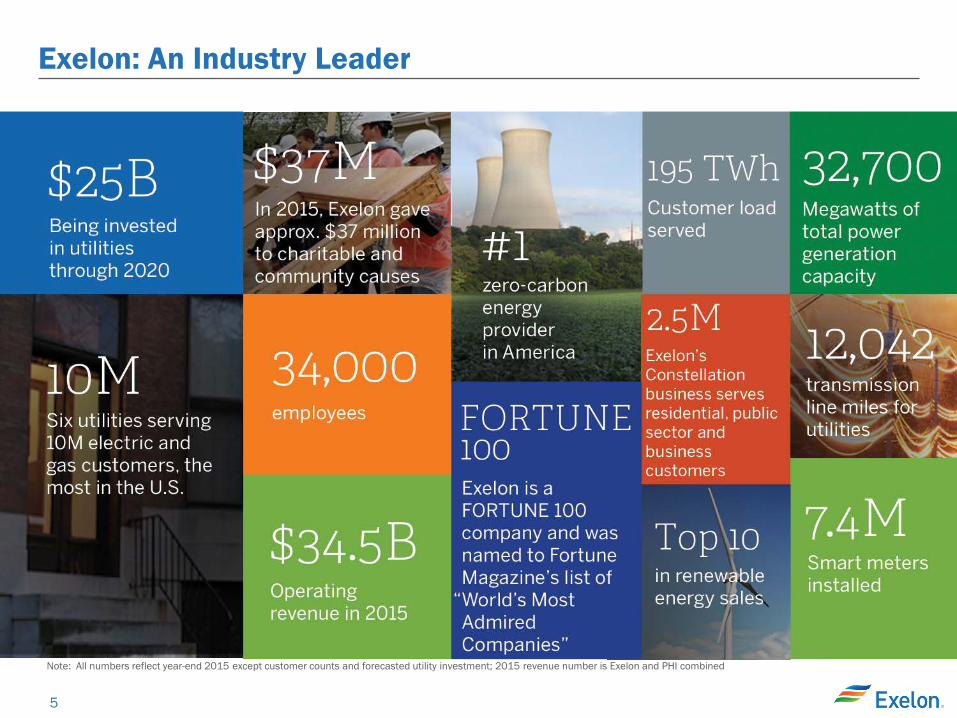
Exelon: An Industry Leader
Note: All numbers reflect year-end 2015 except customer counts and forecasted utility investment; 2015 revenue number is Exelon and PHI combined
6
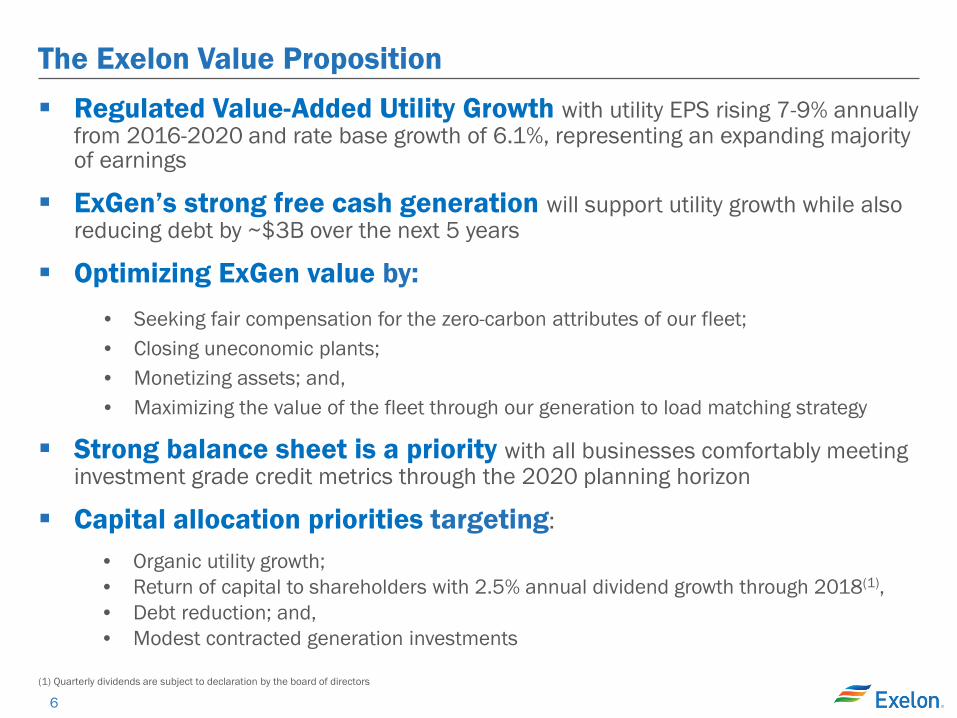
The Exelon Value Proposition Regulated Value-Added Utility Growth with utility EPS rising 7-9% annually
from 2016-2020 and rate base growth of 6.1%, representing an expanding majority of earnings
ExGen’s strong free cash generation will support utility growth while also reducing debt by ~$3B over the next 5 years
Optimizing ExGen value by: • Seeking fair compensation for the zero-carbon attributes of our fleet; • Closing uneconomic plants; • Monetizing assets; and, • Maximizing the value of the fleet through our generation to load matching strategy
Strong balance sheet is a priority with all businesses comfortably meeting investment grade credit metrics through the 2020 planning horizon
Capital allocation priorities targeting:
• Organic utility growth; • Return of capital to shareholders with 2.5% annual dividend growth through 2018(1), • Debt reduction; and, • Modest contracted generation investments
(1) Quarterly dividends are subject to declaration by the board of directors
7
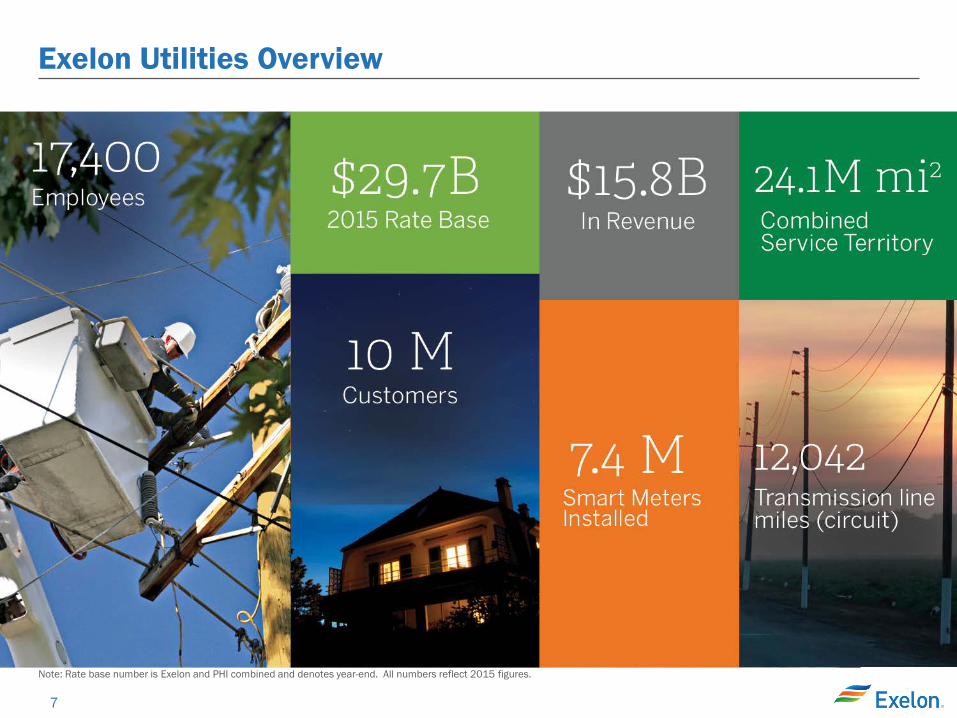
Exelon Utilities Overview
Note: Rate base number is Exelon and PHI combined and denotes year-end. All numbers reflect 2015 figures.

8
Deploying Significant Capital for Our Customers Capital Expenditures 2012-2020 ($M)
More than $25B of capital is being invested in utilities from 2016-2020
1,475 1,375 1,6002,100
3,175 3,375 3,400 3,125 3,225375 600725
850
1,475 1,200 1,1001,000 800
275
325
475 500 525525 550
450
500
475
400 250
200
3,750
5,525
2,650
2013A
225
2,275
2012A
225
3,100
2014A 2015A
5,325
150
2017E 2016E
5,175
2018E
25
2019E
4,675 4,600 25
2020E
Gas Delivery Smart Grid/Smart Meter Electric Transmission
Electric Distribution
Note: Numbers rounded to nearest $25M; Numbers may not add due to rounding; 2012 Includes a full year of capital spend for BGE; 2016 includes a full year of capital spend for PHI
9
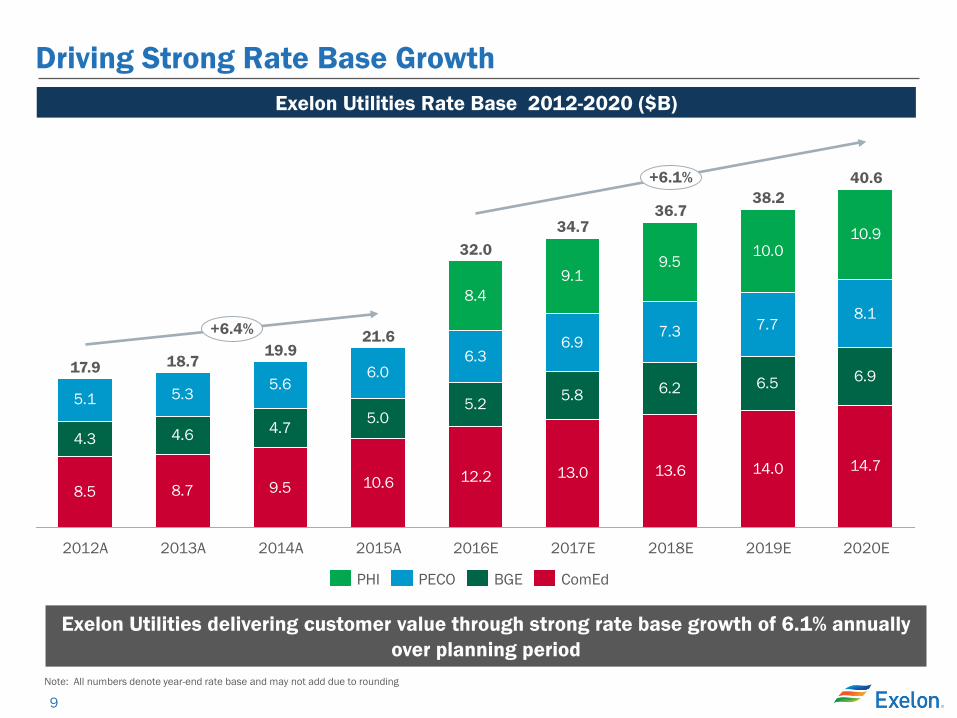
Driving Strong Rate Base Growth Exelon Utilities Rate Base 2012-2020 ($B)
Exelon Utilities delivering customer value through strong rate base growth of 6.1% annually over planning period
8.5 8.7 9.5 10.6 12.2 13.0 13.6 14.0 14.7
4.3 4.6 4.7 5.05.2 5.8 6.2 6.5 6.9
5.1 5.3 5.66.0
6.36.9
7.3 7.78.1
8.49.1
9.510.0
10.9
+6.1%
+6.4%
2020E
40.6
2019E
38.2
2018E
36.7
2017E
34.7
2016E
32.0
2015A
21.6
2014A
19.9
2013A
18.7
2012A
17.9
ComEd BGE PECO PHI
Note: All numbers denote year-end rate base and may not add due to rounding
10
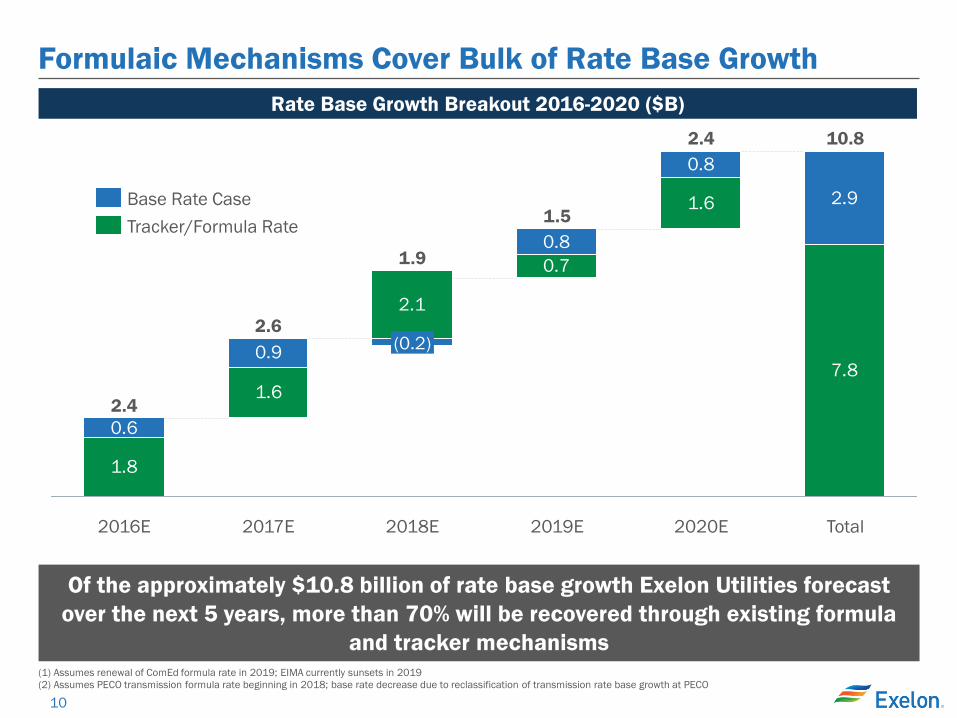
Formulaic Mechanisms Cover Bulk of Rate Base Growth
1.8
1.6
0.7
1.6
7.8
0.6
0.9
2.1
0.8
0.8
2.9
2018E
1.9
Total
10.8
2020E
2.4
2019E
1.5
(0.2)
2017E
2.6
2016E
2.4
Tracker/Formula Rate Base Rate Case
Of the approximately $10.8 billion of rate base growth Exelon Utilities forecast over the next 5 years, more than 70% will be recovered through existing formula
and tracker mechanisms
Rate Base Growth Breakout 2016-2020 ($B)
(1) Assumes renewal of ComEd formula rate in 2019; EIMA currently sunsets in 2019 (2) Assumes PECO transmission formula rate beginning in 2018; base rate decrease due to reclassification of transmission rate base growth at PECO
11
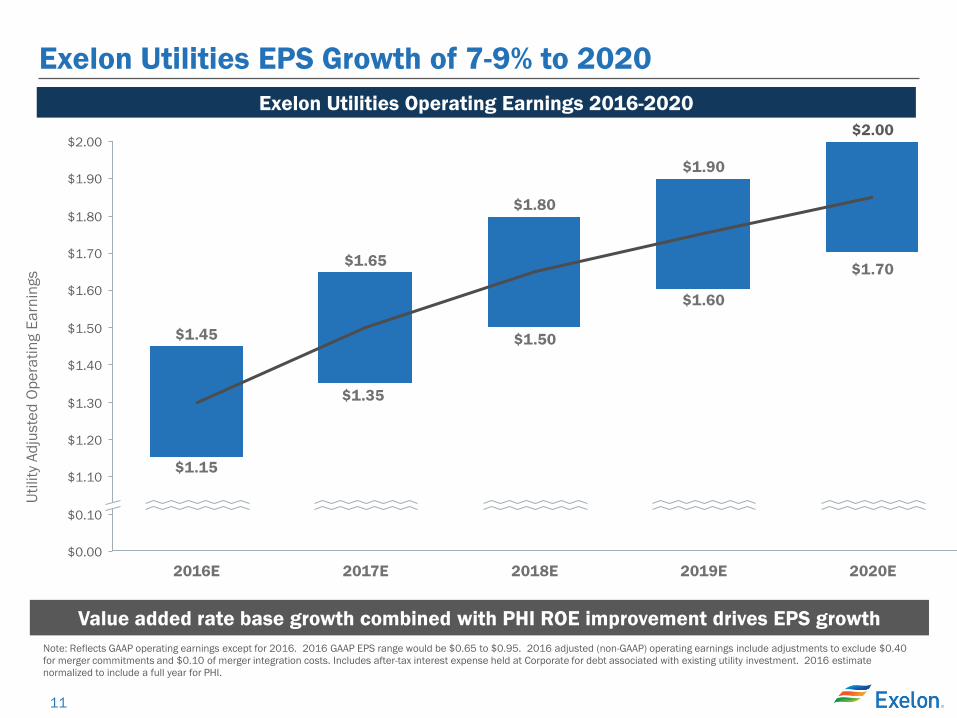
Exelon Utilities EPS Growth of 7-9% to 2020
$0.00
$1.10
$0.10
$1.70
$1.30
$1.60
$1.40
$1.20
$1.50
$1.90
$1.80
$2.00
$1.45
$2.00
2020E 2019E 2018E
$1.90
2017E
$1.65
$1.80
2016E
$1.60
$1.50
$1.15
Utili
ty A
djus
ted
Oper
atin
g Ea
rnin
gs
Value added rate base growth combined with PHI ROE improvement drives EPS growth
$1.35
Note: Reflects GAAP operating earnings except for 2016. 2016 GAAP EPS range would be $0.65 to $0.95. 2016 adjusted (non-GAAP) operating earnings include adjustments to exclude $0.40 for merger commitments and $0.10 of merger integration costs. Includes after-tax interest expense held at Corporate for debt associated with existing utility investment. 2016 estimate normalized to include a full year for PHI.
$1.70
Exelon Utilities Operating Earnings 2016-2020

12
Proven Track Record of Improving Operational Performance
Operations Metric At CEG Merger (2012) 2015 2015
BGE PECO ComEd BGE PECO ComEd PHI
Electric Operations
OSHA Recordable Rate
2.5 Beta SAIFI (Outage Frequency)
2.5 Beta CAIDI (Outage Duration)
Customer Operations
Customer Satisfaction N/A
Service Level % of Calls Answered in <30 sec
Abandon Rate
Gas Operations
Percent of Calls Responded to in <1 Hour
No Gas Operations
No Gas
Operations 3rd Party Damages per 1000 Gas Locates
Overall Rank Electric Utility Panel of 24 Utilities(1) 23rd 2nd 2nd 4th 2nd 3rd 18th
Q1 Q2Q3 Q4
Performance Quartiles
Exelon Utilities has identified and transferred best practices at each of its utilities to improve operating performance in areas such as: • System Performance • Emergency Preparedness • Corrective and Preventive Maintenance
Significant opportunity for operating performance improvements at PHI (1) Ranking based on results of five key industry performance indicators – CAIDI, SAIFI, Safety, Customer Satisfaction, and Cost per Customer
13
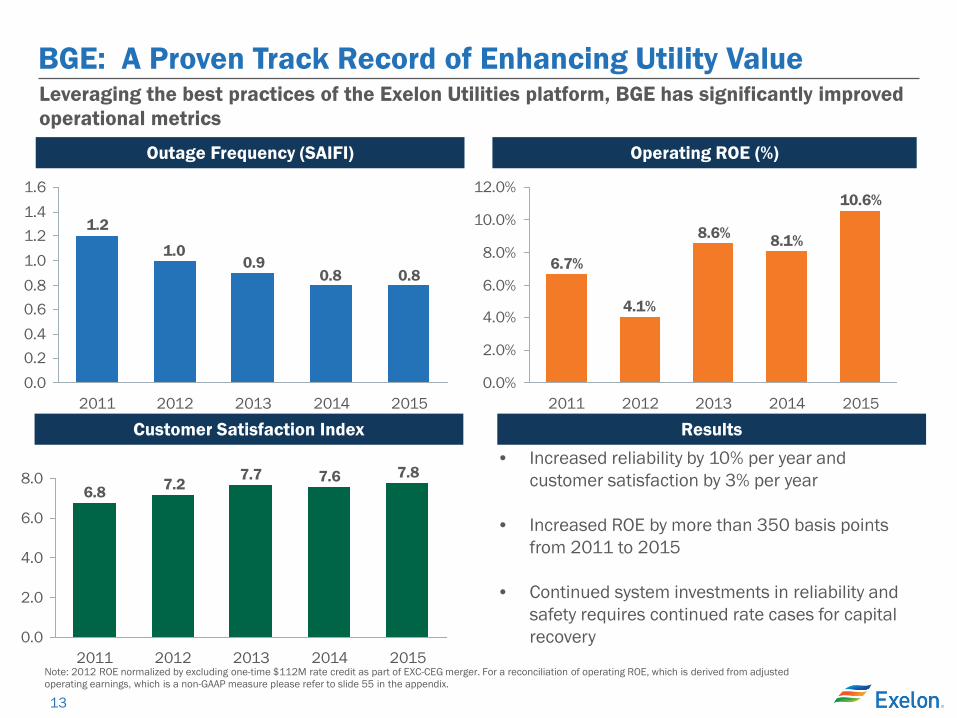
BGE: A Proven Track Record of Enhancing Utility Value
Note: 2012 ROE normalized by excluding one-time $112M rate credit as part of EXC-CEG merger. For a reconciliation of operating ROE, which is derived from adjusted operating earnings, which is a non-GAAP measure please refer to slide 55 in the appendix.
• Increased reliability by 10% per year and customer satisfaction by 3% per year
• Increased ROE by more than 350 basis points from 2011 to 2015
• Continued system investments in reliability and safety requires continued rate cases for capital recovery
Leveraging the best practices of the Exelon Utilities platform, BGE has significantly improved operational metrics
Outage Frequency (SAIFI) Operating ROE (%)
0.80.80.9
1.0
1.2
0.00.20.40.60.81.01.21.41.6
2013 2015 2014 2011 2012
Customer Satisfaction Index
7.87.67.77.26.8
0.0
2.0
4.0
6.0
8.0
2012 2013 2014 2015 2011
Results
10.6%
8.1%
4.1%
6.7%
8.6%
0.0%
2.0%
4.0%
6.0%
8.0%
10.0%
12.0%
2011 2012 2013 2014 2015
14
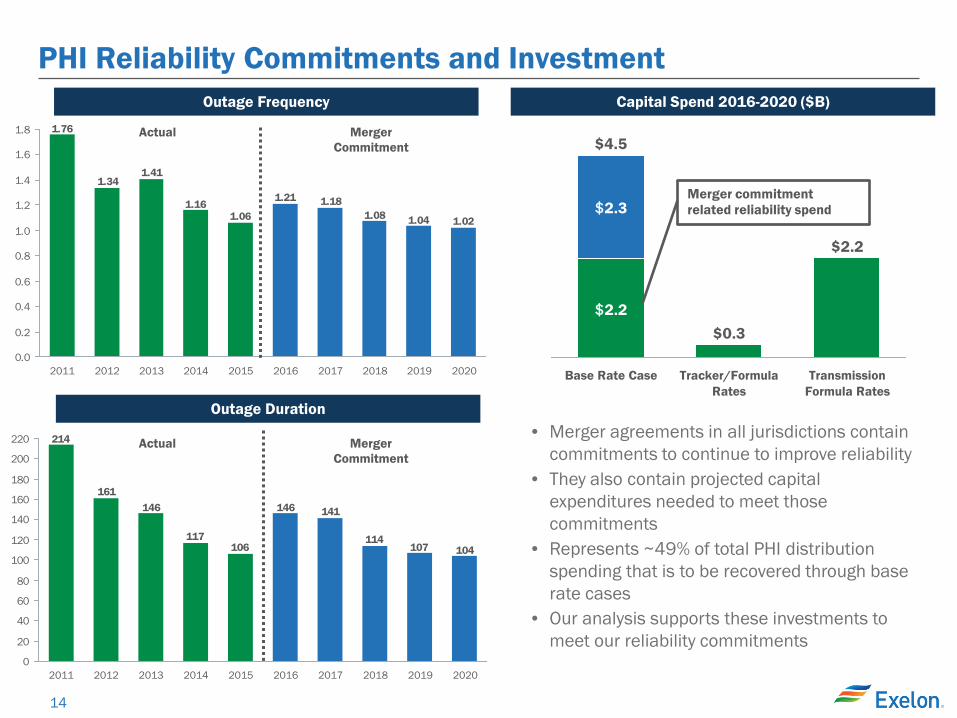
• Merger agreements in all jurisdictions contain commitments to continue to improve reliability
• They also contain projected capital expenditures needed to meet those commitments
• Represents ~49% of total PHI distribution spending that is to be recovered through base rate cases
• Our analysis supports these investments to meet our reliability commitments
1.021.04
1.181.21
1.061.16
1.411.34
1.76
1.08
0.0
0.2
0.4
0.6
0.8
1.0
1.2
1.4
1.6
1.8
2020 2019 2018 2017 2016 2015 2014 2013 2012 2011
104107
141146
106117
146161
214
114
0
20
40
60
80
100
120
140
160
180
200
220
2020 2019 2018 2017 2016 2015 2014 2013 2012 2011
Outage Frequency
Outage Duration
Capital Spend 2016-2020 ($B)
Actual Merger Commitment
Actual Merger Commitment
Transmission Formula Rates
$2.2
Tracker/Formula Rates
$0.3
Base Rate Case
$4.5
$2.2
$2.3 Merger commitment related reliability spend
PHI Reliability Commitments and Investment
15
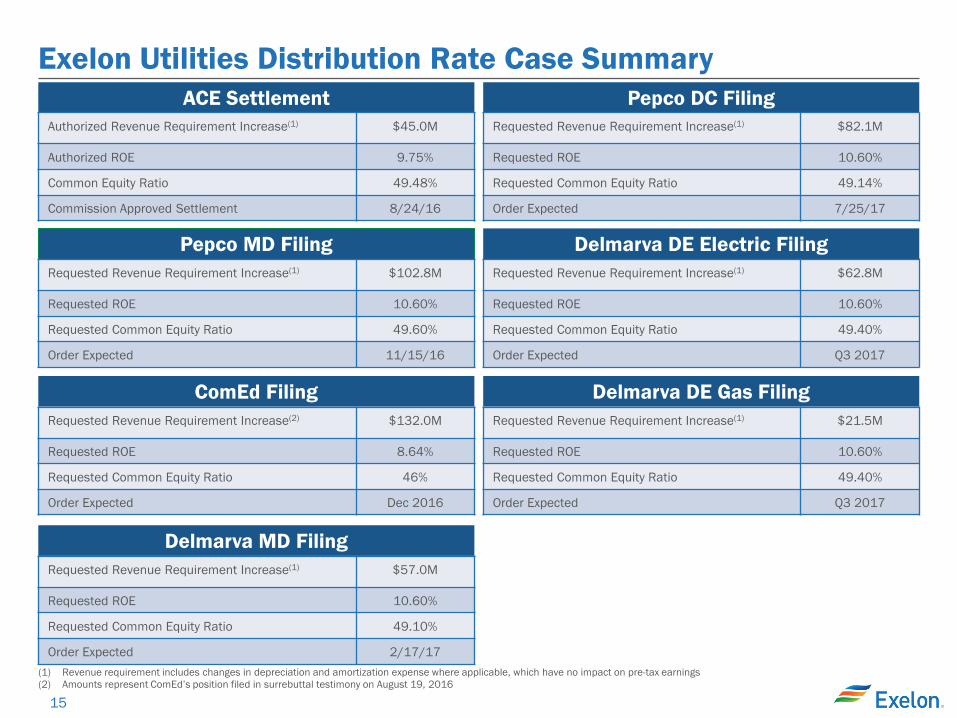
Exelon Utilities Distribution Rate Case Summary
ACE Settlement
Pepco MD Filing Requested Revenue Requirement Increase(1) $102.8M
Requested ROE 10.60%
Requested Common Equity Ratio 49.60%
Order Expected 11/15/16
Delmarva DE Electric Filing Requested Revenue Requirement Increase(1) $62.8M
Requested ROE 10.60%
Requested Common Equity Ratio 49.40%
Order Expected Q3 2017
Delmarva DE Gas Filing Requested Revenue Requirement Increase(1) $21.5M
Requested ROE 10.60%
Requested Common Equity Ratio 49.40%
Order Expected Q3 2017
Delmarva MD Filing Requested Revenue Requirement Increase(1) $57.0M
Requested ROE 10.60%
Requested Common Equity Ratio 49.10%
Order Expected 2/17/17
Pepco DC Filing Requested Revenue Requirement Increase(1) $82.1M
Requested ROE 10.60%
Requested Common Equity Ratio 49.14%
Order Expected 7/25/17
ComEd Filing
Requested Revenue Requirement Increase(2) $132.0M
Requested ROE 8.64%
Requested Common Equity Ratio 46%
Order Expected Dec 2016
(1) Revenue requirement includes changes in depreciation and amortization expense where applicable, which have no impact on pre-tax earnings (2) Amounts represent ComEd’s position filed in surrebuttal testimony on August 19, 2016
Authorized Revenue Requirement Increase(1) $45.0M
Authorized ROE 9.75%
Common Equity Ratio 49.48%
Commission Approved Settlement 8/24/16
16
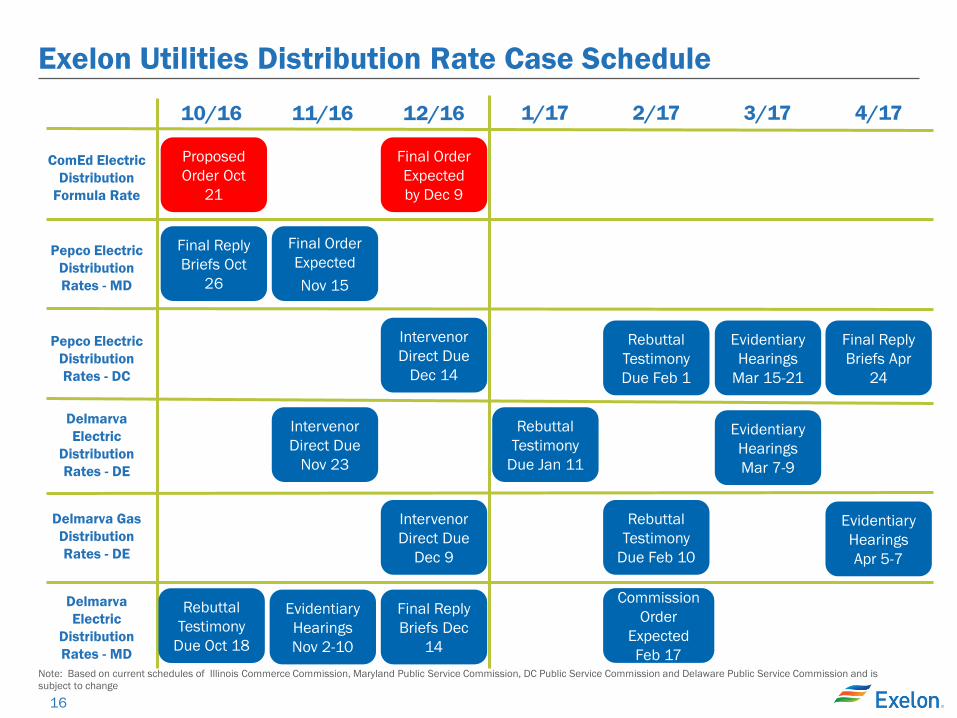
10/16
11/16
12/16
ComEd Electric Distribution
Formula Rate
1/17
Pepco Electric Distribution Rates - DC
Delmarva Electric
Distribution Rates - DE
Delmarva Electric
Distribution Rates - MD
Pepco Electric Distribution Rates - MD
Exelon Utilities Distribution Rate Case Schedule
2/17
Final Order Expected by Dec 9
Final Order Expected Nov 15
3/17 4/17
Proposed Order Oct
21
Final Reply Briefs Oct
26
Note: Based on current schedules of Illinois Commerce Commission, Maryland Public Service Commission, DC Public Service Commission and Delaware Public Service Commission and is subject to change
Intervenor Direct Due
Dec 14
Intervenor Direct Due
Nov 23
Delmarva Gas Distribution Rates - DE
Rebuttal Testimony
Due Jan 11
Evidentiary Hearings Mar 7-9
Intervenor Direct Due
Dec 9
Rebuttal Testimony
Due Feb 10
Evidentiary Hearings Apr 5-7
Commission Order
Expected Feb 17
Final Reply Briefs Dec
14
Evidentiary Hearings Nov 2-10
Rebuttal Testimony
Due Oct 18
Rebuttal Testimony Due Feb 1
Evidentiary Hearings
Mar 15-21
Final Reply Briefs Apr
24
17
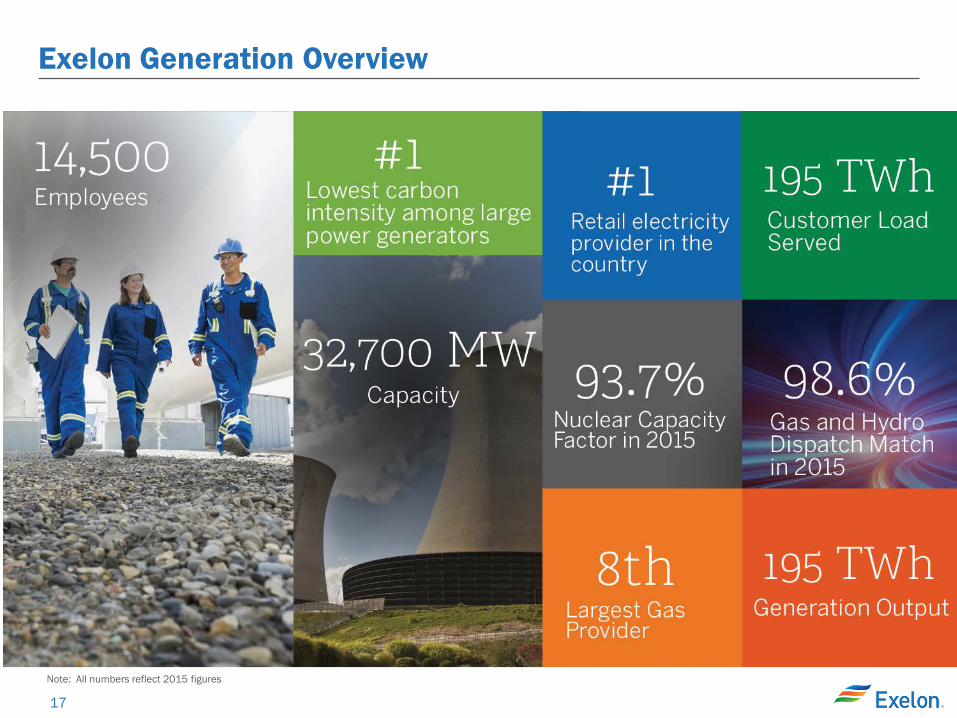
Exelon Generation Overview
Note: All numbers reflect 2015 figures
18
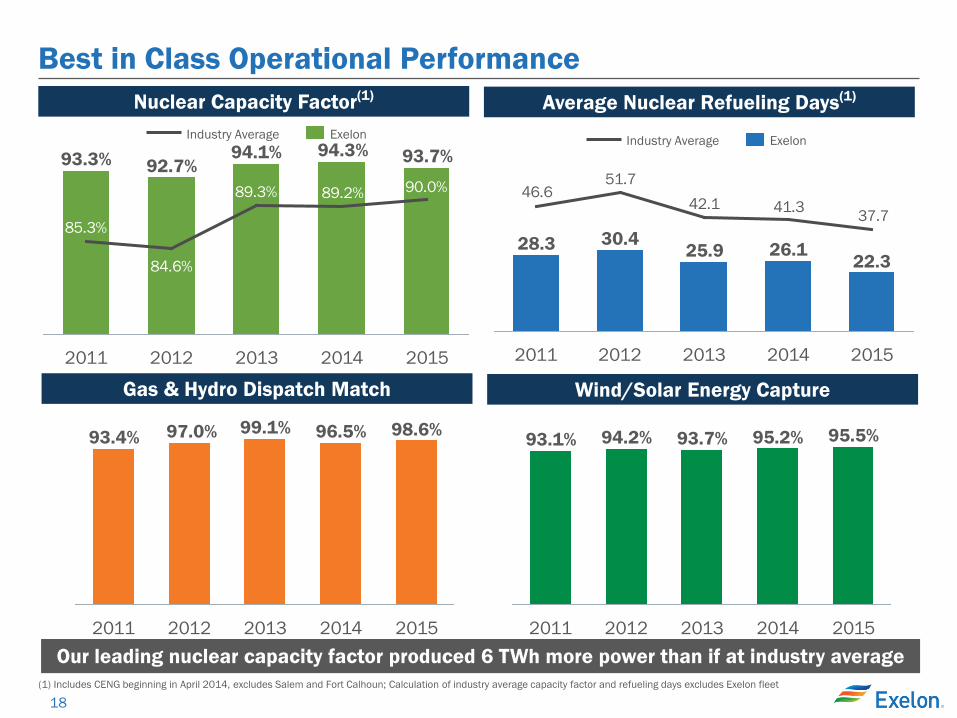
Best in Class Operational Performance Nuclear Capacity Factor(1)
Gas & Hydro Dispatch Match
Our leading nuclear capacity factor produced 6 TWh more power than if at industry average
Average Nuclear Refueling Days(1)
Wind/Solar Energy Capture
98.6%96.5%99.1%97.0%93.4%
2013 2011 2014 2012 2015
95.5%95.2%93.7%94.2%93.1%
2015 2014 2013 2012 2011
93.7%94.3%94.1%92.7%93.3%
90.0%89.2%89.3%
85.3%
84.6%
2015 2011 2013 2014 2012
Exelon Industry Average
22.326.125.9
30.428.337.741.342.1
51.746.6
2014 2015 2013 2011 2012
Exelon Industry Average
(1) Includes CENG beginning in April 2014, excludes Salem and Fort Calhoun; Calculation of industry average capacity factor and refueling days excludes Exelon fleet
19
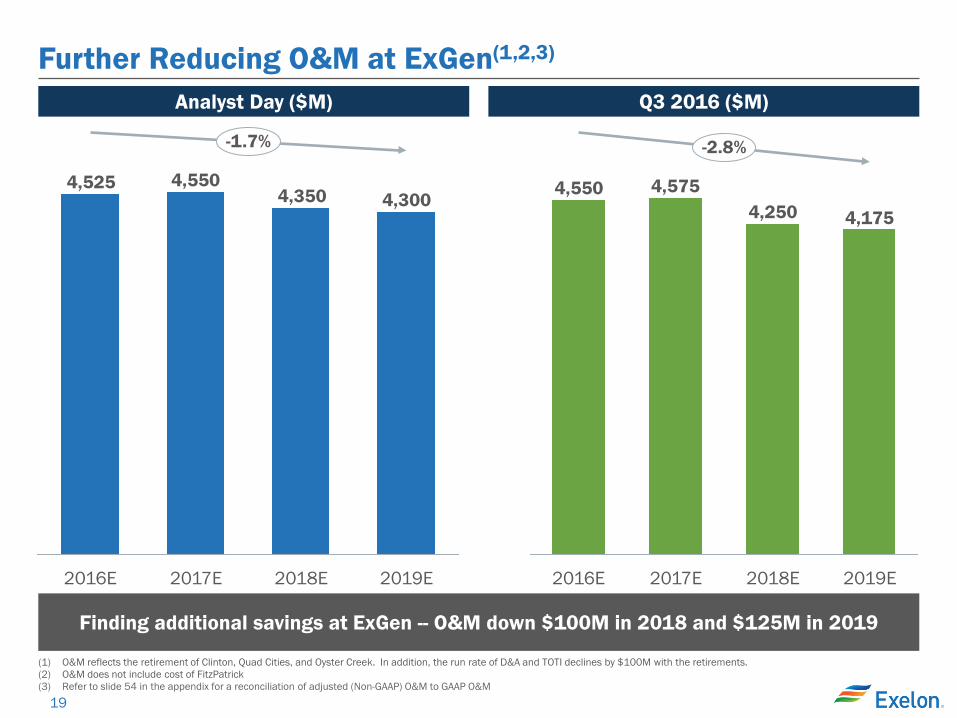
Further Reducing O&M at ExGen(1,2,3)
Analyst Day ($M) Q3 2016 ($M)
4,3004,3504,5504,525
-1.7%
2019E 2016E 2017E 2018E
4,1754,2504,5754,550
-2.8%
2019E 2018E 2017E 2016E
Finding additional savings at ExGen -- O&M down $100M in 2018 and $125M in 2019
(1) O&M reflects the retirement of Clinton, Quad Cities, and Oyster Creek. In addition, the run rate of D&A and TOTI declines by $100M with the retirements. (2) O&M does not include cost of FitzPatrick (3) Refer to slide 54 in the appendix for a reconciliation of adjusted (Non-GAAP) O&M to GAAP O&M
20
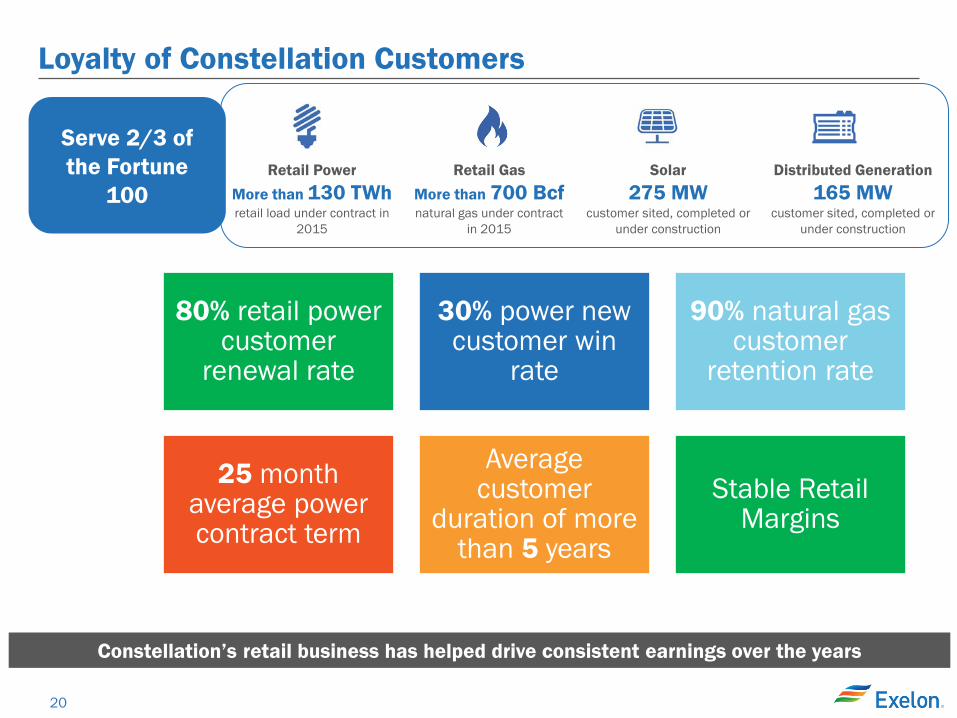
Loyalty of Constellation Customers
Constellation’s retail business has helped drive consistent earnings over the years
Retail Power More than 130 TWh retail load under contract in
2015
Retail Gas More than 700 Bcf natural gas under contract
in 2015
Solar 275 MW
customer sited, completed or under construction
Distributed Generation 165 MW
customer sited, completed or under construction
Serve 2/3 of the Fortune
100
80% retail power customer
renewal rate
30% power new customer win
rate
90% natural gas customer
retention rate
25 month average power contract term
Average customer
duration of more than 5 years
Stable Retail Margins
21
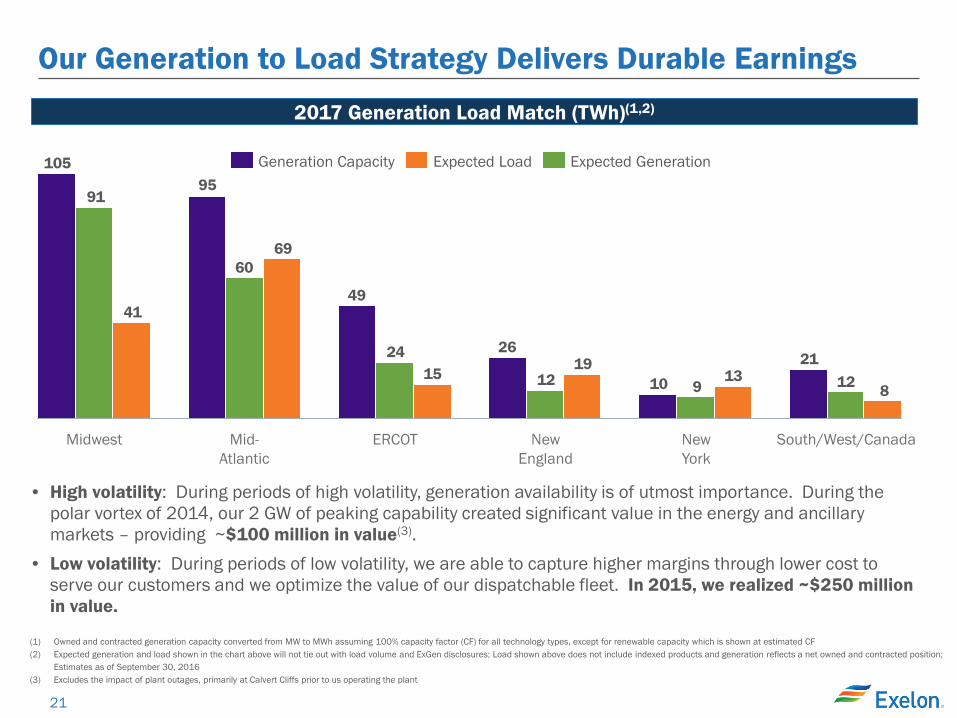
Our Generation to Load Strategy Delivers Durable Earnings
81221
13910
1912
26
1524
49
6960
95
41
91
105
Midwest Mid-Atlantic
ERCOT New England
New York
South/West/Canada
7445
4
46
2013
35
2012
31
22
2011
22
13 5
Expected Load Expected Generation Generation Capacity
2017 Generation Load Match (TWh)(1,2)
• High volatility: During periods of high volatility, generation availability is of utmost importance. During the polar vortex of 2014, our 2 GW of peaking capability created significant value in the energy and ancillary markets – providing ~$100 million in value(3).
• Low volatility: During periods of low volatility, we are able to capture higher margins through lower cost to serve our customers and we optimize the value of our dispatchable fleet. In 2015, we realized ~$250 million in value.
(1) Owned and contracted generation capacity converted from MW to MWh assuming 100% capacity factor (CF) for all technology types, except for renewable capacity which is shown at estimated CF (2) Expected generation and load shown in the chart above will not tie out with load volume and ExGen disclosures; Load shown above does not include indexed products and generation reflects a net owned and contracted position;
Estimates as of September 30, 2016 (3) Excludes the impact of plant outages, primarily at Calvert Cliffs prior to us operating the plant
22
Status of New York and Illinois Nuclear Plants
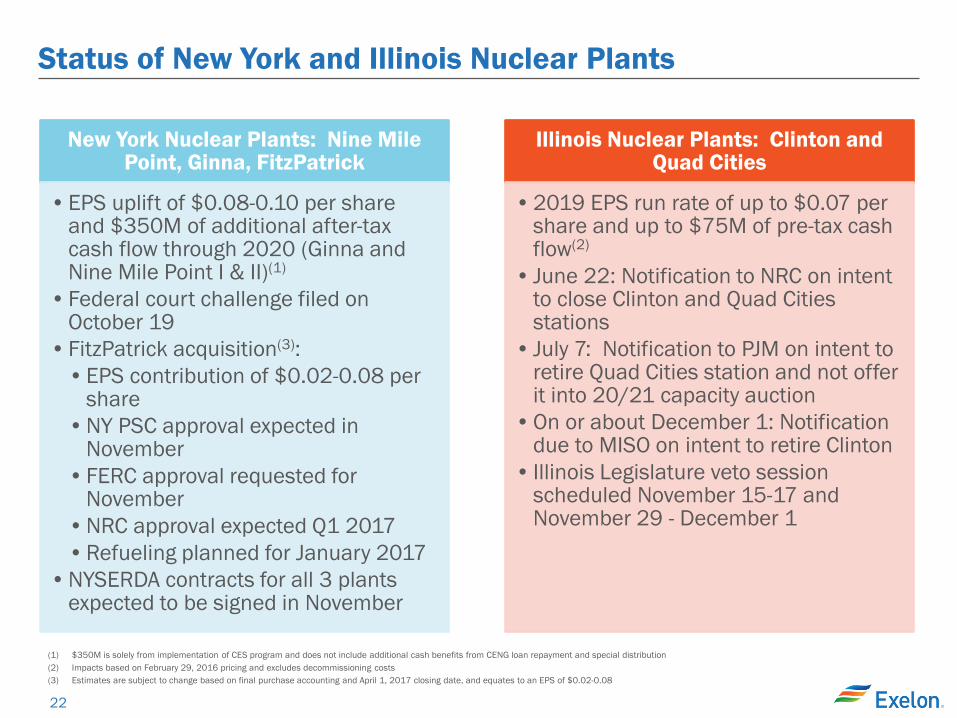
New York Nuclear Plants: Nine Mile Point, Ginna, FitzPatrick
•EPS uplift of $0.08-0.10 per share and $350M of additional after-tax cash flow through 2020 (Ginna and Nine Mile Point I & II)(1)
•Federal court challenge filed on October 19
•FitzPatrick acquisition(3): •EPS contribution of $0.02-0.08 per
share •NY PSC approval expected in
November •FERC approval requested for
November •NRC approval expected Q1 2017 •Refueling planned for January 2017
•NYSERDA contracts for all 3 plants expected to be signed in November
Illinois Nuclear Plants: Clinton and Quad Cities
•2019 EPS run rate of up to $0.07 per share and up to $75M of pre-tax cash flow(2)
• June 22: Notification to NRC on intent to close Clinton and Quad Cities stations
• July 7: Notification to PJM on intent to retire Quad Cities station and not offer it into 20/21 capacity auction
•On or about December 1: Notification due to MISO on intent to retire Clinton
• Illinois Legislature veto session scheduled November 15-17 and November 29 - December 1
(1) $350M is solely from implementation of CES program and does not include additional cash benefits from CENG loan repayment and special distribution (2) Impacts based on February 29, 2016 pricing and excludes decommissioning costs (3) Estimates are subject to change based on final purchase accounting and April 1, 2017 closing date, and equates to an EPS of $0.02-0.08

23
Exelon Generation Disclosures
September 30, 2016
24
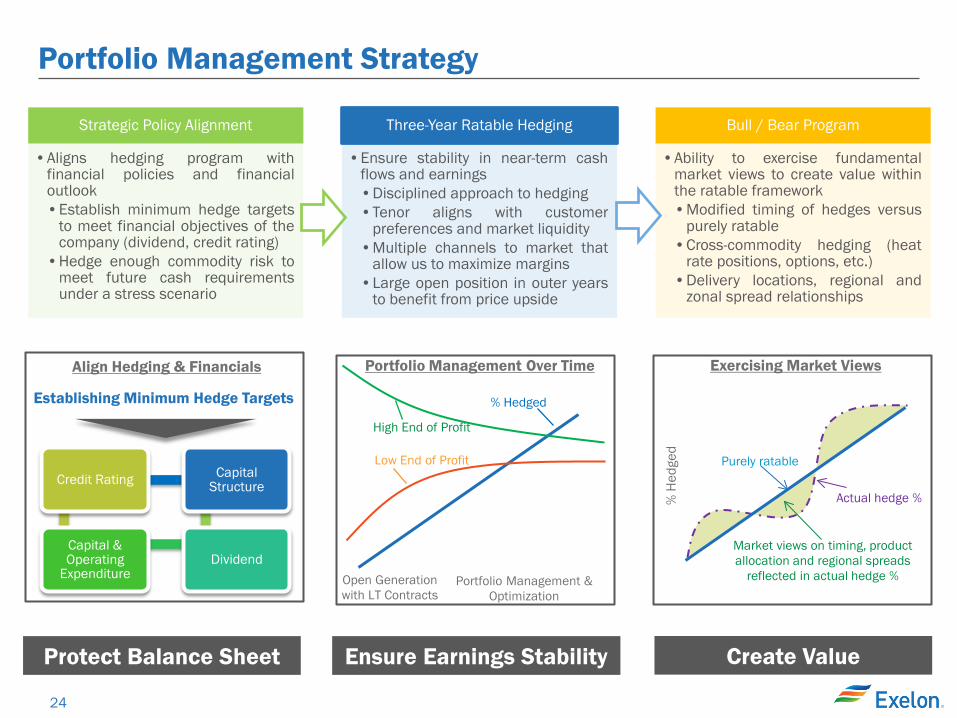
Portfolio Management Strategy
Protect Balance Sheet Ensure Earnings Stability Create Value
Strategic Policy Alignment
•Aligns hedging program with financial policies and financial outlook •Establish minimum hedge targets
to meet financial objectives of the company (dividend, credit rating)
•Hedge enough commodity risk to meet future cash requirements under a stress scenario
Three-Year Ratable Hedging
•Ensure stability in near-term cash flows and earnings •Disciplined approach to hedging •Tenor aligns with customer
preferences and market liquidity •Multiple channels to market that
allow us to maximize margins •Large open position in outer years
to benefit from price upside
Bull / Bear Program
•Ability to exercise fundamental market views to create value within the ratable framework •Modified timing of hedges versus
purely ratable •Cross-commodity hedging (heat
rate positions, options, etc.) •Delivery locations, regional and
zonal spread relationships
Exercising Market Views
% H
edge
d
Purely ratable
Actual hedge %
Market views on timing, product allocation and regional spreads
reflected in actual hedge %
High End of Profit
Low End of Profit
% Hedged
Open Generation with LT Contracts
Portfolio Management & Optimization
Portfolio Management Over Time Align Hedging & Financials
Establishing Minimum Hedge Targets
Credit Rating
Capital & Operating
Expenditure Dividend
Capital Structure
25
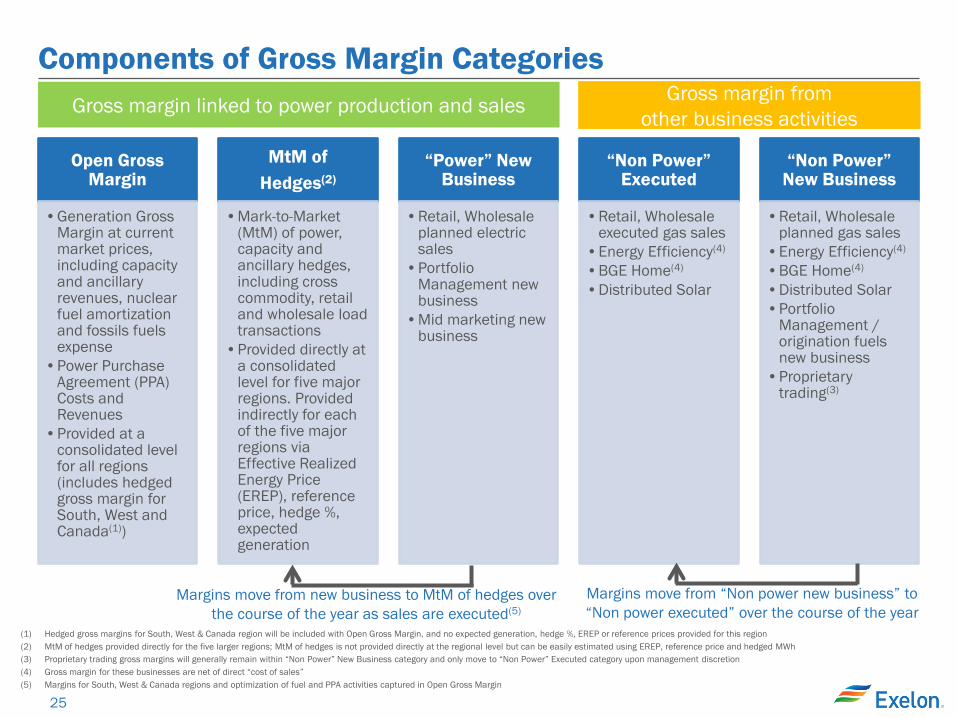
Components of Gross Margin Categories
Open Gross Margin
•Generation Gross Margin at current market prices, including capacity and ancillary revenues, nuclear fuel amortization and fossils fuels expense
•Power Purchase Agreement (PPA) Costs and Revenues
•Provided at a consolidated level for all regions (includes hedged gross margin for South, West and Canada(1))
MtM of Hedges(2)
•Mark-to-Market (MtM) of power, capacity and ancillary hedges, including cross commodity, retail and wholesale load transactions
•Provided directly at a consolidated level for five major regions. Provided indirectly for each of the five major regions via Effective Realized Energy Price (EREP), reference price, hedge %, expected generation
“Power” New Business
•Retail, Wholesale planned electric sales
•Portfolio Management new business
•Mid marketing new business
“Non Power” Executed
•Retail, Wholesale executed gas sales
•Energy Efficiency(4) •BGE Home(4) •Distributed Solar
“Non Power” New Business
•Retail, Wholesale planned gas sales
•Energy Efficiency(4) •BGE Home(4) •Distributed Solar •Portfolio
Management / origination fuels new business
•Proprietary trading(3)
Margins move from new business to MtM of hedges over the course of the year as sales are executed(5)
Margins move from “Non power new business” to “Non power executed” over the course of the year
Gross margin linked to power production and sales Gross margin from other business activities
(1) Hedged gross margins for South, West & Canada region will be included with Open Gross Margin, and no expected generation, hedge %, EREP or reference prices provided for this region (2) MtM of hedges provided directly for the five larger regions; MtM of hedges is not provided directly at the regional level but can be easily estimated using EREP, reference price and hedged MWh (3) Proprietary trading gross margins will generally remain within “Non Power” New Business category and only move to “Non Power” Executed category upon management discretion (4) Gross margin for these businesses are net of direct “cost of sales” (5) Margins for South, West & Canada regions and optimization of fuel and PPA activities captured in Open Gross Margin
26
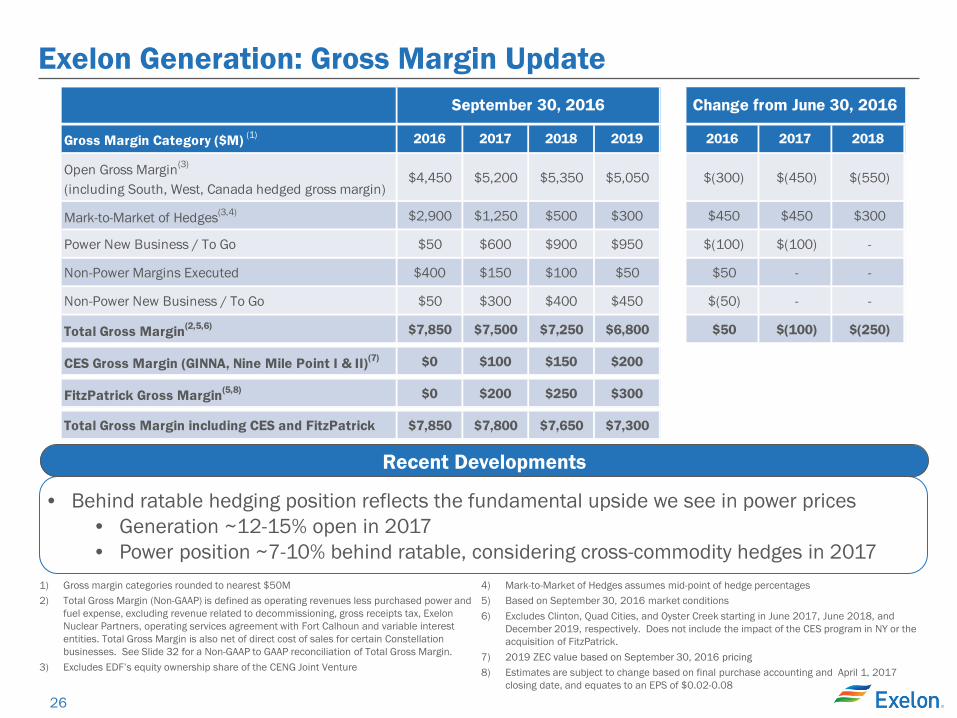
Exelon Generation: Gross Margin Update
1) Gross margin categories rounded to nearest $50M 2) Total Gross Margin (Non-GAAP) is defined as operating revenues less purchased power and
fuel expense, excluding revenue related to decommissioning, gross receipts tax, Exelon Nuclear Partners, operating services agreement with Fort Calhoun and variable interest entities. Total Gross Margin is also net of direct cost of sales for certain Constellation businesses. See Slide 32 for a Non-GAAP to GAAP reconciliation of Total Gross Margin.
3) Excludes EDF’s equity ownership share of the CENG Joint Venture
4) Mark-to-Market of Hedges assumes mid-point of hedge percentages 5) Based on September 30, 2016 market conditions 6) Excludes Clinton, Quad Cities, and Oyster Creek starting in June 2017, June 2018, and
December 2019, respectively. Does not include the impact of the CES program in NY or the acquisition of FitzPatrick.
7) 2019 ZEC value based on September 30, 2016 pricing 8) Estimates are subject to change based on final purchase accounting and April 1, 2017
closing date, and equates to an EPS of $0.02-0.08
• Behind ratable hedging position reflects the fundamental upside we see in power prices • Generation ~12-15% open in 2017 • Power position ~7-10% behind ratable, considering cross-commodity hedges in 2017
Recent Developments
Gross Margin Category ($M) (1) 2016 2017 2018 2019 2016 2017 2018
Open Gross Margin(3)
(including South, West, Canada hedged gross margin)$4,450 $5,200 $5,350 $5,050 $(300) $(450) $(550)
Mark-to-Market of Hedges(3,4) $2,900 $1,250 $500 $300 $450 $450 $300
Power New Business / To Go $50 $600 $900 $950 $(100) $(100) -
Non-Power Margins Executed $400 $150 $100 $50 $50 - -
Non-Power New Business / To Go $50 $300 $400 $450 $(50) - -
Total Gross Margin(2,5,6) $7,850 $7,500 $7,250 $6,800 $50 $(100) $(250)
CES Gross Margin (GINNA, Nine Mile Point I & II)(7) $0 $100 $150 $200
FitzPatrick Gross Margin(5,8) $0 $200 $250 $300
Total Gross Margin including CES and FitzPatrick $7,850 $7,800 $7,650 $7,300
September 30, 2016 Change from June 30, 2016

27
ExGen Disclosures
(1) Gross margin categories rounded to nearest $50M (2) Total Gross Margin (Non-GAAP) is defined as operating revenues less purchased power and
fuel expense, excluding revenue related to decommissioning, gross receipts tax, Exelon Nuclear Partners, operating services agreement with Fort Calhoun and variable interest entities. Total Gross Margin is also net of direct cost of sales for certain Constellation businesses. Refer to slide 32 for a reconciliation of Total Gross Margin to the most comparable GAAP measure.
(3) Excludes EDF’s equity ownership share of the CENG Joint Venture (4) Mark-to-Market of Hedges assumes mid-point of hedge percentages
(5) Based on September 30, 2016 market conditions (6) Excludes Clinton, Quad Cities, and Oyster Creek starting in June 2017, June 2018, and
December 2019, respectively. Does not include the impact of the CES program in NY or the acquisition of FitzPatrick.
Gross Margin Category ($M)(1) 2016 2017 2018 2019
Open Gross Margin (including South, West & Canada hedged GM)(3) $4,450 $5,200 $5,350 $5,050
Mark-to-Market of Hedges(3,4) $2,900 $1,250 $500 $300 Power New Business / To Go $50 $600 $900 $950 Non-Power Margins Executed $400 $150 $100 $50 Non-Power New Business / To Go $50 $300 $400 $450
Total Gross Margin(2,6) $7,850 $7,500 $7,250 $6,800
Reference Prices(5) 2016 2017 2018 2019
Henry Hub Natural Gas ($/MMbtu) $2.46 $3.09 $2.91 $2.81 Midwest: NiHub ATC prices ($/MWh) $25.87 $28.49 $27.78 $27.66 Mid-Atlantic: PJM-W ATC prices ($/MWh) $28.84 $32.84 $31.08 $30.44 ERCOT-N ATC Spark Spread ($/MWh)HSC Gas, 7.2HR, $2.50 VOM
$1.54 $3.13 $3.28 $3.57
New York: NY Zone A ($/MWh) $26.51 $32.28 $31.43 $31.23 New England: Mass Hub ATC Spark Spread($/MWh)ALQN Gas, 7.5HR, $0.50 VOM
$5.52 $7.10 $7.29 $7.81
28
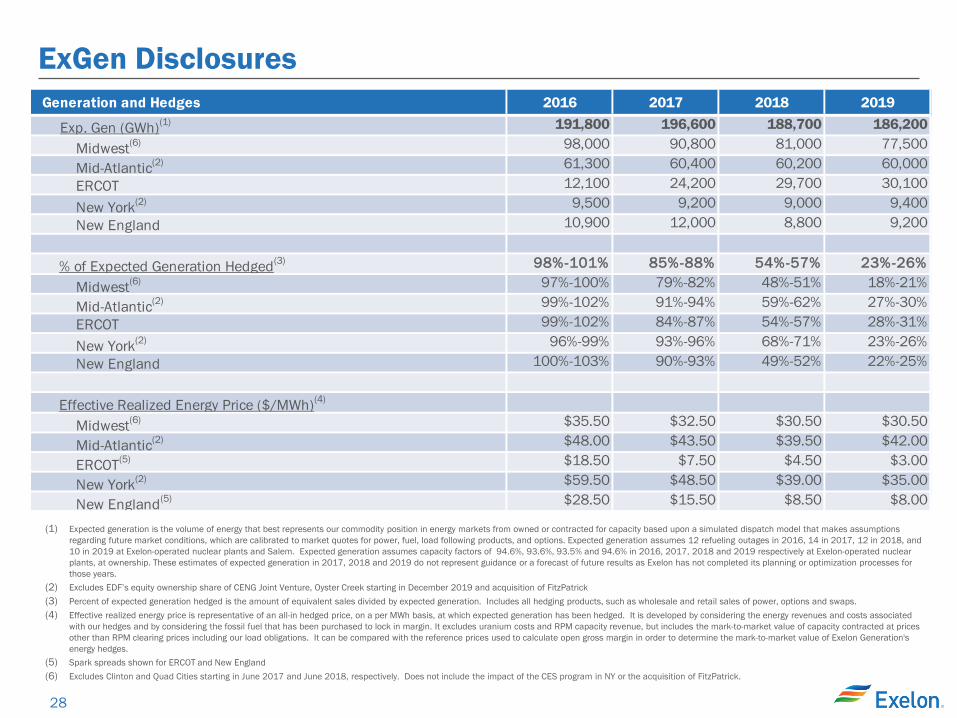
ExGen Disclosures
(1) Expected generation is the volume of energy that best represents our commodity position in energy markets from owned or contracted for capacity based upon a simulated dispatch model that makes assumptions regarding future market conditions, which are calibrated to market quotes for power, fuel, load following products, and options. Expected generation assumes 12 refueling outages in 2016, 14 in 2017, 12 in 2018, and 10 in 2019 at Exelon-operated nuclear plants and Salem. Expected generation assumes capacity factors of 94.6%, 93.6%, 93.5% and 94.6% in 2016, 2017, 2018 and 2019 respectively at Exelon-operated nuclear plants, at ownership. These estimates of expected generation in 2017, 2018 and 2019 do not represent guidance or a forecast of future results as Exelon has not completed its planning or optimization processes for those years.
(2) Excludes EDF’s equity ownership share of CENG Joint Venture, Oyster Creek starting in December 2019 and acquisition of FitzPatrick (3) Percent of expected generation hedged is the amount of equivalent sales divided by expected generation. Includes all hedging products, such as wholesale and retail sales of power, options and swaps. (4) Effective realized energy price is representative of an all-in hedged price, on a per MWh basis, at which expected generation has been hedged. It is developed by considering the energy revenues and costs associated
with our hedges and by considering the fossil fuel that has been purchased to lock in margin. It excludes uranium costs and RPM capacity revenue, but includes the mark-to-market value of capacity contracted at prices other than RPM clearing prices including our load obligations. It can be compared with the reference prices used to calculate open gross margin in order to determine the mark-to-market value of Exelon Generation's energy hedges.
(5) Spark spreads shown for ERCOT and New England (6) Excludes Clinton and Quad Cities starting in June 2017 and June 2018, respectively. Does not include the impact of the CES program in NY or the acquisition of FitzPatrick.
Generation and Hedges 2016 2017 2018 2019
Exp. Gen (GWh)(1) 191,800 196,600 188,700 186,200
Midwest(6) 98,000 90,800 81,000 77,500
Mid-Atlantic(2) 61,300 60,400 60,200 60,000ERCOT 12,100 24,200 29,700 30,100
New York(2) 9,500 9,200 9,000 9,400New England 10,900 12,000 8,800 9,200
% of Expected Generation Hedged(3) 98%-101% 85%-88% 54%-57% 23%-26%
Midwest(6) 97%-100% 79%-82% 48%-51% 18%-21%
Mid-Atlantic(2) 99%-102% 91%-94% 59%-62% 27%-30%ERCOT 99%-102% 84%-87% 54%-57% 28%-31%
New York(2) 96%-99% 93%-96% 68%-71% 23%-26%New England 100%-103% 90%-93% 49%-52% 22%-25%
Effective Realized Energy Price ($/MWh)(4)
Midwest(6) $35.50 $32.50 $30.50 $30.50
Mid-Atlantic(2) $48.00 $43.50 $39.50 $42.00
ERCOT(5) $18.50 $7.50 $4.50 $3.00
New York(2) $59.50 $48.50 $39.00 $35.00
New England(5) $28.50 $15.50 $8.50 $8.00
29
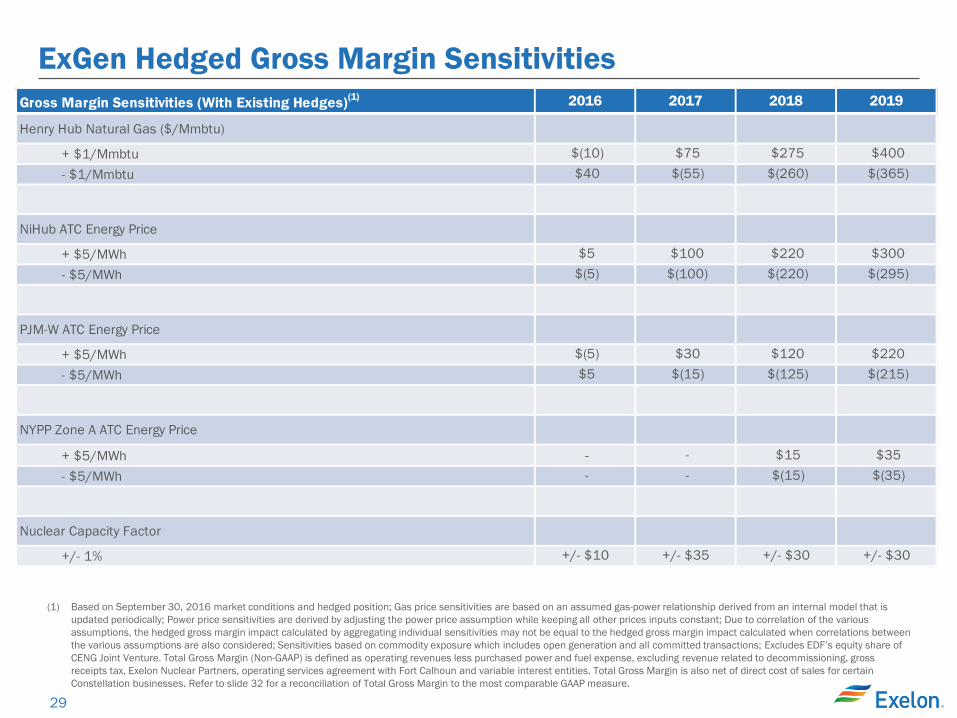
ExGen Hedged Gross Margin Sensitivities
(1) Based on September 30, 2016 market conditions and hedged position; Gas price sensitivities are based on an assumed gas-power relationship derived from an internal model that is updated periodically; Power price sensitivities are derived by adjusting the power price assumption while keeping all other prices inputs constant; Due to correlation of the various assumptions, the hedged gross margin impact calculated by aggregating individual sensitivities may not be equal to the hedged gross margin impact calculated when correlations between the various assumptions are also considered; Sensitivities based on commodity exposure which includes open generation and all committed transactions; Excludes EDF’s equity share of CENG Joint Venture. Total Gross Margin (Non-GAAP) is defined as operating revenues less purchased power and fuel expense, excluding revenue related to decommissioning, gross receipts tax, Exelon Nuclear Partners, operating services agreement with Fort Calhoun and variable interest entities. Total Gross Margin is also net of direct cost of sales for certain Constellation businesses. Refer to slide 32 for a reconciliation of Total Gross Margin to the most comparable GAAP measure.
Gross Margin Sensitivities (With Existing Hedges)(1) 2016 2017 2018 2019
Henry Hub Natural Gas ($/Mmbtu)
+ $1/Mmbtu $(10) $75 $275 $400 - $1/Mmbtu $40 $(55) $(260) $(365)
NiHub ATC Energy Price
+ $5/MWh $5 $100 $220 $300 - $5/MWh $(5) $(100) $(220) $(295)
PJM-W ATC Energy Price
+ $5/MWh $(5) $30 $120 $220 - $5/MWh $5 $(15) $(125) $(215)
NYPP Zone A ATC Energy Price
+ $5/MWh - - $15 $35 - $5/MWh - - $(15) $(35)
Nuclear Capacity Factor
+/- 1% +/- $10 +/- $35 +/- $30 +/- $30
30
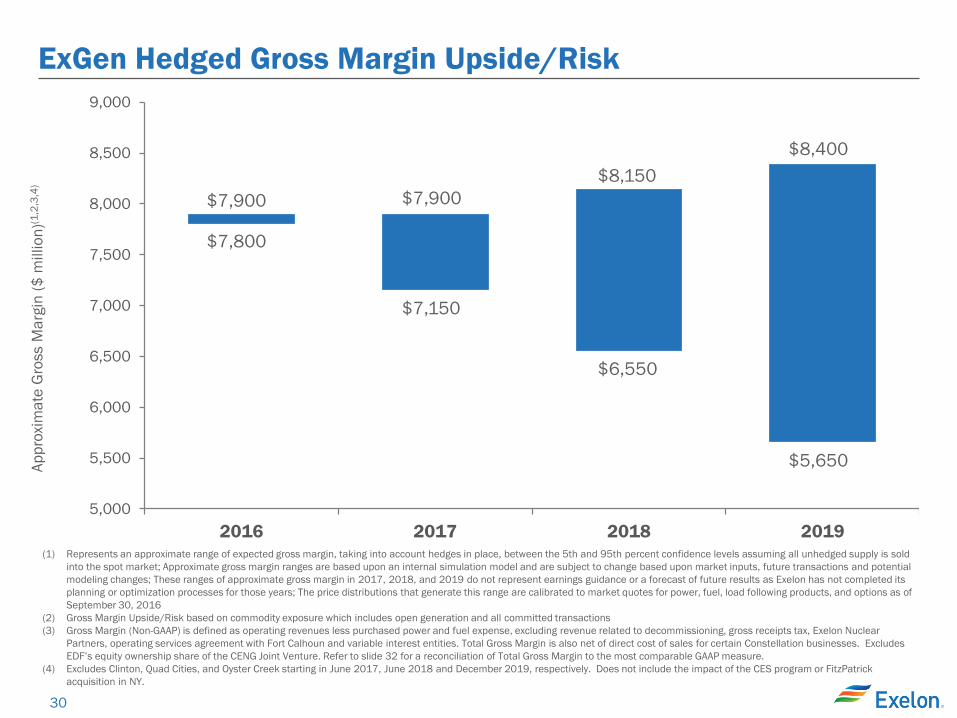
ExGen Hedged Gross Margin Upside/Risk
5,000
5,500
6,000
6,500
7,000
7,500
8,000
8,500
9,000
2016 2017 2018 2019
Appr
oxim
ate
Gro
ss M
argi
n ($
mill
ion)
(1,2
,3,4
)
$7,900
$7,800
$7,900
$7,150
(1) Represents an approximate range of expected gross margin, taking into account hedges in place, between the 5th and 95th percent confidence levels assuming all unhedged supply is sold into the spot market; Approximate gross margin ranges are based upon an internal simulation model and are subject to change based upon market inputs, future transactions and potential modeling changes; These ranges of approximate gross margin in 2017, 2018, and 2019 do not represent earnings guidance or a forecast of future results as Exelon has not completed its planning or optimization processes for those years; The price distributions that generate this range are calibrated to market quotes for power, fuel, load following products, and options as of September 30, 2016
(2) Gross Margin Upside/Risk based on commodity exposure which includes open generation and all committed transactions (3) Gross Margin (Non-GAAP) is defined as operating revenues less purchased power and fuel expense, excluding revenue related to decommissioning, gross receipts tax, Exelon Nuclear
Partners, operating services agreement with Fort Calhoun and variable interest entities. Total Gross Margin is also net of direct cost of sales for certain Constellation businesses. Excludes EDF’s equity ownership share of the CENG Joint Venture. Refer to slide 32 for a reconciliation of Total Gross Margin to the most comparable GAAP measure.
(4) Excludes Clinton, Quad Cities, and Oyster Creek starting in June 2017, June 2018 and December 2019, respectively. Does not include the impact of the CES program or FitzPatrick acquisition in NY.
$6,550
$8,400
$5,650
$8,150
31
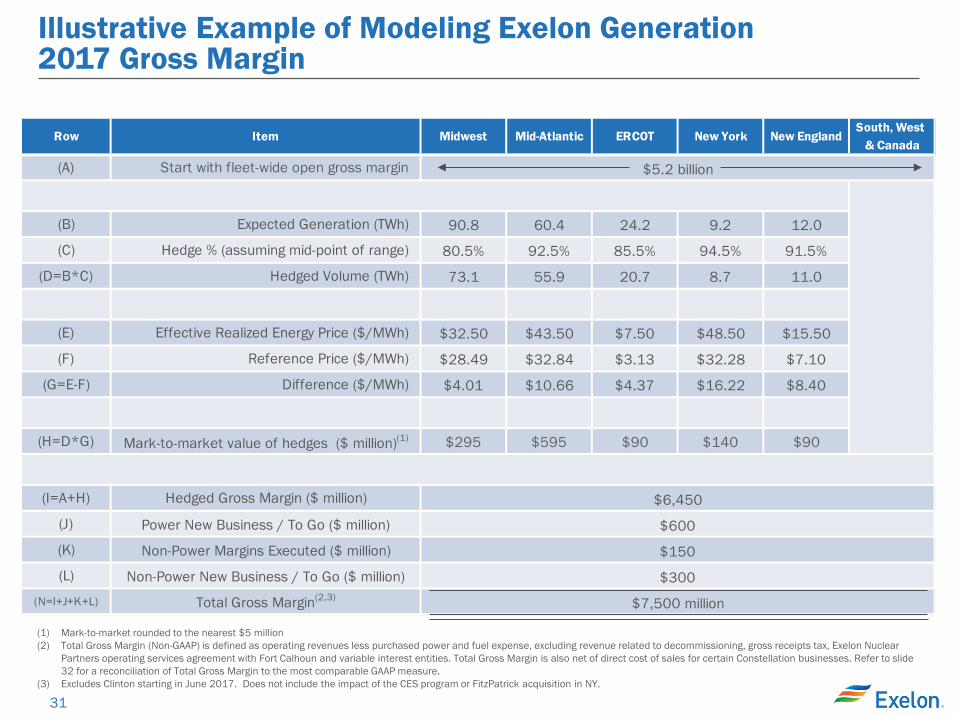
Row Item Midwest Mid-Atlantic ERCOT New York New EnglandSouth, West
& Canada
(A) Start with fleet-wide open gross margin
(B) Expected Generation (TWh) 90.8 60.4 24.2 9.2 12.0
(C) Hedge % (assuming mid-point of range) 80.5% 92.5% 85.5% 94.5% 91.5%
(D=B*C) Hedged Volume (TWh) 73.1 55.9 20.7 8.7 11.0
(E) Effective Realized Energy Price ($/MWh) $32.50 $43.50 $7.50 $48.50 $15.50
(F) Reference Price ($/MWh) $28.49 $32.84 $3.13 $32.28 $7.10
(G=E-F) Difference ($/MWh) $4.01 $10.66 $4.37 $16.22 $8.40
(H=D*G) Mark-to-market value of hedges ($ million)(1) $295 $595 $90 $140 $90
(I=A+H) Hedged Gross Margin ($ million)
(J) Power New Business / To Go ($ million)
(K) Non-Power Margins Executed ($ million)
(L) Non-Power New Business / To Go ($ million)(N=I+J+K+L) Total Gross Margin(2,3)
$150
$300
$7,500 million
$5.2 billion
$6,450
$600
Illustrative Example of Modeling Exelon Generation 2017 Gross Margin
(1) Mark-to-market rounded to the nearest $5 million (2) Total Gross Margin (Non-GAAP) is defined as operating revenues less purchased power and fuel expense, excluding revenue related to decommissioning, gross receipts tax, Exelon Nuclear
Partners operating services agreement with Fort Calhoun and variable interest entities. Total Gross Margin is also net of direct cost of sales for certain Constellation businesses. Refer to slide 32 for a reconciliation of Total Gross Margin to the most comparable GAAP measure.
(3) Excludes Clinton starting in June 2017. Does not include the impact of the CES program or FitzPatrick acquisition in NY.

32
Additional ExGen Modeling Data Total Gross Margin Reconciliation (in $M)(1) 2016 2017 2018 2019
Revenue Net of Purchased Power and Fuel Expense(2)(3) $8,625 $8,200 $7,975 $7,525
Other Revenues(4) $(300) $(300) $(300) $(300)
Direct cost of sales incurred to generate revenues for certain Constellation businesses(5) $(475) $(400) $(425) $(425)
Total Gross Margin (Non-GAAP) $7,850 $7,500 $7,250 $6,800
(1) All amounts rounded to the nearest $25M (2) Revenue net of purchased power and fuel expense (RNF), a non-GAAP measure, is calculated as the GAAP measure of operating revenue less the GAAP measure of purchased power and fuel
expense. ExGen does not forecast the GAAP components of RNF separately, as to do so would be unduly burdensome. RNF also includes the RNF of our proportionate ownership share of CENG. (3) Excludes the mark-to-market impact of economic hedging activities due to the volatility and unpredictability of the future changes to power prices (4) Other revenues reflects revenues from operating services agreement with Fort Calhoun, variable interest entities, funds collected through revenues for decommissioning the former PECO nuclear
plants through regulated rates and gross receipts tax revenues (5) Reflects the cost of sales and depreciation expense of certain Constellation businesses of Generation (6) ExGen amounts for O&M, TOTI, Depreciation & Amortization; excludes EDF’s equity ownership share of the CENG Joint Venture (7) ExGen adjusted O&M excludes direct cost of sales for certain Constellation business, P&L neutral decommissioning costs and the impact from O&M related to variable interest entities. Refer to slide
57 for a reconciliation of adjusted (non-GAAP) O&M to GAAP O&M. (8) TOTI excludes gross receipts tax of $100M (9) Depreciation & Amortization excludes the cost of sales impact of ExGen’s non-power businesses of $25M
Key ExGen Modeling Inputs (in $M)(1)(6) 2016
Other Revenues (excluding Gross Receipts Tax)(4) $175
Adjusted O&M(7) $(4,550)
Taxes Other Than Income (TOTI)(8) $(350)
Depreciation & Amortization(9) $(1,025)
Interest Expense $(350)
Effective Tax Rate 34.0%
33
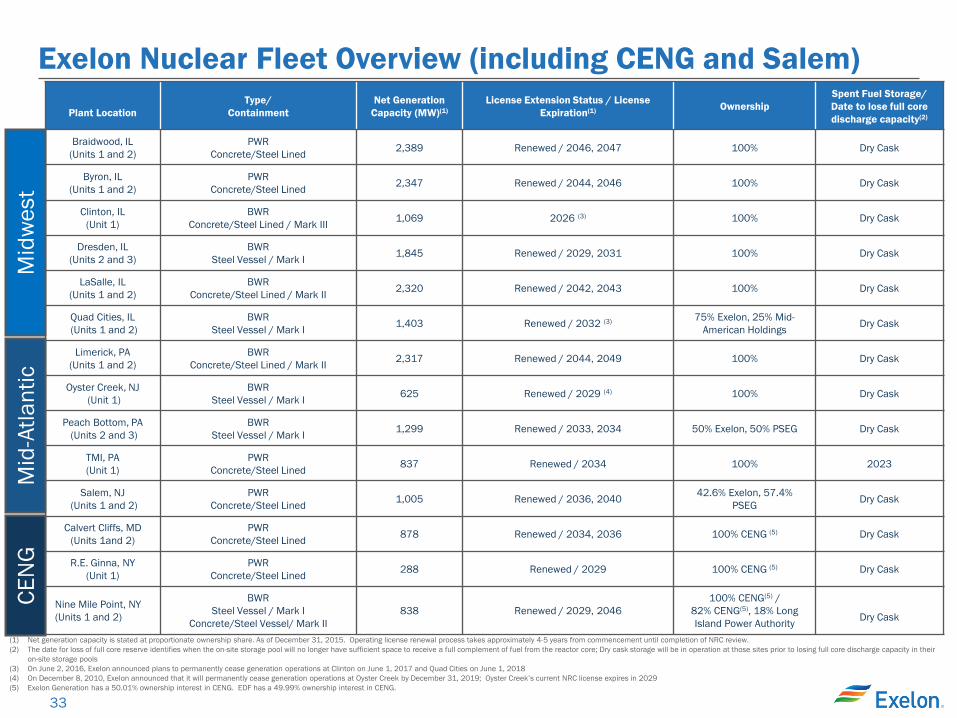
Exelon Nuclear Fleet Overview (including CENG and Salem)
Plant Location Type/
Containment Net Generation
Capacity (MW)(1) License Extension Status / License
Expiration(1) Ownership Spent Fuel Storage/ Date to lose full core discharge capacity(2)
Braidwood, IL (Units 1 and 2)
PWR Concrete/Steel Lined 2,389 Renewed / 2046, 2047 100% Dry Cask
Byron, IL (Units 1 and 2)
PWR Concrete/Steel Lined 2,347 Renewed / 2044, 2046 100% Dry Cask
Clinton, IL (Unit 1)
BWR Concrete/Steel Lined / Mark III 1,069 2026 (3) 100% Dry Cask
Dresden, IL (Units 2 and 3)
BWR Steel Vessel / Mark I 1,845 Renewed / 2029, 2031 100% Dry Cask
LaSalle, IL (Units 1 and 2)
BWR Concrete/Steel Lined / Mark II 2,320 Renewed / 2042, 2043 100% Dry Cask
Quad Cities, IL (Units 1 and 2)
BWR Steel Vessel / Mark I 1,403 Renewed / 2032 (3) 75% Exelon, 25% Mid-
American Holdings Dry Cask
Limerick, PA (Units 1 and 2)
BWR Concrete/Steel Lined / Mark II 2,317 Renewed / 2044, 2049 100% Dry Cask
Oyster Creek, NJ (Unit 1)
BWR Steel Vessel / Mark I 625 Renewed / 2029 (4) 100% Dry Cask
Peach Bottom, PA (Units 2 and 3)
BWR Steel Vessel / Mark I 1,299 Renewed / 2033, 2034 50% Exelon, 50% PSEG Dry Cask
TMI, PA (Unit 1)
PWR Concrete/Steel Lined 837 Renewed / 2034 100% 2023
Salem, NJ (Units 1 and 2)
PWR Concrete/Steel Lined 1,005 Renewed / 2036, 2040 42.6% Exelon, 57.4%
PSEG Dry Cask
Calvert Cliffs, MD (Units 1and 2)
PWR Concrete/Steel Lined 878 Renewed / 2034, 2036 100% CENG (5) Dry Cask
R.E. Ginna, NY (Unit 1)
PWR Concrete/Steel Lined 288 Renewed / 2029 100% CENG (5) Dry Cask
Nine Mile Point, NY (Units 1 and 2)
BWR Steel Vessel / Mark I
Concrete/Steel Vessel/ Mark II 838 Renewed / 2029, 2046
100% CENG(5) / 82% CENG(5), 18% Long Island Power Authority
Dry Cask
(1) Net generation capacity is stated at proportionate ownership share. As of December 31, 2015. Operating license renewal process takes approximately 4-5 years from commencement until completion of NRC review. (2) The date for loss of full core reserve identifies when the on-site storage pool will no longer have sufficient space to receive a full complement of fuel from the reactor core; Dry cask storage will be in operation at those sites prior to losing full core discharge capacity in their
on-site storage pools (3) On June 2, 2016, Exelon announced plans to permanently cease generation operations at Clinton on June 1, 2017 and Quad Cities on June 1, 2018 (4) On December 8, 2010, Exelon announced that it will permanently cease generation operations at Oyster Creek by December 31, 2019; Oyster Creek’s current NRC license expires in 2029 (5) Exelon Generation has a 50.01% ownership interest in CENG. EDF has a 49.99% ownership interest in CENG.
Mid
wes
t M
id-A
tlant
ic
CEN
G
34
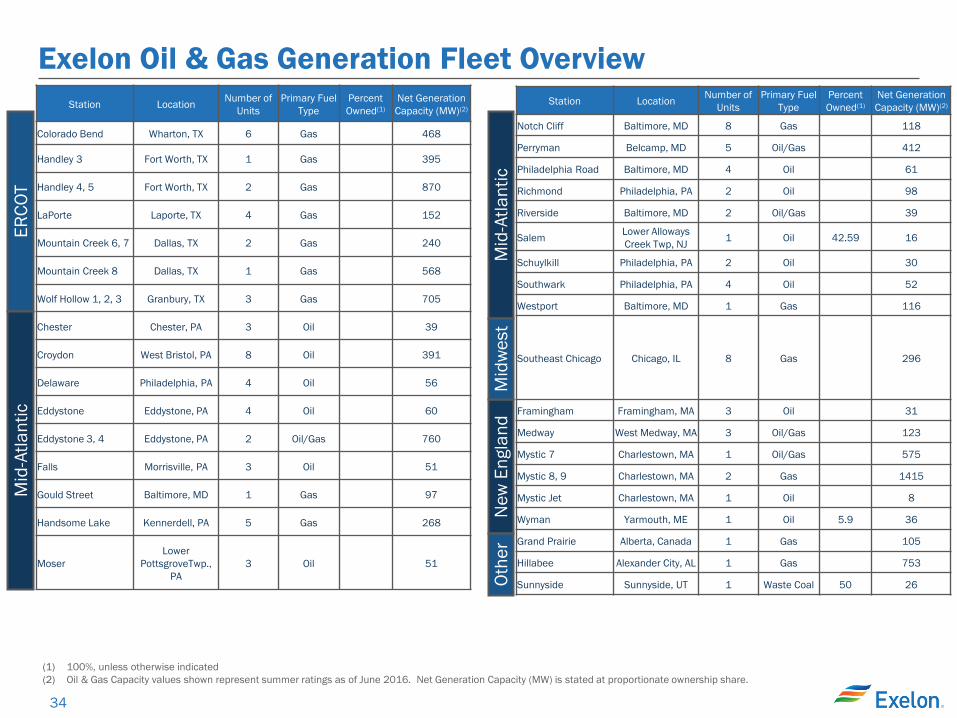
Exelon Oil & Gas Generation Fleet Overview
(1) 100%, unless otherwise indicated (2) Oil & Gas Capacity values shown represent summer ratings as of June 2016. Net Generation Capacity (MW) is stated at proportionate ownership share.
ERCO
T M
id-A
tlant
ic
Station Location Number of Units
Primary Fuel Type
Percent Owned(1)
Net Generation Capacity (MW)(2)
Notch Cliff Baltimore, MD 8 Gas 118
Perryman Belcamp, MD 5 Oil/Gas 412
Philadelphia Road Baltimore, MD 4 Oil 61
Richmond Philadelphia, PA 2 Oil 98
Riverside Baltimore, MD 2 Oil/Gas 39
Salem Lower Alloways Creek Twp, NJ 1 Oil 42.59 16
Schuylkill Philadelphia, PA 2 Oil 30
Southwark Philadelphia, PA 4 Oil 52
Westport Baltimore, MD 1 Gas 116
Southeast Chicago Chicago, IL 8 Gas 296
Framingham Framingham, MA 3 Oil 31
Medway West Medway, MA 3 Oil/Gas 123
Mystic 7 Charlestown, MA 1 Oil/Gas 575
Mystic 8, 9 Charlestown, MA 2 Gas 1415
Mystic Jet Charlestown, MA 1 Oil 8
Wyman Yarmouth, ME 1 Oil 5.9 36
Grand Prairie Alberta, Canada 1 Gas 105
Hillabee Alexander City, AL 1 Gas 753
Sunnyside Sunnyside, UT 1 Waste Coal 50 26
Mid
-Atla
ntic
N
ew E
ngla
nd
Othe
r M
idw
est
Station Location Number of Units
Primary Fuel Type
Percent Owned(1)
Net Generation Capacity (MW)(2)
Colorado Bend Wharton, TX 6 Gas 468
Handley 3 Fort Worth, TX 1 Gas 395
Handley 4, 5 Fort Worth, TX 2 Gas 870
LaPorte Laporte, TX 4 Gas 152
Mountain Creek 6, 7 Dallas, TX 2 Gas 240
Mountain Creek 8 Dallas, TX 1 Gas 568
Wolf Hollow 1, 2, 3 Granbury, TX 3 Gas 705
Chester Chester, PA 3 Oil 39
Croydon West Bristol, PA 8 Oil 391
Delaware Philadelphia, PA 4 Oil 56
Eddystone Eddystone, PA 4 Oil 60
Eddystone 3, 4 Eddystone, PA 2 Oil/Gas 760
Falls Morrisville, PA 3 Oil 51
Gould Street Baltimore, MD 1 Gas 97
Handsome Lake Kennerdell, PA 5 Gas 268
Moser Lower
PottsgroveTwp., PA
3 Oil 51
35
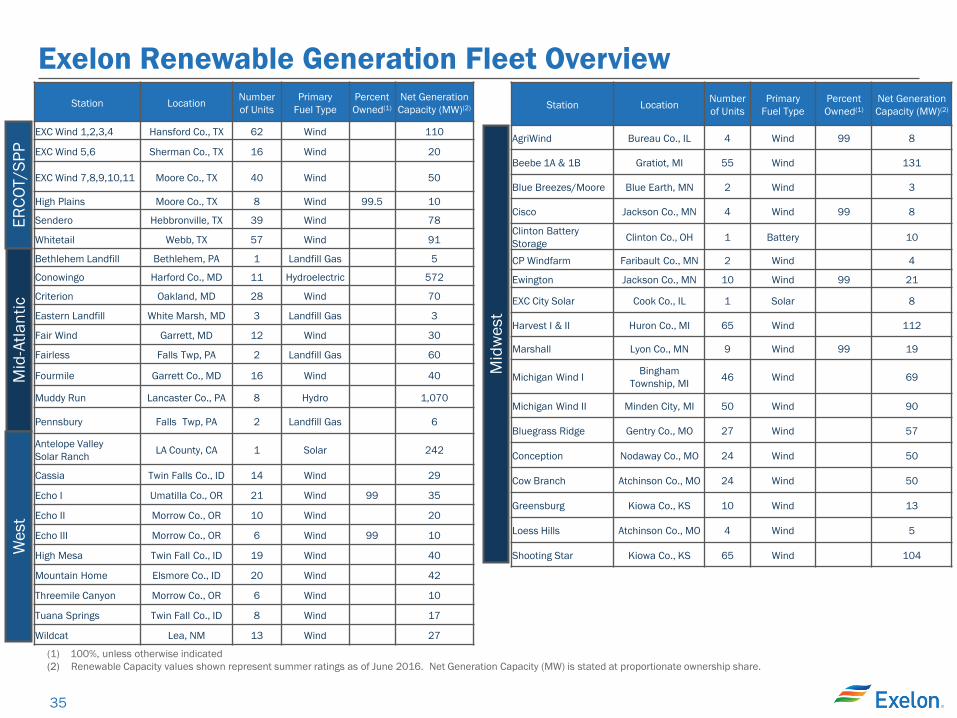
Exelon Renewable Generation Fleet Overview ER
COT/
SPP
Mid
-Atla
ntic
Station Location Number of Units
Primary Fuel Type
Percent Owned(1)
Net Generation Capacity (MW)(2)
AgriWind Bureau Co., IL 4 Wind 99 8
Beebe 1A & 1B Gratiot, MI 55 Wind 131
Blue Breezes/Moore Blue Earth, MN 2 Wind 3
Cisco Jackson Co., MN 4 Wind 99 8
Clinton Battery Storage Clinton Co., OH 1 Battery 10
CP Windfarm Faribault Co., MN 2 Wind 4
Ewington Jackson Co., MN 10 Wind 99 21
EXC City Solar Cook Co., IL 1 Solar 8
Harvest I & II Huron Co., MI 65 Wind 112
Marshall Lyon Co., MN 9 Wind 99 19
Michigan Wind I Bingham Township, MI 46 Wind 69
Michigan Wind II Minden City, MI 50 Wind 90
Bluegrass Ridge Gentry Co., MO 27 Wind 57
Conception Nodaway Co., MO 24 Wind 50
Cow Branch Atchinson Co., MO 24 Wind 50
Greensburg Kiowa Co., KS 10 Wind 13
Loess Hills Atchinson Co., MO 4 Wind 5
Shooting Star Kiowa Co., KS 65 Wind 104
Mid
wes
t
Wes
t
Station Location Number of Units
Primary Fuel Type
Percent Owned(1)
Net Generation Capacity (MW)(2)
EXC Wind 1,2,3,4 Hansford Co., TX 62 Wind 110
EXC Wind 5,6 Sherman Co., TX 16 Wind 20
EXC Wind 7,8,9,10,11 Moore Co., TX 40 Wind 50
High Plains Moore Co., TX 8 Wind 99.5 10
Sendero Hebbronville, TX 39 Wind 78
Whitetail Webb, TX 57 Wind 91
Bethlehem Landfill Bethlehem, PA 1 Landfill Gas 5
Conowingo Harford Co., MD 11 Hydroelectric 572
Criterion Oakland, MD 28 Wind 70
Eastern Landfill White Marsh, MD 3 Landfill Gas 3
Fair Wind Garrett, MD 12 Wind 30
Fairless Falls Twp, PA 2 Landfill Gas 60
Fourmile Garrett Co., MD 16 Wind 40
Muddy Run Lancaster Co., PA 8 Hydro 1,070
Pennsbury Falls Twp, PA 2 Landfill Gas 6
Antelope Valley Solar Ranch LA County, CA 1 Solar 242
Cassia Twin Falls Co., ID 14 Wind 29
Echo I Umatilla Co., OR 21 Wind 99 35
Echo II Morrow Co., OR 10 Wind 20
Echo III Morrow Co., OR 6 Wind 99 10
High Mesa Twin Fall Co., ID 19 Wind 40
Mountain Home Elsmore Co., ID 20 Wind 42
Threemile Canyon Morrow Co., OR 6 Wind 10
Tuana Springs Twin Fall Co., ID 8 Wind 17
Wildcat Lea, NM 13 Wind 27
(1) 100%, unless otherwise indicated (2) Renewable Capacity values shown represent summer ratings as of June 2016. Net Generation Capacity (MW) is stated at proportionate ownership share.
36
Delivering Value Through Capital Allocation Policy
Our strong balance sheet underpins our capital allocation policy and capital decisions are made to maximize value to our customers and shareholders
We are returning capital to shareholders by growing our dividend, targeting 2.5% annual increases through 2018(1) with upside potential beyond
We are redeploying free cash flow from Exelon Generation to support: Investing in utilities where we can earn an appropriate return and will deploy
$25B of capital over the next 5 years Retiring debt with ~$3B targeted at ExGen over the next 5 years Investing in select contracted assets where we can meaningfully exceed
our return thresholds
(1) Quarterly dividends are subject to declaration by the board of directors
37
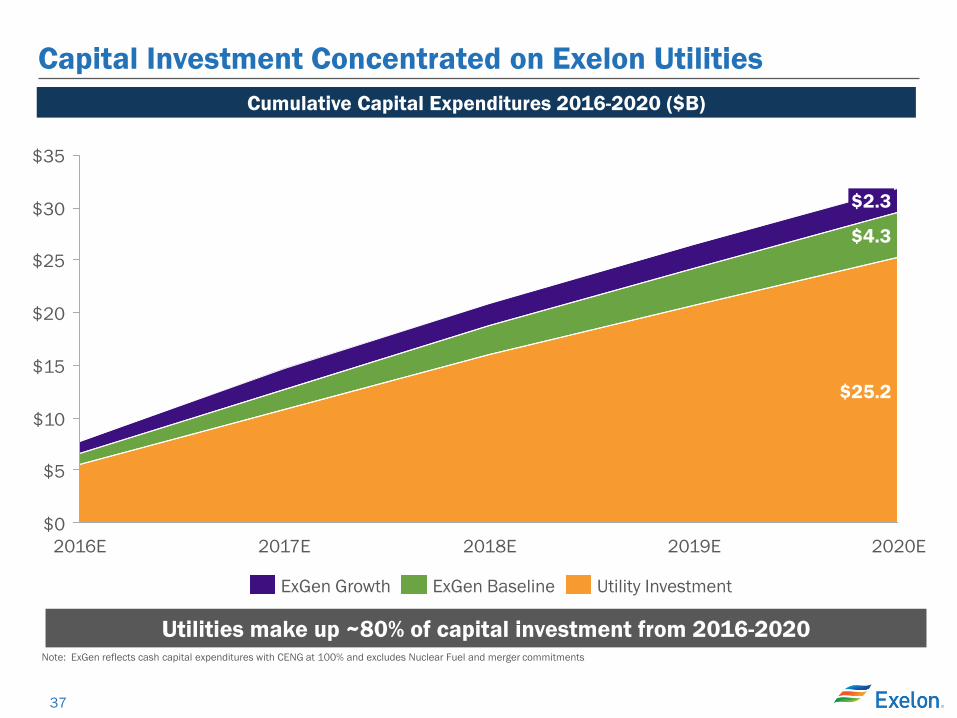
Capital Investment Concentrated on Exelon Utilities
Note: ExGen reflects cash capital expenditures with CENG at 100% and excludes Nuclear Fuel and merger commitments
$35
$30
$25
$20
$15
$10
$5
$0 2020E
$25.2
$4.3
$2.3
2019E 2018E 2017E 2016E
Cumulative Capital Expenditures 2016-2020 ($B)
Utility Investment ExGen Baseline ExGen Growth
Utilities make up ~80% of capital investment from 2016-2020
38
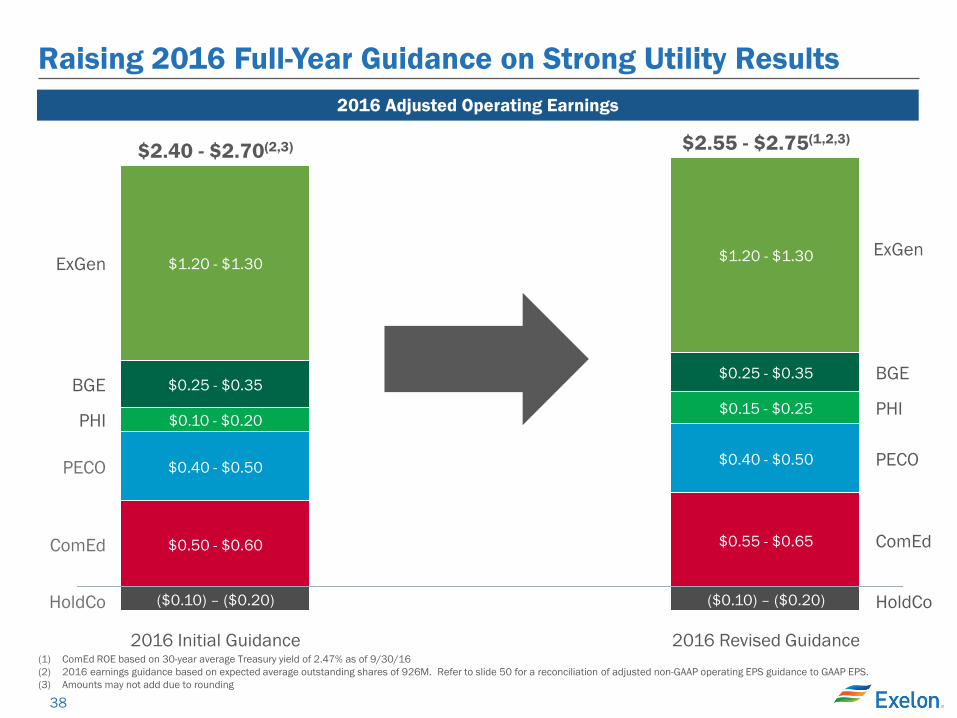
2016 Adjusted Operating Earnings
PECO
PHI
BGE
ExGen
2016 Revised Guidance
$2.55 - $2.75(1,2,3)
($0.10) – ($0.20)
$0.55 - $0.65
$0.40 - $0.50
$0.15 - $0.25
$0.25 - $0.35
$1.20 - $1.30
2016 Initial Guidance
$2.40 - $2.70(2,3)
($0.10) – ($0.20)
$0.50 - $0.60
$0.40 - $0.50
$0.10 - $0.20
$0.25 - $0.35
$1.20 - $1.30
ComEd
HoldCo HoldCo
BGE
PHI
PECO
ComEd
(1) ComEd ROE based on 30-year average Treasury yield of 2.47% as of 9/30/16 (2) 2016 earnings guidance based on expected average outstanding shares of 926M. Refer to slide 50 for a reconciliation of adjusted non-GAAP operating EPS guidance to GAAP EPS. (3) Amounts may not add due to rounding
ExGen
Raising 2016 Full-Year Guidance on Strong Utility Results
39
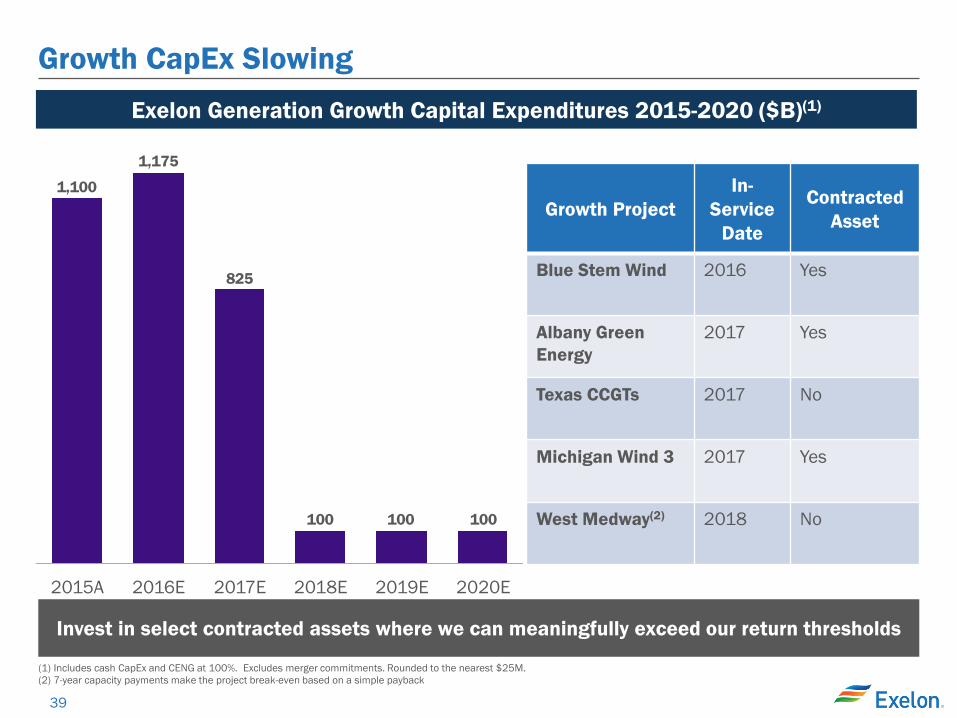
Growth CapEx Slowing
100100100
825
1,175
1,100
2020E 2019E 2018E 2017E 2016E 2015A
Growth Project In-
Service Date
Contracted Asset
Blue Stem Wind 2016 Yes
Albany Green Energy
2017 Yes
Texas CCGTs 2017 No
Michigan Wind 3 2017 Yes
West Medway(2) 2018 No
Exelon Generation Growth Capital Expenditures 2015-2020 ($B)(1)
(1) Includes cash CapEx and CENG at 100%. Excludes merger commitments. Rounded to the nearest $25M. (2) 7-year capacity payments make the project break-even based on a simple payback
Invest in select contracted assets where we can meaningfully exceed our return thresholds
40
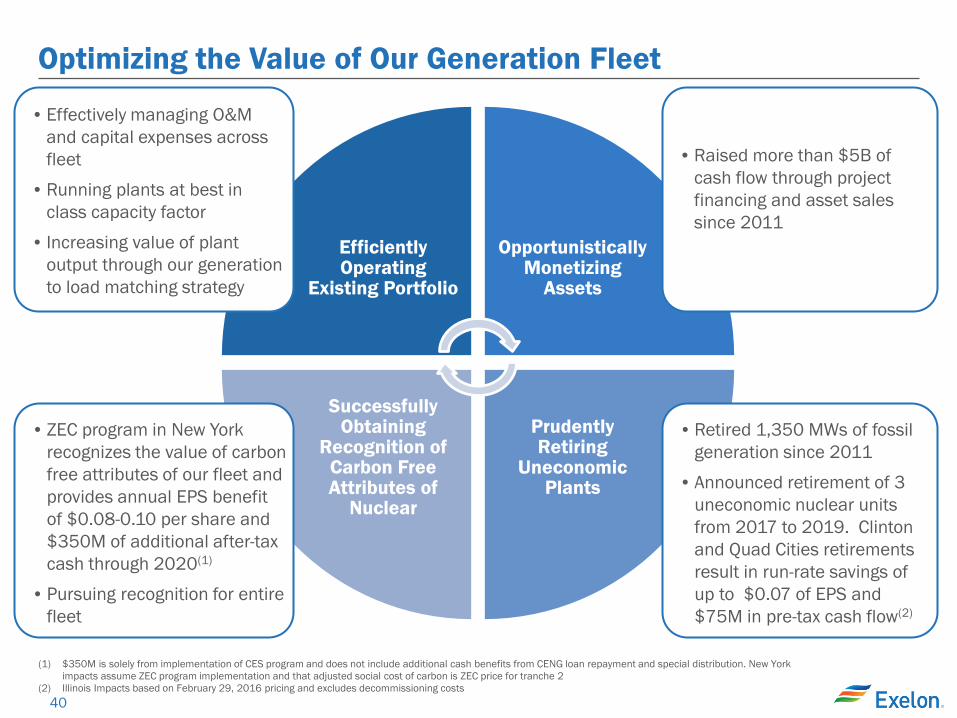
Efficiently Operating
Existing Portfolio
Opportunistically Monetizing
Assets
Prudently Retiring
Uneconomic Plants
Successfully Obtaining
Recognition of Carbon Free Attributes of
Nuclear
Optimizing the Value of Our Generation Fleet
• ZEC program in New York
recognizes the value of carbon free attributes of our fleet and provides annual EPS benefit of $0.08-0.10 per share and $350M of additional after-tax cash through 2020(1)
• Pursuing recognition for entire fleet
• Retired 1,350 MWs of fossil
generation since 2011
• Announced retirement of 3 uneconomic nuclear units from 2017 to 2019. Clinton and Quad Cities retirements result in run-rate savings of up to $0.07 of EPS and $75M in pre-tax cash flow(2)
• Raised more than $5B of cash flow through project financing and asset sales since 2011
• Effectively managing O&M and capital expenses across fleet
• Running plants at best in class capacity factor
• Increasing value of plant output through our generation to load matching strategy
(1) $350M is solely from implementation of CES program and does not include additional cash benefits from CENG loan repayment and special distribution. New York impacts assume ZEC program implementation and that adjusted social cost of carbon is ZEC price for tranche 2
(2) Illinois Impacts based on February 29, 2016 pricing and excludes decommissioning costs
41
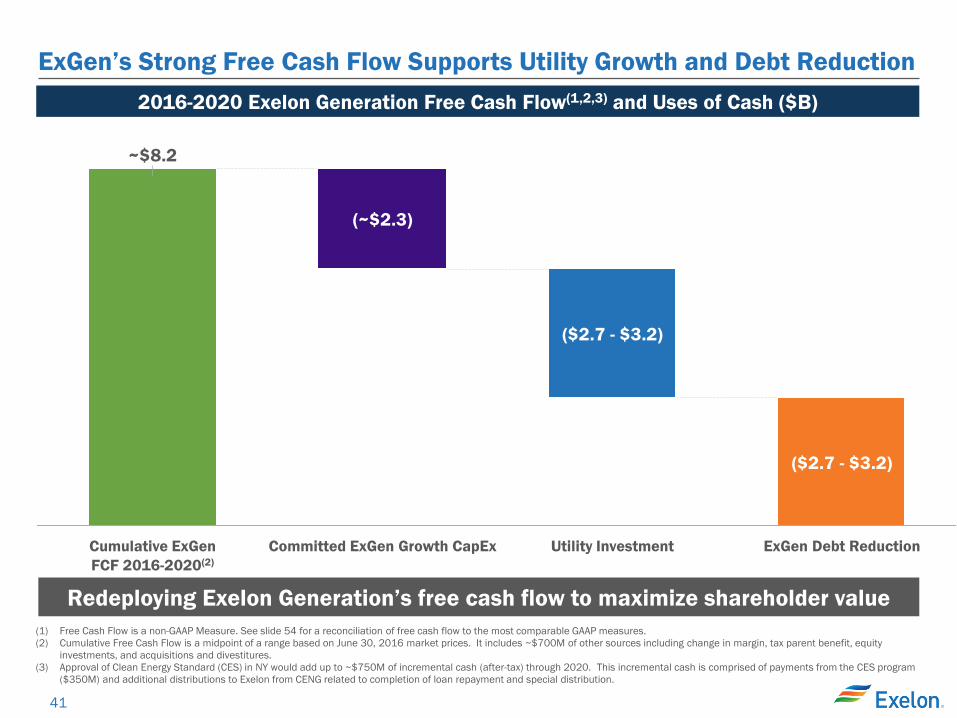
ExGen’s Strong Free Cash Flow Supports Utility Growth and Debt Reduction 2016-2020 Exelon Generation Free Cash Flow(1,2,3) and Uses of Cash ($B)
(1) Free Cash Flow is a non-GAAP Measure. See slide 54 for a reconciliation of free cash flow to the most comparable GAAP measures. (2) Cumulative Free Cash Flow is a midpoint of a range based on June 30, 2016 market prices. It includes ~$700M of other sources including change in margin, tax parent benefit, equity
investments, and acquisitions and divestitures. (3) Approval of Clean Energy Standard (CES) in NY would add up to ~$750M of incremental cash (after-tax) through 2020. This incremental cash is comprised of payments from the CES program
($350M) and additional distributions to Exelon from CENG related to completion of loan repayment and special distribution.
($2.7 - $3.2)
Cumulative ExGen FCF 2016-2020(2)
(~$2.3)
Utility Investment Committed ExGen Growth CapEx ExGen Debt Reduction
($2.7 - $3.2)
~$8.2
Redeploying Exelon Generation’s free cash flow to maximize shareholder value
42
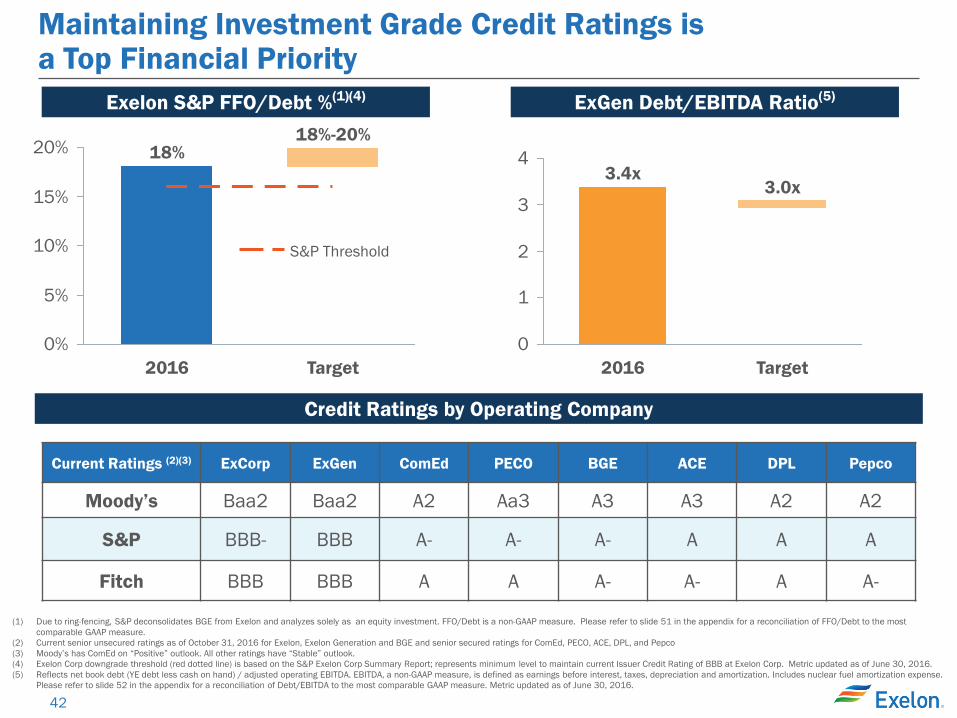
Maintaining Investment Grade Credit Ratings is a Top Financial Priority
Current Ratings (2)(3) ExCorp ExGen ComEd PECO BGE ACE DPL Pepco
Moody’s Baa2 Baa2 A2 Aa3 A3 A3 A2 A2
S&P BBB- BBB A- A- A- A A A
Fitch BBB BBB A A A- A- A A-
(1) Due to ring-fencing, S&P deconsolidates BGE from Exelon and analyzes solely as an equity investment. FFO/Debt is a non-GAAP measure. Please refer to slide 51 in the appendix for a reconciliation of FFO/Debt to the most comparable GAAP measure.
(2) Current senior unsecured ratings as of October 31, 2016 for Exelon, Exelon Generation and BGE and senior secured ratings for ComEd, PECO, ACE, DPL, and Pepco (3) Moody’s has ComEd on “Positive” outlook. All other ratings have “Stable” outlook. (4) Exelon Corp downgrade threshold (red dotted line) is based on the S&P Exelon Corp Summary Report; represents minimum level to maintain current Issuer Credit Rating of BBB at Exelon Corp. Metric updated as of June 30, 2016. (5) Reflects net book debt (YE debt less cash on hand) / adjusted operating EBITDA. EBITDA, a non-GAAP measure, is defined as earnings before interest, taxes, depreciation and amortization. Includes nuclear fuel amortization expense.
Please refer to slide 52 in the appendix for a reconciliation of Debt/EBITDA to the most comparable GAAP measure. Metric updated as of June 30, 2016.
ExGen Debt/EBITDA Ratio(5) Exelon S&P FFO/Debt %(1)(4)
Credit Ratings by Operating Company
0%
5%
10%
15%
20%
Target
18%-20%
2016
18%
0
1
2
3
4
Target
3.0x
2016
3.4x
S&P Threshold
43
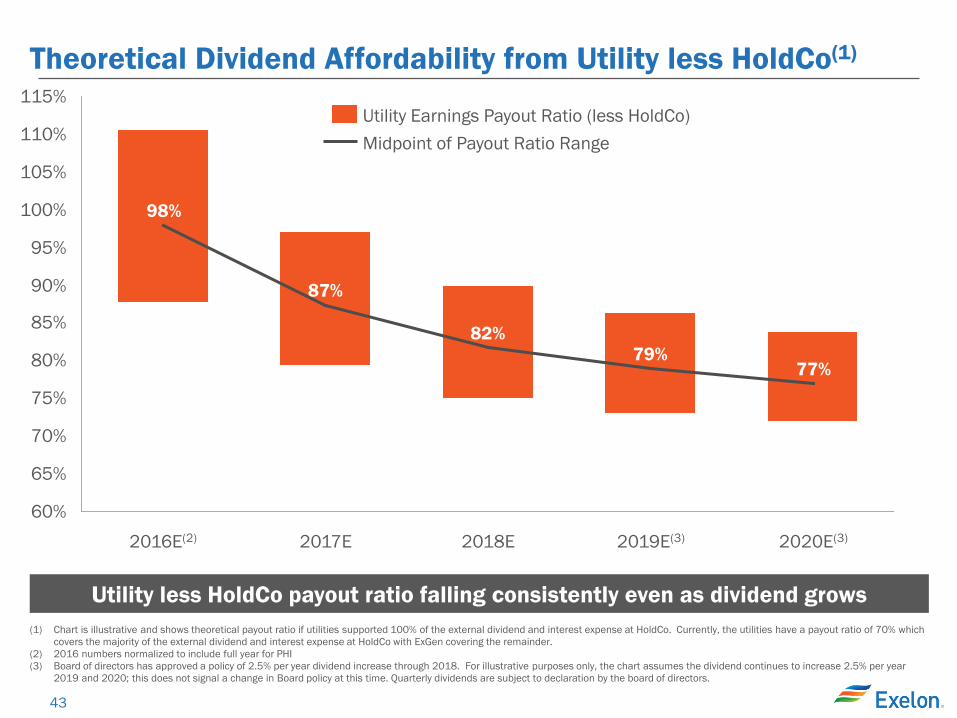
Theoretical Dividend Affordability from Utility less HoldCo(1)
Utility less HoldCo payout ratio falling consistently even as dividend grows
(1) Chart is illustrative and shows theoretical payout ratio if utilities supported 100% of the external dividend and interest expense at HoldCo. Currently, the utilities have a payout ratio of 70% which covers the majority of the external dividend and interest expense at HoldCo with ExGen covering the remainder.
(2) 2016 numbers normalized to include full year for PHI (3) Board of directors has approved a policy of 2.5% per year dividend increase through 2018. For illustrative purposes only, the chart assumes the dividend continues to increase 2.5% per year
2019 and 2020; this does not signal a change in Board policy at this time. Quarterly dividends are subject to declaration by the board of directors.
77%79%
82%
87%
98%
60%
65%
70%
75%
80%
85%
90%
95%
100%
105%
110%
115%
2018E 2017E 2020E(3) 2019E(3) 2016E(2)
Midpoint of Payout Ratio Range Utility Earnings Payout Ratio (less HoldCo)
44
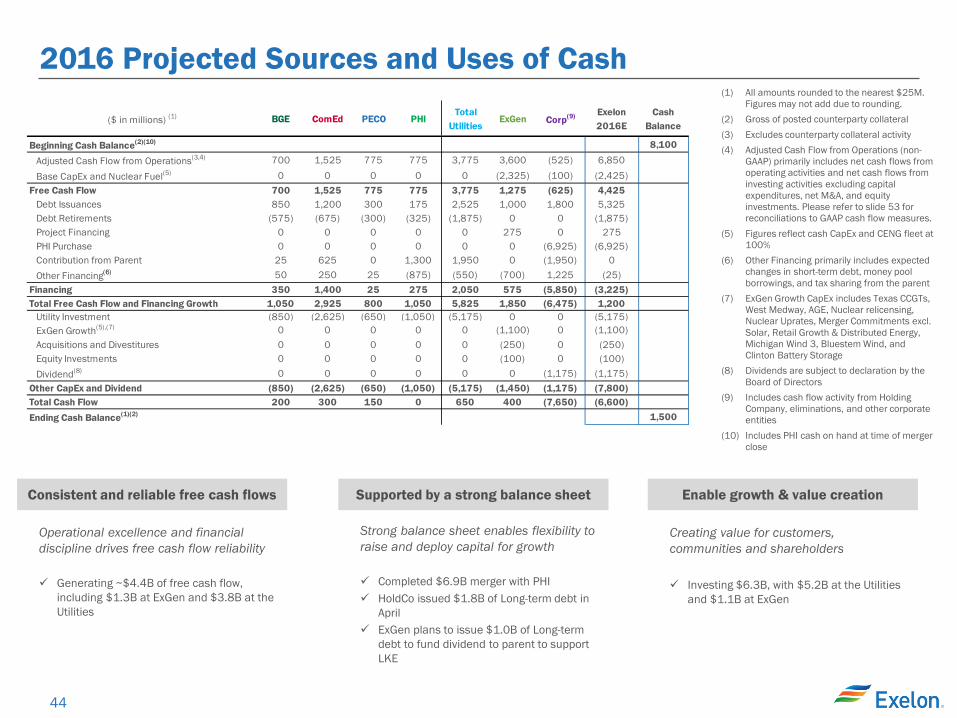
2016 Projected Sources and Uses of Cash
(1) All amounts rounded to the nearest $25M. Figures may not add due to rounding.
(2) Gross of posted counterparty collateral (3) Excludes counterparty collateral activity (4) Adjusted Cash Flow from Operations (non-
GAAP) primarily includes net cash flows from operating activities and net cash flows from investing activities excluding capital expenditures, net M&A, and equity investments. Please refer to slide 53 for reconciliations to GAAP cash flow measures.
(5) Figures reflect cash CapEx and CENG fleet at 100%
(6) Other Financing primarily includes expected changes in short-term debt, money pool borrowings, and tax sharing from the parent
(7) ExGen Growth CapEx includes Texas CCGTs, West Medway, AGE, Nuclear relicensing, Nuclear Uprates, Merger Commitments excl. Solar, Retail Growth & Distributed Energy, Michigan Wind 3, Bluestem Wind, and Clinton Battery Storage
(8) Dividends are subject to declaration by the Board of Directors
(9) Includes cash flow activity from Holding Company, eliminations, and other corporate entities
(10) Includes PHI cash on hand at time of merger close
Consistent and reliable free cash flows Enable growth & value creation Supported by a strong balance sheet
Strong balance sheet enables flexibility to raise and deploy capital for growth
Completed $6.9B merger with PHI HoldCo issued $1.8B of Long-term debt in
April ExGen plans to issue $1.0B of Long-term
debt to fund dividend to parent to support LKE
Operational excellence and financial discipline drives free cash flow reliability
Generating ~$4.4B of free cash flow,
including $1.3B at ExGen and $3.8B at the Utilities
Creating value for customers, communities and shareholders Investing $6.3B, with $5.2B at the Utilities
and $1.1B at ExGen
($ in millions) (1) BGE ComEd PECO PHITotal
UtilitiesExGen Corp(9) Exelon
2016ECash
Balance
Beginning Cash Balance(2)(10) 8,100
Adjusted Cash Flow from Operations(3,4) 700 1,525 775 775 3,775 3,600 (525) 6,850
Base CapEx and Nuclear Fuel(5) 0 0 0 0 0 (2,325) (100) (2,425)Free Cash Flow 700 1,525 775 775 3,775 1,275 (625) 4,425
Debt Issuances 850 1,200 300 175 2,525 1,000 1,800 5,325 Debt Retirements (575) (675) (300) (325) (1,875) 0 0 (1,875)Project Financing 0 0 0 0 0 275 0 275 PHI Purchase 0 0 0 0 0 0 (6,925) (6,925)Contribution from Parent 25 625 0 1,300 1,950 0 (1,950) 0 Other Financing(6) 50 250 25 (875) (550) (700) 1,225 (25)
Financing 350 1,400 25 275 2,050 575 (5,850) (3,225)Total Free Cash Flow and Financing Growth 1,050 2,925 800 1,050 5,825 1,850 (6,475) 1,200
Utility Investment (850) (2,625) (650) (1,050) (5,175) 0 0 (5,175)ExGen Growth(5),(7) 0 0 0 0 0 (1,100) 0 (1,100)Acquisitions and Divestitures 0 0 0 0 0 (250) 0 (250)Equity Investments 0 0 0 0 0 (100) 0 (100)Dividend(8) 0 0 0 0 0 0 (1,175) (1,175)
Other CapEx and Dividend (850) (2,625) (650) (1,050) (5,175) (1,450) (1,175) (7,800)Total Cash Flow 200 300 150 0 650 400 (7,650) (6,600)Ending Cash Balance(1)(2) 1,500
45
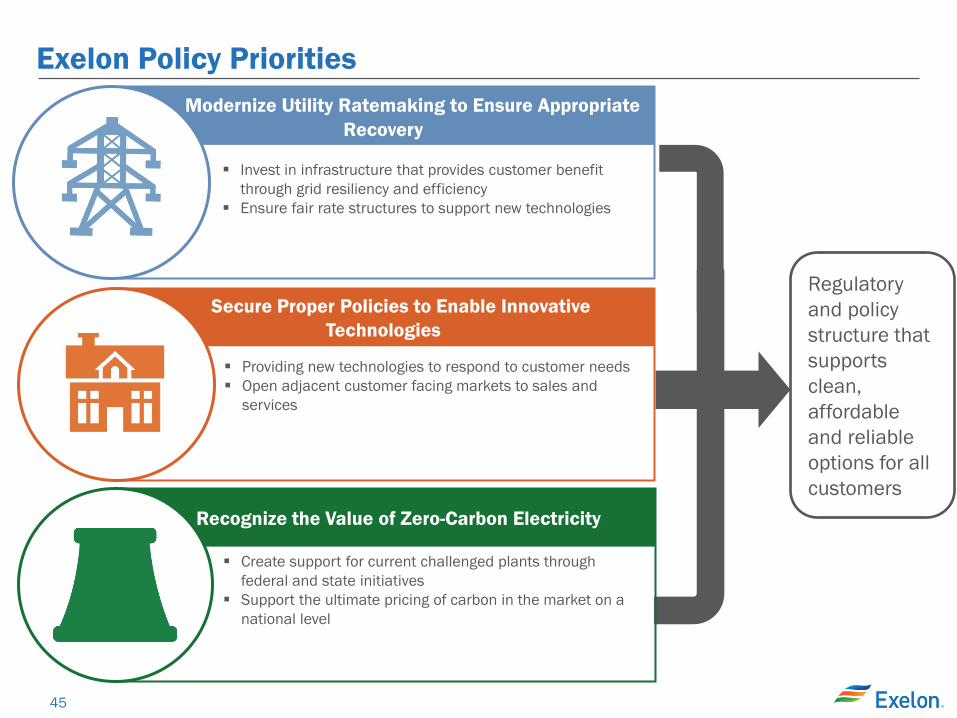
Exelon Policy Priorities
Create support for current challenged plants through federal and state initiatives
Support the ultimate pricing of carbon in the market on a national level
Modernize Utility Ratemaking to Ensure Appropriate Recovery
Secure Proper Policies to Enable Innovative Technologies
Recognize the Value of Zero-Carbon Electricity
Regulatory and policy structure that supports clean, affordable and reliable options for all customers
Invest in infrastructure that provides customer benefit through grid resiliency and efficiency
Ensure fair rate structures to support new technologies
Providing new technologies to respond to customer needs Open adjacent customer facing markets to sales and
services
46
Our Carbon Policy Principles • Exelon believes in our nation’s ability to transition the generation fleet to a zero-carbon
future while maintaining affordable and reliable electric service for consumers • For the foreseeable future, the most cost-effective carbon solution for our customers will
be the continued operation of our nation’s nuclear fleet • Exelon believes competitive markets produce superior results for consumers and drive
innovation. However, those markets do not currently incorporate appropriate pricing for environmental attributes.
• Exelon is pursuing a two-part strategy for moving toward a more competitive treatment of CO2 emissions: o First, we must maintain nuclear units that provide a cost effective form of CO2
abatement. The New York ZEC program demonstrates that as long as the clean energy payment required to maintain operations at existing nuclear units is lower than the social cost of CO2 emissions and the cost of CO2 abatement being paid to other zero carbon resources, maintaining nuclear capacity should be selected as the most competitive source of CO2 abatement.
o Second, we must continue to work toward a technology neutral price of CO2 abatement. Exelon is pursuing approaches to reflect a uniform price on CO2 in wholesale markets as an eventual substitute for technology-specific subsidies. As these approaches are phased in, the ZEC programs have been designed to automatically reduce ZEC payments in response to higher energy prices.
47
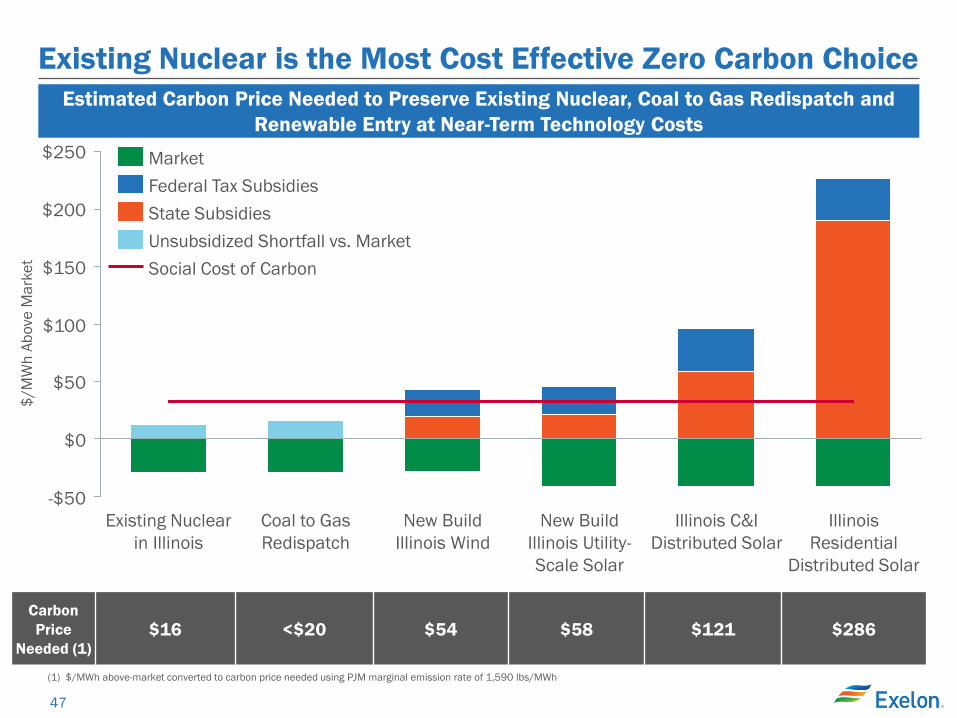
Existing Nuclear is the Most Cost Effective Zero Carbon Choice
Carbon Price
Needed (1) $16 <$20 $54 $58 $121 $286
(1) $/MWh above-market converted to carbon price needed using PJM marginal emission rate of 1,590 lbs/MWh
$250
$0
$50
-$50
$150
$200
$100
Coal to Gas Redispatch
New Build Illinois Wind
New Build Illinois Utility-Scale Solar
Illinois Residential
Distributed Solar
Illinois C&I Distributed Solar
Existing Nuclear in Illinois
Federal Tax Subsidies State Subsidies Unsubsidized Shortfall vs. Market Social Cost of Carbon
Market
Estimated Carbon Price Needed to Preserve Existing Nuclear, Coal to Gas Redispatch and Renewable Entry at Near-Term Technology Costs
$/M
Wh
Abov
e M
arke
t
48
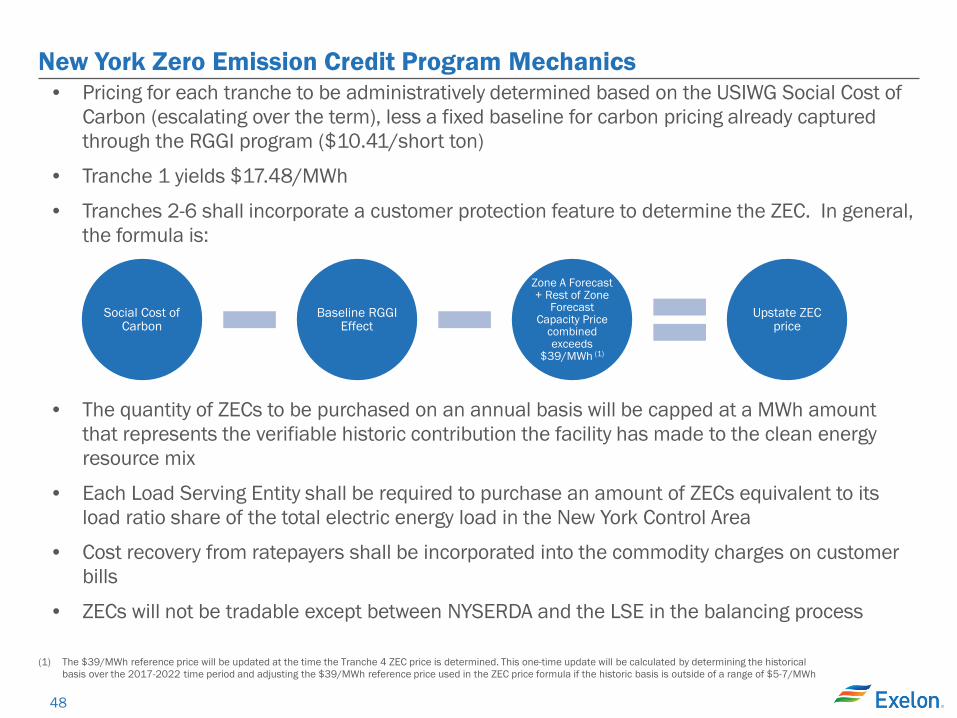
New York Zero Emission Credit Program Mechanics
• Pricing for each tranche to be administratively determined based on the USIWG Social Cost of Carbon (escalating over the term), less a fixed baseline for carbon pricing already captured through the RGGI program ($10.41/short ton)
• Tranche 1 yields $17.48/MWh
• Tranches 2-6 shall incorporate a customer protection feature to determine the ZEC. In general, the formula is:
• The quantity of ZECs to be purchased on an annual basis will be capped at a MWh amount that represents the verifiable historic contribution the facility has made to the clean energy resource mix
• Each Load Serving Entity shall be required to purchase an amount of ZECs equivalent to its load ratio share of the total electric energy load in the New York Control Area
• Cost recovery from ratepayers shall be incorporated into the commodity charges on customer bills
• ZECs will not be tradable except between NYSERDA and the LSE in the balancing process
Social Cost of Carbon
Baseline RGGI Effect
Zone A Forecast + Rest of Zone
Forecast Capacity Price
combined exceeds
$39/MWh (1)
Upstate ZEC price
(1) The $39/MWh reference price will be updated at the time the Tranche 4 ZEC price is determined. This one-time update will be calculated by determining the historical basis over the 2017-2022 time period and adjusting the $39/MWh reference price used in the ZEC price formula if the historic basis is outside of a range of $5-7/MWh
49
Zero Emission Credits (ZECs) are Like Renewable Energy Credits (RECs)
Both credits are for environmental attributes to meet a state environmental goal
While legal challenges are likely, we believe that ZECs, like RECs, will withstand legal challenge: •No affiliate contracts (Ohio) •No attempt to alter FERC wholesale rate (NJ/MD) • Payment for ZECs is not “tethered” to action in a FERC jurisdictional
market
FERC has never applied the Minimum Offer Price Rule (MOPR) to existing resources; it has always been a tool to address state support for new entry
50
GAAP to Operating Earnings Adjustments
• Exelon’s Adjusted (non-GAAP) operating earnings excludes the earnings effects of the following: − Mark-to-market adjustments from economic hedging activities − Unrealized gains and losses from NDT fund investments to the extent not offset by contractual
accounting as described in the notes to the consolidated financial statements − Non-cash amortization of intangible assets, net, related to commodity contracts recorded at fair value at
the date of acquisition of Integrys in 2014 and ConEdison Solutions in 2016 − Certain costs incurred associated with PHI and FitzPatrick acquisitions − Adjustments to merger commitments costs related to settlement of PHI acquisition − Impairments of upstream assets − Plant retirements and divestitures at Generation − Costs incurred related to cost management program − Like-kind exchange tax position at Exelon and ComEd − Generation’s non-controlling interest related to CENG exclusion items − Other unusual items
51
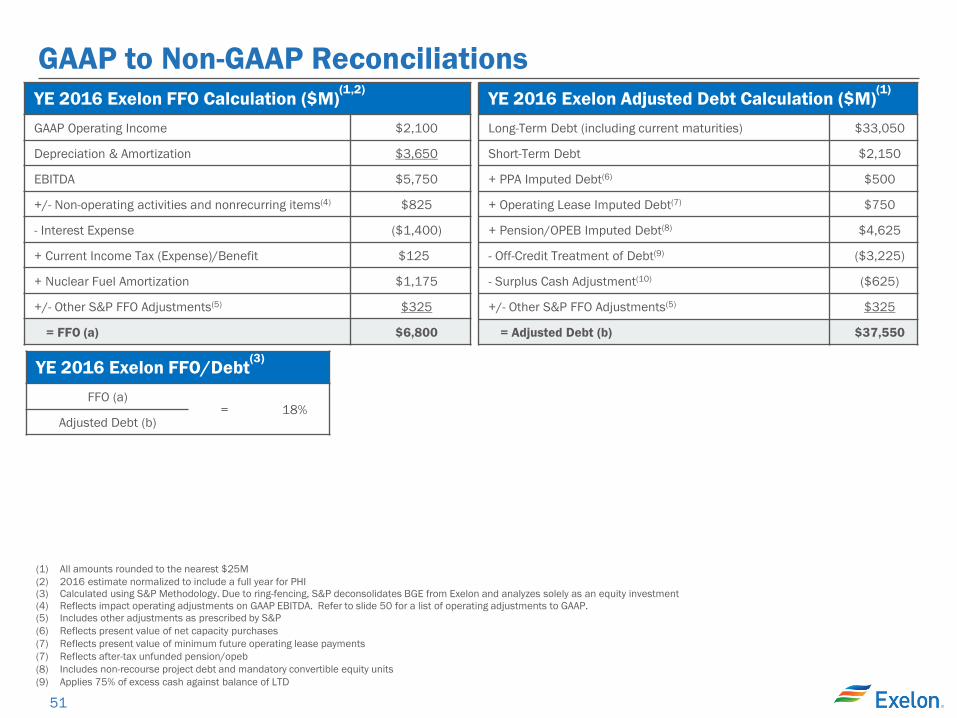
(1) All amounts rounded to the nearest $25M (2) 2016 estimate normalized to include a full year for PHI (3) Calculated using S&P Methodology. Due to ring-fencing, S&P deconsolidates BGE from Exelon and analyzes solely as an equity investment (4) Reflects impact operating adjustments on GAAP EBITDA. Refer to slide 50 for a list of operating adjustments to GAAP. (5) Includes other adjustments as prescribed by S&P (6) Reflects present value of net capacity purchases (7) Reflects present value of minimum future operating lease payments (7) Reflects after-tax unfunded pension/opeb (8) Includes non-recourse project debt and mandatory convertible equity units (9) Applies 75% of excess cash against balance of LTD
YE 2016 Exelon FFO Calculation ($M)(1,2)
GAAP Operating Income $2,100
Depreciation & Amortization $3,650
EBITDA $5,750
+/- Non-operating activities and nonrecurring items(4) $825
- Interest Expense ($1,400)
+ Current Income Tax (Expense)/Benefit $125
+ Nuclear Fuel Amortization $1,175
+/- Other S&P FFO Adjustments(5) $325
= FFO (a) $6,800
YE 2016 Exelon Adjusted Debt Calculation ($M)(1)
Long-Term Debt (including current maturities) $33,050
Short-Term Debt $2,150
+ PPA Imputed Debt(6) $500
+ Operating Lease Imputed Debt(7) $750
+ Pension/OPEB Imputed Debt(8) $4,625
- Off-Credit Treatment of Debt(9) ($3,225)
- Surplus Cash Adjustment(10) ($625)
+/- Other S&P FFO Adjustments(5) $325
= Adjusted Debt (b) $37,550
YE 2016 Exelon FFO/Debt(3)
FFO (a)
= 18% Adjusted Debt (b)
GAAP to Non-GAAP Reconciliations
52
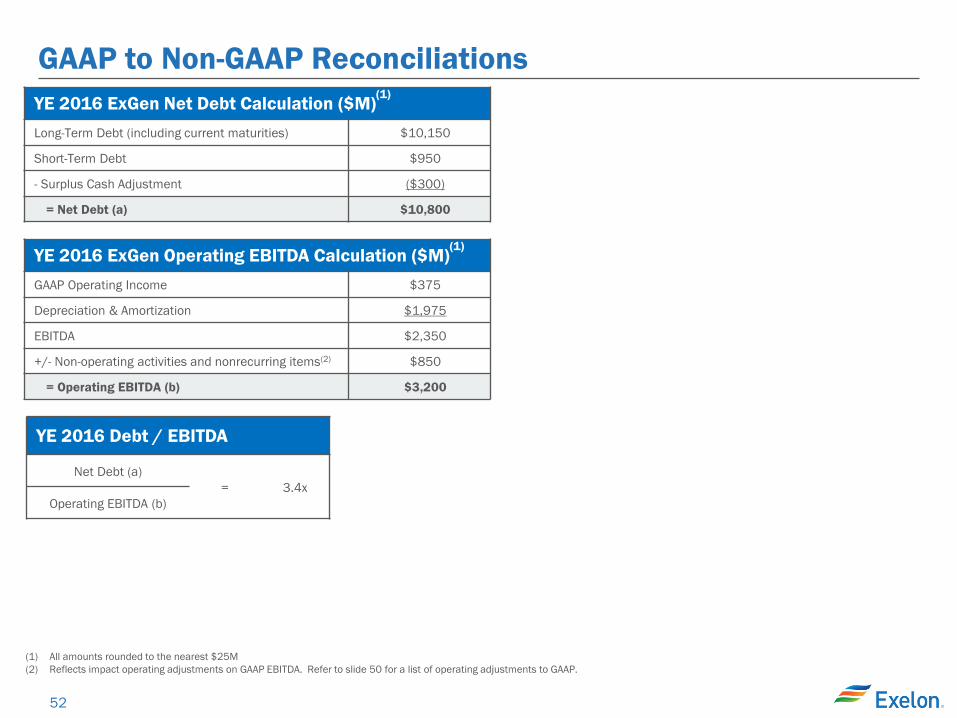
YE 2016 ExGen Net Debt Calculation ($M)(1)
Long-Term Debt (including current maturities) $10,150
Short-Term Debt $950
- Surplus Cash Adjustment ($300)
= Net Debt (a) $10,800
YE 2016 Debt / EBITDA
Net Debt (a)
= 3.4x Operating EBITDA (b)
(1) All amounts rounded to the nearest $25M (2) Reflects impact operating adjustments on GAAP EBITDA. Refer to slide 50 for a list of operating adjustments to GAAP.
YE 2016 ExGen Operating EBITDA Calculation ($M)(1)
GAAP Operating Income $375
Depreciation & Amortization $1,975
EBITDA $2,350
+/- Non-operating activities and nonrecurring items(2) $850
= Operating EBITDA (b) $3,200
GAAP to Non-GAAP Reconciliations
53
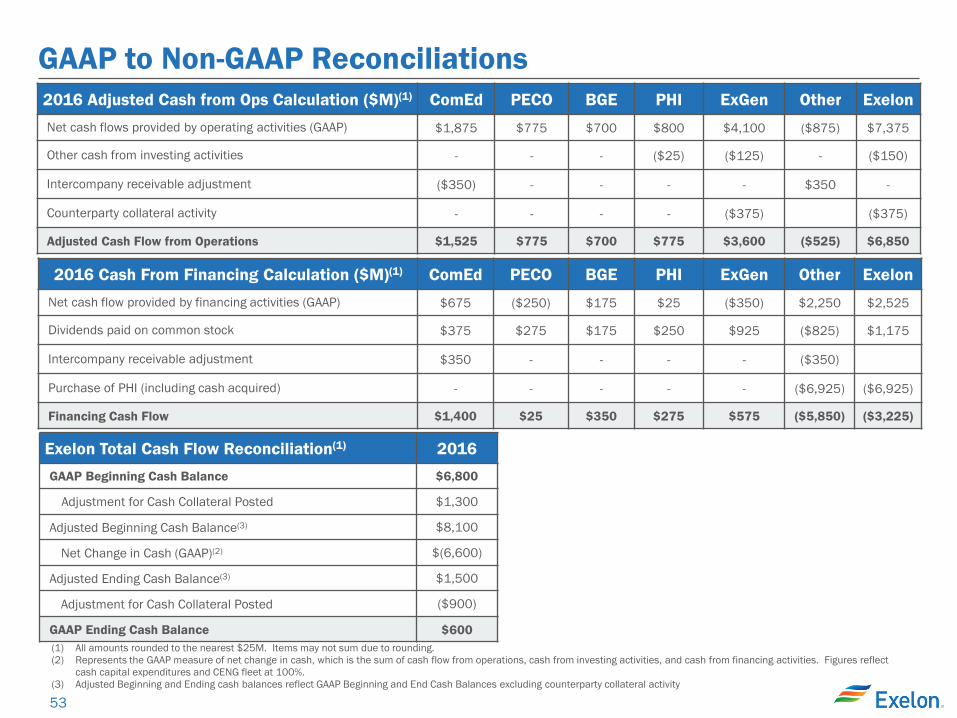
GAAP to Non-GAAP Reconciliations 2016 Adjusted Cash from Ops Calculation ($M)(1) ComEd PECO BGE PHI ExGen Other Exelon Net cash flows provided by operating activities (GAAP)
$1,875 $775 $700 $800 $4,100 ($875) $7,375
Other cash from investing activities - - - ($25) ($125) - ($150)
Intercompany receivable adjustment ($350) - - - - $350 -
Counterparty collateral activity - - - - ($375) ($375)
Adjusted Cash Flow from Operations $1,525 $775 $700 $775 $3,600 ($525) $6,850
2016 Cash From Financing Calculation ($M)(1) ComEd PECO BGE PHI ExGen Other Exelon Net cash flow provided by financing activities (GAAP)
$675 ($250) $175 $25 ($350) $2,250 $2,525
Dividends paid on common stock $375 $275 $175 $250 $925 ($825) $1,175
Intercompany receivable adjustment $350 - - - - ($350)
Purchase of PHI (including cash acquired) - - - - - ($6,925) ($6,925)
Financing Cash Flow $1,400 $25 $350 $275 $575 ($5,850) ($3,225)
Exelon Total Cash Flow Reconciliation(1) 2016
GAAP Beginning Cash Balance $6,800
Adjustment for Cash Collateral Posted $1,300
Adjusted Beginning Cash Balance(3) $8,100
Net Change in Cash (GAAP)(2) $(6,600)
Adjusted Ending Cash Balance(3) $1,500
Adjustment for Cash Collateral Posted ($900)
GAAP Ending Cash Balance $600 (1) All amounts rounded to the nearest $25M. Items may not sum due to rounding. (2) Represents the GAAP measure of net change in cash, which is the sum of cash flow from operations, cash from investing activities, and cash from financing activities. Figures reflect
cash capital expenditures and CENG fleet at 100%. (3) Adjusted Beginning and Ending cash balances reflect GAAP Beginning and End Cash Balances excluding counterparty collateral activity
54
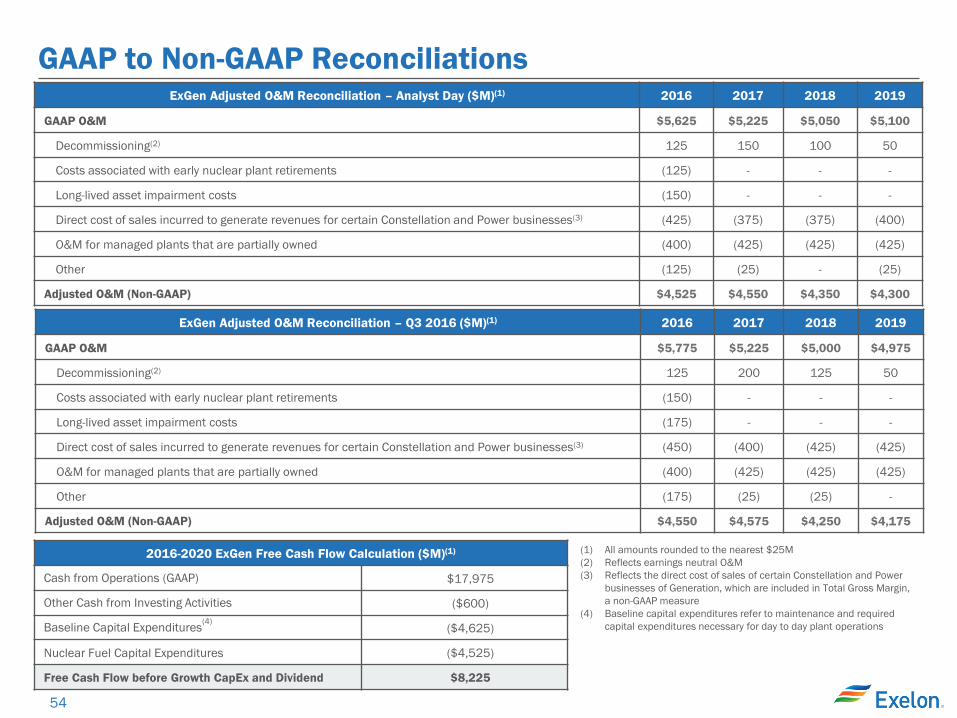
ExGen Adjusted O&M Reconciliation – Analyst Day ($M)(1) 2016 2017 2018 2019
GAAP O&M $5,625 $5,225 $5,050 $5,100
Decommissioning(2) 125 150 100 50
Costs associated with early nuclear plant retirements (125) - - -
Long-lived asset impairment costs (150) - - -
Direct cost of sales incurred to generate revenues for certain Constellation and Power businesses(3) (425) (375) (375) (400)
O&M for managed plants that are partially owned (400) (425) (425) (425)
Other (125) (25) - (25)
Adjusted O&M (Non-GAAP) $4,525 $4,550 $4,350 $4,300
(1) All amounts rounded to the nearest $25M (2) Reflects earnings neutral O&M (3) Reflects the direct cost of sales of certain Constellation and Power
businesses of Generation, which are included in Total Gross Margin, a non-GAAP measure
(4) Baseline capital expenditures refer to maintenance and required capital expenditures necessary for day to day plant operations
GAAP to Non-GAAP Reconciliations
2016-2020 ExGen Free Cash Flow Calculation ($M)(1)
Cash from Operations (GAAP) $17,975
Other Cash from Investing Activities ($600)
Baseline Capital Expenditures(4) ($4,625)
Nuclear Fuel Capital Expenditures ($4,525)
Free Cash Flow before Growth CapEx and Dividend $8,225
ExGen Adjusted O&M Reconciliation – Q3 2016 ($M)(1) 2016 2017 2018 2019
GAAP O&M $5,775 $5,225 $5,000 $4,975
Decommissioning(2) 125 200 125 50
Costs associated with early nuclear plant retirements (150) - - -
Long-lived asset impairment costs (175) - - -
Direct cost of sales incurred to generate revenues for certain Constellation and Power businesses(3) (450) (400) (425) (425)
O&M for managed plants that are partially owned (400) (425) (425) (425)
Other (175) (25) (25) -
Adjusted O&M (Non-GAAP) $4,550 $4,575 $4,250 $4,175
55
GAAP to Non-GAAP Reconciliations
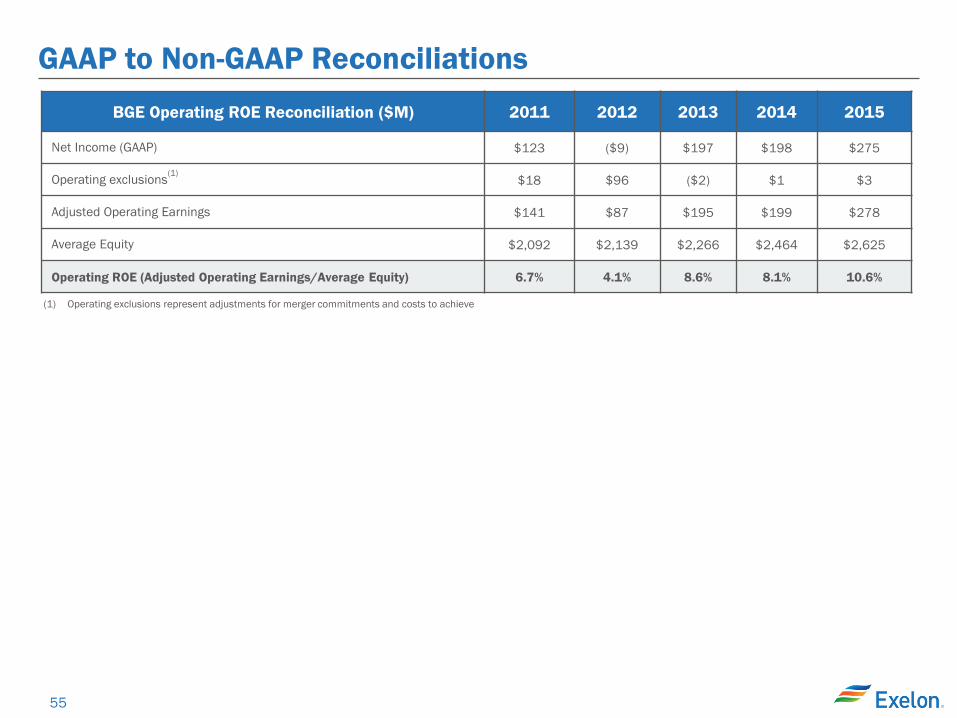
(1) Operating exclusions represent adjustments for merger commitments and costs to achieve
BGE Operating ROE Reconciliation ($M) 2011 2012 2013 2014 2015
Net Income (GAAP) $123 ($9) $197 $198 $275
Operating exclusions(1) $18 $96 ($2) $1 $3
Adjusted Operating Earnings $141 $87 $195 $199 $278
Average Equity $2,092 $2,139 $2,266 $2,464 $2,625
Operating ROE (Adjusted Operating Earnings/Average Equity) 6.7% 4.1% 8.6% 8.1% 10.6%