Embed Size (px)
Citation preview
EEG in NEUROPSYCHOLOGY
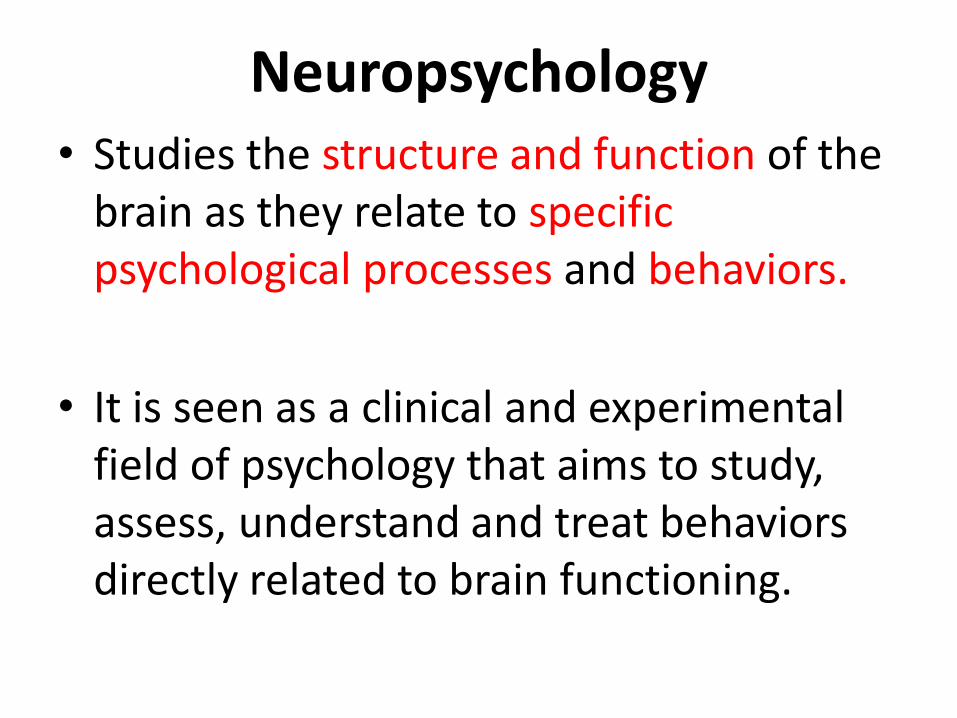
Neuropsychology• Studies the structure and function of the
brain as they relate to specific psychological processes and behaviors.
• It is seen as a clinical and experimental field of psychology that aims to study, assess, understand and treat behaviors directly related to brain functioning.


Methods Used to Study the Brain
The brain's functions can be studied in many ways:
effects of brain damage
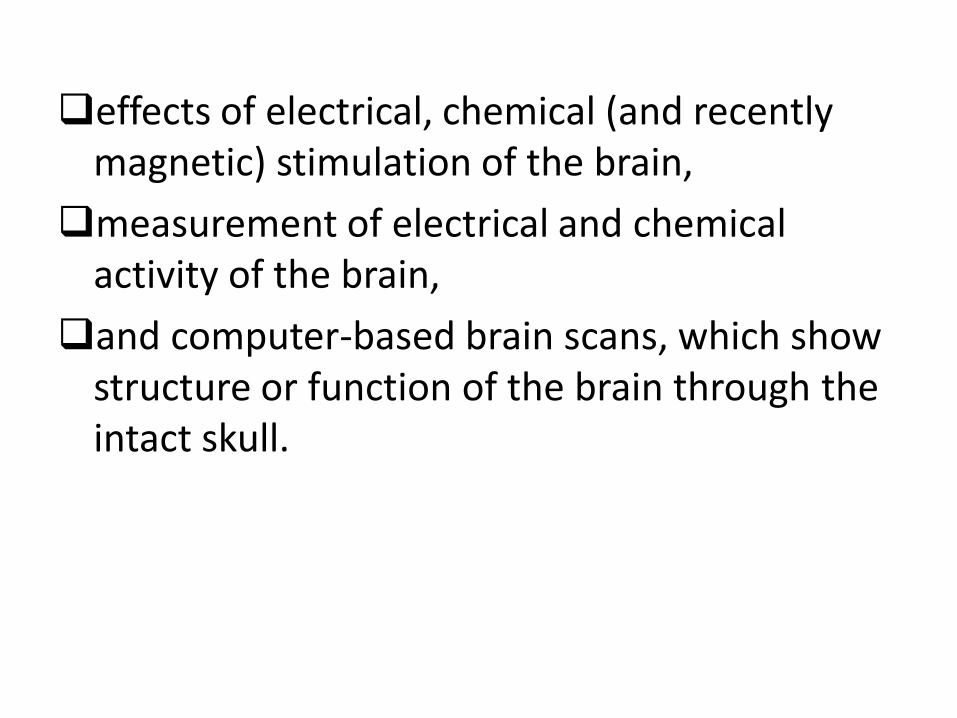
effects of electrical, chemical (and recently magnetic) stimulation of the brain,
measurement of electrical and chemical activity of the brain,
and computer-based brain scans, which show structure or function of the brain through the intact skull.
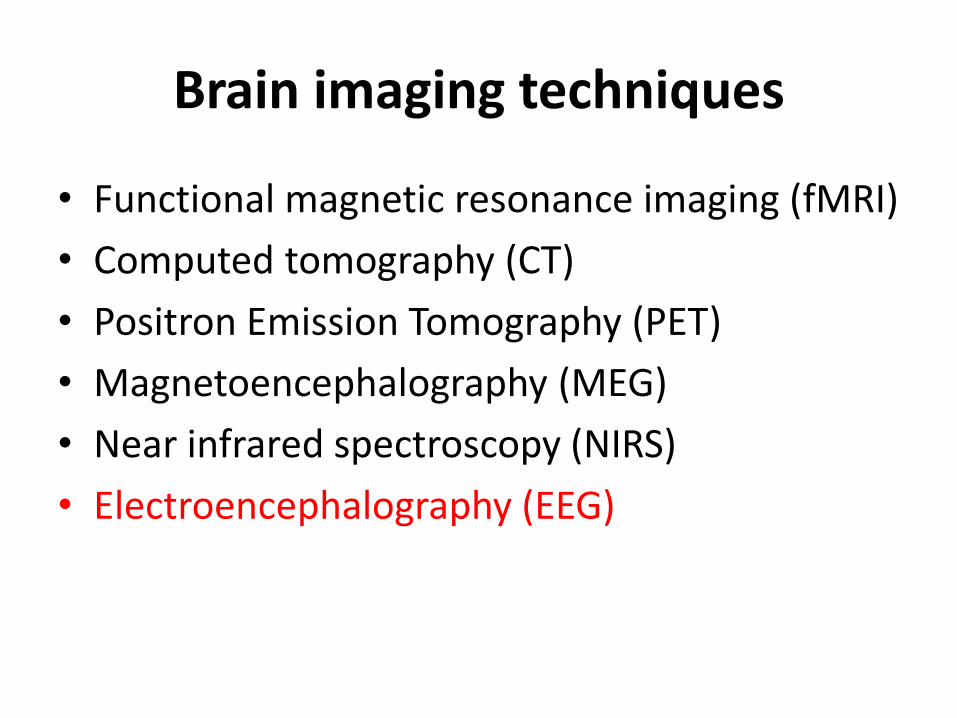
Brain imaging techniques
• Functional magnetic resonance imaging (fMRI)
• Computed tomography (CT)
• Positron Emission Tomography (PET)
• Magnetoencephalography (MEG)
• Near infrared spectroscopy (NIRS)
• Electroencephalography (EEG)
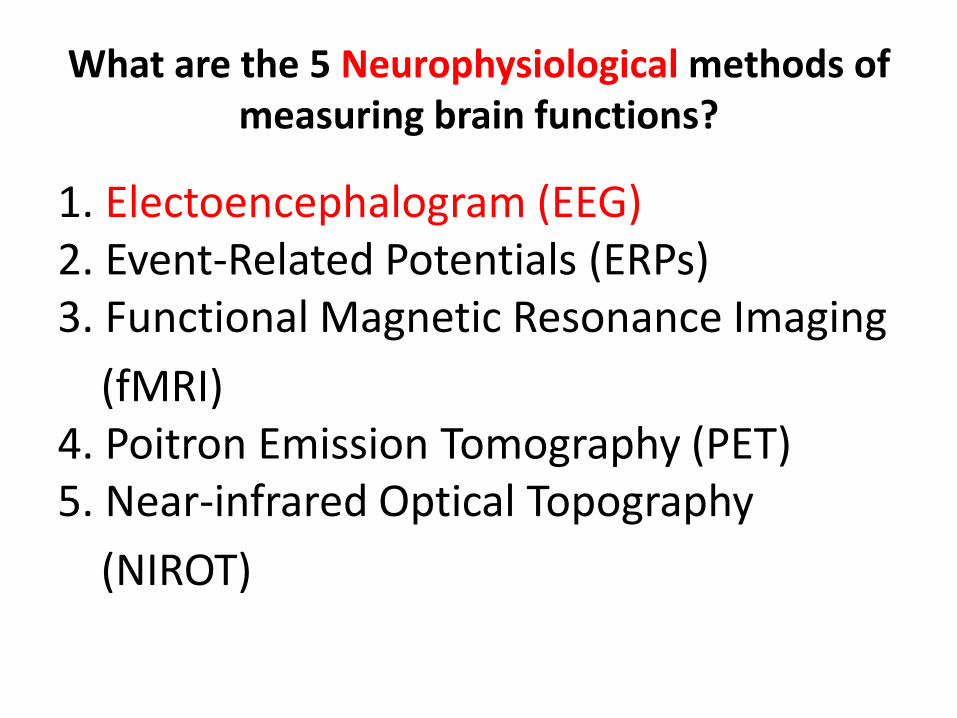
What are the 5 Neurophysiological methods of measuring brain functions?
1. Electoencephalogram (EEG)2. Event-Related Potentials (ERPs)3. Functional Magnetic Resonance Imaging
(fMRI)4. Poitron Emission Tomography (PET)5. Near-infrared Optical Topography
(NIROT)
ELECTRO-ENCEPHALOGRAPHY

Brain Electrical Activity
• The brain is made up of hundreds of billions of microscopic elements called neurons which use chemical messages to regulate electrical activity throughout the brain.
• The brain communicates to itself and with the body by means of these electrical changes and our emotions, perceptions, thoughts, and behaviors are the result of the totality of these electrical and chemical changes, although the exact mechanism of how brain becomes mind is not understood.
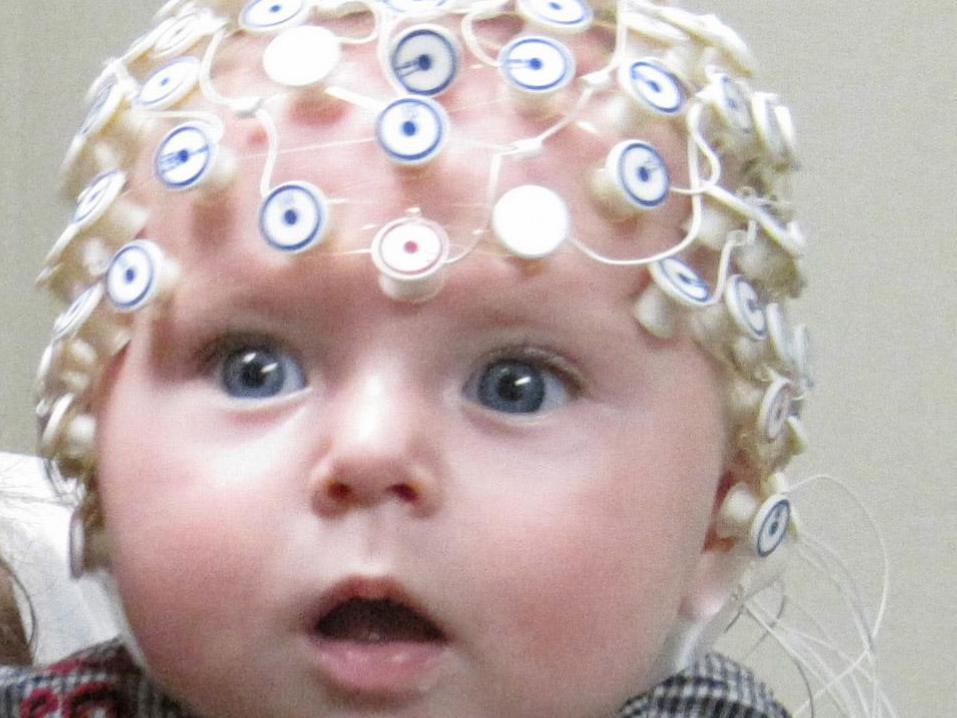
• As a side effect of the electrochemical processes used by neurons for signaling,
brain tissue generates electric fields when it is
active.
• When large numbers of neurons show synchronized activity, the electric fields that they generate can be large enough to detect outside the skull, using
ELECTRO- ENCEPHALOGRAPHY (EEG)

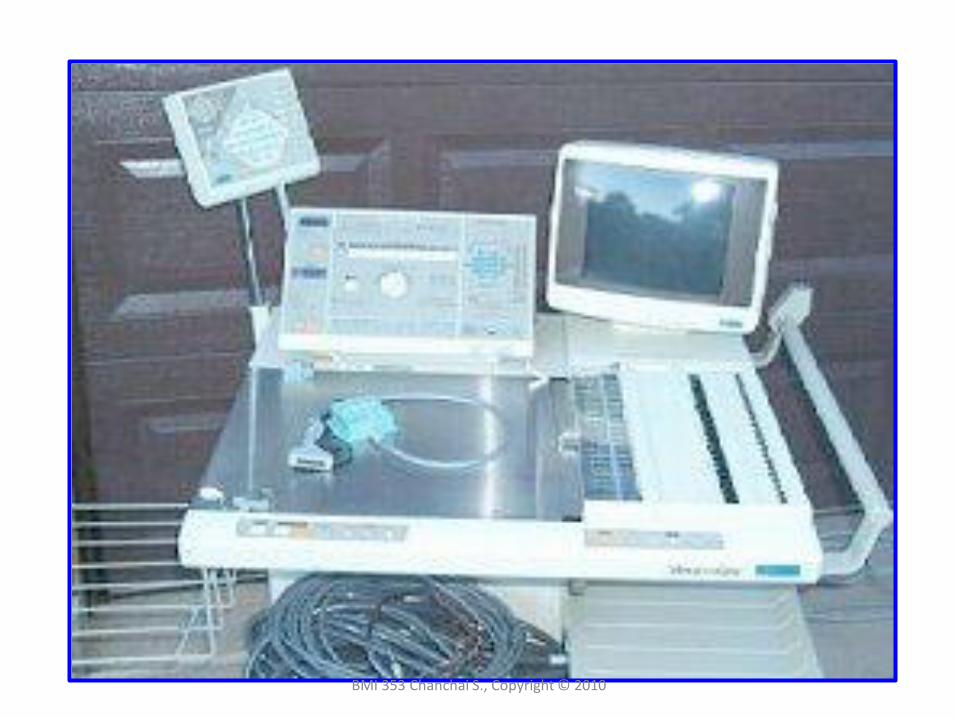
Electroencephalograph (New)
BMI 353 Chanchai S., Copyright © 2010
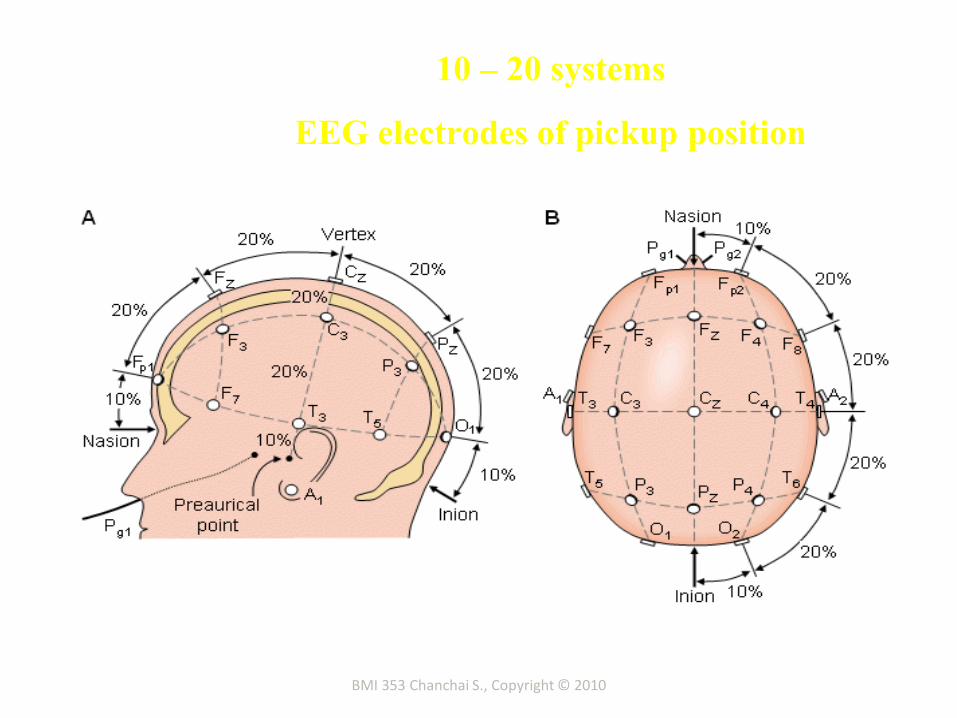
10 – 20 systems EEG electrodes of pickup position
BMI 353 Chanchai S., Copyright © 2010


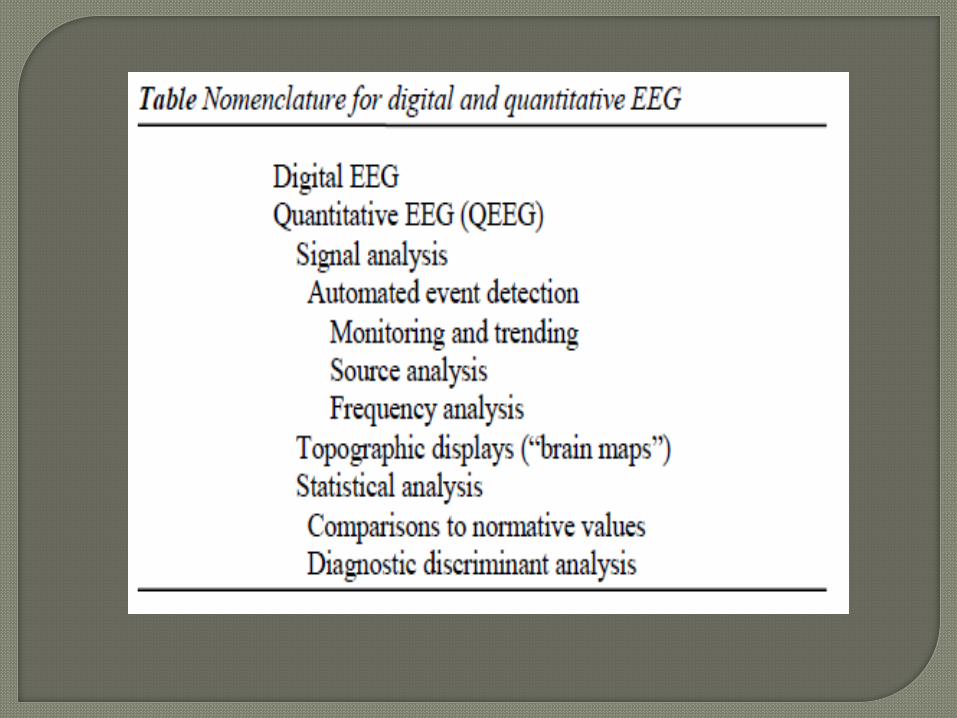
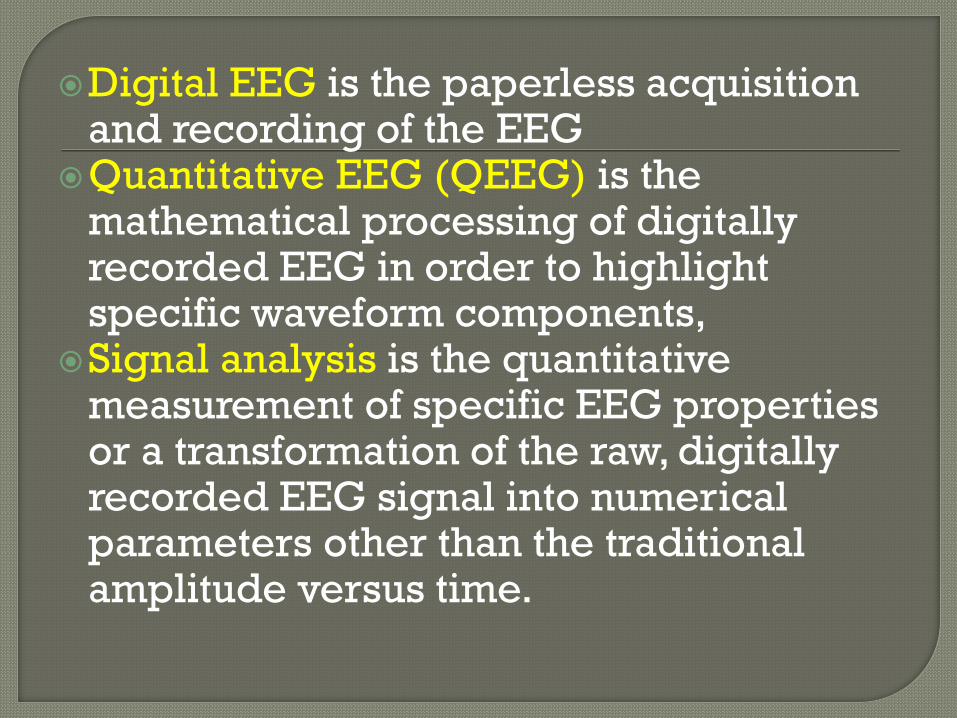
Digital EEG is the paperless acquisition and recording of the EEG
Quantitative EEG (QEEG) is the mathematical processing of digitally recorded EEG in order to highlight specific waveform components,
Signal analysis is the quantitative measurement of specific EEG properties or a transformation of the raw, digitally recorded EEG signal into numerical parameters other than the traditional amplitude versus time.


The results of signal processing, such as frequency analysis,
may be displayed as :
a table of numbers,
a multidimensional graph, or
a topographic display
Fred S. Starr, M.D., BCIA-EEG
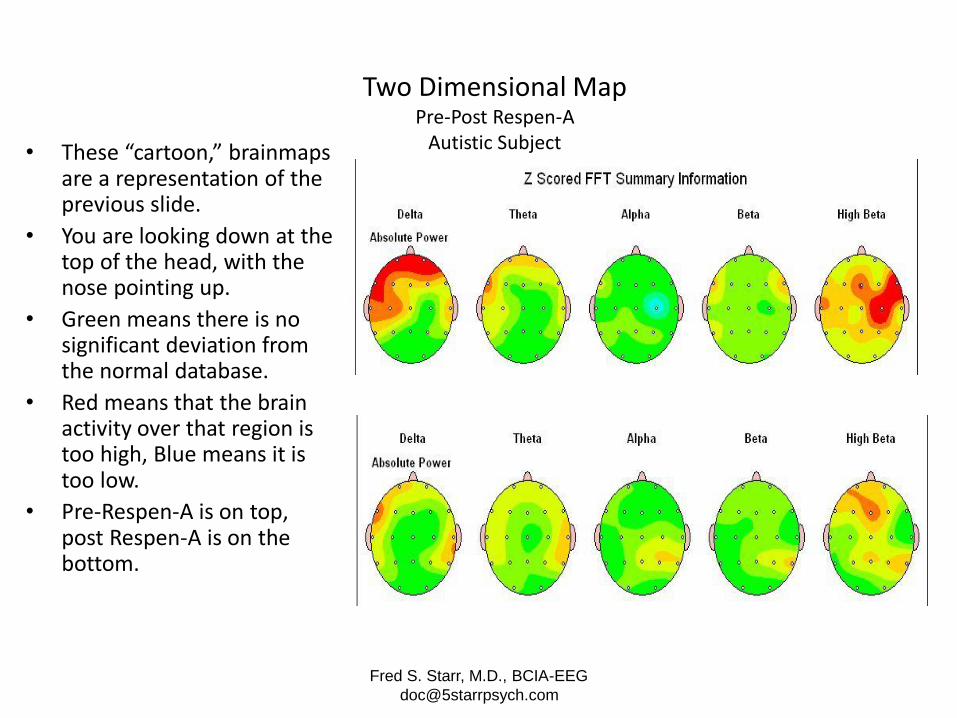
Two Dimensional MapPre-Post Respen-A
Autistic Subject• These “cartoon,” brainmaps are a representation of the previous slide.
• You are looking down at the top of the head, with the nose pointing up.
• Green means there is no significant deviation from the normal database.
• Red means that the brain activity over that region is too high, Blue means it is too low.
• Pre-Respen-A is on top, post Respen-A is on the bottom.
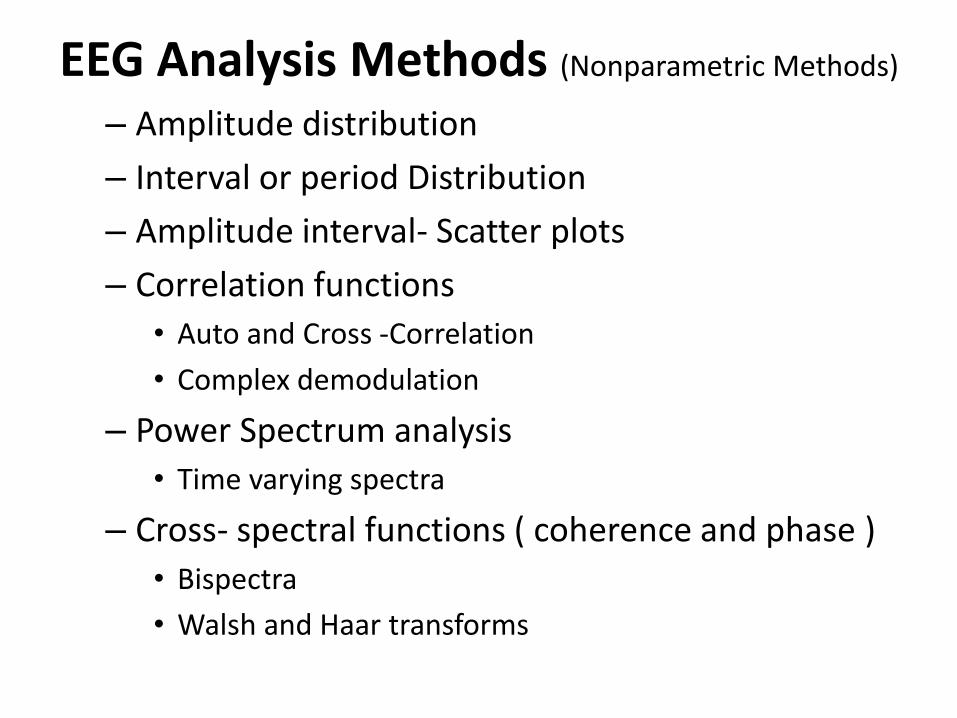
EEG Analysis Methods (Nonparametric Methods)
– Amplitude distribution
– Interval or period Distribution
– Amplitude interval- Scatter plots
– Correlation functions
• Auto and Cross -Correlation
• Complex demodulation
– Power Spectrum analysis
• Time varying spectra
– Cross- spectral functions ( coherence and phase )
• Bispectra
• Walsh and Haar transforms

EEG Analysis Methods (Parametric)
• Autoregressive and ARMA Models
• Time varying signals : Kalman filtering
• Segmentation Analysis.
• Mimetic Analysis
• Template Matching
• Topographic Analysis
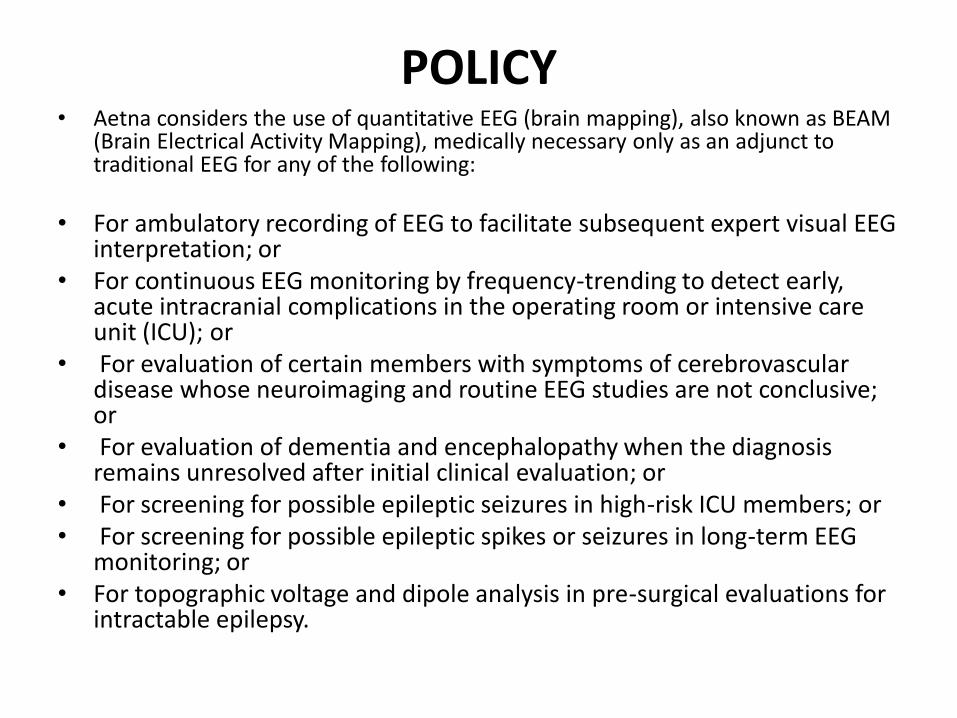
POLICY• Aetna considers the use of quantitative EEG (brain mapping), also known as BEAM
(Brain Electrical Activity Mapping), medically necessary only as an adjunct to traditional EEG for any of the following:
• For ambulatory recording of EEG to facilitate subsequent expert visual EEG interpretation; or
• For continuous EEG monitoring by frequency-trending to detect early, acute intracranial complications in the operating room or intensive care unit (ICU); or
• For evaluation of certain members with symptoms of cerebrovascular disease whose neuroimaging and routine EEG studies are not conclusive; or
• For evaluation of dementia and encephalopathy when the diagnosis remains unresolved after initial clinical evaluation; or
• For screening for possible epileptic seizures in high-risk ICU members; or• For screening for possible epileptic spikes or seizures in long-term EEG
monitoring; or• For topographic voltage and dipole analysis in pre-surgical evaluations for
intractable epilepsy.
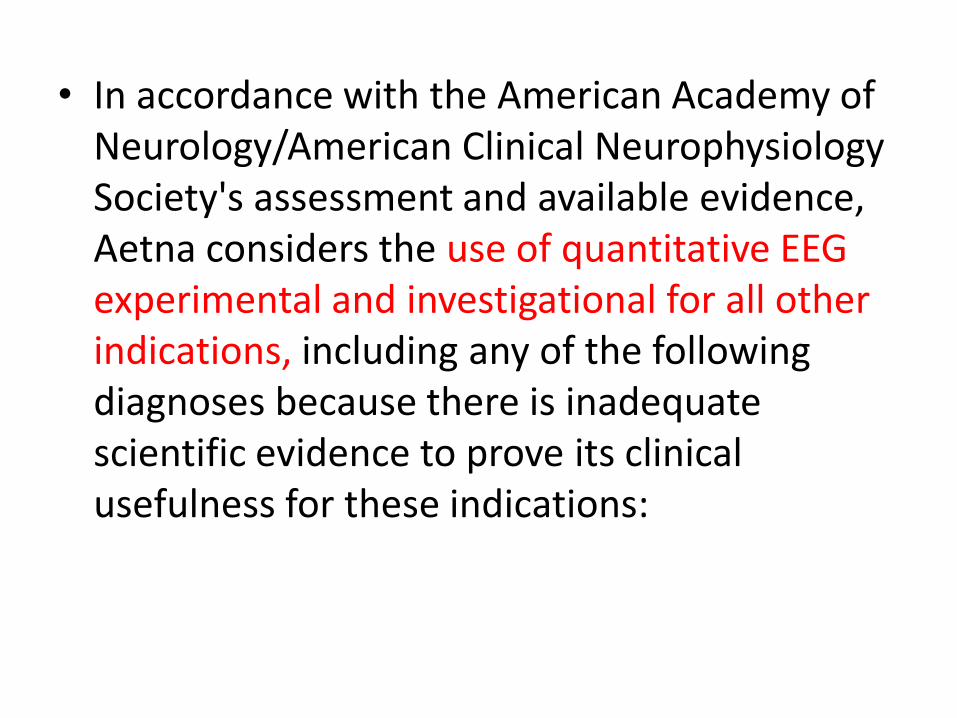
• In accordance with the American Academy of Neurology/American Clinical Neurophysiology Society's assessment and available evidence, Aetna considers the use of quantitative EEG experimental and investigational for all other indications, including any of the following diagnoses because there is inadequate scientific evidence to prove its clinical usefulness for these indications:
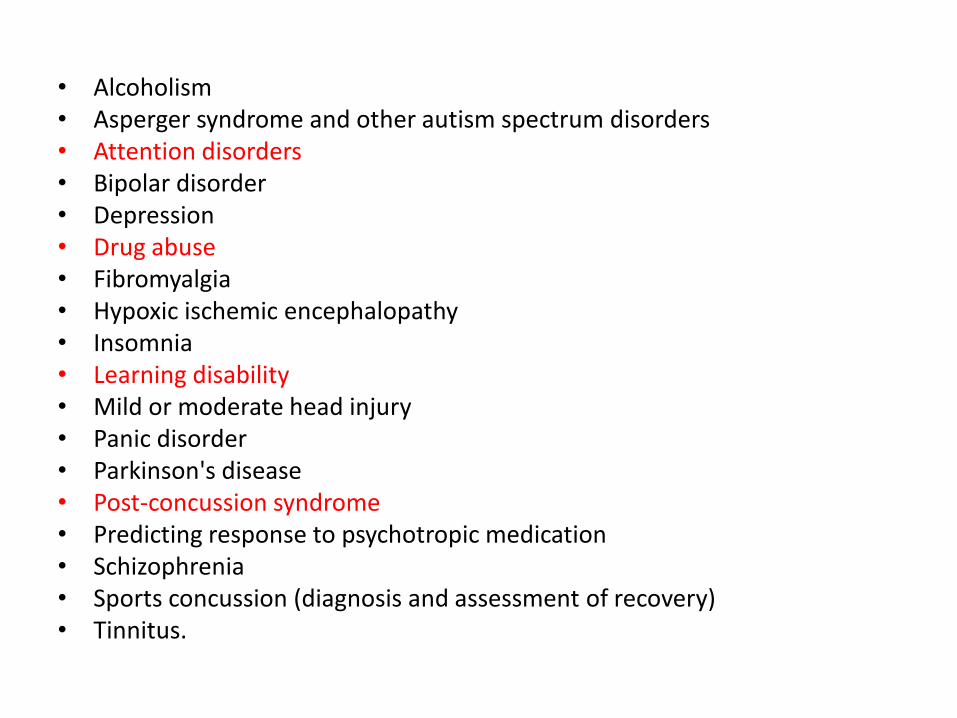
• Alcoholism• Asperger syndrome and other autism spectrum disorders• Attention disorders• Bipolar disorder• Depression• Drug abuse• Fibromyalgia• Hypoxic ischemic encephalopathy• Insomnia• Learning disability• Mild or moderate head injury• Panic disorder• Parkinson's disease• Post-concussion syndrome• Predicting response to psychotropic medication• Schizophrenia• Sports concussion (diagnosis and assessment of recovery)• Tinnitus.
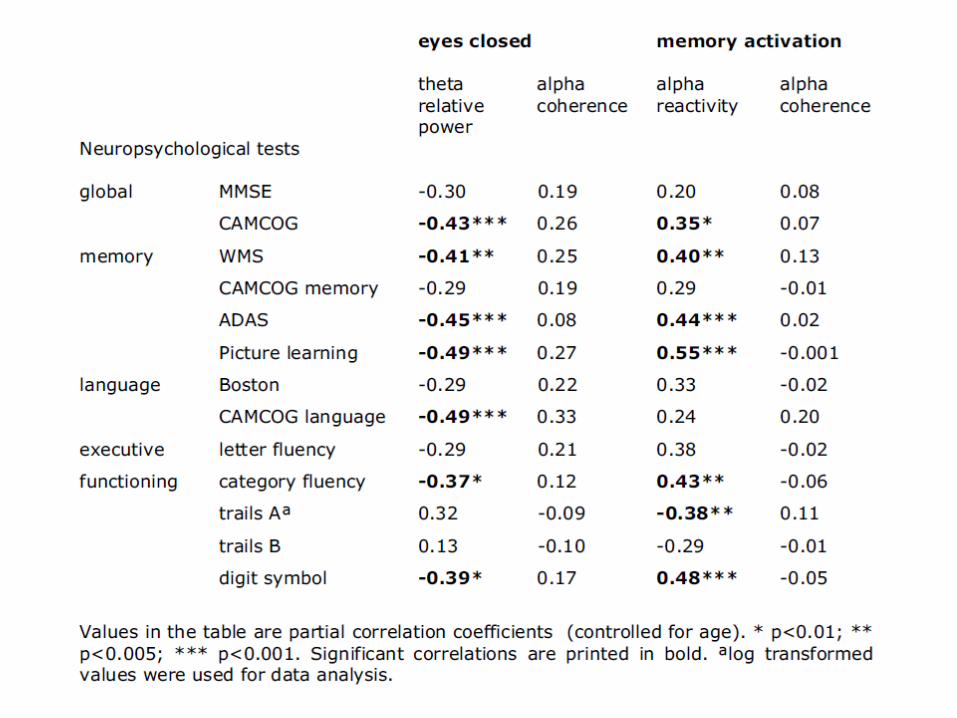
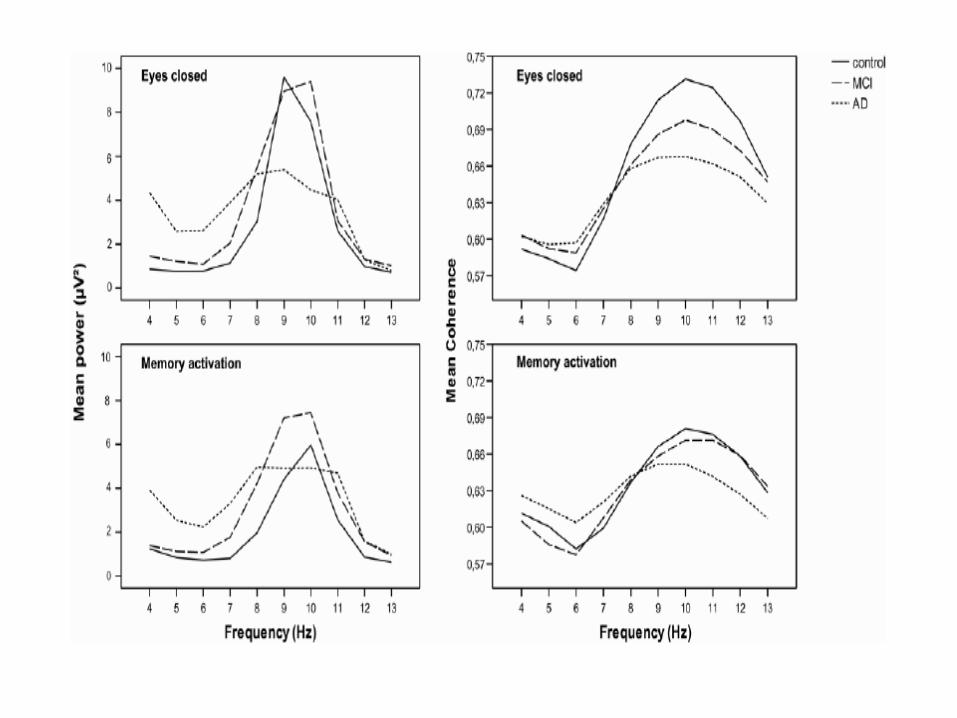
van der Hiele et al, 2007

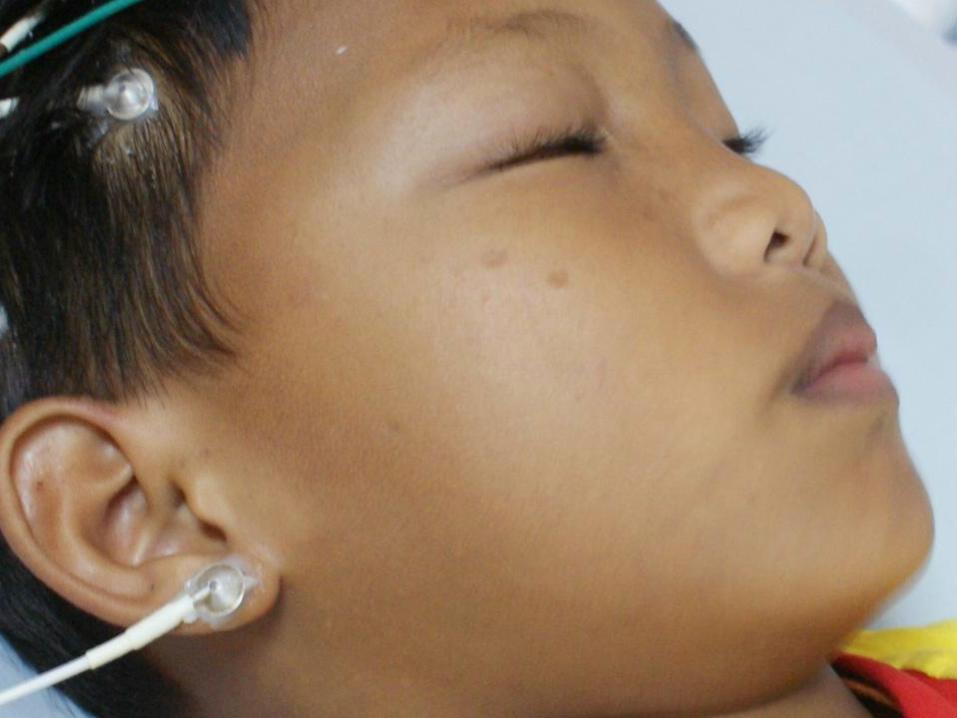
LOCAL RESEARCH
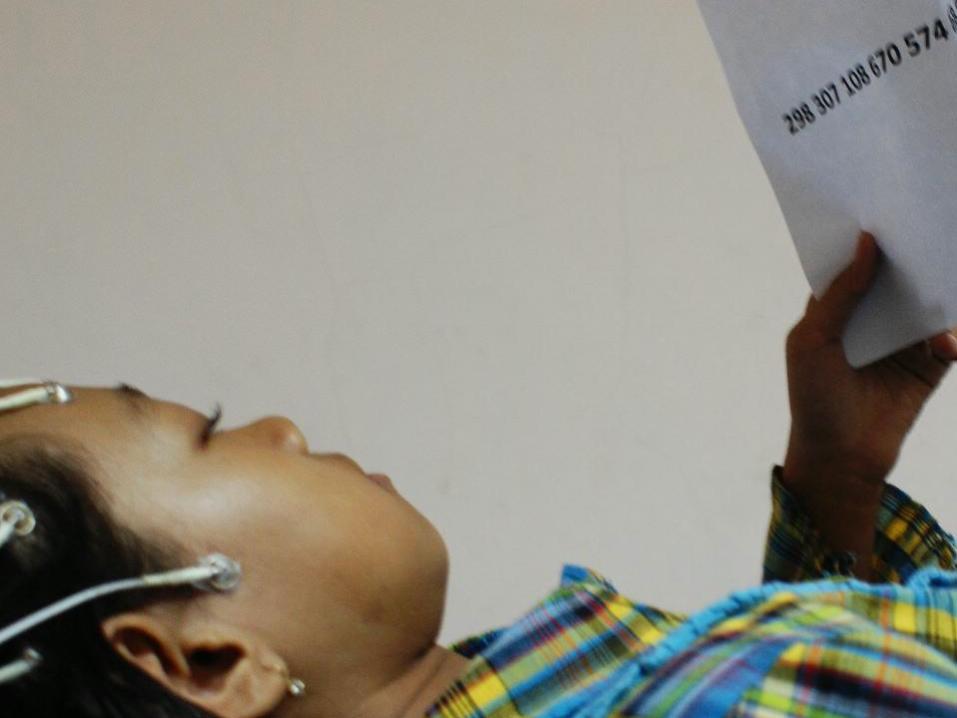

Pra Tidak Baca Post BacaPra Baca
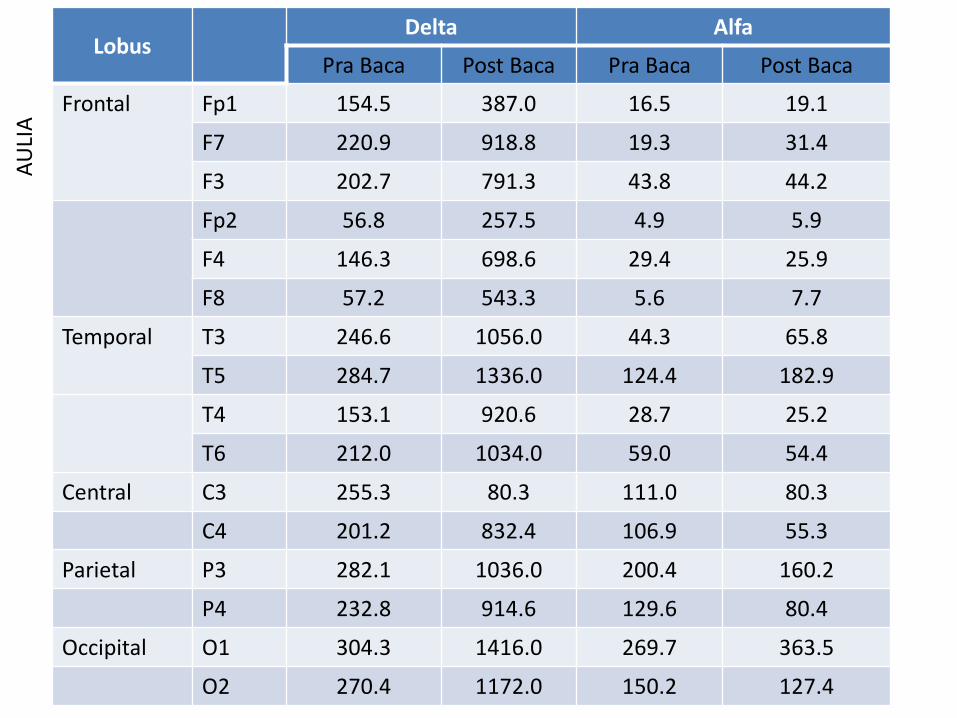
LobusDelta Alfa
Pra Baca Post Baca Pra Baca Post Baca
Frontal Fp1 154.5 387.0 16.5 19.1
F7 220.9 918.8 19.3 31.4
F3 202.7 791.3 43.8 44.2
Fp2 56.8 257.5 4.9 5.9
F4 146.3 698.6 29.4 25.9
F8 57.2 543.3 5.6 7.7
Temporal T3 246.6 1056.0 44.3 65.8
T5 284.7 1336.0 124.4 182.9
T4 153.1 920.6 28.7 25.2
T6 212.0 1034.0 59.0 54.4
Central C3 255.3 80.3 111.0 80.3
C4 201.2 832.4 106.9 55.3
Parietal P3 282.1 1036.0 200.4 160.2
P4 232.8 914.6 129.6 80.4
Occipital O1 304.3 1416.0 269.7 363.5
O2 270.4 1172.0 150.2 127.4
AU
LIA
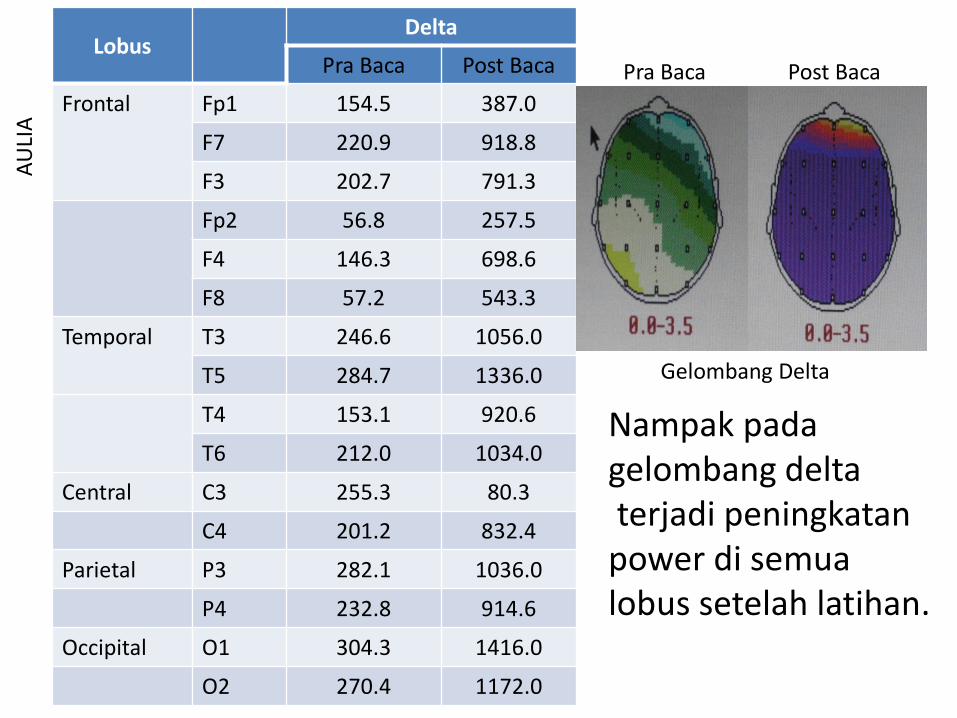
deltaLobus
Delta
Pra Baca Post Baca
Frontal Fp1 154.5 387.0
F7 220.9 918.8
F3 202.7 791.3
Fp2 56.8 257.5
F4 146.3 698.6
F8 57.2 543.3
Temporal T3 246.6 1056.0
T5 284.7 1336.0
T4 153.1 920.6
T6 212.0 1034.0
Central C3 255.3 80.3
C4 201.2 832.4
Parietal P3 282.1 1036.0
P4 232.8 914.6
Occipital O1 304.3 1416.0
O2 270.4 1172.0
AU
LIA
Pra Baca Post Baca
Gelombang Delta
Nampak padagelombang deltaterjadi peningkatan
power di semualobus setelah latihan.
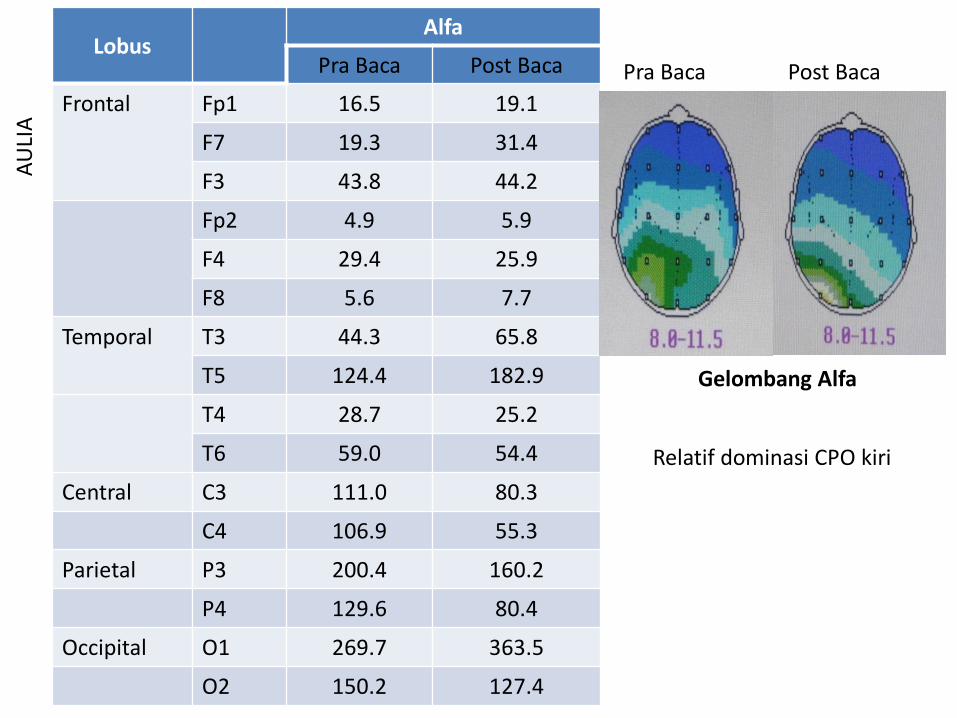
alfaLobus
Alfa
Pra Baca Post Baca
Frontal Fp1 16.5 19.1
F7 19.3 31.4
F3 43.8 44.2
Fp2 4.9 5.9
F4 29.4 25.9
F8 5.6 7.7
Temporal T3 44.3 65.8
T5 124.4 182.9
T4 28.7 25.2
T6 59.0 54.4
Central C3 111.0 80.3
C4 106.9 55.3
Parietal P3 200.4 160.2
P4 129.6 80.4
Occipital O1 269.7 363.5
O2 150.2 127.4
AU
LIA
Pra Baca Post Baca
Gelombang Alfa
Relatif dominasi CPO kiri

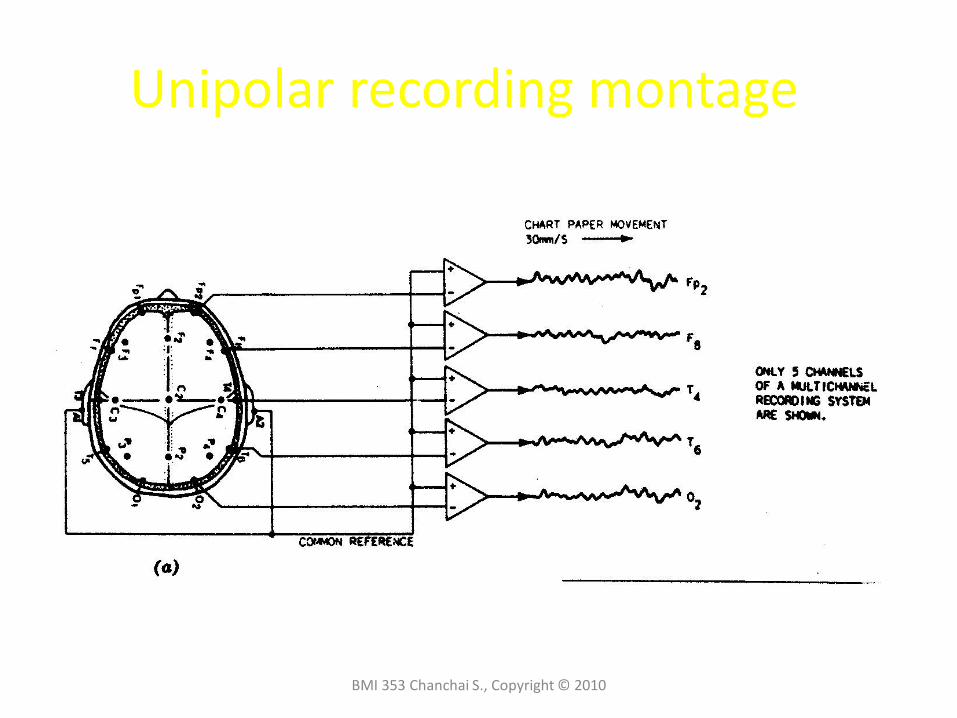
Unipolar recording montage
BMI 353 Chanchai S., Copyright © 2010

Average recording montage
BMI 353 Chanchai S., Copyright © 2010
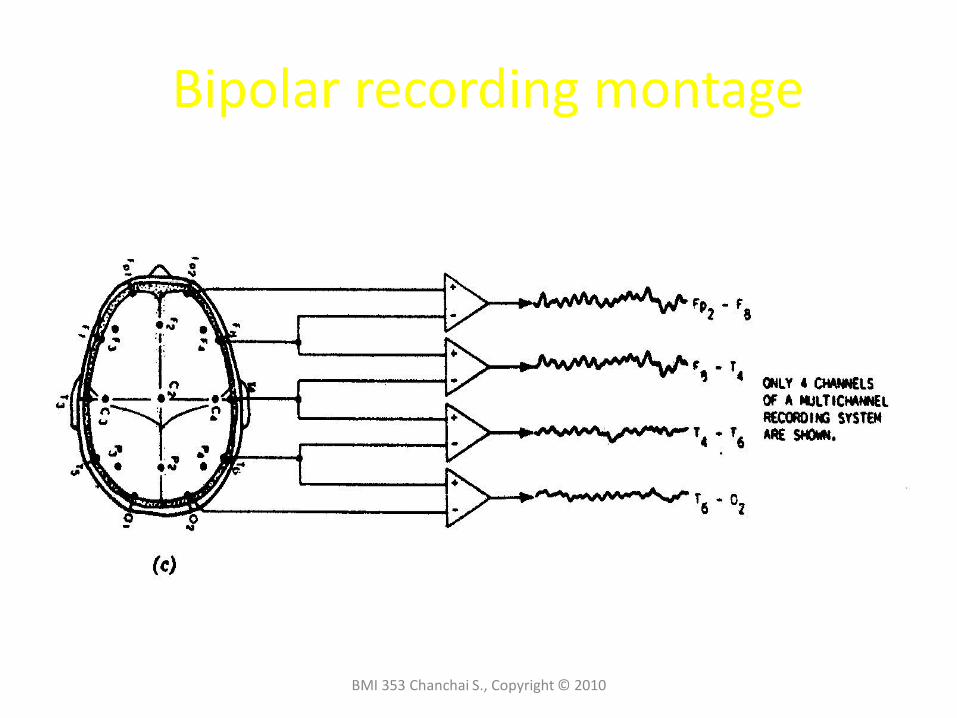
Bipolar recording montage
BMI 353 Chanchai S., Copyright © 2010