Embed Size (px)
Citation preview
EEDS TO CHANG
Version 7.2
WHAT IS ICTCP? - INTRODUCTION
ICTCP is a color representation designed for high dynamic range (HDR) and wide color gamut
(WCG) imagery and is intended as a replacement for Non-Constant Luminance (NCL) Y’C’BC’R
with HDR and WCG signals.
The television industry is going through a major evolution. Wide color primaries and high
dynamic range along with higher spatial resolution are the technologies of the future. Distortions
already known to be caused by non-uniformity of standard dynamic (SDR) range NCL Y’C’BC’R
(hue linearity and constant luminance) will become more prevalent as display capabilities
improve. When setting a new standard for HDR and WCG (new non-linear encoding curves,
new color primaries, and increased bit depth), a significantly improved color representation
designed for the coming evolution should be included.
Displays of the future will likely have widely varying primaries and luminance ranges. To
account for the variations, display mapping will become a routine process. In addition, color
processing such as blending, fading, chroma-subsampling, and resizing will need to be
processed quickly, with minimal error. As the volume of color essence increases, color
transformations will become more costly. Performing these tasks in an efficient essence
representation reduces complexity and increases speed. ICTCP is designed for this purpose.
ICTCP follows the same operations as NCL Y’C’BC’R, and has similar benefits as Constant
Luminance (CL) Y’CC’BCC’RC while additionally improving color uniformity. This is achieved by
utilizing aspects of the human visual system and by optimizing for lines of constant hue,
uniformity of just-noticeable-difference (JND) ellipses, and constant luminance.
The transformation from ITU-R BT.2020 primaries [1] into ICTCP using the PQ ST 2084 [2] non-
linearity is given below. ICTCP has also been defined utilizing the HLG non-linearity, but that
derivation will not be discussed in this paper. Minimal testing utilizing the HLG non-linearity has
been completed assuming a 1000 cd/m2 display. Relative results are comparable.
EEDS TO CHANG
Version 7.2
HOW TO TRANSFORM LINEAR ITU-R BT.2020 INTO ICTCP
Start with ITU-R BT.2020 linear RGB, then:
1. Calculate LMS
L = (1688R + 2146G + 262B ) / 4096
M = (683R + 2951G + 462B ) / 4096
S = (99R + 309G + 3688B) / 4096
2. Apply the ST 2084 [2] non-linearity (See the “Design Criteria” section for the equation)
L’M’S’ = EOTFPQ-1 (LMS)
3. Calculate ICTCP
I = 0.5L’ + 0.5M’
CT = (6610L’ - 13613M’ + 7003S’ ) / 4096
CP = (17933L’ - 17390M’ - 543S’ ) / 4096
ICTCP DESIGN CRITERIA
ICTCP was designed utilizing key aspects of the human visual system (HVS). In a simplified
form, there are three important steps [3] to color processing in the eye.
1. Incoming light is captured by the three photo receptors (cones) in the eye that have peak
sensitivities in the L(ong), M(edium), and S(hort) wavelengths.
2. The linear light is transduced (converted) into a non-linear signal response to mimic the
adaptive cone response of the HVS.
3. The non-linear signal goes through a color differencing process to separate the signal
into three distinct pathways (the light-dark Intensity axis, the yellow-blue Tritan
isoluminant axis, and the red-green Protan isoluminant axis).
EEDS TO CHANG
Version 7.2
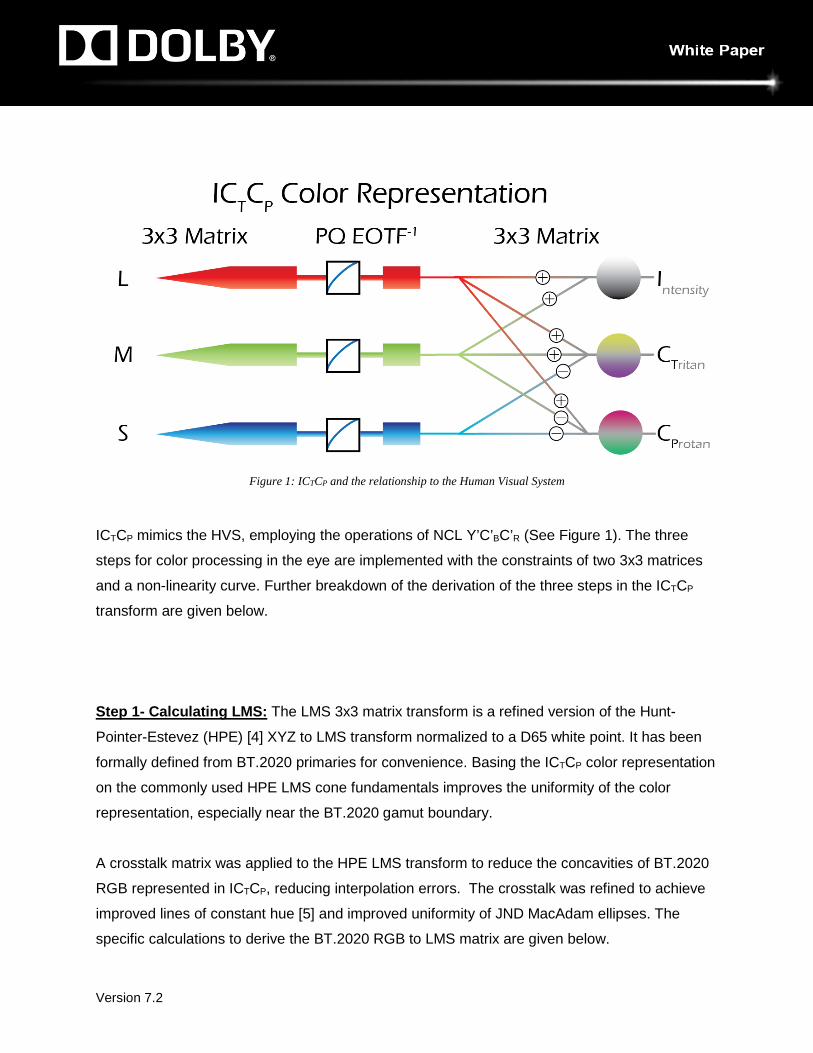
Figure 1: ICTCP and the relationship to the Human Visual System
ICTCP mimics the HVS, employing the operations of NCL Y’C’BC’R (See Figure 1). The three
steps for color processing in the eye are implemented with the constraints of two 3x3 matrices
and a non-linearity curve. Further breakdown of the derivation of the three steps in the ICTCP
transform are given below.
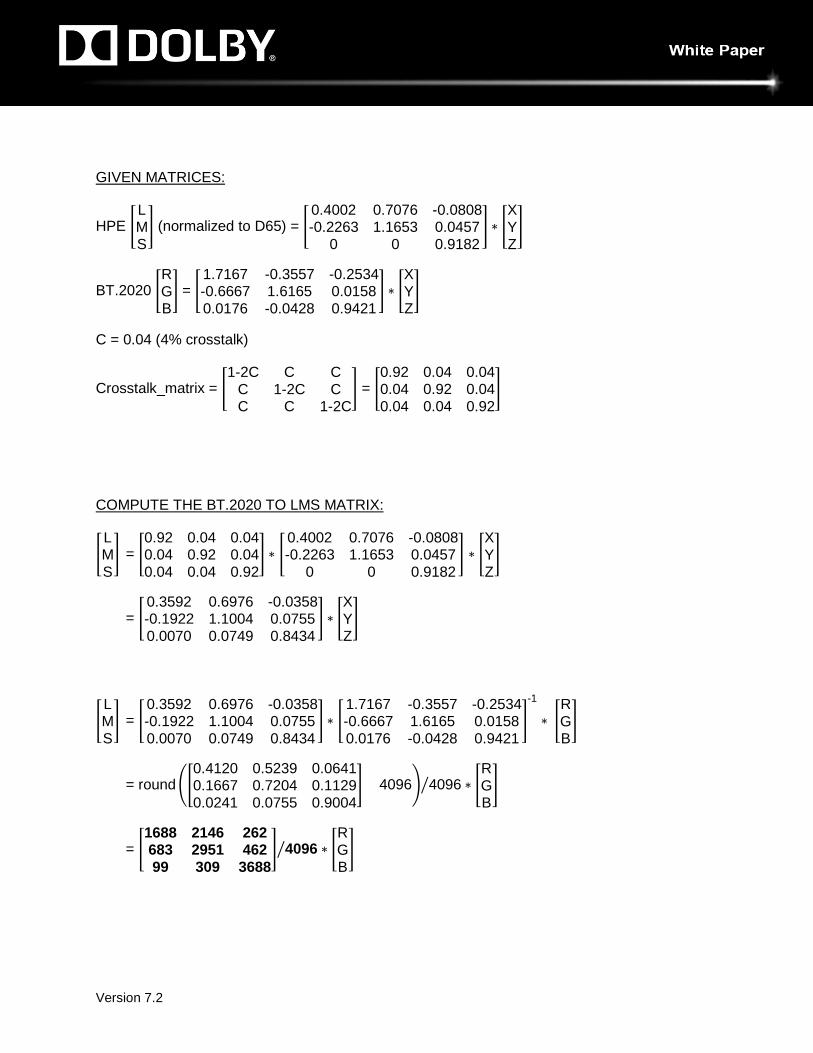
Step 1- Calculating LMS: The LMS 3x3 matrix transform is a refined version of the Hunt-
Pointer-Estevez (HPE) [4] XYZ to LMS transform normalized to a D65 white point. It has been
formally defined from BT.2020 primaries for convenience. Basing the ICTCP color representation
on the commonly used HPE LMS cone fundamentals improves the uniformity of the color
representation, especially near the BT.2020 gamut boundary.
A crosstalk matrix was applied to the HPE LMS transform to reduce the concavities of BT.2020
RGB represented in ICTCP, reducing interpolation errors. The crosstalk was refined to achieve
improved lines of constant hue [5] and improved uniformity of JND MacAdam ellipses. The
specific calculations to derive the BT.2020 RGB to LMS matrix are given below.
EEDS TO CHANG
Version 7.2
GIVEN MATRICES:
HPE �LMS� (normalized to D65) = �
0.4002 0.7076 -0.0808-0.2263 1.1653 0.0457
0 0 0.9182� ∗ �
XYZ�
BT.2020 �RGB� = �
1.7167 -0.3557 -0.2534-0.6667 1.6165 0.01580.0176 -0.0428 0.9421
� ∗ �XYZ�
C = 0.04 (4% crosstalk)
Crosstalk_matrix = �1-2C C C
C 1-2C CC C 1-2C
� = �0.92 0.04 0.040.04 0.92 0.040.04 0.04 0.92
�
COMPUTE THE BT.2020 TO LMS MATRIX:
�LMS� = �
0.92 0.04 0.040.04 0.92 0.040.04 0.04 0.92
� ∗ �0.4002 0.7076 -0.0808-0.2263 1.1653 0.0457
0 0 0.9182� ∗ �
XYZ�
= �0.3592 0.6976 -0.0358-0.1922 1.1004 0.07550.0070 0.0749 0.8434
� ∗ �XYZ�
�LMS� = �
0.3592 0.6976 -0.0358-0.1922 1.1004 0.07550.0070 0.0749 0.8434
� ∗ �1.7167 -0.3557 -0.2534-0.6667 1.6165 0.01580.0176 -0.0428 0.9421
�-1
∗ �RGB�
= round��0.4120 0.5239 0.06410.1667 0.7204 0.11290.0241 0.0755 0.9004
�× 4096� 4096� ∗ �RGB�
= �1688 2146 262683 2951 46299 309 3688
� 4096� ∗ �RGB�
EEDS TO CHANG
Version 7.2
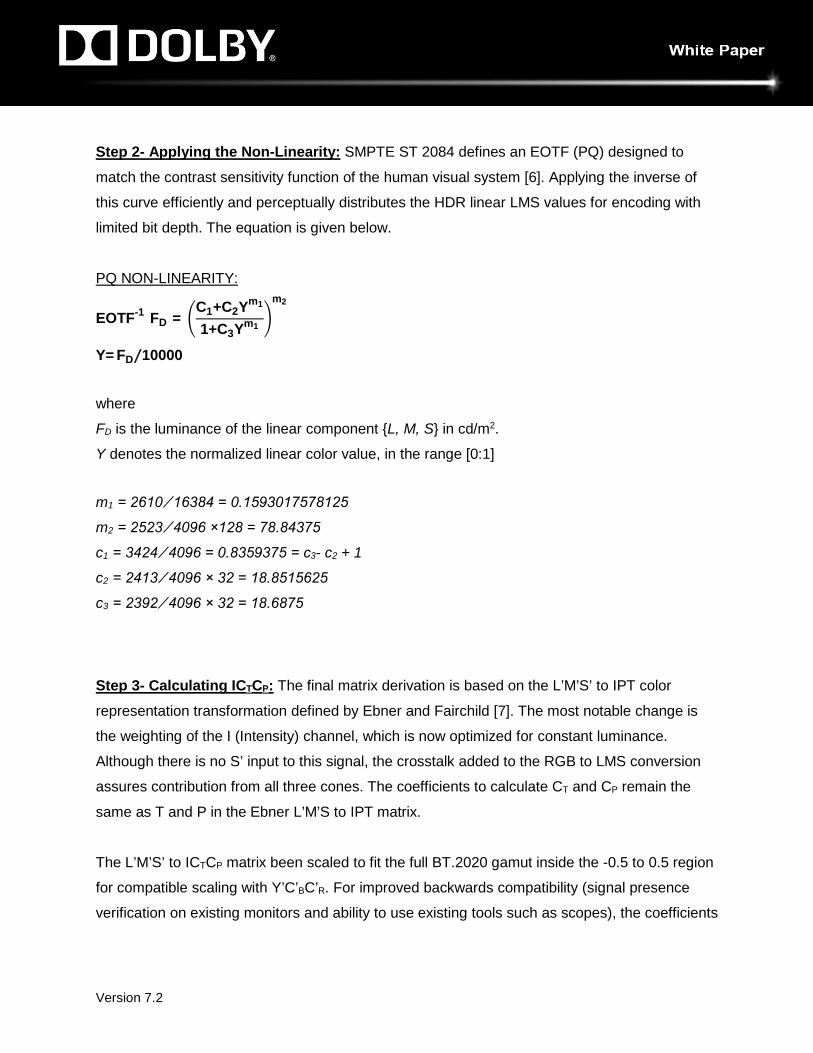
Step 2- Applying the Non-Linearity: SMPTE ST 2084 defines an EOTF (PQ) designed to
match the contrast sensitivity function of the human visual system [6]. Applying the inverse of
this curve efficiently and perceptually distributes the HDR linear LMS values for encoding with
limited bit depth. The equation is given below.
PQ NON-LINEARITY:
EOTF-1[FD]= �C1+C2Ym1
1+C3Ym1 �m2
Y= FD 10000⁄
where
FD is the luminance of the linear component {L, M, S} in cd/m2.
Y denotes the normalized linear color value, in the range [0:1]
m1 = 2610 ⁄ 16384 = 0.1593017578125
m2 = 2523 ⁄ 4096 ×128 = 78.84375
c1 = 3424 ⁄ 4096 = 0.8359375 = c3- c2 + 1
c2 = 2413 ⁄ 4096 × 32 = 18.8515625
c3 = 2392 ⁄ 4096 × 32 = 18.6875
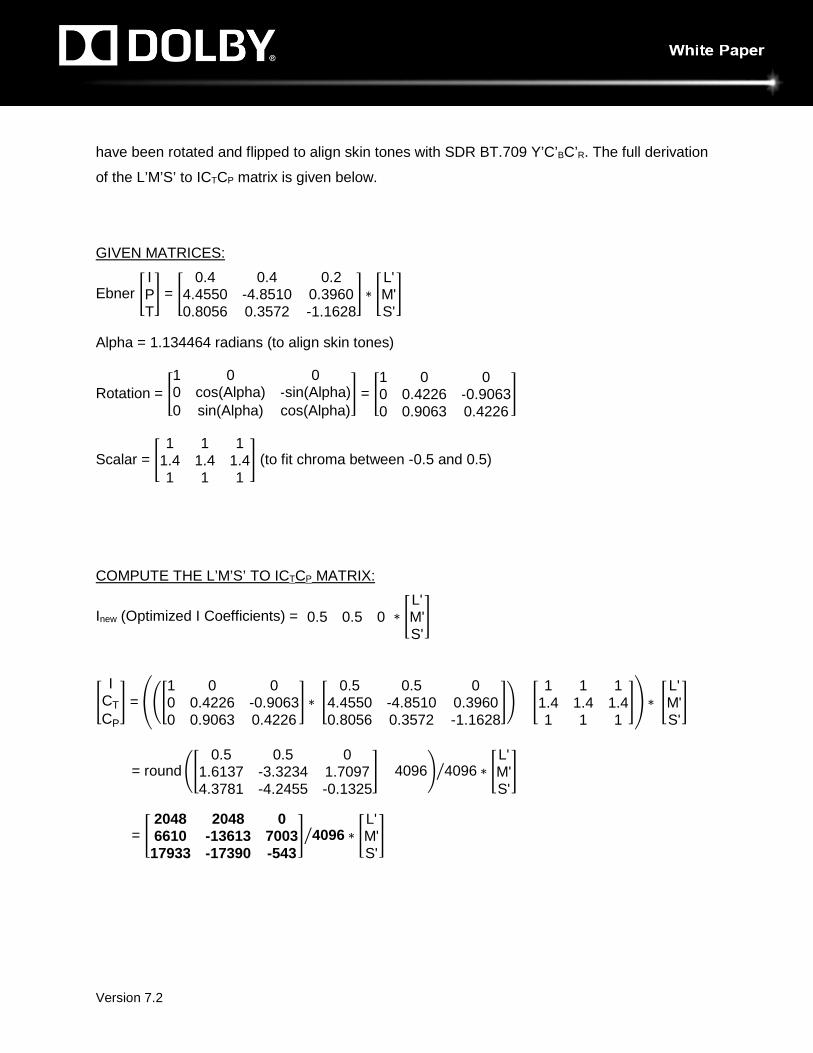
Step 3- Calculating ICTCP: The final matrix derivation is based on the L’M’S’ to IPT color
representation transformation defined by Ebner and Fairchild [7]. The most notable change is
the weighting of the I (Intensity) channel, which is now optimized for constant luminance.
Although there is no S’ input to this signal, the crosstalk added to the RGB to LMS conversion
assures contribution from all three cones. The coefficients to calculate CT and CP remain the
same as T and P in the Ebner L’M’S to IPT matrix.
The L’M’S’ to ICTCP matrix been scaled to fit the full BT.2020 gamut inside the -0.5 to 0.5 region
for compatible scaling with Y’C’BC’R. For improved backwards compatibility (signal presence
verification on existing monitors and ability to use existing tools such as scopes), the coefficients
EEDS TO CHANG
Version 7.2
have been rotated and flipped to align skin tones with SDR BT.709 Y’C’BC’R. The full derivation
of the L’M’S’ to ICTCP matrix is given below.
GIVEN MATRICES:
Ebner �IPT� = �
0.4 0.4 0.24.4550 -4.8510 0.39600.8056 0.3572 -1.1628
� ∗ �L'M'S'�
Alpha = 1.134464 radians (to align skin tones)
Rotation = �1 0 00 cos(Alpha) -sin(Alpha)0 sin(Alpha) cos(Alpha)
� = �1 0 00 0.4226 -0.90630 0.9063 0.4226
�
Scalar = �1 1 1
1.4 1.4 1.41 1 1
� (to fit chroma between -0.5 and 0.5)
COMPUTE THE L’M’S’ TO ICTCP MATRIX:
Inew (Optimized I Coefficients) = [0.5 0.5 0] ∗ �L'M'S'�
�I
CTCP
� = ���1 0 00 0.4226 -0.90630 0.9063 0.4226
� ∗ �0.5 0.5 0
4.4550 -4.8510 0.39600.8056 0.3572 -1.1628
��× �1 1 1
1.4 1.4 1.41 1 1
�� ∗ �L'M'S'�
= round��0.5 0.5 0
1.6137 -3.3234 1.70974.3781 -4.2455 -0.1325
�× 4096� 4096� ∗ �L'M'S'�
= �2048 2048 06610 -13613 700317933 -17390 -543
� 4096� ∗ �L'M'S'�
EEDS TO CHANG
Version 7.2
COMPARISON OF HDR NCL Y’C’BC’R AND ICTCP
In the following comparison, BT.2020 NCL Y’C’BC’R using the PQ non-linearity and ICTCP using
the PQ non-linearity will be analyzed.
Constant Luminance: A color representation has true constant luminance [8] when the luma
channel (Y’ of Y’C’BC’R encoded with EOTF-1PQ for example) matches with EOTF-1
PQ encoded
luminance (EOTF-1PQ encoded luminance Y of XYZ). The closer a color representation meets
the constant luminance criteria, the better the decorrelation of the chroma and luma channels.
A decorrelated representation holds a significant advantage in color processing such as chroma
sub-sampling. The consequences of a representation that does not meet the constant
luminance criteria is that any form of interpolation (gamut mapping, color sub-sampling,
blending, etc.) will result in luminance changes even if only color information is being altered.
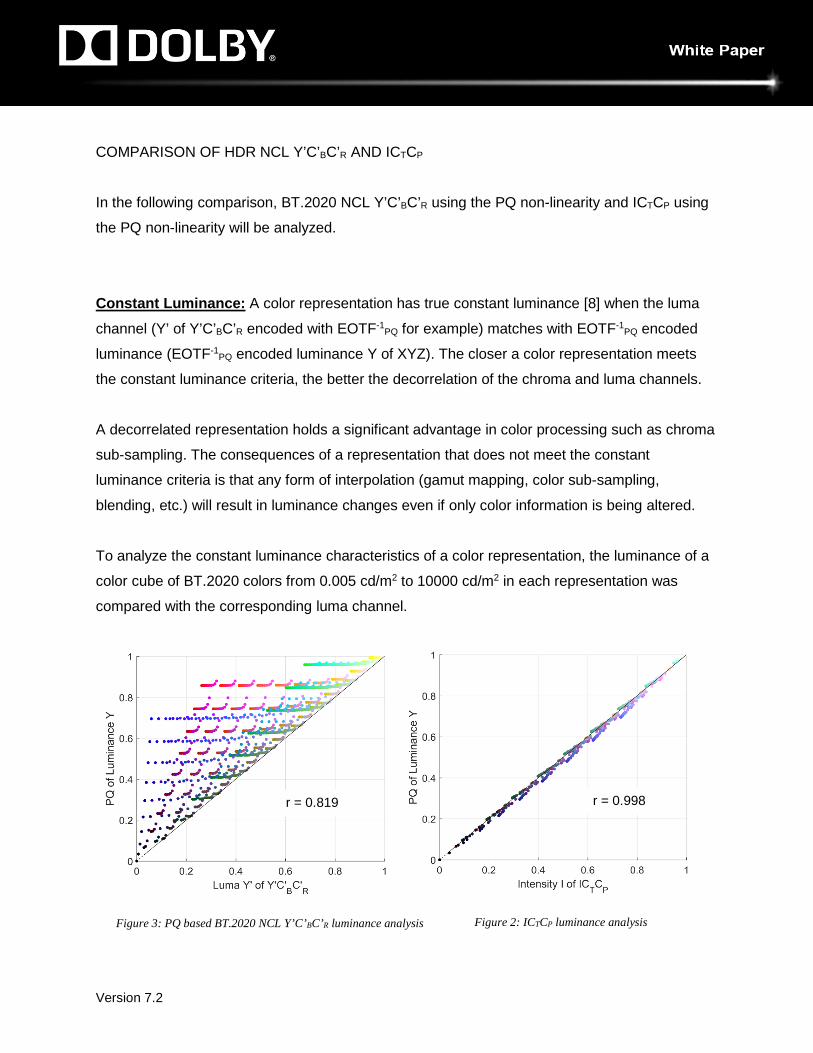
To analyze the constant luminance characteristics of a color representation, the luminance of a
color cube of BT.2020 colors from 0.005 cd/m2 to 10000 cd/m2 in each representation was
compared with the corresponding luma channel.
Figure 2: ICTCP luminance analysis
r = 0.998
Figure 3: PQ based BT.2020 NCL Y’C’BC’R luminance analysis
r = 0.819
EEDS TO CHANG
Version 7.2
Those luminance values were also encoded in PQ for comparison. A perfectly constant
luminance space would have a 1:1 relationship between luma (Y’ of Y’C’BC’R and I of ICTCP) and
EOTF-1PQ encoded luminance and would also have a Pearson Correlation Coefficient (r) of 1 [9].
The results from NCL Y’C’BC’R are shown in Figure 3. The most significant crosstalk occurs in
the saturated red and blue colors. Therefore, manipulation of these colors has the most
luminance error. Desaturation (decreasing CB and CR) will result in decreasing luminance.
The results from ICTCP can be seen in Figure 2. The Intensity channel of ICTCP was optimized
for constant luminance and therefore has an improved correlation. This improvement leads to
enhancements in chroma sub-sampling due to the decorrelation of the chroma and luma
channels. As the saturation is changed (CT and CP) the luminance will remain nearly constant.
Hue Linearity: Lines of constant hue are important if saturation adjustments are made. Gamut
volume mapping is a common example where desaturation techniques are frequently used. In
order to maintain accurate image representation when mapping between volumes, it is expected
that relative hue will remain constant. If a color representation has crosstalk between hue and
saturation, the gamut mapping algorithms must be complex to account for non-uniform shifts. A
completely decorrelated color representation allows hues to remain constant as saturation is
changed, therefore simplifying complex operations.
Desaturating highly saturated colors in NCL Y’C’BC’R leads to hue shifts mainly in the blue and
magenta color regions. To analyze lines of constant hue, the Hung and Berns [10] data set was
analyzed in NCL Y’C’BC’R and ICTCP.
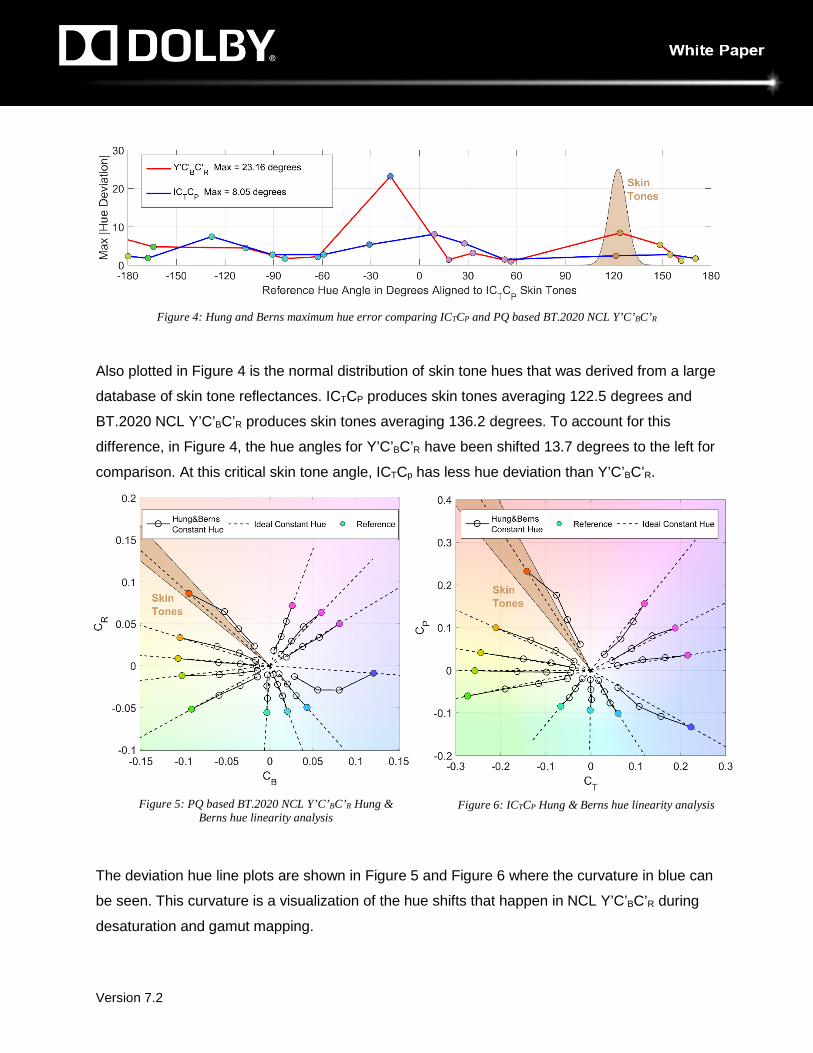
As anticipated, the maximum hue deviation of NCL Y’C’BC’R (Figure 4) is in the blue. This
maximum deviation is 23.2 degrees. ICTCP reduces the maximum hue angle deviation to less
than half, having a maximum of 8.0 degrees.
EEDS TO CHANG
Version 7.2
Figure 4: Hung and Berns maximum hue error comparing ICTCP and PQ based BT.2020 NCL Y’C’BC’R
Also plotted in Figure 4 is the normal distribution of skin tone hues that was derived from a large
database of skin tone reflectances. ICTCP produces skin tones averaging 122.5 degrees and
BT.2020 NCL Y’C’BC’R produces skin tones averaging 136.2 degrees. To account for this
difference, in Figure 4, the hue angles for Y’C’BC’R have been shifted 13.7 degrees to the left for
comparison. At this critical skin tone angle, ICTCp has less hue deviation than Y’C’BC’R.
.
The deviation hue line plots are shown in Figure 5 and Figure 6 where the curvature in blue can
be seen. This curvature is a visualization of the hue shifts that happen in NCL Y’C’BC’R during
desaturation and gamut mapping.
Figure 5: PQ based BT.2020 NCL Y’C’BC’R Hung & Berns hue linearity analysis
Figure 6: ICTCP Hung & Berns hue linearity analysis
EEDS TO CHANG
Version 7.2
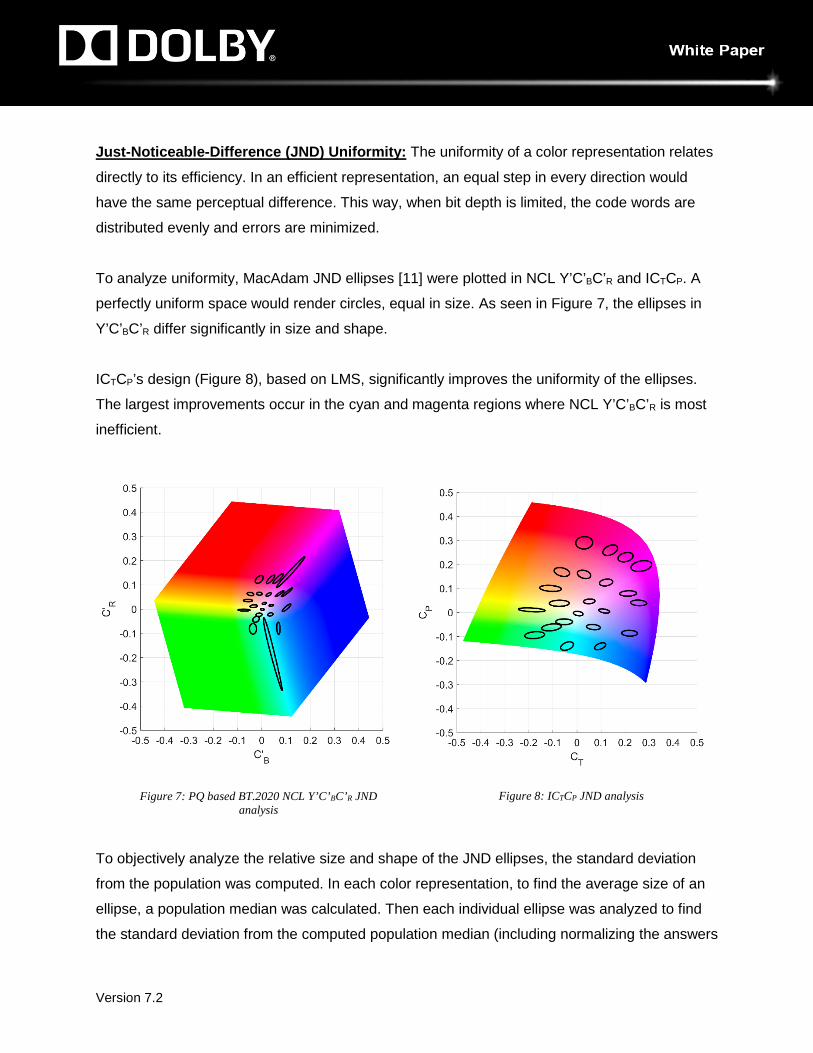
Just-Noticeable-Difference (JND) Uniformity: The uniformity of a color representation relates
directly to its efficiency. In an efficient representation, an equal step in every direction would
have the same perceptual difference. This way, when bit depth is limited, the code words are
distributed evenly and errors are minimized.
To analyze uniformity, MacAdam JND ellipses [11] were plotted in NCL Y’C’BC’R and ICTCP. A
perfectly uniform space would render circles, equal in size. As seen in Figure 7, the ellipses in
Y’C’BC’R differ significantly in size and shape.
ICTCP’s design (Figure 8), based on LMS, significantly improves the uniformity of the ellipses.
The largest improvements occur in the cyan and magenta regions where NCL Y’C’BC’R is most
inefficient.
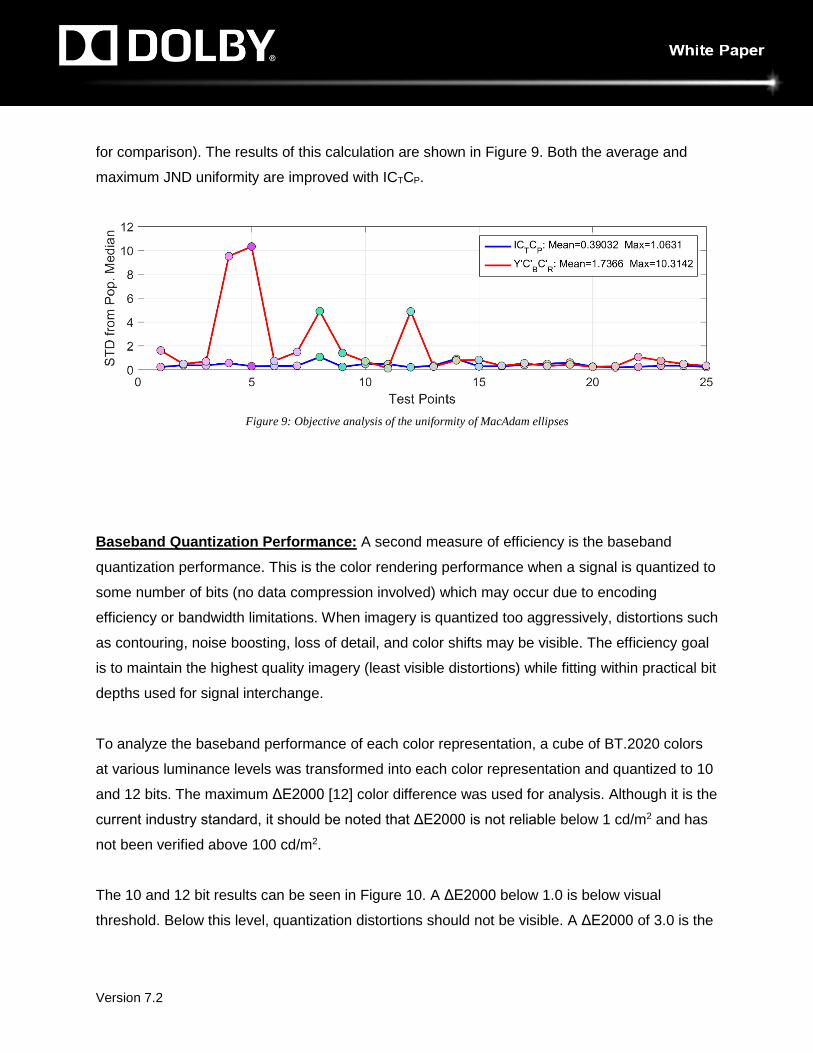
To objectively analyze the relative size and shape of the JND ellipses, the standard deviation
from the population was computed. In each color representation, to find the average size of an
ellipse, a population median was calculated. Then each individual ellipse was analyzed to find
the standard deviation from the computed population median (including normalizing the answers
Figure 8: ICTCP JND analysis Figure 7: PQ based BT.2020 NCL Y’C’BC’R JND analysis
EEDS TO CHANG
Version 7.2
for comparison). The results of this calculation are shown in Figure 9. Both the average and
maximum JND uniformity are improved with ICTCP.
Figure 9: Objective analysis of the uniformity of MacAdam ellipses
Baseband Quantization Performance: A second measure of efficiency is the baseband
quantization performance. This is the color rendering performance when a signal is quantized to
some number of bits (no data compression involved) which may occur due to encoding
efficiency or bandwidth limitations. When imagery is quantized too aggressively, distortions such
as contouring, noise boosting, loss of detail, and color shifts may be visible. The efficiency goal
is to maintain the highest quality imagery (least visible distortions) while fitting within practical bit
depths used for signal interchange.
To analyze the baseband performance of each color representation, a cube of BT.2020 colors
at various luminance levels was transformed into each color representation and quantized to 10
and 12 bits. The maximum ΔE2000 [12] color difference was used for analysis. Although it is the
current industry standard, it should be noted that ΔE2000 is not reliable below 1 cd/m2 and has
not been verified above 100 cd/m2.
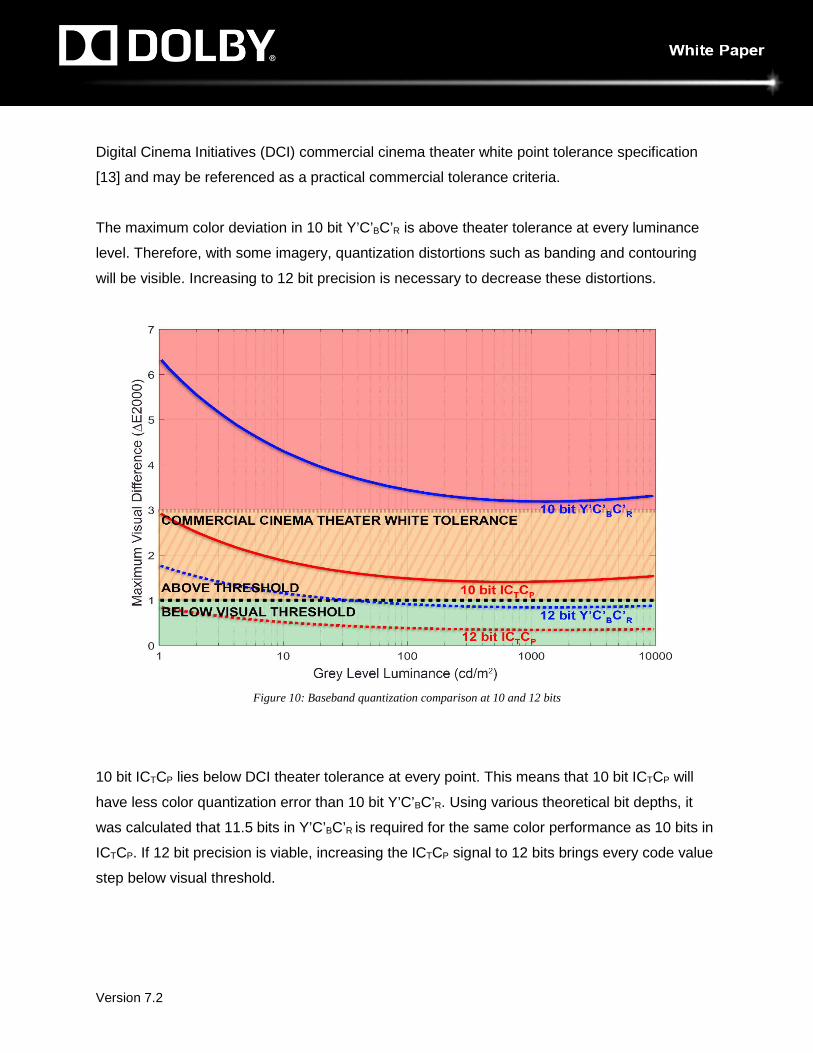
The 10 and 12 bit results can be seen in Figure 10. A ΔE2000 below 1.0 is below visual
threshold. Below this level, quantization distortions should not be visible. A ΔE2000 of 3.0 is the
EEDS TO CHANG
Version 7.2
Digital Cinema Initiatives (DCI) commercial cinema theater white point tolerance specification
[13] and may be referenced as a practical commercial tolerance criteria.
The maximum color deviation in 10 bit Y’C’BC’R is above theater tolerance at every luminance
level. Therefore, with some imagery, quantization distortions such as banding and contouring
will be visible. Increasing to 12 bit precision is necessary to decrease these distortions.
Figure 10: Baseband quantization comparison at 10 and 12 bits
10 bit ICTCP lies below DCI theater tolerance at every point. This means that 10 bit ICTCP will
have less color quantization error than 10 bit Y’C’BC’R. Using various theoretical bit depths, it
was calculated that 11.5 bits in Y’C’BC’R is required for the same color performance as 10 bits in
ICTCP. If 12 bit precision is viable, increasing the ICTCP signal to 12 bits brings every code value
step below visual threshold.
EEDS TO CHANG
Version 7.2
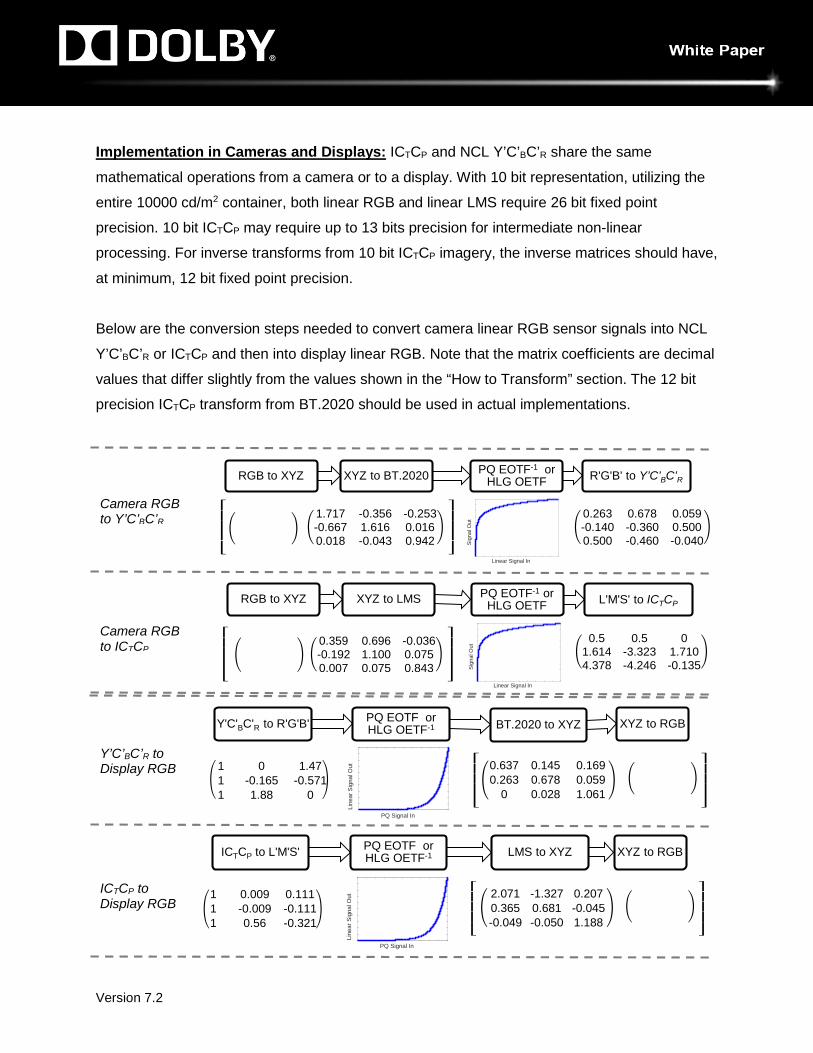
Implementation in Cameras and Displays: ICTCP and NCL Y’C’BC’R share the same
mathematical operations from a camera or to a display. With 10 bit representation, utilizing the
entire 10000 cd/m2 container, both linear RGB and linear LMS require 26 bit fixed point
precision. 10 bit ICTCP may require up to 13 bits precision for intermediate non-linear
processing. For inverse transforms from 10 bit ICTCP imagery, the inverse matrices should have,
at minimum, 12 bit fixed point precision.
Below are the conversion steps needed to convert camera linear RGB sensor signals into NCL
Y’C’BC’R or ICTCP and then into display linear RGB. Note that the matrix coefficients are decimal
values that differ slightly from the values shown in the “How to Transform” section. The 12 bit
precision ICTCP transform from BT.2020 should be used in actual implementations.
⎣⎢⎢⎢⎡
⎦⎥⎥⎥⎤
RGB to XYZ XYZ to BT.2020 PQ EOTF-1 or HLG OETF R'G'B' to Y’C’BC’R
� �
Linear Signal In
Sig
nal O
ut �0.263 0.678 0.059-0.140 -0.360 0.5000.500 -0.460 -0.040
�
�1.717 -0.356 -0.253-0.667 1.616 0.0160.018 -0.043 0.942
�
⎣⎢⎢⎢⎡
⎦⎥⎥⎥⎤ � �
Linear Signal In
Sig
nal O
ut �0.5 0.5 0
1.614 -3.323 1.7104.378 -4.246 -0.135
�
�0.359 0.696 -0.036-0.192 1.100 0.0750.007 0.075 0.843
�
RGB to XYZ XYZ to LMS PQ EOTF-1 or HLG OETF L'M'S' to ICTCP
⎣⎢⎢⎢⎡
⎦⎥⎥⎥⎤ � �
1 0.009 0.111 1 -0.009 -0.111 1 0.56 -0.321
� � 2.071 -1.327 0.207 0.365 0.681 -0.045 -0.049 -0.050 1.188
ICTCP to L'M'S' PQ EOTF or HLG OETF-1 LMS to XYZ XYZ to RGB
� �
PQ Signal In
Line
ar S
igna
l Out
Y'C'BC'R to R'G'B' PQ EOTF or HLG OETF-1 BT.2020 to XYZ XYZ to RGB
⎣⎢⎢⎢⎡
⎦⎥⎥⎥⎤ � � � �
1 0 1.47 1 -0.165 -0.571 1 1.88 0
� � 0.637 0.145 0.169 0.263 0.678 0.059
0 0.028 1.061
PQ Signal In
Line
ar S
igna
l Out
Camera RGB to Y’C’BC’R
Camera RGB to ICTCP
Y’C’BC’R to Display RGB
ICTCP to Display RGB
EEDS TO CHANG
Version 7.2
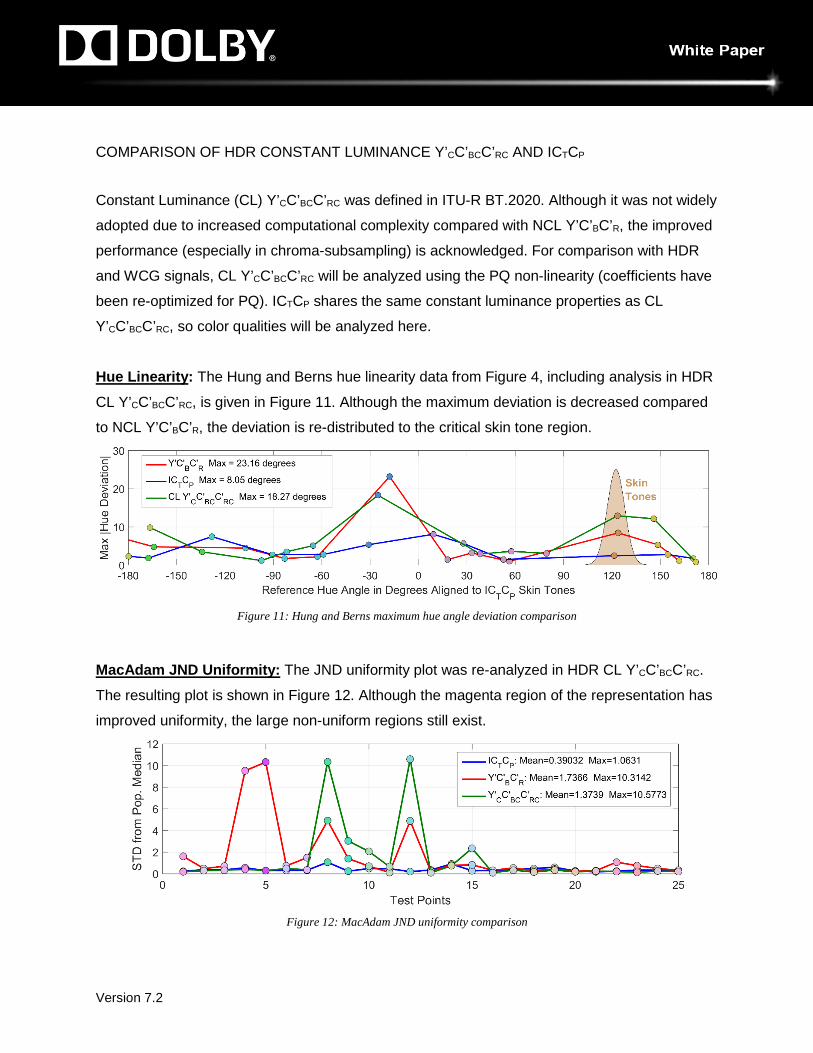
COMPARISON OF HDR CONSTANT LUMINANCE Y’CC’BCC’RC AND ICTCP
Constant Luminance (CL) Y’CC’BCC’RC was defined in ITU-R BT.2020. Although it was not widely
adopted due to increased computational complexity compared with NCL Y’C’BC’R, the improved
performance (especially in chroma-subsampling) is acknowledged. For comparison with HDR
and WCG signals, CL Y’CC’BCC’RC will be analyzed using the PQ non-linearity (coefficients have
been re-optimized for PQ). ICTCP shares the same constant luminance properties as CL
Y’CC’BCC’RC, so color qualities will be analyzed here.
Hue Linearity: The Hung and Berns hue linearity data from Figure 4, including analysis in HDR
CL Y’CC’BCC’RC, is given in Figure 11. Although the maximum deviation is decreased compared
to NCL Y’C’BC’R, the deviation is re-distributed to the critical skin tone region.
Figure 11: Hung and Berns maximum hue angle deviation comparison
MacAdam JND Uniformity: The JND uniformity plot was re-analyzed in HDR CL Y’CC’BCC’RC.
The resulting plot is shown in Figure 12. Although the magenta region of the representation has
improved uniformity, the large non-uniform regions still exist.
Figure 12: MacAdam JND uniformity comparison
EEDS TO CHANG
Version 7.2
CONCLUSION
The range of display technologies, from various color primaries to increasing dynamic range, is
creating a marketplace where color management is becoming increasingly important if artistic
intent is to be maintained. In many applications, traditional color transformations may not be
possible due to limitations in bandwidth, speed, or processing power. In these cases, image
processing must be performed on the incoming signal. With growing color volumes and the
increasing need for color processing, distortions created by the baseband quantization
performance and the non-uniformity of NCL Y’C’BC’R are increasing.
ICTCP is a more perceptually uniform color representation that is based on the human visual
system. The improved decorrelation of saturation, hue, and intensity make ICTCP ideal for the
entire imaging chain from scene to screen. ICTCP improves color accuracy with fewer bits, has
been designed with the same operations as NCL Y’C’BC’R, and can serve as a drop-in
replacement. The perceptually uniform design of ICTCP allows for complex tasks such as gamut
mapping to be easily performed with minimal error.
The industry is making a large change to implement wider color primaries, high dynamic range
non-linearity curves, and increased bit depth. With the improving technology and revamping of
systems to meet these standards, this is the ideal time to also transition to an improved color
representation, forming an over-arching next generation solution.
EEDS TO CHANG
Version 7.2
REFERENCES [1] International Telecommunication Union (ITU), "Parameter values for ultra-high definition television
systems for production and international programme exchange," Recommendation ITU-R BT.2020-2, 2015.
[2] Society of Motion Picture & Television Engineers, “High Dynamic Range Electro-Optical Transfer Function of Mastering Reference Displays”, SMPTE ST 2084:2014, August 2014, 1-14.
[3] De Valois, R. and De Valois, K. “A multi-stage color model”. Vision Research, 33(8): 1053-1065, 1993.
[4] Fairchild, Mark D. (2005). Color Appearance Models (2E ed.). Wiley Interscience. ISBN 978-0-470-01216-1.
[5] Froehlich et al., “Encoding Color Difference Signals for High Dynamic Range and Wide Gamut Imagery”, Color Imaging Conference, 2015, 1, October 2015, 240-247.
[6] Miller et al., “Perceptual Signal Coding for More Efficient Usage of Bit Codes”, Society of Motion Picture & Television Engineers Annual Technical Conference & Exhibition. 2012.
[7] Ebner, Fairchild, “Development and Testing of a Color Space (IPT) with Improved Hue Uniformity”, IS&T sixth Color Imaging Conference, 1998.
[8] Hunt, R.W.G, “The Reproduction of Colour Sixth Edition”, Wiley-IS&T Series in Imaging Science and Technology, 2004, 342.
[9] Lane, David M. Online Stat Book. Online. March 1, 2016. <http://onlinestatbook.com/2/describing_bivariate_data/pearson.html>.
[10] Hung, P. and Berns, R. “Determination of Constant Hue Loci for a CRT Gamut and Their Predictions Using Color Appearance Space”, COLOR research and application. Volume 20, Number 5, October 1995.
[11] MacAdam, L, David, “Visual Sensitivities to Color Difference in Daylight”, Journal of the Optical Society of America, 32, 5, May 1942, 247-274.
[12] CIE. Improvement to Industrial Colour-Difference Evaluation. Vienna: CIE Publication No. 142-2001, Central Bureau of the CIE; 2001.
[13] Society of Motion Picture & Television Engineers, “SMPTE Standard for D-Cinema Quality – Screen Luminance Level, Chromaticity and Uniformity”, SMPTE 431-1-2006.