Embed Size (px)
Citation preview
8/10/2019 EEDI AND SEEMP.pdf
http://slidepdf.com/reader/full/eedi-and-seemppdf 1/62
MEPC 63/INF.2 Annex, page 1
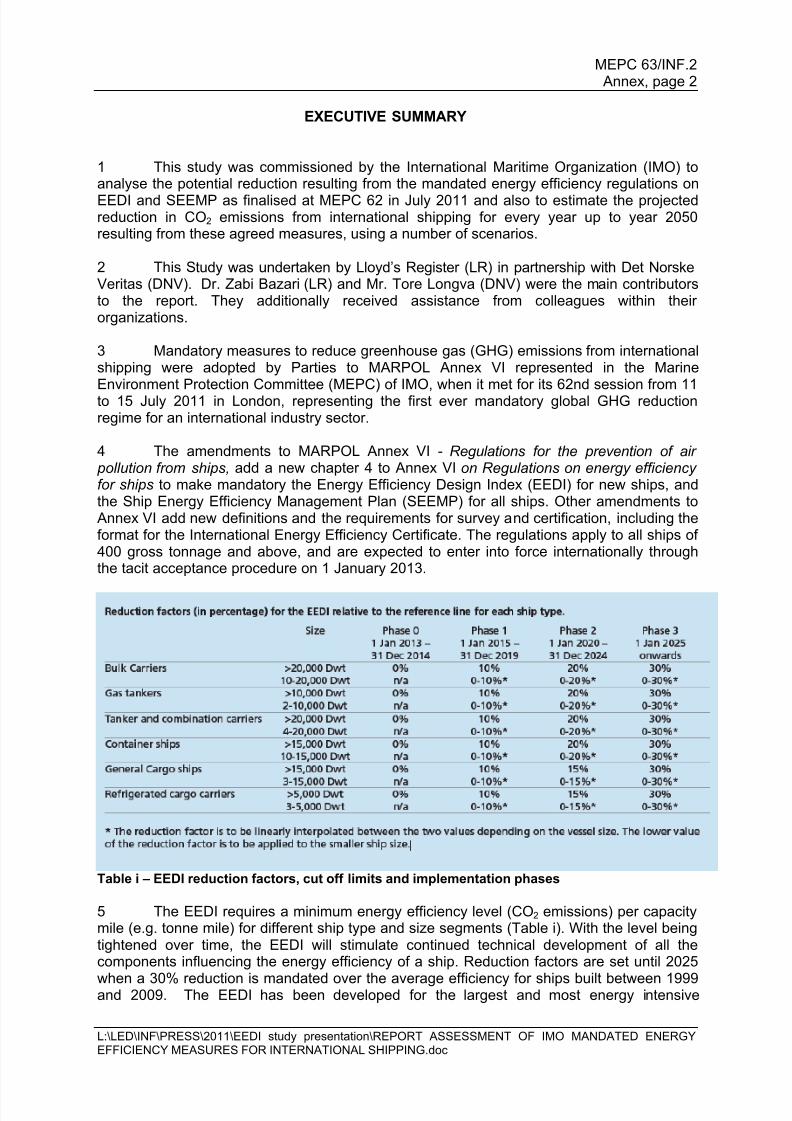
L:\LED\INF\PRESS\2011\EEDI study presentation\REPORT ASSESSMENT OF IMO MANDATED ENERGYEFFICIENCY MEASURES FOR INTERNATIONAL SHIPPING.doc
PROJECT FINAL REPORT
ASSESSMENT OF IMO MANDATED ENERGY EFFICIENCYMEASURES FOR INTERNATIONAL SHIPPING
ESTIMATED CO2 EMISSIONS REDUCTION FROM INTRODUCTION OF MANDATORYTECHNICAL AND OPERATIONAL ENERGY EFFICIENCY MEASURES FOR SHIPS
Report Authors:Zabi Bazari, Lloyd’s Register, London, UK Tore Longva, DNV, Oslo, Norway
Date of report:31 October 2011
8/10/2019 EEDI AND SEEMP.pdf
http://slidepdf.com/reader/full/eedi-and-seemppdf 2/62

8/10/2019 EEDI AND SEEMP.pdf
http://slidepdf.com/reader/full/eedi-and-seemppdf 3/62
MEPC 63/INF.2 Annex, page 3
L:\LED\INF\PRESS\2011\EEDI study presentation\REPORT ASSESSMENT OF IMO MANDATED ENERGYEFFICIENCY MEASURES FOR INTERNATIONAL SHIPPING.doc
segments of the world merchant fleet and will embrace about 70% of emissions from new oiland gas tankers, bulk carriers, general cargo, refrigerated cargo and container ships as wellas combination carriers (wet/dry bulk). For ship types not covered by the current EEDIformula, suitable formulas will be developed in the future according to a work plan agreed atMEPC 62.
6 The SEEMP establishes a mechanism for a shipping company and/or a ship toimprove the energy efficiency of ship operations. The SEEMP provides an approach formonitoring ship and fleet efficiency performance over time using, for example, the EnergyEfficiency Operational Indicator (EEOI) as a monitoring and/or benchmark tool. The SEEMPurges the ship owner and operator at each stage of the operation of the ship to review andconsider operational practices and technology upgrades to optimize the energy efficiencyperformance of a ship.
7 In this study, scenario modelling was used to forecast possible world‘s fleet CO2 emission growth trajectories to 2050. The scenarios included options for fleet growth, EEDIand SEEMP uptake, fuel price and EEDI waiver. Table ii shows the combined scenariosmodelled in this Study.
8 A model, designed specifically to account for the uptake of emission reductiontechnologies and measures and the implementation of regulations to control emissions, hasbeen used to predict CO2 emission levels to 2050. The model keeps track of the year ofbuild for all ships, and scraps the oldest and least energy-efficient ships first. By includingthe scrapping rate, the renewal rate of the fleet is taken into account.
Scenario IPCC growthscenario
EEDIUptake
scenario
SEEMPuptake
Fuel pricescenarios
Waiver scenario
A1B-1 A1B Regulation Low* Reference 5% A1B-2 A1B Regulation Low High 5% A1B-3 A1B Regulation High** Reference 5% A1B-4 A1B Regulation High High 5%
B2-1 B2 Regulation Low Reference 5% B2-2 B2 Regulation Low High 5% B2-3 B2 Regulation High Reference 5% B2-4 B2 Regulation High High 5%
A1B-3W A1B Regulation High Reference 30%* 30% ** 60%
Table ii – Combined scenarios
9 Based on scenarios modelled in this Study, results shows that the adoption by IMOof mandatory reduction measures from 2013 and onwards will lead to significant emissionreductions by the shipping industry (see Figure i).
8/10/2019 EEDI AND SEEMP.pdf
http://slidepdf.com/reader/full/eedi-and-seemppdf 4/62
MEPC 63/INF.2 Annex, page 4
L:\LED\INF\PRESS\2011\EEDI study presentation\REPORT ASSESSMENT OF IMO MANDATED ENERGYEFFICIENCY MEASURES FOR INTERNATIONAL SHIPPING.doc
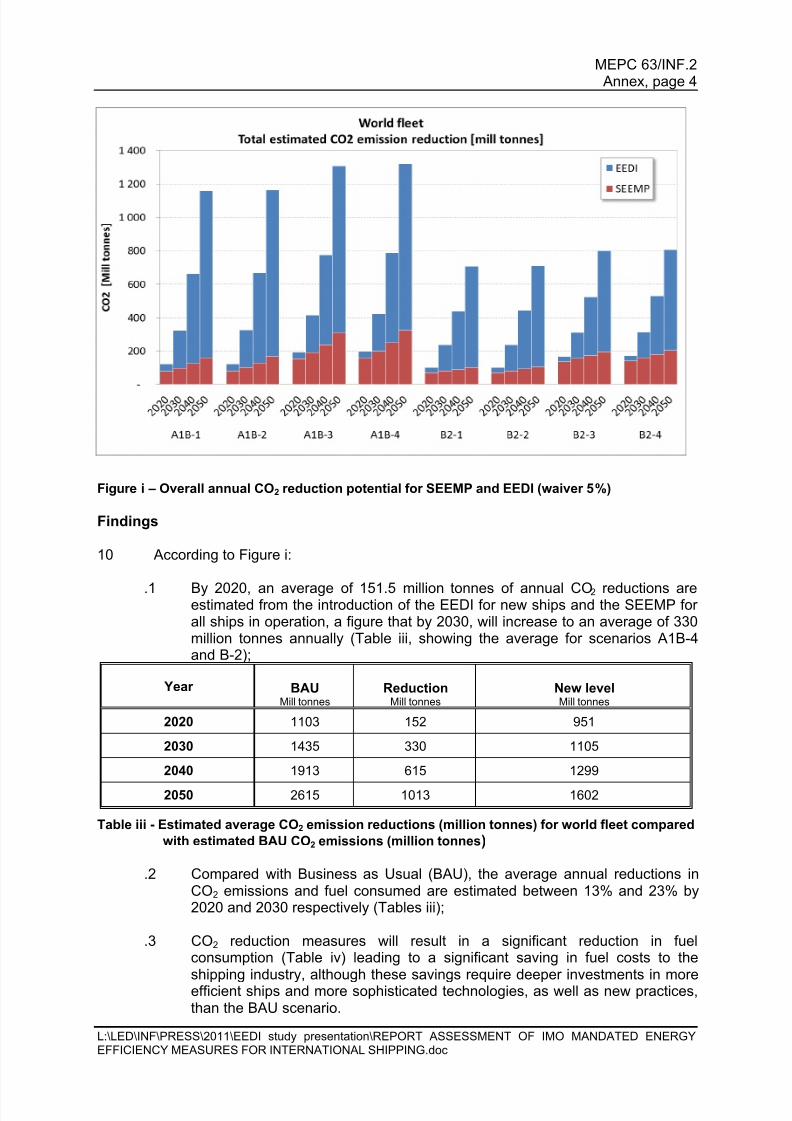
Figure i – Overall annual CO2 reduction potential for SEEMP and EEDI (waiver 5%)
Findings
10 According to Figure i:
.1 By 2020, an average of 151.5 million tonnes of annual CO2 reductions areestimated from the introduction of the EEDI for new ships and the SEEMP forall ships in operation, a figure that by 2030, will increase to an average of 330million tonnes annually (Table iii, showing the average for scenarios A1B-4and B-2);
Year BAUMill tonnes
ReductionMill tonnes
New levelMill tonnes
2020 1103 152 951
2030 1435 330 1105
2040 1913 615 1299
2050 2615 1013 1602
Table iii - Estimated average CO2 emission reductions (million tonnes) for world fleet compared
with estimated BAU CO2 emissions (million tonnes)
.2 Compared with Business as Usual (BAU), the average annual reductions inCO2 emissions and fuel consumed are estimated between 13% and 23% by2020 and 2030 respectively (Tables iii);
.3 CO2 reduction measures will result in a significant reduction in fuelconsumption (Table iv) leading to a significant saving in fuel costs to the
shipping industry, although these savings require deeper investments in moreefficient ships and more sophisticated technologies, as well as new practices,than the BAU scenario.
8/10/2019 EEDI AND SEEMP.pdf
http://slidepdf.com/reader/full/eedi-and-seemppdf 5/62
MEPC 63/INF.2 Annex, page 5
L:\LED\INF\PRESS\2011\EEDI study presentation\REPORT ASSESSMENT OF IMO MANDATED ENERGYEFFICIENCY MEASURES FOR INTERNATIONAL SHIPPING.doc
Year 2020 2030
Scenarios Low (B2-1)Mill tonnes
High (A1B-4)Mill tonnes
Low (B2-1)Mill tonnes
High (A1B-4)Mill tonnes
BAU fuel
consumption 340 390 420 530Reduction in fuelconsumption
30 70 80 140
New fuelconsumption level
310 320 340 390
Table iv - Annual fuel consumption reduction (in million metric tonnes) for world fleet
.4 The average annual fuel cost saving is estimated between US$20 and US$80billion (average US$50 billion) by 2020, and between US$90 and US$310billion (average US$200 billion) by 2030 (Table v).
High (A1B-4) Low (B2-1)
Year2020
$billion2030
$billion2020
$billion2030
$billion
BAU fuel cost 490 1170 240 510
Reduction in fuel cost 80 310 20 90
New fuel cost level 410 860 220 420
Table v - Annual fuel cost reduction (in billion US$) for world fleet
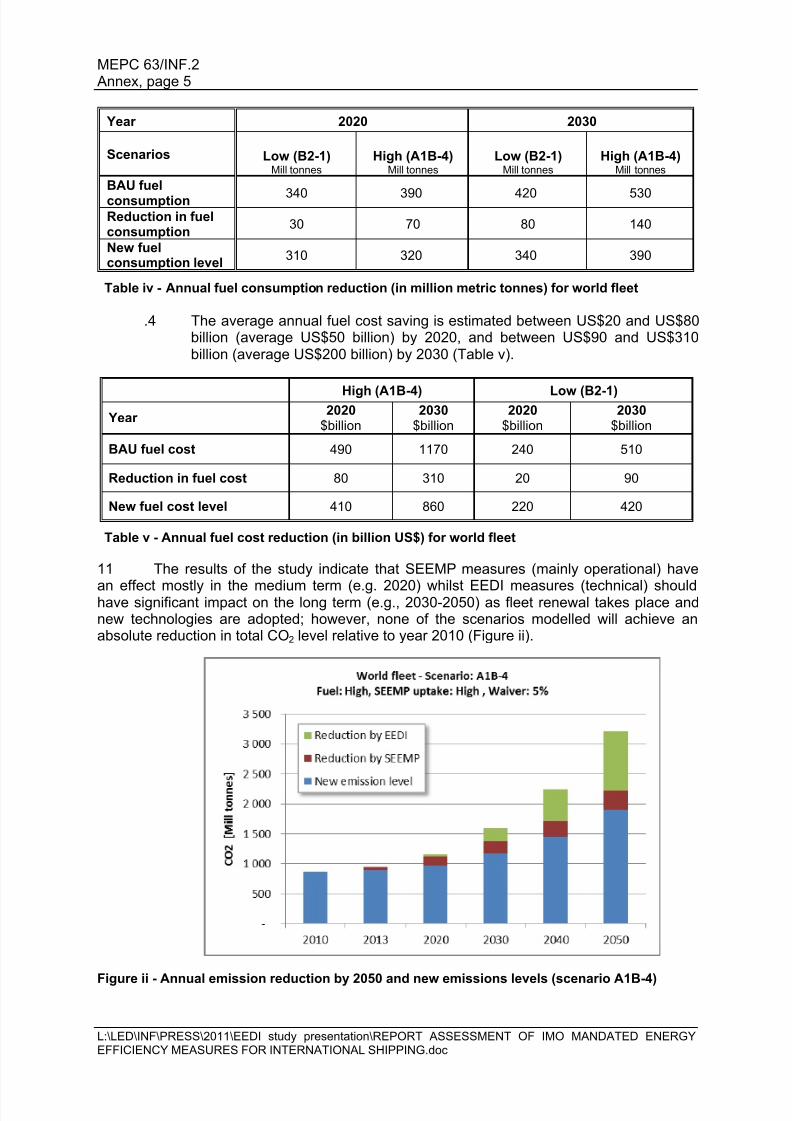
11 The results of the study indicate that SEEMP measures (mainly operational) have
an effect mostly in the medium term (e.g. 2020) whilst EEDI measures (technical) shouldhave significant impact on the long term (e.g., 2030-2050) as fleet renewal takes place andnew technologies are adopted; however, none of the scenarios modelled will achieve anabsolute reduction in total CO2 level relative to year 2010 (Figure ii).
Figure ii - Annual emission reduction by 2050 and new emissions levels (scenario A1B-4)
8/10/2019 EEDI AND SEEMP.pdf
http://slidepdf.com/reader/full/eedi-and-seemppdf 6/62
MEPC 63/INF.2 Annex, page 6
L:\LED\INF\PRESS\2011\EEDI study presentation\REPORT ASSESSMENT OF IMO MANDATED ENERGYEFFICIENCY MEASURES FOR INTERNATIONAL SHIPPING.doc
Concluding remarks
12 Based on the results of this Study, the following conclusions may be made:
.1 Significant reduction of CO2 emissions from ships due to EEDI and SEEMPregulations is foreseen to 2050 with emission reduction due to SEEMP(primarily operational measures) likely to be realised more rapidly than that forEEDI (primarily technical measures), as the effect of EEDI will occur only asand when older, less efficient, tonnage is replaced by new, more efficienttonnage.
.2 Mandatory application of EEDI will drive more energy efficient ship design andrealise the CO2 emission reduction potential associated with technicalinnovation and the use of lower or no carbon fuels. Calculations made withinthis Study suggest that the agreed EEDI limits can be achieved viatechnological developments and some design speed reduction as highlightedin this report.
.3 Forecasts with different scenarios indicate total annual CO2 emissions in 2050of 3215 million tonnes for BAU and new emissions level of 1895 million tonnes(1320 million tonnes reduced) for scenario A1B-4 (high growth combined withhigh SEEMP uptake and high fuel price) and a total annual CO2 emissions in2050 of around 2014 million tonnes for BAU and new emissions level of 1344million tonnes (706 million tonnes reduced) for scenario B2-1 (low growthcombined with low SEEMP uptake and reference fuel price).
.4 For EEDI, an annual reduction of about 1000 million tonnes of CO2 for
scenario A1B and 600 million tonnes of CO2 for scenario B2 is foreseen in2050. For SEEMP, an annual reduction of about 325 million tonnes of CO2 forscenario A1B-4 and 103 million tonnes of CO2 for scenario B2-1 is foreseenby 2050.
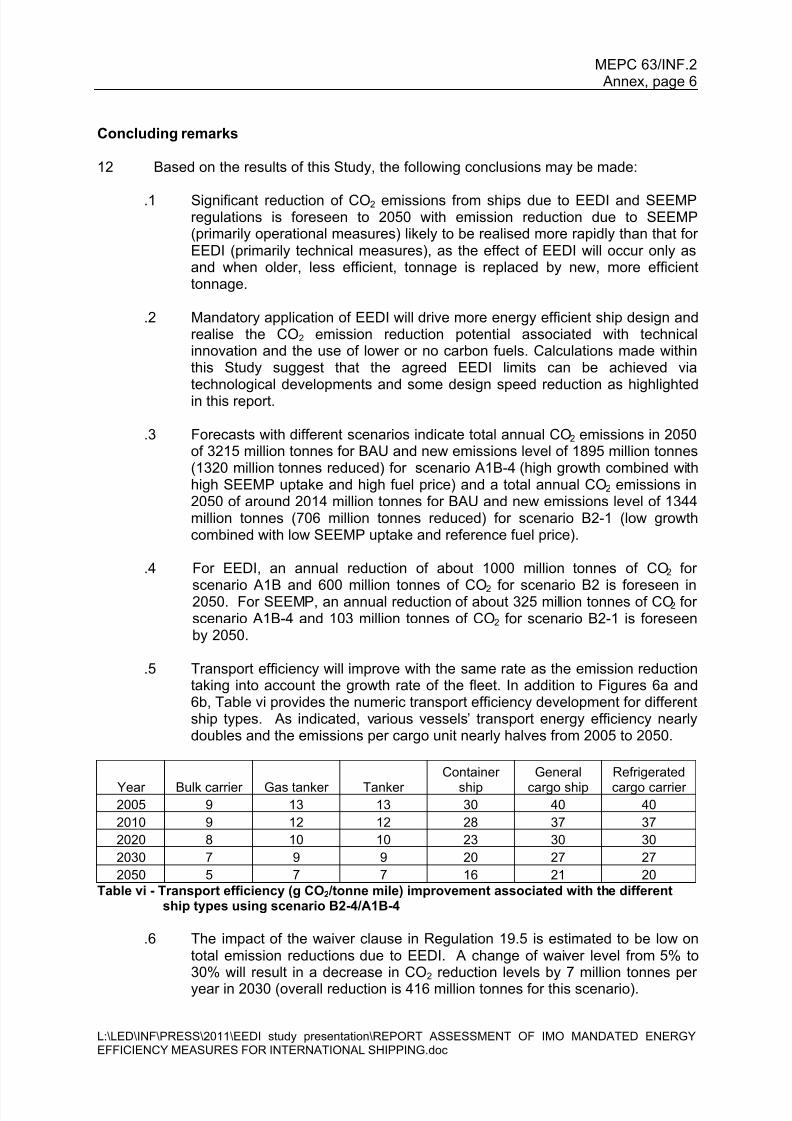
.5 Transport efficiency will improve with the same rate as the emission reductiontaking into account the growth rate of the fleet. In addition to Figures 6a and6b, Table vi provides the numeric transport efficiency development for differentship types. As indicated, various vessels‘ transport energy efficiency nearlydoubles and the emissions per cargo unit nearly halves from 2005 to 2050.
Year Bulk carrier Gas tanker Tanker
Container
ship
General
cargo ship
Refrigerated
cargo carrier2005 9 13 13 30 40 40
2010 9 12 12 28 37 37
2020 8 10 10 23 30 30
2030 7 9 9 20 27 27
2050 5 7 7 16 21 20Table vi - Transport efficiency (g CO2 /tonne mile) improvement associated with the different
ship types using scenario B2-4/A1B-4
.6 The impact of the waiver clause in Regulation 19.5 is estimated to be low ontotal emission reductions due to EEDI. A change of waiver level from 5% to30% will result in a decrease in CO2 reduction levels by 7 million tonnes peryear in 2030 (overall reduction is 416 million tonnes for this scenario).

8/10/2019 EEDI AND SEEMP.pdf
http://slidepdf.com/reader/full/eedi-and-seemppdf 7/62
MEPC 63/INF.2 Annex, page 7
L:\LED\INF\PRESS\2011\EEDI study presentation\REPORT ASSESSMENT OF IMO MANDATED ENERGYEFFICIENCY MEASURES FOR INTERNATIONAL SHIPPING.doc
.7 Based on the analysis provided in this Study, it is concluded that the likelihoodof Flag States or shipowners to opt for an EEDI waiver is low due to lowcompliance costs and commercial disadvantage of non-compliance. Accordingly, the uptake level taken in this Study as 5% (low) and 30% (high) isregarded as reasonable. It is most likely that waiver uptake will be at the level
of 5% as current indications imply.
Table vii-Technologies for EEDI reductions and SEEMP related measures
.8 Implementation of SEEMP-related energy efficiency measures are generallycost effective; however, it is likely that adoption of these measures will need tobe stimulated. Follow-on monitoring and audits, and high carbon and fuelprices are expected to play a role in driving uptake of SEEMP efficiencymeasures. Although it is not anticipated to have a target-based regulatoryframework for SEEMP in the foreseeable future; putting in place an effectiveaudit/monitoring system, building awareness and resolving split incentiveissues for operational energy efficiency measures will facilitate enhanceduptake of SEEMP measures in the world fleet.
.9 The mandatory use of SEEMP based on current IMO regulations will provide aprocedural framework for shipping companies to recognise the importance ofthe operational energy saving activities. It will significantly boost the level ofawareness and, if implemented properly, will lead to a positive cultural change.However, and in view of lack of regulatory requirements for target setting andmonitoring, SEEMP‘s effectiveness will need to be stimulated / incentivised viaother initiatives.
.10 To make the application of SEEMP more effective and to prepare the shippingindustry for likely future carbon pricing via MBMs, it seems that use of theEEOI (Energy Efficiency Operational Indicator) or a similar performance
indicator should be encouraged or mandated. This will involve more accurate
EEDI reduction measure SEEMP Related measure
1 Optimised hull dimensions and form Engine tuning and monitoring2 Lightweight construction Hull condition3 Hull coating Propeller condition4 Hull air lubrication system Reduced auxiliary power5 Optimisation of propeller-hull interface
and flow devices Speed reduction (operation)
6 Contra-rotating propeller Trim/draft7 Engine efficiency improvement Voyage execution8 Waste heat recovery Weather routing9 Gas fuelled (LNG) Advanced hull coating10 Hybrid electric power and propulsion
conceptsPropeller upgrade and aft body flowdevices
11 Reducing on-board power demand(auxiliary system and hotel loads).
12 Variable speed drive for pumps, fans, etc.13 Wind power (sail, wind engine, etc.)14 Solar power
15 Design speed reduction (new builds)

8/10/2019 EEDI AND SEEMP.pdf
http://slidepdf.com/reader/full/eedi-and-seemppdf 8/62
MEPC 63/INF.2 Annex, page 8
L:\LED\INF\PRESS\2011\EEDI study presentation\REPORT ASSESSMENT OF IMO MANDATED ENERGYEFFICIENCY MEASURES FOR INTERNATIONAL SHIPPING.doc
and verifiable measurement of fuel consumption that could pave the way forCO2 foot printing and data verification in the future.
.11 The estimated reductions in CO2 emissions, for combined EEDI and SEEMP,from the world fleet translate into a significant annual fuel cost saving of about
US$50 billion in 2020 and about US$200 billion by 2030; using fuel priceincrease scenarios that take into account the switch to low sulphur fuel in2020.
.12 Investigations show that ship hydrodynamic and main engine optimisation willbring about energy saving opportunities of up to around 10% with nosignificant additional cost of shipbuilding. In addition, main and auxiliaryengines are already available with reduced specific fuel consumption of about10% below the values used in the reference line calculations. The above twocombined effects is indicative that cost of compliance, for an ―average ship‖, tophases 0 and 1 will not be significant.
.13 As a consequence of current developments in ship design and newtechnologies coming onto market, the cost of EEDI compliance in phase 1seems to be marginal as the 10% reduction requirement may be achieved bylow-cost hull form design and main engine optimisations. Cost of compliancefor phase 2 and phase 3 may be higher and will involve some design-speedreduction for an average ship. However, the overall life-cycle fuel economy ofthe new ships will be positive as indicated by the high savings in fuel costs.
.14 Despite the significant CO2 emission reduction potential resulting from EEDIand SEEMP regulations, an absolute reduction in total CO2 emissions forshipping from the 2010 level appears not to be feasible using these two
measures alone. For all scenarios, the projected growth in world tradeoutweighs the achieved emission reduction using EEDI and SEEMP, giving anupward trend, albeit at a very much reduced rate compared to BAU.
Figure 4a – World fleet CO2 level projections (B2-1 scenario)

8/10/2019 EEDI AND SEEMP.pdf
http://slidepdf.com/reader/full/eedi-and-seemppdf 9/62
9
Table of Contents
Section Page
EXECUTIVE SUMMARY 2-8
1 INTRODUCTION 11MEPC energy efficiency measuresCO2 reduction measures
2 EEDI APPLICATION ASPECTS 12Ship typesEEDI reduction factor, cut off levels and implementation phasesEEDI waiverEEDI and ship technologies
3 SEEMP APPLICATION ASPECTS 15SEEMP and operational measures
SEEMP uptake level
4 METHODOLOGY 16Overall approachGrowth scenario scenariosEEDI and SEEMP scenariosFuel price scenariosOverview of scenarios modelledSimulation modelFleet baseline and developmentMethod of inclusion of EEDI reduction factorMethod of inclusion of SEEMP reduction potentials
Method of calculation of cost level
5 RESULTS 21
Emission reduction potentials to 2050Emissions projections to 2050Emission reduction by ship categoryTransport efficiencyImpact of waiverImpact of fuel priceFuel consumption and fuel cost projections to 2050Fuel consumption and fuel cost projections to 2050 for typical ship types
Cost of compliance to EEDI
6 CONCLUDING REMARKS 34
7 REFERENCES 35
8/10/2019 EEDI AND SEEMP.pdf
http://slidepdf.com/reader/full/eedi-and-seemppdf 10/62
MEPC 63/INF.2 Annex, page 10
L:\LED\INF\PRESS\2011\EEDI study presentation\REPORT ASSESSMENT OF IMO MANDATED ENERGYEFFICIENCY MEASURES FOR INTERNATIONAL SHIPPING.doc
APPENDICES
Appendix 1 Analysis of Waiver Uptake
Appendix 2 Technology options for various ship types / sizes for EEDI compliance
Appendix 3 SEEMP measures reduction potentials
Appendix 4 Analysis of SEEMP likely uptake
Appendix 5 Method of calculation of CO2 reduction due to EEDI reduction factors
Appendix 6 Projected CO2 emission reductions attributable to SEEMP and EEDI
Appendix 7 Projected emissions trends
Appendix 8 Projected change in transport efficiencies over time
8/10/2019 EEDI AND SEEMP.pdf
http://slidepdf.com/reader/full/eedi-and-seemppdf 11/62

8/10/2019 EEDI AND SEEMP.pdf
http://slidepdf.com/reader/full/eedi-and-seemppdf 12/62
MEPC 63/INF.2 Annex, page 12
L:\LED\INF\PRESS\2011\EEDI study presentation\REPORT ASSESSMENT OF IMO MANDATED ENERGYEFFICIENCY MEASURES FOR INTERNATIONAL SHIPPING.doc
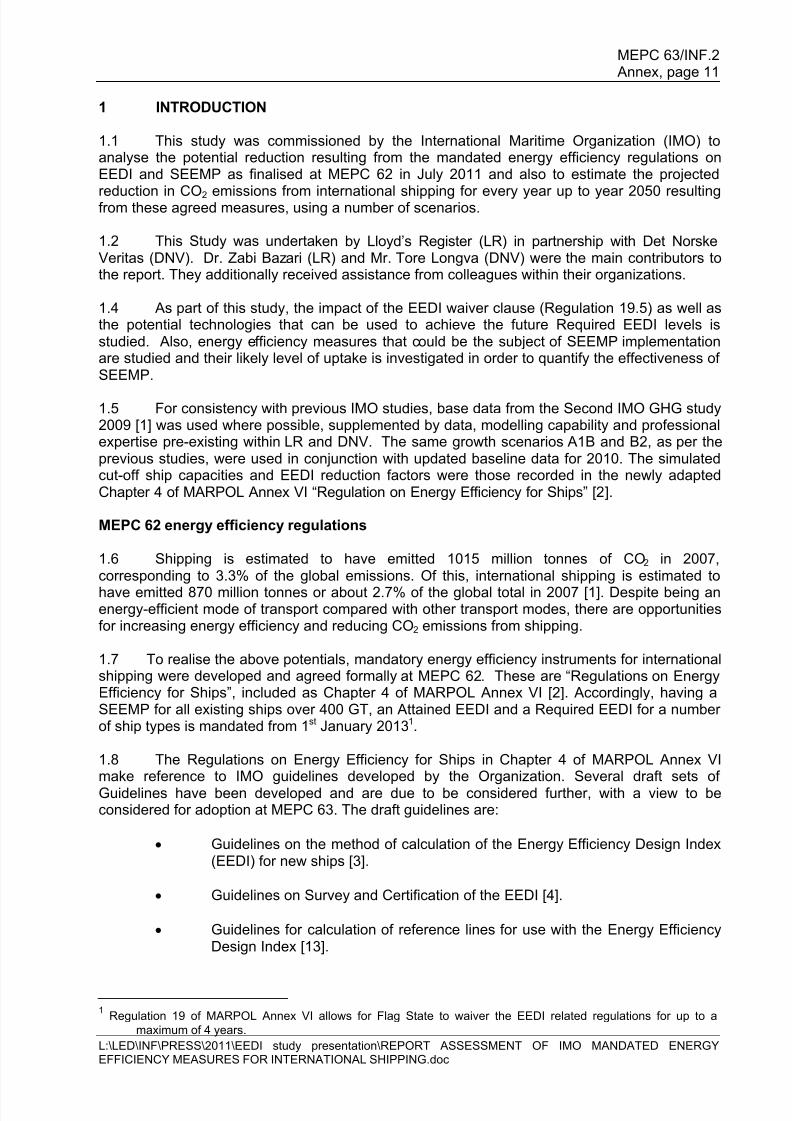
Guidelines for the development of a Ship Energy Efficiency Management Plan(SEEMP) [5].
Guidelines for determining minimum propulsion power and speed to enablesafe manoeuvring in adverse weather conditions (under development).
1.9 Additionally, IMO has developed Guidelines for voluntary use of the Energy EfficiencyOperational Indicator (EEOI) [6].
1.10 In this Study, the scope of application of the Required EEDI and SEEMP has been fullytaken into account in order to quantify their impact on future level of CO 2 from shipping.
CO2 reduction measures
1.11 At present, the principal ways of reducing CO2 emissions towards 2050 are consideredto be a mix of operational measures, technological developments and use of alternative fuelswith lower carbon content. In this Study, it is assumed that:
Uptake of new technologies and low carbon fuels will be mainly driven by theEEDI regulations.
Uptake of operational measures and cost effective technology upgrades will beencouraged by the SEEMP combined with increasing fuel and carbon prices.
2 EEDI APPLICATION ASPECTS
Ship types
2.1 EEDI will only be applicable to new ships of more than 400 GT. Currently, the EEDIdoes not apply to vessels such as offshore, fishing and service vessels (of all sizes), turbineships and diesel electric ships. Additionally, currently ro-ro ships and passenger ships areexcluded from the Required EEDI regulation. Although these ships may be included in theregulation in future years, the impact of future application of EEDI regulations for these ships onoverall CO2 reductions are not assessed in this Study.
2.2 The ships included in this study are those named under Regulation 21 (on RequiredEEDI) and are as follows:
1. Bulk carriers2. Gas carriers
3. Tankers4. Container ships5. General cargo ships6. Refrigerated cargo ships7. Combination carriers
2.3 From the above list, the combination carriers have been amalgamated with the tankersas a single group, in accordance with Regulation 21.4.
EEDI reduction factor, cut off levels and implementation phases
2.4 Regulation 21 stipulates that the Attained EEDI should be less than or equal to the
Required EEDI. The Required EEDI itself has to be below the Reference EEDI2
by a
2 Reference EEDI refers to EEDI as calculated from Reference Line (Regulation 21.3).
8/10/2019 EEDI AND SEEMP.pdf
http://slidepdf.com/reader/full/eedi-and-seemppdf 13/62
MEPC 63/INF.2 Annex, page 13
L:\LED\INF\PRESS\2011\EEDI study presentation\REPORT ASSESSMENT OF IMO MANDATED ENERGYEFFICIENCY MEASURES FOR INTERNATIONAL SHIPPING.doc
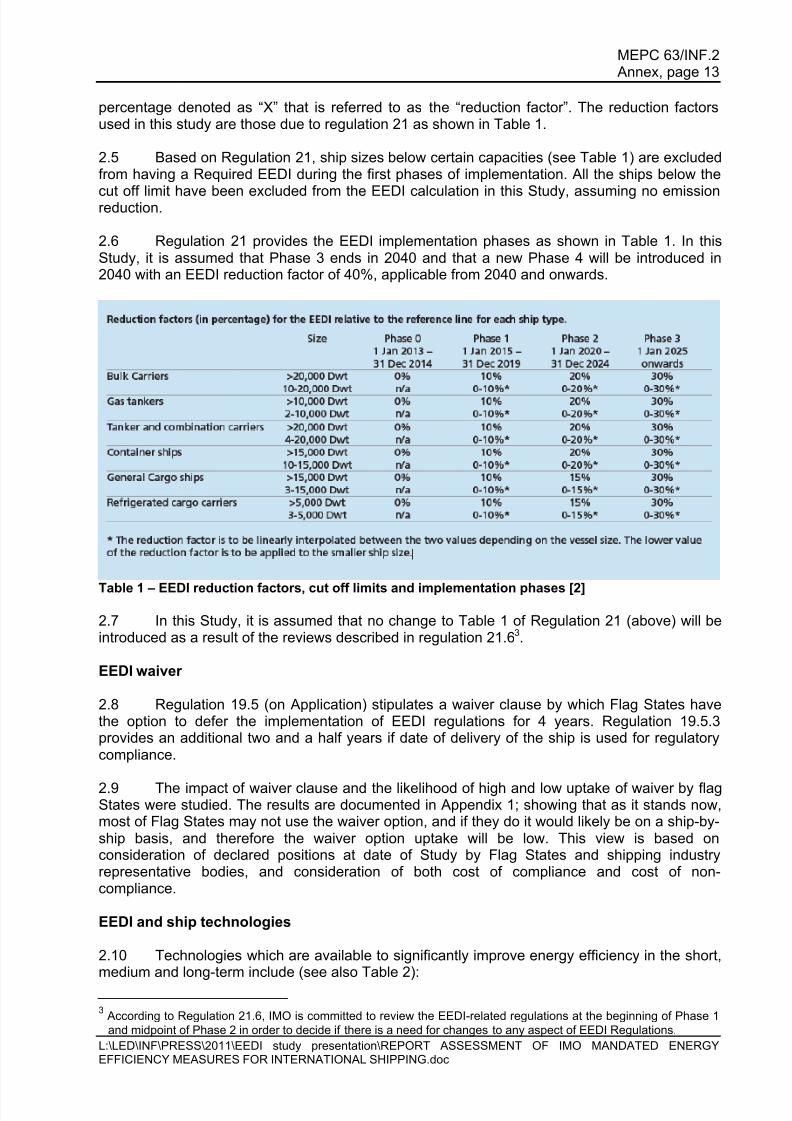
percentage denoted as ―X‖ that is referred to as the ―reduction factor‖. The reduction factorsused in this study are those due to regulation 21 as shown in Table 1.
2.5 Based on Regulation 21, ship sizes below certain capacities (see Table 1) are excludedfrom having a Required EEDI during the first phases of implementation. All the ships below the
cut off limit have been excluded from the EEDI calculation in this Study, assuming no emissionreduction.
2.6 Regulation 21 provides the EEDI implementation phases as shown in Table 1. In thisStudy, it is assumed that Phase 3 ends in 2040 and that a new Phase 4 will be introduced in2040 with an EEDI reduction factor of 40%, applicable from 2040 and onwards.
Table 1 – EEDI reduction factors, cut off limits and implementation phases [2]
2.7 In this Study, it is assumed that no change to Table 1 of Regulation 21 (above) will beintroduced as a result of the reviews described in regulation 21.63.
EEDI waiver
2.8 Regulation 19.5 (on Application) stipulates a waiver clause by which Flag States havethe option to defer the implementation of EEDI regulations for 4 years. Regulation 19.5.3provides an additional two and a half years if date of delivery of the ship is used for regulatorycompliance.
2.9 The impact of waiver clause and the likelihood of high and low uptake of waiver by flagStates were studied. The results are documented in Appendix 1; showing that as it stands now,most of Flag States may not use the waiver option, and if they do it would likely be on a ship-by-ship basis, and therefore the waiver option uptake will be low. This view is based onconsideration of declared positions at date of Study by Flag States and shipping industryrepresentative bodies, and consideration of both cost of compliance and cost of non-compliance.
EEDI and ship technologies
2.10 Technologies which are available to significantly improve energy efficiency in the short,medium and long-term include (see also Table 2):
3 According to Regulation 21.6, IMO is committed to review the EEDI-related regulations at the beginning of Phase 1and midpoint of Phase 2 in order to decide if there is a need for changes to any aspect of EEDI Regulations.

8/10/2019 EEDI AND SEEMP.pdf
http://slidepdf.com/reader/full/eedi-and-seemppdf 14/62
MEPC 63/INF.2 Annex, page 14
L:\LED\INF\PRESS\2011\EEDI study presentation\REPORT ASSESSMENT OF IMO MANDATED ENERGYEFFICIENCY MEASURES FOR INTERNATIONAL SHIPPING.doc
Ship capacity enhancemento Larger shipso Purposely designed ships for specific routes/cargo mixerso Multi-purpose ships (combination carriers) to avoid ballast (empty) legs
o Use of light weight construction materials;o Zero or minimum ballast configurations;
Hull and propellero Hull optimisation for less resistance and improved sea margins.o Advanced underwater hull coatings and monitoring.o More hydro-dynamically efficient aft-ship, propeller and rudder arrangements.o Reduced air drag through improved aerodynamics of hull and superstructure.o Hull air lubrication systems.
Engines, waste heat recovery and propulsion systemo More efficient main and auxiliary engines (de-rating, electronic control, long-
stroke, variable geometry turbocharger, etc.);o Waste heat recovery and ship‘s thermal energy integr ation;o Fuel cell and hybrid electric technologies
Alternative fuelso LNGo Nuclear
Alternative sources of energyo Solar panelso Wind power such as kites, sails and flettner rotors
2.11 Table 2 shows the list of technologies that is expected to be used for reducing futureship‘s EEDI.
No. EEDI reduction measure Remark
1 Optimised hull dimensions and form Ship design for efficiency via choice of main dimensions(port and canal restrictions) and hull forms.
2 Lightweight construction New lightweight ship construction material.3 Hull coating Use of advanced hull coatings/paints.4 Hull air lubrication system Air cavity via injection of air under/around the hull to reduce
wet surface and thereby ship resistance.5 Optimisation of propeller-hull interface
and flow devicesPropeller-hull-rudder design optimisation plus relevantchanges to ship‘s aft body.
6 Contra-rotating propeller Two propellers in series; rotating at different direction.7 Engine efficiency improvement De-rating, long-stroke, electronic injection, variable geometry
turbocharging, etc.8 Waste heat recovery Main and auxiliary engines‘ exhaust gas waste heat recovery
and conversion to electric power.9 Gas fuelled (LNG) Natural gas fuel and dual fuel engines.
10 Hybrid electric power and propulsionconcepts
For some ships, the use of electric or hybrid would be moreefficient.
11 Reducing on-board power demand(auxiliary system and hotel loads).
Maximum heat recovery and minimising required electricalloads flexible power solutions and power management.
12 Variable speed drive for pumps, fans,etc.
Use of variable speed electric motors for control of rotatingflow machinery leads to significant reduction in their energy
use.13 Wind power (sail, wind engine, etc.) Sails, fletnner rotor, kites, etc. These are considered asemerging technologies.
14 Solar power Solar photovoltaic cells.

8/10/2019 EEDI AND SEEMP.pdf
http://slidepdf.com/reader/full/eedi-and-seemppdf 15/62
MEPC 63/INF.2 Annex, page 15
L:\LED\INF\PRESS\2011\EEDI study presentation\REPORT ASSESSMENT OF IMO MANDATED ENERGYEFFICIENCY MEASURES FOR INTERNATIONAL SHIPPING.doc
15 Design speed reduction (new builds) Reducing design speed via choice of lower power or de-rated engines.
Table 2 – Technologies for EEDI reduction
2.12 The above technologies are further classified into groups and their likely application to
various ship types and ship sizes are investigated. Appendix 2 shows the results of thisinvestigation for some ship types and sizes (―average ship‖ in each class size). Accordingly, it isanticipated that for phases 0 and 1 (by 2020), and for an ―average ship‖ in the class, EEDIcompliance will be achieved mainly via hull, propeller and main engine optimisation (paint, hullform, propeller and aft body design improvements, engine optimisation and de-rating, etc.).Beyond 2020 (phases 2 and 3), the uptake of new technologies and some design speedreduction are foreseen for compliance with EEDI.
3 SEEMP APPLICATION ASPECTS
3.1 For SEEMP, it is assumed that all existing and new ships above 400 GT will have a
SEEMP on board from the first renewal/intermediate survey of the IAPP certificate after 1st
January 2013. In this Study, all these ships are included in the SEEMP calculation.
SEEMP and operational measures
3.2 The potential savings from operational measures are significant and go beyond ship-board energy management and speed reductions. New modes of co-operation between cargoowners, charterers and shipowners, as well as port-related issues also contribute. In addition,better fleet planning, large-scale improvements of vessel utilisation, and minimising non-productive ballast voyages are possible through further consolidations in the industry both onthe liner and charter side. As such, operational measures to reduce the fuel consumption andCO2 emissions can be considered in three categories:
Enhanced technical and operational management : Measures include enhancedweather routing; optimized trim and ballasting; hull and propeller cleaning; bettermain and auxiliary engine maintenance and tuning; enhanced voyage executionand performance measurement, monitoring and reporting; efficient operation oflarger electrical consumers; and deployment of cost effective propulsion, enginesand auxiliary technology upgrades;
Enhanced logistics and fleet planning : Measures include combining cargoes toachieve a higher utilisation rate, use of combination carriers ‘, optimisation oflogistic chains, enhanced routeing, fewer/shorter ballast legs; larger cargobatches; adjustments for optimised arrival times and slower steaming – andchanged contract formats between charterer and shipowner; and
Port related : Removing restrictions on ship size (e.g. ship draft, length and beam,congestion), and limitations on quick port turn-around. Implementation requiresinfrastructure development and virtual arrival support. Measures can include,typically: larger port capacity; fewer restrictions on ship draft, beam or length;24/7 port operation; quicker loading and discharging; flexible design of cargohandling equipment; and more efficient port clearance and slot time allocation.
3.3 A SEEMP is expected to lead to primarily enhanced technical and operationalmanagement (first bullet above). Logistics and port-related energy efficiency measures are also
influenced by a SEEMP but to a second degree as these measures involve many stakeholdersand are more complicated to implement.
8/10/2019 EEDI AND SEEMP.pdf
http://slidepdf.com/reader/full/eedi-and-seemppdf 16/62
MEPC 63/INF.2 Annex, page 16
L:\LED\INF\PRESS\2011\EEDI study presentation\REPORT ASSESSMENT OF IMO MANDATED ENERGYEFFICIENCY MEASURES FOR INTERNATIONAL SHIPPING.doc
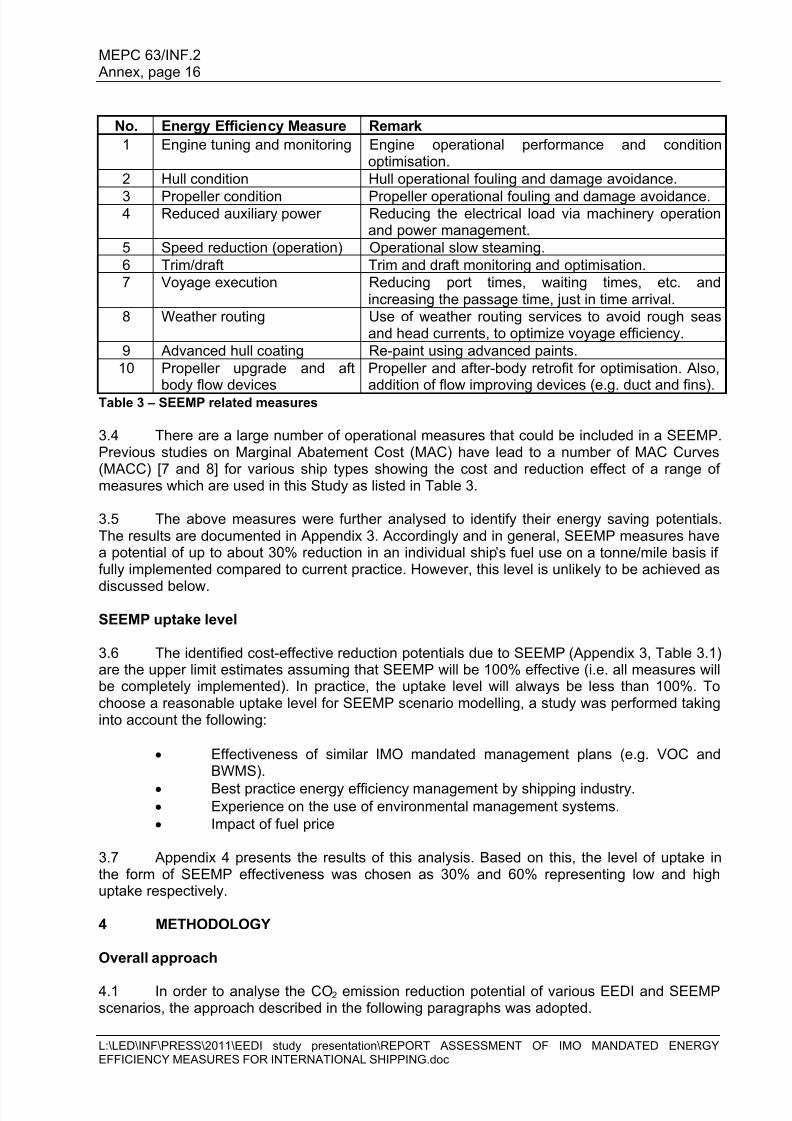
No. Energy Efficiency Measure Remark
1 Engine tuning and monitoring Engine operational performance and conditionoptimisation.
2 Hull condition Hull operational fouling and damage avoidance.
3 Propeller condition Propeller operational fouling and damage avoidance.4 Reduced auxiliary power Reducing the electrical load via machinery operation
and power management.5 Speed reduction (operation) Operational slow steaming.6 Trim/draft Trim and draft monitoring and optimisation.7 Voyage execution Reducing port times, waiting times, etc. and
increasing the passage time, just in time arrival.8 Weather routing Use of weather routing services to avoid rough seas
and head currents, to optimize voyage efficiency.9 Advanced hull coating Re-paint using advanced paints.10 Propeller upgrade and aft
body flow devicesPropeller and after-body retrofit for optimisation. Also,addition of flow improving devices (e.g. duct and fins).
Table 3 – SEEMP related measures
3.4 There are a large number of operational measures that could be included in a SEEMP.Previous studies on Marginal Abatement Cost (MAC) have lead to a number of MAC Curves(MACC) [7 and 8] for various ship types showing the cost and reduction effect of a range ofmeasures which are used in this Study as listed in Table 3.
3.5 The above measures were further analysed to identify their energy saving potentials.The results are documented in Appendix 3. Accordingly and in general, SEEMP measures havea potential of up to about 30% reduction in an individual ship‘s fuel use on a tonne/mile basis iffully implemented compared to current practice. However, this level is unlikely to be achieved as
discussed below.
SEEMP uptake level
3.6 The identified cost-effective reduction potentials due to SEEMP (Appendix 3, Table 3.1)are the upper limit estimates assuming that SEEMP will be 100% effective (i.e. all measures willbe completely implemented). In practice, the uptake level will always be less than 100%. Tochoose a reasonable uptake level for SEEMP scenario modelling, a study was performed takinginto account the following:
Effectiveness of similar IMO mandated management plans (e.g. VOC andBWMS).
Best practice energy efficiency management by shipping industry. Experience on the use of environmental management systems. Impact of fuel price
3.7 Appendix 4 presents the results of this analysis. Based on this, the level of uptake inthe form of SEEMP effectiveness was chosen as 30% and 60% representing low and highuptake respectively.
4 METHODOLOGY
Overall approach
4.1 In order to analyse the CO2 emission reduction potential of various EEDI and SEEMPscenarios, the approach described in the following paragraphs was adopted.
8/10/2019 EEDI AND SEEMP.pdf
http://slidepdf.com/reader/full/eedi-and-seemppdf 17/62
MEPC 63/INF.2 Annex, page 17
L:\LED\INF\PRESS\2011\EEDI study presentation\REPORT ASSESSMENT OF IMO MANDATED ENERGYEFFICIENCY MEASURES FOR INTERNATIONAL SHIPPING.doc
4.2 Scenario planning is commonly used to evaluate an uncertain future. In this study,scenarios were used to provide possible fleet and emission growth trajectories to 2050 uponwhich different projections for the impact of the EEDI on new ships and impact of SEEMP on allships could be overlaid.
Fleet growth scenarios
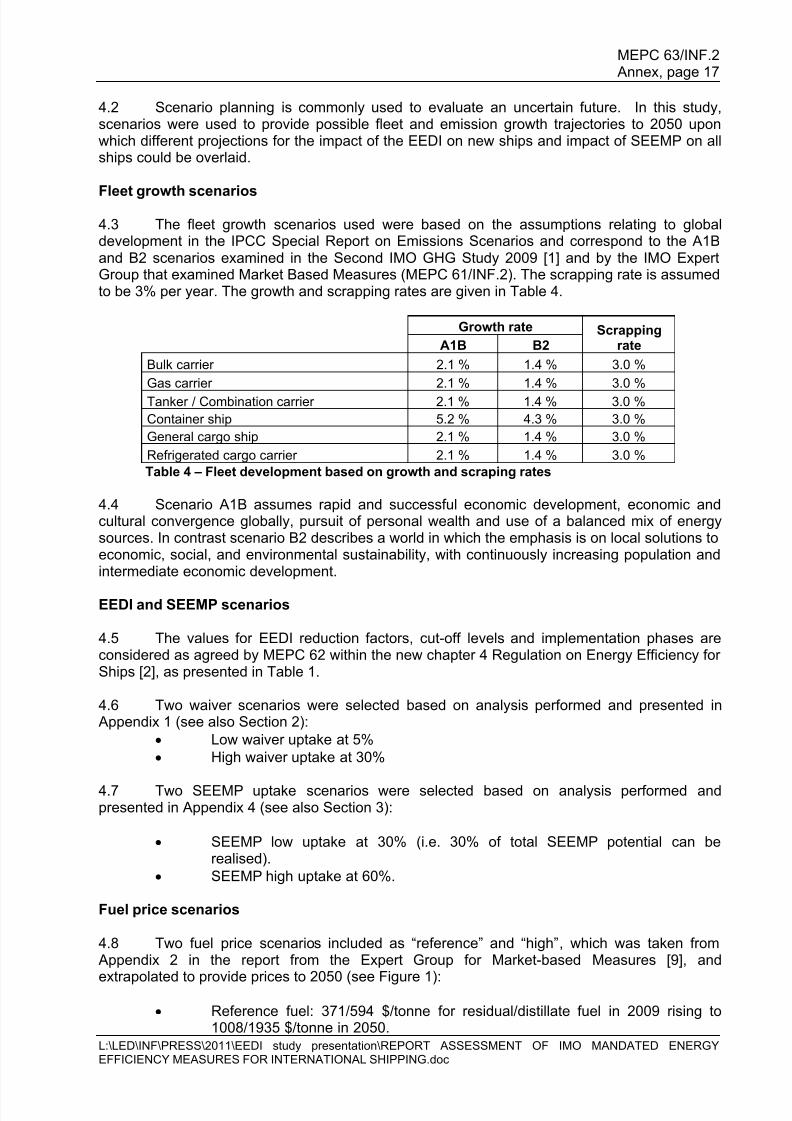
4.3 The fleet growth scenarios used were based on the assumptions relating to globaldevelopment in the IPCC Special Report on Emissions Scenarios and correspond to the A1Band B2 scenarios examined in the Second IMO GHG Study 2009 [1] and by the IMO ExpertGroup that examined Market Based Measures (MEPC 61/INF.2). The scrapping rate is assumedto be 3% per year. The growth and scrapping rates are given in Table 4.
Growth rate ScrappingrateA1B B2
Bulk carrier 2.1 % 1.4 % 3.0 %
Gas carrier 2.1 % 1.4 % 3.0 %
Tanker / Combination carrier 2.1 % 1.4 % 3.0 %
Container ship 5.2 % 4.3 % 3.0 %
General cargo ship 2.1 % 1.4 % 3.0 %
Refrigerated cargo carrier 2.1 % 1.4 % 3.0 %
Table 4 – Fleet development based on growth and scraping rates
4.4 Scenario A1B assumes rapid and successful economic development, economic andcultural convergence globally, pursuit of personal wealth and use of a balanced mix of energysources. In contrast scenario B2 describes a world in which the emphasis is on local solutions toeconomic, social, and environmental sustainability, with continuously increasing population andintermediate economic development.
EEDI and SEEMP scenarios
4.5 The values for EEDI reduction factors, cut-off levels and implementation phases areconsidered as agreed by MEPC 62 within the new chapter 4 Regulation on Energy Efficiency forShips [2], as presented in Table 1.
4.6 Two waiver scenarios were selected based on analysis performed and presented in Appendix 1 (see also Section 2):
Low waiver uptake at 5% High waiver uptake at 30%
4.7 Two SEEMP uptake scenarios were selected based on analysis performed andpresented in Appendix 4 (see also Section 3):
SEEMP low uptake at 30% (i.e. 30% of total SEEMP potential can berealised).
SEEMP high uptake at 60%.
Fuel price scenarios
4.8 Two fuel price scenarios included as ―reference‖ and ―high‖, which was taken from Appendix 2 in the report from the Expert Group for Market-based Measures [9], and
extrapolated to provide prices to 2050 (see Figure 1):
Reference fuel: 371/594 $/tonne for residual/distillate fuel in 2009 rising to1008/1935 $/tonne in 2050.

8/10/2019 EEDI AND SEEMP.pdf
http://slidepdf.com/reader/full/eedi-and-seemppdf 18/62
MEPC 63/INF.2 Annex, page 18
L:\LED\INF\PRESS\2011\EEDI study presentation\REPORT ASSESSMENT OF IMO MANDATED ENERGYEFFICIENCY MEASURES FOR INTERNATIONAL SHIPPING.doc
High: 371/594 $/tonne for residual/distillate fuel in 2009 rising to 1416/2719$/tonne in 2050.
Figure 1 – Fuel price scenarios. The sharp increase in distillate fuel in 2020 is due to the 0.5%global sulphur requirement
4.9 The split between heavy fuel oil (HFO) and marine distillate (MGO) are taken asfollows:
80% HFO and 20% MGO from 2013 to 2019, and
20% HFO and 80% MGO from 2020 and onwards.
Overview of scenarios modelled
4.10 Table 5 shows the combined scenarios modelled in this Study.
Scenario IPCC growthscenario
EEDIUptake
scenario
SEEMPuptake
Fuelprice
scenarios
Waiverscenario
A1B-1 A1B Regulation Low* Reference 5% A1B-2 A1B Regulation Low High 5% A1B-3 A1B Regulation High** Reference 5%
A1B-4 A1B Regulation High High 5% B2-1 B2 Regulation Low Reference 5% B2-2 B2 Regulation Low High 5% B2-3 B2 Regulation High Reference 5% B2-4 B2 Regulation High High 5%
A1B-3W A1B Regulation High Reference 30%* 30% ** 60%
Table 5 – Combined scenarios
Simulation model
4.11 A simulation model, designed specifically to account for the uptake of emission
reduction technologies and measures and the implementation of regulations to controlemissions, has been used to predict likely CO2 emission levels to 2050. This model has beenapplied in several previous studies [10-12].
8/10/2019 EEDI AND SEEMP.pdf
http://slidepdf.com/reader/full/eedi-and-seemppdf 19/62
MEPC 63/INF.2 Annex, page 19
L:\LED\INF\PRESS\2011\EEDI study presentation\REPORT ASSESSMENT OF IMO MANDATED ENERGYEFFICIENCY MEASURES FOR INTERNATIONAL SHIPPING.doc
4.12 The model calculates emissions as a function of installed power to reflect the size andtransport capacity of the fleet, assuming that, if no reduction measures are applied, the sameamount of energy per tonne-mile and emission per energy produced will apply as determined inthe base year (start of 2010). The future fleet emissions are constructed using fleet growth ratesand scrapping rates to find an annual installed power of the fleet, and then applying activity
level; specific emission levels and emission reduction factors to produce the modelled emissionsfor a given year.
4.13 The model keeps track of the year of build for all ships, and scraps the oldest and leastenergy-efficient ships first. By including the scrapping rate, the renewal rate of the fleet is takeninto account. A high scrapping rate will ensure a faster uptake of new technologies.
Fleet baseline and development
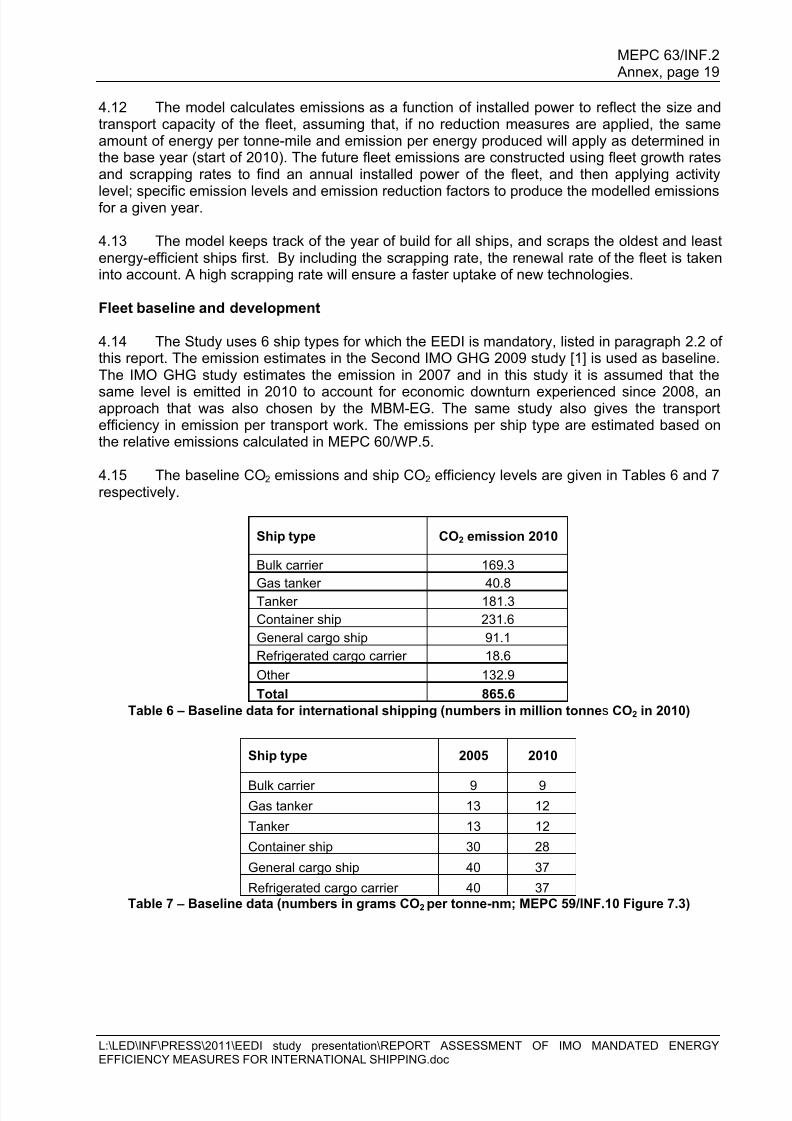
4.14 The Study uses 6 ship types for which the EEDI is mandatory, listed in paragraph 2.2 ofthis report. The emission estimates in the Second IMO GHG 2009 study [1] is used as baseline.The IMO GHG study estimates the emission in 2007 and in this study it is assumed that the
same level is emitted in 2010 to account for economic downturn experienced since 2008, anapproach that was also chosen by the MBM-EG. The same study also gives the transportefficiency in emission per transport work. The emissions per ship type are estimated based onthe relative emissions calculated in MEPC 60/WP.5.
4.15 The baseline CO2 emissions and ship CO2 efficiency levels are given in Tables 6 and 7respectively.
Ship type CO2 emission 2010
Bulk carrier 169.3
Gas tanker 40.8Tanker 181.3
Container ship 231.6
General cargo ship 91.1
Refrigerated cargo carrier 18.6
Other 132.9
Total 865.6
Table 6 – Baseline data for international shipping (numbers in million tonnes CO2 in 2010)
Ship type 2005 2010
Bulk carrier 9 9Gas tanker 13 12
Tanker 13 12
Container ship 30 28
General cargo ship 40 37
Refrigerated cargo carrier 40 37Table 7 – Baseline data (numbers in grams CO2 per tonne-nm; MEPC 59/INF.10 Figure 7.3)
8/10/2019 EEDI AND SEEMP.pdf
http://slidepdf.com/reader/full/eedi-and-seemppdf 20/62
MEPC 63/INF.2 Annex, page 20
L:\LED\INF\PRESS\2011\EEDI study presentation\REPORT ASSESSMENT OF IMO MANDATED ENERGYEFFICIENCY MEASURES FOR INTERNATIONAL SHIPPING.doc
Method of inclusion of EEDI reduction factor
4.16 A methodology has been developed to determine the impact of future EEDI regulatorylimits on the global fleet of merchant ships. This Study assumes that the impact of a given EEDIlimit will depend on the level of spread (expressed by the standard deviation) of EEDI values for
the current fleet reference line. Different ship types have different spread: Bulk carriersgenerally are fairly uniform vessels and the standard deviation of individual ships compared withthe regression line is low. For Tankers, Container ships and, in particular, General Cargo ships,the spread is more significant. A detailed description of the methodology is given in Appendix 5.
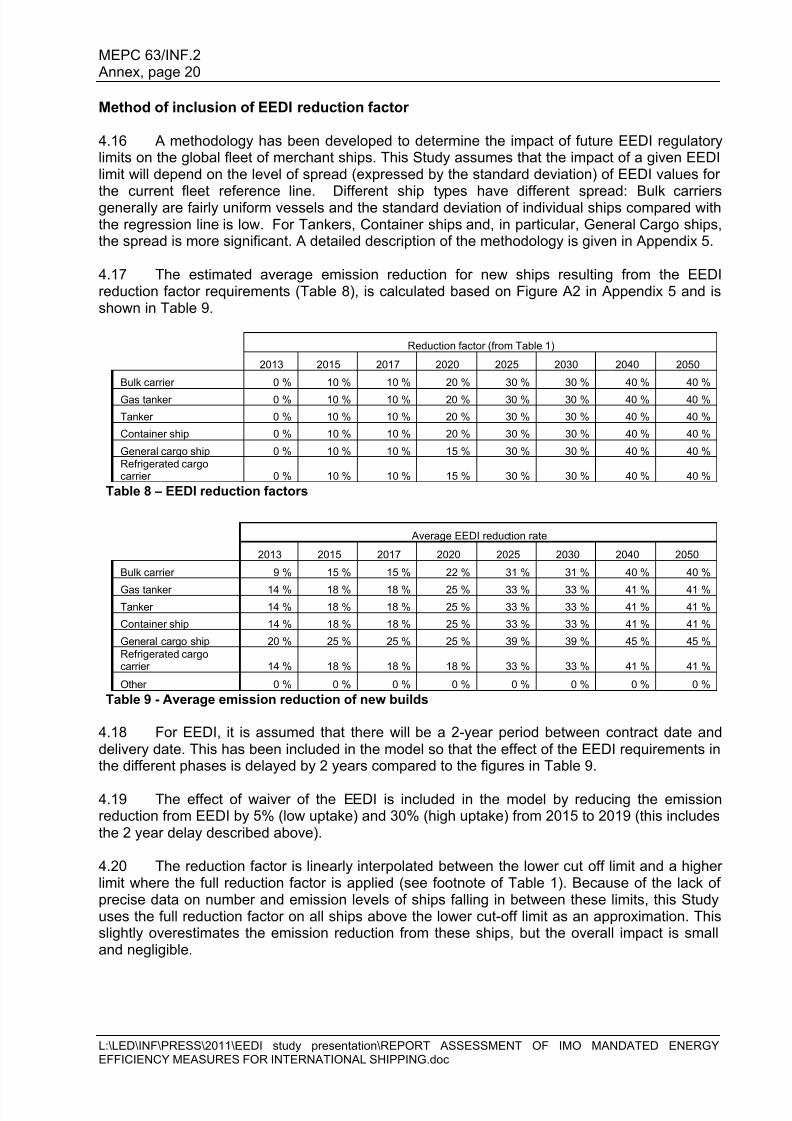
4.17 The estimated average emission reduction for new ships resulting from the EEDIreduction factor requirements (Table 8), is calculated based on Figure A2 in Appendix 5 and isshown in Table 9.
Reduction factor (from Table 1)
2013 2015 2017 2020 2025 2030 2040 2050
Bulk carrier 0 % 10 % 10 % 20 % 30 % 30 % 40 % 40 %
Gas tanker 0 % 10 % 10 % 20 % 30 % 30 % 40 % 40 %
Tanker 0 % 10 % 10 % 20 % 30 % 30 % 40 % 40 %
Container ship 0 % 10 % 10 % 20 % 30 % 30 % 40 % 40 %
General cargo ship 0 % 10 % 10 % 15 % 30 % 30 % 40 % 40 %Refrigerated cargocarrier 0 % 10 % 10 % 15 % 30 % 30 % 40 % 40 %
Table 8 – EEDI reduction factors
Average EEDI reduction rate
2013 2015 2017 2020 2025 2030 2040 2050
Bulk carrier 9 % 15 % 15 % 22 % 31 % 31 % 40 % 40 %
Gas tanker 14 % 18 % 18 % 25 % 33 % 33 % 41 % 41 %Tanker 14 % 18 % 18 % 25 % 33 % 33 % 41 % 41 %
Container ship 14 % 18 % 18 % 25 % 33 % 33 % 41 % 41 %
General cargo ship 20 % 25 % 25 % 25 % 39 % 39 % 45 % 45 %Refrigerated cargocarrier 14 % 18 % 18 % 18 % 33 % 33 % 41 % 41 %
Other 0 % 0 % 0 % 0 % 0 % 0 % 0 % 0 %
Table 9 - Average emission reduction of new builds
4.18 For EEDI, it is assumed that there will be a 2-year period between contract date anddelivery date. This has been included in the model so that the effect of the EEDI requirements inthe different phases is delayed by 2 years compared to the figures in Table 9.
4.19 The effect of waiver of the EEDI is included in the model by reducing the emissionreduction from EEDI by 5% (low uptake) and 30% (high uptake) from 2015 to 2019 (this includesthe 2 year delay described above).
4.20 The reduction factor is linearly interpolated between the lower cut off limit and a higherlimit where the full reduction factor is applied (see footnote of Table 1). Because of the lack ofprecise data on number and emission levels of ships falling in between these limits, this Studyuses the full reduction factor on all ships above the lower cut-off limit as an approximation. Thisslightly overestimates the emission reduction from these ships, but the overall impact is smalland negligible.
8/10/2019 EEDI AND SEEMP.pdf
http://slidepdf.com/reader/full/eedi-and-seemppdf 21/62
MEPC 63/INF.2 Annex, page 21
L:\LED\INF\PRESS\2011\EEDI study presentation\REPORT ASSESSMENT OF IMO MANDATED ENERGYEFFICIENCY MEASURES FOR INTERNATIONAL SHIPPING.doc
Method of inclusion of SEEMP reduction potentials
4.21 The potential of operational and technology upgrade measures to contribute to CO2 emission reduction over the years to 2050 was assessed using the procedure as explained inSection 3.
4.22 The Study uses the assumption that only cost-effective measures will be implementedas a consequence of a mandatory SEEMP. The SEEMP only works as a catalyst and increasesthe awareness in the industry of potential measures. The methodology used to calculate cost-effectiveness is given in [12]. Two scenarios on fuel prices give a range of cost-effectivemeasures.
4.23 Uptake of operational measures (change in operational procedures) are impacted by arange of factors including non-financial barriers for implementation such as split incentives anddelivery capacity. However, there is a correlation between high uptake and high fuel prices, asthe financial gain will help to overcome the barriers. Thus, the high fuel price/high uptake andreference fuel price/low uptake are the two most likely scenarios.
4.24 A number of individual operational and retrofit measures were included in the modelwith cost and reduction potential (Appendix 3). In addition, a generic EEDI reduction measurewas added to represent the general increase in energy efficiency by reduced EEDI on newbuilds. This approach ensures that the effect of combining measures is taken into account. Thedesign improvements implemented to lower the EEDI to the required level will make theabsolute reduction from an operational measure lower compared to a previous design – even ifthe relative reduction is the same. For a detailed description of the methodology see [7] and[12].
4.25 Table 3.1 in Appendix 3 shows the potential emission reduction relative to the baseline(i.e. without taking into account any reduction by the EEDI). These numbers are used in the
model and Table 3.2 in Appendix 3 shows the results, with SEEMP emission reduction per shiptype and scenario relative to the emission level after deducting the emission reduction causedby the EEDI, and taking into account the uptake of SEEMP.
Method of calculation of fuel cost
4.26 The model projects the annual fuel consumption and CO2 emissions of the world fleetas described above. The fuel price scenarios contain the cost of fuel per year from 2010 to 2050(see Figure 1). The annual fuel cost and savings are calculated by multiplying the fuel price withthe annual fuel consumption and estimated savings.
5 RESULTS
Emission reduction to 2050
5.1 Results are presented throughout for two future IPCC growth scenario A1B andscenario B2. The results on EEDI relate to EEDI reference lines, reduction factors and cut offlevels from IMO Regulations on Energy Efficiency of Ships [2]. All the reported results hereinrelates to a waiver uptake of 5%, unless otherwise stated. Additionally, scenarios for fuel prices,SEEMP uptake and waiver uptake have been included as shown in Table 5.
5.2 Figures 2a and 2b show the CO2 reduction potential relative to Business As Usual(BAU) for various scenarios. Combination A1B-4 provides the highest annual reduction potential
(1,320 million tonnes CO2 in 2050) while combination B2-1 provides the lowest reductionpotential (706 million tonnes CO2 in 2050).
8/10/2019 EEDI AND SEEMP.pdf
http://slidepdf.com/reader/full/eedi-and-seemppdf 22/62
MEPC 63/INF.2 Annex, page 22
L:\LED\INF\PRESS\2011\EEDI study presentation\REPORT ASSESSMENT OF IMO MANDATED ENERGYEFFICIENCY MEASURES FOR INTERNATIONAL SHIPPING.doc
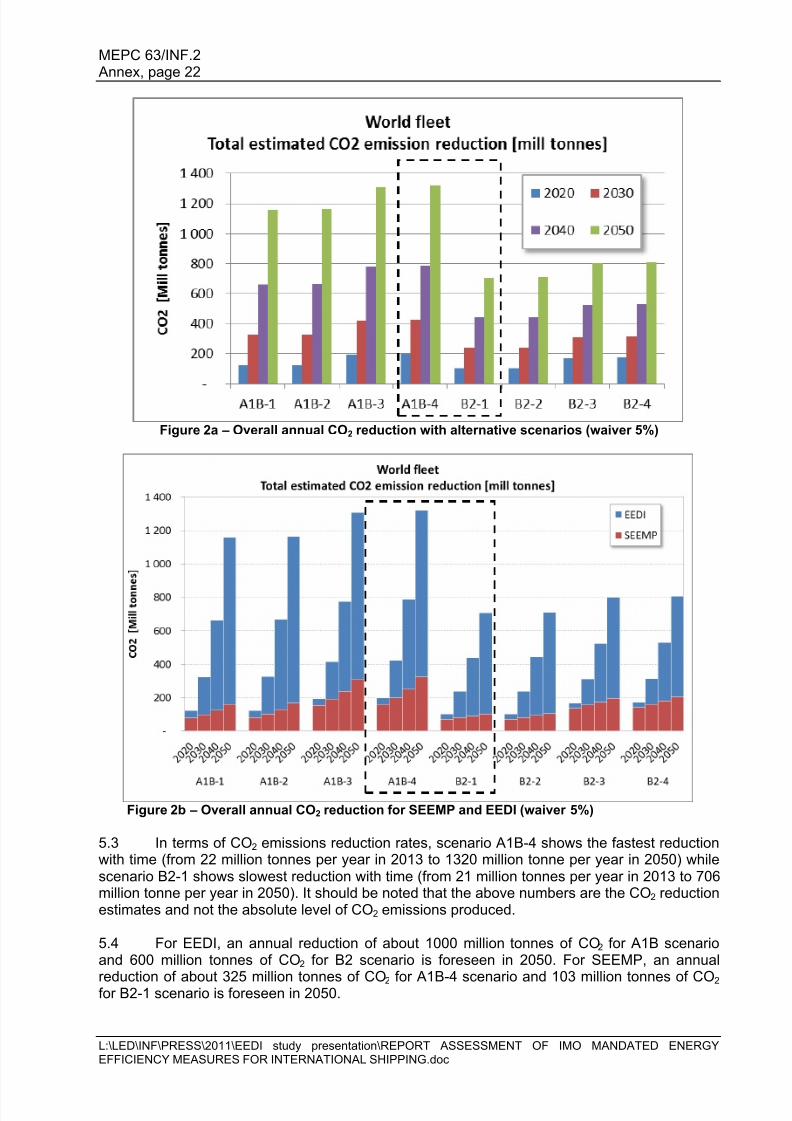
Figure 2a – Overall annual CO2 reduction with alternative scenarios (waiver 5%)
Figure 2b – Overall annual CO2 reduction for SEEMP and EEDI (waiver 5%)
5.3 In terms of CO2 emissions reduction rates, scenario A1B-4 shows the fastest reductionwith time (from 22 million tonnes per year in 2013 to 1320 million tonne per year in 2050) whilescenario B2-1 shows slowest reduction with time (from 21 million tonnes per year in 2013 to 706million tonne per year in 2050). It should be noted that the above numbers are the CO 2 reductionestimates and not the absolute level of CO2 emissions produced.
5.4 For EEDI, an annual reduction of about 1000 million tonnes of CO2 for A1B scenarioand 600 million tonnes of CO2 for B2 scenario is foreseen in 2050. For SEEMP, an annual
reduction of about 325 million tonnes of CO2 for A1B-4 scenario and 103 million tonnes of CO2 for B2-1 scenario is foreseen in 2050.
8/10/2019 EEDI AND SEEMP.pdf
http://slidepdf.com/reader/full/eedi-and-seemppdf 23/62
MEPC 63/INF.2 Annex, page 23
L:\LED\INF\PRESS\2011\EEDI study presentation\REPORT ASSESSMENT OF IMO MANDATED ENERGYEFFICIENCY MEASURES FOR INTERNATIONAL SHIPPING.doc
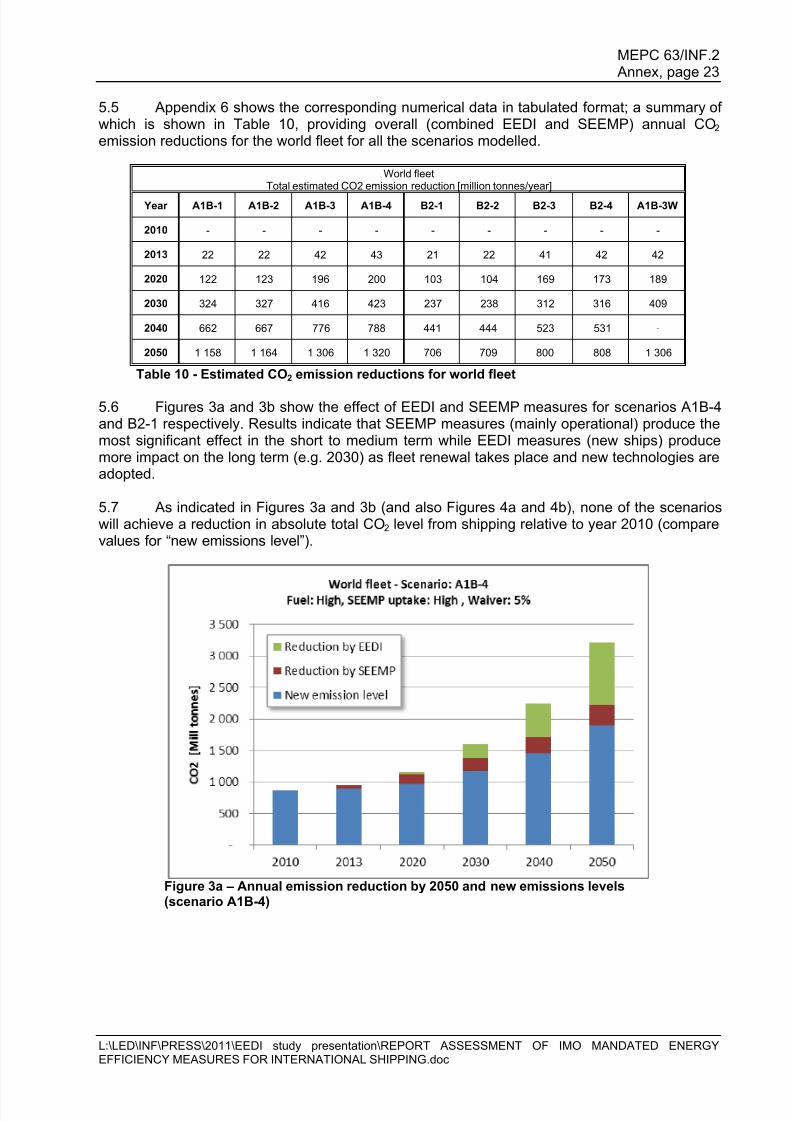
5.5 Appendix 6 shows the corresponding numerical data in tabulated format; a summary ofwhich is shown in Table 10, providing overall (combined EEDI and SEEMP) annual CO2 emission reductions for the world fleet for all the scenarios modelled.
World fleetTotal estimated CO2 emission reduction [million tonnes/year]
Year A1B-1 A1B-2 A1B-3 A1B-4 B2-1 B2-2 B2-3 B2-4 A1B-3W
2010 - - - - - - - - -
2013 22 22 42 43 21 22 41 42 42
2020 122 123 196 200 103 104 169 173 189
2030 324 327 416 423 237 238 312 316 409
2040 662 667 776 788 441 444 523 531 -
2050 1 158 1 164 1 306 1 320 706 709 800 808 1 306
Table 10 - Estimated CO2 emission reductions for world fleet
5.6 Figures 3a and 3b show the effect of EEDI and SEEMP measures for scenarios A1B-4and B2-1 respectively. Results indicate that SEEMP measures (mainly operational) produce themost significant effect in the short to medium term while EEDI measures (new ships) producemore impact on the long term (e.g. 2030) as fleet renewal takes place and new technologies areadopted.
5.7 As indicated in Figures 3a and 3b (and also Figures 4a and 4b), none of the scenarioswill achieve a reduction in absolute total CO2 level from shipping relative to year 2010 (comparevalues for ―new emissions level‖).
Figure 3a – Annual emission reduction by 2050 and new emissions levels(scenario A1B-4)

8/10/2019 EEDI AND SEEMP.pdf
http://slidepdf.com/reader/full/eedi-and-seemppdf 24/62
MEPC 63/INF.2 Annex, page 24
L:\LED\INF\PRESS\2011\EEDI study presentation\REPORT ASSESSMENT OF IMO MANDATED ENERGYEFFICIENCY MEASURES FOR INTERNATIONAL SHIPPING.doc
Figure 3b – Annual emission reduction by 2050 and new emissions levels (scenario B2-1)
Emission projections to 2050
5.8 Figures 4a and 4b demonstrate the reduction potential of EEDI and SEEMP forscenarios A1B-4 and B2-1 respectively. The upper side of the upper curve shows the BAU(Business as Usual). The underside of the lower curve on each figure represents the forecastoverall annual CO2 emission figures (new emission level). The difference between the twocurves shows the overall reduction due to the combined EEDI and SEEMP.
Figure 4a – World fleet CO2 level projections (A1B-4 scenario)
8/10/2019 EEDI AND SEEMP.pdf
http://slidepdf.com/reader/full/eedi-and-seemppdf 25/62
MEPC 63/INF.2 Annex, page 25
L:\LED\INF\PRESS\2011\EEDI study presentation\REPORT ASSESSMENT OF IMO MANDATED ENERGYEFFICIENCY MEASURES FOR INTERNATIONAL SHIPPING.doc
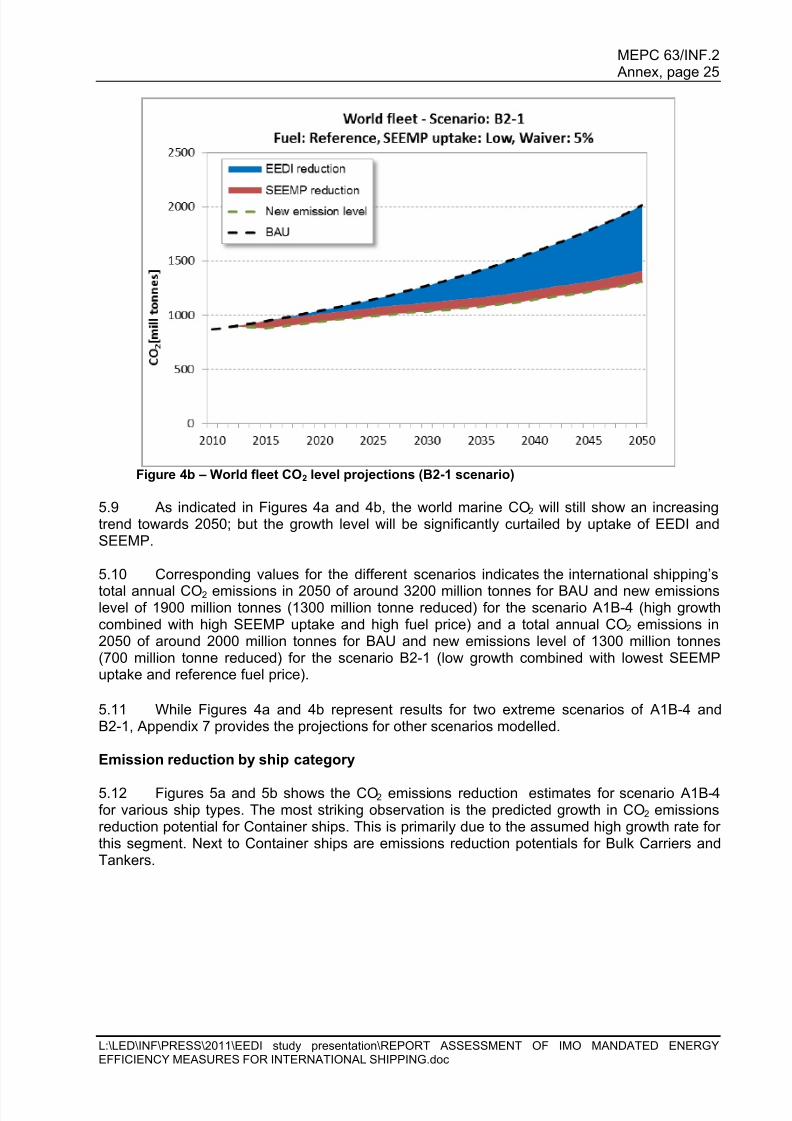
Figure 4b – World fleet CO2 level projections (B2-1 scenario)
5.9 As indicated in Figures 4a and 4b, the world marine CO2 will still show an increasingtrend towards 2050; but the growth level will be significantly curtailed by uptake of EEDI andSEEMP.
5.10 Corresponding values for the different scenarios indicates the international shipping‘s
total annual CO2 emissions in 2050 of around 3200 million tonnes for BAU and new emissionslevel of 1900 million tonnes (1300 million tonne reduced) for the scenario A1B-4 (high growthcombined with high SEEMP uptake and high fuel price) and a total annual CO2 emissions in2050 of around 2000 million tonnes for BAU and new emissions level of 1300 million tonnes(700 million tonne reduced) for the scenario B2-1 (low growth combined with lowest SEEMPuptake and reference fuel price).
5.11 While Figures 4a and 4b represent results for two extreme scenarios of A1B-4 andB2-1, Appendix 7 provides the projections for other scenarios modelled.
Emission reduction by ship category
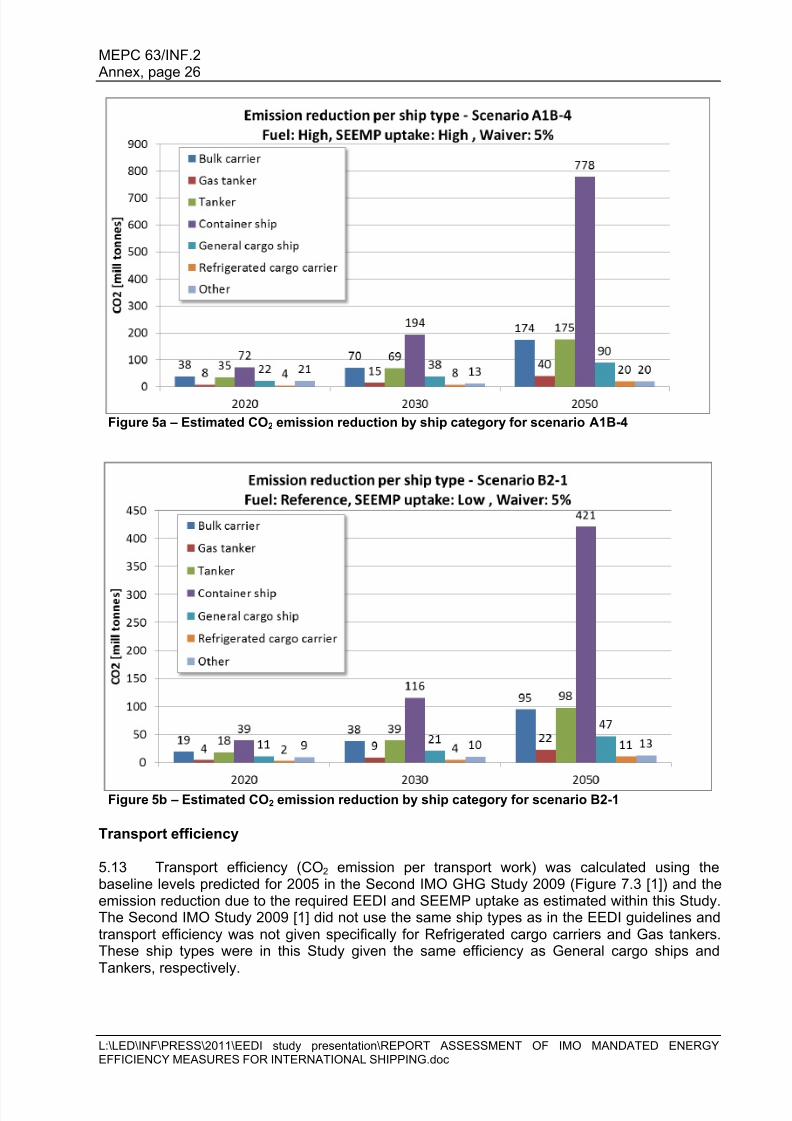
5.12 Figures 5a and 5b shows the CO2 emissions reduction estimates for scenario A1B-4for various ship types. The most striking observation is the predicted growth in CO2 emissionsreduction potential for Container ships. This is primarily due to the assumed high growth rate forthis segment. Next to Container ships are emissions reduction potentials for Bulk Carriers andTankers.
8/10/2019 EEDI AND SEEMP.pdf
http://slidepdf.com/reader/full/eedi-and-seemppdf 26/62
MEPC 63/INF.2 Annex, page 26
L:\LED\INF\PRESS\2011\EEDI study presentation\REPORT ASSESSMENT OF IMO MANDATED ENERGYEFFICIENCY MEASURES FOR INTERNATIONAL SHIPPING.doc
Figure 5a – Estimated CO2 emission reduction by ship category for scenario A1B-4
Figure 5b – Estimated CO2 emission reduction by ship category for scenario B2-1
Transport efficiency
5.13 Transport efficiency (CO2 emission per transport work) was calculated using thebaseline levels predicted for 2005 in the Second IMO GHG Study 2009 (Figure 7.3 [1]) and theemission reduction due to the required EEDI and SEEMP uptake as estimated within this Study.The Second IMO Study 2009 [1] did not use the same ship types as in the EEDI guidelines andtransport efficiency was not given specifically for Refrigerated cargo carriers and Gas tankers.These ship types were in this Study given the same efficiency as General cargo ships andTankers, respectively.

8/10/2019 EEDI AND SEEMP.pdf
http://slidepdf.com/reader/full/eedi-and-seemppdf 27/62
MEPC 63/INF.2 Annex, page 27
L:\LED\INF\PRESS\2011\EEDI study presentation\REPORT ASSESSMENT OF IMO MANDATED ENERGYEFFICIENCY MEASURES FOR INTERNATIONAL SHIPPING.doc
5.14 Figures 6a and 6b show the transport efficiency for world fleet for scenario A1B-4 andB2-1 respectively (Appendix 8 present transport efficiency for all the scenarios modelled). Whencalculating efficiency improvement the fleet growth is not relevant and the same efficiencyimprovement would be achieved i.e. in both A1B-1 and B2-1.
Figure 6a – World fleet CO2 transport efficiency trends (scenario A1B-4/B2-4)
Figure 6b – World fleet CO2 transport efficiency trends (scenario A1B-1/B2-1)
5.15 The transport efficiency will improve with the same rate as the emission reduction. Inaddition to Figures 6a and 6b, Table 11 provides the numeric transport efficiency developmentfor the different ship types under scenario B2-4 / A1B-4. As indicated, various vessels ‘ transportenergy efficiency nearly doubles and the emissions per cargo unit nearly halves from 2005 to2050.
8/10/2019 EEDI AND SEEMP.pdf
http://slidepdf.com/reader/full/eedi-and-seemppdf 28/62
MEPC 63/INF.2 Annex, page 28
L:\LED\INF\PRESS\2011\EEDI study presentation\REPORT ASSESSMENT OF IMO MANDATED ENERGYEFFICIENCY MEASURES FOR INTERNATIONAL SHIPPING.doc
Year Bulk carrier Gas tanker TankerContainer
shipGeneral
cargo shipRefrigeratedcargo carrier
2005 9 13 13 30 40 40
2010 9 12 12 28 37 37
2020 8 10 10 23 30 302030 7 9 9 20 27 27
2050 5 7 7 16 21 20Table 11 - Transport efficiency (g CO2 /tonne mile) improvement associated with the different ship
types using scenario B2-4/A1B-4
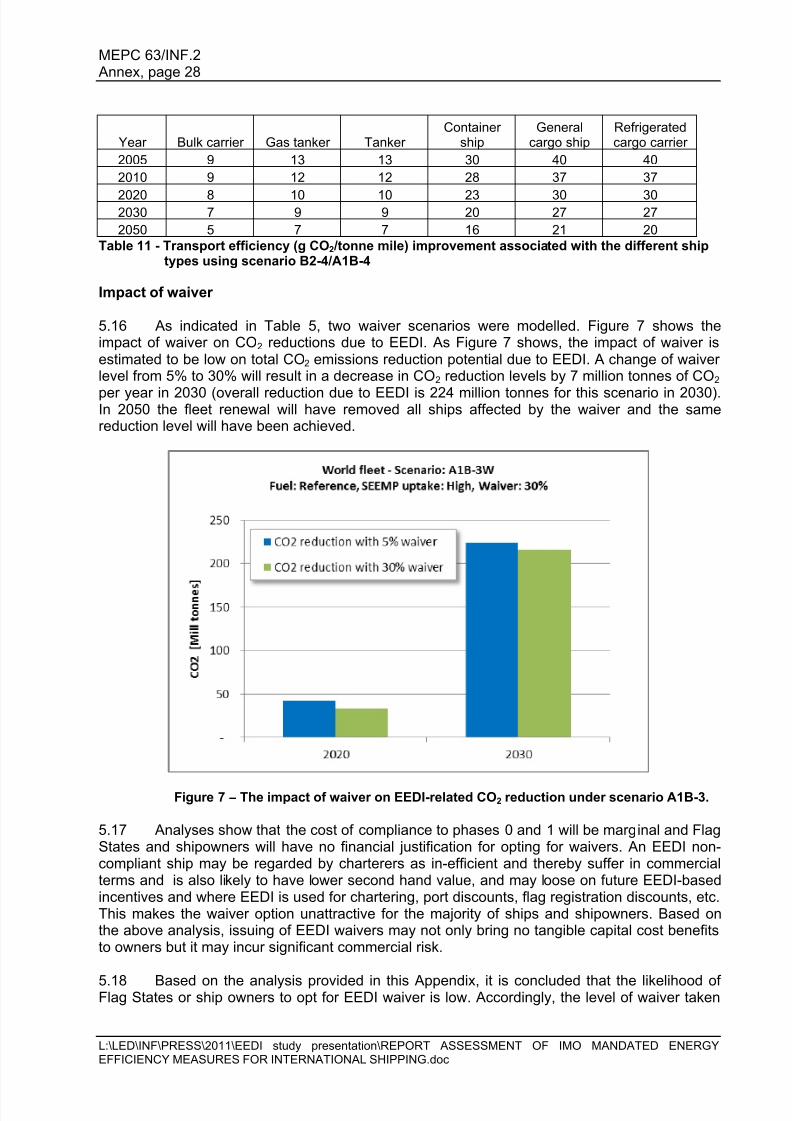
Impact of waiver
5.16 As indicated in Table 5, two waiver scenarios were modelled. Figure 7 shows theimpact of waiver on CO2 reductions due to EEDI. As Figure 7 shows, the impact of waiver isestimated to be low on total CO2 emissions reduction potential due to EEDI. A change of waiverlevel from 5% to 30% will result in a decrease in CO2 reduction levels by 7 million tonnes of CO2
per year in 2030 (overall reduction due to EEDI is 224 million tonnes for this scenario in 2030).In 2050 the fleet renewal will have removed all ships affected by the waiver and the samereduction level will have been achieved.
Figure 7 – The impact of waiver on EEDI-related CO2 reduction under scenario A1B-3.
5.17 Analyses show that the cost of compliance to phases 0 and 1 will be marginal and FlagStates and shipowners will have no financial justification for opting for waivers. An EEDI non-compliant ship may be regarded by charterers as in-efficient and thereby suffer in commercialterms and is also likely to have lower second hand value, and may loose on future EEDI-basedincentives and where EEDI is used for chartering, port discounts, flag registration discounts, etc.This makes the waiver option unattractive for the majority of ships and shipowners. Based onthe above analysis, issuing of EEDI waivers may not only bring no tangible capital cost benefitsto owners but it may incur significant commercial risk.
5.18 Based on the analysis provided in this Appendix, it is concluded that the likelihood ofFlag States or ship owners to opt for EEDI waiver is low. Accordingly, the level of waiver taken
8/10/2019 EEDI AND SEEMP.pdf
http://slidepdf.com/reader/full/eedi-and-seemppdf 29/62
MEPC 63/INF.2 Annex, page 29
L:\LED\INF\PRESS\2011\EEDI study presentation\REPORT ASSESSMENT OF IMO MANDATED ENERGYEFFICIENCY MEASURES FOR INTERNATIONAL SHIPPING.doc
in this study as 5% (low) and 30% (high) is regarded as reasonable. It is most likely that waiverwill be at the level of 5% as current indications imply.Impact of fuel price
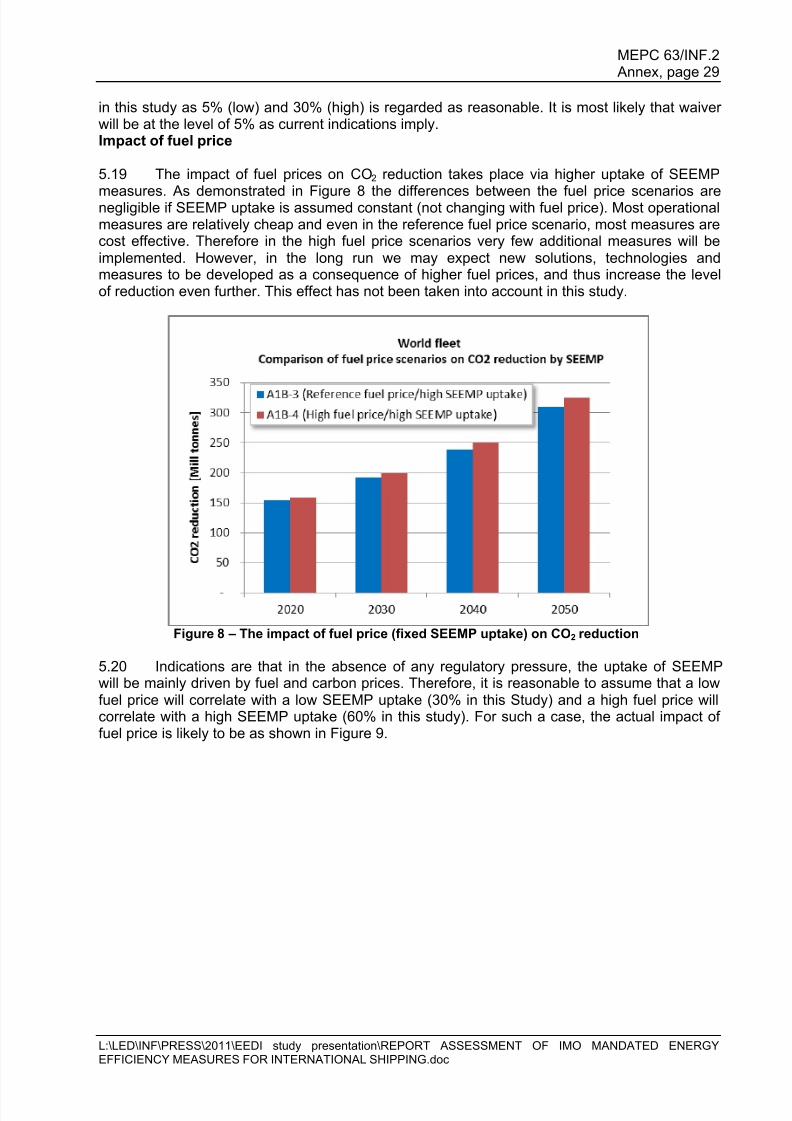
5.19 The impact of fuel prices on CO2 reduction takes place via higher uptake of SEEMP
measures. As demonstrated in Figure 8 the differences between the fuel price scenarios arenegligible if SEEMP uptake is assumed constant (not changing with fuel price). Most operationalmeasures are relatively cheap and even in the reference fuel price scenario, most measures arecost effective. Therefore in the high fuel price scenarios very few additional measures will beimplemented. However, in the long run we may expect new solutions, technologies andmeasures to be developed as a consequence of higher fuel prices, and thus increase the levelof reduction even further. This effect has not been taken into account in this study.
Figure 8 – The impact of fuel price (fixed SEEMP uptake) on CO2 reduction
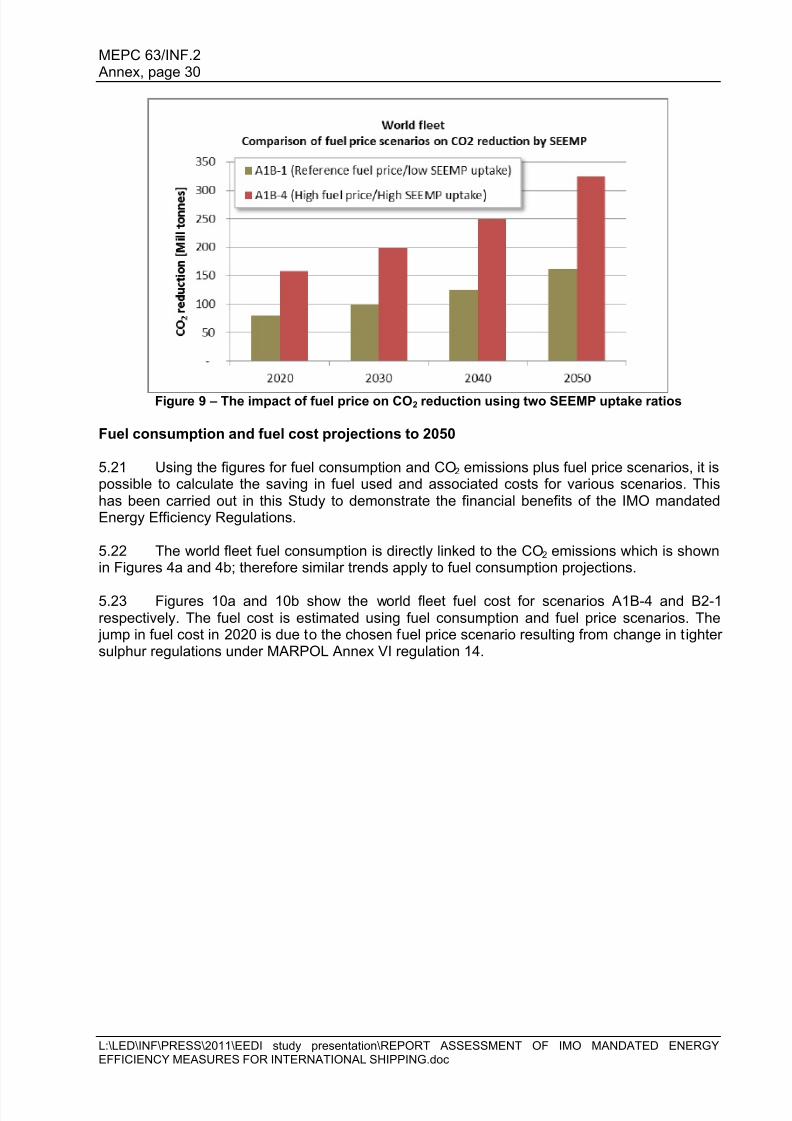
5.20 Indications are that in the absence of any regulatory pressure, the uptake of SEEMPwill be mainly driven by fuel and carbon prices. Therefore, it is reasonable to assume that a lowfuel price will correlate with a low SEEMP uptake (30% in this Study) and a high fuel price willcorrelate with a high SEEMP uptake (60% in this study). For such a case, the actual impact offuel price is likely to be as shown in Figure 9.
8/10/2019 EEDI AND SEEMP.pdf
http://slidepdf.com/reader/full/eedi-and-seemppdf 30/62
MEPC 63/INF.2 Annex, page 30
L:\LED\INF\PRESS\2011\EEDI study presentation\REPORT ASSESSMENT OF IMO MANDATED ENERGYEFFICIENCY MEASURES FOR INTERNATIONAL SHIPPING.doc
Figure 9 – The impact of fuel price on CO2 reduction using two SEEMP uptake ratios
Fuel consumption and fuel cost projections to 2050
5.21 Using the figures for fuel consumption and CO2 emissions plus fuel price scenarios, it ispossible to calculate the saving in fuel used and associated costs for various scenarios. Thishas been carried out in this Study to demonstrate the financial benefits of the IMO mandatedEnergy Efficiency Regulations.
5.22 The world fleet fuel consumption is directly linked to the CO2 emissions which is shownin Figures 4a and 4b; therefore similar trends apply to fuel consumption projections.
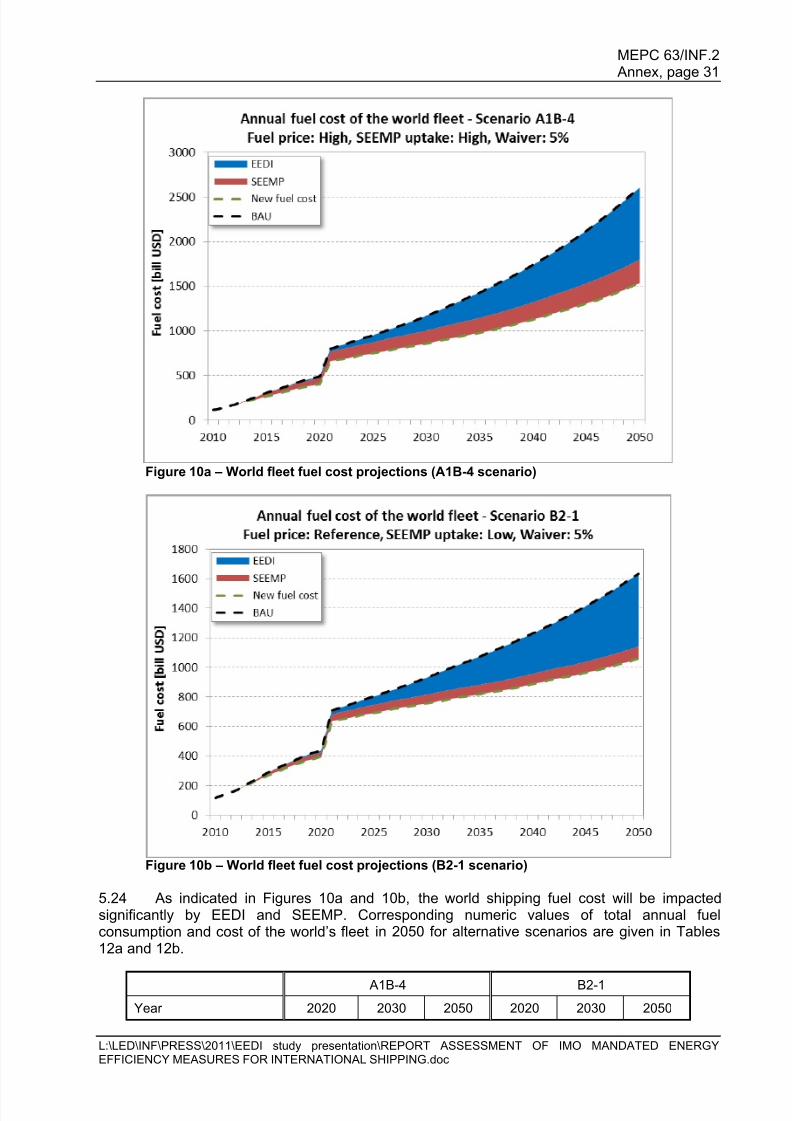
5.23 Figures 10a and 10b show the world fleet fuel cost for scenarios A1B-4 and B2-1respectively. The fuel cost is estimated using fuel consumption and fuel price scenarios. The jump in fuel cost in 2020 is due to the chosen fuel price scenario resulting from change in t ightersulphur regulations under MARPOL Annex VI regulation 14.
8/10/2019 EEDI AND SEEMP.pdf
http://slidepdf.com/reader/full/eedi-and-seemppdf 31/62
MEPC 63/INF.2 Annex, page 31
L:\LED\INF\PRESS\2011\EEDI study presentation\REPORT ASSESSMENT OF IMO MANDATED ENERGYEFFICIENCY MEASURES FOR INTERNATIONAL SHIPPING.doc
Figure 10a – World fleet fuel cost projections (A1B-4 scenario)
Figure 10b – World fleet fuel cost projections (B2-1 scenario)
5.24 As indicated in Figures 10a and 10b, the world shipping fuel cost will be impactedsignificantly by EEDI and SEEMP. Corresponding numeric values of total annual fuelconsumption and cost of the world‘s fleet in 2050 for alternative scenarios are given in Tables12a and 12b.
A1B-4 B2-1
Year 2020 2030 2050 2020 2030 2050

8/10/2019 EEDI AND SEEMP.pdf
http://slidepdf.com/reader/full/eedi-and-seemppdf 32/62
8/10/2019 EEDI AND SEEMP.pdf
http://slidepdf.com/reader/full/eedi-and-seemppdf 33/62
MEPC 63/INF.2 Annex, page 33
L:\LED\INF\PRESS\2011\EEDI study presentation\REPORT ASSESSMENT OF IMO MANDATED ENERGYEFFICIENCY MEASURES FOR INTERNATIONAL SHIPPING.doc
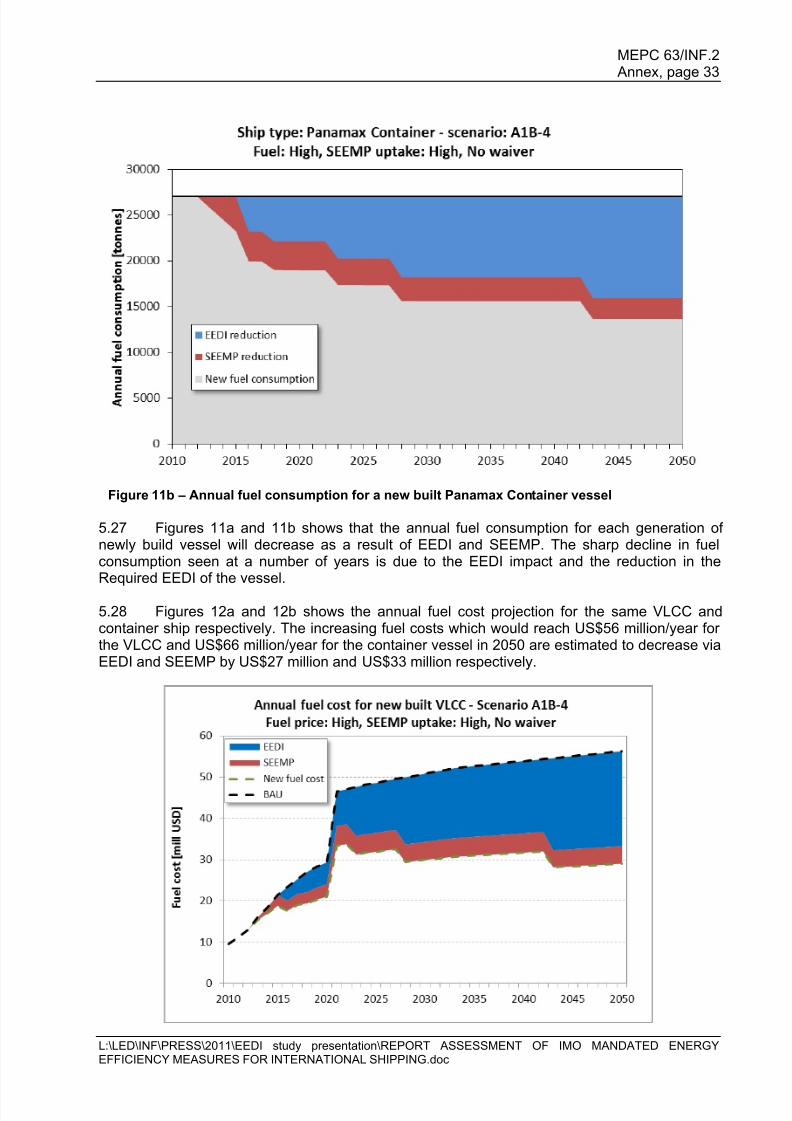
Figure 11b – Annual fuel consumption for a new built Panamax Container vessel
5.27 Figures 11a and 11b shows that the annual fuel consumption for each generation ofnewly build vessel will decrease as a result of EEDI and SEEMP. The sharp decline in fuelconsumption seen at a number of years is due to the EEDI impact and the reduction in theRequired EEDI of the vessel.
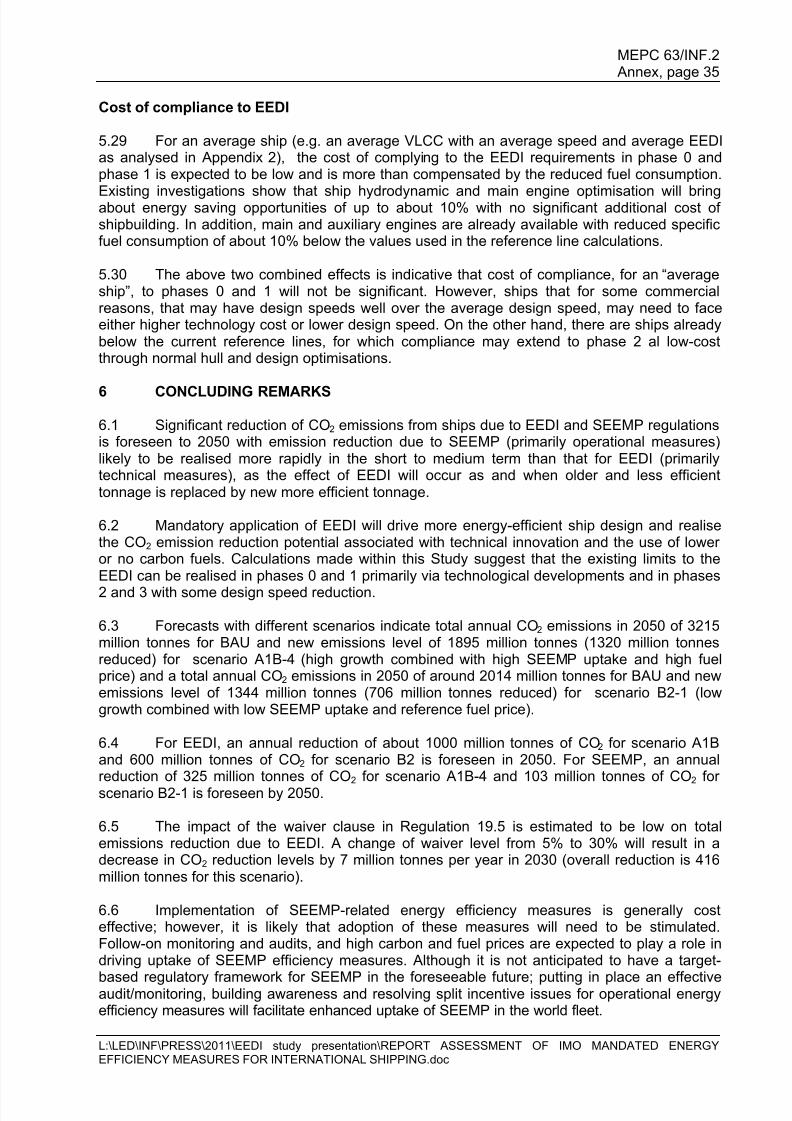
5.28 Figures 12a and 12b shows the annual fuel cost projection for the same VLCC andcontainer ship respectively. The increasing fuel costs which would reach US$56 million/year forthe VLCC and US$66 million/year for the container vessel in 2050 are estimated to decrease viaEEDI and SEEMP by US$27 million and US$33 million respectively.

8/10/2019 EEDI AND SEEMP.pdf
http://slidepdf.com/reader/full/eedi-and-seemppdf 34/62
8/10/2019 EEDI AND SEEMP.pdf
http://slidepdf.com/reader/full/eedi-and-seemppdf 35/62
MEPC 63/INF.2 Annex, page 35
L:\LED\INF\PRESS\2011\EEDI study presentation\REPORT ASSESSMENT OF IMO MANDATED ENERGYEFFICIENCY MEASURES FOR INTERNATIONAL SHIPPING.doc
Cost of compliance to EEDI
5.29 For an average ship (e.g. an average VLCC with an average speed and average EEDIas analysed in Appendix 2), the cost of complying to the EEDI requirements in phase 0 andphase 1 is expected to be low and is more than compensated by the reduced fuel consumption.
Existing investigations show that ship hydrodynamic and main engine optimisation will bringabout energy saving opportunities of up to about 10% with no significant additional cost ofshipbuilding. In addition, main and auxiliary engines are already available with reduced specificfuel consumption of about 10% below the values used in the reference line calculations.
5.30 The above two combined effects is indicative that cost of compliance, for an ―averageship‖, to phases 0 and 1 will not be significant. However, ships that for some commercialreasons, that may have design speeds well over the average design speed, may need to faceeither higher technology cost or lower design speed. On the other hand, there are ships alreadybelow the current reference lines, for which compliance may extend to phase 2 al low-costthrough normal hull and design optimisations.
6 CONCLUDING REMARKS
6.1 Significant reduction of CO2 emissions from ships due to EEDI and SEEMP regulationsis foreseen to 2050 with emission reduction due to SEEMP (primarily operational measures)likely to be realised more rapidly in the short to medium term than that for EEDI (primarilytechnical measures), as the effect of EEDI will occur as and when older and less efficienttonnage is replaced by new more efficient tonnage.
6.2 Mandatory application of EEDI will drive more energy-efficient ship design and realisethe CO2 emission reduction potential associated with technical innovation and the use of loweror no carbon fuels. Calculations made within this Study suggest that the existing limits to theEEDI can be realised in phases 0 and 1 primarily via technological developments and in phases
2 and 3 with some design speed reduction.
6.3 Forecasts with different scenarios indicate total annual CO2 emissions in 2050 of 3215million tonnes for BAU and new emissions level of 1895 million tonnes (1320 million tonnesreduced) for scenario A1B-4 (high growth combined with high SEEMP uptake and high fuelprice) and a total annual CO2 emissions in 2050 of around 2014 million tonnes for BAU and newemissions level of 1344 million tonnes (706 million tonnes reduced) for scenario B2-1 (lowgrowth combined with low SEEMP uptake and reference fuel price).
6.4 For EEDI, an annual reduction of about 1000 million tonnes of CO2 for scenario A1Band 600 million tonnes of CO2 for scenario B2 is foreseen in 2050. For SEEMP, an annualreduction of 325 million tonnes of CO2 for scenario A1B-4 and 103 million tonnes of CO2 forscenario B2-1 is foreseen by 2050.
6.5 The impact of the waiver clause in Regulation 19.5 is estimated to be low on totalemissions reduction due to EEDI. A change of waiver level from 5% to 30% will result in adecrease in CO2 reduction levels by 7 million tonnes per year in 2030 (overall reduction is 416million tonnes for this scenario).
6.6 Implementation of SEEMP-related energy efficiency measures is generally costeffective; however, it is likely that adoption of these measures will need to be stimulated.Follow-on monitoring and audits, and high carbon and fuel prices are expected to play a role indriving uptake of SEEMP efficiency measures. Although it is not anticipated to have a target-
based regulatory framework for SEEMP in the foreseeable future; putting in place an effectiveaudit/monitoring, building awareness and resolving split incentive issues for operational energyefficiency measures will facilitate enhanced uptake of SEEMP in the world fleet.
8/10/2019 EEDI AND SEEMP.pdf
http://slidepdf.com/reader/full/eedi-and-seemppdf 36/62
MEPC 63/INF.2 Annex, page 36
L:\LED\INF\PRESS\2011\EEDI study presentation\REPORT ASSESSMENT OF IMO MANDATED ENERGYEFFICIENCY MEASURES FOR INTERNATIONAL SHIPPING.doc
6.7 To make the application of SEEMP more effective and to prepare the shipping industryfor likely future carbon pricing via MBMs, it seems that use of EEOI (Energy EfficiencyOperational Indicator) or a similar performance indicator should be encouraged or mandated.This will involve more accurate and verifiable measurement of fuel consumption that could pavethe way for CO2 foot printing and data verification in the future.
6.8 The estimated reductions in CO2 emissions, for combined EEDI and SEEMP, from theworld fleet translate into a significant average annual fuel cost saving of about US$50 billion in2020 and about US$200 billion by 2030; using fuel price increase scenarios that take intoaccount the switch to low sulphur fuel in 2020.
6.9 As a consequence of current developments in ship design and new technologiescoming onto market, the cost of EEDI compliance in phase 1 seems to be marginal as the 10%reduction requirement may be achieved by low-cost hull form design and main engineoptimisations. Cost of compliance for phase 2 and phase 3 may be higher and will involve somedesign-speed reduction for an average ship. However, the overall fuel economy of the new shipswill be positive as indicated by the high savings in fuel costs
6.10 Despite the significant CO2 emission reduction potential resulting from EEDI andSEEMP regulations, an absolute reduction in total CO2 emissions for shipping from the 2010level appears not to be feasible using these two measures alone. For all scenarios, theprojected growth in world trade outweighs the achieved emission reduction using EEDI andSEEMP, giving an upward trend, albeit at a very much reduced rate compared to BAU.
7 REFERENCES
1 International Maritime Organization, Second IMO GHG study 2009, Buhaug, Ø.; Corbett, J.J.;Endresen, Ø.; Eyring, V.; Faber, J.; Hanayama, S.; Lee, D.S.; Lee, D.;Lindstad, H.;
Markowska, A.Z.; Mjelde, A.; Nelissen, D.; Nilsen, J.; Pålsson, C.; Winebrake, J.J.;Wu, W. –Q.;Yoshida, K., London, 2009.
2 International Maritime Organization, Resolution MEPC.203(62) Adopted on 15 July 2011―amendments to the annex of the protocol of 1997 to amend the International Conventionfor the Prevention of Pollution from Ships, 1973, as modified by the Protocol of 1978relating thereto (Inclusion of regulations on energy efficiency for ships in MARPOL Annex VI), MEPC 62/24/Add.1, Appendix 19, July 2015.
3 International Maritime Organization, Marine Environment Protection Committee, InterimGuidelines on the method of calculation of the Energy Efficiency Design Index for newships, MEPC.1/Circ.681, 2009
4 International Maritime Organization, Marine Environment Protection Committee, InterimGuidelines on the voluntary verification of the Energy Efficiency Design Index for newships, MEPC.1/Circ.682, 2009
5 International Maritime Organization, Marine Environment Protection Committee, Guidancefor the Development of a Ship Energy Efficiency Management Plan, MEPC.1/Circ.683,2009
6 International Maritime Organization, Marine Environment Protection Committee,Guidelines for Voluntary Use of the Ship Energy Efficiency Operational Indicator,MEPC.1/Circ.684, 2009

8/10/2019 EEDI AND SEEMP.pdf
http://slidepdf.com/reader/full/eedi-and-seemppdf 37/62
MEPC 63/INF.2 Annex, page 37
L:\LED\INF\PRESS\2011\EEDI study presentation\REPORT ASSESSMENT OF IMO MANDATED ENERGYEFFICIENCY MEASURES FOR INTERNATIONAL SHIPPING.doc
7 International Maritime Organization, Marine Environment Protection Committee,submission by Norway on ―Updated Marginal Abatement Cost Curves for shipping‖,MEPC 60/INF.19, 15 January 2010.
8 International Maritime Organization, Marine Environment Protection Committee,
submission by IMarEst on ―Marginal Abatement Costs and Cost Effectiveness of Energy-Efficiency Measures‖, MEPC 62/INF.7, 8 April 2011.
9 International Maritime Organization, Marine Environment Protection Committee,submission by IMarEst on ―Full report of the work undertaken by the Expert Group onFeasibility Study and Impact Assessment of possible Market-based Measures‖, MEPC61/INF.2, 13 August 2010.
10 International Maritime Organization, Marine Environment Protection Committee,Technical and operational means for reducing CO2 emissions from shipping ,MEPC 58/INF 14, 2008
11 Eide, M.S., Endresen, Ø. and Longva, T., Future CO2 Emissions: Outlook andChallenges for the Shipping Industry , paper presented at IMDC, 2009
12 Eide, M.S., Longva, T., Hoffmann, P., Endresen, Ø., Dalsøren, S.B. (2010 ): Future CostScenarios for Reduction of Ship CO2 Emissions. Maritime Policy & Management, 38: 1,11 — 37, January 2011.
13 International Maritime Organization, Marine Environment Protection Committee, Reportof the Working Group on Energy Efficiency Measures for Ships, MEPC/ 61/WP.10, 30September 2010.
***

8/10/2019 EEDI AND SEEMP.pdf
http://slidepdf.com/reader/full/eedi-and-seemppdf 38/62
8/10/2019 EEDI AND SEEMP.pdf
http://slidepdf.com/reader/full/eedi-and-seemppdf 39/62

8/10/2019 EEDI AND SEEMP.pdf
http://slidepdf.com/reader/full/eedi-and-seemppdf 40/62
MEPC 63/INF.2 Annex, page 2
L:\LED\INF\PRESS\2011\EEDI study presentation\REPORT ASSESSMENT OF IMO MANDATED ENERGYEFFICIENCY MEASURES FOR INTERNATIONAL SHIPPING.doc
BIMCO
5 BIMCOs Marine Committee at its 22nd meeting in October 2011 discussed the issueof EEDI waiver and issued the following statement:
―BIMCO has evaluated the commercial implication of new ships built after 1 January2013 being granted waivers from the Flag State for compliance with the EEDIrequirement. It is BIMCO‘s firm recommendation that due to the lifespan of ships andthe significant uncertainties in respect of governments‘ environmental agendas andhow these may be applied, members should abstain from building new ships withoutcertified EEDI compliance. Such ships would be compromised in relation to theirfuture second-hand value in the market, potentially restricted in their ability to tradeworldwide and be less attractive in the charter market due to their perceived lowerefficiency‖.
BIMCO later on has emphasised that ―their advice against waiver in no way bears apolitical signal. On the contrary, it is purely an acknowledgment of shipping being aglobal business and in line with BIMCO‘s objectives to promote fair businesspractices, free trade and open access to markets‖
A1-4 Technology cost of compliance to EEDI
6 The waiver applies to the first 4 years of EEDI regulation. The evaluation of cost ofcompliance to EEDI regulation during these 4 years shows that this cost will be low. This isdue to the following reason:
EEDI Reference Lines: The construction of EEDI reference lines are based on
assumption of engines BSFC (Brake Specific Fuel Consumption) of 190 and 215g/kWh for main and auxiliary engines respectively. This gives effectively up to 10%advantage to ships for compliance.
Ship hydrodynamic optimisation: Ship hydrodynamic (resistances) has a majorimpact on EEDI. A number of reported investigations shows that ship hydrodynamicoptimisation will bring about energy saving opportunities of up to about 10% withactually no significant extra cost of shipbuilding. This on its own will be sufficient toensure compliance to phases 0 and 1 of EEDI for the majority of ships.
Preparation for future more stringent phases 2 and 3: It is believed that the futureadoption of technologies for phases 2 and 3 of EEDI regulation (beyond 2020) will be
based on experience gained with EEDI during phases 0 and 1. Those Flag Statesthat opt for waiver will deprive themselves of gaining this experience and will havedifficulty in adapting to EEDI regulations when the period of waiver elapses.
7 Based on the above, it is concluded that cost of compliance to phases 0 and 1 willnot be significant and flag States and ship-owners will have no financial justification for optingfor waiver. This makes the uptake of waiver option unattractive for the majority of ships andshipowners.
8/10/2019 EEDI AND SEEMP.pdf
http://slidepdf.com/reader/full/eedi-and-seemppdf 41/62
MEPC 63/INF.2 Annex, page 3
L:\LED\INF\PRESS\2011\EEDI study presentation\REPORT ASSESSMENT OF IMO MANDATED ENERGYEFFICIENCY MEASURES FOR INTERNATIONAL SHIPPING.doc
A1-5 Commercial cost of non-compliance to EEDI
8 Shipping is mainly an international industry and non-compliance to even voluntaryregulations normally puts the non-compliant ship in some commercial disadvantage. AnEEDI non-complaint ship is expected to suffer from the following:
Higher ship fuel cost: A non-compliant EEDI ship is likely to be less efficient thanthe EEDI-compliant ship. This will translate to additional fuel cost of the vessel overits entire operation lifecycle.
Cost of re-verification: Obtaining an EEDI verification (if desired later on) andcertification during service period will incur significantly additional cost than obtainingEEDI verification during the normal ship construction and commissioning trials.
Second hand value: A ship without an EEDI is likely to have lower second havevalue as this will imply that it is not an energy efficient ship
Opportunity costs: The non-EEDI ship may loose on future EEDI-based incentivesand where EEDI is used for chartering, port discounts, flag registration discounts, etc.Incentives could be driven by ports, Flag States, charterers and Port States.
Charter-ability: Ships with EEDI is expected to have a better charter-abilityopportunity as against those without. A ship with no EEDI may be regarded as anenergy in-efficient ship.
9 Based on the above analysis, the 4-year waiver of EEDI compliance may not onlybring no tangible capital cost benefits to owners but it may incur significant commercial risksfor the ship and also some future opportunity costs.
A1-6 Level of waiver uptake
10 At MEPC 62, a number of countries supported the waiver clause to be includednotably Brazil, China and Saudi Arabia. Assuming, that waiver will be taken up by these flagstates, it is possible to estimate the level of waiver uptake. As of October 2011, the existingtonnage and number of ships for these three flags compared to the global fleet wereanalysed and constitute together 4.6% of the global fleet.
11 Based on the above assumption, a 5% waiver is forecast. Other scenarios can bemodelled as soon as position of various flag States are known.
A1-7 Conclusions
12 Based on the analysis provided in this Appendix, it is concluded that the likelihood offlag States or shipowners to opt for an EEDI waiver is low due to lower compliance costs andcommercial disadvantage of not doing so. Accordingly, the level waiver uptake level taken inthis Study as 5% (low) and 30% (high) is regarded as reasonable. It is most likely that waiverwill be at the level of 5% as current indications imply.
8/10/2019 EEDI AND SEEMP.pdf
http://slidepdf.com/reader/full/eedi-and-seemppdf 42/62

8/10/2019 EEDI AND SEEMP.pdf
http://slidepdf.com/reader/full/eedi-and-seemppdf 43/62
MEPC 63/INF.2 Annex, page 5
L:\LED\INF\PRESS\2011\EEDI study presentation\REPORT ASSESSMENT OF IMO MANDATED ENERGYEFFICIENCY MEASURES FOR INTERNATIONAL SHIPPING.doc
2010 2015 2020 2025
Primary/secondary fuel HFO HFO/MGO HFO/MGO MGO/HFO
Expected EEDI reduction (%) 0 0 0 0
Hull /ship dimensions/paint optimisation Conv. Conv/OPHULL OPHULL OPHULL
Expected EEDI reduction (%) 0 2 5 7
Hull air lubrication NA NA NA HAL
Expected EEDI reduction (%) 0 0 0 0
Propeller type / size / design FPP ( C) FPP ( C) FPP (LDSS) FPP (LDSS)
Expected EEDI reduction (%) 0 0 2 2
Propeller / rudder / aft flow optimisation FPP ( C) FPP (OP) FPP (OP) FPP (OP)
Expected EEDI reduction (%) 0 2 3 4
Propulsion system type Direct-drive Direct-drive Direct-drive Direct-drive
Expected EEDI reduction (%) 0 0 0 0
Main engine type/optimisation 2-stroke diesel
(C)
2-stroke diesel
(OP)
2-stroke diesel
(OP, DR/LS)
2-stroke diesel
(OP, DR/LS)
Expected EEDI reduction (%) 0 1 4 5
Main engine actual SFC relative to reference value SFC (M/E) SFC (M/E) SFC (M/E) SFC (M/E)
Expected EEDI reduction (%) 0 5 5 5
Auxiliary engine type/optimisation 4-stroke diesel
(C)
4-stroke diesel
(C)
4-stroke diesel
(OP)
4-stroke diesel
(OP)
Expected EEDI reduction (%) 0 0 0 0Auxiliary engines actual SFC relative to reference value SFC (A/E) SFC (A/E) SFC (A/E) SFC (A/E)
Expected EEDI reduction (%) 0 5 5 5
Auxiliary load reduction Conv. Conv. VSDRIVE VSDRIVE
Expected EEDI reduction (%) 0 0 0 0
Waste heat recovery NA NA NA WHR
Expected EEDI reduction (%) 0 0 0 5
Renewable energy for propulsion NA NA NA WINDPOWER
Expected EEDI reduction (%) 0 0 0 0
Renewable energy for power generation NA NA NA SOLPOWER
Expected EEDI reduction (%) 0 0 0 0
EEDI (Required) 2.560 2.304 2.048 1.792
IMO EEDI reduction factor (%) 0 10 20 30
EEDI reduction (Technical) (%) 0 9.8 18.44 27.08
Design speed (average) 15.74 15.72 15.62 15.51
Expected EEDI reduction due to speed reduction(%) 0 0.2 1.56 2.92
Speed
Propulsion
system and
M/E
A/E and
auxiliary
loads
EEDI
aspects
Heat
recovery
Renewable
energy
Fuel
Hull
Propeller
Table 2.1 - Ship type: Tanker - Average VLCC Technology options for Required EEDI compliance
Year

8/10/2019 EEDI AND SEEMP.pdf
http://slidepdf.com/reader/full/eedi-and-seemppdf 44/62
8/10/2019 EEDI AND SEEMP.pdf
http://slidepdf.com/reader/full/eedi-and-seemppdf 45/62
MEPC 63/INF.2 Annex, page 7
L:\LED\INF\PRESS\2011\EEDI study presentation\REPORT ASSESSMENT OF IMO MANDATED ENERGYEFFICIENCY MEASURES FOR INTERNATIONAL SHIPPING.doc
2010 2015 2020 2025
Primary/secondary fuel HFO HFO/MGO HFO/MGO MGO/HFO
Expected EEDI reduction (%) 0 0 0 0
Hull /ship dimensions/paint optimisation Conv. Conv/OPHULL OPHULL OPHULL
Expected EEDI reduction (%) 0 2 4 5
Hull air lubrication NA NA NA HAL
Expected EEDI reduction (%) 0 0 0 0
Propeller type / size / design FPP ( C) FPP ( C) FPP (LDSS) FPP (LDSS)
Expected EEDI reduction (%) 0 0 2 2
Propeller / rudder / aft flow optimisation FPP ( C) FPP (OP) FPP (OP) FPP (OP)
Expected EEDI reduction (%) 0 2 3 4
Propulsion system type Direct-drive Direct-drive Direct-drive Direct-drive
Expected EEDI reduction (%) 0 0 0 0
Main engine type/optimisation 2-stroke diesel
(C)
2-stroke diesel
(OP)
2-stroke diesel
(OP, DR/LS)
2-stroke diesel
(OP, DR/LS)
Expected EEDI reduction (%) 0 1 4 5
Main engine actual SFC relative to reference value SFC (M/E) SFC (M/E) SFC (M/E) SFC (M/E)
Expected EEDI reduction (%) 0 5 5 5
Auxiliary engine type/optimisation 4-stroke diesel
(C)
4-stroke diesel
(C)
4-stroke diesel
(OP)
4-stroke diesel
(OP)
Expected EEDI reduction (%) 0 0 0 0
Auxiliary engines actual SFC relative to reference value SFC (A/E) SFC (A/E) SFC (A/E) SFC (A/E)
Expected EEDI reduction (%) 0 5 5 5
Auxiliary load reduction Conv. Conv. VSDRIVE VSDRIVE
Expected EEDI reduction (%) 0 0 0 0
Waste heat recovery NA NA NA WHR
Expected EEDI reduction (%) 0 0 0 6
Renewable energy for propulsion NA NA NA WINDPOWER
Expected EEDI reduction (%) 0 0 0 0
Renewable energy for power generation NA NA NA SOLPOWER
Expected EEDI reduction (%) 0 0 0 0
EEDI (Required) [g CO2/tonne.nmile] 15.840 14.256 12.672 11.088
IMO EEDI reduction factor (%) 0 10 20 30
EEDI reduction (Technical) (%) 0 9.8 17.48 26.12
Design speed (average) 24.46 24.44 24.15 23.98
Expected EEDI reduction due to speed reduction(%) 0 0.2 2.52 3.88
Fuel
Hull
Propeller
Year
Table 2.3 - Containership - Average New Panamax: Technology options for Required EEDI compliance
Speed
Propulsion
system and
M/E
A/E andauxiliary
loads
EEDI
aspects
Heat
recoveryRenewable
energy
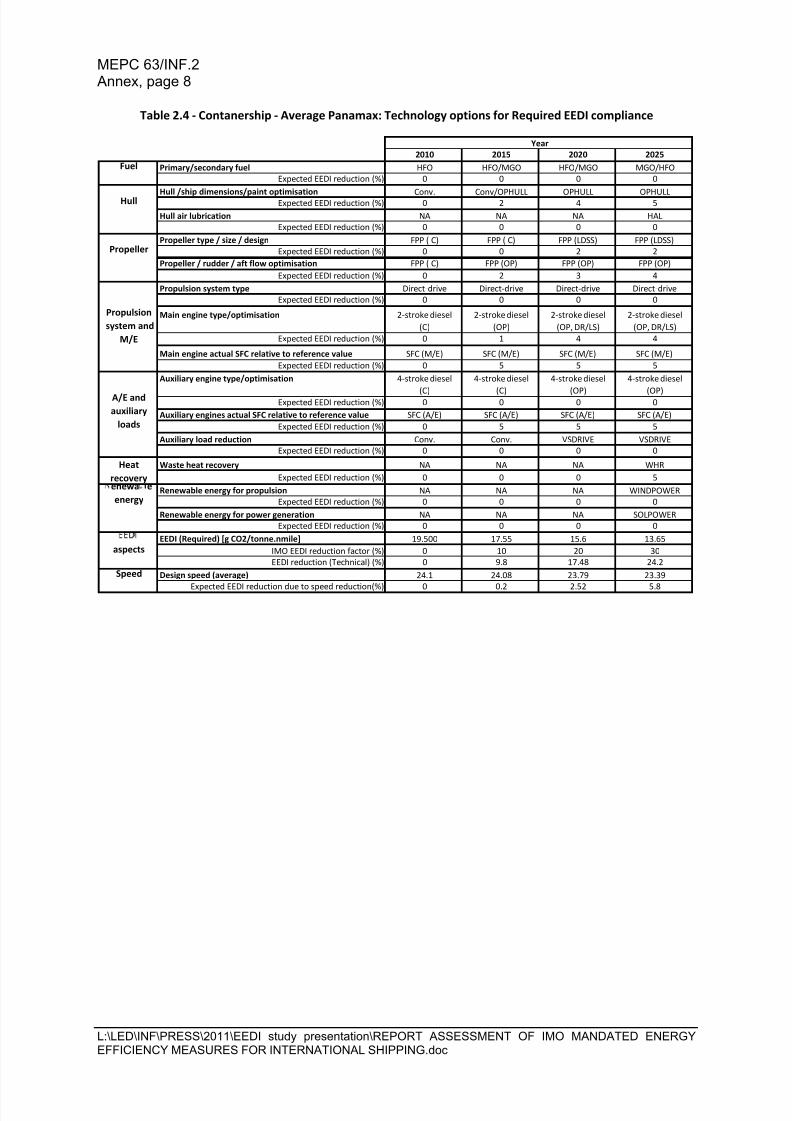
8/10/2019 EEDI AND SEEMP.pdf
http://slidepdf.com/reader/full/eedi-and-seemppdf 46/62
MEPC 63/INF.2 Annex, page 8
L:\LED\INF\PRESS\2011\EEDI study presentation\REPORT ASSESSMENT OF IMO MANDATED ENERGYEFFICIENCY MEASURES FOR INTERNATIONAL SHIPPING.doc
2010 2015 2020 2025
Primary/secondary fuel HFO HFO/MGO HFO/MGO MGO/HFO
Expected EEDI reduction (%) 0 0 0 0
Hull /ship dimensions/paint optimisationConv. Conv/OPHULL OPHULL OPHULLExpected EEDI reduction (%) 0 2 4 5
Hull air lubrication NA NA NA HAL
Expected EEDI reduction (%) 0 0 0 0
Propeller type / size / design FPP ( C) FPP ( C) FPP (LDSS) FPP (LDSS)
Expected EEDI reduction (%) 0 0 2 2
Propeller / rudder / aft flow optimisation FPP ( C) FPP (OP) FPP (OP) FPP (OP)
Expected EEDI reduction (%) 0 2 3 4
Propulsion system type Direct-drive Direct-drive Direct-drive Direct-drive
Expected EEDI reduction (%) 0 0 0 0
Main engine type/optimisation 2-stroke diesel
(C)
2-stroke diesel
(OP)
2-stroke diesel
(OP, DR/LS)
2-stroke diesel
(OP, DR/LS)
Expected EEDI reduction (%) 0 1 4 4
Main engine actual SFC relative to reference value SFC (M/E) SFC (M/E) SFC (M/E) SFC (M/E)
Expected EEDI reduction (%) 0 5 5 5
Auxiliary engine type/optimisation 4-stroke diesel
(C)
4-stroke diesel
(C)
4-stroke diesel
(OP)
4-stroke diesel
(OP)Expected EEDI reduction (%) 0 0 0 0
Auxiliary engines actual SFC relative to reference value SFC (A/E) SFC (A/E) SFC (A/E) SFC (A/E)
Expected EEDI reduction (%) 0 5 5 5
Auxiliary load reduction Conv. Conv. VSDRIVE VSDRIVE
Expected EEDI reduction (%) 0 0 0 0
Waste heat recovery NA NA NA WHR
Expected EEDI reduction (%) 0 0 0 5
Renewable energy for propulsion NA NA NA WINDPOWER
Expected EEDI reduction (%) 0 0 0 0
Renewable energy for power generation NA NA NA SOLPOWER
Expected EEDI reduction (%) 0 0 0 0
EEDI (Required) [g CO2/tonne.nmile] 19.500 17.55 15.6 13.65
IMO EEDI reduction factor (%) 0 10 20 30
EEDI reduction (Technical) (%) 0 9.8 17.48 24.2
Design speed (average) 24.1 24.08 23.79 23.39
Expected EEDI reduction due to speed reduction(%) 0 0.2 2.52 5.8
Speed
Propulsion
system and
M/E
A/E and
auxiliary
loads
aspects
Heat
recoveryenewa e
energy
Fuel
Hull
Propeller
Year
Table 2.4 - Contanership - Average Panamax: Technology options for Required EEDI compliance
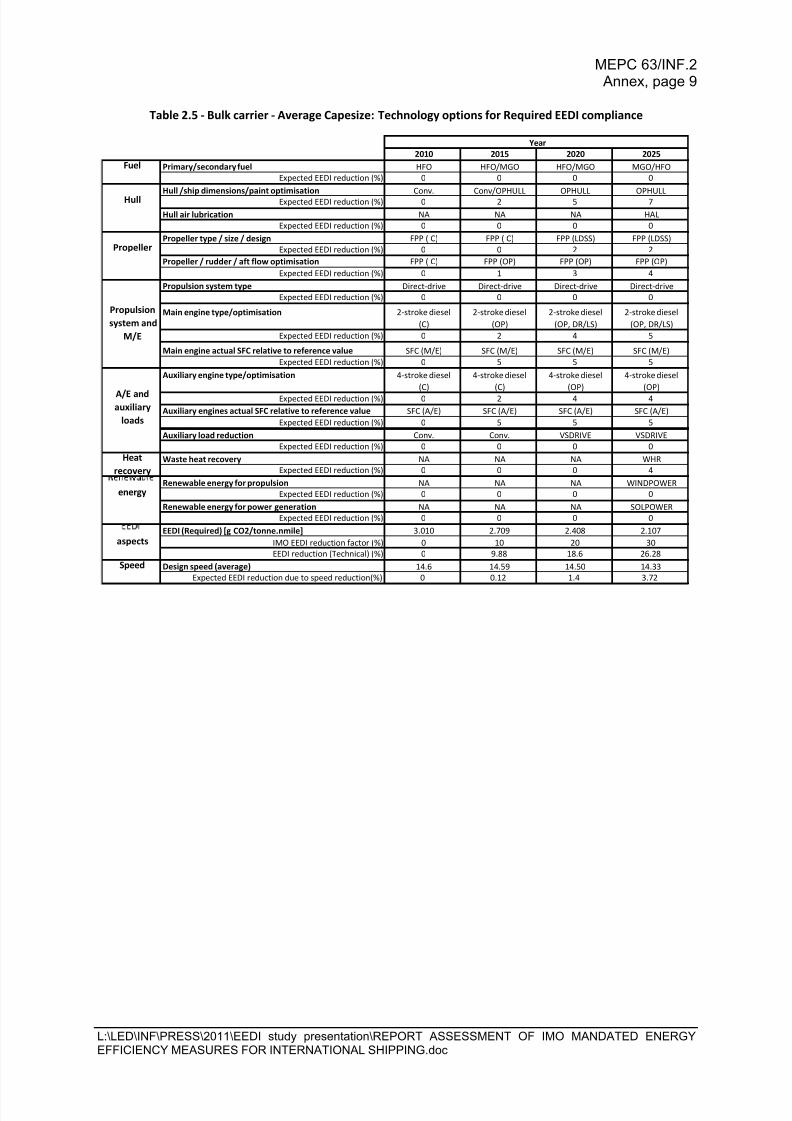
8/10/2019 EEDI AND SEEMP.pdf
http://slidepdf.com/reader/full/eedi-and-seemppdf 47/62
MEPC 63/INF.2 Annex, page 9
L:\LED\INF\PRESS\2011\EEDI study presentation\REPORT ASSESSMENT OF IMO MANDATED ENERGYEFFICIENCY MEASURES FOR INTERNATIONAL SHIPPING.doc
2010 2015 2020 2025
Primary/secondary fuel HFO HFO/MGO HFO/MGO MGO/HFO
Expected EEDI reduction (%) 0 0 0 0
Hull /ship dimensions/paint optimisation Conv. Conv/OPHULL OPHULL OPHULL
Expected EEDI reduction (%) 0 2 5 7
Hull air lubrication NA NA NA HAL
Expected EEDI reduction (%) 0 0 0 0
Propeller type / size / design FPP ( C) FPP ( C) FPP (LDSS) FPP (LDSS)
Expected EEDI reduction (%) 0 0 2 2
Propeller / rudder / aft flow optimisation FPP ( C) FPP (OP) FPP (OP) FPP (OP)
Expected EEDI reduction (%) 0 1 3 4
Propulsion system type Direct-drive Direct-drive Direct-drive Direct-drive
Expected EEDI reduction (%) 0 0 0 0
Main engine type/optimisation 2-stroke diesel
(C)
2-stroke diesel
(OP)
2-stroke diesel
(OP, DR/LS)
2-stroke diesel
(OP, DR/LS)
Expected EEDI reduction (%) 0 2 4 5
Main engine actual SFC relative to reference value SFC (M/E) SFC (M/E) SFC (M/E) SFC (M/E)
Expected EEDI reduction (%) 0 5 5 5
Auxiliary engine type/optimisation 4-stroke diesel
(C)
4-stroke diesel
(C)
4-stroke diesel
(OP)
4-stroke diesel
(OP)
Expected EEDI reduction (%) 0 2 4 4
Auxiliary engines actual SFC relative to reference value SFC (A/E) SFC (A/E) SFC (A/E) SFC (A/E)
Expected EEDI reduction (%) 0 5 5 5
Auxiliary load reduction Conv. Conv. VSDRIVE VSDRIVE
Expected EEDI reduction (%) 0 0 0 0
Waste heat recovery NA NA NA WHR
Expected EEDI reduction (%) 0 0 0 4
Renewable energy for propulsion NA NA NA WINDPOWER
Expected EEDI reduction (%) 0 0 0 0
Renewable energy for power generation NA NA NA SOLPOWER
Expected EEDI reduction (%) 0 0 0 0
EEDI (Required) [g CO2/tonne.nmile] 3.010 2.709 2.408 2.107
IMO EEDI reduction factor (%) 0 10 20 30
EEDI reduction (Technical) (%) 0 9.88 18.6 26.28
Design speed (average) 14.6 14.59 14.50 14.33
Expected EEDI reduction due to speed reduction(%) 0 0.12 1.4 3.72
Fuel
Hull
Propeller
Year
Table 2.5 - Bulk carrier - Average Capesize: Technology options for Required EEDI compliance
Speed
Propulsion
system and
M/E
A/E andauxiliary
loads
aspects
Heat
recovery
energy

8/10/2019 EEDI AND SEEMP.pdf
http://slidepdf.com/reader/full/eedi-and-seemppdf 48/62
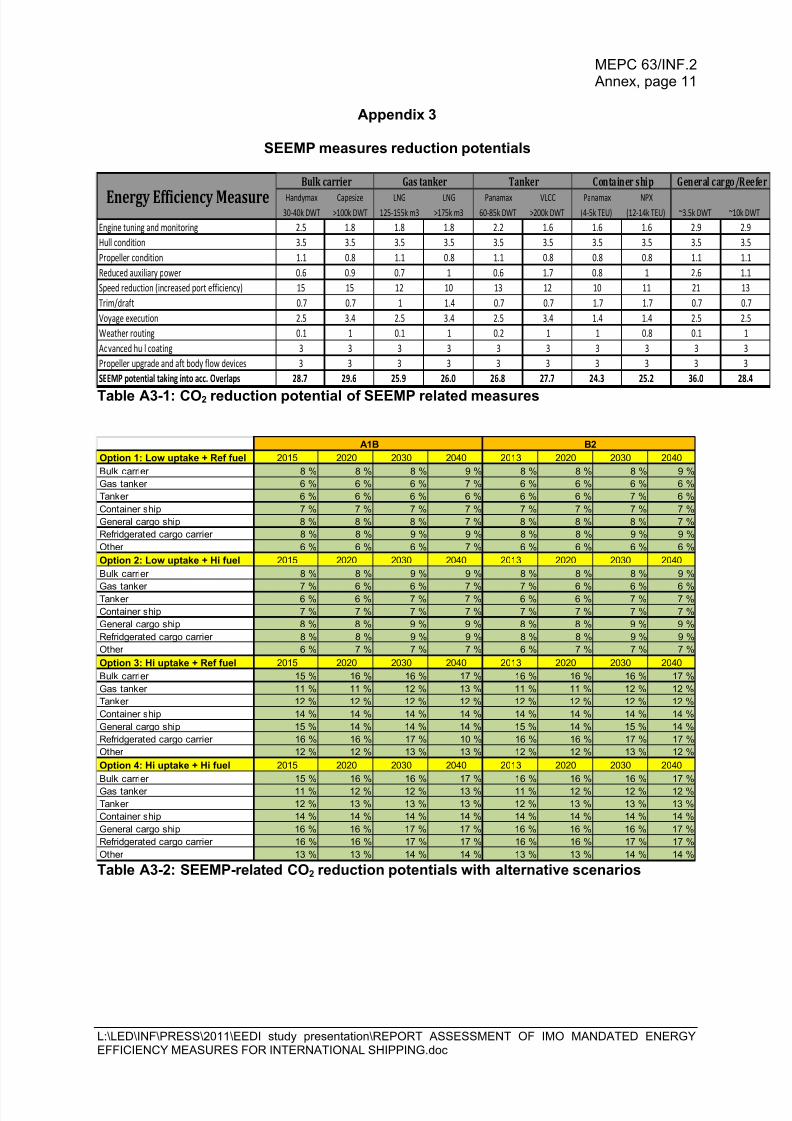
8/10/2019 EEDI AND SEEMP.pdf
http://slidepdf.com/reader/full/eedi-and-seemppdf 49/62
MEPC 63/INF.2 Annex, page 11
L:\LED\INF\PRESS\2011\EEDI study presentation\REPORT ASSESSMENT OF IMO MANDATED ENERGYEFFICIENCY MEASURES FOR INTERNATIONAL SHIPPING.doc
Appendix 3
SEEMP measures reduction potentials
Handymax Capesize LNG LNG Panamax VLCC Panamax NPX
30-40k DWT >100k DWT 125-155k m3 >175k m3 60-85k DWT >200k DWT (4-5k TEU) (12-14k TEU) ~3.5k DWT ~10k DWT
Engine tuning and monitoring 2.5 1.8 1.8 1.8 2.2 1.6 1.6 1.6 2.9 2.9
Hull condition 3.5 3.5 3.5 3.5 3.5 3.5 3.5 3.5 3.5 3.5
Propeller condition 1.1 0.8 1.1 0.8 1.1 0.8 0.8 0.8 1.1 1.1
Reduced auxiliary power 0.6 0.9 0.7 1 0.6 1.7 0.8 1 2.6 1.1
Speed reduction (increased port efficiency) 15 15 12 10 13 12 10 11 21 13
Trim/draft 0.7 0.7 1 1.4 0.7 0.7 1.7 1.7 0.7 0.7
Voyage execution 2.5 3.4 2.5 3.4 2.5 3.4 1.4 1.4 2.5 2.5
Weather routing 0.1 1 0.1 1 0.2 1 1 0.8 0.1 1
Advanced hull coating 3 3 3 3 3 3 3 3 3 3
Propeller upgrade and aft body flow devices 3 3 3 3 3 3 3 3 3 3
SEEMP potential taking into acc. Overlaps 28.7 29.6 25.9 26.0 26.8 27.7 24.3 25.2 36.0 28.4
Container ship General cargo/Reefer
Energy Efficiency Measure
Bulk carrier Gas tanker Tanker
Table A3-1: CO2 reduction potential of SEEMP related measures
Option 1: Low uptake + Ref fuel 2015 2020 2030 2040 2013 2020 2030 2040
Bulk carrier 8 % 8 % 8 % 9 % 8 % 8 % 8 % 9 %
Gas tanker 6 % 6 % 6 % 7 % 6 % 6 % 6 % 6 %
Tanker 6 % 6 % 6 % 6 % 6 % 6 % 7 % 6 %
Container ship 7 % 7 % 7 % 7 % 7 % 7 % 7 % 7 %
General cargo ship 8 % 8 % 8 % 7 % 8 % 8 % 8 % 7 %
Refridgerated cargo carrier 8 % 8 % 9 % 9 % 8 % 8 % 9 % 9 %
Other 6 % 6 % 6 % 7 % 6 % 6 % 6 % 6 %
Option 2: Low uptake + Hi fuel 2015 2020 2030 2040 2013 2020 2030 2040
Bulk carrier 8 % 8 % 9 % 9 % 8 % 8 % 8 % 9 %
Gas tanker 7 % 6 % 6 % 7 % 7 % 6 % 6 % 6 %Tanker 6 % 6 % 7 % 7 % 6 % 6 % 7 % 7 %
Container ship 7 % 7 % 7 % 7 % 7 % 7 % 7 % 7 %
General cargo ship 8 % 8 % 9 % 9 % 8 % 8 % 9 % 9 %
Refridgerated cargo carrier 8 % 8 % 9 % 9 % 8 % 8 % 9 % 9 %
Other 6 % 7 % 7 % 7 % 6 % 7 % 7 % 7 %
Option 3: Hi uptake + Ref fuel 2015 2020 2030 2040 2013 2020 2030 2040
Bulk carrier 15 % 16 % 16 % 17 % 16 % 16 % 16 % 17 %
Gas tanker 11 % 11 % 12 % 13 % 11 % 11 % 12 % 12 %
Tanker 12 % 12 % 12 % 12 % 12 % 12 % 12 % 12 %
Container ship 14 % 14 % 14 % 14 % 14 % 14 % 14 % 14 %
General cargo ship 15 % 14 % 14 % 14 % 15 % 14 % 15 % 14 %
Refridgerated cargo carrier 16 % 16 % 17 % 10 % 16 % 16 % 17 % 17 %
Other 12 % 12 % 13 % 13 % 12 % 12 % 13 % 12 %
Option 4: Hi uptake + Hi fuel 2015 2020 2030 2040 2013 2020 2030 2040
Bulk carrier 15 % 16 % 16 % 17 % 16 % 16 % 16 % 17 %
Gas tanker 11 % 12 % 12 % 13 % 11 % 12 % 12 % 12 %
Tanker 12 % 13 % 13 % 13 % 12 % 13 % 13 % 13 %
Container ship 14 % 14 % 14 % 14 % 14 % 14 % 14 % 14 %
General cargo ship 16 % 16 % 17 % 17 % 16 % 16 % 16 % 17 %
Refridgerated cargo carrier 16 % 16 % 17 % 17 % 16 % 16 % 17 % 17 %
Other 13 % 13 % 14 % 14 % 13 % 13 % 14 % 14 %
A1B B2
Table A3-2: SEEMP-related CO2 reduction potentials with alternative scenarios
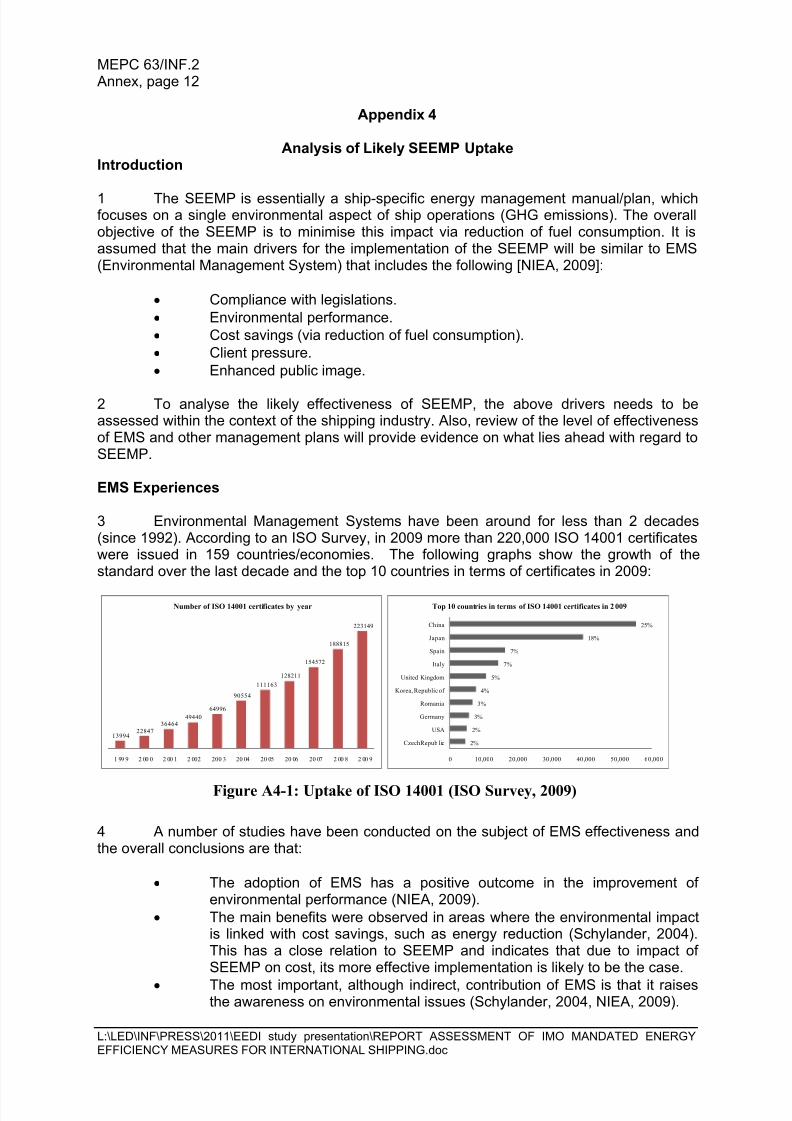
8/10/2019 EEDI AND SEEMP.pdf
http://slidepdf.com/reader/full/eedi-and-seemppdf 50/62
MEPC 63/INF.2 Annex, page 12
L:\LED\INF\PRESS\2011\EEDI study presentation\REPORT ASSESSMENT OF IMO MANDATED ENERGYEFFICIENCY MEASURES FOR INTERNATIONAL SHIPPING.doc
Appendix 4
Analysis of Likely SEEMP UptakeIntroduction
1 The SEEMP is essentially a ship-specific energy management manual/plan, whichfocuses on a single environmental aspect of ship operations (GHG emissions). The overallobjective of the SEEMP is to minimise this impact via reduction of fuel consumption. It isassumed that the main drivers for the implementation of the SEEMP will be similar to EMS(Environmental Management System) that includes the following [NIEA, 2009]:
Compliance with legislations. Environmental performance. Cost savings (via reduction of fuel consumption). Client pressure. Enhanced public image.
2 To analyse the likely effectiveness of SEEMP, the above drivers needs to beassessed within the context of the shipping industry. Also, review of the level of effectivenessof EMS and other management plans will provide evidence on what lies ahead with regard toSEEMP.
EMS Experiences
3 Environmental Management Systems have been around for less than 2 decades(since 1992). According to an ISO Survey, in 2009 more than 220,000 ISO 14001 certificateswere issued in 159 countries/economies. The following graphs show the growth of thestandard over the last decade and the top 10 countries in terms of certificates in 2009:
1399422847
3646449440
64996
90554
111163
128211
154572
188815
223149
1 99 9 2 00 0 2 00 1 2 002 200 3 20 04 20 05 20 06 20 07 2 00 8 2 00 9
Number of ISO 14001 certificates by year
2%
2%
3%
3%
4%
5%
7%
7%
18%
25%
0 10,000 20,000 30,000 40,000 50,000 60,000
Czech Repub lic
USA
Germany
Romania
Korea, Republic of
United Kingdom
Italy
Spain
Japan
China
Top 10 countries in terms of ISO 14001 certificates in 2 009
4 A number of studies have been conducted on the subject of EMS effectiveness andthe overall conclusions are that:
The adoption of EMS has a positive outcome in the improvement ofenvironmental performance (NIEA, 2009).
The main benefits were observed in areas where the environmental impactis linked with cost savings, such as energy reduction (Schylander, 2004).This has a close relation to SEEMP and indicates that due to impact ofSEEMP on cost, its more effective implementation is likely to be the case.
The most important, although indirect, contribution of EMS is that it raisesthe awareness on environmental issues (Schylander, 2004, NIEA, 2009).
Figure A4-1: Uptake of ISO 14001 (ISO Survey, 2009)
8/10/2019 EEDI AND SEEMP.pdf
http://slidepdf.com/reader/full/eedi-and-seemppdf 51/62
MEPC 63/INF.2 Annex, page 13
L:\LED\INF\PRESS\2011\EEDI study presentation\REPORT ASSESSMENT OF IMO MANDATED ENERGYEFFICIENCY MEASURES FOR INTERNATIONAL SHIPPING.doc
Similar observations have been made in the shipping industry, where theintroduction of EMS is associated with positive impact on environmentalawareness and cultural change (Thetokas, Kaza, 2005).
5 Based on the experience from EMS, it could be argued that:
The shipping industry is not alien to management systems and plans suchas SEEMP; the ISM Code has been a mandatory instrument for more thana decade.
Systems based on the ISO 14001 standard are used increasingly in theshipping industry.
SEEMP is dealing with a quantitative environmental aspect with costimplications and based on EMS experience, it is expected to have a widereffectiveness.
Experience from existing IMO mandatory management plans
6 The literature on previously mandated IMO management plans such as VOC(Volatile Organic Compounds) and BWMS (Ballast Water Management Systems) wereresearched. Although there is widespread agreement that the industry fully comply with therelevant regulations and management plans, their use is not investigated in terms ofquantifiable impact on level of VOC or transfer of alien species.
7 According to the 2nd IMO GHG study, paragraph 1.17 ―A reduction in emissions ofVOC has not been quantified. The most tangible result of implementing Regulation 15 inMARPOL Annex VI is the introduction of standardized VOC return pipes, through whichtankers can discharge VOC to shore during loading. Most tankers now have this capability,although the frequency of their use is variable‖.
Experience of best-practice ship energy management
8 Ship operators have already been implementing energy efficiency operationalmeasures suggested within the SEEMP Guidelines and set goals for reducing the energyconsumption of their fleet. Performance and savings are not always monitored and reported.However, from some major operators who publish their results, it can be seen that if SEEMPis successfully promoted within the wider industry, significant reductions in CO2 emissionscan be achieved.
9 Published experiences from some major ship owning / operation companies arebriefly described below:
Virtual arrival: It is estimated that implementation of virtual arrival canreduce GHG emissions on the tanker and bulk carrier sectors by 5% (BP,2010), however the concept is not yet fully evaluated in practice.
Slow steaming: Maersk Line‘s experience from the implementation of slowsteaming show that for over 1½ year since its implementation in 2009, therelative CO2 emissions were reduced by 7% (Maersk Line, 2010). MaerskTankers is implementing super-slow steaming in ballast voyages, and theyare reporting savings in bunker costs of up to 50%.
Hanjin Shipping experience: They have implemented a number of CO2 emission reduction measures/technologies applied on their ships including
turbocharger cut-off, application of low-friction paints, use of fuel additives,route optimisation and vessel performance monitoring systems (Hanjin,2010). Although no specific figures are available for each measure, the
8/10/2019 EEDI AND SEEMP.pdf
http://slidepdf.com/reader/full/eedi-and-seemppdf 52/62
MEPC 63/INF.2 Annex, page 14
L:\LED\INF\PRESS\2011\EEDI study presentation\REPORT ASSESSMENT OF IMO MANDATED ENERGYEFFICIENCY MEASURES FOR INTERNATIONAL SHIPPING.doc
overall emissions of the company‘s shipping sector in 2010 were reducedby 12% (expressed in g-CO2/teu-km) compared to 2008 levels.
Cosco Group experience: In their 2008 report, they list a variety ofoperational measures including fuel homogenisation and use of additives,engine temperature control, speed reduction and speed optimisation,
vessel performance monitoring, cargo heating optimisation and hullcleaning. Again, no specific figures are available for each measure but fuelconsumption (expressed in kg/kilotons per sea mile) has consistentlyreduced4 across all shipping sectors the company is engaged in(containerships, bulk carriers, tankers and general cargo).
Cruise shipping: Similar experiences are reported in the cruise sector.
o Holland America Line reports an increase in efficiency (expressedin kg fuel per km travelled per available lower berth ) of 6%between 2007-2009 by employing operational practices such asvoyage optimisation, performance monitoring and reporting, andonboard energy conservation.
o RCCL (Royal Caribbean Cruise Lines) reported a reduction of 4%in fuel consumption (expressed in terms of available passengercruise days). Although some of these savings are attributed to theintroduction of more efficient ships on the fleet, operational andmanagement practices such as ship speed, hull maintenance,deployment (itinerary planning of individual sailings), heating,ventilation and air conditioning usage, lighting, water managementand behavioural changes among passengers and employees arecited.
o Princess Cruises also list a number of operational measures, suchas participation in a voluntary speed reduction programme, use of
low-friction silicone paint, use of engine waste heat for fresh waterproduction, use of low energy bulbs, HVAC optimisation and useof shore side electricity but with no reported figures as to the effectof these measures.
Class Societies: A number of class societies have been promotingoperational energy efficiency practices and have reported significant savingpotentials from operational and technical best-practice viewpoints.
10 Based on the above experiences, it could be concluded that the potential for energysaving is high and some companies are already taking advantage of this potential, primarilyfor cost cutting. Therefore, if SEEMP regulation could spread the use of energy savingpractices widely within the industry, its impact is expected to be high especially if fuel cost
pressure persists.
Increased awareness and culture change
11 The effectiveness of the SEEMP will be driven to a large extent via increasingfamiliarity of the industry with advantages of energy efficiency and promotion of awarenessand cultural change. The mandatory nature of the SEEMP will ensure to a certain degreethat the above mentioned awareness and cultural change are achieved in the short tomedium term.
4 The company has reported reductions of 6% for the containership sector, 6% for the bulk carrier sector, 60% forthe tanker sector and 13% for the general cargo sector in 2007 compared to 2004 levels, in terms ofkg/kilotons per sea mile
8/10/2019 EEDI AND SEEMP.pdf
http://slidepdf.com/reader/full/eedi-and-seemppdf 53/62
MEPC 63/INF.2 Annex, page 15
L:\LED\INF\PRESS\2011\EEDI study presentation\REPORT ASSESSMENT OF IMO MANDATED ENERGYEFFICIENCY MEASURES FOR INTERNATIONAL SHIPPING.doc
12 In the longer term, the following aspects need to be ensured for a good and effectiveSEEMP uptake:
Company energy policy and management commitment to reducing fuelconsumption are in place at strategic levels.
Measures in the SEEMP are specific and applicable to the ship and itsoperation.
Clear objectives and goals for energy saving are set. Roles and responsibilities are clearly assigned and there are enough
resources available for their implementation. Training is continuously provided. A quantitative performance monitoring system is in place and records
showing alignment with the goals are made available. Compliance with the SEEMP requirements is evaluated in some detail by
periodical audits and management reviews.
SEEMP and Fuel price
13 There is a clear linkage between fuel prices and operational energy efficiencypractices. Studies on the first and second global oil crises during 1970s indicate that shippingtransport efficiency increased after the oil price hikes; primarily via slow steaming. The samehas happened after the 2008 worldwide economic crisis due to banking system. Despitethese linkages, there are no well documented studies relating to possible uptake of SEEMPmeasures with fuel price. In this Study, it is assumed that uptake of SEEMP will be affectedby marine fuel and carbon prices.
Conclusions
14 Based on this analysis, it may be concluded that the mandatory use of SEEMPbased on current IMO regulations will provide a procedural framework for shippingcompanies to recognise the importance of the operational energy saving activities. It willsignificantly boost the level of awareness and, if implemented properly, will lead to a positivecultural change. However, and in view of lack of regulatory requirements for target settingand monitoring, SEEMP effectiveness will need to be stimulated / incentivised via otherinitiatives.
15 Some drivers for more effective use of the SEEMP are:
High fuel and carbon prices. More vigorous awareness building and cultural change on board ships. More collaboration between industry stakeholders and a solution to issue of
split-incentives. Effective monitoring of SEEMP implementation via rigorous audits and
reviews.
16 In view of the above, the uncertainty of the SEEMP's effectiveness as a regulatorymeasure in its current form will persist in the future. Further action beyond current regulationsmay be needed to encourage wider uptake of SEEMP measures in the future.
8/10/2019 EEDI AND SEEMP.pdf
http://slidepdf.com/reader/full/eedi-and-seemppdf 54/62
MEPC 63/INF.2 Annex, page 16
L:\LED\INF\PRESS\2011\EEDI study presentation\REPORT ASSESSMENT OF IMO MANDATED ENERGYEFFICIENCY MEASURES FOR INTERNATIONAL SHIPPING.doc
References
[1]: Northern Ireland Environmental Agency, Measuring the effectiveness of EnvironmentalManagement Systems, Phase 1: Desktop Report, June 2009, www.ni-environment.gov.uk [2]: Northern Ireland Environmental Agency, Measuring the effectiveness of Environmental
Management Systems, Phase 2: Final Report Including Data & Statistical Analysis, June2009, www.ni-environment.gov.uk [3]: Schaltegger, S., Burritt, R., and Petersen, H., (2003), An Introduction to CorporateEnvironmental Management - Striving for sustainability.[4]: Schylander, E., (2004) Environmental Effects and Organisational Experiences ofEnvironmental Management Systems[5]: International Organization for Standardization (ISO), (2004), EN ISO 14001:2004[6]: International Organization for Standardization (ISO), (2009) The ISO Survey ofCertifications[7]: Theotokas, I., Kaza, V., (2005), Environmental management in Greek shippingcompanies[8]: BP, (2010), Sustainability Review 2010, www.bp.com/sustainability [9]: Maersk Line (2010), Sustainability Progress Report 2010[10]:http://www.maersk.com/Sustainability/EnvironmentAndClimate/Pages/EnergyConsumption.aspx. [11]: http://www.maersktankers.com/Crude/AboutUs/Pages/ShortStories.aspx?SSItemId=3 [12]: Hanjin Shipping (2010), 2010 Sustainability Report[13]: http://www.cosco.com/GC_report/GC_report2008/web-en/c2-2-2.html [14]: Holland America Line (2009), HAL 2009 Sustainability Report[15]: Royal Caribbean Cruises Ltd (2008), 2008 Stewardship Report[16]: Princess Cruises (2009), 2009 Sustainability Report

8/10/2019 EEDI AND SEEMP.pdf
http://slidepdf.com/reader/full/eedi-and-seemppdf 55/62
MEPC 63/INF.2 Annex, page 17
L:\LED\INF\PRESS\2011\EEDI study presentation\REPORT ASSESSMENT OF IMO MANDATED ENERGYEFFICIENCY MEASURES FOR INTERNATIONAL SHIPPING.doc
Appendix 5
Method of calculation of CO2 reduction due to EEDI reduction factor
1 The reduction potential of the technologies described in this study is the relativereduction of the average EEDI of future new builds compared to the average EEDI of thepresent fleet. The objective is to identify the EEDI limit required to achieve these reductionpercentages.
2 The relationship is dependent on the spread of the samples around the referenceline expressed by a standard deviation. The reference lines for different ship types werepresented in MEPC 62/24/Add.1 [A1]. The standard deviations presented in Table A5.1 forthe different ship types were not presented in [A1], but were retrieved from the backgrounddata.
3 While the standard deviation from the fleet average (or ‗reference line‘) value maydiffer for different sizes of ship (i.e. small vessels might have larger standard deviation), andthis would have an impact on the effect of an EEDI limit, it was beyond the scope of thisstudy to assess this.
Ship typeStandard deviationin reference lines
Standard deviationused in this study
Bulk carrier 0.13 0.15Tanker (incl. gas) 0.23 (0.19 for gas) 0.20Container ship 0.18 0.20Coastal ships 0.28 – 0.38 0.30
Table A5.1 Standard deviation for the reference lines
4 In this study three standard deviations, 0.15, 0.20 and 0.30, have been assessed,covering the relevant range for all ship types. The closest figure the real standard deviationwas chosen: Ocean-going ships are assumed to have a standard deviation of 0.15; containerships 0.20 and coastal ships 0.30. A flat percentage for all ship sizes is assumed within allsegments. By using the total percentage reduction of technical measures and alternativefuels for each period the required EEDI can be read from Figure A5.2 Figure A5.3 shows theresults expressed in terms of the required EEDI in relation to the current fleet average or‗reference line‘. A negative value indicates a r equired EEDI above the current fleet averagevalue.
5 Setting a mandatory limit on the EEDI for future ships will lower the average EEDIfor all new builds. However, the new average will not be equal to the set EEDI limit. Thisappendix explains the relationship between the set EEDI limit and the average EEDI.
6 The estimated EEDI values are calculated for every ship in the fleet, and plottedagainst the capacity in order to create a reference line. The EEDI values can be shown to benormally distributed around the regression line [A2]. The regression line represents theaverage EEDI value for a segment, with 50% of the vessels having EEDI values above theaverage (poor performers) and 50% having lower EEDI values (good performers).
7 By imposing a limit to how much the EEDI can deviate from the reference line thenew builds will have a different distribution. It can be assumed that this will not be a normaldistribution: most new builds will tend to lie close to the limit, complying with the requirement,but not necessarily more. However, depending on the cost of compliance with the limit,

8/10/2019 EEDI AND SEEMP.pdf
http://slidepdf.com/reader/full/eedi-and-seemppdf 56/62
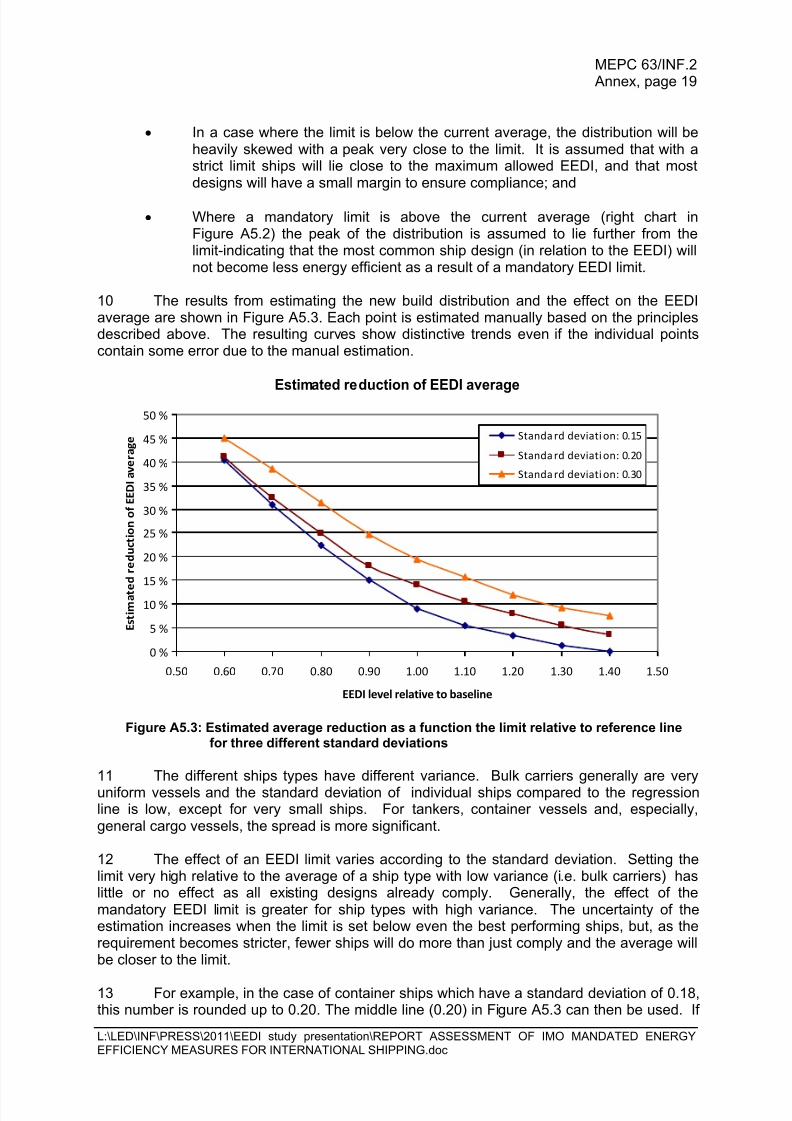
8/10/2019 EEDI AND SEEMP.pdf
http://slidepdf.com/reader/full/eedi-and-seemppdf 57/62
8/10/2019 EEDI AND SEEMP.pdf
http://slidepdf.com/reader/full/eedi-and-seemppdf 58/62
MEPC 63/INF.2 Annex, page 20
L:\LED\INF\PRESS\2011\EEDI study presentation\REPORT ASSESSMENT OF IMO MANDATED ENERGYEFFICIENCY MEASURES FOR INTERNATIONAL SHIPPING.doc
a 20% reduction (y-axis) of the average EEDI for container new builds is required, the EEDIshould be about 17-18% (x-axis) higher than the current fleet average or ‗reference line‘.
Appendix V References
A1 International Maritime Organization, Marine Environment Protection Committee,Report of the marine environment protection committee on its sixty-second session,MEPC 62/24/Add.1, 26 July 2011.
A2 International Maritime Organization, Marine Environment Protection Committee, A mandatory CO2 Design Index for New Ships, MEPC 57/INF.12, 2008.

8/10/2019 EEDI AND SEEMP.pdf
http://slidepdf.com/reader/full/eedi-and-seemppdf 59/62
MEPC 63/INF.2 Annex, page 21
L:\LED\INF\PRESS\2011\EEDI study presentation\REPORT ASSESSMENT OF IMO MANDATED ENERGYEFFICIENCY MEASURES FOR INTERNATIONAL SHIPPING.doc
Appendix 6
Projected CO2 Emissions Reduction Attributable to EEDI and SEEMP
Growth scenario A1B
SEEMP uptake scenarios High
Fuel price scenario Reference High Reference High Reference High Reference High Reference
Scenario A1B-1 A1B-2 A1B-3 A1B-4 B2-1 B2-2 B2-3 B2-4 30 % waiver
Estimated BAU CO2 emissions
[mill tonnes]866
EEDI - estimated CO2 emission
reduction [mill tonnes]0
SEEMP - estima ted CO2 emiss ion
reduction [mill tonnes]0 0 0 0 0 0 0 0 0
Total estimated CO2 emission
reduction [mill tonnes]0 0 0 0 0 0 0 0 0
Total estimated CO2 emission
reduction [% of total]
0 % 0 % 0 % 0 % 0 % 0 % 0 % 0 % 0 %
Estimated total CO2 emissions
[mill tonnes]944
EEDI - estimated CO2 emission
reduction [mill tonnes]0
SEEMP - estima ted CO2 emiss ion
reduction [mill tonnes]22 22 42 43 21 22 41 42 42
Total estimated CO2 emission
reduction [mill tonnes]22 22 42 43 21 22 41 42 42
Total estimated CO2 emission
reduction [% of total]2 % 2 % 4 % 5 % 2 % 2 % 5 % 5 % 4 %
Estimated total CO2 emissions
[mill tonnes]1 165
EEDI - estimated CO2 emission
reduction [mill tonnes]33
SEEMP - estima ted CO2 emiss ion
reduction [mill tonnes]80 81 154 158 72 73 138 142 155
Total estimated CO2 emission
reduction [mill tonnes] 122 123 196 200 103 104 169 173 189Total estimated CO2 emission
reduction [% of total]10 % 11 % 17 % 17 % 10 % 10 % 16 % 17 % 16 %
Estimated total CO2 emissions
[mill tonnes]1 599
EEDI - estimated CO2 emission
reduction [mill tonnes]216
SEEMP - estima ted CO2 emiss ion
reduction [mill tonnes]100 103 192 199 82 83 156 161 193
Total estimated CO2 emission
reduction [mill tonnes]324 327 416 423 237 238 312 316 409
Total estimated CO2 emission
reduction [% of total]20 % 20 % 26 % 26 % 19 % 19 % 25 % 25 % 26 %
Estimated total CO2 emissions
[mill tonnes]2 242
EEDI - estimated CO2 emission
reduction [mill tonnes]533
SEEMP - estima ted CO2 emiss ionreduction [mill tonnes] 125 130 238 250 90 93 172 180 239
Total estimated CO2 emission
reduction [mill tonnes]662 667 776 788 441 444 523 531 772
Total estimated CO2 emission
reduction [% of total]30 % 30 % 35 % 35 % 28 % 28 % 33 % 34 % 34 %
Estimated total CO2 emissions
[mill tonnes]3 215
EEDI - estimated CO2 emission
reduction [mill tonnes]995
SEEMP - estima ted CO2 emiss ion
reduction [mill tonnes]162 168 311 325 103 106 197 205 311
Total estimated CO2 emission
reduction [mill tonnes]1 158 1 164 1 306 1 320 706 709 800 808 1 306
Total estimated CO2 emission
reduction [% of total]36 % 36 % 41 % 41 % 35 % 35 % 40 % 40 % 41 %
2 0 5 0
3 215 2 014
995 603
2 0 4
0
2 242 1 584
538 351
2 0 3 0
1 599 1 271
224 155
2 0 2 0
1 165 1 040
42 31
2 0 1 3
944 913
0 0
Year
A1B B2
Low High Low High
2 0 1 0
866 866
0 0
Table A6-1 Projected emission reductions attributable to EEDI and SEEMP

8/10/2019 EEDI AND SEEMP.pdf
http://slidepdf.com/reader/full/eedi-and-seemppdf 60/62
MEPC 63/INF.2 Annex, page 22
L:\LED\INF\PRESS\2011\EEDI study presentation\REPORT ASSESSMENT OF IMO MANDATED ENERGYEFFICIENCY MEASURES FOR INTERNATIONAL SHIPPING.doc
Year A1B-1 A1B-2 A1B-3 A1B-4 B2-1 B2-2 B2-3 B2-4 A1B-3WL
2010 866 866 866 866 866 866 866 866 866
2013 944 944 944 944 913 913 913 913 944 2020 1 165 1 165 1 165 1 165 1 040 1 040 1 040 1 040 1 165
2030 1 599 1 599 1 599 1 599 1 271 1 271 1 271 1 271 1 599
2040 2 242 2 242 2 242 2 242 1 584 1 584 1 584 1 584 2 242
2050 3 215 3 215 3 215 3 215 2 014 2 014 2 014 2 014 3 215
Year A1B-1 A1B-2 A1B-3 A1B-4 B2-1 B2-2 B2-3 B2-4 A1B-3WL
2010 - - - - - - - - -
2013 - - - - - - - - -
2020 42 42 42 42 31 31 31 31 33 2030 224 224 224 224 155 155 155 155 216
2040 538 538 538 538 351 351 351 351 351
2050 995 995 995 995 603 603 603 603 995
Year A1B-1 A1B-2 A1B-3 A1B-4 B2-1 B2-2 B2-3 B2-4 A1B-3WL
2010 - - - - - - - - -
2013 22 22 42 43 21 22 41 42 42
2020 80 81 154 158 72 73 138 142 155
2030 100 103 192 199 82 83 156 161 193
2040 125 130 238 250 90 93 172 180
2050 162 168 311 325 103 106 197 205 311
Year A1B-1 A1B-2 A1B-3 A1B-4 B2-1 B2-2 B2-3 B2-4 A1B-3WL
2010 - - - - - - - - -
2013 22 22 42 43 21 22 41 42 42,49
2020 122 123 196 200 103 104 169 173 188,63
2030 324 327 416 423 237 238 312 316 409,22
2040 662 667 776 788 441 444 523 531 -
2050 1 158 1 164 1 306 1 320 706 709 800 808 1 306,30
A1B-3WFuel: Reference, SEEMP uptake: High, Waiver: 30%
Year A1B-1 A1B-2 A1B-3 A1B-4 B2-1 B2-2 B2-3 B2-4 A1B-3WL
2010 0,0 % 0,0 % 0,0 % 0,0 % 0,0 % 0,0 % 0,0 % 0,0 % 0,0 %
2013 2,3 % 2,4 % 4,5 % 4,6 % 2,3 % 2,4 % 4,5 % 4,6 % 4,5 %
2020 10,5 % 10,6 % 16,8 % 17,2 % 9,9 % 10,0 % 16,3 % 16,7 % 16,2 %
2030 20,3 % 20,4 % 26,0 % 26,4 % 18,6 % 18,8 % 24,5 % 24,9 % 25,6 %
2040 29,5 % 29,8 % 34,6 % 35,1 % 27,8 % 28,0 % 33,0 % 33,5 % 34,4 %
2050 36,0 % 36,2 % 40,6 % 41,1 % 35,0 % 35,2 % 39,7 % 40,1 % 40,6 %
World fleetRelative estimated CO2 emission reduction [%]
World fleetTotal estimated CO2 emission reduction [mill tonnes]
World fleetSEEMP - estimated CO2 emission reduction [mill tonnes]
World fleetEEDI - estimated CO2 emission reduction [mill tonnes]
Estimated CO2 emis sions [mil l tonnes]. Scenari o/Option:
Table A6-2 - Estimated Emissions Levels with Alternative Scenarios

8/10/2019 EEDI AND SEEMP.pdf
http://slidepdf.com/reader/full/eedi-and-seemppdf 61/62
MEPC 63/INF.2 Annex, page 23
L:\LED\INF\PRESS\2011\EEDI study presentation\REPORT ASSESSMENT OF IMO MANDATED ENERGYEFFICIENCY MEASURES FOR INTERNATIONAL SHIPPING.doc
Appendix 7 -Projected emissions trends
Projection of CO2 emissions reduction by EEDI and SEEMP for alternative scenarios

8/10/2019 EEDI AND SEEMP.pdf
http://slidepdf.com/reader/full/eedi-and-seemppdf 62/62
MEPC 63/INF.2 Annex, page 24
Appendix 8
Transport efficiency trends