Embed Size (px)
Citation preview
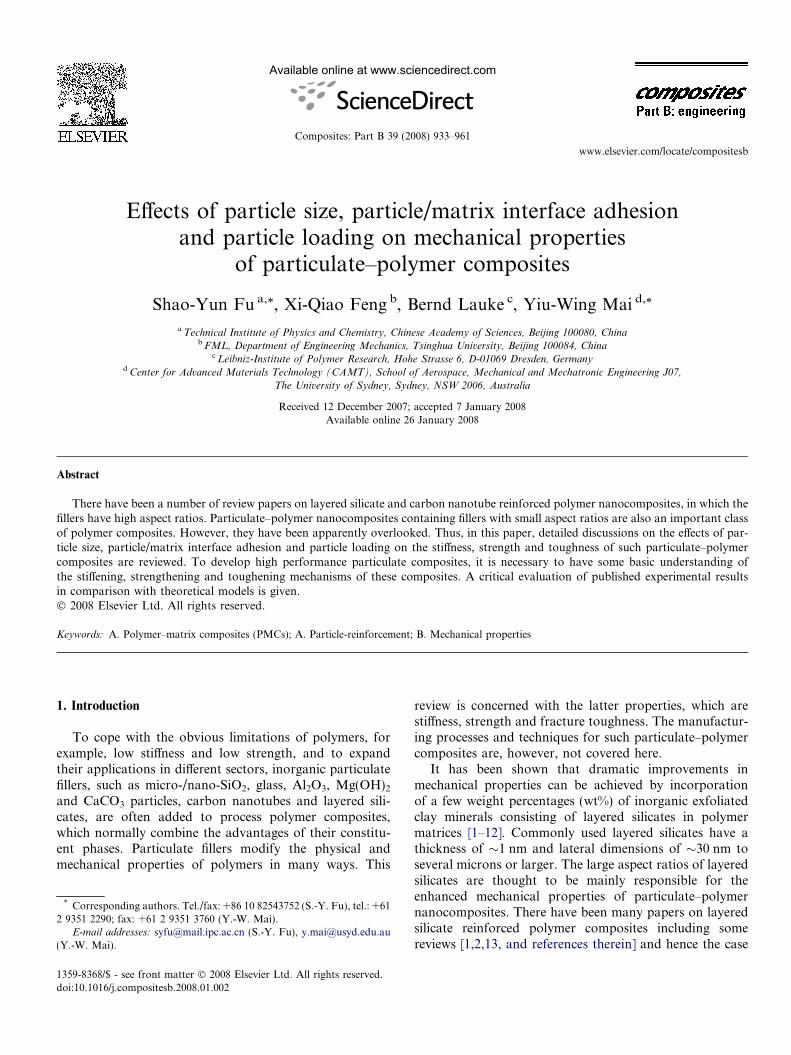
Available online at www.sciencedirect.com
www.elsevier.com/locate/compositesb
Composites: Part B 39 (2008) 933–961
Effects of particle size, particle/matrix interface adhesionand particle loading on mechanical properties
of particulate–polymer composites
Shao-Yun Fu a,*, Xi-Qiao Feng b, Bernd Lauke c, Yiu-Wing Mai d,*
a Technical Institute of Physics and Chemistry, Chinese Academy of Sciences, Beijing 100080, Chinab FML, Department of Engineering Mechanics, Tsinghua University, Beijing 100084, China
c Leibniz-Institute of Polymer Research, Hohe Strasse 6, D-01069 Dresden, Germanyd Center for Advanced Materials Technology (CAMT), School of Aerospace, Mechanical and Mechatronic Engineering J07,
The University of Sydney, Sydney, NSW 2006, Australia
Received 12 December 2007; accepted 7 January 2008Available online 26 January 2008
Abstract
There have been a number of review papers on layered silicate and carbon nanotube reinforced polymer nanocomposites, in which thefillers have high aspect ratios. Particulate–polymer nanocomposites containing fillers with small aspect ratios are also an important classof polymer composites. However, they have been apparently overlooked. Thus, in this paper, detailed discussions on the effects of par-ticle size, particle/matrix interface adhesion and particle loading on the stiffness, strength and toughness of such particulate–polymercomposites are reviewed. To develop high performance particulate composites, it is necessary to have some basic understanding ofthe stiffening, strengthening and toughening mechanisms of these composites. A critical evaluation of published experimental resultsin comparison with theoretical models is given.� 2008 Elsevier Ltd. All rights reserved.
Keywords: A. Polymer–matrix composites (PMCs); A. Particle-reinforcement; B. Mechanical properties
1. Introduction
To cope with the obvious limitations of polymers, forexample, low stiffness and low strength, and to expandtheir applications in different sectors, inorganic particulatefillers, such as micro-/nano-SiO2, glass, Al2O3, Mg(OH)2
and CaCO3 particles, carbon nanotubes and layered sili-cates, are often added to process polymer composites,which normally combine the advantages of their constitu-ent phases. Particulate fillers modify the physical andmechanical properties of polymers in many ways. This
1359-8368/$ - see front matter � 2008 Elsevier Ltd. All rights reserved.
doi:10.1016/j.compositesb.2008.01.002
* Corresponding authors. Tel./fax: +86 10 82543752 (S.-Y. Fu), tel.: +612 9351 2290; fax: +61 2 9351 3760 (Y.-W. Mai).
E-mail addresses: [email protected] (S.-Y. Fu), [email protected](Y.-W. Mai).
review is concerned with the latter properties, which arestiffness, strength and fracture toughness. The manufactur-ing processes and techniques for such particulate–polymercomposites are, however, not covered here.
It has been shown that dramatic improvements inmechanical properties can be achieved by incorporationof a few weight percentages (wt%) of inorganic exfoliatedclay minerals consisting of layered silicates in polymermatrices [1–12]. Commonly used layered silicates have athickness of �1 nm and lateral dimensions of �30 nm toseveral microns or larger. The large aspect ratios of layeredsilicates are thought to be mainly responsible for theenhanced mechanical properties of particulate–polymernanocomposites. There have been many papers on layeredsilicate reinforced polymer composites including somereviews [1,2,13, and references therein] and hence the case
Nomenclature
a, b, c and d constants in Eqs. (18) and (23)A1 and B1 constants in Eq. (3)B empirical constantC1 and C2 constants for a given compositedp particle diameterDs average interparticle distanceEc composite Young’s modulusEm matrix Young’s modulusEp particle Young’s modulusf particle/matrix friction coefficientfc a factor of phase morphology varying between 0
and 1F(dp) parameter as a function of dp and 0 6 F(dp) 6 1g constantGc composite fracture toughness, also critical en-
ergy release rateGm matrix fracture toughness, also critical energy
release ratek, H constants in Eq. (26)kE Einstein coefficientk(Vp) slope of the tensile strength against dp
kp(Vp) constant as a function of particle volume frac-tion
k/ enhanced fracture surface volume fractionKc composite fracture toughness, also stress inten-
sity factorn parameter for Gc taking into account the extra
fracture path around the particlesnp a parameter related to particle size and particle
volume fraction
p pressureP particle aspect (length to width) ratioQ parameter accounting for weaknesses in the
composite structure caused by the discontinu-ities in stress transfer
s crowding factor for the ratio of the apparentvolume occupied by the particle to its own truevolume and its value is between 1.0 and 2.0
S constant in Eq. (30a)Sr strength reduction factorT line tensionVp particle volume fractionVp max maximum packing fractioneK c composite bulk modulusWc impact toughness (work of fracture) of the com-
posite, notched specimeneK m matrix bulk moduluseK p particle bulk moduluseGc composite shear moduluseGm matrix shear moduluseGp particle shear modulusa particle/matrix adhesion coefficientrc composite strength or yield strengthrm matrix strengthra particle/matrix adhesion strengthd Ep/Em
vp particle strengthening factormm matrix Poisson ratio
934 S.-Y. Fu et al. / Composites: Part B 39 (2008) 933–961
of layered nanoparticles will not be discussed here. In con-trast, much attention has been paid to carbon nanotubes(CNTs) as reinforcing fillers for polymers. There are manyresearch papers and several reviews on the mechanicalproperties of CNT reinforced polymer nanocomposites[13–15, and cited references]. Improvements in mechanicalproperties have been observed by adding a few wt% ofCNTs. In these studies, both layered silicates and CNTshave high aspect ratios.
Polymer composites containing particles with a smallaspect ratio of 1 or thereabout have also been studiedextensively because of their technological and scientificimportance. Many studies have been conducted on themechanical properties of these particulate-filled polymercomposites. Stiffness or Young’s modulus can be readilyimproved by adding either micro- or nano-particles sincerigid inorganic particles generally have a much higher stiff-ness than polymer matrices [16–24]. However, strengthstrongly depends on the stress transfer between the parti-cles and the matrix. For well-bonded particles, the appliedstress can be effectively transferred to the particles from the
matrix [25]; this clearly improves the strength [16,26–30].However, for poorly bonded micro-particles, strengthreductions occur by adding particles [17–19,31–37]. Thedrawback of thermosetting resins is their poor resistanceto crack growth [38–41]. But inorganic particles have beenfound to be effective tougheners for thermosetting resins[22,42,43]. Though they do not increase the toughness asdramatically as rubber particle inclusions [44,45], theyincrease the elastic modulus and hardness much better thanrubber particles. In contrast, most studies on thermoplas-tics filled with rigid particulates reported a significantdecrease of fracture toughness compared to the neat poly-mers [19,35,46–48]. There are, however, several studies thatshow toughness increase with introduction of rigid particlesin polypropylene [49,50] and polyethylene [50–57]. Impres-sively enhanced impact toughness has been reported forpolyethylene filled with calcium carbonate particles by Fuand Wang [53–56] and Bartczak et al. [57]. Enhancementof impact properties of some pseudo-ductile polymers bythe introduction of inorganic particles has also beenachieved [57,58].
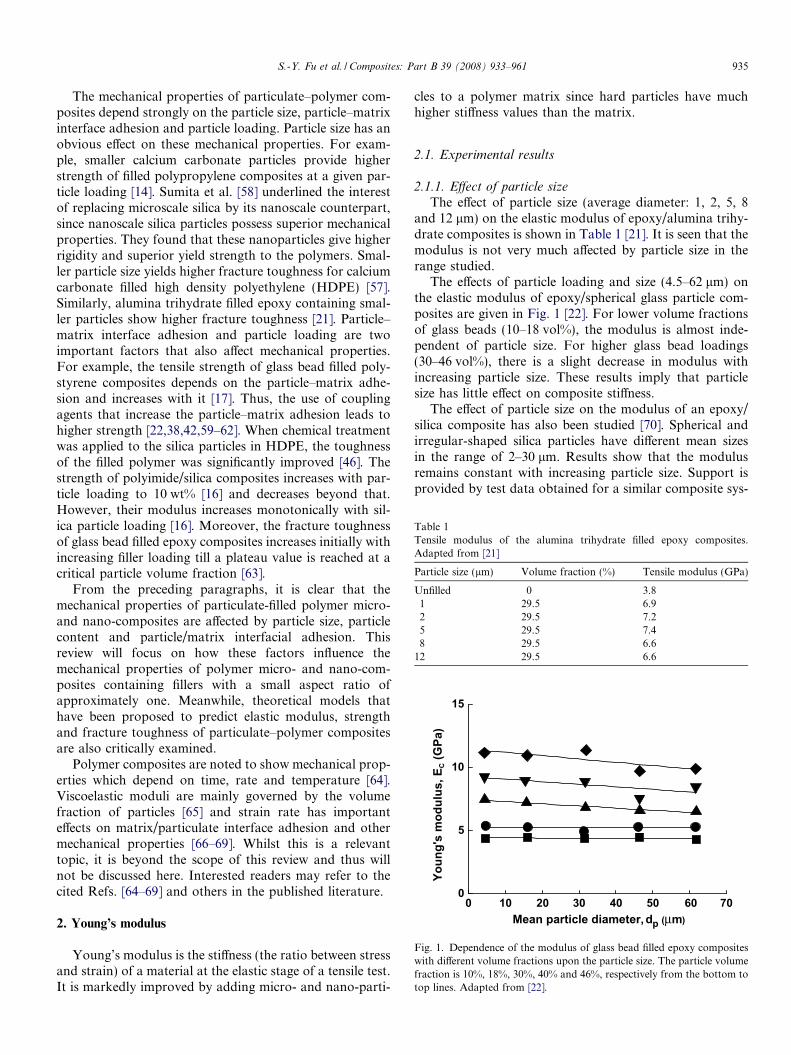
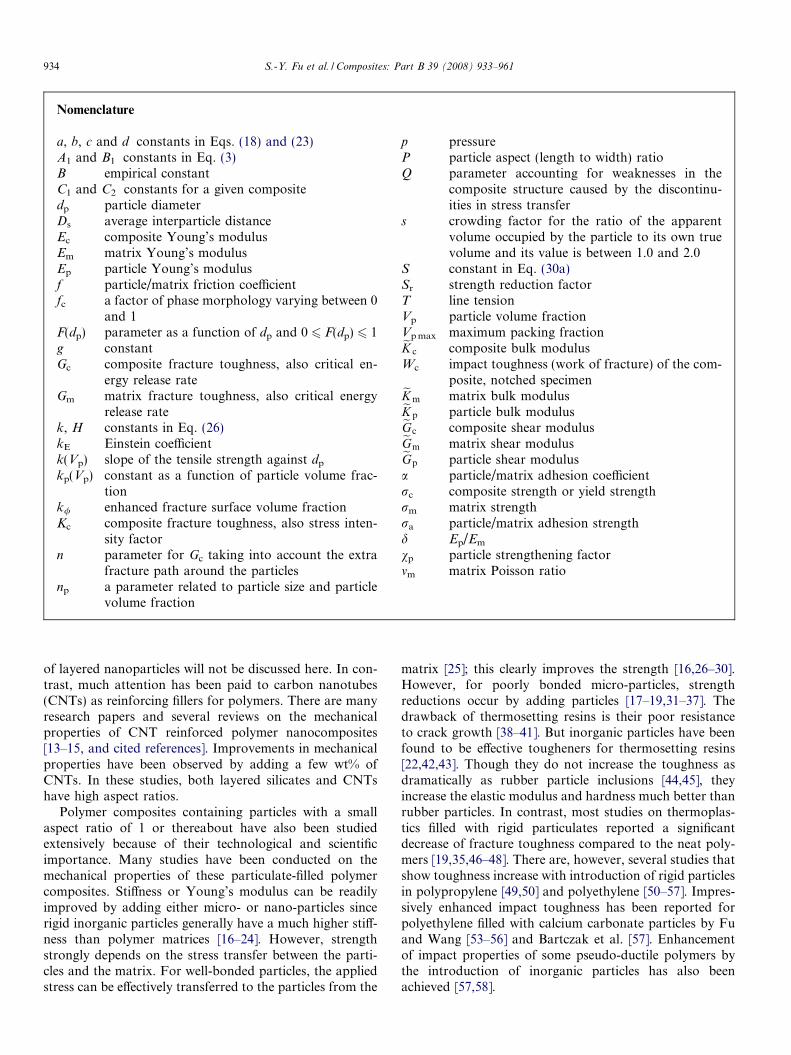
Table 1Tensile modulus of the alumina trihydrate filled epoxy composites.Adapted from [21]
Particle size (lm) Volume fraction (%) Tensile modulus (GPa)
Unfilled 0 3.81 29.5 6.92 29.5 7.25 29.5 7.48 29.5 6.6
12 29.5 6.6
0 10 20 30 40 50 60 700
5
10
15
Youn
g's
mod
ulus
, EC (G
Pa)
Mean particle diameter, dp (μm)
Fig. 1. Dependence of the modulus of glass bead filled epoxy compositeswith different volume fractions upon the particle size. The particle volumefraction is 10%, 18%, 30%, 40% and 46%, respectively from the bottom totop lines. Adapted from [22].
S.-Y. Fu et al. / Composites: Part B 39 (2008) 933–961 935
The mechanical properties of particulate–polymer com-posites depend strongly on the particle size, particle–matrixinterface adhesion and particle loading. Particle size has anobvious effect on these mechanical properties. For exam-ple, smaller calcium carbonate particles provide higherstrength of filled polypropylene composites at a given par-ticle loading [14]. Sumita et al. [58] underlined the interestof replacing microscale silica by its nanoscale counterpart,since nanoscale silica particles possess superior mechanicalproperties. They found that these nanoparticles give higherrigidity and superior yield strength to the polymers. Smal-ler particle size yields higher fracture toughness for calciumcarbonate filled high density polyethylene (HDPE) [57].Similarly, alumina trihydrate filled epoxy containing smal-ler particles show higher fracture toughness [21]. Particle–matrix interface adhesion and particle loading are twoimportant factors that also affect mechanical properties.For example, the tensile strength of glass bead filled poly-styrene composites depends on the particle–matrix adhe-sion and increases with it [17]. Thus, the use of couplingagents that increase the particle–matrix adhesion leads tohigher strength [22,38,42,59–62]. When chemical treatmentwas applied to the silica particles in HDPE, the toughnessof the filled polymer was significantly improved [46]. Thestrength of polyimide/silica composites increases with par-ticle loading to 10 wt% [16] and decreases beyond that.However, their modulus increases monotonically with sil-ica particle loading [16]. Moreover, the fracture toughnessof glass bead filled epoxy composites increases initially withincreasing filler loading till a plateau value is reached at acritical particle volume fraction [63].
From the preceding paragraphs, it is clear that themechanical properties of particulate-filled polymer micro-and nano-composites are affected by particle size, particlecontent and particle/matrix interfacial adhesion. Thisreview will focus on how these factors influence themechanical properties of polymer micro- and nano-com-posites containing fillers with a small aspect ratio ofapproximately one. Meanwhile, theoretical models thathave been proposed to predict elastic modulus, strengthand fracture toughness of particulate–polymer compositesare also critically examined.
Polymer composites are noted to show mechanical prop-erties which depend on time, rate and temperature [64].Viscoelastic moduli are mainly governed by the volumefraction of particles [65] and strain rate has importanteffects on matrix/particulate interface adhesion and othermechanical properties [66–69]. Whilst this is a relevanttopic, it is beyond the scope of this review and thus willnot be discussed here. Interested readers may refer to thecited Refs. [64–69] and others in the published literature.
2. Young’s modulus
Young’s modulus is the stiffness (the ratio between stressand strain) of a material at the elastic stage of a tensile test.It is markedly improved by adding micro- and nano-parti-
cles to a polymer matrix since hard particles have muchhigher stiffness values than the matrix.
2.1. Experimental results
2.1.1. Effect of particle size
The effect of particle size (average diameter: 1, 2, 5, 8and 12 lm) on the elastic modulus of epoxy/alumina trihy-drate composites is shown in Table 1 [21]. It is seen that themodulus is not very much affected by particle size in therange studied.
The effects of particle loading and size (4.5–62 lm) onthe elastic modulus of epoxy/spherical glass particle com-posites are given in Fig. 1 [22]. For lower volume fractionsof glass beads (10–18 vol%), the modulus is almost inde-pendent of particle size. For higher glass bead loadings(30–46 vol%), there is a slight decrease in modulus withincreasing particle size. These results imply that particlesize has little effect on composite stiffness.
The effect of particle size on the modulus of an epoxy/silica composite has also been studied [70]. Spherical andirregular-shaped silica particles have different mean sizesin the range of 2–30 lm. Results show that the modulusremains constant with increasing particle size. Support isprovided by test data obtained for a similar composite sys-
0 1 2 3 4 5 6 7 80.5
1.0
1.5
2.0
2.5
3.0
3.5
Nor
mal
ized
mod
ulus
, EC/E
m
Particle volume fraction, Vp (%)
3 nm 9 nm 30 nm 90 nm 300 nm 3000 nm
Fig. 3. The predicted modulus of spherical particle filled polymercomposite as a function of particle size, where the particle to matrixmodulus ratio Ep/Em = 40. Adapted from [76].
0 3 6 9 12 150
400
800
1200
1600
39 nm
21 nmYo
ung'
s m
odul
us, E
c (M
Pa)
Nano-CaCO3 weight fraction ( %)
Fig. 4. Young’s modulus of 21 nm and 39 nm CaCO3 reinforced PPcomposites at different compositions. Adapted from [77].
936 S.-Y. Fu et al. / Composites: Part B 39 (2008) 933–961
tem over a similar range of silica diameter 6–42 lm [15].Note that the modulus of angular-shaped silica/epoxycomposites decreases marginally with mean particle size(2–47 lm) [71]. The same observation is obtained for alu-minum hydroxide filled polypropylene composites (wherethe average particle diameter varies from 1 to 25 lm)[72]. The elastic modulus of CaCO3-filled polybenzoxazinecomposites increases with filler content but does notdepend on particle size (1, 5 and 20 lm) [73]. Also, themodulus of aluminum particle/polyester composites isunaffected by particle size (100 nm, 3.5 and 20 lm) [74].Similarly, particle size (1–12 lm) does not affect the modu-lus of epoxy/alumina trihydrate powder composites [75].
The tensile moduli of organo-soluble polyimide (PI)/sil-ica composite materials are shown in Fig. 2 [16]. The silicaparticle size is dependent on its loading in the composite.Thus, it is 100–200 nm, 200–450 nm and 1–2 lm, respec-tively, for silica loading of 5, 10 and 20 wt%. Since Young’smodulus increases linearly with silica content, the particlesize effect is insignificant. Otherwise, the relationship willbe non-linear [16].
In the above, it is shown that the particulate compositemodulus is insensitive to particle size. However, when theparticle is decreased to a critical size such as 30 nm, therewill be an obvious effect of particle size on the modulus pre-dicted theoretically as shown in Fig. 3 [76]. Indeed, it is alsoexperimentally observed, Fig. 4 [77], that polypropylene(PP)/CaCO3 composites containing smaller (21 nm) nano-particles have higher Young’s modulus than those compos-ites with larger (39 nm) nanoparticles. Moreover,nanoindentation modulus has been obtained on compositecoatings reinforced with silica of different sizes [78], asshown in Fig. 5. Clearly, the modulus decreases withincreasing particle size from 15 to 35 nm, especially at highparticle loading.
To summarize, it seems that there is a critical particlesize above which there is no effect on composite modulus.When the particle size is below this critical value, the effect
0 10 20 30 40 501.5
2.0
2.5
3.0
3.5
4.0
4.5
Youn
g's
mod
ulus
, Ec
(GPa
)
Silica weight fraction (%)
Fig. 2. The influence of silica content on the tensile modulus of polyimide/silica composite materials. Adapted from [16].
4 6 8 10 12 14 163.0
3.5
4.0
4.5
5.0
5.5
Youn
g's
mod
ulus
, Ec (
MPa
)
Particle volume fraction, Vp (%)
15 nm35 nm
Fig. 5. The Young’s modulus of polysiloxane nanocomposite coatingswith different silica particle sizes as a function of the volume filler content.Adapted from [78].
2.2
2.4
(G
Pa)
C-MAH C-Si C-0 C-SA
S.-Y. Fu et al. / Composites: Part B 39 (2008) 933–961 937
on composite modulus is more significant. The magnitudeof this critical particle size cannot be predicted a priori
for it depends on the particle, matrix and particle/matrixadhesion.
0 5 10 15 20 25 30 351.0
1.2
1.4
1.6
1.8
2.0
Yo
un
g's
mo
du
lus,
Ec
BaSO4 weight fraction (%)
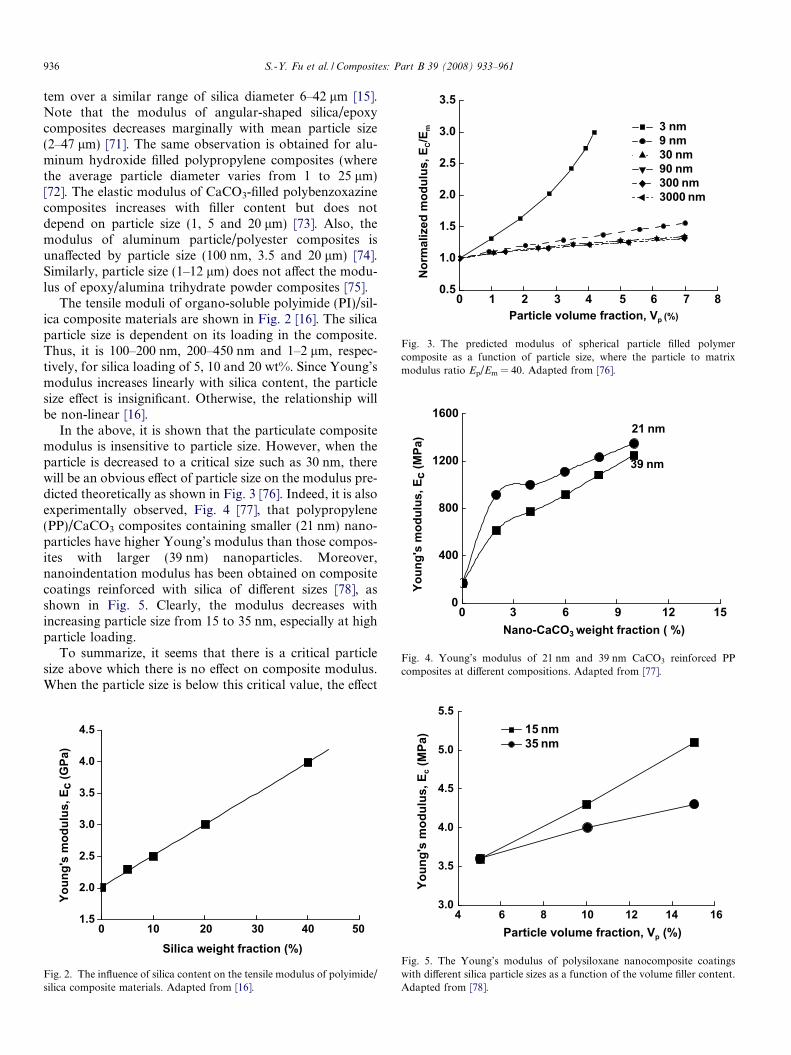
Fig. 7. The Young’s modulus of the PP/BaSO4 composites. M-0: virginPP + BaSO4 without pretreatment; M-SA: virgin PP + BaSO4 pretreatedwith 1 wt% stearic acid; M-SI: virgin PP + BaSO4 pretreated with 1 wt%silane AMPTES; M-MAH: PP-g-MAH + BaSO4 without pretreatment.The resultant composites were designated hereafter as C-0 for PP/M-0, C-SA for PP/M-SA, C-SI for PP/M-SI and C-MAH for PP/M-MAH,respectively. Adapted from [80].
2.1.2. Effect of particle/matrix interfacial adhesion
The tensile modulus of polystyrene (PS)/glass-beadcomposites is shown in Fig. 6 as a function of glass loading[17]. The bonding between glass and PS is varied by usingdifferent coupling agents. It is seen that the modulus isindependent of the interfacial adhesion but increasesalmost linearly with glass loading. Since Young’s modulusis measured at relatively low deformation, there is insuffi-cient dilation to cause interface separation. Thus, it is easyto understand that the adhesion strength does not notice-ably affect the elastic modulus.
Many studies have supported the above observation.Young’s modulus of epoxy/glass bead composites increaseswith glass bead loading [79] but is unaffected by glass sur-face treatment. Moreover, the effect of interfacial bondingon flexural modulus of glass bead (dp � 30 lm) filled epoxyand polyester resins is studied as a function of particle vol-ume fraction and interfacial bond strength [62]. The latterparameter can be varied by chemical surface treatment ofglass using a silicone mold release to prevent chemicalbonding at one extreme and a silane coupling agent tomaximize bonding at the other extreme. No clear effect ofinterfacial bonding on modulus can be seen. Similar resultsare also obtained on the modulus of nanocomposites. Forexample, the modulus of a polypropylene composite filledwith 0–40 vol% of ultra-fine calcium carbonate (dp =70 nm) is studied [35]. Untreated and surface treated parti-cles are considered. A monotonic increase in modulus isnoted with filler loading but no noticeable effect of interfa-cial adhesion on modulus has been found.
Conversely, it is observed that the modulus of polypro-pylene (PP)/BaSO4 composites depends on interfacial mod-ification but this is an indirect effect [80]. It is shown from
0 4 10 15 20 25 30 352
3
4
5
6
7
Youn
g's
mod
ulus
, Ec (
GPa
)
Particle volume fraction, Vp (%)
Fig. 6. The Young’s modulus at 20�C for PS–glass bead composites withexcellent (h) and poor (j) interfacial adhesion. Adapted from [17].
Fig. 7 that the composite modulus is controlled to someextent by particle surface modification. This phenomenonis due to two possible factors: interfacial adhesion andmatrix crystalline structure. The direct effect of the formeris insignificant since modulus is a property at low deforma-tion which is not sensitive to adhesion. The second factor ismainly responsible for the improvement of composite mod-ulus because the crystallinity of semi-crystalline polymers,and hence the composite modulus [80], is affected by thefiller.
In conclusion, interfacial adhesion has little effect on theYoung’s modulus of particulate-filled composites.
2.1.3. Effect of particle loading
The effect of particle loading on composite modulus hasactually been already shown in Figs. 1–7 for some materialsystems, in which the modulus increases with increasingparticle loading. More examples are given below to demon-strate this effect.
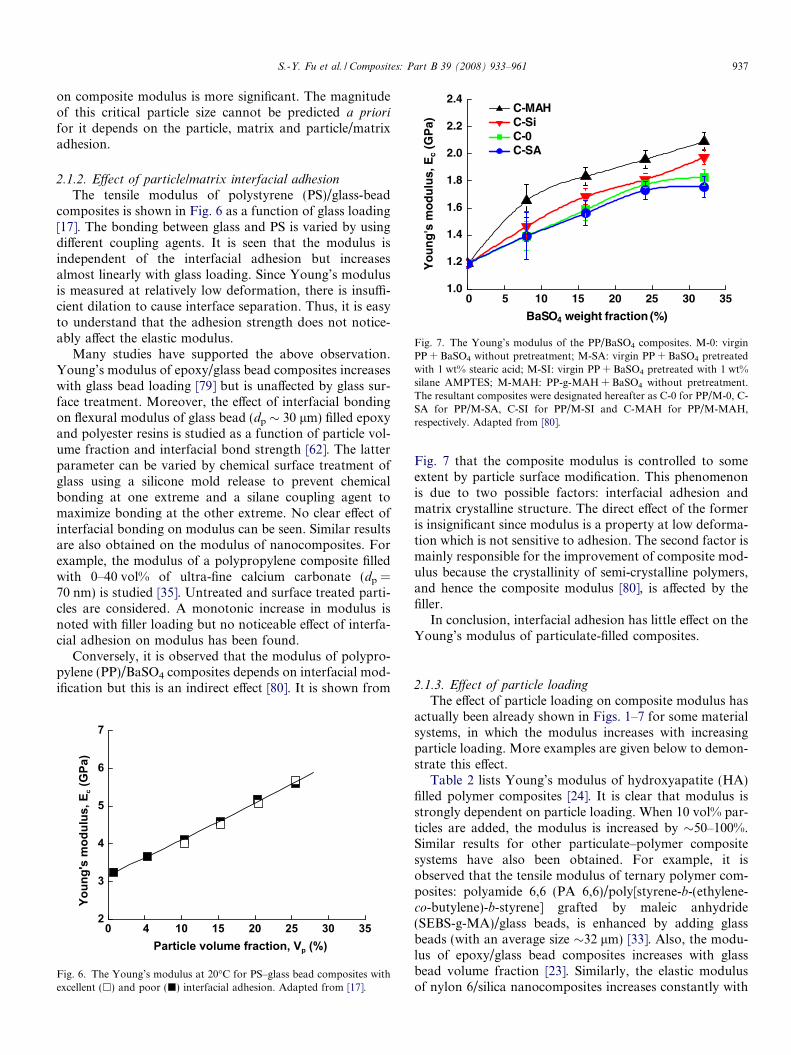
Table 2 lists Young’s modulus of hydroxyapatite (HA)filled polymer composites [24]. It is clear that modulus isstrongly dependent on particle loading. When 10 vol% par-ticles are added, the modulus is increased by �50–100%.Similar results for other particulate–polymer compositesystems have also been obtained. For example, it isobserved that the tensile modulus of ternary polymer com-posites: polyamide 6,6 (PA 6,6)/poly[styrene-b-(ethylene-co-butylene)-b-styrene] grafted by maleic anhydride(SEBS-g-MA)/glass beads, is enhanced by adding glassbeads (with an average size �32 lm) [33]. Also, the modu-lus of epoxy/glass bead composites increases with glassbead volume fraction [23]. Similarly, the elastic modulusof nylon 6/silica nanocomposites increases constantly with
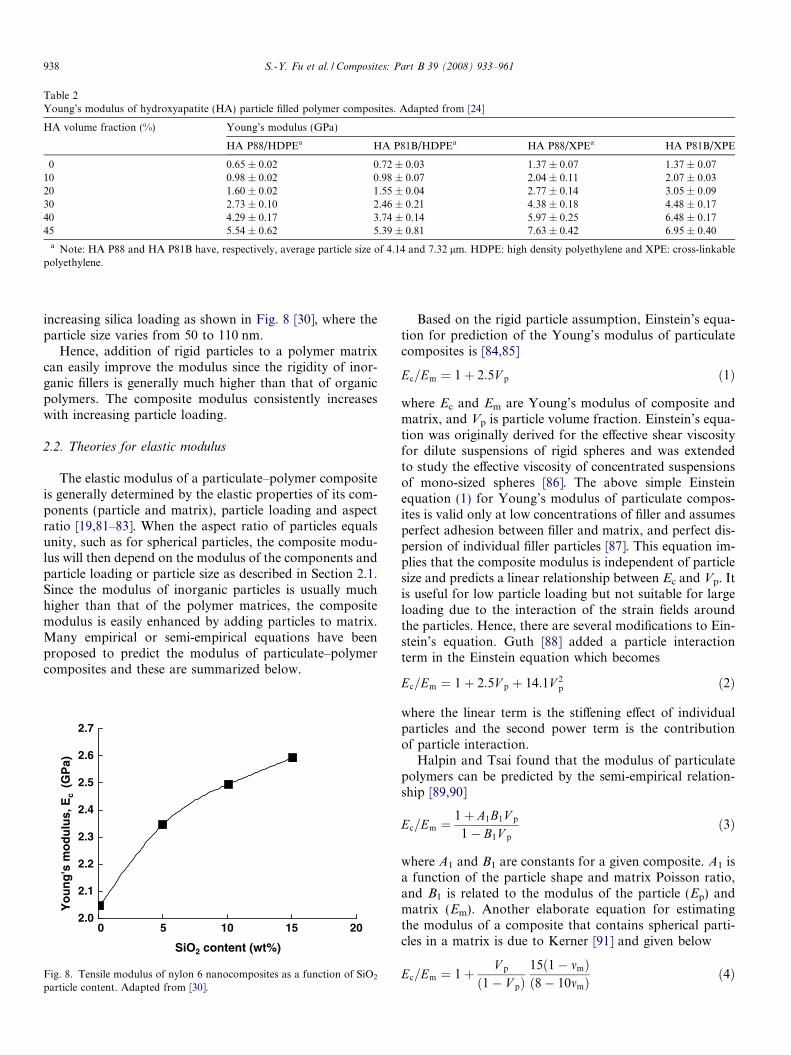
Table 2Young’s modulus of hydroxyapatite (HA) particle filled polymer composites. Adapted from [24]
HA volume fraction (%) Young’s modulus (GPa)
HA P88/HDPEa HA P81B/HDPEa HA P88/XPEa HA P81B/XPE
0 0.65 ± 0.02 0.72 ± 0.03 1.37 ± 0.07 1.37 ± 0.0710 0.98 ± 0.02 0.98 ± 0.07 2.04 ± 0.11 2.07 ± 0.0320 1.60 ± 0.02 1.55 ± 0.04 2.77 ± 0.14 3.05 ± 0.0930 2.73 ± 0.10 2.46 ± 0.21 4.38 ± 0.18 4.48 ± 0.1740 4.29 ± 0.17 3.74 ± 0.14 5.97 ± 0.25 6.48 ± 0.1745 5.54 ± 0.62 5.39 ± 0.81 7.63 ± 0.42 6.95 ± 0.40
a Note: HA P88 and HA P81B have, respectively, average particle size of 4.14 and 7.32 lm. HDPE: high density polyethylene and XPE: cross-linkablepolyethylene.
938 S.-Y. Fu et al. / Composites: Part B 39 (2008) 933–961
increasing silica loading as shown in Fig. 8 [30], where theparticle size varies from 50 to 110 nm.
Hence, addition of rigid particles to a polymer matrixcan easily improve the modulus since the rigidity of inor-ganic fillers is generally much higher than that of organicpolymers. The composite modulus consistently increaseswith increasing particle loading.
2.2. Theories for elastic modulus
The elastic modulus of a particulate–polymer compositeis generally determined by the elastic properties of its com-ponents (particle and matrix), particle loading and aspectratio [19,81–83]. When the aspect ratio of particles equalsunity, such as for spherical particles, the composite modu-lus will then depend on the modulus of the components andparticle loading or particle size as described in Section 2.1.Since the modulus of inorganic particles is usually muchhigher than that of the polymer matrices, the compositemodulus is easily enhanced by adding particles to matrix.Many empirical or semi-empirical equations have beenproposed to predict the modulus of particulate–polymercomposites and these are summarized below.
0 5 10 15 202.0
2.1
2.2
2.3
2.4
2.5
2.6
2.7
Yo
un
g's
mo
du
lus,
Ec (
GP
a)
SiO2 content (wt%)
Fig. 8. Tensile modulus of nylon 6 nanocomposites as a function of SiO2
particle content. Adapted from [30].
Based on the rigid particle assumption, Einstein’s equa-tion for prediction of the Young’s modulus of particulatecomposites is [84,85]
Ec=Em ¼ 1þ 2:5V p ð1Þ
where Ec and Em are Young’s modulus of composite andmatrix, and Vp is particle volume fraction. Einstein’s equa-tion was originally derived for the effective shear viscosityfor dilute suspensions of rigid spheres and was extendedto study the effective viscosity of concentrated suspensionsof mono-sized spheres [86]. The above simple Einsteinequation (1) for Young’s modulus of particulate compos-ites is valid only at low concentrations of filler and assumesperfect adhesion between filler and matrix, and perfect dis-persion of individual filler particles [87]. This equation im-plies that the composite modulus is independent of particlesize and predicts a linear relationship between Ec and Vp. Itis useful for low particle loading but not suitable for largeloading due to the interaction of the strain fields aroundthe particles. Hence, there are several modifications to Ein-stein’s equation. Guth [88] added a particle interactionterm in the Einstein equation which becomes
Ec=Em ¼ 1þ 2:5V p þ 14:1V 2p ð2Þ
where the linear term is the stiffening effect of individualparticles and the second power term is the contributionof particle interaction.
Halpin and Tsai found that the modulus of particulatepolymers can be predicted by the semi-empirical relation-ship [89,90]
Ec=Em ¼1þ A1B1V p
1� B1V p
ð3Þ
where A1 and B1 are constants for a given composite. A1 isa function of the particle shape and matrix Poisson ratio,and B1 is related to the modulus of the particle (Ep) andmatrix (Em). Another elaborate equation for estimatingthe modulus of a composite that contains spherical parti-cles in a matrix is due to Kerner [91] and given below
Ec=Em ¼ 1þ V p
ð1� V pÞ15ð1� mmÞð8� 10mmÞ
ð4Þ
0 5 10 15 20 252.6
2.8
3.0
3.2
3.4
3.6
Youn
g's
mod
ulus
,Ec
(GPa
)
Particle weight fraction (%)
Particle diameter: 12 nm25 nm50 nm
Kerner's approach
Series coupling
Parallelcoupling
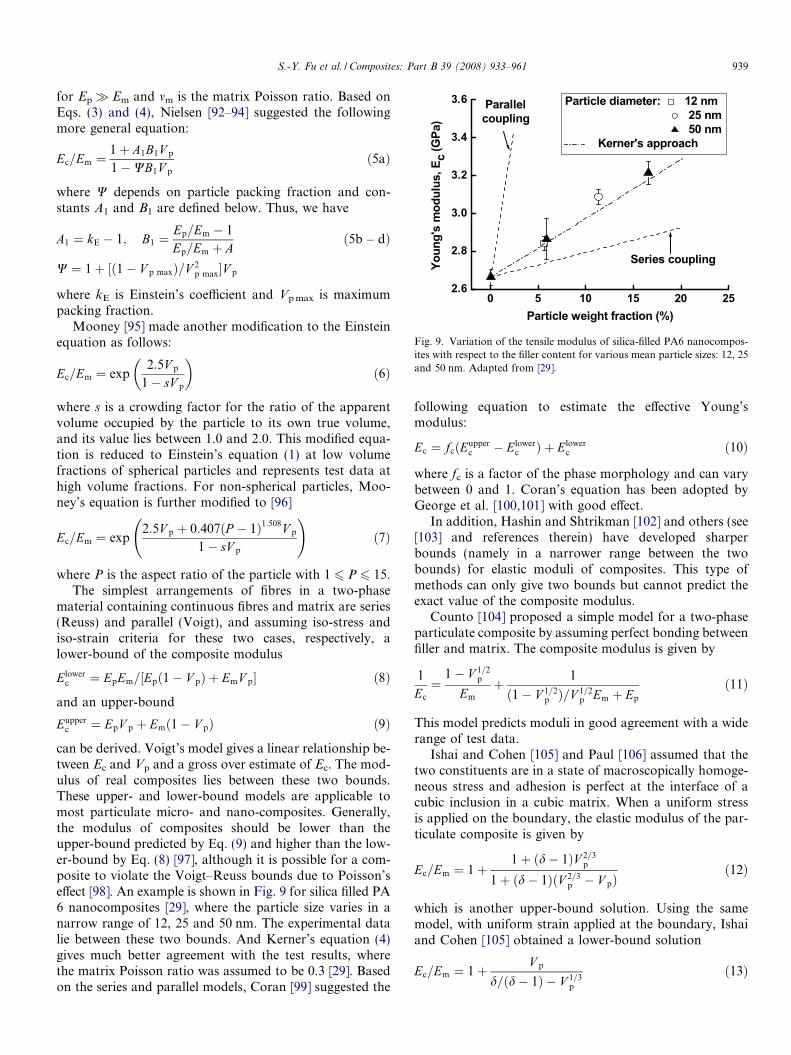
Fig. 9. Variation of the tensile modulus of silica-filled PA6 nanocompos-ites with respect to the filler content for various mean particle sizes: 12, 25and 50 nm. Adapted from [29].
S.-Y. Fu et al. / Composites: Part B 39 (2008) 933–961 939
for Ep� Em and mm is the matrix Poisson ratio. Based onEqs. (3) and (4), Nielsen [92–94] suggested the followingmore general equation:
Ec=Em ¼1þ A1B1V p
1�WB1V p
ð5aÞ
where W depends on particle packing fraction and con-stants A1 and B1 are defined below. Thus, we have
A1 ¼ kE � 1; B1 ¼Ep=Em � 1
Ep=Em þ Að5b – dÞ
W ¼ 1þ ½ð1� V p maxÞ=V 2p max�V p
where kE is Einstein’s coefficient and Vp max is maximumpacking fraction.
Mooney [95] made another modification to the Einsteinequation as follows:
Ec=Em ¼ exp2:5V p
1� sV p
� �ð6Þ
where s is a crowding factor for the ratio of the apparentvolume occupied by the particle to its own true volume,and its value lies between 1.0 and 2.0. This modified equa-tion is reduced to Einstein’s equation (1) at low volumefractions of spherical particles and represents test data athigh volume fractions. For non-spherical particles, Moo-ney’s equation is further modified to [96]
Ec=Em ¼ exp2:5V p þ 0:407ðP � 1Þ1:508V p
1� sV p
!ð7Þ
where P is the aspect ratio of the particle with 1 6 P 6 15.The simplest arrangements of fibres in a two-phase
material containing continuous fibres and matrix are series(Reuss) and parallel (Voigt), and assuming iso-stress andiso-strain criteria for these two cases, respectively, alower-bound of the composite modulus
Elowerc ¼ EpEm=½Epð1� V pÞ þ EmV p� ð8Þ
and an upper-bound
Eupperc ¼ EpV p þ Emð1� V pÞ ð9Þ
can be derived. Voigt’s model gives a linear relationship be-tween Ec and Vp and a gross over estimate of Ec. The mod-ulus of real composites lies between these two bounds.These upper- and lower-bound models are applicable tomost particulate micro- and nano-composites. Generally,the modulus of composites should be lower than theupper-bound predicted by Eq. (9) and higher than the low-er-bound by Eq. (8) [97], although it is possible for a com-posite to violate the Voigt–Reuss bounds due to Poisson’seffect [98]. An example is shown in Fig. 9 for silica filled PA6 nanocomposites [29], where the particle size varies in anarrow range of 12, 25 and 50 nm. The experimental datalie between these two bounds. And Kerner’s equation (4)gives much better agreement with the test results, wherethe matrix Poisson ratio was assumed to be 0.3 [29]. Basedon the series and parallel models, Coran [99] suggested the
following equation to estimate the effective Young’smodulus:
Ec ¼ fcðEupperc � Elower
c Þ þ Elowerc ð10Þ
where fc is a factor of the phase morphology and can varybetween 0 and 1. Coran’s equation has been adopted byGeorge et al. [100,101] with good effect.
In addition, Hashin and Shtrikman [102] and others (see[103] and references therein) have developed sharperbounds (namely in a narrower range between the twobounds) for elastic moduli of composites. This type ofmethods can only give two bounds but cannot predict theexact value of the composite modulus.
Counto [104] proposed a simple model for a two-phaseparticulate composite by assuming perfect bonding betweenfiller and matrix. The composite modulus is given by
1
Ec
¼1� V 1=2
p
Em
þ 1
ð1� V 1=2p Þ=V 1=2
p Em þ Ep
ð11Þ
This model predicts moduli in good agreement with a widerange of test data.
Ishai and Cohen [105] and Paul [106] assumed that thetwo constituents are in a state of macroscopically homoge-neous stress and adhesion is perfect at the interface of acubic inclusion in a cubic matrix. When a uniform stressis applied on the boundary, the elastic modulus of the par-ticulate composite is given by
Ec=Em ¼ 1þ1þ ðd� 1ÞV 2=3
p
1þ ðd� 1ÞðV 2=3p � V pÞ
ð12Þ
which is another upper-bound solution. Using the samemodel, with uniform strain applied at the boundary, Ishaiand Cohen [105] obtained a lower-bound solution
Ec=Em ¼ 1þ V p
d=ðd� 1Þ � V 1=3p
ð13Þ
940 S.-Y. Fu et al. / Composites: Part B 39 (2008) 933–961
where d = Ep/Em. The dependence of Young’s modulus ofepoxy/glass bead composites and epoxy/rubber has beentested by using the model, that is, Eqs. (12) and (13)[107]. However, only the lower-bound solution fits the datawell. This observation has also been found by Young et al.[108]. Nonetheless, the model should give upper- and low-er-bounds to the composite modulus [109], namely, all datalie between the two bounds described by Eqs. (12) and (13).Indeed, the modulus results obtained for PP/ultra-fineCaCO3 composites fell within these two bounds.
For simplicity and without loss of accuracy, an approx-imate method, that is, the modified rule of mixtures, canalso be used to predict the elastic modulus of particulatecomposites [110]
Ec ¼ vpEpV p þ Emð1� V pÞ ð14Þ
where 0 < vp < 1 is a particle strengthening factor. Theelastic moduli of particulate composites predicted by Eq.(14), originally developed for modulus of short-fibre com-posites [18,111–113], fall between those predicted by theReuss (Eq. (8)) and Voigt models (Eq. (9)).
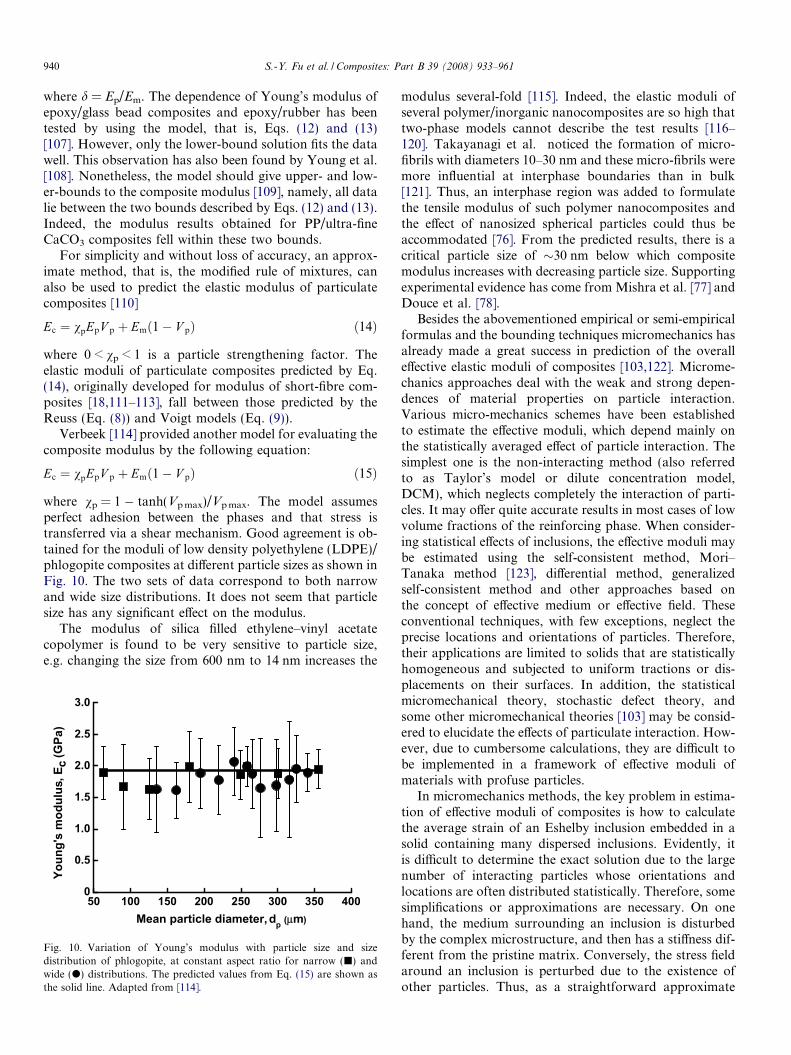
Verbeek [114] provided another model for evaluating thecomposite modulus by the following equation:
Ec ¼ vpEpV p þ Emð1� V pÞ ð15Þ
where vp = 1 � tanh(Vp max)/Vp max. The model assumesperfect adhesion between the phases and that stress istransferred via a shear mechanism. Good agreement is ob-tained for the moduli of low density polyethylene (LDPE)/phlogopite composites at different particle sizes as shown inFig. 10. The two sets of data correspond to both narrowand wide size distributions. It does not seem that particlesize has any significant effect on the modulus.
The modulus of silica filled ethylene–vinyl acetatecopolymer is found to be very sensitive to particle size,e.g. changing the size from 600 nm to 14 nm increases the
50 100 150 200 250 300 350 4000
0.5
1.0
1.5
2.0
2.5
3.0
Youn
g's
mod
ulus
, Ec
(GPa
)
Mean particle diameter, dp (μm)
Fig. 10. Variation of Young’s modulus with particle size and sizedistribution of phlogopite, at constant aspect ratio for narrow (j) andwide (d) distributions. The predicted values from Eq. (15) are shown asthe solid line. Adapted from [114].
modulus several-fold [115]. Indeed, the elastic moduli ofseveral polymer/inorganic nanocomposites are so high thattwo-phase models cannot describe the test results [116–120]. Takayanagi et al. noticed the formation of micro-fibrils with diameters 10–30 nm and these micro-fibrils weremore influential at interphase boundaries than in bulk[121]. Thus, an interphase region was added to formulatethe tensile modulus of such polymer nanocomposites andthe effect of nanosized spherical particles could thus beaccommodated [76]. From the predicted results, there is acritical particle size of �30 nm below which compositemodulus increases with decreasing particle size. Supportingexperimental evidence has come from Mishra et al. [77] andDouce et al. [78].
Besides the abovementioned empirical or semi-empiricalformulas and the bounding techniques micromechanics hasalready made a great success in prediction of the overalleffective elastic moduli of composites [103,122]. Microme-chanics approaches deal with the weak and strong depen-dences of material properties on particle interaction.Various micro-mechanics schemes have been establishedto estimate the effective moduli, which depend mainly onthe statistically averaged effect of particle interaction. Thesimplest one is the non-interacting method (also referredto as Taylor’s model or dilute concentration model,DCM), which neglects completely the interaction of parti-cles. It may offer quite accurate results in most cases of lowvolume fractions of the reinforcing phase. When consider-ing statistical effects of inclusions, the effective moduli maybe estimated using the self-consistent method, Mori–Tanaka method [123], differential method, generalizedself-consistent method and other approaches based onthe concept of effective medium or effective field. Theseconventional techniques, with few exceptions, neglect theprecise locations and orientations of particles. Therefore,their applications are limited to solids that are statisticallyhomogeneous and subjected to uniform tractions or dis-placements on their surfaces. In addition, the statisticalmicromechanical theory, stochastic defect theory, andsome other micromechanical theories [103] may be consid-ered to elucidate the effects of particulate interaction. How-ever, due to cumbersome calculations, they are difficult tobe implemented in a framework of effective moduli ofmaterials with profuse particles.
In micromechanics methods, the key problem in estima-tion of effective moduli of composites is how to calculatethe average strain of an Eshelby inclusion embedded in asolid containing many dispersed inclusions. Evidently, itis difficult to determine the exact solution due to the largenumber of interacting particles whose orientations andlocations are often distributed statistically. Therefore, somesimplifications or approximations are necessary. On onehand, the medium surrounding an inclusion is disturbedby the complex microstructure, and then has a stiffness dif-ferent from the pristine matrix. Conversely, the stress fieldaround an inclusion is perturbed due to the existence ofother particles. Thus, as a straightforward approximate
S.-Y. Fu et al. / Composites: Part B 39 (2008) 933–961 941
model, the inclusion is assumed to be surrounded by aneffective medium, also referred to as the reference matrix,with a stiffness (or compliance) and subjected to an effectivestress (or strain) in the far field. This approximation, whichrenders the analytical evaluation of the effective moduli ofa heterogeneous solid, is common to all the effective med-ium methods and the effective field methods aforemen-tioned, although the definitions of the effective mediumand the effective field in these methods are different.
A rather simple and accurate micromechanics method isMori–Tanaka method [123]. It assumes each inclusion inthe infinite pristine matrix loaded by an effective stress thatequals the average stress over the matrix. The effectivemoduli of inclusion-dispersed composites may be easilyderived with good accuracy even for a high volume fractionof inclusions. For a composite reinforced by particles ofspherical shape, this method leads to the effective Young’smodulus Ec, bulk modulus eK m and shear modulus eGc as
Ec ¼9eK c
eGc
3eK c þ eGc
ð16aÞ
eK c ¼ eK m þV peK mðeK p � eK mÞeK m þ b2ð1� V pÞðeK p � eK mÞ
ð16bÞ
eGc ¼ eGm þV peGmðeGp � eGmÞeGm þ b1ð1� V pÞðeGp � eGmÞ
ð16cÞ
where b1 ¼ 2ð4�5mmÞ15ð1�mmÞ, b2 = 3 � 5b1, eK and eG denote the bulk
modulus and the shear modulus, the subscripts ‘‘m” and‘‘p” stand for matrix and particulate, respectively. Manyother analytical or semi-analytical solutions from microm-echanics methods are available in the literature but areomitted here for conciseness.
The effect of particle size on the effective elastic modulusof composites has recently attracted much attention, espe-cially for nanoparticle-reinforced composites. The particlesrestrict the mobility and deformation of the matrix byintroducing a mechanical restraint. The restriction in poly-meric molecular diffusion in the presence of solid particlesoccurs because of an effective attraction potential betweensegments of the chain and the repulsive potential that thepolymer is subjected to when it is close to solid particles.The degree of the particle restriction depends on the prop-erties of the filler and the matrix [124,125]. This effect ofinterfacial phase or interphase also makes a contributionto the enhancement in the composite modulus. For parti-cles of size larger than 1 lm, however, this contribution willbe negligible compared to that of the particles. The zero-thickness assumption for interfaces is generally acceptable.The reasons are twofold. First, the restriction to the mobil-ity and deformation of matrix by particles should be lim-ited to a very small volume for a low Vp because thethickness of interphase is generally about 1 nm or smallerand the content of particles added in composites is usuallysmall. Second, while for a high Vp the elastic modulus ofthe confined polymer near interfaces is much lower thanthat of the particles, though higher than the unconfined
polymer. This independence of elastic modulus of parti-cle-filled micro-composites is consistent with the predictionof conventional micromechanics which neither has aninternal length parameter in its constitutive relation noraccounts for the interphase effects. In addition, Christensenand Lo’s three-phase model [126], Mori–Tanaka method,self-consistent method, Halpin and Kardos’ model [127]of micromechanics can also be extended to account forthe interface effect by including an interphase regionbetween the matrix and particles [128,129]. For instance,Colombini et al. [130,131] used the self-consistent schemebased on a ‘‘particle-interphase-matrix” three-phase unitcell model to study the influence of the particle size andshape on the mechanical properties of bimodal hard/softlatex blends. They found that the smaller the size of thehard particles, the better the mechanical enhancement ofthe mechanical film properties. Sevostianova and Kacha-nov [132] used a differential scheme suggested by Shenand Li [133] to account for the interphase effect on effectiveelastic moduli. Lutz and Zimmerman [134] addressed theeffect of an inhomogeneous interphase zone on the bulkmodulus and conductivity of particulate composites.
For reviews and recapitulations of micromechanics the-ories and the related results, the reader is referred to Refs.[103,122] and references cited therein. Most previous workwas conducted based on Eshelby’s inclusion theory [135]for those composites comprised of well-defined inclusionsdispersed in a connected matrix phase. The conventionalEshelby’s tensor was derived for elliptical inclusions per-fectly bonded to the matrix by assuming that the interfaceregion has a zero thickness. To account for the size effect ofparticles, the classical formulation of Eshelby’s theory hasbeen revisited to include the surface/interface stresses, ten-sion and energy [136]. The influences of such factors as par-ticle agglomeration and interface debonding on the elasticmoduli have also been studied recently (see for example,[137–141] and references therein).
3. Strength
The strength of a material is defined as the maximumstress that the material can sustain under uniaxial tensileloading. For micro- and nano-particulate composites thisrelies on the effectiveness of stress transfer between matrixand fillers. Factors like particle size, particle/matrix interfa-cial strength and particle loading that significantly affectthe composite strength are discussed below.
3.1. Experimental results
3.1.1. Effect of particle size
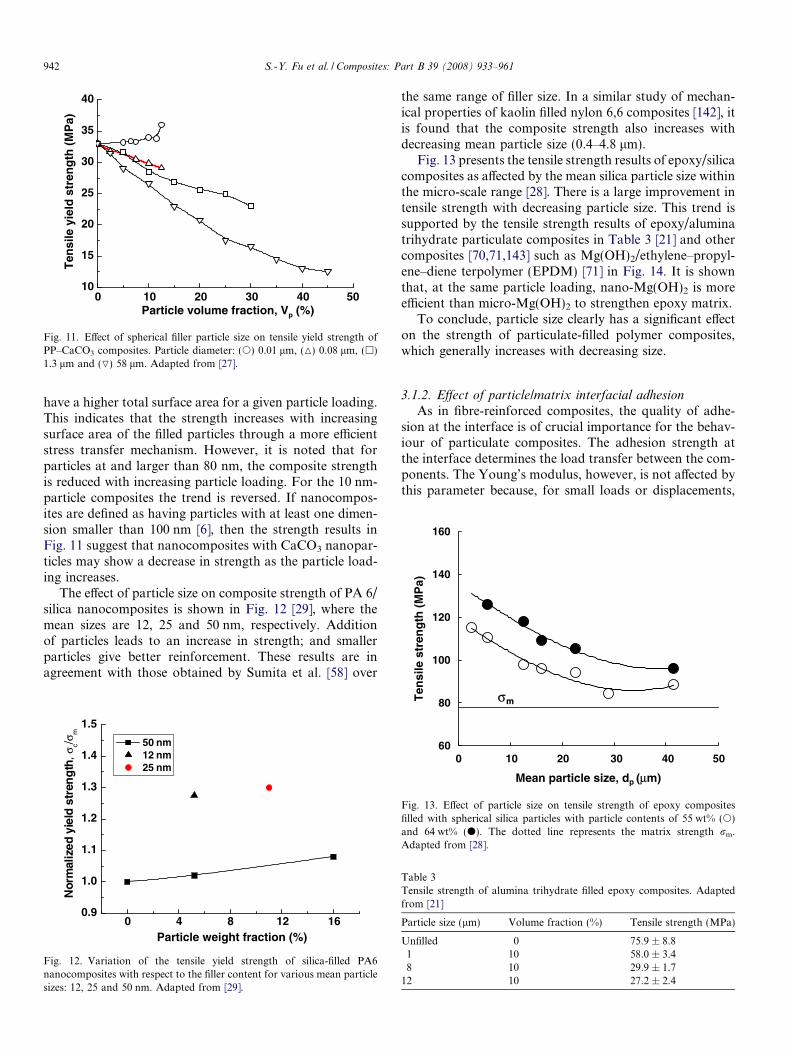
The effect of spherical particle size on the tensile yieldstrength of polypropylene (PP)/CaCO3 composites isshown in Fig. 11 [27]. The particle size varies from10 nm, 80 nm, 1.3 to 58 lm. It is clearly shown that, fora given particulate volume fraction, the composite strengthincreases with decreasing particle size. Smaller particles
0 10 20 30 40 5010
15
20
25
30
35
40
Ten
sile
yie
ld s
tren
gth
(M
Pa)
Particle volume fraction, Vp (%)
Fig. 11. Effect of spherical filler particle size on tensile yield strength ofPP–CaCO3 composites. Particle diameter: (s) 0.01 lm, (M) 0.08 lm, (h)1.3 lm and (O) 58 lm. Adapted from [27].
100
120
140
160
sile
str
eng
th (
MP
a)
942 S.-Y. Fu et al. / Composites: Part B 39 (2008) 933–961
have a higher total surface area for a given particle loading.This indicates that the strength increases with increasingsurface area of the filled particles through a more efficientstress transfer mechanism. However, it is noted that forparticles at and larger than 80 nm, the composite strengthis reduced with increasing particle loading. For the 10 nm-particle composites the trend is reversed. If nanocompos-ites are defined as having particles with at least one dimen-sion smaller than 100 nm [6], then the strength results inFig. 11 suggest that nanocomposites with CaCO3 nanopar-ticles may show a decrease in strength as the particle load-ing increases.
The effect of particle size on composite strength of PA 6/silica nanocomposites is shown in Fig. 12 [29], where themean sizes are 12, 25 and 50 nm, respectively. Additionof particles leads to an increase in strength; and smallerparticles give better reinforcement. These results are inagreement with those obtained by Sumita et al. [58] over
0 4 8 12 160.9
1.0
1.1
1.2
1.3
1.4
1.5
Nor
mal
ized
yie
ld s
tren
gth
,σc/σ
m
Particle weight fraction (%)
50 nm 12 nm 25 nm
Fig. 12. Variation of the tensile yield strength of silica-filled PA6nanocomposites with respect to the filler content for various mean particlesizes: 12, 25 and 50 nm. Adapted from [29].
the same range of filler size. In a similar study of mechan-ical properties of kaolin filled nylon 6,6 composites [142], itis found that the composite strength also increases withdecreasing mean particle size (0.4–4.8 lm).
Fig. 13 presents the tensile strength results of epoxy/silicacomposites as affected by the mean silica particle size withinthe micro-scale range [28]. There is a large improvement intensile strength with decreasing particle size. This trend issupported by the tensile strength results of epoxy/aluminatrihydrate particulate composites in Table 3 [21] and othercomposites [70,71,143] such as Mg(OH)2/ethylene–propyl-ene–diene terpolymer (EPDM) [71] in Fig. 14. It is shownthat, at the same particle loading, nano-Mg(OH)2 is moreefficient than micro-Mg(OH)2 to strengthen epoxy matrix.
To conclude, particle size clearly has a significant effecton the strength of particulate-filled polymer composites,which generally increases with decreasing size.
3.1.2. Effect of particle/matrix interfacial adhesion
As in fibre-reinforced composites, the quality of adhe-sion at the interface is of crucial importance for the behav-iour of particulate composites. The adhesion strength atthe interface determines the load transfer between the com-ponents. The Young’s modulus, however, is not affected bythis parameter because, for small loads or displacements,
Table 3Tensile strength of alumina trihydrate filled epoxy composites. Adaptedfrom [21]
Particle size (lm) Volume fraction (%) Tensile strength (MPa)
Unfilled 0 75.9 ± 8.81 10 58.0 ± 3.48 10 29.9 ± 1.7
12 10 27.2 ± 2.4
60
80
0 10 20 30 40 50
Mean particle size, dp (μm)
Ten σm
Fig. 13. Effect of particle size on tensile strength of epoxy compositesfilled with spherical silica particles with particle contents of 55 wt% (s)and 64 wt% (d). The dotted line represents the matrix strength rm.Adapted from [28].
20
24
28
32
36
40
0 5 10 15 20 25 30
Particle volume fraction, Vp (%)
Ten
sile
str
eng
th, σ
c (M
Pa)
Fig. 15. The tensile strength at 20 �C for PS–glass bead composites withexcellent (h) and poor (d) interfacial adhesion. Adapted from [17].
0 20 40 60 80 100 1200
4
8
12
16
20
NanoMesh 2500Mesh 1250Mesh 800
Ten
sile
str
eng
th, σ
c (M
Pa)
Particle weight fraction (%)
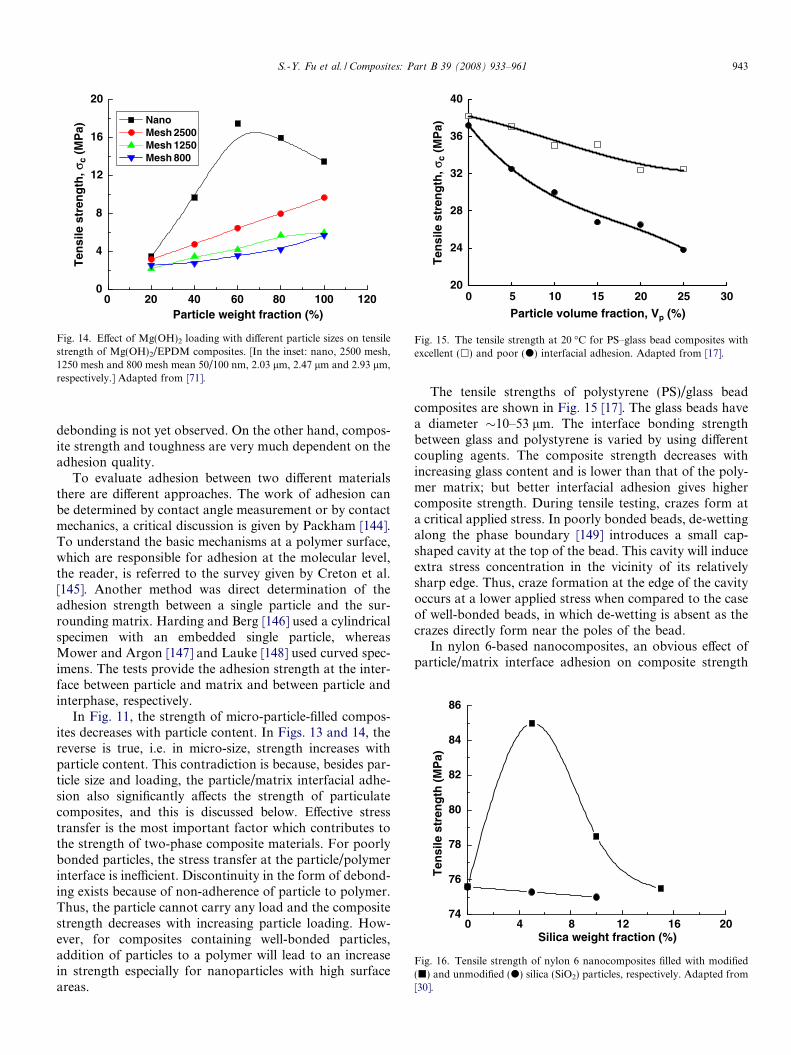
Fig. 14. Effect of Mg(OH)2 loading with different particle sizes on tensilestrength of Mg(OH)2/EPDM composites. [In the inset: nano, 2500 mesh,1250 mesh and 800 mesh mean 50/100 nm, 2.03 lm, 2.47 lm and 2.93 lm,respectively.] Adapted from [71].
0 4 8 12 16 2074
76
78
80
82
84
86
Ten
sile
str
eng
th (
MP
a)
Silica weight fraction (%)
Fig. 16. Tensile strength of nylon 6 nanocomposites filled with modified(j) and unmodified (d) silica (SiO2) particles, respectively. Adapted from[30].
S.-Y. Fu et al. / Composites: Part B 39 (2008) 933–961 943
debonding is not yet observed. On the other hand, compos-ite strength and toughness are very much dependent on theadhesion quality.
To evaluate adhesion between two different materialsthere are different approaches. The work of adhesion canbe determined by contact angle measurement or by contactmechanics, a critical discussion is given by Packham [144].To understand the basic mechanisms at a polymer surface,which are responsible for adhesion at the molecular level,the reader, is referred to the survey given by Creton et al.[145]. Another method was direct determination of theadhesion strength between a single particle and the sur-rounding matrix. Harding and Berg [146] used a cylindricalspecimen with an embedded single particle, whereasMower and Argon [147] and Lauke [148] used curved spec-imens. The tests provide the adhesion strength at the inter-face between particle and matrix and between particle andinterphase, respectively.
In Fig. 11, the strength of micro-particle-filled compos-ites decreases with particle content. In Figs. 13 and 14, thereverse is true, i.e. in micro-size, strength increases withparticle content. This contradiction is because, besides par-ticle size and loading, the particle/matrix interfacial adhe-sion also significantly affects the strength of particulatecomposites, and this is discussed below. Effective stresstransfer is the most important factor which contributes tothe strength of two-phase composite materials. For poorlybonded particles, the stress transfer at the particle/polymerinterface is inefficient. Discontinuity in the form of debond-ing exists because of non-adherence of particle to polymer.Thus, the particle cannot carry any load and the compositestrength decreases with increasing particle loading. How-ever, for composites containing well-bonded particles,addition of particles to a polymer will lead to an increasein strength especially for nanoparticles with high surfaceareas.
The tensile strengths of polystyrene (PS)/glass beadcomposites are shown in Fig. 15 [17]. The glass beads havea diameter �10–53 lm. The interface bonding strengthbetween glass and polystyrene is varied by using differentcoupling agents. The composite strength decreases withincreasing glass content and is lower than that of the poly-mer matrix; but better interfacial adhesion gives highercomposite strength. During tensile testing, crazes form ata critical applied stress. In poorly bonded beads, de-wettingalong the phase boundary [149] introduces a small cap-shaped cavity at the top of the bead. This cavity will induceextra stress concentration in the vicinity of its relativelysharp edge. Thus, craze formation at the edge of the cavityoccurs at a lower applied stress when compared to the caseof well-bonded beads, in which de-wetting is absent as thecrazes directly form near the poles of the bead.
In nylon 6-based nanocomposites, an obvious effect ofparticle/matrix interface adhesion on composite strength
944 S.-Y. Fu et al. / Composites: Part B 39 (2008) 933–961
also exists [30]. If the particles, whose size varies from 50 to110 nm, are untreated, the strength decreases only margin-ally with increasing particle content. However, when thesurface of silica nanoparticles is modified by aminobutyricacid to improve the filler/matrix adhesion, the tensilestrength of nylon 6/silica nanocomposites shows a bell-shaped curve with silica loading (Fig. 16). The modifiedcomposites have good particle dispersion and strong poly-mer/silica interface adhesion for effective stress transfer.Therefore, the composite strength is increased. When silicacontent is above 5 wt% particle aggregation occurs, thusleading to degradation in composite strength as the particlecontent increases.
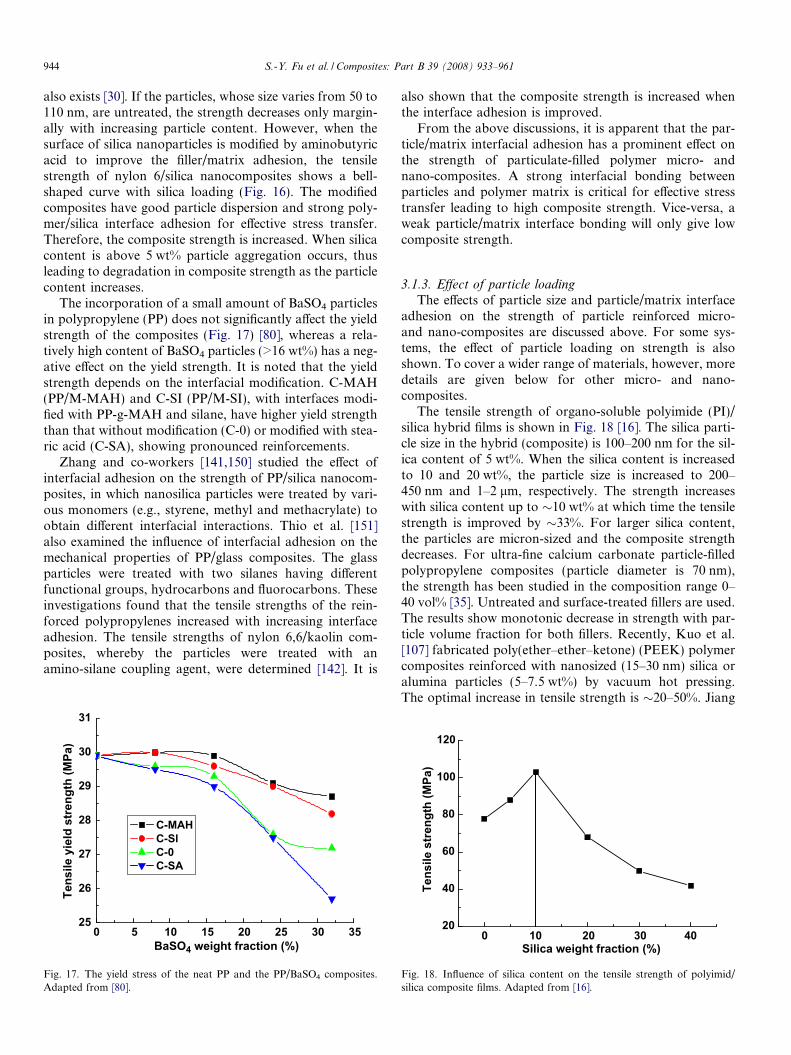
The incorporation of a small amount of BaSO4 particlesin polypropylene (PP) does not significantly affect the yieldstrength of the composites (Fig. 17) [80], whereas a rela-tively high content of BaSO4 particles (>16 wt%) has a neg-ative effect on the yield strength. It is noted that the yieldstrength depends on the interfacial modification. C-MAH(PP/M-MAH) and C-SI (PP/M-SI), with interfaces modi-fied with PP-g-MAH and silane, have higher yield strengththan that without modification (C-0) or modified with stea-ric acid (C-SA), showing pronounced reinforcements.
Zhang and co-workers [141,150] studied the effect ofinterfacial adhesion on the strength of PP/silica nanocom-posites, in which nanosilica particles were treated by vari-ous monomers (e.g., styrene, methyl and methacrylate) toobtain different interfacial interactions. Thio et al. [151]also examined the influence of interfacial adhesion on themechanical properties of PP/glass composites. The glassparticles were treated with two silanes having differentfunctional groups, hydrocarbons and fluorocarbons. Theseinvestigations found that the tensile strengths of the rein-forced polypropylenes increased with increasing interfaceadhesion. The tensile strengths of nylon 6,6/kaolin com-posites, whereby the particles were treated with anamino-silane coupling agent, were determined [142]. It is
0 5 10 15 20 25 30 3525
26
27
28
29
30
31
Tens
ile y
ield
str
engt
h (M
Pa)
BaSO4 weight fraction (%)
C-MAH C-Sl C-0 C-SA
Fig. 17. The yield stress of the neat PP and the PP/BaSO4 composites.Adapted from [80].
also shown that the composite strength is increased whenthe interface adhesion is improved.
From the above discussions, it is apparent that the par-ticle/matrix interfacial adhesion has a prominent effect onthe strength of particulate-filled polymer micro- andnano-composites. A strong interfacial bonding betweenparticles and polymer matrix is critical for effective stresstransfer leading to high composite strength. Vice-versa, aweak particle/matrix interface bonding will only give lowcomposite strength.
3.1.3. Effect of particle loadingThe effects of particle size and particle/matrix interface
adhesion on the strength of particle reinforced micro-and nano-composites are discussed above. For some sys-tems, the effect of particle loading on strength is alsoshown. To cover a wider range of materials, however, moredetails are given below for other micro- and nano-composites.
The tensile strength of organo-soluble polyimide (PI)/silica hybrid films is shown in Fig. 18 [16]. The silica parti-cle size in the hybrid (composite) is 100–200 nm for the sil-ica content of 5 wt%. When the silica content is increasedto 10 and 20 wt%, the particle size is increased to 200–450 nm and 1–2 lm, respectively. The strength increaseswith silica content up to �10 wt% at which time the tensilestrength is improved by �33%. For larger silica content,the particles are micron-sized and the composite strengthdecreases. For ultra-fine calcium carbonate particle-filledpolypropylene composites (particle diameter is 70 nm),the strength has been studied in the composition range 0–40 vol% [35]. Untreated and surface-treated fillers are used.The results show monotonic decrease in strength with par-ticle volume fraction for both fillers. Recently, Kuo et al.[107] fabricated poly(ether–ether–ketone) (PEEK) polymercomposites reinforced with nanosized (15–30 nm) silica oralumina particles (5–7.5 wt%) by vacuum hot pressing.The optimal increase in tensile strength is �20–50%. Jiang
0 10 20 30 4020
40
60
80
100
120
Tens
ile s
tren
gth
(MPa
)
Silica weight fraction (%)
Fig. 18. Influence of silica content on the tensile strength of polyimid/silica composite films. Adapted from [16].
0 3 6 9 12 15 1860
80
100
120
140
160
180
Ten
sile
str
eng
th (
MP
a)
Silica weight fraction (%)
Room temperature 77K
Fig. 19. The tensile strength of SiO2/PI hybrid films at room temperatureand 77 K as a function of silica content. Adapted from [153].
Fig. 20. Tensile strength of polyurethane/nanosilica composites preparedvia in situ polymerization and blending methods as a function of silicaconcentration (silica particle size 66 nm). Adapted from [156].
S.-Y. Fu et al. / Composites: Part B 39 (2008) 933–961 945
et al. recently reported fabrication of semi-crystalline poly-lactide (PLA) nanocomposites with nanosized precipitatedcalcium carbonate (NPCC) by melt extrusion [152]. How-ever, the addition of NPCC in the range �2.5–7.5 wt%results in a reduction of tensile strength of the resultingnanocomposites.
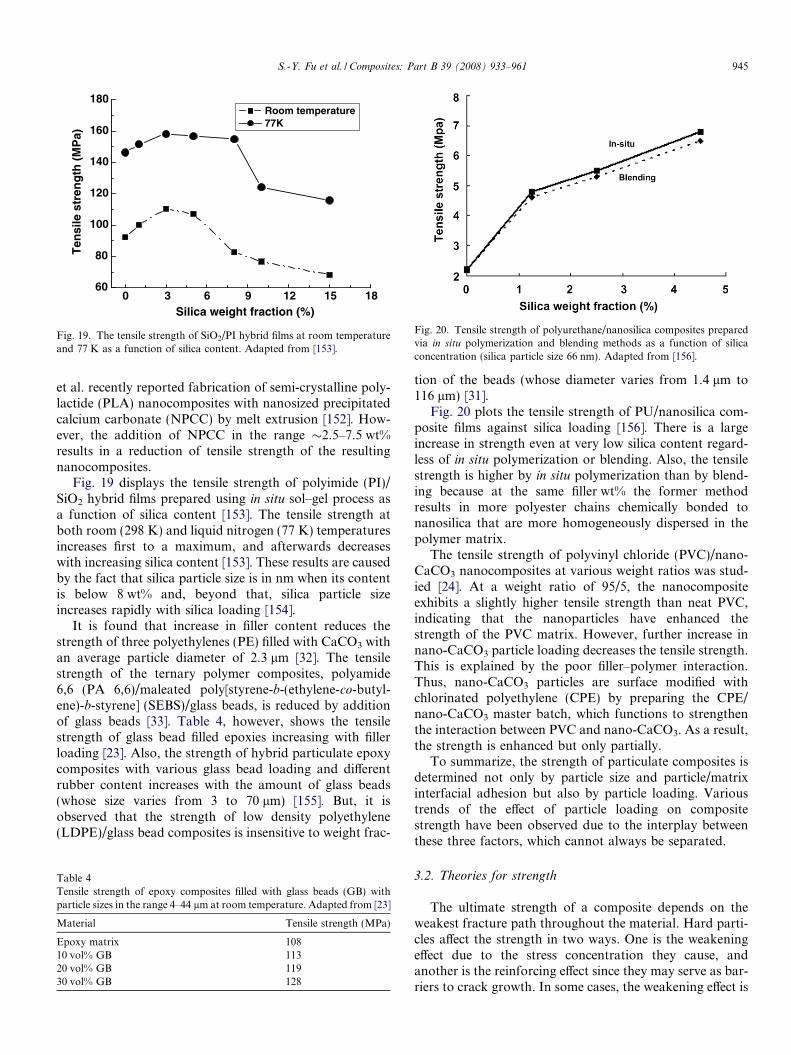
Fig. 19 displays the tensile strength of polyimide (PI)/SiO2 hybrid films prepared using in situ sol–gel process asa function of silica content [153]. The tensile strength atboth room (298 K) and liquid nitrogen (77 K) temperaturesincreases first to a maximum, and afterwards decreaseswith increasing silica content [153]. These results are causedby the fact that silica particle size is in nm when its contentis below 8 wt% and, beyond that, silica particle sizeincreases rapidly with silica loading [154].
It is found that increase in filler content reduces thestrength of three polyethylenes (PE) filled with CaCO3 withan average particle diameter of 2.3 lm [32]. The tensilestrength of the ternary polymer composites, polyamide6,6 (PA 6,6)/maleated poly[styrene-b-(ethylene-co-butyl-ene)-b-styrene] (SEBS)/glass beads, is reduced by additionof glass beads [33]. Table 4, however, shows the tensilestrength of glass bead filled epoxies increasing with fillerloading [23]. Also, the strength of hybrid particulate epoxycomposites with various glass bead loading and differentrubber content increases with the amount of glass beads(whose size varies from 3 to 70 lm) [155]. But, it isobserved that the strength of low density polyethylene(LDPE)/glass bead composites is insensitive to weight frac-
Table 4Tensile strength of epoxy composites filled with glass beads (GB) withparticle sizes in the range 4–44 lm at room temperature. Adapted from [23]
Material Tensile strength (MPa)
Epoxy matrix 10810 vol% GB 11320 vol% GB 11930 vol% GB 128
tion of the beads (whose diameter varies from 1.4 lm to116 lm) [31].
Fig. 20 plots the tensile strength of PU/nanosilica com-posite films against silica loading [156]. There is a largeincrease in strength even at very low silica content regard-less of in situ polymerization or blending. Also, the tensilestrength is higher by in situ polymerization than by blend-ing because at the same filler wt% the former methodresults in more polyester chains chemically bonded tonanosilica that are more homogeneously dispersed in thepolymer matrix.
The tensile strength of polyvinyl chloride (PVC)/nano-CaCO3 nanocomposites at various weight ratios was stud-ied [24]. At a weight ratio of 95/5, the nanocompositeexhibits a slightly higher tensile strength than neat PVC,indicating that the nanoparticles have enhanced thestrength of the PVC matrix. However, further increase innano-CaCO3 particle loading decreases the tensile strength.This is explained by the poor filler–polymer interaction.Thus, nano-CaCO3 particles are surface modified withchlorinated polyethylene (CPE) by preparing the CPE/nano-CaCO3 master batch, which functions to strengthenthe interaction between PVC and nano-CaCO3. As a result,the strength is enhanced but only partially.
To summarize, the strength of particulate composites isdetermined not only by particle size and particle/matrixinterfacial adhesion but also by particle loading. Varioustrends of the effect of particle loading on compositestrength have been observed due to the interplay betweenthese three factors, which cannot always be separated.
3.2. Theories for strength
The ultimate strength of a composite depends on theweakest fracture path throughout the material. Hard parti-cles affect the strength in two ways. One is the weakeningeffect due to the stress concentration they cause, andanother is the reinforcing effect since they may serve as bar-riers to crack growth. In some cases, the weakening effect is
946 S.-Y. Fu et al. / Composites: Part B 39 (2008) 933–961
predominant and thus the composite strength is lower thanthe matrix; and in other cases, the reinforcing effect is moresignificant and then the composites will have strengthshigher than the matrix.
Prediction of the strength of composites is difficult. Thedifficulty arises because the strength of composites is deter-mined by the fracture behaviours which are associated withthe extreme values of such parameters as interface adhe-sion, stress concentration and defect size/spatial distribu-tions. Thus, the load-bearing capacity of a particulatecomposite depends on the strength of the weakest paththroughout the microstructure, rather than the statisticallyaveraged values of the microstructure parameters. Hence,although numerous theories of composite strength havebeen published before, there is no universally accepted the-ory todate. In what follows, we summarize some phenom-enological models and semi-empirical equations availablebecause they are simple and easy to use in practice andcan give correct predictions for appropriate cases.
Assuming that the stress cannot be transferred from thematrix to the filler and that the strength of a particulate-filled polymer composite is determined from the effectivesectional area of load-bearing matrix in the absence ofthe particles, a very simple expression for the compositestrength is given by [34,35]
rc ¼ rmð1� V pÞ ð17Þ
where rc and rm are, respectively, composite strength andmatrix strength, and Vp is particle volume fraction. Eq.(17) was proposed for poorly bonded particles. This equa-tion indicates that the strength of a particulate compositedecreases linearly with increasing particle loading. How-ever, test results have shown that the relationship betweenrc and Vp is not always linear even if a decreasing tendencywas observed. A modified form of Eq. (17) is thus obtainedby replacing the particle volume fraction by a power lawfunction of the volume fraction as [36,37]
rc ¼ rmð1� aV bpÞ ð18Þ
where a and b are constants depending on particle shapeand arrangement in the composite. Eq. (18) still predictsa decrease in strength with increase of particle loading.
For poorly bonded particles, Nielsen’s equation is oftenused for the prediction of strength of particulate compos-ites. For cubic particles embedded in a cubic matrix, Niel-sen gave [157]
rc ¼ rmð1� V 2=3p ÞQ ð19Þ
where the parameter Q accounts for weaknesses in thestructure caused by the discontinuities in stress transferand generation of stress concentration at the particle/poly-mer interface. When there is no stress concentration, thevalue of Q will be the maximum equal to unity.
Based on the hypothesis that there is no adhesionbetween filler and polymer, that is, the load is sustainedonly by the polymer, Nicolais and Nicodemo [158,159]
derived, with simple geometric considerations, the follow-ing expression:
rc ¼ rmð1� 1:21V 2=3p Þ ð20Þ
which gives a lower-bound strength of the composite. Anupper-bound is immediately obtained by considering that,for perfect adhesion, the strength of the composite is sim-ply equal to the strength of the polymer matrix. So, thestrength is intermediate between these two bounds and can-not be higher than that of the matrix.
Jancar et al. [160] believed that stress concentrationdepends on particle volume fraction and presented a mod-ified form of Eq. (20) as
rc ¼ rmð1� 1:21V 2=3p ÞSr ð21Þ
where Sr is a strength reduction factor and varies in therange from 1.0 to 0.2 for low and high volume fractions,respectively.
Leidner and Woodhams [161] considered the contribu-tions of particle/matrix friction and residual pressure tothe composite strength and gave a modified equation
rc ¼ 0:83pfV p þ krmð1� V pÞ ð22Þ
where p is pressure, f is friction coefficient, and k is relativechange in strength of matrix due to the presence of the fil-ler. The first term on the right side of Eq. (22) is the frictioncontribution.
When some adhesion exists between particle and matrix,the interface can transfer a part of the stress to the parti-cles, making a contribution to the composite strength.Thus, Eq. (18) may be modified for better prediction ofcomposite strength as [162]
rc ¼ rmð1� aV bp þ cV d
pÞ ð23Þ
where c and d are constants. Eq. (20) can also be modifiedto include cases with some adhesion so that [163]
rc ¼ rmð1� 1:07V 2=3p Þ ð24Þ
Piggott and Leidner [164] argued that the assumption ofuniform filler distribution in most models was unlikely inpractice and then proposed an empirical equation below
rc ¼ grm � aV p ð25Þ
where a is coefficient of the particle/matrix adhesion, and g
is a constant.It can be seen that in the case of nil or some adhesion,
addition of particles generally leads to reduction instrength. But in the case of strong filler–matrix adhesion,where the stress is transferred through shear from thematrix to the particles, Eq. (22) can be rewritten as [161]
rc ¼ 0:83pfV p þ krmð1� V pÞ þ raHð1� V pÞ ð26Þ
where ra is the particle/matrix adhesion strength and H is aconstant.
Furthermore, for very strong particle–matrix interfacialbonding, Pukanszky et al. [165,166] gave an empiricalrelationship
0 5 10 15 20 25 30100
110
120
130
140
150
Ten
sile
str
eng
th (
MP
a)
Ds
-1 (mm-1)
S=9.8*10 -4 MPa*m S=1.24*10 -3 MPa*m S=1.74*10 -3 MPa*m
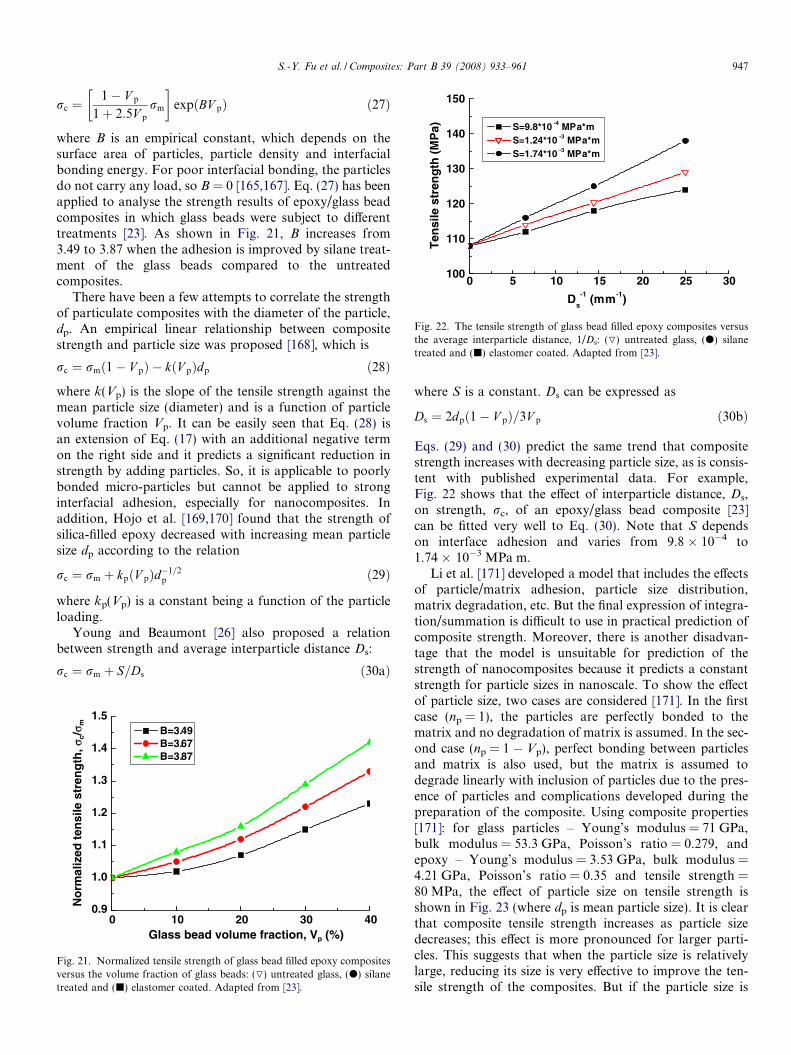
Fig. 22. The tensile strength of glass bead filled epoxy composites versusthe average interparticle distance, 1/Ds: (O) untreated glass, (d) silanetreated and (j) elastomer coated. Adapted from [23].
S.-Y. Fu et al. / Composites: Part B 39 (2008) 933–961 947
rc ¼1� V p
1þ 2:5V p
rm
� �expðBV pÞ ð27Þ
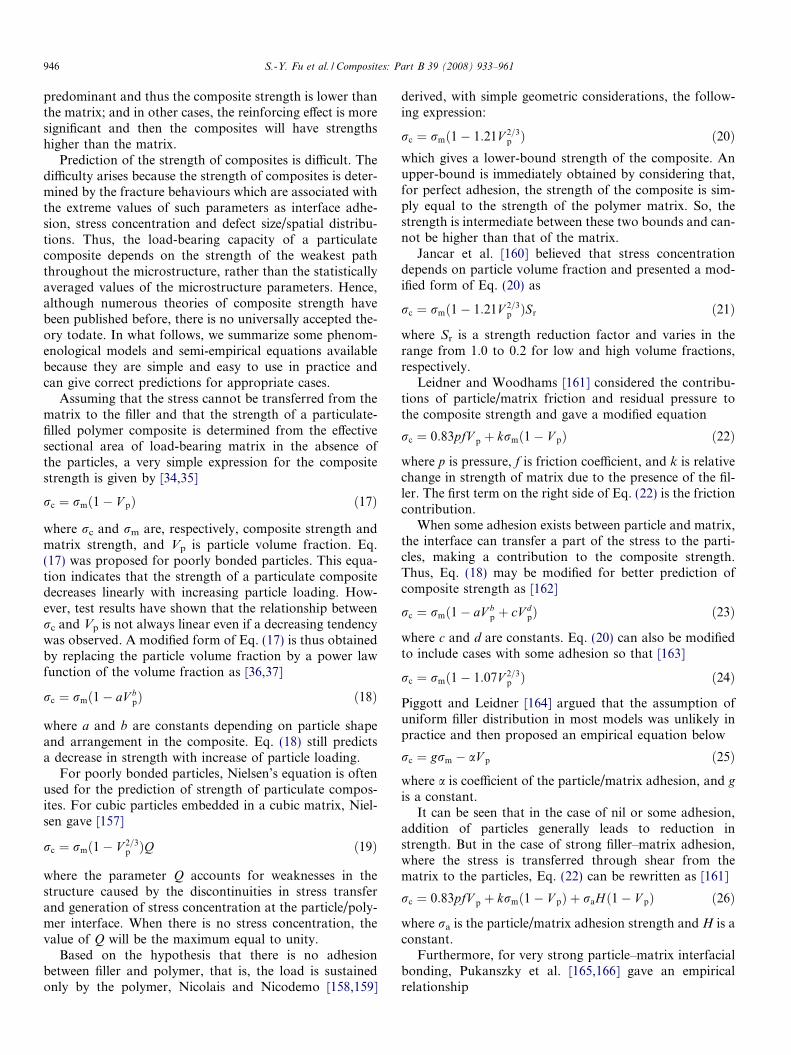
where B is an empirical constant, which depends on thesurface area of particles, particle density and interfacialbonding energy. For poor interfacial bonding, the particlesdo not carry any load, so B = 0 [165,167]. Eq. (27) has beenapplied to analyse the strength results of epoxy/glass beadcomposites in which glass beads were subject to differenttreatments [23]. As shown in Fig. 21, B increases from3.49 to 3.87 when the adhesion is improved by silane treat-ment of the glass beads compared to the untreatedcomposites.
There have been a few attempts to correlate the strengthof particulate composites with the diameter of the particle,dp. An empirical linear relationship between compositestrength and particle size was proposed [168], which is
rc ¼ rmð1� V pÞ � kðV pÞdp ð28Þ
where k(Vp) is the slope of the tensile strength against themean particle size (diameter) and is a function of particlevolume fraction Vp. It can be easily seen that Eq. (28) isan extension of Eq. (17) with an additional negative termon the right side and it predicts a significant reduction instrength by adding particles. So, it is applicable to poorlybonded micro-particles but cannot be applied to stronginterfacial adhesion, especially for nanocomposites. Inaddition, Hojo et al. [169,170] found that the strength ofsilica-filled epoxy decreased with increasing mean particlesize dp according to the relation
rc ¼ rm þ kpðV pÞd�1=2p ð29Þ
where kp(Vp) is a constant being a function of the particleloading.
Young and Beaumont [26] also proposed a relationbetween strength and average interparticle distance Ds:
rc ¼ rm þ S=Ds ð30aÞ
0 10 20 30 400.9
1.0
1.1
1.2
1.3
1.4
1.5
No
rmal
ized
ten
sile
str
eng
th, σ
c/σ m
Glass bead volume fraction, Vp (%)
B=3.49 B=3.67 B=3.87
Fig. 21. Normalized tensile strength of glass bead filled epoxy compositesversus the volume fraction of glass beads: (O) untreated glass, (d) silanetreated and (j) elastomer coated. Adapted from [23].
where S is a constant. Ds can be expressed as
Ds ¼ 2dpð1� V pÞ=3V p ð30bÞ
Eqs. (29) and (30) predict the same trend that compositestrength increases with decreasing particle size, as is consis-tent with published experimental data. For example,Fig. 22 shows that the effect of interparticle distance, Ds,on strength, rc, of an epoxy/glass bead composite [23]can be fitted very well to Eq. (30). Note that S dependson interface adhesion and varies from 9.8 � 10�4 to1.74 � 10�3 MPa m.
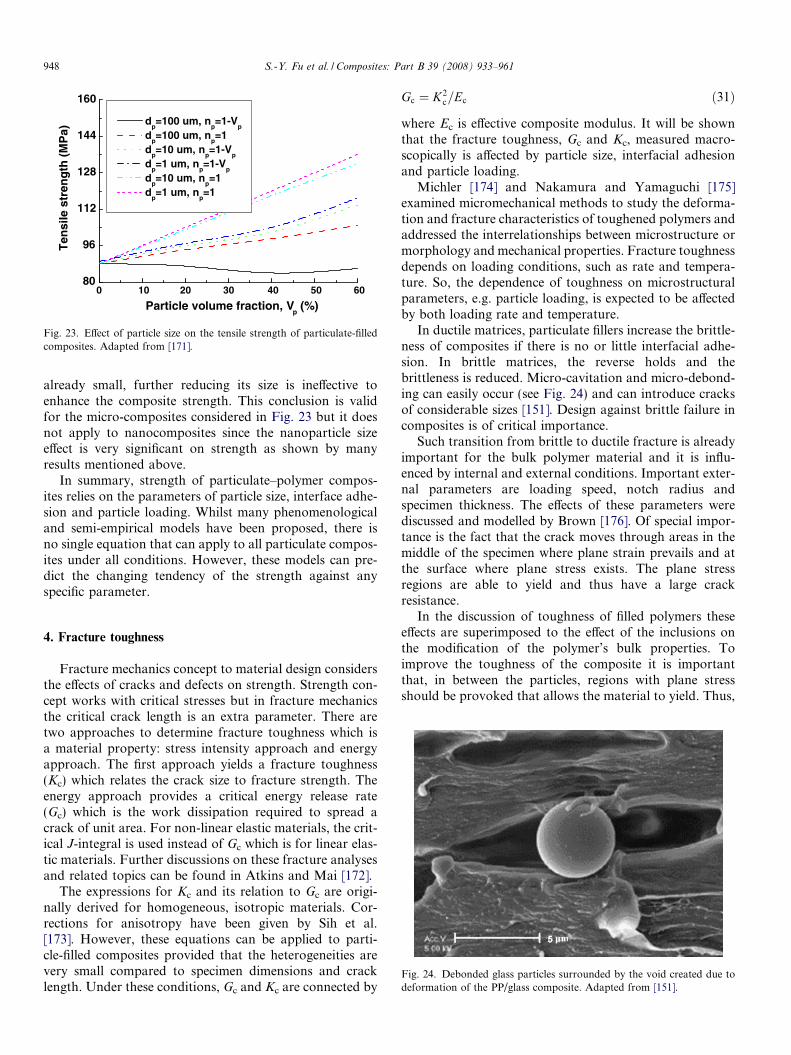
Li et al. [171] developed a model that includes the effectsof particle/matrix adhesion, particle size distribution,matrix degradation, etc. But the final expression of integra-tion/summation is difficult to use in practical prediction ofcomposite strength. Moreover, there is another disadvan-tage that the model is unsuitable for prediction of thestrength of nanocomposites because it predicts a constantstrength for particle sizes in nanoscale. To show the effectof particle size, two cases are considered [171]. In the firstcase (np = 1), the particles are perfectly bonded to thematrix and no degradation of matrix is assumed. In the sec-ond case (np = 1 � Vp), perfect bonding between particlesand matrix is also used, but the matrix is assumed todegrade linearly with inclusion of particles due to the pres-ence of particles and complications developed during thepreparation of the composite. Using composite properties[171]: for glass particles – Young’s modulus = 71 GPa,bulk modulus = 53.3 GPa, Poisson’s ratio = 0.279, andepoxy – Young’s modulus = 3.53 GPa, bulk modulus =4.21 GPa, Poisson’s ratio = 0.35 and tensile strength =80 MPa, the effect of particle size on tensile strength isshown in Fig. 23 (where dp is mean particle size). It is clearthat composite tensile strength increases as particle sizedecreases; this effect is more pronounced for larger parti-cles. This suggests that when the particle size is relativelylarge, reducing its size is very effective to improve the ten-sile strength of the composites. But if the particle size is
0 10 20 30 40 50 6080
96
112
128
144
160
Ten
sile
str
eng
th (
MP
a)
Particle volume fraction, Vp (%)
dp=100 um, n
p=1-V
p
dp=100 um, n
p=1
dp=10 um, n
p=1-V
p
dp=1 um, n
p=1-V
p
dp=10 um, n
p=1
dp=1 um, n
p=1
Fig. 23. Effect of particle size on the tensile strength of particulate-filledcomposites. Adapted from [171].
948 S.-Y. Fu et al. / Composites: Part B 39 (2008) 933–961
already small, further reducing its size is ineffective toenhance the composite strength. This conclusion is validfor the micro-composites considered in Fig. 23 but it doesnot apply to nanocomposites since the nanoparticle sizeeffect is very significant on strength as shown by manyresults mentioned above.
In summary, strength of particulate–polymer compos-ites relies on the parameters of particle size, interface adhe-sion and particle loading. Whilst many phenomenologicaland semi-empirical models have been proposed, there isno single equation that can apply to all particulate compos-ites under all conditions. However, these models can pre-dict the changing tendency of the strength against anyspecific parameter.
Fig. 24. Debonded glass particles surrounded by the void created due todeformation of the PP/glass composite. Adapted from [151].
4. Fracture toughness
Fracture mechanics concept to material design considersthe effects of cracks and defects on strength. Strength con-cept works with critical stresses but in fracture mechanicsthe critical crack length is an extra parameter. There aretwo approaches to determine fracture toughness which isa material property: stress intensity approach and energyapproach. The first approach yields a fracture toughness(Kc) which relates the crack size to fracture strength. Theenergy approach provides a critical energy release rate(Gc) which is the work dissipation required to spread acrack of unit area. For non-linear elastic materials, the crit-ical J-integral is used instead of Gc which is for linear elas-tic materials. Further discussions on these fracture analysesand related topics can be found in Atkins and Mai [172].
The expressions for Kc and its relation to Gc are origi-nally derived for homogeneous, isotropic materials. Cor-rections for anisotropy have been given by Sih et al.[173]. However, these equations can be applied to parti-cle-filled composites provided that the heterogeneities arevery small compared to specimen dimensions and cracklength. Under these conditions, Gc and Kc are connected by
Gc ¼ K2c=Ec ð31Þ
where Ec is effective composite modulus. It will be shownthat the fracture toughness, Gc and Kc, measured macro-scopically is affected by particle size, interfacial adhesionand particle loading.
Michler [174] and Nakamura and Yamaguchi [175]examined micromechanical methods to study the deforma-tion and fracture characteristics of toughened polymers andaddressed the interrelationships between microstructure ormorphology and mechanical properties. Fracture toughnessdepends on loading conditions, such as rate and tempera-ture. So, the dependence of toughness on microstructuralparameters, e.g. particle loading, is expected to be affectedby both loading rate and temperature.
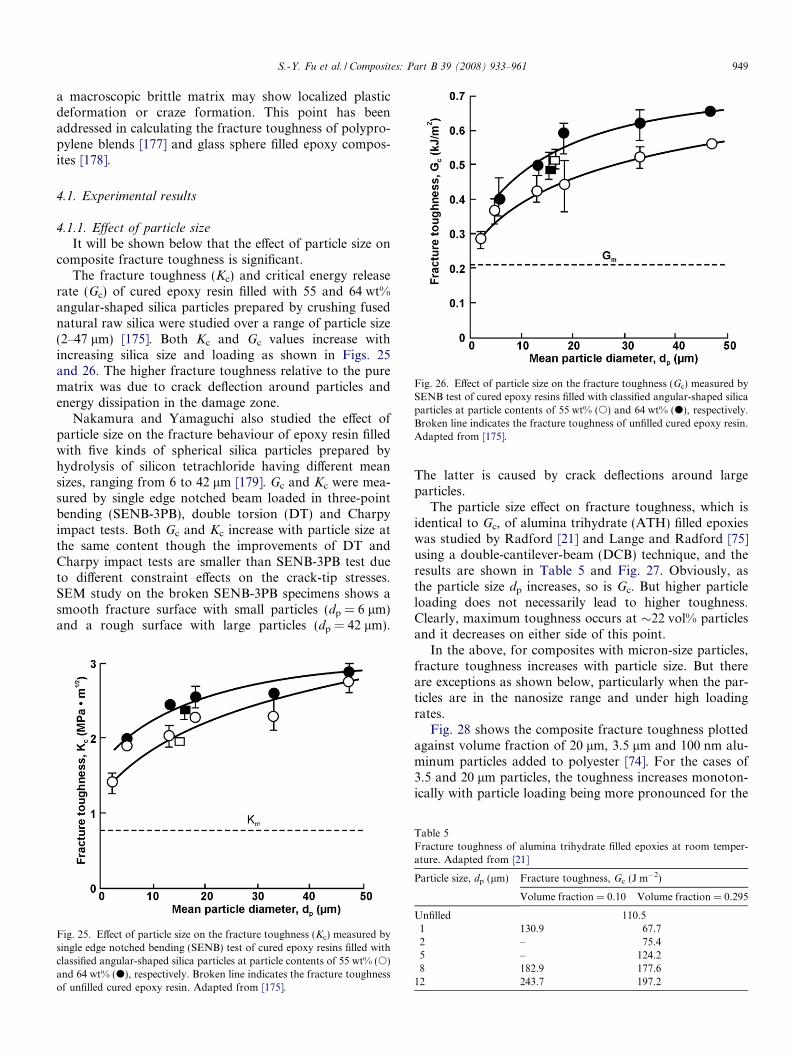
In ductile matrices, particulate fillers increase the brittle-ness of composites if there is no or little interfacial adhe-sion. In brittle matrices, the reverse holds and thebrittleness is reduced. Micro-cavitation and micro-debond-ing can easily occur (see Fig. 24) and can introduce cracksof considerable sizes [151]. Design against brittle failure incomposites is of critical importance.
Such transition from brittle to ductile fracture is alreadyimportant for the bulk polymer material and it is influ-enced by internal and external conditions. Important exter-nal parameters are loading speed, notch radius andspecimen thickness. The effects of these parameters werediscussed and modelled by Brown [176]. Of special impor-tance is the fact that the crack moves through areas in themiddle of the specimen where plane strain prevails and atthe surface where plane stress exists. The plane stressregions are able to yield and thus have a large crackresistance.
In the discussion of toughness of filled polymers theseeffects are superimposed to the effect of the inclusions onthe modification of the polymer’s bulk properties. Toimprove the toughness of the composite it is importantthat, in between the particles, regions with plane stressshould be provoked that allows the material to yield. Thus,
S.-Y. Fu et al. / Composites: Part B 39 (2008) 933–961 949
a macroscopic brittle matrix may show localized plasticdeformation or craze formation. This point has beenaddressed in calculating the fracture toughness of polypro-pylene blends [177] and glass sphere filled epoxy compos-ites [178].
Fig. 26. Effect of particle size on the fracture toughness (Gc) measured bySENB test of cured epoxy resins filled with classified angular-shaped silicaparticles at particle contents of 55 wt% (s) and 64 wt% (d), respectively.Broken line indicates the fracture toughness of unfilled cured epoxy resin.Adapted from [175].
4.1. Experimental results
4.1.1. Effect of particle sizeIt will be shown below that the effect of particle size on
composite fracture toughness is significant.The fracture toughness (Kc) and critical energy release
rate (Gc) of cured epoxy resin filled with 55 and 64 wt%angular-shaped silica particles prepared by crushing fusednatural raw silica were studied over a range of particle size(2–47 lm) [175]. Both Kc and Gc values increase withincreasing silica size and loading as shown in Figs. 25and 26. The higher fracture toughness relative to the purematrix was due to crack deflection around particles andenergy dissipation in the damage zone.
Nakamura and Yamaguchi also studied the effect ofparticle size on the fracture behaviour of epoxy resin filledwith five kinds of spherical silica particles prepared byhydrolysis of silicon tetrachloride having different meansizes, ranging from 6 to 42 lm [179]. Gc and Kc were mea-sured by single edge notched beam loaded in three-pointbending (SENB-3PB), double torsion (DT) and Charpyimpact tests. Both Gc and Kc increase with particle size atthe same content though the improvements of DT andCharpy impact tests are smaller than SENB-3PB test dueto different constraint effects on the crack-tip stresses.SEM study on the broken SENB-3PB specimens shows asmooth fracture surface with small particles (dp = 6 lm)and a rough surface with large particles (dp = 42 lm).
Fig. 25. Effect of particle size on the fracture toughness (Kc) measured bysingle edge notched bending (SENB) test of cured epoxy resins filled withclassified angular-shaped silica particles at particle contents of 55 wt% (s)and 64 wt% (d), respectively. Broken line indicates the fracture toughnessof unfilled cured epoxy resin. Adapted from [175].
The latter is caused by crack deflections around largeparticles.
The particle size effect on fracture toughness, which isidentical to Gc, of alumina trihydrate (ATH) filled epoxieswas studied by Radford [21] and Lange and Radford [75]using a double-cantilever-beam (DCB) technique, and theresults are shown in Table 5 and Fig. 27. Obviously, asthe particle size dp increases, so is Gc. But higher particleloading does not necessarily lead to higher toughness.Clearly, maximum toughness occurs at �22 vol% particlesand it decreases on either side of this point.
In the above, for composites with micron-size particles,fracture toughness increases with particle size. But thereare exceptions as shown below, particularly when the par-ticles are in the nanosize range and under high loadingrates.
Fig. 28 shows the composite fracture toughness plottedagainst volume fraction of 20 lm, 3.5 lm and 100 nm alu-minum particles added to polyester [74]. For the cases of3.5 and 20 lm particles, the toughness increases monoton-ically with particle loading being more pronounced for the
Table 5Fracture toughness of alumina trihydrate filled epoxies at room temper-ature. Adapted from [21]
Particle size, dp (lm) Fracture toughness, Gc (J m�2)
Volume fraction = 0.10 Volume fraction = 0.295
Unfilled 110.51 130.9 67.72 – 75.45 – 124.28 182.9 177.6
12 243.7 197.2
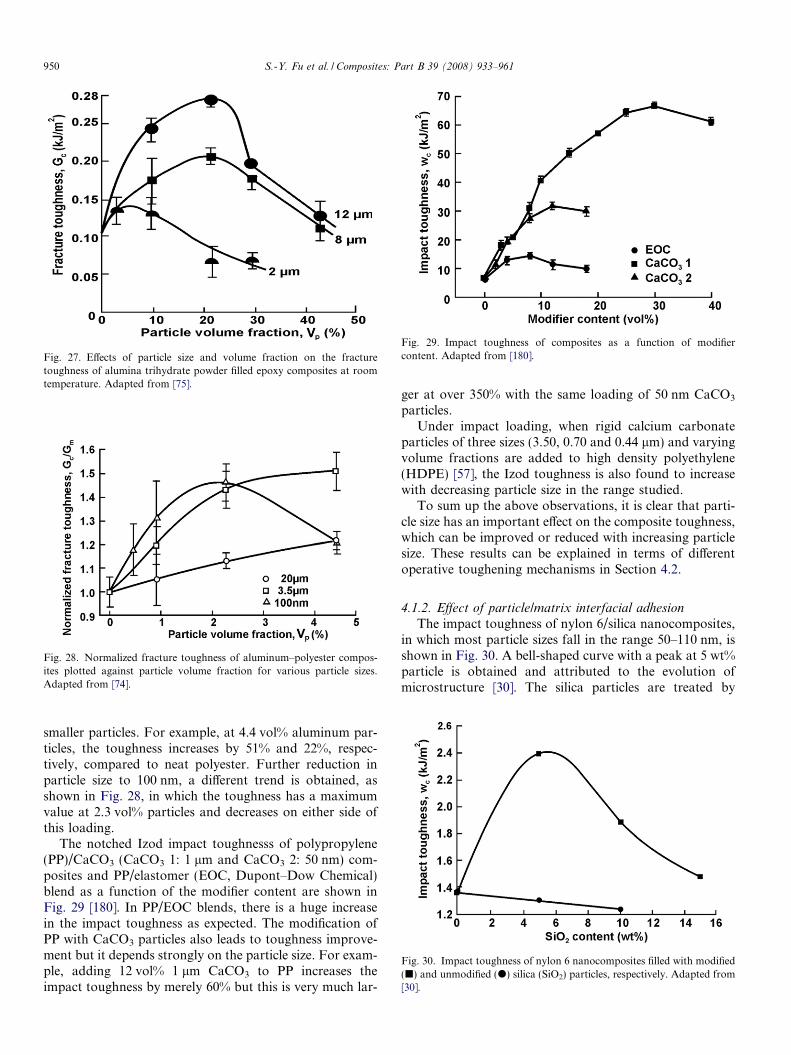
Fig. 27. Effects of particle size and volume fraction on the fracturetoughness of alumina trihydrate powder filled epoxy composites at roomtemperature. Adapted from [75].
Fig. 28. Normalized fracture toughness of aluminum–polyester compos-ites plotted against particle volume fraction for various particle sizes.Adapted from [74].
Fig. 29. Impact toughness of composites as a function of modifiercontent. Adapted from [180].
Fig. 30. Impact toughness of nylon 6 nanocomposites filled with modified(j) and unmodified (d) silica (SiO2) particles, respectively. Adapted from[30].
950 S.-Y. Fu et al. / Composites: Part B 39 (2008) 933–961
smaller particles. For example, at 4.4 vol% aluminum par-ticles, the toughness increases by 51% and 22%, respec-tively, compared to neat polyester. Further reduction inparticle size to 100 nm, a different trend is obtained, asshown in Fig. 28, in which the toughness has a maximumvalue at 2.3 vol% particles and decreases on either side ofthis loading.
The notched Izod impact toughnesss of polypropylene(PP)/CaCO3 (CaCO3 1: 1 lm and CaCO3 2: 50 nm) com-posites and PP/elastomer (EOC, Dupont–Dow Chemical)blend as a function of the modifier content are shown inFig. 29 [180]. In PP/EOC blends, there is a huge increasein the impact toughness as expected. The modification ofPP with CaCO3 particles also leads to toughness improve-ment but it depends strongly on the particle size. For exam-ple, adding 12 vol% 1 lm CaCO3 to PP increases theimpact toughness by merely 60% but this is very much lar-
ger at over 350% with the same loading of 50 nm CaCO3
particles.Under impact loading, when rigid calcium carbonate
particles of three sizes (3.50, 0.70 and 0.44 lm) and varyingvolume fractions are added to high density polyethylene(HDPE) [57], the Izod toughness is also found to increasewith decreasing particle size in the range studied.
To sum up the above observations, it is clear that parti-cle size has an important effect on the composite toughness,which can be improved or reduced with increasing particlesize. These results can be explained in terms of differentoperative toughening mechanisms in Section 4.2.
4.1.2. Effect of particle/matrix interfacial adhesion
The impact toughness of nylon 6/silica nanocomposites,in which most particle sizes fall in the range 50–110 nm, isshown in Fig. 30. A bell-shaped curve with a peak at 5 wt%particle is obtained and attributed to the evolution ofmicrostructure [30]. The silica particles are treated by
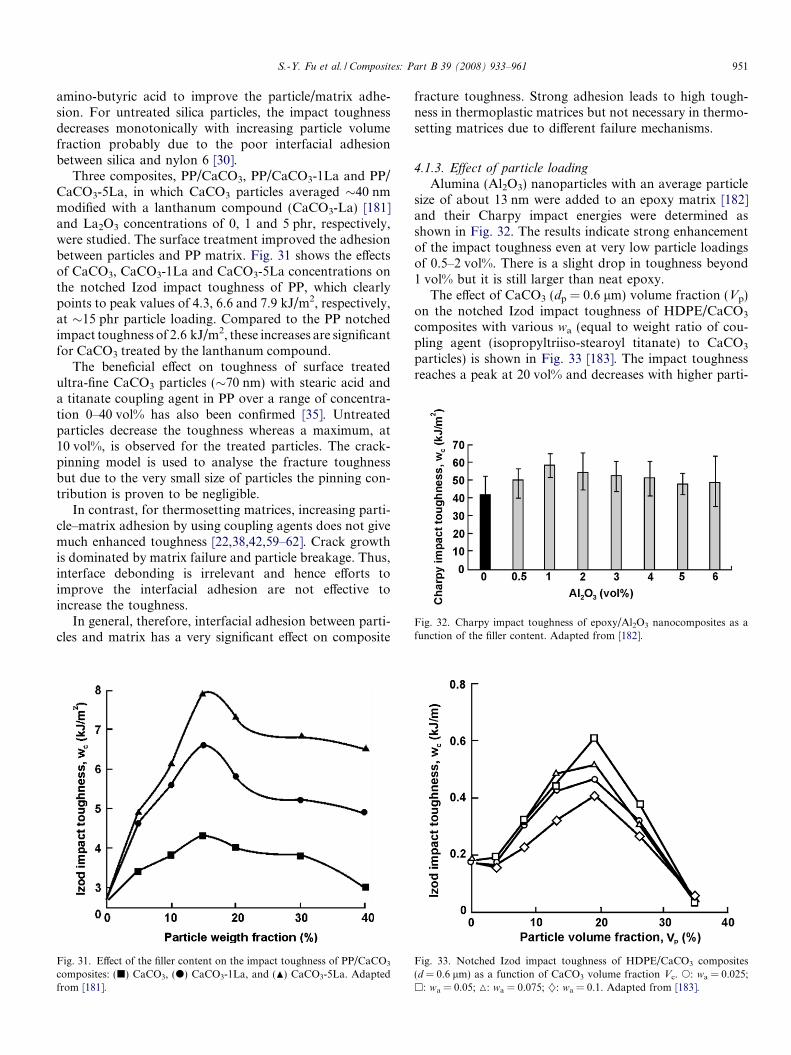
Fig. 32. Charpy impact toughness of epoxy/Al2O3 nanocomposites as afunction of the filler content. Adapted from [182].
S.-Y. Fu et al. / Composites: Part B 39 (2008) 933–961 951
amino-butyric acid to improve the particle/matrix adhe-sion. For untreated silica particles, the impact toughnessdecreases monotonically with increasing particle volumefraction probably due to the poor interfacial adhesionbetween silica and nylon 6 [30].
Three composites, PP/CaCO3, PP/CaCO3-1La and PP/CaCO3-5La, in which CaCO3 particles averaged �40 nmmodified with a lanthanum compound (CaCO3-La) [181]and La2O3 concentrations of 0, 1 and 5 phr, respectively,were studied. The surface treatment improved the adhesionbetween particles and PP matrix. Fig. 31 shows the effectsof CaCO3, CaCO3-1La and CaCO3-5La concentrations onthe notched Izod impact toughness of PP, which clearlypoints to peak values of 4.3, 6.6 and 7.9 kJ/m2, respectively,at �15 phr particle loading. Compared to the PP notchedimpact toughness of 2.6 kJ/m2, these increases are significantfor CaCO3 treated by the lanthanum compound.
The beneficial effect on toughness of surface treatedultra-fine CaCO3 particles (�70 nm) with stearic acid anda titanate coupling agent in PP over a range of concentra-tion 0–40 vol% has also been confirmed [35]. Untreatedparticles decrease the toughness whereas a maximum, at10 vol%, is observed for the treated particles. The crack-pinning model is used to analyse the fracture toughnessbut due to the very small size of particles the pinning con-tribution is proven to be negligible.
In contrast, for thermosetting matrices, increasing parti-cle–matrix adhesion by using coupling agents does not givemuch enhanced toughness [22,38,42,59–62]. Crack growthis dominated by matrix failure and particle breakage. Thus,interface debonding is irrelevant and hence efforts toimprove the interfacial adhesion are not effective toincrease the toughness.
In general, therefore, interfacial adhesion between parti-cles and matrix has a very significant effect on composite
Fig. 31. Effect of the filler content on the impact toughness of PP/CaCO3
composites: (j) CaCO3, (d) CaCO3-1La, and (N) CaCO3-5La. Adaptedfrom [181].
fracture toughness. Strong adhesion leads to high tough-ness in thermoplastic matrices but not necessary in thermo-setting matrices due to different failure mechanisms.
4.1.3. Effect of particle loading
Alumina (Al2O3) nanoparticles with an average particlesize of about 13 nm were added to an epoxy matrix [182]and their Charpy impact energies were determined asshown in Fig. 32. The results indicate strong enhancementof the impact toughness even at very low particle loadingsof 0.5–2 vol%. There is a slight drop in toughness beyond1 vol% but it is still larger than neat epoxy.
The effect of CaCO3 (dp = 0.6 lm) volume fraction (Vp)on the notched Izod impact toughness of HDPE/CaCO3
composites with various wa (equal to weight ratio of cou-pling agent (isopropyltriiso-stearoyl titanate) to CaCO3
particles) is shown in Fig. 33 [183]. The impact toughnessreaches a peak at 20 vol% and decreases with higher parti-
Fig. 33. Notched Izod impact toughness of HDPE/CaCO3 composites(d = 0.6 lm) as a function of CaCO3 volume fraction Vc. s: wa = 0.025;h: wa = 0.05; M: wa = 0.075; }: wa = 0.1. Adapted from [183].
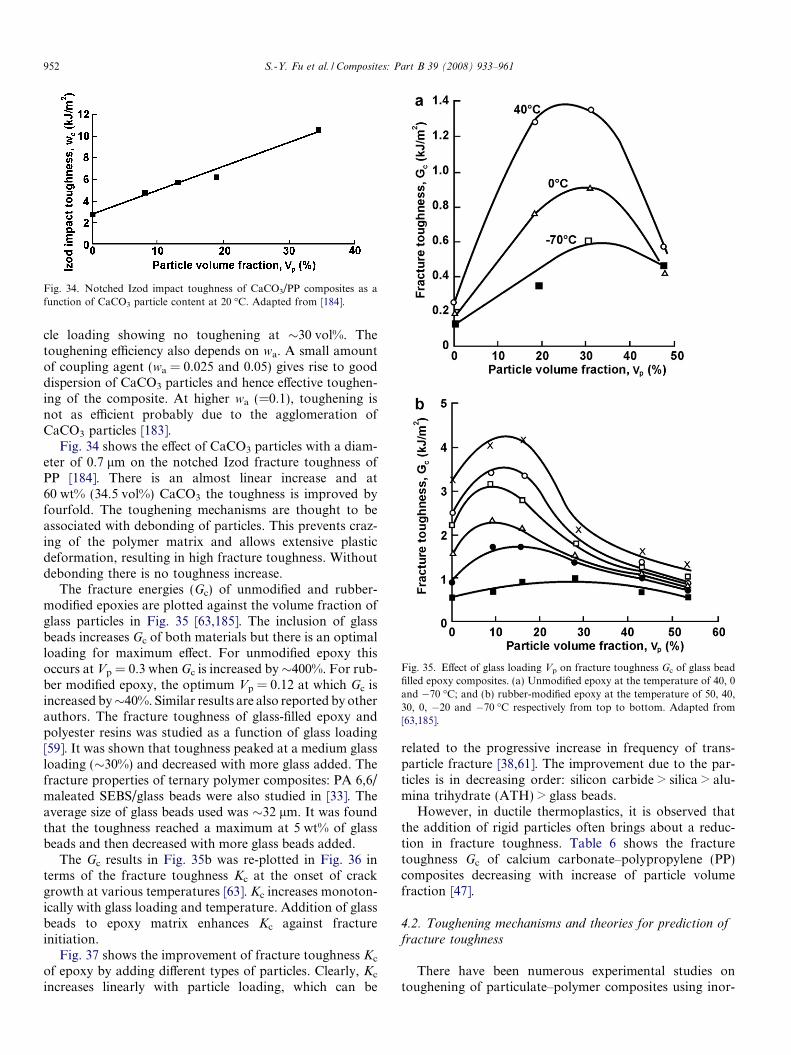
Fig. 34. Notched Izod impact toughness of CaCO3/PP composites as afunction of CaCO3 particle content at 20 �C. Adapted from [184].
Fig. 35. Effect of glass loading Vp on fracture toughness Gc of glass beadfilled epoxy composites. (a) Unmodified epoxy at the temperature of 40, 0and �70 �C; and (b) rubber-modified epoxy at the temperature of 50, 40,30, 0, �20 and �70 �C respectively from top to bottom. Adapted from[63,185].
952 S.-Y. Fu et al. / Composites: Part B 39 (2008) 933–961
cle loading showing no toughening at �30 vol%. Thetoughening efficiency also depends on wa. A small amountof coupling agent (wa = 0.025 and 0.05) gives rise to gooddispersion of CaCO3 particles and hence effective toughen-ing of the composite. At higher wa (=0.1), toughening isnot as efficient probably due to the agglomeration ofCaCO3 particles [183].
Fig. 34 shows the effect of CaCO3 particles with a diam-eter of 0.7 lm on the notched Izod fracture toughness ofPP [184]. There is an almost linear increase and at60 wt% (34.5 vol%) CaCO3 the toughness is improved byfourfold. The toughening mechanisms are thought to beassociated with debonding of particles. This prevents craz-ing of the polymer matrix and allows extensive plasticdeformation, resulting in high fracture toughness. Withoutdebonding there is no toughness increase.
The fracture energies (Gc) of unmodified and rubber-modified epoxies are plotted against the volume fraction ofglass particles in Fig. 35 [63,185]. The inclusion of glassbeads increases Gc of both materials but there is an optimalloading for maximum effect. For unmodified epoxy thisoccurs at Vp = 0.3 when Gc is increased by�400%. For rub-ber modified epoxy, the optimum Vp = 0.12 at which Gc isincreased by�40%. Similar results are also reported by otherauthors. The fracture toughness of glass-filled epoxy andpolyester resins was studied as a function of glass loading[59]. It was shown that toughness peaked at a medium glassloading (�30%) and decreased with more glass added. Thefracture properties of ternary polymer composites: PA 6,6/maleated SEBS/glass beads were also studied in [33]. Theaverage size of glass beads used was �32 lm. It was foundthat the toughness reached a maximum at 5 wt% of glassbeads and then decreased with more glass beads added.
The Gc results in Fig. 35b was re-plotted in Fig. 36 interms of the fracture toughness Kc at the onset of crackgrowth at various temperatures [63]. Kc increases monoton-ically with glass loading and temperature. Addition of glassbeads to epoxy matrix enhances Kc against fractureinitiation.
Fig. 37 shows the improvement of fracture toughness Kc
of epoxy by adding different types of particles. Clearly, Kc
increases linearly with particle loading, which can be
related to the progressive increase in frequency of trans-particle fracture [38,61]. The improvement due to the par-ticles is in decreasing order: silicon carbide > silica > alu-mina trihydrate (ATH) > glass beads.
However, in ductile thermoplastics, it is observed thatthe addition of rigid particles often brings about a reduc-tion in fracture toughness. Table 6 shows the fracturetoughness Gc of calcium carbonate–polypropylene (PP)composites decreasing with increase of particle volumefraction [47].
4.2. Toughening mechanisms and theories for prediction of
fracture toughness
There have been numerous experimental studies ontoughening of particulate–polymer composites using inor-
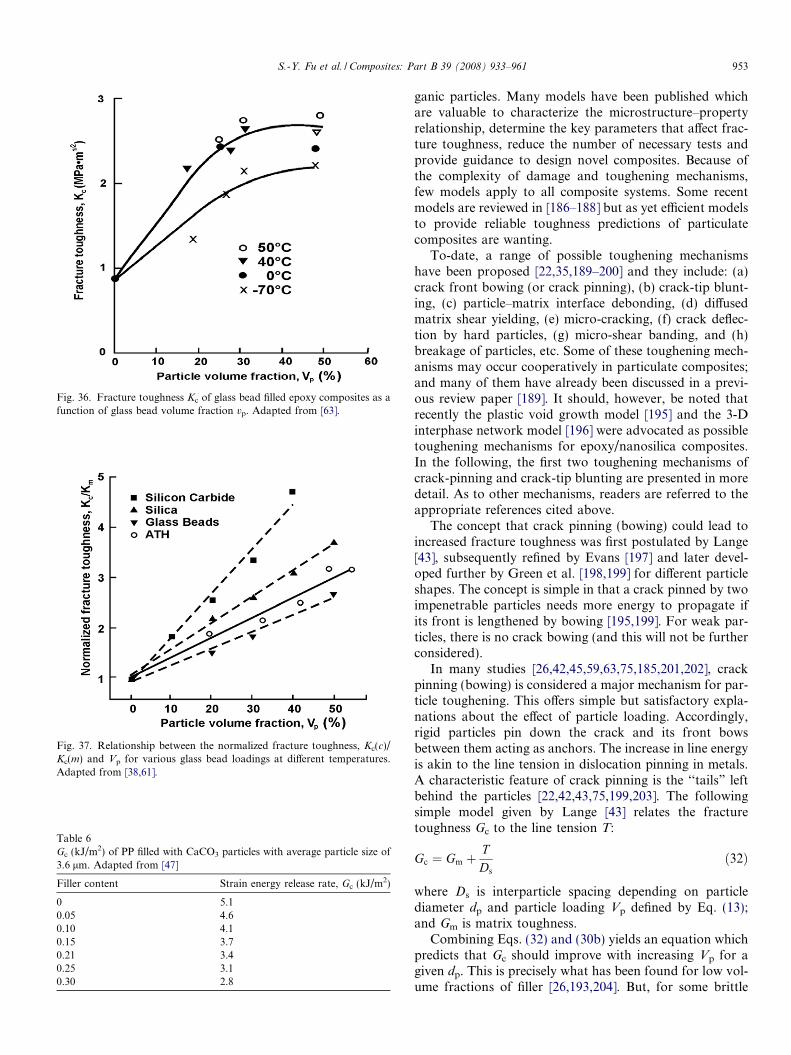
Fig. 36. Fracture toughness Kc of glass bead filled epoxy composites as afunction of glass bead volume fraction vp. Adapted from [63].
Table 6Gc (kJ/m2) of PP filled with CaCO3 particles with average particle size of3.6 lm. Adapted from [47]
Filler content Strain energy release rate, Gc (kJ/m2)
0 5.10.05 4.60.10 4.10.15 3.70.21 3.40.25 3.10.30 2.8
Fig. 37. Relationship between the normalized fracture toughness, Kc(c)/Kc(m) and Vp for various glass bead loadings at different temperatures.Adapted from [38,61].
S.-Y. Fu et al. / Composites: Part B 39 (2008) 933–961 953
ganic particles. Many models have been published whichare valuable to characterize the microstructure–propertyrelationship, determine the key parameters that affect frac-ture toughness, reduce the number of necessary tests andprovide guidance to design novel composites. Because ofthe complexity of damage and toughening mechanisms,few models apply to all composite systems. Some recentmodels are reviewed in [186–188] but as yet efficient modelsto provide reliable toughness predictions of particulatecomposites are wanting.
To-date, a range of possible toughening mechanismshave been proposed [22,35,189–200] and they include: (a)crack front bowing (or crack pinning), (b) crack-tip blunt-ing, (c) particle–matrix interface debonding, (d) diffusedmatrix shear yielding, (e) micro-cracking, (f) crack deflec-tion by hard particles, (g) micro-shear banding, and (h)breakage of particles, etc. Some of these toughening mech-anisms may occur cooperatively in particulate composites;and many of them have already been discussed in a previ-ous review paper [189]. It should, however, be noted thatrecently the plastic void growth model [195] and the 3-Dinterphase network model [196] were advocated as possibletoughening mechanisms for epoxy/nanosilica composites.In the following, the first two toughening mechanisms ofcrack-pinning and crack-tip blunting are presented in moredetail. As to other mechanisms, readers are referred to theappropriate references cited above.
The concept that crack pinning (bowing) could lead toincreased fracture toughness was first postulated by Lange[43], subsequently refined by Evans [197] and later devel-oped further by Green et al. [198,199] for different particleshapes. The concept is simple in that a crack pinned by twoimpenetrable particles needs more energy to propagate ifits front is lengthened by bowing [195,199]. For weak par-ticles, there is no crack bowing (and this will not be furtherconsidered).
In many studies [26,42,45,59,63,75,185,201,202], crackpinning (bowing) is considered a major mechanism for par-ticle toughening. This offers simple but satisfactory expla-nations about the effect of particle loading. Accordingly,rigid particles pin down the crack and its front bowsbetween them acting as anchors. The increase in line energyis akin to the line tension in dislocation pinning in metals.A characteristic feature of crack pinning is the ‘‘tails” leftbehind the particles [22,42,43,75,199,203]. The followingsimple model given by Lange [43] relates the fracturetoughness Gc to the line tension T:
Gc ¼ Gm þTDs
ð32Þ
where Ds is interparticle spacing depending on particlediameter dp and particle loading Vp defined by Eq. (13);and Gm is matrix toughness.
Combining Eqs. (32) and (30b) yields an equation whichpredicts that Gc should improve with increasing Vp for agiven dp. This is precisely what has been found for low vol-ume fractions of filler [26,193,204]. But, for some brittle
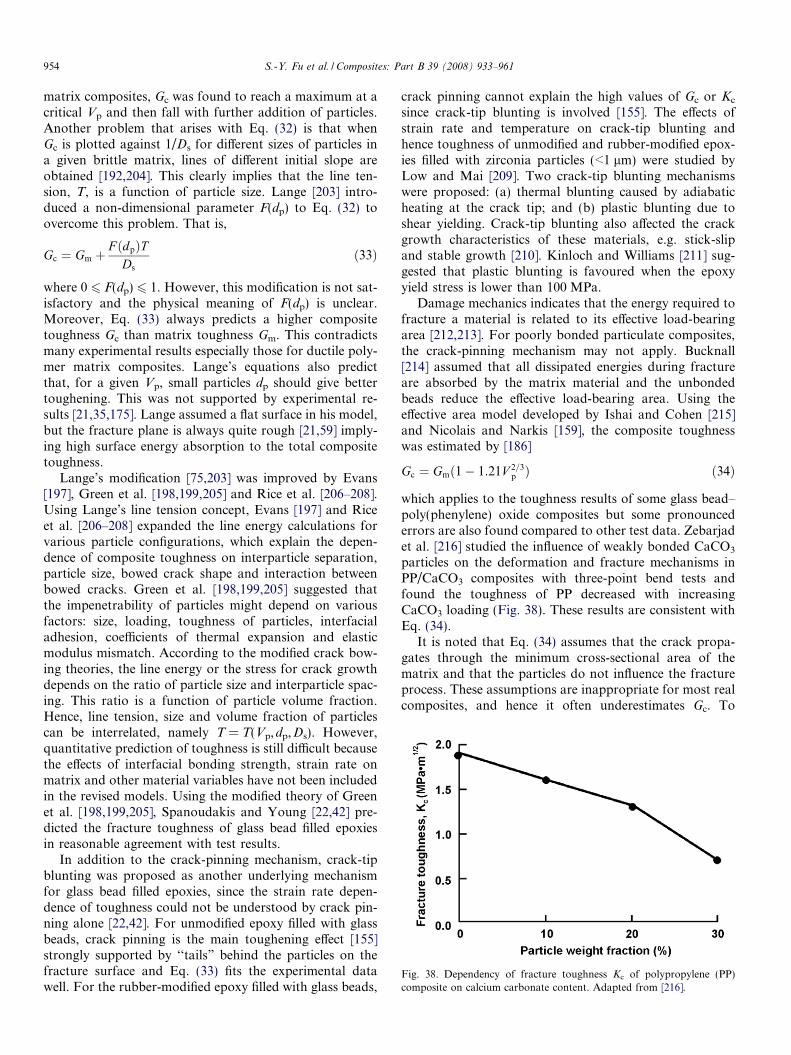
Fig. 38. Dependency of fracture toughness Kc of polypropylene (PP)composite on calcium carbonate content. Adapted from [216].
954 S.-Y. Fu et al. / Composites: Part B 39 (2008) 933–961
matrix composites, Gc was found to reach a maximum at acritical Vp and then fall with further addition of particles.Another problem that arises with Eq. (32) is that whenGc is plotted against 1/Ds for different sizes of particles ina given brittle matrix, lines of different initial slope areobtained [192,204]. This clearly implies that the line ten-sion, T, is a function of particle size. Lange [203] intro-duced a non-dimensional parameter F(dp) to Eq. (32) toovercome this problem. That is,
Gc ¼ Gm þF ðdpÞT
Ds
ð33Þ
where 0 6 F(dp) 6 1. However, this modification is not sat-isfactory and the physical meaning of F(dp) is unclear.Moreover, Eq. (33) always predicts a higher compositetoughness Gc than matrix toughness Gm. This contradictsmany experimental results especially those for ductile poly-mer matrix composites. Lange’s equations also predictthat, for a given Vp, small particles dp should give bettertoughening. This was not supported by experimental re-sults [21,35,175]. Lange assumed a flat surface in his model,but the fracture plane is always quite rough [21,59] imply-ing high surface energy absorption to the total compositetoughness.
Lange’s modification [75,203] was improved by Evans[197], Green et al. [198,199,205] and Rice et al. [206–208].Using Lange’s line tension concept, Evans [197] and Riceet al. [206–208] expanded the line energy calculations forvarious particle configurations, which explain the depen-dence of composite toughness on interparticle separation,particle size, bowed crack shape and interaction betweenbowed cracks. Green et al. [198,199,205] suggested thatthe impenetrability of particles might depend on variousfactors: size, loading, toughness of particles, interfacialadhesion, coefficients of thermal expansion and elasticmodulus mismatch. According to the modified crack bow-ing theories, the line energy or the stress for crack growthdepends on the ratio of particle size and interparticle spac-ing. This ratio is a function of particle volume fraction.Hence, line tension, size and volume fraction of particlescan be interrelated, namely T = T(Vp,dp,Ds). However,quantitative prediction of toughness is still difficult becausethe effects of interfacial bonding strength, strain rate onmatrix and other material variables have not been includedin the revised models. Using the modified theory of Greenet al. [198,199,205], Spanoudakis and Young [22,42] pre-dicted the fracture toughness of glass bead filled epoxiesin reasonable agreement with test results.
In addition to the crack-pinning mechanism, crack-tipblunting was proposed as another underlying mechanismfor glass bead filled epoxies, since the strain rate depen-dence of toughness could not be understood by crack pin-ning alone [22,42]. For unmodified epoxy filled with glassbeads, crack pinning is the main toughening effect [155]strongly supported by ‘‘tails” behind the particles on thefracture surface and Eq. (33) fits the experimental datawell. For the rubber-modified epoxy filled with glass beads,
crack pinning cannot explain the high values of Gc or Kc
since crack-tip blunting is involved [155]. The effects ofstrain rate and temperature on crack-tip blunting andhence toughness of unmodified and rubber-modified epox-ies filled with zirconia particles (<1 lm) were studied byLow and Mai [209]. Two crack-tip blunting mechanismswere proposed: (a) thermal blunting caused by adiabaticheating at the crack tip; and (b) plastic blunting due toshear yielding. Crack-tip blunting also affected the crackgrowth characteristics of these materials, e.g. stick-slipand stable growth [210]. Kinloch and Williams [211] sug-gested that plastic blunting is favoured when the epoxyyield stress is lower than 100 MPa.
Damage mechanics indicates that the energy required tofracture a material is related to its effective load-bearingarea [212,213]. For poorly bonded particulate composites,the crack-pinning mechanism may not apply. Bucknall[214] assumed that all dissipated energies during fractureare absorbed by the matrix material and the unbondedbeads reduce the effective load-bearing area. Using theeffective area model developed by Ishai and Cohen [215]and Nicolais and Narkis [159], the composite toughnesswas estimated by [186]
Gc ¼ Gmð1� 1:21V 2=3p Þ ð34Þ
which applies to the toughness results of some glass bead–poly(phenylene) oxide composites but some pronouncederrors are also found compared to other test data. Zebarjadet al. [216] studied the influence of weakly bonded CaCO3
particles on the deformation and fracture mechanisms inPP/CaCO3 composites with three-point bend tests andfound the toughness of PP decreased with increasingCaCO3 loading (Fig. 38). These results are consistent withEq. (34).
It is noted that Eq. (34) assumes that the crack propa-gates through the minimum cross-sectional area of thematrix and that the particles do not influence the fractureprocess. These assumptions are inappropriate for most realcomposites, and hence it often underestimates Gc. To
S.-Y. Fu et al. / Composites: Part B 39 (2008) 933–961 955
redress this problem, Kendall [46] assumed that when acrack meets a particle, it will grow along the particle/matrixinterface whose fracture toughness is Gf. Then consideringthe extra area of fracture surface due to the presence ofparticles, he obtained the relation below to calculate thecomposite fracture toughness:
Gc ¼ Gmð1� k/Þ þ Gf nk/ ð35Þ
where k/ is enhanced fracture surface volume fraction,which depends on the fracture path, and n takes into ac-count the extra path around the particles. Eq. (35) withoutthe second term on the right side, since this is thought to benegligible, has been used by Friedrich and Karsch [217] todescribe the toughness of a series of silica–PP compositeswith good accuracy. Naturally, these two models assumeno or weak adhesion between particles and matrix andhence predict toughness to decrease with particle loading.
Lange and Radford [75] studied the fracture of aluminatrihydrate (ATH) filled epoxy resins and reported that Gc
was improved by adding the particles. This was attributedto crack pinning. They used three different median particlesizes: 1, 8 and 12 lm (see Fig. 27). As the particle sizeincreased, the peak value Gc also increased. They explainedthis by assuming large particles were better able to supportcrack pinning than small particles, and thus more efficientin improving the overall Gc. Conversely, the decrease in Gc
beyond the peak value suggests a reduced extent of crackpinning at high volume fractions. Furthermore, crackblunting was concluded to be the dominant tougheningmechanism for large ATH particles because the particleswere weak, frequently undergoing cleavage and unstableto participate extensively in crack pinning. For most parti-cles, the higher the particle strength, the larger the enhance-ment of fracture toughness achieved per unit volumefraction. The leveling of Kc sometimes observed at highvolume fractions may be due to an increase in the fre-quency of trans-particle fractures.
The mechanism of crack interaction with a second phasedispersion is qualitatively consistent with the resultsobtained by Lange and Radford [75] where two differenttypes of fracture surfaces were observed. One type includedsurface steps associated with each particle encountered bythe moving crack front. They are a characteristic featureof the interaction of a crack with inhomogeneities, suchas voids and second phase particles. This type of surfacewas only observed for composites containing dispersedphase volume fractions smaller than that resulting in peaktoughness. The second type of surface appeared similar tothat of polycrystalline materials. Such surfaces were foundfor composites with volume fractions larger than that yield-ing peak toughness. A combination of both types of frac-ture surfaces was observed for composites with peaktoughness. In general, for large interparticle spacing, a sur-face containing steps was observed. For small interparticlespacing, the surface appeared polycrystalline. During frac-ture, a moving crack is momentarily pinned at positions ofinhomogeneities within the brittle matrix. This interaction
leads to crack front bowing, thus increasing its total lengthwhen the particle spacing decreases and the line tensionrises. However, a maximum is reached inferring that thedispersed particles become too closely spaced to interacteffectively with the crack front. Smaller particles are lesseffective as anchors than larger particles. Therefore, thefracture toughness is higher for the composite containinglarger particles.
Particle/matrix interface adhesion was found to affectboth the crack growth behaviour and the appearance ofthe fracture surface of glass bead filled epoxy micro-com-posites [42]. The main toughening mechanism is crack pin-ning. For poorly bonded particles, the crack is attracted tothe equators of the particles and moves around the parti-cles. The fracture surface consists of hemispherical holesand top surfaces of debonded particles. For well-bondedparticles, the crack is attracted to the poles of the particles.The crack then propagates through the matrix above orbelow the particles leaving a layer of epoxy resin coveringthem.
Weak interfacial adhesion between rigid particles andmatrix makes crack pinning less effective because debondedparticles are ineffective as pinning sites [63]. Moreover,Levita et al. [35] reported that the crack-pinning contribu-tion to Gc is negligible for very small particle size. Smallparticles differ from coarse ones if the interface adhesionaffects the composites properties (since surface to volumeratio increases with reciprocal particle size). If interfacialdebonding dominates, smaller particles will lead to largerGc due to their higher total surface area than larger parti-cles at a given volume fraction.
As mentioned above, another approach to explain thetoughness variation of particle-filled polymers is based onthe fracture process zone concept. Evans et al. [218] arguedthat energy dissipation processes within a dissipation zonein front of the crack are responsible for toughness enhance-ment by adding hard particles to ductile polymers. Theyfound that particle debonding and subsequent yielding oflocal polymer regions are the dominant mechanisms. Sim-ilar argument was used by Bohse et al. [219].
The toughening mechanisms of semi-crystalline poly-mers (e.g., polyamides and isotactic polypropylene) rein-forced with rubber particles have been extensively studied[220–224]. The effects of such parameters as rubber particlesize, volume fraction and interparticle distance on the effec-tiveness of toughening have been examined. It has beenconcluded [222] that for a blend to be tough, the particlesmust be smaller than a critical size, which depends on thematrix type and rubber concentration. Similarly, rubberconcentration must be above a critical level that, in turn,is a function of particle size. Based on experimental obser-vations of a series of rubber-modified polyamide-6,6blends, Wu [225,226] found that the thickness of the matrixligaments between rubber particles is a key parameter forrubber toughening. He noted that a sharp brittle–toughtransition occurs when the average thickness of the matrixligaments is smaller than a certain critical value. Several
956 S.-Y. Fu et al. / Composites: Part B 39 (2008) 933–961
explanations for this phenomenon were proposed by Wu,but rejected by Muratoglu et al. [227] who concluded thatthe change of the local matrix structure caused by the inclu-sions is responsible for the change of toughness. This ideawas extended and proven for certain semi-crystalline poly-mers in subsequent papers [222,228]. The primary role ofthe filler is to introduce a high amount of interface thataffects the crystallization process and modifies the structureof the polymer in the neighborhood of the particle surface.The role of the trancrystalline regions due to nanosized softand hard particles, such as rubber and clay, on toughnesshas been recently studied by Dasari et al. [229].
5. Concluding remarks
A critical review of the experimental results and theoriesof the mechanical properties including modulus, strengthand fracture toughness of polymer based particulate micro-and nano-composites is presented. The effects of particlesize, particle/matrix adhesion and particle loading on com-posite stiffness, strength and toughness of a range of partic-ulate composites having both micro- and nano-fillers withsmall aspect ratios of unity and thereabout are examinedin detail. It is shown that composite strength and toughnessare strongly affected by all three factors, especially particle/matrix adhesion. This is expected because strength dependson effective stress transfer between filler and matrix, andtoughness/brittleness is controlled by adhesion. Varioustrends of the effect of particle loading on compositestrength and toughness have been observed due to theinterplay between these three factors, which cannot alwaysbe separated. However, composite stiffness depends signif-icantly on particle loading, not particle/matrix adhesion,since the fillers have much larger modulus than the matrix.There is also a critical particle size, usually in nanoscale,below which the composite stiffness is greatly enhanceddue to the significant effect of the particle size, probablycaused by the much larger surface areas imparting a‘‘nano”-effect. A critical evaluation of existing test dataand available theoretical and phenomenological models isgiven to obtain basic knowledge of the strengthening, stiff-ening and toughening mechanisms in these particulatecomposites. The applicability of existing models, both phe-nomenological and empirical/semi-empirical, to describethe experimental results for polymer-based particulatecomposites are discussed.
Acknowledgements
Financial support from the National Natural ScienceFoundation of China (Grant Nos.: 50573090, 10672161,10525210 and 10732050), the Overseas OutstandingScholar Foundation of the Chinese Academy of Sciences(Grant Nos.: 2005-1-3 and 2005-2-1), the 973 Project(2003CB615603), the Australian Research Council andthe Alexander von Humboldt Foundation is gratefullyacknowledged.
References
[1] Ray SS, Okamoto M. Polymer/layered silicate nanocomposites: areview from preparation to processing. Prog Polym Sci 2003;28:1539–641.
[2] Alexandre M, Dubois P. Polymer-layered silicate nanocomposites:preparation, properties and uses of a new class of materials. MaterSci Eng R 2000;28:1–63.
[3] Kim MH, Park CI, Choi WM, Lee JW, Lim JG, Park OO.Synthesis and material properties of syndiotactic polystyrene/organophilic clay nanocomposites. J Appl Polym Sci 2004;92:2144–50.
[4] Liu L, Qi Z, Zhu X. Studies on nylon 6/clay nanocomposites bymelt-intercalation process. J Appl Polym Sci 1999;71:1133–8.
[5] Usuki A, Kojima Y, Kawasumi M, Okada A, Fukushima Y,Kurauchi T, et al. Synthesis of nylon-6–clay hybrid. J Mater Res1993;8:1179–83.
[6] Giannelis EP. Polymer layered silicate nanocomposites. Adv Mater1996;8:29–35.
[7] Kojima Y, Usuki A, Kawasumi M, Fukushima Y, Okada A,Kurauchi T, et al. One-pot synthesis of nylon-6 clay hybrid. J PolymSci Part A Polym Chem 1993;31:1755–8.
[8] Tyan HL, Liu YC, Wei KH. Thermally and mechanically enhancedclay/polyimide nanocomposite via reactive organoclay. Chem Mater1999;11:1942–7.
[9] Shi H, Lan T, Pinnavaia T. Interfacial effects on the reinforcementproperties of polymer–organoclay nanocomposites. Chem Mater1996;8:1584–7.
[10] Cho JW, Paul DR. Nylon 6 nanocomposites by melt compounding.Polymer 2001;42:1083–94.
[11] Wang Z, Lan T, Pinnavaia TJ. Hybrid organic–inorganic nano-composites formed from an epoxy polymer and a layered silicic acid(magadiite). Chem Mater 1996;8:2200–4.
[12] Zhang YH, Wu JT, Fu SY, Yang SY, Li Y, Fan L, et al. Studieson characterization and cryogenic mechanical properties of poly-imide-layered silicate nanocomposite films. Polymer 2004;45:7579–87.
[13] Tjong SC. Structural and mechanical properties of polymer nano-composites. Mater Sci Eng R 2006;53:73–197.
[14] Lau KT, Gu C, Hui D. A critical review on nanotube and nanotube/nanoclay related polymer composite materials. Composites Part B2006;37:425–36.
[15] Xie XL, Zhou XP, Mai Y-W. Dispersion and alignment of carbonnanotubes in polymer matrix: a review. Mater Sci Eng R2005;49:89–112.
[16] Zhu ZK, Yang Y, Yin J, Qi ZN. Preparation and properties oforganosoluble polyimide/silica hybrid materials by sol–gel process. JAppl Polym Sci 1999;73:2977–84.
[17] Dekkers MEJ, Heikens D. The effect of interfacial adhesion on thetensile behavior of polystyrene–glass-bead composites. J ApplPolym Sci 1983;28:3809–15.
[18] Fu SY, Lauke B. Characterization of tensile behaviour of hybridshort glass fibre calcite particle ABS composites. Composite Part A1998;29A:575–83.
[19] Fu SY, Lauke B. Analysis of mechanical properties of injectionmolded short glass fibre (SGF)/calcite/ABS composites. J Mater SciTechnol 1997;13:389–96.
[20] Eirich FR. Some mechanical and molecular aspects of the perfor-mance of composites. J Appl Polym Sci Appl Polym Symp1984;39:93–102.
[21] Radford KC. The mechanical properties of an epoxy resin with asecond phase dispersion. J Mater Sci 1971;6:1286–91.
[22] Spanoudakis J, Young RJ. Crack propagation in a glass particle-filled epoxy–resin. 1. Effect of particle-volume fraction and size. JMater Sci 1984;19:473–86.
[23] Amdouni N, Sautereau H, Gerard JF. Epoxy composites based onglass-beats. 2. Mechanical-properties. J Appl Polym Sci 1992;46:1723–35.
S.-Y. Fu et al. / Composites: Part B 39 (2008) 933–961 957
[24] Wang M, Berry C, Braden M, Bonfield W. Young’s and shearmoduli of ceramic particle filled polyethylene. J Mater Sci MaterMed 1998;9:621–4.
[25] Hsueh CH. Effects of aspect ratios of ellipsoidal inclusions on elasticstress transfer of ceramic composites. J Am Ceram Soc 1987;72:344–7.
[26] Young RJ, Beaumont PWR. Effect of composition upon fracture ofsilica particle-filled epoxy–resin composites. J Mater Sci 1977;12:684–92.
[27] Pukanszky B, Voros G. Mechanism of interfacial interactions inparticulate filled composites. Compos Interf 1993;1:411–27.
[28] Nakamura Y, Yamaguchi M, Okubo M, Matsumoto T. Effects ofparticle size on mechanical and impact properties of epoxy resinfilled with spherical silica. J Appl Polym Sci 1992;45:1281–9.
[29] Reynaud E, Jouen T, Gauthier C, Vigier G, Varlet J. Nanofillers inpolymeric matrix: a study on silica reinforced PA6. Polymer2001;42:8759–68.
[30] Ou Y, Yang F, Yu ZZ. A new conception on the toughness of nylon6/silica nanocomposite prepared via in situ polymerization. J PolymSci Part B Polym Phys 1998;36:789–95.
[31] Liang JZ, Li RKY, Tjong SC. Tensile fracture behaviour andmorphological analysis of glass bead filled low density polyethylenecomposites. Plast Rubber Compos Process Appl 1997;26:278–82.
[32] Chacko VP, Farris RJ, Karasz FE. Dynamic mechanical spectrom-etry of nylon-12. J Appl Polym Sci 1983;28:2701–5.
[33] Tjong SC, Xu SA. Ternary polymer composites: PA6,6/maleatedSEBS/glass beads. J Appl Polym Sci 2001;81:3231–7.
[34] Danusso F, Tieghi G. Strength versus composition of rigid matrixparticulate composites. Polymer 1986;27:1385–90.
[35] Levita G, Marchetti A, Lazzeri A. Fracture of ultrafine calciumcarbonate/polypropylene composites. Polym Compos 1989;10:39–43.
[36] Nicolais L, Narkis M. Stress–strain behavior of styrene–acryloni-trile/glass bead composites in the glassy region. Polym Eng Sci1971;11:194–9.
[37] Nicolais L, Nicodemo L. Effect of particles shape on tensileproperties of glassy thermoplastic composites. Int J Polym Mater1974;3:229.
[38] Moloney AC, Kausch HH, Kaiser T, Beer HR. Review – parametersdetermining the strength and toughness of particulate filled epoxideresins. J Mater Sci 1987;22:381–93.
[39] Kinloch AJ, Young RJ. Fracture behavior of polymers. Lon-don: Elsevier Applied Science; 1983, p. 229.
[40] Shimbo M, Ochi M, Arai K. Internal stress of cured epoxide resincoatings having different network chains. J Coat Technol1984;56:45–51.
[41] Shimbo M, Ochi M, Shigeta Y. Shrinkage and internal stress duringcuring of epoxide resins. J Appl Polym Sci 1981;26:2265–77.
[42] Spanoudakis J, Young RJ. Crack propagation in a glass particle-filled composite at or near a rigid spherical inclusion. J Mater Sci1984;19:487–96.
[43] Lange FF. The interaction of a crack front with a second phasedispersion. Philos Mag 1970;22:983–92.
[44] Nielsen LE, Landel RF. Mechanical properties of polymers andcomposites. 2nd ed. New York: Marcel Dekker; 1994, p. 131–232.
[45] Rothon R. Particulate-filled polymer composites. New York: JohnWiley & Sons; 1995.
[46] Kendall K. Fracture of particulate filled polymers. Brit Polym J1978;10:35–8.
[47] Jancar J, Dibenedetto AT. Failure mechanics in ternary compositesof polypropylene with inorganic fillers and elastomer inclusions. JMater Sci 1995;30:2438–45.
[48] Fu SY, Lauke B. Fracture resistance of unfilled and calcite particle-filled ABS composites reinforced by short glass fibers (SGF) underimpact load. Composite Part A 1998;29A:631–41.
[49] Pukanszky B. Composites. In: Karger-Kocsis J, editor. Polypropyl-ene: structure, blends and composites, vol. 3. London: Chapman &Hall; 1995. p. 1–70.
[50] Baker RA, Koller LL, Kummer PE. Calcium carbonate. In: KatzHS, Milevski JL, editors. Handbook of fillers for plastics. 2nded. New York: Van Nostrand Reinhold Co; 1987. p. 119–42.
[51] Badran BM, Galeski A, Kryszewski M. High-density polyethylenefilled with modified chalk. J Appl Polym Sci 1982;27:3669–81.
[52] Hoffmann H, Grellmann W, Zilvar V. Instrumented impact studieson thermoplastic composites. In: Sedlacek B, editor. 28th Micro-symposium on macromolecules polymer composites. Polymer com-posites. New York: Walter de Gruyter; 1986. p. 233–42.
[53] Fu Q, Wang G. Polyethylene toughened by rigid inorganic particles.Polym Eng Sci 1992;32:94–7.
[54] Fu Q, Wang G, Shen J. Polyethylene toughened by CaCO3 particles:brittle–ductile transition of CaCO3-toughened HDPE. J Appl PolymSci 1993;49:673–6.
[55] Fu Q, Wang G. Effect of morphology on brittle–ductile transition ofHDPE/CaCO3 blends. J Appl Polym Sci 1993;49:1985–8.
[56] Fu Q, Wang G. Polyethylene toughened by CaCO3 particles-percolation model of brittle–ductile transition in HDPE/CaCO3
blends. Polym Int 1993;30:309–12.[57] Bartczak Z, Argon AS, Cohen RE, Weinberg M. Toughness
mechanism in semi-crystalline polymer blends: II. High-densitypolyethylene toughened with calcium carbonate filler particles.Polymer 1999;40:2347–65.
[58] Sumita M, Shizuma T, Miyasaka K, Ishikawa K. Effect of reducibleproperties of temperature, rate of strain, and filler content on thetensile yield stress of nylon 6 composites filled with ultrafineparticles. J Macromol Sci 1983;B22:601–18.
[59] Broutman LJ, Sahu S. The effect of interfacial bonding on thetoughness of glass filled polymers. Mater Sci Eng 1971;8:98–107.
[60] Kinloch AJ. Structural adhesives. London: Elsevier Applied SciencePublishers; 1986.
[61] Roulin-Moloney AC, Cantwell WJ, Kausch HH. Parametersdetermining the strength and toughness of particulate-filled epoxyresins. Polym Compos 1987;8:314–23.
[62] Sahu S, Broutman LJ. Mechanical properties of particulatecomposites. Polym Eng Sci 1972;12:91–100.
[63] Kinloch AJ, Maxwell DL, Young RJ. The fracture of hybrid–particulate composites. J Mater Sci 1985;20:4169–84.
[64] Alcock B, Cabrera NO, Barkoula NM, Reynolds CT, Govaert LE,Peijs T. The effect of temperature and strain rate on the mechanicalproperties of highly oriented polypropylene tapes and all-polypro-pylene composites. Compos Sci Technol 2007;67:2061–70.
[65] Kwon SC, Adachi T, Araki W, Yamaji A. Thermo-viscoelasticproperties of silica particulate-reinforced epoxy composites: consid-ered in terms of the particle packing model. Acta Mater2006;54:3369–74.
[66] van Hartingsveldt EAA, van Aartsen JJ. Strain-rate dependence ofinterfacial adhesion in particle-reinforced polymers. Polymer1991;32:1482–7.
[67] Nicolais L, Guerra G, Migliaresi C, Nicodemo L, Di Benedetto AT.Viscoelastic behavior of glass-reinforced epoxy resin. Polym Com-pos 1981;2:116–20.
[68] Drozdov AD. Modeling viscoelastic response of particulate poly-meric composites with high volume fractions of fillers. MathComput Model 1999;29:11–25.
[69] Adolf DB, Rchambers OS. Application of a nonlinear viscoelasticmodel to glassy, particulate-filled polymers. J Polym Sci Part BPolym Phys 2005;43:3135–50.
[70] Nakamura Y, Yamaguchi M, Okubo M, Matsumoto T. Effect ofparticle size on mechanical properties of epoxy resin filled withangular-shaped silica. J Appl Polym Sci 1992;44:151–8.
[71] Zhang Q, Tian M, Wu Y, Lin G, Zhang L. Effect of particle size onthe properties of Mg(OH)2-filled rubber composites. J Appl PolymSci 2004;94:2341–6.
[72] Lazzeri A, Thio YS, Cohen RE. Volume strain measurements onCaCO3/polypropylene particulate composites: the effect of particlesize. J Appl Polym Sci 2004;91:925–35.
958 S.-Y. Fu et al. / Composites: Part B 39 (2008) 933–961
[73] Suprapakorn N, Dhamrongvaraporn SS. Effect of CaCO3 on themechanical and rheological properties of a ring-opening phenolicresin: polybenzoxazine. Polym Compos 1998;19:126–32.
[74] Singh RP, Zhang M, Chan D. Toughening of a brittle thermosettingpolymer: effects of reinforcement particle size and volume fraction. JMater Sci 2002;37:781–8.
[75] Lange FF, Radford KC. Fracture energy of an epoxy compositesystem. J Mater Sci 1971;6:1197–203.
[76] Ji XL, Jing JK, Jiang BZ. Tensile modulus of polymer nanocom-posites. Polym Eng Sci 2002;42:983–93.
[77] Mishra S, Sonawane SH, Singh RP. Studies on characterization ofnano CaCO3 prepared by the in situ deposition technique and itsapplication in PP–nano CaCO3 composites. J Polym Sci Part BPolym Phys 2005;43:107–13.
[78] Douce J, Boilot JP, Biteau J, Scodellaro L, Jimenez A. Effect of fillersize and surface condition of nano-sized silica particles in polysi-loxane coatings. Thin Solid Films 2004;466:114–22.
[79] Dibendetto AT, Wambach AD. The fracture toughness of epoxy–glass bead composites. Int J Polym Mater 1972;1:159–73.
[80] Wang K, Wu J, Ye L, Zeng H. Mechanical properties andtoughening mechanisms of polypropylene/barium sulfate compos-ites. Composite Part A 2003;34:1199–205.
[81] Fu SY, Hu X, Yue CY. The flexural modulus of misaligned shortfiber reinforced polymers. Compos Sci Technol 1999;59:1533–42.
[82] Fu SY, Lauke B. Strength anisotropy of misaligned short-fibre-reinforced polymers. Compos Sci Technol 1998;58:1961–72.
[83] Fu SY, Lauke B. Effects of fibre length and orientation distributionson the tensile strength of short fibre reinforced polymers. ComposSci Technol 1996;56:1179–90.
[84] Einstein A. Ueber die von der molekularkinetischen fluessigkeitensuspendierten teilchen. Ann Phys (Leipzig) 1905;17:549–60.
[85] Einstein A. Investigation on theory of Brownian motion. NewYork: Dover; 1956.
[86] Hsueh CH, Becher PF. Effective viscosity of suspensions of spheres.J Am Ceram Soc 2005;88:1046–9.
[87] Tavman IH. Thermal and mechanical properties of aluminumpowder-filled high-density polyethylene composites. J Appl PolymSci 1996;62:2161–7.
[88] Guth E. Theory of filler reinforcement. J Appl Phys 1945;16:20–5.[89] Halpin JC. Stiffness and expansion estimates for oriented short fiber
composites. J Compos Mater 1969;3:732–4.[90] Halpin JC, Tsai SW. Effects of environmental factors on composite
materials. Technical Report. AFML-TR 67-423; 1969.[91] Kerner EH. The elastic and thermoelastic properties of composite
media. Proc Phys Soc B 1956;69:808–13.[92] Nielsen LE. Generalized equation for the elastic moduli of
composite materials. J Appl Phys 1970;41:4626–7.[93] Nielsen LE. Dynamic mechanical properties of polymers filled with
agglomerated particles. J Polym Sci Polym Phys 1979;17:1897–901.[94] Lewis TB, Nielsen LE. Dynamic mechanical properties of particu-
late filled composites. J Appl Polym Sci 1970;14:1449–71.[95] Mooney M. The viscosity of a concentrated suspension of spherical
particles. J Colloid Sci 1951;6:162–70.[96] Brodnyan JG. The concentration dependence of the Newtonian
viscosity of prolate ellipsoids. Trans Soc Rheol 1959;3:61–8.[97] Fu SY, Hu X, Yue CY. A new model for the transverse modulus of
unidirectional fiber composites. J Mater Sci 1998;33:4953–60.[98] Ma L, Feng XQ, Gao KW, Yu SW. Elastic and plastic analyses of
functionally graded elements. Mater Sci Forum 2003;423-425:731–6.[99] Coran AY. Thermoplastic elastomeric rubber-plastic blends. In:
Bhowmick AK, Stephens HL, editors. Handbook of elastomers –new development and technology. New York: Marcel Dekker Inc.;1988. p. 249–60.
[100] George S, Prasannakumari L, Koshy P, Varughese KT, Thomas S.Tearing behavior of blends of isotactic polypropylene and nitrilerubber: influence of blend ratio, morphology and compatibilizerloading. Mater Lett 1996;26:51–8.
[101] George S, Joseph R, Thomas S, Varughese KT. Blends of isotacticpolypropylene and nitrile rubber: morphology, mechanical proper-ties and compatibilization. Polymer 1995;36:4405–16.
[102] Hashin Z, Shtrikman S. On some variational principles in an-isotropic and inhomogeneous elasticity. J Mech Phys Solids1962;10:335–42.
[103] Torquato S. Random heterogeneous materials: microstructure andmacroscopic properties. Heidelberg: Springer; 2002.
[104] Counto UJ. Effect of the elastic modulus, creep and creep recoveryof concrete. Mag Concr Res 1964;16:129–38.
[105] Ishai O, Cohen IJ. Elastic properties of filled and porous epoxycomposites. Int J Mech Sci 1967;9:539–46.
[106] Paul B. Prediction of constants of multiphase materials. Trans AmInst Min Metall Pet Eng 1960;218:36–41.
[107] Kuo MC, Tsai CM, Huang JC, Chen M. Composites reinforced bynano-sized SiO2 and Al2O3 particulates. Mater Chem Phys2005;90:185–95.
[108] Young RJ, Maxwell DL, Kinloch AJ. The deformation of hybrid–particulate composites. J Mater Sci 1985;21:380–8.
[109] Lee J, Yee AF. Fracture behavior of glass bead filled epoxies:cleaning process of glass beads. J Appl Polym Sci 2001;79:1371–83.
[110] Fu SY, Xu G, Mai Y-W. On the elastic modulus of hybrid. Particle/short fiber/polymer composites. Composite Part B 2002;33:291–9.
[111] Jayaraman K, Kortschot MT. Correction to the Fukuda–KawataYoung’s modulus theory and the Fukuda–Chou strength theory forshort fibre-reinforced composite materials. J Mater Sci1996;31:2059–64.
[112] Vu-Khanh T, Denault J. The effects of injection moulding on themechanical behaviour of long-fibre reinforced PBT/PET blends.Compos Sci Technol 1991;40:423–35.
[113] Piggott MR. Short fibre polymer composites: a fracture-basedtheory of fibre reinforcement. J Compos Mater 1994;28:588–606.
[114] Verbeek CJR. The influence of interfacial adhesion, particle size andsize distribution on the predicted mechanical properties of partic-ulate thermoplastic composites. Mater Lett 2003;57:1919–24.
[115] Shang SW, Williams JW, Soderholm KJM. Work of adhesionaffects the. mechanical properties of silica-filled composites. J MaterSci 1994;29:2406–16.
[116] Kojima Y, Usuki A, Kawasumi M, Okada A, Kurauchi T,Kamigaito O. Synthesis of nylon 6–clay hybrid by montmorilloniteintercalated with-caprolactam. J Polym Sci Part A Polym Chem1993;31:983–6.
[117] Kojima Y, Usuki A, Kawasumi M, Okada A, Kurauchi T,Kamigaito O. One-pot synthesis of nylon 6–clay hybrid. J PolymSci Part A Polym Chem 1993;31:1755–8.
[118] Yano K, Usuki A, Okada A, Kurauchi T, Kamigaito O. Synthesisand properties of polyimide–clay hybrid. J Polym Sci Part A PolymChem 1993;31:2493–8.
[119] Usuki A, Koiwai A, Kojima Y, Kawasumi M, Okada A, KurauchiT, et al. Migration of antidegradants to the surface in NR and SBRvulcanizates. J Appl Polym Sci 1995;65:119–25.
[120] Feng XQ. Effective elastic moduli of polymer–clay nanocomposites.Chin Sci Bull 2001;46:1130–3.
[121] Takayanagi M, Ogata T, Morikawa M, Kai T. Polymer compositesof rigid and flexible molecules: system of wholly aromatic andaliphatic polyamides. J Macromol Sci Phys B 1980;l7:591–615.
[122] Nemat-Nasser S, Hori M. Micromechanics: overall properties ofheterogeneous materials. Amsterdam: North-Holland; 1993.
[123] Mori T, Tanaka K. Average stress in matrix and average energy ofmaterials with misfitting inclusions. Acta Metall 1973;21:571–4.
[124] Drozdov AD, Dorfmann A. The stress–strain response and ultimatestrength of filled elastomers. Comput Mater Sci 2001;21:395–417.
[125] Manson JA, Sperling LH. Polymer blends and composites. NewYork: Plenum; 1976.
[126] Christensen RM, Lo KH. Solutions for effective shear properties inthree phase sphere and cylinder models. J Mech Phys Solids1979;27:315–30.
S.-Y. Fu et al. / Composites: Part B 39 (2008) 933–961 959
[127] Halpin JC, Kardos JL. Halpin–Tsai equations: a review. Polym EngSci 1976;16:344–52.
[128] Alberola ND, Benzarti K, Bas C, Bomal Y. Interface effects inelastomers reinforced by modified precipitated silica. Polym Com-pos 2001;22:312–25.
[129] Wang GF, Feng XQ, Yu SW, Nan CW. Interface effects on effectiveelastic moduli of nanocrystalline materials. Mater Sci Eng A2003;363:1–8.
[130] Colombini D, Hassander H, Karlsson OJ, Maurer FHJ. Influence ofthe particle size and particle size ratio on the morphology andviscoelastic properties of bimodal hard/soft latex blends. Macro-molecules 2004;37:6865–73.
[131] Colombini D, Maurer FHJ. Origin of additional mechanicaltransitions in multicomponent polymeric materials. Macromolecules2002;35:5891–902.
[132] Sevostianova I, Kachanov M. Effect of interphase layers on theoverall elastic and conductive properties of matrix composites.Applications to nanosize inclusion. Int J Solids Struct 2007;44:1304–15.
[133] Shen LX, Li J. Effective elastic moduli of composites reinforced byparticle or fiber with an inhomogeneous interphase. Int J SolidsStruct 2003;40:1393–409.
[134] Lutz MP, Zimmerman RW. Effect of an inhomogeneous interphasezone on the bulk modulus and conductivity of a particulatecomposite. Int J Solids Struct 2005;42:429–37.
[135] Sharma P, Ganti S. Size-dependent Eshelby’s tensor for embeddednano-inclusions incorporating surface/interface energies. J ApplMech 2004;71:663–71.
[136] Zhong Z, Maguid SA. On the imperfectly bonded sphericalinclusion problem. J Appl Mech 1999;66:839–46.
[137] Li HX, Liu YH, Feng XQ, Cen ZZ. Limit analysis of ductilecomposites based on homogenization theory. Proc R Soc Lond A2003;459:659–75.
[138] Shi DL, Feng XQ, Huang Y, Hwang KC, Gao H. The effect ofnanotube waviness and agglomeration on the elastic property ofcarbon nanotube-reinforced composites. J Eng Mater Technol2004;126:250–7.
[139] Feng XQ, Shi DL, Huang Y, Hwang KC. Multiscale mechanics ofcarbon nanotubes and their composites. In: Sih GC, editor.Multiscaling in molecular and continuum mechanics: interactionof time and size from macro to nano. The Netherlands: Springer;2007. p. 103–39.
[140] Kontou E. Micromechanics model for particulate composites. MechMater 2007;39:702–9.
[141] Rong MZ, Zhang MQ, Pan SL, Lehmann B, Friedrich K. Analysisof the interfacial interactions in polypropylene/silica nanocompos-ites. Polym Int 2004;53:176–83.
[142] Buggy M, Bradley G, Sullivan A. Polymer–filler interactions inkaolin/nylon 6,6 composites containing a silane coupling agent.Composite Part A 2005;36:437–42.
[143] Nakamura Y, Okabe S, Iida T. Effects of particle shape, size andinterfacial adhesion on the fracture strength of silica-filled epoxyresin. Polym Polym Compos 1999;7:177–86.
[144] Packham DE. Work of adhesion: contact angles and contactmechanics. Int J Adhes Adhes 1996;16:121–8.
[145] Creton C, Kramer EJ, Brown HR, Hui CY. Adhesion andfracture of interfaces between immiscible polymers: from themolecular to the continuum scale. Adv Polym Sci 2001;156:53–136.
[146] Harding PH, Berg JC. The characterization of interfacial strengthusing single-particle composites. J Adhe Sci Technol 1997;11:1063–76.
[147] Mower TM, Argon AS. An experimental technique to measure theadhesive and transparent matrices. J Mater Sci 1996;31:1585–94.
[148] Lauke B. Determination of adhesion strength between a coatedparticle and polymer matrix more composites. Compos Sci Technol2006;66:3153–60.
[149] Dekkers MEJ, Heikens D. The effect of interfacial adhesion on themechanism for . . . polystyrene–glass bead composites. J Mater Sci1983;18:3281–7.
[150] Wu CL, Zhang MQ, Rong MZ, Friedrich K. Silica nanoparticlesfilled polypropylene: effects of particle surface treatment, matrixductility and particle species on mechanical performance of thecomposites. Compos Sci Technol 2005;65:635–45.
[151] Thio YS, Argon AS, Cohen RE. Role of interfacial adhesionstrength on toughening polypropylene with rigid particles. Polymer2004;45:3139–47.
[152] Jiang L, Zhang J, Wolcott MP. Comparison of polylactide/nano-sized calcium carbonate and polylactide/montmorillonite compos-ites: reinforcing effects and toughening mechanisms. Polymer2007;48:7632–44.
[153] Li Y, Fu SY, Lin DJ, Zhang YH, Pan QY. Mechanical properties ofpolyimide composites filled with SiO2 nano-particles at roomtemperature and cryogenic temperatures. Acta Mater ComposSinica 2005;22:11–5.
[154] Li Y. Cryogenic properties of silica/polyimide hybrid films. Masterthesis, Chinese Academy of Sciences, Beijing; 2004.
[155] Maazouz A, Sautereau H, Gerard JF. Hybrid–particulate compos-ites based on an epoxy matrix, a reactive rubber, and glass beads:morphology viscoelastic, and mechanical properties. J Appl PolymSci 1993;50:615–26.
[156] Chen Y, Zhou S, Yang H, Wu L. Structure and properties ofpolyurethane/nanosilica composites. J Appl Polym Sci 2005;95:1032–9.
[157] Nielsen LE. Simple theory of stress–strain properties of filledpolymers. J Appl Polym Sci 1966;10:97–103.
[158] Nicolais L, Nicodemo L. Strength of particulate composite. PolymEng Sci 1973;13:469.
[159] Nicolais L, Narkis M. Stress–strain behaviors of SAN/glass beadcomposites in the glassy region. Polym Eng Sci 1971;11:194–9.
[160] Jancar J, Dianselmo A, Dibenedetto AT. The yield strength ofparticulate reinforced thermoplastic composites. Polym Eng Sci1992;32:1394–9.
[161] Leidner J, Woodhams RT. Strength of polymeric compositescontaining spherical fillers. J Appl Polym Sci 1974;18:1639–54.
[162] Bigg DM. Mechanical properties of particulate filled polymers.Polym Compos 1987;8:115–22.
[163] Lu S, Yan L, Zhu X, Qi Z. Microdamage and interfacial adhesion inglass bead-filled high-density polyethylene. J Mater Sci 1992;27:4633–8.
[164] Piggott MR, Leidner J. Misconceptions about filled polymers. JAppl Polym Sci 1974;18:1619–23.
[165] Turcsanyi B, Pukanszky B, Tudos F. Composition dependence oftensile yield stress in filled polymers. J Mater Sci Lett 1988;7:160–2.
[166] Pukanszky B, Turcsanyi B, Tudos F. Effect of interfacial interactionon the tensile yield stress of polymer composites. In: Ishida H,editor. Interfaces in polymer, ceramic and metal matrix compos-ites. Amsterdam: Elsevier; 1988. p. 467–77.
[167] Liang JZ, Li RKY. Prediction of tensile yield strength of rigidinorganic particulate filled thermoplastic composites. J MaterProcess Technol 1998;83:127–30.
[168] Landon G, Lewis G, Boden G. The influence of particle size on thetensile strength of particulate-filled polymers. J Mater Sci1977;12:1605–13.
[169] Hojo H, Toyoshima W, Tamura M, Kawamura N. Short- and long-term strength characteristics of particulate-filled cast epoxy resin.Polym Eng Sci 1974;14:604–9.
[170] Hojo H, Toyoshima W. In: The 31st ANTEC, SPE Montreal,Canada (1973) (Technomic, 1973). p. 163.
[171] Li G, Helms JE, Pang SS, Schulz K. Analytical modeling of tensilestrength of particulate filled composites. Polym Compos2001;22:593–603.
[172] Atkins AG, Mai Y-W. Elastic and plastic fracture. Chichester: EllisHorwood; 1985 and 1988 editions.
960 S.-Y. Fu et al. / Composites: Part B 39 (2008) 933–961
[173] Sih GC, Paris PC, Irwin GR. On cracks in rectilinearly anisotropicbodies. Int J Fract 1965;1:189–203.
[174] Michler GH. Micromechanics of polymers. J Macromol Sci B1999;38:787–802.
[175] Nakamura Y, Yamaguchi M. Effect of particle size on fracturetoughness of epoxy resin filled with angular-shaped silica. Polymer1991;32:2221–9.
[176] Brown HR. A model for brittle–ductile transitions in polymers. JMater Sci 1982;17:469–76.
[177] Argon AS, Cohen RE. Toughenability of polymers. Polymer2003;44:6013–32.
[178] Evans AG, Williams S, Beaumont PWR. On the toughness ofparticulate filled polymers. J Mater Sci 1985;20:3668–74.
[179] Nakamura Y, Yamaguchi M. Effect of particle size on the fracturetoughness of epoxy resin filled with spherical silica. Polymer1992;33:3415–26.
[180] Zhang L, Li C, Huang R. Toughness mechanism in polypropylenecomposites: PP toughened with elastomer and calcium carbonate. JPolym Sci Part B Polym Phys 2004;42:1656–62.
[181] Guo T, Wang L, Zhang A, Cai T. Effects of nano calcium carbonatemodified by a lanthanum compound on the properties of polypro-pylene. J Appl Polym Sci 2005;97:1154–60.
[182] Wetzel B, Haupert F, Zhang MQ. Epoxy nanocomposites with highmechanical and tribological performance. Compos Sci Technol2003;63:2055–67.
[183] Liu ZH, Kwok KW, Li RKY, Choy CL. Effects of coupling agentand morphology on the impact strength of high density polyethyl-ene/CaCO3 composites. Polymer 2002;43:2501–6.
[184] Zuiderduin WCJ, Westzaan C, Huetink J, Gaymans RJ. Toughen-ing of polypropylene with calcium carbonate particles. Polymer2003;44:261–75.
[185] Maxwell D, Young RJ, Kinloch AJ. Hybrid particulate-filled epoxy-polymers. J Mater Sci Lett 1984;3:9–12.
[186] Pukanszky B, Maurer FHJ. Composition dependence of the fracturetoughness of heterogeneous polymer systems. Polymer 1995;36:1617–25.
[187] Gutowski WS. Physical model of interface and interphase perfor-mance in composite materials and bonded polymers. Die AngewMakromol Chem 1999;272:51–6.
[188] Hayes BS, Seferis JC. Modification of thermosetting resins andcomposites through preformed particles. Polym Compos2004;22:451–67.
[189] Garg AC, Mai Y-W. Failure mechanisms in toughened epoxy resins– a review. Compos Sci Technol 1988;31:179–223.
[190] Friedrich K, Karsch UA. Fatigue crack growth and fracture in glasssphere-filled nylon 6. Polym Compos 1982;3:65–74.
[191] Lee J, Yee AF. Inorganic particle toughening II: tougheningmechanisms of glass bead filled epoxies. Polymer 2001;42:589–97.
[192] Lee J, Yee AF. Inorganic particle toughening I: micro-mechanicaldeformations in the fracture of glass bead filled epoxies. Polymer2001;42:577–88.
[193] Faber KT, Evans AG. Crack deflection processes – I: theory. ActaMetall 1983;31:565–76.
[194] Azimi HR, Pearson RA, Hertzberg RW. Fatigue of hybrid epoxycomposites: epoxies containing rubber and hollow glass spheres.Polym Eng Sci 1996;36:2352–65.
[195] Johnsen BB, Kinloch AJ, Mohammed RD, Taylor AC, Sprenger S.Toughening mechanisms of nanoparticle-modified epoxy polymers.Polymer 2007;48:530–41.
[196] Zhang H, Zhang Z, Friedrich K, Eger C. Property improvements ofin situ epoxy nanocomposites with reduced interparticle distance athigh nanosilica content. Acta Mater 2006;54:1833–42.
[197] Evans AG. The strength of brittle materials containing second phasedispersions. Philos Mag 1972;26:1327–44.
[198] Green DJ, Nicholson PS, Embury JD. Fracture of a brittleparticulate composite, part 1: experimental aspects. J Mater Sci1979;14:1413–20.
[199] Green DJ, Nicholson PS, Embury JD. Fracture of a brittleparticulate composite, part 2: theoretical aspects. J Mater Sci1979;14:1657–61.
[200] Phipps MA, Pritchard G, Abou-Torabi A. Role of particle strengthand filler volume fraction in the fracture of alumina trihydrate filledepoxy resins. Polym Polym Compos 1995;3:71–7.
[201] Evans AG, Graham LJ. A model for crack propagation inpolycrystalline ceramics. Acta Met 1975;23:1303–12.
[202] Moloney AC, Kausch HH, Stieger HR. The fracture of particulate-filled epoxide resins. J Mater Sci 1983;18:208–16.
[203] Lange FF. Fracture energy and strength behavior of a sodiumborosilicate glass–Al2O3 composite system. J Am Ceram Soc1971;54:614–20.
[204] Mallick PK, Broutman L. Mechanical and fracture behavior of glassbead filled epoxy composites. J Mater Sci Eng 1975;18:63–73.
[205] Green DJ, Nicholson PS. Studies in brittle porous materials. JMater Sci 1977;12:987–9.
[206] Gao H, Rice JR. Somewhat circular tensile cracks. Int J Fract1987;33:155–74.
[207] Rice JR, Ben-Zion Y, Kim K. Three-dimensional perturbationsolution for a dynamic planar crack moving unsteadily in a modelelastic solid. J Mech Phys Solids 1994;42:813–43.
[208] Perrin G, Rice JR. Disordering of dynamic planar crack front in amodel elastic medium of random variable toughness. J Mech PhysSolids 1994;42:1047–64.
[209] Low IM, Mai Y-W. Rate and temperature effects on crack bluntingmechanisms in pure and modified epoxies. J Mater Sci1989;24:1634–44.
[210] Low IM, Mai Y-W. Micromechanisms of crack extension inunmodified and modified epoxy resins. Compos Sci Technol1988;33:191–212.
[211] Kinloch AJ, Williams JG. Crack blunting mechanisms in polymers.J Mater Sci 1980;15:987–96.
[212] Feng XQ, Yu SW. Damage mechanics. Beijing: Tsinghua UniversityPress; 1997.
[213] Lemaitre J. A course on damage mechanics. Berlin: Springer-Verlag;1992.
[214] Bucknall CB. Fracture and failure of multiphase polymers andpolymer composites. Adv Polym Sci 1978;27:121–48.
[215] Ishai O, Cohen LJ. Effect of fillers and voids on compressive yield ofepoxy composites. J Compos Mater 1968;2:302–26.
[216] Zebarjad SM, Tahani M, Sajjadi SA. Influence of filler particles ondeformation and fracture mechanism of isotactic polypropylene. JMater Proc Technol 2004;155-156:1459–64.
[217] Friedrich K, Karsch UA. Failure processes in particulate filledpolypropylene. J Mater Sci 1981;16:2167–79.
[218] Evans AG, Ahmad ZB, Gilbert DG, Beaumont PWR. Mechanismsof toughening in rubber toughened polymers. Acta Metall1986;34:79–87.
[219] Bohse J, Grellmann W, Seidler S. Micromechanical interpretation offracture toughness of particulate-filled thermoplastics. J Mater Sci1991;26:6715–21.
[220] Fekete E, Molnar S, Kim GM, Michler GH, Pukanszky B. JMacromol Sci B 1999;38:885–99.
[221] Argon AS, Bartczak Z, Cohen RE, Muratoglu OK. Novel mech-anisms of toughening semi-crystalline polymers. In: Pearson RA,Sue HJ, Yee AF, editors. Toughening of plastics: advances inmodeling and experiments. Modeling and experiments symposiumseries 759. Washington, DC: ACS; 2000. p. 98–124.
[222] Bartczak Z, Argon AS, Cohen RE, Weinberg M. Toughnessmechanism in semi-crystalline polymer blends: I. High-densitypolyethylene toughened with rubbers. Polymer 1999;40:2331–46.
[223] Wilbrink MWL, Argon AS, Cohen RE, Weinberg M. Toughena-bility of nylon-6 with CaCO3 filler particles: new findings andgeneral principles. Polymer 2001;42:10155–80.
[224] Martuscelli E, Musto P, Ragosta G. Advanced routes for polymertoughening. Amsterdam: Elsevier; 1996.

S.-Y. Fu et al. / Composites: Part B 39 (2008) 933–961 961
[225] Wu S. Phase structure and adhesion in polymer blends: a criterionfor rubber toughening. Polymer 1985;26:1855–63.
[226] Wu S. A generalized criterion for rubber toughening: the criticalmatrix ligament thickness. J Appl Polym Sci 1988;35:549–61.
[227] Muratoglu OK, Argon AS, Cohen RE, Weinberg M. Tougheningmechanism of rubber-modified polyamides. Polymer 1995;36:921–30.
[228] Bartczak Z, Argon AS, Cohen RE, Cohen KT, Kowalewski T. Themorphology and orientation of polyethylene in films of sub-micronthickness crystallized in contact with calcite and rubber substrates.Polymer 1999;40:2367–80.
[229] Dasari A, Yu ZZ, Mai Y-W. Transcrystalline regions in the vicinityof nanofillers in polyamide-6. Macromolecules 2007;40:123–30.