Embed Size (px)
Citation preview

1
The Revision of EEB-2018-1279 1
2
Effects of competition and phosphorus fertilization on leaf and root traits of 3
late-successional conifers Abies fabri and Picea brachytyla 4
5
Lei Yu 1, Mengya Song 2, Yanbao Lei 2, 6
Helena Korpelainen 3, Ülo Niinemets 4, 5 and Chunyang Li 1, * 7
8
1 College of Life and Environmental Sciences, Hangzhou Normal University, Hangzhou 9
310036, China 10
2 Key Laboratory of Mountain Surface Processes and Ecological Regulation, Institute of 11
Mountain Hazards and Environment, Chinese Academy of Sciences, Chengdu 610041, 12
China 13
3 Department of Agricultural Sciences, Viikki Plant Science Centre, P.O. Box 27, 14
FI-00014 University of Helsinki, Finland 15
4 Institute of Agricultural and Environmental Sciences, Estonian University of Life 16
Sciences, Kreutzwaldi 1, 51006 Tartu, Estonia 17
5 Estonian Academy of Sciences, Kohtu 6, 10130 Tallinn, Estonia 18
19
* Corresponding author: Chunyang Li, E-mail: [email protected] 20
21
Head title: Phosphorus effect on functional traits of plants 22

2
Abstract Leaf and root systems are known to show a high degree of developmental 1
plasticity in response to the local environment. However, few studies have investigated 2
simultaneously the leaf and root traits as affected by competition and phosphorus (P) 3
fertilization, especially in connection with the primary succession. We investigated 4
morphological and physiological responses to different competition treatments (intra- vs. 5
interspecific competition) and P regimes in seedlings of Abies fabri and Picea brachytyla, 6
collected from the late succession stage Hailuogou glacier retreat area. A. fabri had a 7
greater total chlorophyll content and specific leaf area (SLA), higher leaf nitrogen (N) 8
and P concentrations, as well as a higher water use efficiency (assessed by the carbon 9
isotope composition, δ13C) and N absorption relative to P. brachytyla under P fertilization 10
conditions, and its total biomass responded more strongly to P fertilization, especially 11
under interspecific competition. P fertilization decreased the specific root length (SRL) 12
and ectomycorrhizal infection in both species and specific root tip density in P. 13
brachytyla but it had no effect on the average root diameter. We concluded that similar 14
changes in root characteristics, but the superior performance of above-ground traits in A. 15
fabri in response to P availability, especially under competition, explain the greater 16
competitive capacity of A. fabri at final stages of succession. These findings highlight the 17
influence of soil nutrition availability and competition on the functional traits of plants 18
and contribute to the understanding of the role of relative modifications in leaf and root 19
traits during succession. 20
Keywords: competition; soil P availability; plant functional traits; trait correlations; 21
primary succession 22

3
1. Introduction 1
2
Plants are exposed to multiple stresses, including both biotic (e.g. competition) and 3
abiotic factors (e.g. soil nutrient availability). Competition is a major biotic factor that 4
affects plant survival and growth, species abundance and distribution, and the 5
composition of plant communities (Williams and McCarthy, 2001; Michalet, 2006). 6
Competition is a complex stress that affects plants’ aerial and belowground environment. 7
Previous studies have indicated that it can lead to morphological responses and changes 8
in resource allocation (Novoplansky, 2009; Yamawo, 2015), photosynthetic capacity 9
(Poorter et al., 2012; Duan et al., 2014), water use efficiency (δ13C) (Duan et al., 2014), 10
nitrogen (Miller et al., 2007; Ashton et al., 2008) and phosphorus (Müller and 11
Bartelheimer, 2013) absorption, and non-structural carbohydrate metabolism (Guo et al., 12
2016). Such structural, physiological and chemical modifications ultimately affect plants’ 13
performance and competitive status in different environments. 14
15
Competition often interacts with abiotic stresses, resource availability and environmental 16
heterogeneity at different time scales (Sardans et al., 2004; Niinemets, 2010a; Chen et al., 17
2014; Duan et al., 2014; Guo et al., 2016). Phosphorus (P) is a key abiotic resource that 18
affects plants at the biochemical and ecophysiological levels by directly influencing 19
metabolic processes but also by altering competitive interactions in the ecosystem 20
(Williamson et al., 2001; Sterner and Elser, 2002; Vance et al., 2003; Turnbull et al., 2007; 21
Yu et al., 2017). P is usually the most limiting element in terrestrial ecosystems (Elser et 22

4
al., 2007; Vitousek et al., 2010), especially during the later stages of succession when 1
much of the soil phosphorus may be present in standing biomass, plant litter and 2
organic soil matter in forms unavailable to plants (Brais et al., 1995; Holdaway et al., 3
2011). Variation in soil P availability can influence individual competitiveness, species 4
diversity, and the structure, functioning and dynamics of ecosystems (Williamson et al., 5
2001; Reich and Oleksyn, 2004; Lambers et al., 2011). There are several strategies for 6
plants to avoid or cope with resource (e.g. P) limitations, including altered biomass 7
allocation (Shipley and Meziane, 2002; Poorter et al., 2012), morphological or 8
physiological adaptation of growth or developmental processes (plasticity) (Gedroc et al., 9
1996; Aphalo et al., 1999; Callaway et al., 2003), tolerance (Grime, 1979), and resource 10
investments into endo- and ectomycorrhizal associations to increase nutrient uptake 11
(Chiariello et al., 1982; Smith et al., 1999; Tuomi et al., 2001). 12
13
Plants can adjust the share of biomass allocation between roots and shoots depending on 14
whether the most limiting resource conditions occur above- or belowground (Shipley and 15
Meziane, 2002; Poorter et al., 2012). For example, plants can modify biomass allocation 16
and invest relatively more into roots under water- or nutrient-limited conditions (Dong et 17
al., 2016; Song et al., 2017). As a response to abiotic stresses, plants can also adjust their 18
morphology to increase the uptake of most limiting resources (Ryser and Eek, 2000; Hill 19
et al., 2006; Niinemets, 2010b) to the extent that these adjustments that enhance the 20
efficiency of uptake of resources might be more important than changes in the total mass 21
allocation (Poorter et al., 2012). Commonly, a decreasing light availability causes an 22

5
increase in the leaf area per unit mass (specific leaf area, SLA; Rijkers et al., 2000; Evans 1
and Poorter, 2001; Niinemets et al., 2015). Belowground, an increasing nutrient 2
limitation is generally associated with an increasing specific root length (SRL) (Hill et al., 3
2006; Ostonen et al., 2007), which represents the length of roots potentially able to 4
explore soil per unit mass invested. In addition to morphological plasticity, endo- and 5
ectomycorrhizal associations play important roles in the growth and establishment of 6
seedlings (Chiariello et al., 1982; Smith and Read, 1997). Endo- and ectomycorrhizal 7
associations are especially important for nutrient mobilization and uptake by plants in 8
nutrient limited environments (Chiariello et al., 1982; Smith and Read, 1997), e.g. in 9
conditions encountered in late-successional stages of ecosystems, where P is often the 10
main limiting nutrient (Brais et al., 1995; Holdaway et al., 2011). To gain an insight into 11
changes in species competitiveness during succession, it is also important to examine 12
variation in leaf and root traits among different competition patterns, and to determine 13
how they change along environmental gradients (e.g. Craine et al., 2005; Liu et al., 2010), 14
particularly depending on the availability of soil nutrients (Coomes and Grubb, 2000; 15
Lambers et al., 2008). 16
17
Across habitats, plants may experience selection pressures with varying severity (Price et 18
al., 2014), and correlated variation patterns among leaf and root traits have been observed 19
(Craine and Lee, 2003; Liu et al., 2010; Holdaway et al., 2011). For example, leaf and 20
root N (Craine and Lee, 2003; Craine et al., 2005; Tjoelker et al., 2005; Freschet et al., 21
2010; Liu et al., 2010) and P concentrations (Kerkhoff et al., 2006; Newman and Hart, 22

6
2006; Holdaway et al., 2011) have consistently been found to be positively correlated. 1
However, the relationships among key above- and belowground morphological traits 2
(SLA and SRL), which represent plants’ resource acquisition strategies (Wright et al., 3
2004; Li and Bao, 2015; Cheng et al., 2016), are poorly understood, and the results 4
obtained so far are fragmented and inconsistent. For instance, positive correlations 5
between SLA and SRL have been found among temperate trees in central Poland 6
(Withington et al., 2006), while Tjoelker et al. (2005) detected no relationship between 7
SLA and SRL in 39 grassland and savanna species. Holdaway et al. (2011) discovered 8
that along a soil chronosequence, there was a weak positive correlation between SLA and 9
SRL, but this relationship became obscure when SRL increased and SLA declined with 10
an increasing site age. However, only few studies have investigated how morphological 11
traits are influenced by interactions with neighbors and how the relationship between 12
SLA and SRL is altered by changes in P availability during primary succession, e.g., in 13
glacier retreat areas, where profound changes occur in vegetation composition depending 14
on the age of the glacier meltdown (Lei et al., 2015; Song et al., 2017). 15
16
The Hailuogou glacier retreat area in the Gongga Mountain region (Southwest China), 17
has a characteristic primary succession series, including N-fixing species dominating the 18
most recent meltdown areas, followed by deciduous shrubs of Salix and Populus, and the 19
climax community, which is dominated by Abies fabri and Picea brachytyla (Luo et al., 20
2012; Zhou et al., 2013; Lei et al., 2015). Among the late successional conifer species, A. 21
fabri appears during later stages of succession, followed by P. brachytyla as a 22

7
co-dominant species (Zhou et al., 2013; Lei et al., 2015). A. fabri and P. brachytyla occur 1
mainly in the mountainous regions of Western Sichuan, China. They are endemic and 2
dominant species of the subalpine dark coniferous forests (Wu, 1995; Liu, 2002; Guo et 3
al., 2010). During the primary succession, soil nutrient availability changes from the 4
initial N limitation of primary production to P limitation (Walker and Syers, 1976; 5
Vitousek et al., 2010; Lei et al., 2015; Song et al., 2017). The responses of leaf and root 6
traits to successional variation in soil nutrient (e.g. P) availability have important 7
implications for understanding the drivers of vegetation changes during the primary 8
succession. 9
10
In this study, we explored how the biotic factor (competition) and the abiotic factor (soil 11
P availability) alone and in combination affect leaf and root traits in A. fabri and P. 12
brachytyla. We quantified variation in root traits (SRL, average root diameter, specific 13
root tip density, nutrient and non-structural carbohydrate contents, ectomycorrhizal 14
associations) and the relationships among root and leaf traits (SLA, net photosynthetic 15
rate, nutrient and non-structural carbohydrate contents) in A. fabri and P. brachytyla 16
across competition and P fertilization treatments in the Hailuogou glacier retreat area. In 17
addition, different forms of 15N-labeled nitrogen sources (15NH4NO3 and NH415NO3) 18
were utilized to determine, whether A. fabri and P. brachytyla exhibit differentiation in 19
absorbing nitrogen under different treatments. The following hypotheses were tested: (1) 20
competition and P fertilization alter both morphological and physiological traits of A. 21
fabri and P. brachytyla, and, consequently, influence the competitiveness of these two 22

8
conifers, (2) A. fabri has superior growth characteristics due to more efficient above- and 1
belowground resource harvesting under P fertilization and competition, and (3) the 2
relationships among leaf and root traits in these two conifers are influenced by soil P 3
availability and competition, providing further insight into changes in species 4
competitiveness during succession. 5

9
2. Materials and methods 1
2
2.1. Study site, plant material and experimental design 3
4
Our study was conducted at the Gongga Mountain Alpine Ecosystem Observation and 5
Experiment Station of the Chinese Academy of Sciences located at the south-eastern 6
fringe of the Tibetan Plateau (29°34' N, 101°59' E, 3000 m above sea level), where the 7
mean annual temperature, annual precipitation and relative humidity are 4.2 °C, 1947 mm 8
and 90.2% (averages over 22 years; Yu et al., 2017). The Hailuogou glacier retreat area is 9
2 km away from the station and the climatic conditions are similar. 10
11
Healthy A. fabri and P. brachytyla seedlings with a height of about 25 cm were selected 12
from a nursery near the station. Two seedlings (10 cm apart from each other) were 13
planted in each plastic pot (external diameter 32 cm, height 25 cm) with native soil in 14
mid-September 2014. The planting soil was obtained from the natural habitat dominated 15
by P. brachytyla and had a pH of 5.33 ± 0.03, soil organic matter content of 79.56 ± 6.66 16
g kg–1, total N content of 1.36 ± 0.04 g kg–1, and total P content of 0.57 ± 0.03 g kg–1. 17
18
The competition treatments were designed as follows: monoculture planting (Mon) of A. 19
fabri + A. fabri and P. brachytyla + P. brachytyla (intraspecific competition) and mixed 20
planting (Mix) of A. fabri + P. brachytyla (interspecific competition). Mon+P and Mix+P 21
were monoculture planting with P fertilization and mixed planting with P fertilization, 22

10
respectively. The experimental layout was completely randomized with three factors 1
(species, competition, and P fertilization). Twenty replicates per treatment were included 2
in the experiment. The experiment was performed in an open area under rain-fed 3
conditions. P fertilization was provided as NaH2PO4, 0.4 g P per pot in P-fertilized 4
treatments (see, Siddique et al., 2010; Chen et al., 2015). Plants were watered every other 5
day. The seedlings were fertilized on 6 May 2015 and harvested in late August 2016. In 6
addition, in the 15N tracer experiment, labeled 15NH4NO3 and NH415NO3 solutions were 7
injected into the soil at the depth of 5 cm around the rhizosphere (30 mg per plant) in all 8
treatments (five replicates in each case). 72 h after the application of 15N solution, the 9
plants were harvested and 15N values of leaves were determined. 10
11
2.2. Analyses of plant morphology, biomass and ectomycorrhizal infection 12
13
At the end of the experiment, five plants from each treatment were selected randomly for 14
biomass measurements. The selected plants were harvested and divided into leaves, stems, 15
fine roots (<2 mm in diameter) and coarse roots (>2 mm in diameter). The dry mass of all 16
biomass samples was determined after oven-drying at 70 °C to a constant mass. The 17
root/shoot ratio (R/S ratio) was calculated as follows: total root biomass / (leaf biomass + 18
stem biomass). Current-year leaves were scanned and the leaf area was estimated by 19
ImageJ software (National Institutes of Health, Bethesda, MD, USA). The specific leaf 20
area (SLA, leaf area per unit dry mass) for current-year leaves was calculated as the ratio 21
of the projected leaf area to leaf dry mass. Root samples were analyzed by WinRHIZO 22

11
root-scanning software (Regent Instruments Inc., Ottawa, ON Canada). Specific root 1
length (SRL) was calculated for selected root samples as the ratio of the length of roots to 2
their dry mass (Wang et al., 2006; Dong et al., 2016). Specific root tip density (SRD) was 3
calculated as the ratio of root tip to root length, and the average root diameter (AD) was 4
also measured (Guo et al., 2016). The rate of ectomycorrhizal infection (ECM) was 5
analyzed by counting the total number of mycorrhizal tips per seedling and by calculating 6
the extent of the infection as the percentage of root tips that were mycorrhizal (Dehlin et 7
al., 2004; Yin et al., 2013). 8
9
2.3. Determination of leaf gas exchange characteristics and chlorophyll content 10
11
The light-saturated net photosynthetic rate (Pn) was measured with a LI-COR 6400 12
portable photosynthesis system (LI-COR, Lincoln, NE, USA) with a conifer chamber 13
(PLC-broad, PP Systems) for intact current-year leaves in five randomly chosen 14
individuals in each treatment between 08:00 and 11:30 at the end of July 2016. The 15
standard measurement conditions were as follows: leaf temperature, 25 °C; water vapor 16
pressure deficit, 1.5 ± 0.5 kPa (corresponding to relative humidity of 50%); light intensity 17
(PPFD), 1500 μmol m–2 s–1; and CO2 concentration, 400 ± 5 μmol mol–1. Once the 18
steady-state gas exchange rates were observed, the light-saturated net photosynthetic rate 19
(Pn) was recorded. 20
21
In addition to leaves used in photosynthesis measurements, additional neighboring leaves 22

12
were randomly sampled for chlorophyll content measurements. The chlorophyll content 1
was determined by spectrophotometry according to the method of Lichtenthaler (1987) 2
using a UV-330 spectrophotometer (Unicam, Cambridge, UK). The total chlorophyll 3
content (TChl) was calculated as the sum of chlorophyll a and b. 4
5
2.4. Determination of N and P contents 6
7
For both N and P analyses, 0.2 g of dry powdered material was used. The N content was 8
determined by a semi-micro Kjeldahl method (Mitchell, 1998), and the P content by 9
induced plasma emission spectroscopy (Hötscher and Hay, 1997). 10
11
2.5. Determination of non-structural carbohydrates 12
13
Leaf and root samples from five randomly chosen individuals in each treatment were 14
collected for non-structural carbohydrate analyses at the end of the experiment. Total 15
soluble sugar and starch contents were determined as glucose equivalents by the anthrone 16
method according to Yemm and Willis (1954). Methodological details of these 17
measurements have been described by Guo et al. (2016) and Yu et al. (2017). 18
19
2.6. Determination of carbon and nitrogen isotope composition 20
21
The stable isotope analyses were conducted at the Stable Isotope Laboratory for 22

13
Ecological and Environmental Research, Chinese Academy of Forestry using a DELTA V 1
Advantage Isotope Ratio Mass Spectrometer (Thermo Fisher Scientific, Inc., Waltham, 2
MA, USA). The carbon isotope composition (δ13C) was determined for the same leaves, 3
which had been used for Pn estimation. Each leaf sample was dried at 70 °C until 4
constant mass. Dried leaves were ground, and 13C/12C ratios were determined with an 5
isotope ratio mass spectrometer (Thermo Fisher Scientific, Inc., USA). The carbon 6
isotope composition was expressed as δ13C values, relative to the standard Pee Dee 7
Belemnite (Farquhar et al., 1989) as follows: δ13C = (Rsample/Rstandard - 1) × 1,000, where 8
Rsample is the 13C/12C ratio of the sample and Rstandard that of the standard. 9
10
In the 15N tracer experiment, fully-expanded intact mature leaves from the same upper 11
position of the cuttings were sampled in each treatment 72 h after the application of 15N. 12
15N/14N ratios were determined, and the N isotope composition was expressed as δ15N. 13
The overall precision of the δ13C and δ15N estimations was better than 0.1‰, as 14
determined from repetitive samples in each case. 15
16
2.7. Statistical analyses 17
18
Individual traits among treatments were compared by Tukey’s test after one-way 19
ANOVAs. Three-way ANOVAs were employed to test the effects of species, competition, 20
phosphorus and their interactions. All statistical effects were considered significant at P < 21
0.05. Partial correlations were used to exclude the possibility that correlations between 22

14
leaf and root traits were due to the impact of competition or P fertilization, or both. 1
Before analyses, data were checked for normality and the homogeneity of variances and 2
log-transformed to correct for deviations from these assumptions when needed. All 3
analyses were carried out using the Statistical Package for the Social Sciences (SPSS, 4
Chicago, IL, USA) version 18.0. 5
15
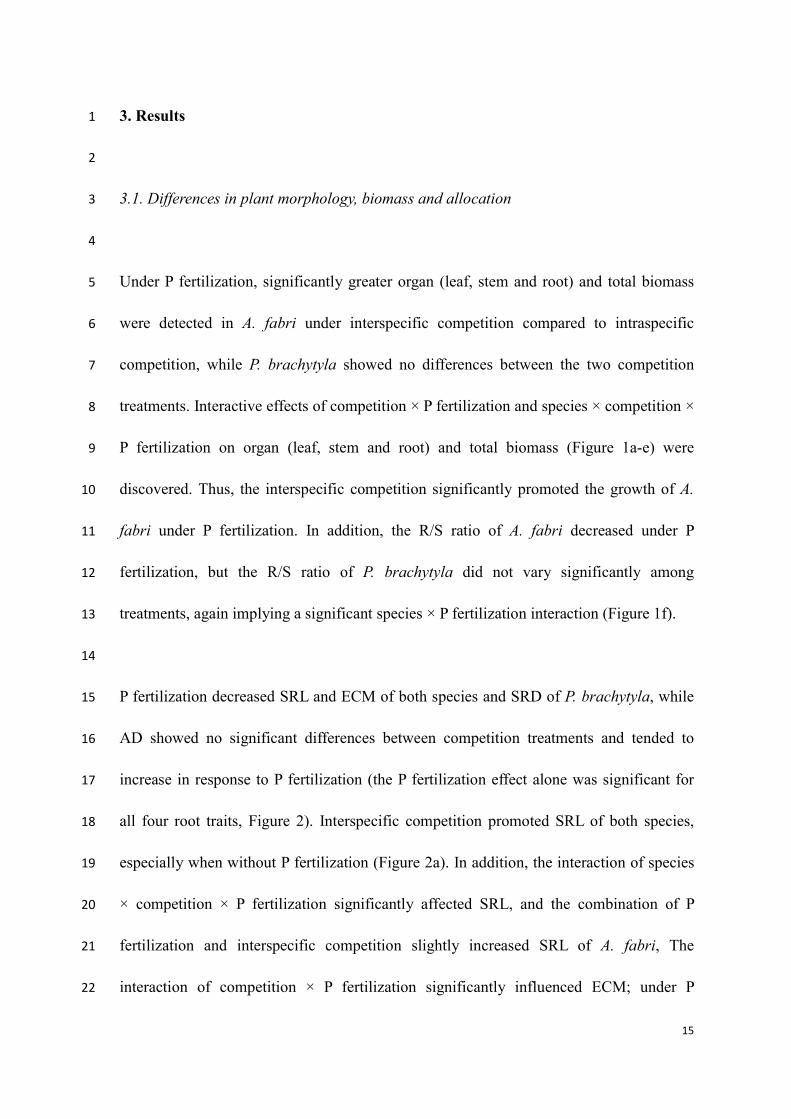
3. Results 1
2
3.1. Differences in plant morphology, biomass and allocation 3
4
Under P fertilization, significantly greater organ (leaf, stem and root) and total biomass 5
were detected in A. fabri under interspecific competition compared to intraspecific 6
competition, while P. brachytyla showed no differences between the two competition 7
treatments. Interactive effects of competition × P fertilization and species × competition × 8
P fertilization on organ (leaf, stem and root) and total biomass (Figure 1a-e) were 9
discovered. Thus, the interspecific competition significantly promoted the growth of A. 10
fabri under P fertilization. In addition, the R/S ratio of A. fabri decreased under P 11
fertilization, but the R/S ratio of P. brachytyla did not vary significantly among 12
treatments, again implying a significant species × P fertilization interaction (Figure 1f). 13
14
P fertilization decreased SRL and ECM of both species and SRD of P. brachytyla, while 15
AD showed no significant differences between competition treatments and tended to 16
increase in response to P fertilization (the P fertilization effect alone was significant for 17
all four root traits, Figure 2). Interspecific competition promoted SRL of both species, 18
especially when without P fertilization (Figure 2a). In addition, the interaction of species 19
× competition × P fertilization significantly affected SRL, and the combination of P 20
fertilization and interspecific competition slightly increased SRL of A. fabri, The 21
interaction of competition × P fertilization significantly influenced ECM; under P 22

16
fertilization, the reduction in ECM was stronger under interspecific competition. 1
2
3.2. Differences in leaf gas exchange and δ13C 3
4
Under P fertilization, Pn, TChl and SLA of both species increased, and A. fabri had the 5
greatest values of Pn, δ13C, TChl and SLA under interspecific competition (Figure 3a-d). 6
The interaction of species × competition, and competition × P fertilization significantly 7
affected Pn and TChl, and the interaction of species × competition × P fertilization 8
significantly influenced δ13C and SLA. 9
10
3.3. Differences in concentrations of N, P and non-structural carbohydrates 11
12
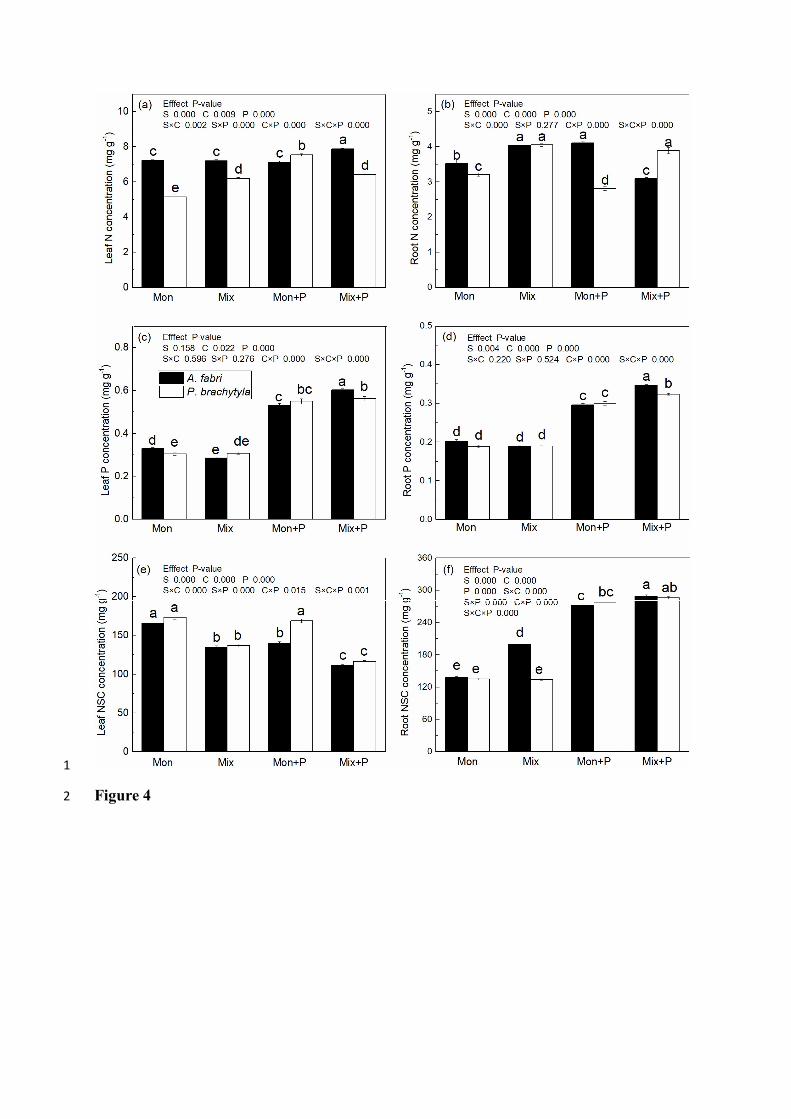
Under P fertilization, interspecific competition significantly increased the leaf N 13
concentration (LNC) of A. fabri but decreased it in P. brachytyla, whereas the root N 14
concentration (RNC) showed a contrasting pattern (Figure 4a, b). P fertilization 15
significantly increased leaf and root P concentrations (LPC and RPC) in both species 16
under both intraspecific or interspecific competition, and A. fabri had the highest leaf and 17
root P concentrations under interspecific competition (Figure 4c, d). In addition, the 18
interactions of competition × P fertilization and species × competition × P fertilization 19
significantly influenced leaf and root N and P concentrations. 20
21
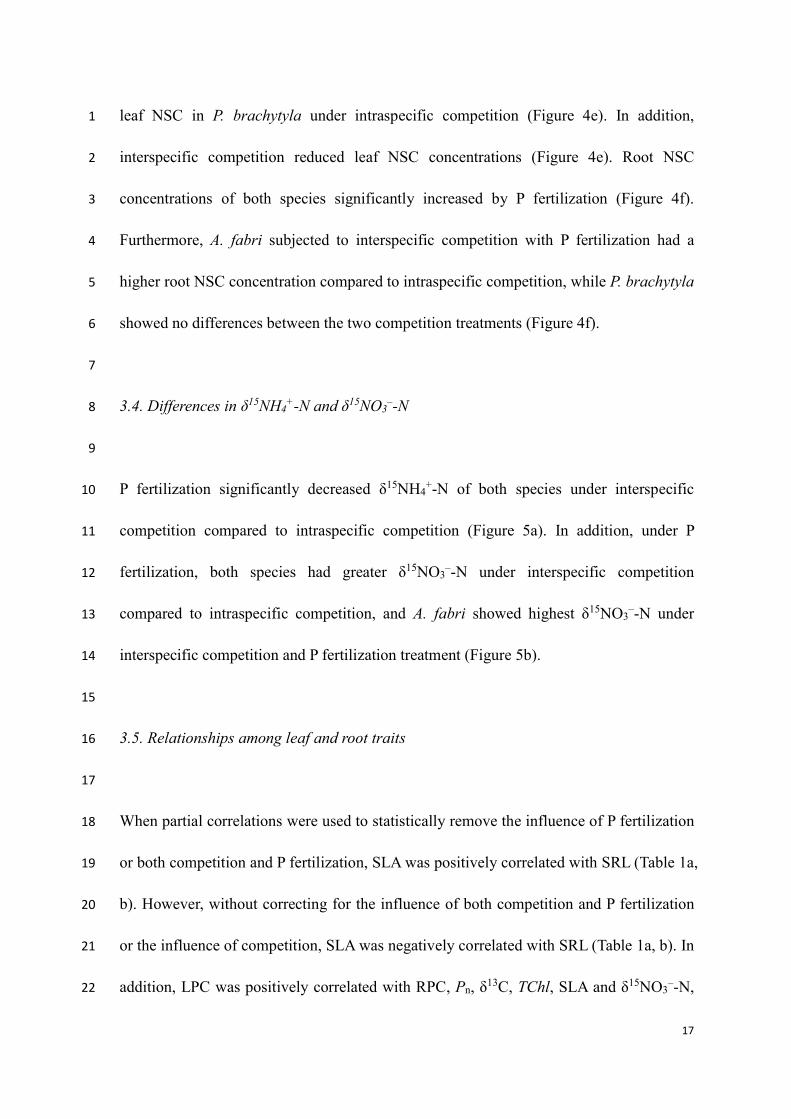
Leaf NSC concentrations of both species tended to decrease by P fertilization, except for 22
17
leaf NSC in P. brachytyla under intraspecific competition (Figure 4e). In addition, 1
interspecific competition reduced leaf NSC concentrations (Figure 4e). Root NSC 2
concentrations of both species significantly increased by P fertilization (Figure 4f). 3
Furthermore, A. fabri subjected to interspecific competition with P fertilization had a 4
higher root NSC concentration compared to intraspecific competition, while P. brachytyla 5
showed no differences between the two competition treatments (Figure 4f). 6
7
3.4. Differences in δ15NH4+-N and δ15NO3
–-N 8
9
P fertilization significantly decreased δ15NH4+-N of both species under interspecific 10
competition compared to intraspecific competition (Figure 5a). In addition, under P 11
fertilization, both species had greater δ15NO3–-N under interspecific competition 12
compared to intraspecific competition, and A. fabri showed highest δ15NO3–-N under 13
interspecific competition and P fertilization treatment (Figure 5b). 14
15
3.5. Relationships among leaf and root traits 16
17
When partial correlations were used to statistically remove the influence of P fertilization 18
or both competition and P fertilization, SLA was positively correlated with SRL (Table 1a, 19
b). However, without correcting for the influence of both competition and P fertilization 20
or the influence of competition, SLA was negatively correlated with SRL (Table 1a, b). In 21
addition, LPC was positively correlated with RPC, Pn, δ13C, TChl, SLA and δ15NO3–-N, 22

18
and LNSC was negatively correlated with RNSC both with or without the statistical 1
influence of competition or P fertilization, or their combination (Table 1a, b). 2
19
4. Discussion 1
2
4.1. Changes in biomass and allocation, and in morphological traits in response to 3
competition and P fertilization treatments 4
5
Our results showed that biomass accumulation and allocation (including leaves, stems, 6
fine roots and total biomass, and R/S ratio; Figure 1) as well as morphological traits (SRL, 7
AD, SRD and SLA; Figures 2a-c, 3d) of A. fabri and P. brachytyla were significantly 8
affected by competition and P fertilization, as previously observed in several coniferous 9
species (Dehlin et al., 2004; Duan et al., 2014). In particular, in the control treatment (no 10
P fertilization), there were no differences in the total biomass of either species between 11
intra- and interspecific competition (Mon versus Mix) (Figure 1d). Under P fertilization, 12
A. fabri had a higher total biomass under interspecific competition than under 13
intraspecific competition, but P. brachytyla showed no differences between the two 14
competition treatments (Mon+P versus Mix+P) (Figure 1d). These findings indicated that 15
interspecific competition significantly promoted the growth of A. fabri, which was the 16
species responding more strongly to P fertilization. This can be a key factor allowing 17
more shade tolerant A. fabri to gain a competitive advantage over P. brachytyla in closed 18
stands in climax communities. In addition, P fertilization significantly decreased the R/S 19
ratio of A. fabri, thus indicating that this species has more plasticity in its biomass 20
allocation in response to environmental conditions, confirming previous observations 21
(Guo et al., 2016; Song et al., 2017). Such plasticity is relevant, as investing relatively 22

20
more into roots under nutrient-limited conditions allows for a more efficient capture of 1
limiting soil nutrients, especially less movable nutrients, such as P (Shipley and Meziane, 2
2002; Portsmuth and Niinemets, 2007). 3
4
Under P fertilization, A. fabri had higher SLA under interspecific competition than under 5
intraspecific competition, but SLA of P. brachytyla showed no differences between the 6
two competition treatments (Mon+P versus Mix+P) (Figure 3d). Species with high SLA 7
are generally associated with high growth rates and superior above-ground resource 8
acquisition ability in resource-rich conditions (Reich et al., 1999; Westoby et al., 2002). 9
The higher growth rate (Yu et al., 2017) and SLA of A. fabri observed under interspecific 10
competition and P fertilization (Mix+P) are in line with these previous observations. 11
Earlier studies have shown that SRL is positively related to the water and nutrient uptake 12
capacity of roots (Eissenstat, 1991; Pregitzer et al., 2002; Comas and Eissenstat, 2004; 13
Wang et al., 2006). We found that P fertilization significantly decreased SRL and SRD of 14
both species (Figure 2a, c); similarly Ostonen et al. (2007) and Fan et al. (2015) have 15
observed that fertilization significantly decreases SRL. A possible explanation for a 16
decrease in SRL in response to fertilization is that under improved nutrient availability 17
less fine roots are needed to support the growth of aboveground plant parts. Thus, a 18
functional balance between above- and belowground plant parts is achieved at a lower 19
R/S ratio under fertilization (Figure 1f). However, there was no significant increase in AD 20
in either species under P fertilization (Figure 2b). This result is in good agreement with 21
Eissenstat et al. (2000), who reported that the fine-root diameter of tree species varied 22

21
only little along gradients of soil fertility and was unresponsive or minimally responsive 1
to fertilization (Tingey et al., 1997; Ostonen et al., 2007; Wurzburger and Wright, 2015). 2
3
In addition to modifications in the morphological traits of roots, the level of 4
ectomycorrhizal infection of both species significantly decreased under P fertilization 5
(Figure 2d), as has also been shown in a previous meta-analysis, which highlighted that P 6
fertilization reduced mycorrhizal colonization across many ecosystem types (Treseder, 7
2004). In our study, we discovered strong interactions among species × competition × P 8
fertilization for SLA and SRL (Figures 2a, 3d), as under P fertilization, SLA and SRL of 9
A. fabri increased under interspecific competition. Such interactions showed that 10
species-specific responses in these traits increase along environmental gradients; also 11
implying contrasting life history strategies in the two studied species under different 12
ecological scenarios. Thus, our findings provide important insights into predicting the 13
potential responses of different conifer species to soil nutrient availability along 14
successional gradients. 15
16
4.2. The effects of competition and P fertilization on leaf photosynthetic capacity and 17
chlorophyll content, and leaf and root N, P and non-structural carbohydrate contents 18
19
N is the necessary component of proteins, nucleic acids, chlorophylls and many 20
secondary metabolites of plants (Luo et al., 2013), while P is involved in cellular energy 21
transfer (Marschner, 1995) and it is a vital constituent of numerous plant metabolites, 22
22
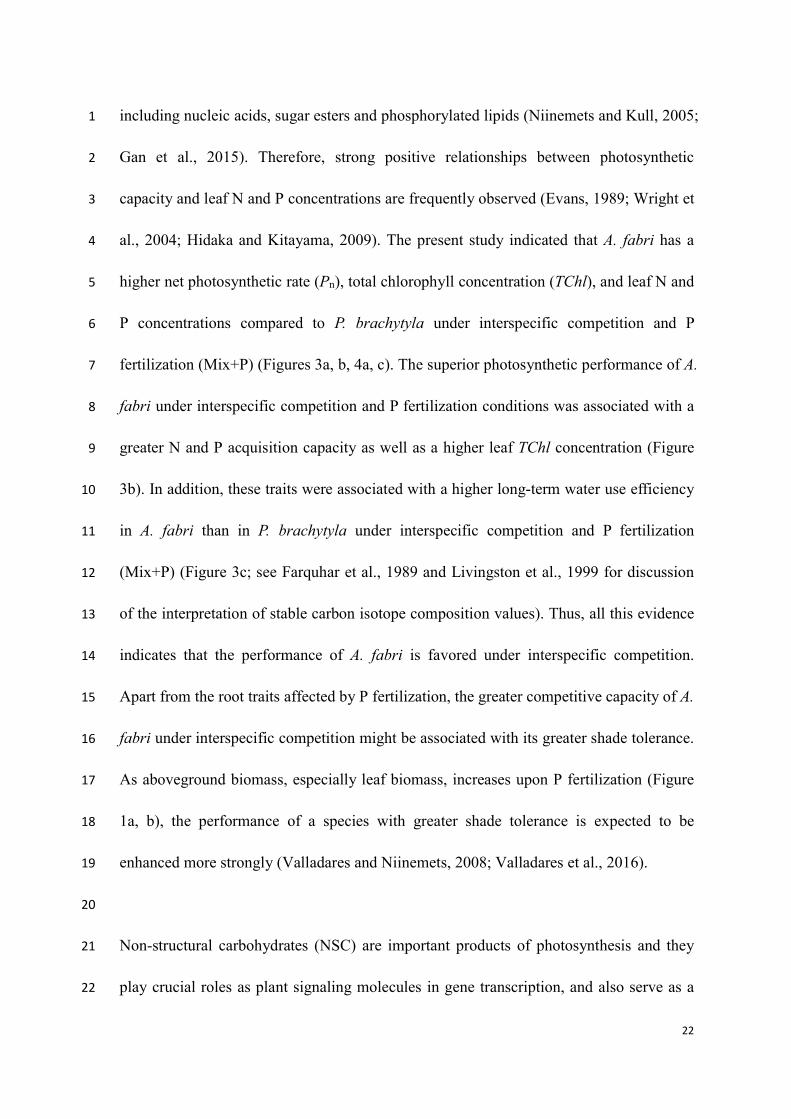
including nucleic acids, sugar esters and phosphorylated lipids (Niinemets and Kull, 2005; 1
Gan et al., 2015). Therefore, strong positive relationships between photosynthetic 2
capacity and leaf N and P concentrations are frequently observed (Evans, 1989; Wright et 3
al., 2004; Hidaka and Kitayama, 2009). The present study indicated that A. fabri has a 4
higher net photosynthetic rate (Pn), total chlorophyll concentration (TChl), and leaf N and 5
P concentrations compared to P. brachytyla under interspecific competition and P 6
fertilization (Mix+P) (Figures 3a, b, 4a, c). The superior photosynthetic performance of A. 7
fabri under interspecific competition and P fertilization conditions was associated with a 8
greater N and P acquisition capacity as well as a higher leaf TChl concentration (Figure 9
3b). In addition, these traits were associated with a higher long-term water use efficiency 10
in A. fabri than in P. brachytyla under interspecific competition and P fertilization 11
(Mix+P) (Figure 3c; see Farquhar et al., 1989 and Livingston et al., 1999 for discussion 12
of the interpretation of stable carbon isotope composition values). Thus, all this evidence 13
indicates that the performance of A. fabri is favored under interspecific competition. 14
Apart from the root traits affected by P fertilization, the greater competitive capacity of A. 15
fabri under interspecific competition might be associated with its greater shade tolerance. 16
As aboveground biomass, especially leaf biomass, increases upon P fertilization (Figure 17
1a, b), the performance of a species with greater shade tolerance is expected to be 18
enhanced more strongly (Valladares and Niinemets, 2008; Valladares et al., 2016). 19
20
Non-structural carbohydrates (NSC) are important products of photosynthesis and they 21
play crucial roles as plant signaling molecules in gene transcription, and also serve as a 22

23
storage of energy for growth and respiration as well as a carbon source for growth. NSC 1
concentrations can be used as indicators of the balance between C supply 2
(photosynthesis), C demand (respiration) and C storage (Chapin et al., 1990; Stitt and 3
Schulze, 1994; Secchi and Zwieniecki, 2011; Sala et al., 2012; Wiley et al., 2013). In this 4
study, we found that A. fabri had higher root NSC concentrations under interspecific 5
competition in both non-fertilized and P-fertilized plants compared to intraspecific 6
competition, while P. brachytyla showed no differences between the two competition 7
treatments (Figure 4f). It has been reported that high root NSC could provide assimilation 8
energy for nutrient uptake (Kobe et al., 2010; Pokhilko et al., 2014). Thus, an increase in 9
the root NSC concentration might be responsible for the greater root P concentration in A. 10
fabri under interspecific competition and P fertilization, thus providing a greater capacity 11
for nutrient uptake, which might be a key factor responsible for the higher 12
competitiveness of A. fabri subjected to interspecific competition under P fertilization. 13
Yet, no such differences in root P concentrations were observed in non-fertilized plants, 14
and root N concentrations were actually smaller in A. fabri under P fertilization and 15
interspecific competition (Figure 4b, d), indicating that the relationship between NSC and 16
nutrient uptake is complex. 17
18
4.3. Changes in use of different nitrogen sources upon P fertilization and competition 19
20
Both species showed lower δ15NH4+-N and δ15NO3
–-N under interspecific competition 21
than under intraspecific competition, except for δ15NH4+-N in P. brachytyla (Figure 5a, b), 22

24
indicating that neighbors affect competition for different N sources (Miller et al., 2007; 1
Ouyang et al., 2016; Song et al., 2017). In addition, P fertilization significantly decreased 2
δ15NH4+-N but increased δ15NO3
–-N of both species under interspecific competition 3
compared to intraspecific competition (Mon+P versus Mix+P) (Figure 5a, b). Thus, the 4
results showed that A. fabri and P. brachytyla preferably absorb NO3–-N under P 5
fertilization conditions. Ammonium is less movable in soil than nitrate and thus the lower 6
absorption capacity for ammonium in P-fertilized plants is in accordance with the 7
reduction in SRL, SRD and ectomycorrhizal colonization (Figure 2). Previous studies 8
have proposed that species better adapted to more movable NO3–-N have a significant 9
competitive advantage (Kronzucker et al., 1997; Song et al., 2017), as observed in A. 10
fabri during interspecific competition under P fertilization (Figure 5b). The better NO3–-N 11
absorbing ability of A. fabri with reduced SRL, SRD and ectomycorrhizal colonization 12
might affect its growth and physiological processes, such as assimilation and metabolism, 13
and result in a competitive advantage under P fertilization. 14
15
4.4. Competition and P fertilization alter relationships among leaf and root traits 16
17
Our study revealed a positive correlation between SLA and SRL when partial correlations 18
were used to statistically remove the influence of P fertilization, but without removing the 19
influence of P fertilization there was a negative correlation between SLA and SRL (Table 20
1a, b). These results indicate that the relationship between SLA and SRL can vary 21
depending on soil nutrient (e.g. P) availability (Wright and Westoby, 1999; Holdaway et 22

25
al., 2011). A likely explanation for these variable relationships is that leaf and root traits 1
differ in their responses to soil nutrient availability (Wright and Westoby, 1999). 2
Holdaway et al. (2011) investigated fine root traits along a 120 000-year soil 3
chronosequence (soil P limitation increasing with soil age) in a temperate rain forest and 4
found a weak positive correlation between SLA and SRL. They also discovered a strong 5
positive relationship between SRL and soil age and a negative relationship between SLA 6
and site age. These results are consistent with increasing SRL with decreasing soil 7
nutrient availability observed by Peltzer et al. (2010) and in our study (Figure 2a). 8
Overall, these findings highlight the importance of considering variation in soil nutrients 9
when making generalizations about changes in root traits during succession. 10
11
In the present study, we found a significant positive relationship between leaf and root P 12
concentrations, regardless of whether removing or not removing statistically the 13
influences of competition or P fertilization, or both (Table 1a, b). Similarly, positive 14
relationships between leaf and root nutrient (N and P) concentrations have been found in 15
grassland and savannah ecosystems (Craine and Lee, 2003; Craine et al., 2005; Tjoelker 16
et al., 2005; Liu et al., 2010), and in temperate and tropical forests (Li et al., 2010). 17
Tjoelker et al. (2005) have suggested that a strong positive relationship in nutrient 18
concentrations between leaves and roots reflect similar adaptations to soil nutrient 19
limitations in aboveground and belowground plant parts. In accordance to this suggestion, 20
positive correlations among leaf, wood, and root tissues have been observed (Niinemets, 21
1998), indicating that the total plant nutrient pools are distributed among different plant 22

26
organs in a balanced manner. In our study, the significant positive relationship between 1
leaf and root P concentrations may be due to P limitation stress during late-stage primary 2
succession (Brais et al., 1995; Holdaway et al., 2011). On the other hand, Li and Bao 3
(2015) have found independent variation in leaf and root N concentrations; similarly, no 4
significant correlation between leaf and root N concentrations was observed in our study 5
(Table 1a, b). 6
7
We observed that LPC was positively correlated with Pn, δ13C, TChl, SLA and δ15NO3–-N, 8
regardless of whether removing or not removing statistically the influence of competition 9
or P fertilization, or both (Table 1a, b). Stronger relationships of physiological and 10
structural characteristics of foliage with leaf P than with leaf N concentration have also 11
been observed in other conifers (Reich and Schoettle, 1988). Such evidence suggests that 12
foliage physiology is more strongly limited by P availability than N availability, as is 13
characteristic during late stages of primary succession. 14

27
5. Conclusions 1
2
The present study demonstrated that competition and P fertilization affect the leaf and 3
root traits of A. fabri and P. brachytyla and that different responses in the morphological 4
and physiological traits between these two conifers to competition and P fertilization 5
could be largely responsible for the competitive outcomes. A. fabri displayed a 6
competitive advantage and had a greater total chlorophyll content and SLA, higher leaf N 7
and P concentrations, as well as a higher water use efficiency (δ13C) and N uptake 8
(δ15NO3–-N) relative to P. brachytyla under P fertilization. In addition, the relationships 9
between SLA and SRL changed with P fertilization, suggesting that soil nutrient 10
availability effects on structural traits may be fundamentally different for the above- and 11
belowground parts of plants. We suggest that further research should focus on large-scale 12
relationships among plant traits and associated environmental factors across successional 13
gradients. 14

28
Acknowledgements This work was supported by the Talent Program of the Hangzhou 1
Normal University (2016QDL020). 2
3
Author contributions Lei Yu had the main responsibility for data collection, analysis 4
and writing, Mengya Song and Yanbao Lei had a significant contribution to data analysis, 5
Helena Korpelainen and Ülo Niinemets had a significant contribution to the interpretation 6
of data and manuscript preparation, and Chunyang Li (the corresponding author) had the 7
overall responsibility for experimental design and project management. 8
9
Conflict of interest The authors declare that they have no conflict of interest.10

29
References 1
2
Aphalo, P.J., Ballaré, C.L., Scopel, A.L., 1999. Plant-plant signaling, the shade avoidance 3
response and competition. J. Exp. Bot. 50, 1629-1634. 4
Ashton, I.W., Miller, A.E., Bowman, W.D., Suding, K.N., 2008. Nitrogen preferences and 5
plant-soil feedbacks as influenced by neighbors in the alpine tundra. Oecologia 156, 6
625-636. 7
Brais, S., Camiré, C., Bergeron, Y., Paré, D., 1995. Changes in nutrient availability and 8
forest floor characteristics in relation to stand age and forest composition in the 9
southern part of the boreal forest of northwestern Quebec. For. Ecol. Manage. 76, 10
181-189. 11
Callaway, R.M., Pennings, S.C., Richards, C.L., 2003. Penotypic plasticity and 12
interactions among plants. Ecology 84, 1115-1128. 13
Chapin, F.S. III, Schulze, E.D., Mooney, H.A., 1990. The ecology and economics of 14
storage in plants. Annu. Rev. Ecol. Syst. 21, 423-447. 15
Chen, F.S., Niklas, K.J., Liu, Y., Feng, X.M., Wan, S.Z., Wang, H., 2015. Nitrogen and 16
phosphorus additions alter nutrient dynamics but not resorption efficiencies of Chinese 17
fir leaves and twigs differing in age. Tree Physiol. 35, 1106-1117. 18
Chen, J., Duan, B.L., Wang, M.L., Korpelainen, H., Li, C.Y., 2014. Intra- and inter-sexual 19
competition of Populus cathayana under different watering regimes. Funct. Ecol. 28, 20
124-136. 21
Cheng, J.H., Chu, P.F., Chen, D.M., Bai, Y.F., 2016. Functional correlations between 22

30
specific leaf area and specific root length along a regional environmental gradient in 1
Inner Mongolia grasslands. Funct. Ecol. 30, 985-997. 2
Chiariello, N., Hickman, J.C., Mooney, H.A., 1982. Endomycorrhizal role for 3
interspecific transfer of phosphorus in a community of annual plants. Science 217, 4
941-943. 5
Comas, L.H., Eissenstat, D.M., 2004. Linking fine root traits to maximum potential 6
growth rate among 11 mature temperate tree species. Funct. Ecol. 18, 388-397. 7
Coomes, D.A., Grubb, P.J., 2000. Impacts of root competition in forests and woodlands: a 8
theoretical framework and review of experiments. Ecol. Monogr. 70, 171-207. 9
Craine, J.M., Lee, W.G., 2003. Covariation in leaf and root traits for native and 10
non-native grasses along an altitudinal gradient in New Zealand. Oecologia 134, 11
471-478. 12
Craine, J.M., Lee, W.G., Bond, W.J., Williams, R.J., Johnson, L.C., 2005. Environmental 13
constraints on a global relationship among leaf and root traits of grasses. Ecology 86, 14
12-19. 15
Dehlin, H., Nilsson, M.C., Wardle, D.A., Shevtsova, A., 2004. Effects of shading and 16
humus fertility on growth, competition, and ectomycorrhizal colonization of boreal 17
forest tree seedlings. Can. J. For. Res. 34, 2573-2586. 18
Dong, T.F., Duan, B.L., Zhang, S., Korpelainen, H., Niinemets, Ü., Li, C.Y., 2016. 19
Growth, biomass allocation and photosynthetic responses are related to intensity of 20
root severance and soil moisture conditions in the plantation tree Cunninghamia 21
lanceolata. Tree Physiol. 36, 807-817. 22

31
Duan, B.L., Dong, T.F., Zhang, X.L., Zhang, Y.B., Chen, J., 2014. Ecophysiological 1
responses of two dominant subalpine tree species Betula albo-sinensis and Abies 2
faxoniana to intra- and interspecific competition under elevated temperature. For. Ecol. 3
Manage. 323, 20-27. 4
Eissenstat, D.M., 1991. On the relationship between specific root length and the rate of 5
root proliferation: a field study using citrus rootstocks. New Phytol. 118, 63-68. 6
Eissenstat, D.M., Wells, C.E., Yanai, R.D., 2000. Building roots in a changing 7
environment: implications for root longevity. New Phytol. 147, 33-42. 8
Elser, J.J., Bracken, M.E.S., Cleland, E.E., Gruner, D.S., Harpole, W.S., Hillebrand, H. et 9
al., 2007. Global analysis of nitrogen and phosphorus limitation of primary producers 10
in freshwater, marine and terrestrial ecosystems. Ecol. Letters 10, 1135-1142. 11
Evans, J.R., 1989. Photosynthesis and nitrogen relationships in leaves of C3 plants. 12
Oecologia 78, 9-19. 13
Evans, J.R., Poorter, H., 2001. Photosynthetic acclimation of plants to growth irradiance: 14
the relative importance of specific leaf area and nitrogen partitioning in maximizing 15
carbon gain. Plant Cell Environ. 24, 755-767. 16
Fan, J.W., Du, Y.L., Turner, N.C., Wang, B.R., Fang, Y., Xi, Y., Guo, X.R., Li, F.M., 2015. 17
Changes in root morphology and physiology to limited phosphorus and moisture in a 18
locally-selected cultivar and an introduced cultivar of Medicago sativa L. growing in 19
alkaline soil. Plant Soil 392, 215-226. 20
Farquhar, G.D., Hubick, K.T., Condon, A.G., Richards, R.A., 1989. Carbon isotope 21
fractionation and plant water-use efficiency. In: Rundel, P.W., Ehleringer, J.R., Nagy, 22

32
K.A. (eds) Stable isotopes in ecological research. Springer New York, pp 21-40. 1
Freschet, G.T., Cornelissen, J.H.C., Van Logtestijn, R.S.P., Aerts, R., 2010. Evidence of 2
the “plant economics spectrum” in a subarctic flora. J. Ecol. 98, 362-373. 3
Gan, H.H., Jiao, Y., Jia, J.B., Wang, X.L., Li, H., Shi, W.G., Peng, C.H., Polle, A., Luo, 4
Z.B., 2015. Phosphorus and nitrogen physiology of two contrasting poplar genotypes 5
when exposed to phosphorus and/or nitrogen starvation. Tree Physiol. 36, 22-38. 6
Gedroc, J.J., McConnaughay, K.D.M., Coleman, J.S., 1996. Plasticity in root/stem 7
partitioning: optimal, ontogenetic, or both? Funct. Ecol. 10, 44-50. 8
Grime, J.P., 1979. Plant strategies and vegtation processes. Chichester, UK: Wiley. 9
Guo, J.Y., Yang, Y., Wang, G.X., Yang, L.D., Sun, X.Y., 2010. Ecophysiological 10
responses of Abies fabri seedlings to drought stress and nitrogen supply. Physiol. 11
Plantarum 139, 335-347. 12
Guo, Q.X., Li, J.Y., Zhang, Y.X., Zhang, J.X., Lu, D.L., Korpelainen, H., Li, C.Y., 2016. 13
Species-specific competition and N fertilization regulate non-structural carbohydrate 14
contents in two Larix species. For. Ecol. Manage. 364, 60-69. 15
Hidaka, A., Kitayama, K., 2009. Divergent patterns of photosynthetic phosphorus-use 16
efficiency versus nitrogen-use efficiency of tree leaves along nutrient-availability 17
gradients. J. Ecol. 97, 984-991. 18
Hill, J., Simpson, R., Moore, A., Chapman, D., 2006. Morphology and response of roots 19
pasture species to phosphorus and nitrogen nutrition. Plant Soil 286, 7-19. 20
Hodge, A., 2004. The plastic plant: root responses to heterogeneous supplies of nutrients. 21
New Phytol. 162, 9-24. 22

33
Holdaway, R.J., Richardson, S.J., Dickie, I.A., Peltzer, D.A., Coomes, D.A., 2011. 1
Species- and community-level patterns in fine root traits along a 120,000-year soil 2
chronosequence in temperate rain forest. J. Ecol. 99, 954-963. 3
Hötscher, M., Hay, M.J.M., 1997. Genotypic differences in physiological integration, 4
morphological plasticity and utilization of phosphorus induced by variation in 5
phosphate supply in Trifolium repens. J. Ecol. 85, 341-350. 6
Kerkhoff, A.J., Fagan, W.F., Elser, J.J., Enquist, B.J., 2006. Phylogenetic and growth 7
form variation in the scaling of nitrogen and phosphorus in the seed plants. Amer. 8
Natur. 168, E103-E122. 9
Kobe, R.K., Lyer, M., Walters, M.B., 2010. Optimal partitioning theory revisited: 10
nonstructural carbohydrates dominate root mass responses to nitrogen. Ecology 91, 11
166-179. 12
Kronzucker, H.J., Siddiqi, M.Y., Glass, A.D., 1997. Conifer root discrimination against 13
soil nitrate and the ecology of forest succession. Nature 385, 59-61. 14
Lambers, H., Brundrett, M.C., Raven, J.A., Hopper, S.D., 2011. Plant mineral nutrition in 15
ancient landscapes: high plant species diversity on infertile soils is linked to functional 16
diversity for nutritional strategies. Plant Soil 348, 7-27. 17
Lambers, H., Raven, J.A., Shaver, G.R., Smith, S.E., 2008. Plant nutrient-acquisition 18
strategies changes with soil age. Trends Ecol. Evol. 23, 95-103. 19
Lei, Y.B., Zhou, J., Xiao, H.F., Duan, B.L., Wu, Y.H., Korpelainen, H., Li, C.Y., 2015. 20
Soil nematode assemblages as bioindicators of primary succession along a 21
120-year-old chronosequence on the Hailuogou Glacier forefield, SW China. Soil Biol. 22

34
Biochem. 88, 362-371. 1
Li, A., Guo, D.L., Wang, Z.Q., Liu, H.Y., 2010. Nitrogen and phosphorus allocation in 2
leaves, twigs, and fine roots across 49 temperate, subtropical and tropical tree species: 3
a hierarchical pattern. Funct. Ecol. 24, 224-232. 4
Li, F.L., Bao, W.K., 2015. New insights into leaf and fine-root trait relationships: 5
implications of resource acquisition among 23 xerophytic woody species. Ecol. Evol. 5, 6
5344-5351. 7
Lichtenthaler, H.K., 1987. Chlorophyll and carotenoids: pigments of photosynthetic 8
biomembranes. Methods Enzymol. 148, 350-382. 9
Liu, G., Freschet, G.T., Pan, X., Cornelissen, J.H.C., Li, Y., Dong, M., 2010. Coordinated 10
variation in leaf and root traits across multiple spatial scales in Chinese semi-arid and 11
arid ecosystems. New Phytol. 118, 543-553. 12
Liu, Q., 2002. Ecological Research on Subalpine Coniferous Forests in China. Sichuan 13
University Press, Chengdu, pp 33-52 (in Chinese). 14
Livingston, N.J., Guy, R.D., Sun, Z.J., Ethier, G.J., 1999. The effects of nitrogen stress on 15
the stable carbon isotope composition, productivity and water use efficiency of white 16
spruce (Picea glauca (Moench) Voss) seedlings. Plant Cell Environ. 22, 281-289. 17
Luo, J., Qin, J.J., He, F.F., Li, H., Liu, T.X., Polle, A., Peng, C.H., Luo, Z.B., 2013. Net 18
fluxes of ammonium and nitrate in association with H+ fluxes in fine roots of Populus 19
popularis. Planta 237, 919-931. 20
Luo, J., Chen, Y.C., Wu, Y.H., Shi, P.L., She, J., Zhou, P., 2012. Temporal-spatial 21
variation and controls of soil respiration in different primary succession stages on 22

35
glacier forehead in Gongga Mountain, China. PloS One 7, e42354. 1
Marschner, H., 1995. Mineral nutrition of higher plants. Academic Press, London, pp 2
889. 3
Michalet, R., 2006. Is facilitation in arid environments the result of direct or complex 4
interaction? New Phytol. 169, 3-6. 5
Miller, A.E., Bowman, W.D., Suding, K.N., 2007. Plant uptake of inorganic and organic 6
nitrogen: neighbor identity matters. Ecology 88, 1832-1840. 7
Mitchell, A.K., 1998. Acclimation of Pacific yew (Taxus brevifolia) foliage to sun and 8
shade. Tree Physiol. 18, 749-757. 9
Müller, B., Bartelheimer, M., 2013. Interspecific competition in Arabidopsis thaliana: 10
root hairs are important for competitive effect, but not for competitive response. Plant 11
Soil 371, 167-177. 12
Newman, G.S., Hart, S.C., 2006. Nutrient covariance between forest foliage and fine 13
roots. For. Ecol. Manage. 236, 136-141. 14
Niinemets, Ü., 1998. Growth of young trees of Acer platanoides and Quercus robur 15
along a gap - understory continuum: interrelationships between allometry, biomass 16
partitioning, nitrogen, and shade-tolerance. Inter. J. Plant Sci. 159, 318-330. 17
Niinemets, Ü., 2010a. Responses of forest trees to single and multiple environmental 18
stresses from seedlings to mature plants: past stress history, stress interactions, 19
tolerance and acclimation. For. Ecol. Manage. 260, 1623-1639. 20
Niinemets, Ü., 2010b. A review of light interception in plant stands from leaf to canopy 21
in different plant functional types and in species with varying shade tolerance. Ecol. 22

36
Res. 25, 693-714. 1
Niinemets, Ü., Keenan, T.F., Hallik, L., 2015. A worldwide analysis of within-canopy 2
variations in leaf structural, chemical and physiological traits across plant functional 3
types. New Phytol. 205, 973-993. 4
Niinemets, Ü., Kull, K., 2005. Co-limitation of plant primary productivity by nitrogen 5
and phosphorus in a species-rich wooded meadow on calcareous soils. Acta Oecol. 28, 6
345-356. 7
Novoplansky, A., 2009. Picking battles wisely: plant behaviour under competition. Plant 8
Cell Environ. 32, 726-741. 9
Ostonen, I., Püttsepp, Ü., Biel, C., Alberton, O., Bakker, M.R., Lõhmus, K., Majdi, H., 10
Metcalfe, D., Olsthoorn, A.F.M., Pronk, A., Vanguelova, E., Weih, M., Brunner, I., 11
2007. Specific root length as an indicator of environmental change. Plant Biosys. 141, 12
426-442. 13
Ouyang, S.N., Tian, Y.Q., Liu, Q.Y., Zhang, L., Wang, R.X., Xu, X.L., 2016. Nitrogen 14
competition between three dominant plant species and microbes in a temperate 15
grassland. Plant Soil 404, 1-12. 16
Peltzer, D.A., Wardle, D.A., Allison, V.J., Baisden, W.T., Bardgett, R.D., Chadwick, O.A. 17
et al., 2010. Understanding ecosystem retrogression. Ecol. Monogr. 80, 509-529. 18
Pokhilko, A., Flis, A., Sulpice, R., Stitt, M., Ebenhoh, O., 2014. Adjustment of carbon 19
fluxes to light conditions regulates the daily turnover of starch in plants: a 20
computational model. Mol. Biosys. 10, 613-627. 21
Poorter, H., Niklas, K.J., Reich, P.B., Oleksyn, J., Poot, P., Mommer, L., 2012. Biomass 22

37
allocation to leaves, stems and roots: meta-analyses of interspecific variation and 1
environmental control. New Phytol. 193, 30-50. 2
Portsmuth, A., Niinemets, Ü., 2007. Structural and physiological plasticity to light and 3
nutrients in five temperate deciduous woody species of contrasting shade tolerance. 4
Funct. Ecol. 21, 61-77. 5
Pregizer, K.S., DeForest, J.L., Burton, A.J., Allen, M.F., Ruess, R.W., Hendrick, R.L., 6
2002. Fine root architecture of nine North American trees. Ecol. Monogr. 72, 293-309. 7
Price, C.A., Wright, I.J., Ackerly, D.D., Niinemets, Ü., Reich, P.B., Veneklaas, E.J., 2014. 8
Are leaf functional traits “invariant” with plant size and what is “invariance” anyway? 9
Funct. Ecol. 28, 1330-1343. 10
Reich, P.B., Ellsworth, D.S., Walters, M.B., Vose, J.M., Gresham, C., Volin, J.C., 11
Bowman, W.D., 1999. Generality of leaf trait relationships: a test across six biomes. 12
Ecology 80, 1955-1969. 13
Reich, P.B., Oleksyn, J., 2004. Global patterns of plant leaf N and P in relation to 14
temperature and latitude. Proc. Natl. Acad. Sci. 101, 11001-11006. 15
Reich, P.B., Schoettle, A.W., 1988. Role of phosphorus and nitrogen in photosynthetic 16
and whole plant carbon gain and nutrient-use efficiency in eastern white pine. 17
Oecologia 77, 25-33. 18
Rijkers, T., Pons, T.L., Bongers, F., 2000. The effect of tree height and light availability 19
on photosynthetic leaf traits of four neotropical species differing in shade tolerance. 20
Funct. Ecol. 14, 77-86. 21
Ryser, P., Eek, L., 2000. Consequences of phenotypic plasticity vs. interspecific 22

38
differences in leaf and root traits for acquisition of aboveground and belowground 1
resources. Amer. J. Bot. 87, 402-411. 2
Sala, A., Woodruff, D.R., Meinzer, F.C., 2012. Carbon dynamics in trees: feast or famine? 3
Tree Physiol. 32, 764-775. 4
Sardans, J., Rodà, F., Peñuelas, J., 2004. Phosphorus limitation and competitive capacities 5
of Pinus halepensis and Quercus ilex subsp. rotundifolia on different soils. Plant Ecol. 6
174, 305-317. 7
Secchi, F., Zwieniecki, M.A., 2011. Sensing embolism in xylem vessels: the role of 8
sucrose as a trigger for refilling. Plant Cell Environ. 34, 514-524. 9
Shipley, B., Meziane, D., 2002. The balanced-growth hypothesis and the allometry of leaf 10
and root biomass allocation. Funct. Ecol. 16, 326-331. 11
Siddique, I., Vieira, I.C.G., Schmidt, S., Lamb, D., Carvalho, C.J.R., Figueiredo, R.O., 12
Blomberg, S., Davidson, E.A., 2010. Nitrogen and phosphorus additions negatively 13
affect tree species diversity in tropical forest regrowth trajectories. Ecology 91, 14
2121-2131. 15
Smith, M.D., Hartnett, D.C., Wilson, G.W.T., 1999. Interacting influence of mycorrhizal 16
symbiosis and competition on plant diversity in tall grass prairie. Oecologia 121, 17
574-582. 18
Smith, S.E., Read, D.J., 1997. Mycorrhizal symbiosis. 2nd ed. Academic Press, London. 19
Song, M.Y., Yu, L., Jiang, Y.L., Lei, Y.B., Korpelainen, H., Niinemets, Ü., Li, C.Y., 2017. 20
Nitrogen-controlled intra- and interspecific competition between Populus purdomii and 21
Salix rehderiana drive primary succession in the Gongga Mountain glacier retreat area. 22

39
Tree Physiol. 37, 799-814. 1
Sterner, R.W., Elser, J.J., 2002. Ecological stoichiometry: the biology of elements from 2
molecules to the biosphere. Princeton University Press, Princeton, NJ. 3
Stitt, M., Schulze, E.D., 1994. Plant growth, storage, and resource allocation: from flux 4
control in a metabolic chain to the whole-plant level. In: Schulze, E.D. (ed.) Flux 5
control in biological systems from enzymes to populations and ecosystems. Academic 6
Press, Inc., San Diego, pp 57-113. 7
Tingey, D.T., Phillips, D.L., Johnson, M.G., Storm, M.J., Ball, J.T., 1997. Effects of 8
elevated CO2 and N fertilization on fine root dynamics and fungal growth in seedlings 9
of Pinus ponderosa. Environ. Exp. Bot. 37, 73-83. 10
Tjoelker, M.G., Craine, J.M., Wedin, D., Reich, P.B., Tilman, D., 2005. Linking leaf and 11
root trait syndromes among 39 grassland and savannah species. New Phytol. 167, 12
493-508. 13
Treseder, K.K., 2004. A meta-analysis of mycorrhizal responses to nitrogen, phosphorus, 14
and atmospheric CO2 in field studies. New Phytol. 164, 347-355. 15
Tuomi, J., Kytöviita, M.M., Härdling, R., 2001. Cost efficiency of nutrient acquisition 16
and the advantage of EM symbiosis for the host plant. Oikos 92, 62-70. 17
Turnbull, T.L., Warren, C.R., Adams, M.A., 2007. Novel mannose-sequestration 18
technique reveals variation in subcellular orthophosphate pools do not explain the 19
effects of phosphorus nutrition on photosynthesis in Eucalyptus globulus seedlings. 20
New Phytol. 176, 849-861. 21
Valladares, F., Laanisto, L., Niinemets, Ü., Zavala, M.A., 2016. Shedding light on the 22

40
shade: ecological perspectives on understory plant life. Plant Ecol. Divers. 9, 237-251. 1
Valladares, F., Niinemets, Ü., 2008. Shade tolerance, a key plant feature of complex 2
nature and consequences. Annu. Rev. Ecol. Evol. S39, 237-257. 3
Vance, C.P., Uhde-Stone, C., Allan, D.L., 2003. Phosphorus acquisition and use: critical 4
adaptations by plants for securing a nonrenewable resource. New Phytol. 157, 5
423-447. 6
Vitousek, P.M., Porder, S., Houlton, B.Z., Chadwick, O.A., 2010. Terrestrial phosphorus 7
limitation: mechanisms, implications, and nitrogen-phosphorus interactions. Ecol. Appl. 8
20, 5-15. 9
Walker, T.W., Syers, J.K., 1976. Fate of phosphorus during pedogenesis. Geoderma 15, 10
1-19. 11
Wang, Z., Guo, D., Wang, X., Gu, J., Mei, L., 2006. Fine root architecture, morphology, 12
and biomass of different branch orders of two Chinese temperate tree species. Plant 13
Soil 288, 155-171. 14
Westoby, M., Falster, D.S., Moles, A.T., Vesk, P.A., Wright, I.J., 2002. Plant ecological 15
strategies: some leading dimensions of variation between species. Annu. Rev. Ecol. 16
System. 33, 125-159. 17
Wiley, E., Huepenbecker, S., Casper, B.B., Helliker, B.R., 2013. The effects of defoliation 18
on carbon allocation: can carbon limitation reduce growth in favor of storage? Tree 19
Physiol. 33, 1216-1228. 20
Williams, A.C., McCarthy, B.C., 2001. A new index of interspecific competition for 21
replacement and additive designs. Ecol. Res. 16, 29-40. 22

41
Williamson, L.C., Ribrioux, S.P., Fitter, A.H., Leyser, H.M., 2001. Phosphate availability 1
regulates root system architecture in Arabidopsis. Plant Physiol. 126, 875-882. 2
Withington, J.M., Reich, P.B., Oleksyn, J., Eissenstat, D.M., 2006. Comparisons of 3
structure and life span in roots and leaves among temperate trees. Ecol. Monogr. 76, 4
381-397. 5
Wright, I.J., Reich, P.B., Westoby, M., Ackerly, D.D., Baruch, Z., Bongers, F. et al., 2004. 6
The worldwide leaf economics spectrum. Nature 428, 821-827. 7
Wright, I.J., Westoby, M., 1999. Differences in seedling growth behaviour among species: 8
trait correlations across species, and trait shifts along nutrient compared to rainfall 9
gradients. J. Ecol. 87, 85-97. 10
Wu, N., 1995. Spatial pattern and relationship of dominant species in a Picea brachytyla 11
community on Gongga Mountain. Acta Phytoecologica Sinica 19, 270-279 (in 12
Chinese). 13
Wurzburger, N., Wright, S.J., 2015. Fine-root responses to fertilization reveal multiple 14
nutrient limitation in a lowland tropical forest. Ecology 96, 2137-2146. 15
Yamawo, A., 2015. Relatedness of neighboring plants alters the expression of indirect 16
defense traits in an extrafloral nectary-bearing plant. Evol. Biol. 42, 12-19. 17
Yemm, E.W., Willis, A.J., 1954. The estimation of carbohydrates in plant extracts by 18
anthrone. Biochem. J. 57, 508-514. 19
Yin, H.J., Xiao, J., Li, Y.F., Chen, Z., Cheng, X.Y., Zhao, C.Z., Liu, Q., 2013. Warming 20
effects on root morphological and physiological traits: The potential consequences on 21
soil C dynamics as altered root exudation. Agric. For. Meteorol. 180, 287-296. 22

42
Yu, L., Song, M.Y., Lei, Y.B., Duan, B.L., Berninger, F., Korpelainen, H., Niinemets, Ü., 1
Li, C.Y., 2017. Effects of phosphorus availability on later stages of primary succession 2
in Gongga Mountain glacier retreat area. Environ. Exp. Bot. 141, 103-112. 3
Zhou, J., Wu, Y.H., Prietzel, J., Bing, H.J., Yu, D., Sun, S.J., Luo, J., Sun, H.Y., 2013. 4
Changes of soil phosphorus speciation along a 120-year soil chronosequence in the 5
Hailuogou Glacier retreat area (Gongga Mountain, SW China). Geoderma 195-196, 6
251-259. 7

43
Table 1 Correlation coefficients and their significance for leaf and root traits of Abies fabri and Picea brachytyla across different P fertilization (fertilized vs. non-fertilized) and competition
(intra- vs. interspecific) treatments.
Pn TChl δ13C SLA SRL ECM δ15NH4+-N δ15NO3
–-N LNC RNC LPC RPC LNSC RNSC
(a) Pn 0.750*** 0.684*** 0.692*** -0.780*** -0.805*** 0.071 0.462** 0.338* -0.458** 0.865*** 0.855*** -0.298 0.769***
TChl 0.281 0.604*** 0.892*** -0.606*** -0.845*** -0.363* 0.501*** 0.445** -0.180 0.887*** 0.923*** -0.698*** 0.877***
δ13C 0.439** 0.208 0.585*** -0.447** -0.548*** -0.055 0.583*** 0.256 -0.248 0.655*** 0.646*** -0.383* 0.468**
SLA 0.033 0.372* 0.160 -0.512*** -0.734*** -0.467** 0.601*** 0.692*** -0.167 0.864*** 0.881*** -0.641*** 0.876***
SRL -0.185 0.100 0.098 0.555*** 0.768*** -0.066 -0.336* -0.305 0.234 -0.826*** -0.808*** 0.131 -0.760***
ECM -0.253 -0.290 -0.024 0.168 0.180 0.079 -0.331* -0.298 0.314* -0.891*** -0.880*** 0.412* -0.845***
δ15NH4+-N 0.495** 0.371* 0.224 -0.333* -0.023 -0.485** -0.294 -0.583*** -0.549*** -0.182 -0.230 0.756*** -0.335*
δ15NO3–-N 0.313 0.454** 0.475** 0.589*** -0.134 0.034 -0.224 0.538*** -0.145 0.484** 0.526*** -0.470** 0.336*
LNC -0.131 -0.037 -0.058 0.644*** 0.202 0.360* -0.726*** 0.431** -0.178 0.510*** 0.513*** -0.307 0.574***
RNC -0.494** -0.450** -0.200 -0.195 -0.200 0.346* -0.536*** -0.125 -0.130 -0.300 -0.281 -0.387* -0.165
LPC 0.398* 0.408* 0.441** 0.393* -0.007 -0.166 0.173 0.646*** 0.207 -0.496** 0.987*** -0.446** 0.926***
RPC 0.392* 0.588*** 0.327* 0.383* -0.160 -0.065 0.184 0.747*** 0.188 -0.496** 0.770*** -0.510*** 0.933***
LNSC -0.009 -0.115 -0.191 -0.290 0.153 -0.168 0.347 -0.606*** -0.081 -0.509*** -0.138 -0.184 -0.514***
RNSC -0.186 -0.088 -0.556*** 0.296 0.082 0.161 0.444** -0.166 0.444** 0.013 -0.331* -0.162 0.042
(b)
Pn 0.846*** 0.694*** 0.745*** -0.799*** -0.816*** 0.042 0.474** 0.347* -0.471** 0.869*** 0.870*** -0.619*** 0.789***
TChl 0.084 0.620*** 0.883*** -0.826*** -0.886*** -0.119 0.497*** 0.444** -0.386* 0.950*** 0.962*** -0.713*** 0.901***
δ13C 0.420** 0.222 0.585*** -0.500*** -0.544*** 0.021 0.578*** 0.248 -0.308 0.655*** 0.642*** -0.542*** 0.461**
SLA -0.032 0.620*** 0.199 -0.658*** -0.743*** -0.379* 0.596*** 0.697*** -0.314 0.893*** 0.892*** -0.733*** 0.880***
SRL -0.214 0.498*** 0.149 0.691*** 0.835*** 0.217 -0.393* -0.352* 0.141 -0.878*** -0.888*** 0.699*** -0.853***
ECM -0.224 -0.335* -0.048 0.028 0.031 0.018 -0.323* -0.291 0.377* -0.892*** -0.879*** 0.601*** -0.844***
δ15NH4+-N 0.417** -0.422** 0.064 -0.586*** -0.425** -0.177 -0.296 -0.738*** -0.436** -0.218 -0.210 0.415** -0.326*
δ15NO3–-N 0.294 0.381* 0.484** 0.564*** -0.034 0.006 -0.250 0.532*** -0.208 0.483** 0.519*** -0.659*** 0.323*
LNC -0.141 0.068 -0.044 0.600*** 0.230 0.327* -0.577*** 0.440** -0.233 0.509*** 0.507*** -0.401* 0.568***
RNC -0.496*** 0.050 -0.137 0.056 0.064 0.235 -0.618*** -0.062 -0.075 -0.341* -0.353* -0.151 -0.243
LPC 0.362* 0.414* 0.453** 0.440** 0.117 -0.203 -0.042 0.654*** 0.226 -0.365* 0.990*** -0.734*** 0.931***
RPC 0.290 0.694*** 0.343* 0.542*** 0.155 -0.153 -0.239 0.714*** 0.219 -0.218 0.763*** -0.739*** 0.933***
LNSC 0.096 -0.748*** -0.189 -0.594*** -0.459** 0.115 0.761*** -0.375* -0.138 -0.545*** -0.253 -0.503*** -0.696***
RNSC -0.215 0.359* -0.412** 0.491*** 0.347* 0.031 -0.560*** -0.072 0.438** 0.206 -0.167 0.123 -0.449**
(a) Correlation coefficients without removing the influence of competition and P fertilization (upper triangle); partial correlation coefficients when removing the influence of both competition and P fertilization (lower triangle). (b) Partial correlation
coefficients when the influence of competition was removed (upper triangle); partial correlation coefficients when the influence of P fertilization was removed (lower triangle). Pn, net photosynthetic rate; TChl, total chlorophyll content; SLA,
specific leaf area; SRL, specific root length; ECM, ectomycorrhizal infection; LNC, RNC, LPC, RPC, LNSC, and RNSC indicate leaf and root N, P and NSC concentrations. * 0.01 < P < 0.05; ** 0.001 < P ≤ 0.01; *** P ≤ 0.001.

44
Figure legends 1
2
Figure 1. Biomass accumulation and allocation of A. fabri and P. brachytyla under 3
different competition treatments and P fertilization levels. (a) Leaf biomass, (b) shoot 4
biomass, (c) total root biomass, (d) total biomass, (e) fine root biomass and (f) root/shoot 5
ratio. Each value is the mean ± SE of five replicate plants (n = 5). Different lowercase 6
letters indicate significant treatment differences among species and treatments, according 7
to Tukey’s test after one-way ANOVA at a significance level of P < 0.05. Three-way 8
analyses of variance (ANOVA) were applied to evaluate the effects of different factors 9
and their interactions. S, species effect; C, competition effect; P, P fertilization effect; S × 10
C, species × competition effect; S × P, species × P fertilization effect; C × P, competition 11
× P fertilization effect; S × C × P, species × competition × P fertilization effect. Black and 12
white bars denote A. fabri and P. brachytyla, respectively. Mon: intraspecific competition; 13
Mix: interspecific competition; Mon+P: intraspecific competition under P fertilization; 14
Mix+P: interspecific competition under P fertilization. 15
16
Figure 2. (a) Specific root length (SRL), (b) average root diameter (AD), (c) specific root 17
tip density (SRD) and (d) ectomycorrhizal infection (ECM) of A. fabri and P. brachytyla 18
under different competition treatments and P fertilization levels. Each value is the mean ± 19
SE (n = 5). Treatment codes and statistical analyses are as in Figure 1. 20
21
Figure 3. (a) Net photosynthetic rate (Pn), (b) total chlorophyll concentration (TChl), (c) 22

45
δ13C and (d) specific leaf area (SLA) of A. fabri and P. brachytyla under different 1
competition treatments and P fertilization levels. Each value is the mean ± SE (n = 5). 2
Treatment codes and statistical analyses are as in Figure 1. 3
4
Figure 4. (a) Leaf N concentration, (b) root N concentration, (c) leaf P concentration, (d) 5
root P concentration, (e) leaf NSC concentration and (f) root NSC concentration of A. 6
fabri and P. brachytyla under different competition treatments and P fertilization levels. 7
Each value is the mean ± SE (n = 5). Treatment codes and statistical analyses are as in 8
Figure 1. 9
10
Figure 5. (a) δ15NH4+-N and (b) δ15NO3
--N of A. fabri and P. brachytyla under different 11
competition treatments and P fertilization levels. Each value is the mean ± SE (n = 5). 12
Treatment codes and statistical analyses are as in Figure 1. 13
14
15
16
17
18
19
20
21
22

46
1
Figure 1 2

47
1
Figure 2 2

48
1
Figure 32
1
Figure 4 2

2
1
Figure 5 2