Embed Size (px)
Citation preview


EEAR 2010 ENERGY EFFICIENCY ANNUAL REPORT
EXECUTIVE SUMMARY
December 2011

2
The Efficiency Energy Annual Report has been edited by the ENEA Technical Unit for Energy Efficiency, based on information and data available as of 31st December, 2011, and provided by the UTEE-ERT, UTEE-IND, UTEE-GED, UTEE-SEN, UTEE-AGR, UTEE-MOS Services. Supervision Rino Romani Coordination Walter Cariani Text writing, data processing, tables and graphs Walter Cariani, Antonio Disi, Giulia Iorio, Laura Manduzio For further information on contents, please contact: Technical Unit for Energy Efficiency CR ENEA Casaccia Via Anguillarese, 301 00123 S.Maria di Galeria - Rome e-mail: [email protected] Duplication is authorized only for non-commercial purposes and with the source mentioned The Energy Efficiency Annual Report is downloadable on the Internet at the following address: http://www.efficienzaenergetica.enea.it EEAR 2010 ENERGY EFFICIENCY ANNUAL REPORT EXECUTIVE SUMMARY
2011 ENEA Italian National Agency for New Technologies, Energy and Sustainable Economic Development
Lungotevere Thaon di Revel, 76 00196 Rome

RAEE 2010 – Executive Summary
3
1. Energy Demand
If compared to other EU Member States, Italy’s energy need is characterized by more vulnerable supplies, higher dependence on hydrocarbons (oil and gas), a limited carbon contribution and the total lack of electronuclear generation.
The primary energy demand, in 2010, was on the order of 185.3 Mtep, i.e., 2.7% higher than in 2009. The increase in primary energy demand is a clear evidence that the decrease trend of primary consumptions in the previous four years has inverted, although the 2010 value is far from the 197.8 Mtep peak achieved in 2005. 2. Final Energy Consumptions
In 2010, the final energy consumption was 137.5 Mtep, 3.6% higher than 2009. Such increase is due to: higher consumption in the industrial sector (+5.5%); increased non-energy (+12.9%) and civil uses (+4.1%).
The distribution of energy uses among various sectors (Figure 1) shows a strong incidence of the civil sector, with an increase from 30.8% in 2004 to 35.0% in 2010, followed by transports (31.0%) and industry (23%).
Figure 1: Final energy uses per sector - Year 2010 (Source: MiSE data processed by ENEA)
23%
31%
35%
2%6% 3%
Industry
Transports
Civil Uses
Agriculture
Non-Energy Uses
Bunkering

RAEE 2010 – Executive Summary
4
The consumption trend in the final use sectors shows a 6.6% increase in total consumption in 2001-2005 and a 6.2% decrease in 2006-2010, with a mean annual decrease rate of ca. 1.25%. Along with the severe consumption contraction in the industrial sector, such decrease stems from the economic crisis and the effects of measures aimed at promoting and incentivizing energy efficiency, but also from a slight consumption decrease in transports, which offsets the consumption increase in the civil sector (residential and tertiary).
Traditionally, Italy is one of the most energy-efficient countries among the industrialized ones: the final energy consumption per capita of 2.4 tep/capita is actually one of the lowest among the countries with similar industrial development (2.7 tep/capita EU average per capita consumption, Figure 2).
Figure 2: Final energy consumption per capita – Year 2009 (Source: Eurostat data processed by ENEA)
MaltaRomaniaBulgaria
PolandLatvia
GreecePortugalHungary
LithuaniaSlovak Republic
ItalySpain
CyprusUnited Kingdom
EU-27SloveniaEstonia
Czech RepublicFrance
DenmarkGermany
IrelandAustria
BelgiumHollandSwedenFinland
Luxembourg
Oil equivalent tons per capita (toe/capita)0.0 2.0 4.0 6.0 8.0 10.0

RAEE 2010 – Executive Summary
5
3. Energy Intensity
In 2010, the primary energy intensity – i.e., the quantity of energy consumed to produce one GDP unit – was 151.3 tep/M€001 (Figure 3).
Between 1990 and 2005, albeit with a fluctuating trend, such an indicator recorded a neglectable variation, whereas in 2006-2009 it showed a continuous decreasing trend resulting in a definite reduction (6%) following a severe decrease in the primary energy demand (-8.8%), exceeding the GDP contraction (-3.0%). The 2010 data show a trend inversion, with an increase in primary energy higher than GDP’s and the consequent increase in primary intensity (+1.4%).
The final energy intensity and primary intensity have similar trends (Figure 3). In 2010, a value of 114.6 tep/M€00 was recorded, with an increase of 2.3% compared to 2009, whereas in 1990-2010 the overall decrease was 5.4%.
Between 1990 and 2010, Italy showed a decrease both in primary and in final energy intensity, with a mean annual decrease rate of 0.30% for primary intensity and 0.27% for final intensity.
Figure 3: Primary and final energy intensities in 1990-2010 (tep/M€00) (Source: MiSE and ISTAT data processed by ENEA)
1 Tep per M€ concatenated, reference year: 2000.
100
110
120
130
140
150
160
170
1990 1991 1992 1993 1994 1995 1996 1997 1998 1999 2000 2001 2002 2003 2004 2005 2006 2007 2008 2009 2010
tep/
M€0
0
final intensity primary intensity

RAEE 2010 – Executive Summary
6
A more accurate interpretation of the final intensity trend, which takes into account several factors to be considered, can be obtained by studying the sectoral intensities. 3.1 Energy Intensities by Sector
Industry
In 2009, energy consumption in the industrial sector was 30.0 Mtep, with a 19.9% decrease compared to 2008. Over the years, the trend has shown a 12.6% increase in 1990-2005 and a 27.0% in 2005-2009. The drastic drop in consumption after 2007 is to be attributed to the recent international economic and financial crisis, whose effects are still evident despite the consumption rise in 2010.
In 1990-2009, the mean annual decrease rate of consumption per unit of value added decreased further (0.7%) and two “energy intensive” subsectors recorded the most significant efficiency improvements, chemistry and metallurgy respectively (Figure 4).
Figure 4: Energy intensity of energy-intensive subsectors (1990=100) (Source: MiSE and ISTAT data processed by ENEA)
50
60
70
80
90
100
110
120
130
140
150
160
1990 1991 1992 1993 1994 1995 1996 1997 1998 1999 2000 2001 2002 2003 2004 2005 2006 2007 2008 2009
Metallurgy Building materials, Glass and Ceramics Chemical and Petrochemical Paper and Graphics Industry

RAEE 2010 – Executive Summary
7
The limited improvement rate is partially due to the Italian entrepreneurial fabric, mainly composed of SMEs whose priority has not been improving energy efficiency so far. Residential Sector
In 2009, energy consumption in the residential sector was 26.0 Mtep, with a 3.2% increase compared to 2008.
Energy consumption per dwelling shows a 2.6% decrease in the 2009 value compared to 2000; such a value is well below the corresponding variation for EU27 (-11.7%) and the decrease values achieved by Germany, France and United Kingdom (Figure 5).
In Italy, electric power consumption per dwelling in the considered period has recorded a slight decrease (-1.8%), associated to purchasing more efficient electric appliances by consumers, whereas heating consumption per dwelling2 has slightly increased unlike most EU countries.
Figure 5: Total consumption variation, electricity and heating, per dwelling in 2000-2009 (Source: Odyssee data processed by ENEA)
2 Quantity energy consumed per dwelling only for heating uses.
-25.00%
-20.00%
-15.00%
-10.00%
-5.00%
0.00%
5.00%
10.00%
15.00%
Italy Germany France United Kingdom
Spain
Total consumption/capita
Heating consumption/capita
El. En. consumption/capita

RAEE 2010 – Executive Summary
8
The decrease in electric power consumption per dwelling has been by and large partially offset by the concomitant increase in the heating unit price, to which an insufficient application of the national regulations to improve energy efficiency in buildings has heavily contributed. Services
In 2009, energy consumption in the service sector was 20.0 Mtep, with a 2.2% increase compared to 2008. Compared to the previous year, In 2009 energetic and electric intensities recorded an increase of 4.9% and 4.1% respectively, confirming the regular growth occurred in 1990 – 2009 (Figure 6).
Figure 6: Final consumption, energy intensity and electrical intensity in the service sector (1990=100) (Source: MiSE and ISTAT data processed by ENEA)
80
100
120
140
160
180
200
220
1990 1991 1992 1993 1994 1995 1996 1997 1998 1999 2000 2001 2002 2003 2004 2005 2006 2007 2008 2009
Final consumption Energy intensity Electrical intensity

RAEE 2010 – Executive Summary
9
Transports
In 2009, the final energy demand in the transport sector was 42.5 Mtep, with a 4,7% decrease compared to 2008. Transport consumption progressively increased until 2007, and started decreasing only in 2008 and 2009 due to the economic crisis that led to a consumption decrease both in passenger and in freight transport.
Approximately 2/3 of the overall consumption are due to passenger transport, the remaining part to freight transport. Both are dominated by the road transportation mode: 89% of passenger transport consumption, even 93% of freight transport’s.
Compared to an EU average of 73%, in Italy 86% of freight is road transported by a number of vehicles with mean age higher than in the major EU countries, used with lower load levels.
In 1999-2009, Italy, that reduced its own energy intensity3 in transports by less than half compared to France (Figure 7), presented a share of the car segment, in
Figure 7: Energy intensity variation in transports and passenger traffic (1999-2009) (Source: Odyssee data processed by ENEA)
3 Expressed as a ratio between final energy consumption and GDP.
-30.0%
-20.0%
-10.0%
0.0%
10.0%
20.0%
30.0%
40.0%
Italy Germany France United Kingdom Spain
Energy intensity
pass-km auto
pass-km bus
pass-km train
pass-km tram

RAEE 2010 – Executive Summary
10
passenger-kilometre, almost constant and a modest increase in using the railway and public transport system.
This result clearly stresses the need in Italy to pursue more efficient modal transport policies. 4. Review of the Italian Instruments to Improve Energy Efficiency
The instruments to improve energy efficiency, already in force or enabled in 2007-2010, are included in one of the following categories:
− Legislative/Normative Instruments. The commonest forms of normative instruments used in Italy are the Minimum Energy Performance Standards and urban instruments.
− Training and Public Awareness. Measures to increase knowledge, awareness and training among stakeholders or users.
− Financial Incentives and Subsidies. Measures encouraging or fostering given activities, behaviours or investments by using financial and fiscal instruments. These include incentives for renewable energy, discounts for high-efficiency domestic appliances, subsidies, subsidized loans and forms of financing. In addition, fiscal incentives are provided, such as tax exemptions, reductions and/or credits to purchase or install given services and goods.
− Strategic Processes. Those processes aimed at developing and implementing policies. They are generally related to strategic planning documents and strategies for policy development.
− R&TD. Government investment policies or support to investments in technology research, development and demonstration.
− Tradable Permits. Three types of instruments: Emissions Trading System (ETS), white certificates (WCs) derived from energy saving or obligations and green certification systems based on the obligation to produce or purchase a minimum amount of renewable energy (mainly electric power).
− Voluntary Agreements.

RAEE 2010 – Executive Summary
11
5. Analysis of the National Indicative Energy Saving Target Achieved4
Directive 2006/32/EC on energy end-use efficiency and energy services requires each Member State to achieve a national indicative energy savings target by 2016 – ninth year of the Directive’s implementation – of 9% of the overall reference consumption5.
The Italian Energy Efficiency Action Plan (EEAP), presented to the European Commission in July 2007, provides programmes and measures aimed at improving both energy efficiency and energy services in the end-use sectors to achieve an annual energy saving of 9.6% (126,327 GWh/p.a.) by 2016 and of 3% (35,658 GWh/p.a.) by 2010, with respect to the reference consumption.
In order to monitor the progress toward the achievement of the 2010 intermediate target, the quantitative assessment of the savings actually obtained has been carried out with reference to the following EEI measures :
a) Transposition of Directive 2002/91/EC and implementation of Legislative Decree 192/05 as to the setting up of minimum energy performance standards of buildings;
b) Acknowledging 55% tax deductions for energy requalification of existing buildings;
c) Awarding energy efficiency titles (White Certificates, WCs) pursuant to the Ministerial Decrees of July 20, 2004;
d) Allowing 20% tax deductions for the installation of high efficiency electric motors and inverters;
e) Incentive measures to encourage environmentally-sustainable replacement of cars and lorries up to 3.5 tonnes.
Table 1 reports the energy savings achieved as of 31 December 2010 and the national indicative energy savings targets proposed in the EEAP 2007 for 2010 and 2016 respectively.
4 Ref.: Italian Energy Efficiency Action Plan 2011, MiSE, July 2011. 5The average consumption in the end-use sectors in the five years preceding the Directive issue.

RAEE 2010 – Executive Summary
12
Table 1: Annual energy saving achieved in 2010 and expected in 2010 and 2016. Detailed by sector
Measures
Annual energy saving
achieved in 2010
(net of duplication) EEAP 2007
a
Annual energy saving
Non-EEAP 2007
measures
b
Total annual energy saving
achieved in
(a+b)
Annual energy saving
expected in 2010
(EEAP 2007)
Annual energy saving
expected in 2016
(EEAP 2007)
[GWh/p.a.] [GWh/p.a.] [GWh/p.a.] [GWh/p.a.] [GWh/p.a.]
Total Residential Sector
25,359 6,068 31,427 16,998 56,830
Total Service Sector
653 4,389 5,042 8,130 24,700
Total Industrial Sector
3,350 4,920 8,270 7,040 21,537
Total Transport Sector
2,972 2,972 3,490 23,260
Totale Energy Saving
32,334 15,377 47,711 35,658 126,327
The details of non-EEAP 2007 measures (Table 1, second column) are reported in Table 2.

RAEE 2010 – Executive Summary
13
Table 2: Annual energy saving achieved in 2010. Detailed by each single non-EEAP 2007 measure
Measures
Annual energy saving achieved in 2010 (net
of duplication)
[GWh/p.a.]
Residential Sector:
RES-10 Natural gas decompression, FV < 20kW, cogeneration, district heating systems
190
RES-11 Low flow rate aerators for showers, water kits, aerators for taps 5,878
RES-12 Automatic switch-off devices for appliances in standby mode 0
Total Residential Sector 6,068
Service Sector:
TER-5 Low flow rate aerators for showers in hotels and sports facilities 385
TER-6 Transposition of Directive 2002/91/EC and implementation of D.Lgs. 192/05
4,004
Total Service Sector 4,389
Industrial Sector:
IND-6 Refrigeration, inverters on compressors, replacement of boilers, recovery of thermal waste
4,920
Total Industrial Sector 4,920
Total Energy Saving 15,377
6. Effectiveness and Economic Efficiency of the main National
Instruments to Improve Energy Efficiency
The main economic incentive and normative instruments implemented to improve energy efficiency have been studied with the aim of assessing their effectiveness and economic efficiency.
The effectiveness quantifies the actual effect of a policy instrument, and represents the difference between the actual situation achieved and that in the absence of measures.
The effectiveness of the main national instruments to improve energy efficiency has been assessed by calculating their contribution to the achievement of the
RAEE 2010 – Executive Summary
14
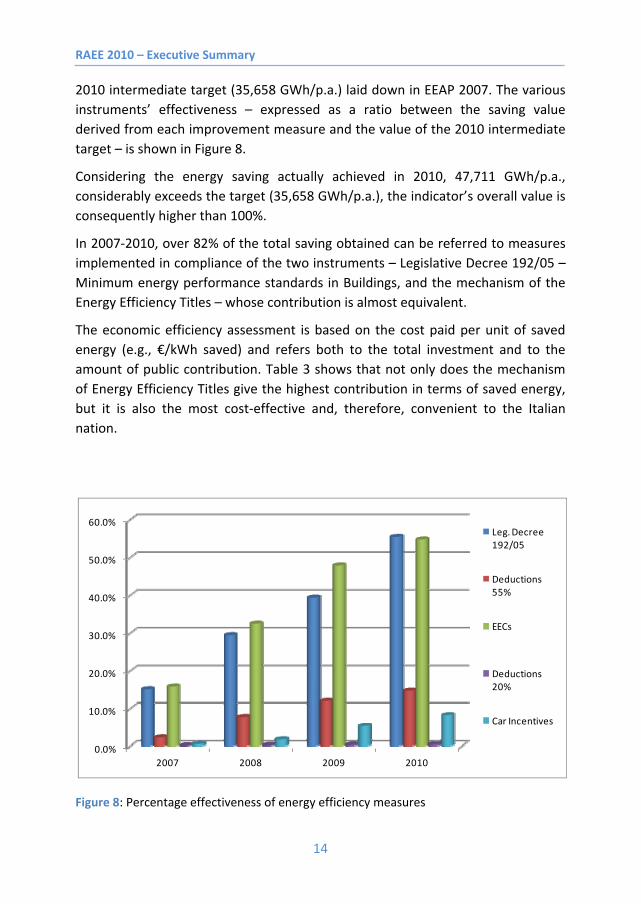
2010 intermediate target (35,658 GWh/p.a.) laid down in EEAP 2007. The various instruments’ effectiveness – expressed as a ratio between the saving value derived from each improvement measure and the value of the 2010 intermediate target – is shown in Figure 8.
Considering the energy saving actually achieved in 2010, 47,711 GWh/p.a., considerably exceeds the target (35,658 GWh/p.a.), the indicator’s overall value is consequently higher than 100%.
In 2007-2010, over 82% of the total saving obtained can be referred to measures implemented in compliance of the two instruments – Legislative Decree 192/05 – Minimum energy performance standards in Buildings, and the mechanism of the Energy Efficiency Titles – whose contribution is almost equivalent.
The economic efficiency assessment is based on the cost paid per unit of saved energy (e.g., €/kWh saved) and refers both to the total investment and to the amount of public contribution. Table 3 shows that not only does the mechanism of Energy Efficiency Titles give the highest contribution in terms of saved energy, but it is also the most cost-effective and, therefore, convenient to the Italian nation.
Figure 8: Percentage effectiveness of energy efficiency measures
0.0%
10.0%
20.0%
30.0%
40.0%
50.0%
60.0%
2007 2008 2009 2010
Leg. Decree 192/05
Deductions 55%
EECs
Deductions 20%
Car Incentives

RAEE 2010 – Executive Summary
15
Table 3: Economic efficiency of incentives
Measure Cost-effectiveness of
total investment (euro/kWh)
Cost-effectiveness for the Government
(euro/kWh)
D.Lgs. 192/05 0.13 Not applicable
55% 0.10 0.05
20% 0.013 0.002
EET Not available 0.0012
Transports 0.82 0.10
7. Analysis of Improvements and Results Achieved in End-Use Sectors
Energy efficiency improvements in the various sectors have been assessed by using energy efficiency indexes that relate the energy consumption for goods and/or services production with the quantity of goods and/or services produced. In particular, hereinafter the ODEX index is referred to, developed within the ODYSSEE-MURE Project6.
ODEX indicators represent a better proxy for assessing energy efficiency trends at an aggregate level (e.g., overall economy, industry, households, transports, services) than the traditional energy intensities, as they are cleaned from structural changes and from other factors not related to energy efficiency (more appliances, more cars, …)
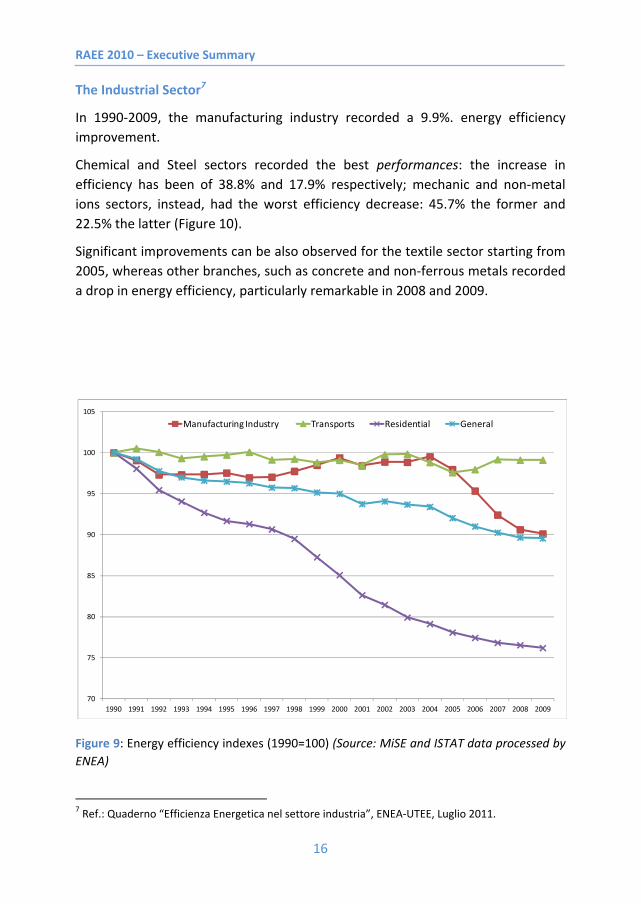
In 2009, the ODEX energy efficiency index for the whole economy was 89.6, therefore, compared to 1990, the energy efficiency improvement achieved was 10.4% (Figure 9).
The various sectors contributed differently to achieving this result: the residential sector achieved regular and constant improvements for the whole 1990-2009 period; industry obtained significant improvements only in the last five years; the transport sector showed a fluctuating trend, but finally recorded the lowest efficiency improvements.
6 The 27EU national energy agencies, Norway and Croatia participate in the project, funded by the
European Commission. ENEA participates as Italian member.
RAEE 2010 – Executive Summary
16
The Industrial Sector7
In 1990-2009, the manufacturing industry recorded a 9.9%. energy efficiency improvement.
Chemical and Steel sectors recorded the best performances: the increase in efficiency has been of 38.8% and 17.9% respectively; mechanic and non-metal ions sectors, instead, had the worst efficiency decrease: 45.7% the former and 22.5% the latter (Figure 10).
Significant improvements can be also observed for the textile sector starting from 2005, whereas other branches, such as concrete and non-ferrous metals recorded a drop in energy efficiency, particularly remarkable in 2008 and 2009.
Figure 9: Energy efficiency indexes (1990=100) (Source: MiSE and ISTAT data processed by ENEA)
7 Ref.: Quaderno “Efficienza Energetica nel settore industria”, ENEA-UTEE, Luglio 2011.
70
75
80
85
90
95
100
105
1990 1991 1992 1993 1994 1995 1996 1997 1998 1999 2000 2001 2002 2003 2004 2005 2006 2007 2008 2009
Manufacturing Industry Transports Residential General

RAEE 2010 – Executive Summary
17
Technologies
Technologies significantly interesting to the sector are:
Electric Motors and Inverters
ENEA estimates that ca. 1,000,000/p.a. high-efficiency motors with 5-90 kW power range could be introduced, with a saving of ca. 1.37 TWh/p.a. and an economic saving for end users of ca. 178 M€8, with a mean return time of less than three years. The potential saving from inverters is still higher, ca. 3.5 TWh/p.a., corresponding to an economic saving of ca. 450 M€ for users.
The forced replacement of motors in compliance of the binding legislation could produce energy savings up to 5.9 TWh/p.a. by 2020, corresponding to ca. 750 M€ of economic saving for end users. The saving potential from a full application of inverters has been estimated to be of 35% for ventilation and pumping, 15% for compressors and 15% for other applications9.
Figure 10: Energy Efficiency in the industrial sector (1990=100) (Source: MiSE and ISTAT data processed by ENEA)
8 With a mean kWh cost of 0.13 €/kWh. 9 Confindustria proposals for the Extraordinary Plan for Energy Efficiency 2010.
60
70
80
90
100
110
120
130
140
150
160
1990 1991 1992 1993 1994 1995 1996 1997 1998 1999 2000 2001 2002 2003 2004 2005 2006 2007 2008 2009
Manufacturing Industry Steel Non-ferrous Metals MechanicAgrofood Textile Non-Metal Ores ConcreteChemical Paper

RAEE 2010 – Executive Summary
18
Cogeneration/Trigeneration
Cogeneration is a consolidated technique by now. Its effectiveness stems from the use of energy facilities of long and proven reliability, such as steam turbines (condensation, bleeding or counter-pressure), gas turbines, internal combustion engines. Similar facilities are penalized by a marked scale effect making installation costs per electric kW for small applications remarkably higher than large facilities of tens of MW. Even for massive uses of 5÷6000 hours/p.a., return times range on average 4÷5 years, and in this historical age, the return times expected by enterprises are at least half that number.
In addition, the technologies reported below are worth mentioning for their high energy saving potential in the medium term:
1) use of fine-bubble oxidation systems replacing the current aeration methods (medium-bubble, turbine, etc.) in the wastewater treatment systems for residential and tertiary sectors (in Italy about 16,000 treatment plants are in operation); for large facilities, use of centrifugal blowers instead of lobe blowers;
2) use of synchronous permanent magnet electric motors replacing the traditional asynchronous induction motors.
Barriers
A major barrier to the application of efficient technologies is that investment pay-back periods are in many cases too long. The application of cogeneration to all suitable sectors would demand stronger incentive mechanisms.
At present, white certificates are the only instrument available as incentive for energy efficiency in the industrial sector. Civil Sector
The civil sector has contributed significantly to the achievement of the EEAP 2007 targets. This has mainly been possible thanks to the implementation by the Italian Government of Directive 2002/91/EC by updating the reference legislation, adjusting the relevant technical provisions and incentivizing any intervention in the civil sector.
In 1990 – 2009, the residential sector recorded the best results in terms of increase in energy efficiency: in 2009, the EE index was 76.1, corresponding to an overall 23.9% increase in energy efficiency compared to 1990 (Figure 11).

RAEE 2010 – Executive Summary
19
Figura 11: Energy efficiency in the residential sector (1990=100) (Source: MiSE and ISTAT data processed by ENEA) Technologies
In the residential and tertiary sectors, several technologies particularly interesting for a better energy efficiency in buildings/plants are available on the market. Particularly:
High-efficiency systems and components (condensation boilers, micro-cogeneration plants, compression or absorption heat pumps);
materials, devices and products for energy dispersions in heating plant pipes or for a better final heat diffusion (high exchange surface radiators);
innovative high thermal insulation bricks;
materials specific for building thermal insulation (expanded clay, stabilized cellulose fiber, expanded polyurethane, sintered expanded polystyrene without HCFC and HFC, plasters and mortars for thermal insulation and prevention of humidity, insulating varnishes, cork, sheetings, insulation sheets and membranes, wooden and natural fiberboards);
low heat dispersion and absorption products and systems (high heat performance doors and double glass windows, solar control glasses to reduce
70
75
80
85
90
95
100
105
1990 1991 1992 1993 1994 1995 1996 1997 1998 1999 2000 2001 2002 2003 2004 2005 2006 2007 2008 2009
Heating Electrical Applications Residential

RAEE 2010 – Executive Summary
20
summer air-conditioning need, mobile external solar screens such as awnings, Venetian blinds, sunshades, insulating polycarbonate sheets letting light pass through).
In addition, technologies and innovative systems are more and more gaining ground: domotic systems, active envelope, solar cooling, smart building and cogeneration.
Partial or integrated energy requalification interventions allow to achieve energy consumption savings of 10% to over 50%, also using high-performance cogeneration systems integrated with renewable energy sources.
Barriers and Criticalities
The building sector is characterized by the limited dimension of the production chain subjects and building process actors very fragmented and poorly integrated. One of the principal effects of such fragmentation is that adequate R&D investments, particularly in energy-saving building technologies are quite impossible to make. However, the opportunity for a higher energy efficiency in the building sector makes it proper to reappraise technological interventions.
Interventions on buildings should be conceived organically, considering the various energy needs, the characteristics of the building envelope and the context it is located in. Given the project complexity, this approach is particularly suitable for new buildings; for existing buildings this opportunity has to be carefully considered in case of cyclic renovation interventions, that are nevertheless necessary to keep buildings in good state. Transport Sector10
In 2009, the energy efficiency index in the transport sector was 98.9, with an overall efficiency increase of only 1.1% in 1990-2009 (Figure 12).
This result is basically due to the efficiency decrease of light vehicles and lorries, which are the main freight transport mode that actually annulled the increase in efficiency achieved by other transport modes (car, air, railway). A significant contribution to achieving the national energy consumption reduction targets can be obtained with a higher energy efficiency in the transport sector by implementing the following intervention proposals:
10 Ref.: Quaderno “Efficienza Energetica nel settore trasporti”, ENEA-UTEE, Luglio 2011.

RAEE 2010 – Executive Summary
21
− promoting transport modes alternative to road transport;
− containing transport demand by: planning territorial functions; awarding the commercialization of local products with reduced packaging; optimizing the distribution of goods;
− providing the electrification of road transport;
− optimizing urban mobility by using Intelligent Transport Systems (ITS);
− using systems for quick electricity storage and recharge.
Figure 12: Energy Efficiency in the transport sector (1990=100) (Source: MiSE and ISTAT data processed by ENEA)
60
70
80
90
100
110
120
130
140
150
1990 1991 1992 1993 1994 1995 1996 1997 1998 1999 2000 2001 2002 2003 2004 2005 2006 2007 2008 2009
Railway Transport Cars Lorries and light vehicles Air Transport Total

RAEE 2010 – Executive Summary
22
Energy Saving Achieved in End-Use Sectors
The energy saving achieved in end-use sectors can be calculated by using top-down methods reflecting the trends of total final energy costs rather than the saving deriving from each single energy efficiency measure or programme.
Top-down energy savings are derived from the multiplication of the variation of a unit energy consumption by an indicator of activity over a reference period.
Energy efficiency indexes are calculated by aggregate statistics or other data officially acknowledged at the national and sectoral levels.
The annual energy savings achieved in end-use sectors in the 1990-2009 period and calculated by using the ODEX index, are reported in Figure 13.
Figure 13: Energy savings in end-use sectors (Source: MiSE and ISTAT data processed by ENEA)
-14.0
-12.0
-10.0
-8.0
-6.0
-4.0
-2.0
0.01990 1991 1992 1993 1994 1995 1996 1997 1998 1999 2000 2001 2002 2003 2004 2005 2006 2007 2008 2009
Manufacturing Industry Transports Residential
Mte
p

RAEE 2010 – Executive Summary
23
8. Energy Efficiency and Savings Achieved at the Regional Level
Territorial Effects of the National Measures to Promote Energy Efficiency and Saving
The analysis of the territorial effects of the two major national measures to improve energy efficiency and saving provides the following results: Measure “Acknowledgment of 55% tax deductions for energy requalification of existing buildings”
The distribution of energy savings at the regional level in 2007-2009 (Figure 14) shows how, for an overall energy saving value of 4,250 GWh:
Figure 14: Energy saving from 55% tax deductions
0 200 400 600 800 1000 1200
Molise
Basilicata
Calabria
The Aosta Valley
The Abruzzi
Campania
Sicily
Umbria
Sardinia
Apulia
The Marches
Liguria
Friuli
Latium
Trentino
Tuscany
Emilia
Veneto
Piemonte
Lombardy
Savings 2007-2009 (GWh)

RAEE 2010 – Executive Summary
24
− over 64% of energy saving from energy requalification measures is centred only in four regions (Lombardy, Veneto, Piemonte and Emilia-Romagna);
− the overall value associated with the total energy saving value, declared in the first ten regions, is ca. 89% of the total (3,800 GWh);
− the last ten regions’ contribution is about 450 GWh, i.e., ca. 10% of the total;
− only1% of energy saving can be attributed to the last 4 regions (Molise, Basilicata, Calabria and the Aosta Valley).
As regards investments, for a total of 7,520 million euro in the three-year period:
− over 60% of investments is centred only in four regions (Lombardy, Veneto, Piemonte and Emilia-Romagna);
− The value associated with the total of investments made in the first ten regions is ca. 88% o f the total;
− the marginal contribution of the last ten regions is confirmed at a value close to 12% of the total;
− only 2% of the overall investments was in the last 4 regions (Molise, Basilicata, Calabria and the Aosta Valley).

RAEE 2010 – Executive Summary
25
Measure: “White Certificates”
Considering the territorial distribution, the regions with the major share of certificated savings are Lombardy, Tuscany and Latium, followed by Emilia Romagna, Piemonte, Apulia and Campania (Figure 15).
If we consider the whole reference period, it is evident that in some regions (Lombardy, Tuscany, Piemonte, Apulia and Veneto) the number of EETs has increased, whereas in other regions (Latium, Emilia, Campania) such increase is more limited despite the increased number of authorized operators.
Figure 15: Total EETs per region
0
200,000
400,000
600,000
800,000
1,000,000
1,200,000
1,400,000
1,600,000
1,800,000
The
Abru
zzi
The
Aost
a Va
lley
Apul
ia
Basil
icat
a
Cala
bria
Cam
pani
a
Emili
a
Friu
li
Latiu
m
Ligu
ria
Lom
bard
y
The
Mar
ches
Mol
ise
Piem
onte
Sard
inia
Sici
ly
Tren
tino
Tusc
any
Umbr
ia
Vene
to
2005-2009 2005-2010 2005-2011

RAEE 2010 – Executive Summary
26
Expected Effects of the Interventions Planned in the ERDF Operational Programmes on Energy Efficiency and Saving11
Italy provided a significant share of resources for renewable energy and energy saving. The overall financial allocation provided for ex ante by the ERDF Operational Programme is 8% within the Convergence Target regions and 12% for those within the Regional Competitiveness and Employment target.
In renewable energy sources, energy efficiency, transport and waste sectors, for the period 2007-2013, the overall EU and national resources provided for are a little more than 13 million euro.
The interventions provided for in the QSN 2007-2013 ERDF Operational Programmes are expected to avoid the emission of ca. 10 Mt CO2 eq. per year by 2020, 6.7 Mt CO2 eq. of which for renewable sources and 1.5 Mt CO2 eq. for energy saving.
The total decrease of final consumption achievable in the seven intervention areas analyzed is 447 ktep/p.a.
The distribution of savings per intervention area (Figure 16) shows that ca. 90% of the overall saving is from interventions in the following four areas: “SMEs energy efficiency - heating” (39%), “requalification of residential and tourist buildings” (19%), “energy efficiency - Electricity” (17%) and “cogeneration” (14%).
11 Ref: QSN 2007-2013, Valutazione dell’impatto potenziale dei programmi operativi FESR sulla
riduzione delle emissioni di gas serra, ENEA 2010 (Assessment of the potential impact of the ERDF Operational Programmes on greenhouse gas emission reduction).

RAEE 2010 – Executive Summary
27
Figure 16: Decrease of final consumptions per intervention area (ktep/p.a.)
0 5 10 15 20
Piemonte
The Aosta Valley
Lombardy
Liguria
Trento
Veneto
Friuli Venezia Giulia
Emilia-Romagna
Tuscany
Umbria
The Marches
Latium
Abruzzo
Molise
Campania
Apulia
Basilicata
Calabria
Sicily
Sardinia
Cogeneration
SMEs’ Energy Efficiency –heating
SMEs’ Energy Efficiency –Electricity
Requalification of residential and tourist buildings
Requalification of public buildings and schools
EE interventions –Public lighting
EE-renovation of public buildings

RAEE 2010 – Executive Summary
Edited by ENEA Communication Service
Lungotevere Thaon di Revel, 76 – 00196 Rome www.enea.it
Editorial Review: Antonino Dattola
Translation: Carla Costigliola Cover: Marco D’Andrea
Printed at Laboratorio Tecnografico ENEA – Frascati Printed in March 2012


![Food security and nutrition: building a global narrative ... · EXECUTIVE SUMMARY EXECUTIVE SUMMARY EXECUTIVE SUMMARY EXECUTIVE SUMMAR Y [ 2 ] This document contains the Summary and](https://img.pdfslide.us/doc/110x75/5ff5433612d22125fb06e6b5/food-security-and-nutrition-building-a-global-narrative-executive-summary-executive.jpg)

![Physiological artifacts in scalp EEG and ear-EEG · eear-EEGwererecordedfrompassivesilverelectrodesembeddedonthesurface ofcustommadeearpiecesasdescribedbyLooneyetal.[5].eear-EEGelectrodelabel](https://img.pdfslide.us/doc/110x75/5be4759d09d3f2f4628cb7a3/physiological-artifacts-in-scalp-eeg-and-ear-eeg-eear-eegwererecordedfrompassivesilverelectrodesembeddedonthesurface.jpg)