Embed Size (px)
Citation preview

1-1
EE/Ae 157a
Introduction to the Physics of
Remote Sensing
Instructor: Dr. Jakob J. van Zyl
e-mail: [email protected]

1-2

1-3
Transmission Spectrum Of Earth’s Atmosphere

1-4
Types Of Remote Sensing Data

1-5
SPECTRAL SIGNATURES OF VEGETATION

1-6
Lava Flow and Impact Crater on Mars

1-7
IKONOS Image of Sydney, Australia

1-8
Mars Orbiter Camera Images of Gullies on Mars

1-9
Gullies on Mars

1-10
HIRISE Image of Shalbatana Vallis (Mars)

1-11
Water Ice on Mars

1-12
ASTER Images of Lago di Garda, Italy

1-13
ASTER Image of Lago di Garda, Italy

1-14
Visible (Left) and Short-Wave Infrared (Right) Images of
Escondida Mine, Chile

1-15
Visible (left) and SWIR (right) Images of Saline Valley,
California

1-16
Visible (left) and TIR (right) Images of Saline Valley, California

1-17
Visible (left) and SWIR (Right) ASTER Images of a Forest Fire

1-18
Hubble and Spitzer Images of Distant Galaxy

1-19
Thermal Images of Erupting Lava on Hawaii

1-20
Galileo Image of Erupting Lava on Io

1-21
Radar Image of Canberra, Australia

1-22
Radar Responses of Sub-Canopy Flooding

1-23
Comparison of Microwave(right) and Visible (left) Imaging

1-24
Visible (Top) and Microwave (Bottom) Images of the Nile

1-25
Radar Images of Seasonal Changes in Patagonia

1-26
Radar Image: Bahia, Brazil

1-27
Shaded Relief: Bahia, Brazil

1-28

1-29
Radar Interferometry Example: Los Angeles, California

1-30
Topography of France Derived from Radar Interferometry

1-31
Differential Interferometry
June 28, 1992, M 7.3, Landers, California Earthquake

1-32
Differential Interferometry
Example: 1995 North Sakhalin Earthquake (M 7.6)
Reference: Tobita, et al., Earth Planets Space, 50, 1998
Radar
Differential
Interferogram
Deformation Model
Predictions
1-33
Differential Interferometry Example: Glacier Movement
Reference:Joughin et al., Science, 1996
1-34
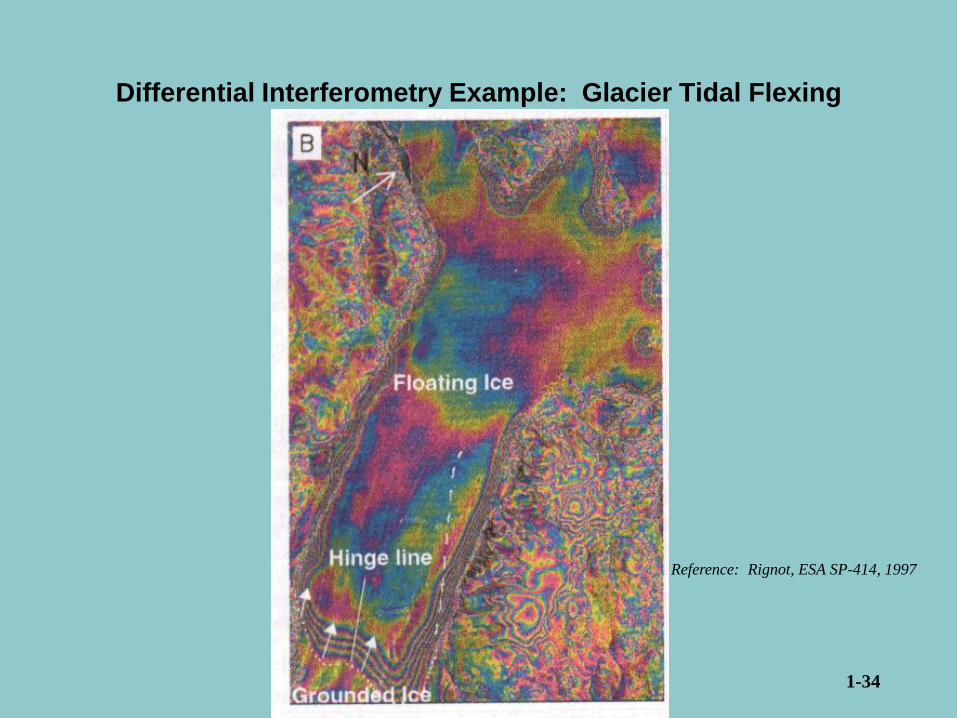
Differential Interferometry Example: Glacier Tidal Flexing
Reference: Rignot, ESA SP-414, 1997
1-35
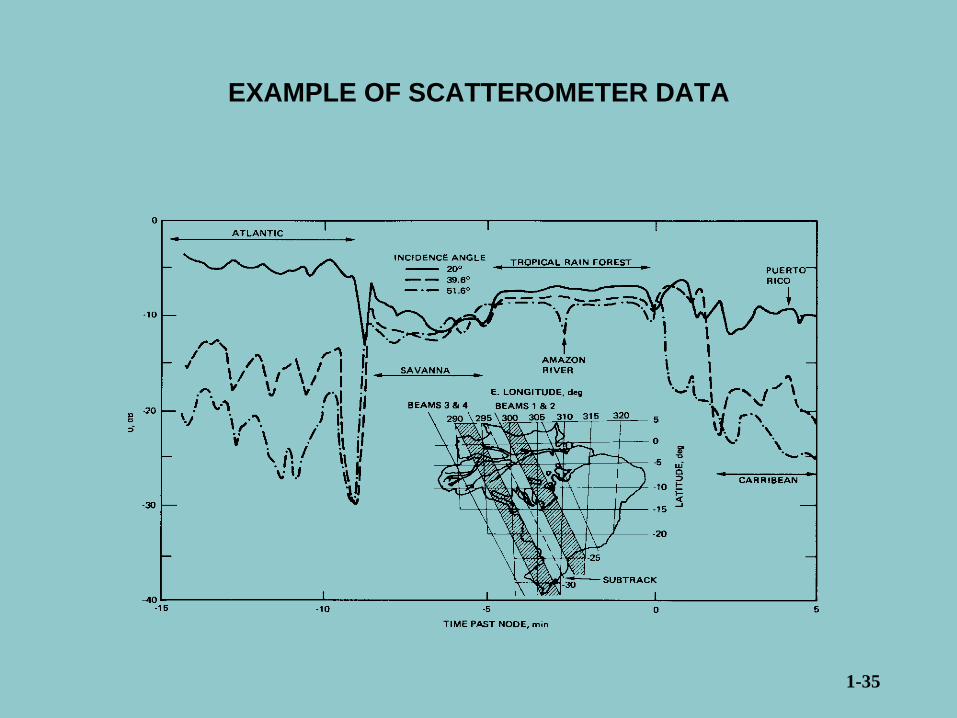
EXAMPLE OF SCATTEROMETER DATA

1-36
NSCAT data of typhoon (speed and direction)
near Japan. The cloud imagery is from the infrared
channel of the GMS-5 Japanese meteorological satellite.
NSCAT data of the Amazon rainforest in South
America.
Blue & Purple: tropical rain forest
Green & Yellow: woodland and savanna
NSCAT (NASA Scatterometer) Data Examples

1-37
QuikScat Data Examples

1-38
QuikScat Seasonal Response
1-39
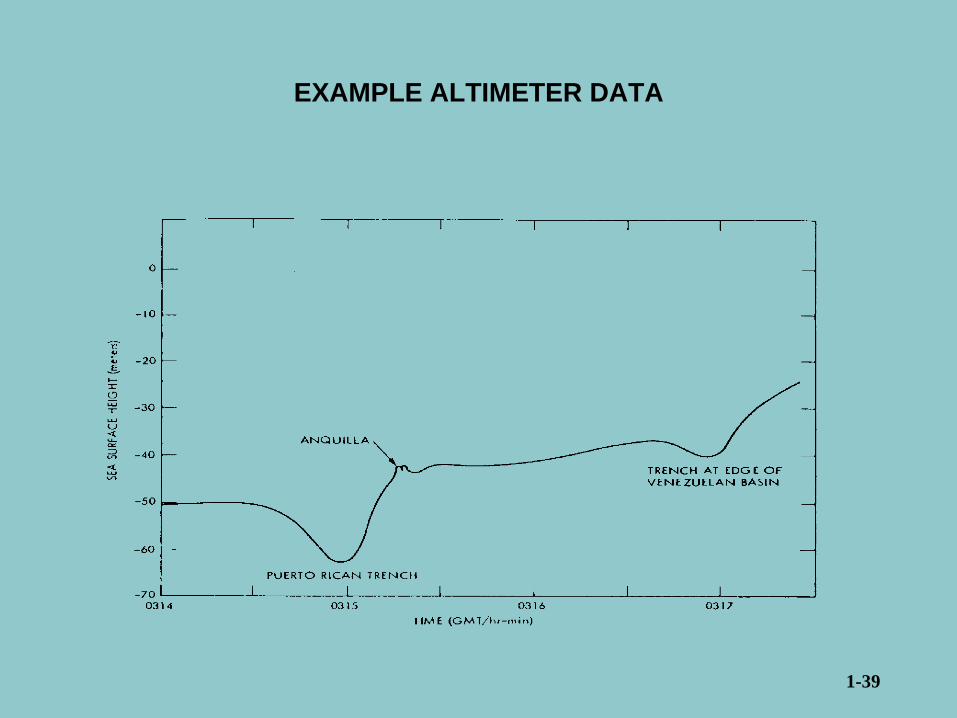
EXAMPLE ALTIMETER DATA

1-40
Products Derived from Satellite Altimetry
Ocean Topography Wave Height
Water Vapor Total Electron Content

1-41
Ocean Topography from Satellite Altimetry

1-42
Hurricane Isabel meets North Carolina

1-43
Mars Orbiter Laser Altimeter Products
Elevation

1-44
EXAMPLE OF SOUNDER DATA

1-45
Mars Polar Cap

1-46
Buried Glaciers on Mars

1-47
Galileo Image of Conamara Chaos on Europa

1-48
TYPES OF REMOTE SENSING DATA
TYPE OF INFORMATION TYPE OF SENSOR
High Spatial Resolution and WideCoverage
Imaging Sensors; Cameras
High Spectral Resolution Spectrometers;Spectroradiometers
Limited Spectral Resolution and HighSpatial Resolution
Multispectral Mappers
High Spatial and Spectral Resolution Imaging Spectrometers
High Accuracy Intensity Measurement Radiometers; Scatterometers
High Accuracy Intensity Measurementwith Moderate Spatial Resolution
Imaging Radiometers
High Accuracy Measurement of Profile Altimeters; Sounders
Three-dimensional TopographicMapping
Scanning Altimeters; StereoImaging; Radar Interferometry