Embed Size (px)
Citation preview

EE/Ge 157 b, Week 3 3 - 1
EE/Ae 157 b
Interferometric Synthetic Aperture Radar

EE/Ge 157 b, Week 3 3 - 2
PRINCIPLES OF IMAGING RADARCHARACTERISTICS OF RADAR WAVES
• The propagation of radar waves are governed by Maxwell’s equations. From these
equations, one can derive the so-called free-space wave equation:
• The solution to this free-space wave equation is of the form:
• There are three parameters in this wave solution that we commonly exploit in radar
remote sensing:
– Amplitude and polarization provides information about scattering properties and
structure
– Frequency diversity allows us to learn more about the size of scatterers
– Phase information is used in interferometry to reconstruct three-dimensional
topography, as well as small changes to topography
2E
2
cr2 E 0
E Aei kr t

EE/Ge 157 b, Week 3 3 - 3
PRINCIPLES OF IMAGING RADAR TYPES OF IMAGING RADARS
Structural Information
Polarimeter
Elevation Information
Interferometer
Spectral Information
Spectrometers
Spatial Information
Imaging Radar
Polarimetric
Interferometer

EE/Ge 157 b, Week 3 3 - 4
RADAR INTERFEROMETRYHOW DOES IT WORK?
RADAR
Return could be
from anywhere
on this circle
B
A1
A2
Antenna 1
Antenna 2
Return comes from
intersection
SINGLE ANTENNA SAR INTERFEROMETRIC SAR
EE/Ge 157 b, Week 3 3 - 5
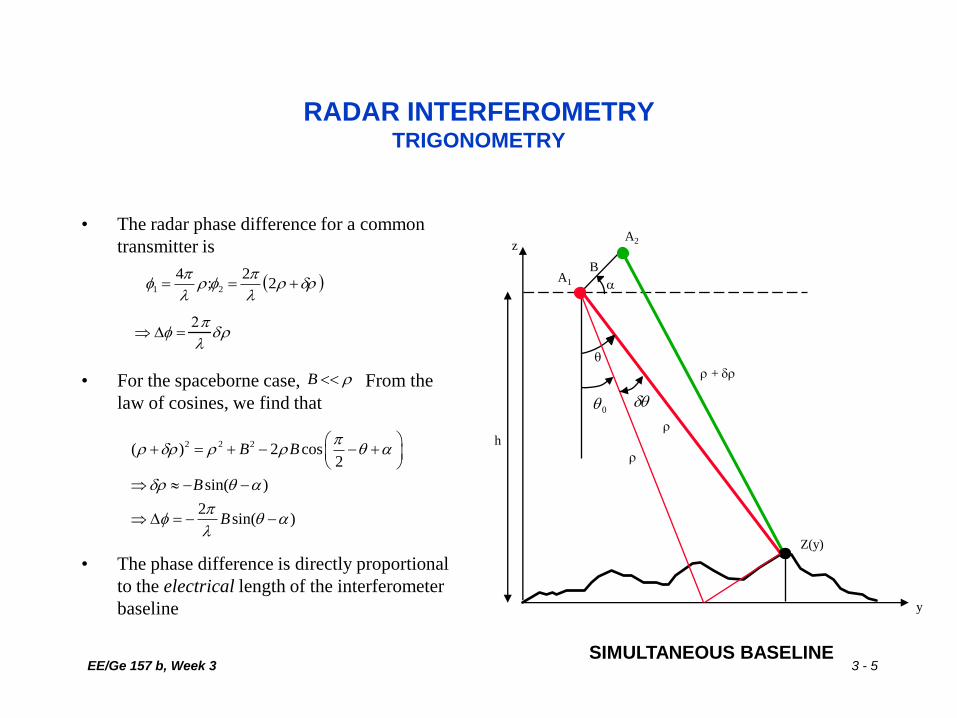
RADAR INTERFEROMETRYTRIGONOMETRY
• The radar phase difference for a common
transmitter is
• For the spaceborne case, From the
law of cosines, we find that
• The phase difference is directly proportional
to the electrical length of the interferometer
baseline
SIMULTANEOUS BASELINE
2
2;
421
2
A2
B
z
A1
+
h
Z(y)
y
0
B
2 2 2( ) 2 cos2
sin( )
2sin( )
B B
B
B
EE/Ge 157 b, Week 3 3 - 6
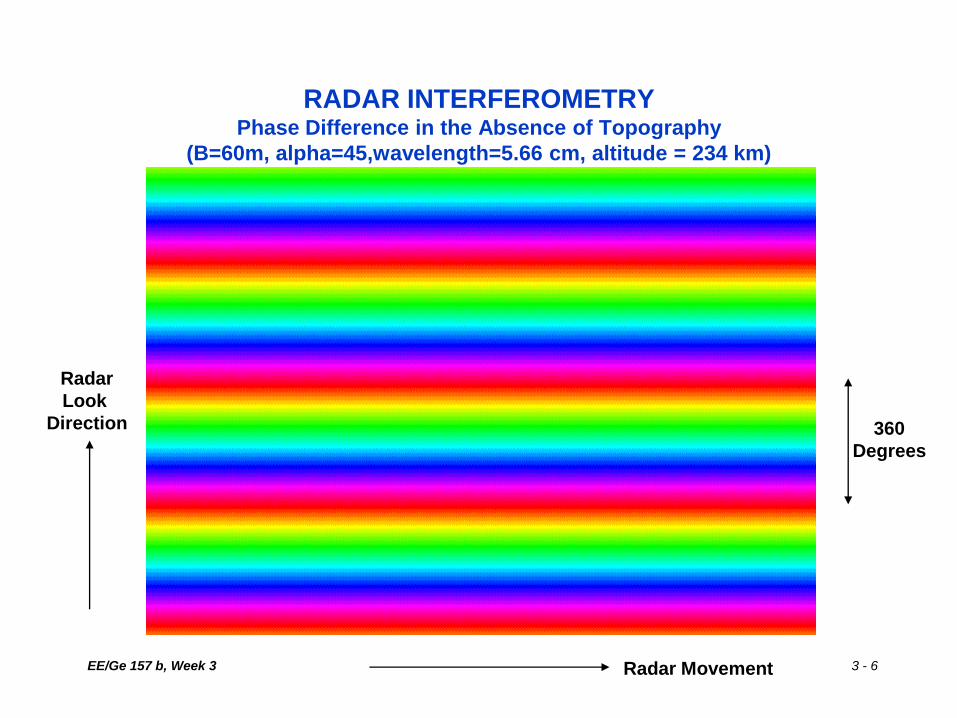
RADAR INTERFEROMETRYPhase Difference in the Absence of Topography
(B=60m, alpha=45,wavelength=5.66 cm, altitude = 234 km)
Radar Movement
Radar
Look
Direction 360
Degrees

EE/Ge 157 b, Week 3 3 - 7
RADAR INTERFEROMETRYPhase Difference is a function of the ELECTRICAL Length of the Baseline
(B=60m, alpha=45, altitude = 234 km)
Wavelength = 5.66 cm Wavelength = 24 cm

EE/Ge 157 b, Week 3 3 - 8
RADAR INTERFEROMETRYExample: Mt. Shasta, California

EE/Ge 157 b, Week 3 3 - 9
RADAR INTERFEROMETRY
Mt Shasta Phase Difference
(B=60m, alpha=45,wavelength=5.66 cm, altitude = 234 km)
Radar Movement
Radar
Look
Direction
EE/Ge 157 b, Week 3 3 - 10
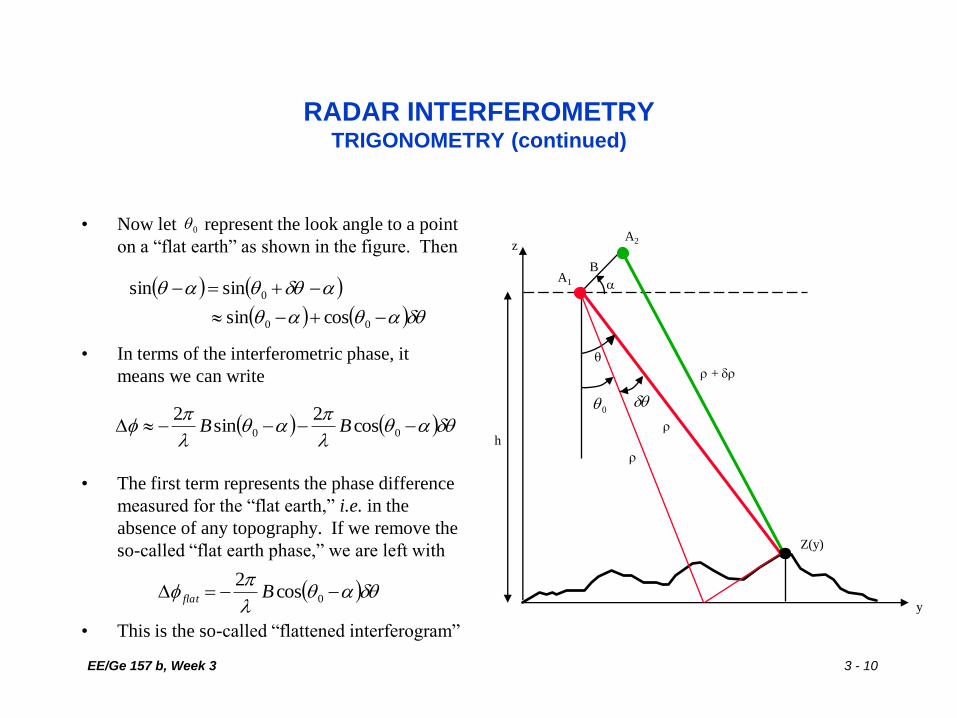
RADAR INTERFEROMETRYTRIGONOMETRY (continued)
• Now let represent the look angle to a point
on a “flat earth” as shown in the figure. Then
• In terms of the interferometric phase, it
means we can write
• The first term represents the phase difference
measured for the “flat earth,” i.e. in the
absence of any topography. If we remove the
so-called “flat earth phase,” we are left with
• This is the so-called “flattened interferogram”
A2
B
z
A1
+
h
Z(y)
y
0
0cos
2Bflat
0
00
0
cossin
sinsin
00 cos
2sin
2BB

EE/Ge 157 b, Week 3 3 - 11
RADAR INTERFEROMETRY
Mt Shasta Flattened Interferogram
(B=60m, alpha=45,wavelength=5.66 cm, altitude = 234 km)

EE/Ge 157 b, Week 3 3 - 12
RADAR INTERFEROMETRYSENSITIVITY TO TOPOGRAPHY
• The elevation of the image point is found
from
• The so-called ambiguity height is the
elevation change required to change the
flattened phase difference by one cycle
• A small ambiguity height means good
sensitivity to topography
• If the elevation is the scene varies by
more than the ambiguity height, the phase
will be “wrapped”, since we only
measure phase modulo 360 degrees.
A2
B
z
A1
+
h
Z(y)
y
0
0sin
yz
0
0
cos
sin
Bha
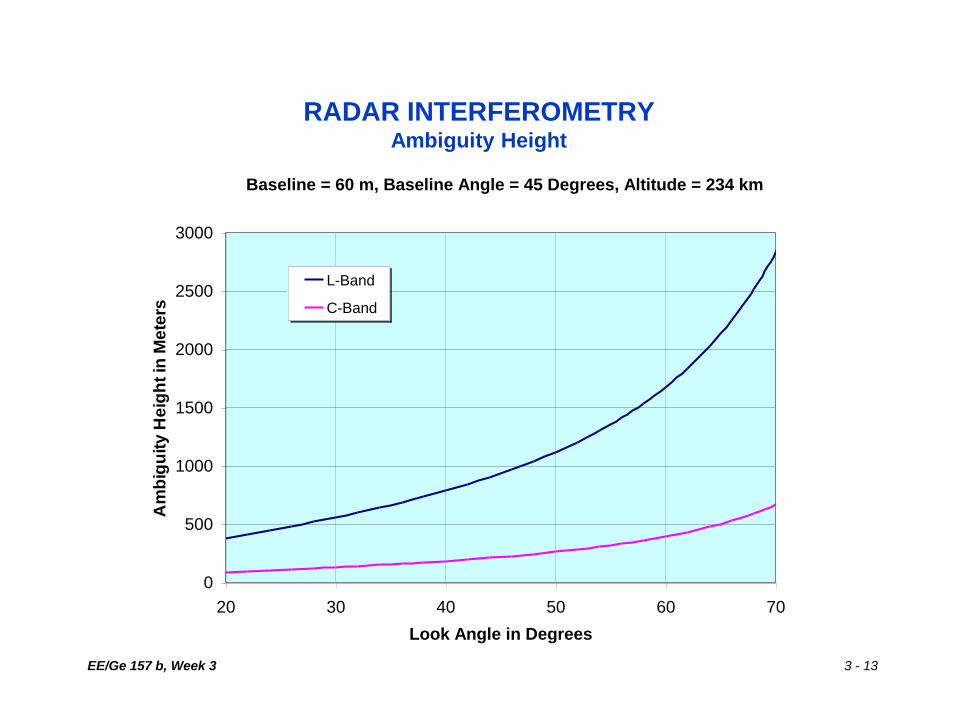
EE/Ge 157 b, Week 3 3 - 13
RADAR INTERFEROMETRYAmbiguity Height
Baseline = 60 m, Baseline Angle = 45 Degrees, Altitude = 234 km
0
500
1000
1500
2000
2500
3000
20 30 40 50 60 70
Look Angle in Degrees
Am
big
uit
y H
eig
ht
in M
ete
rs
L-Band
C-Band
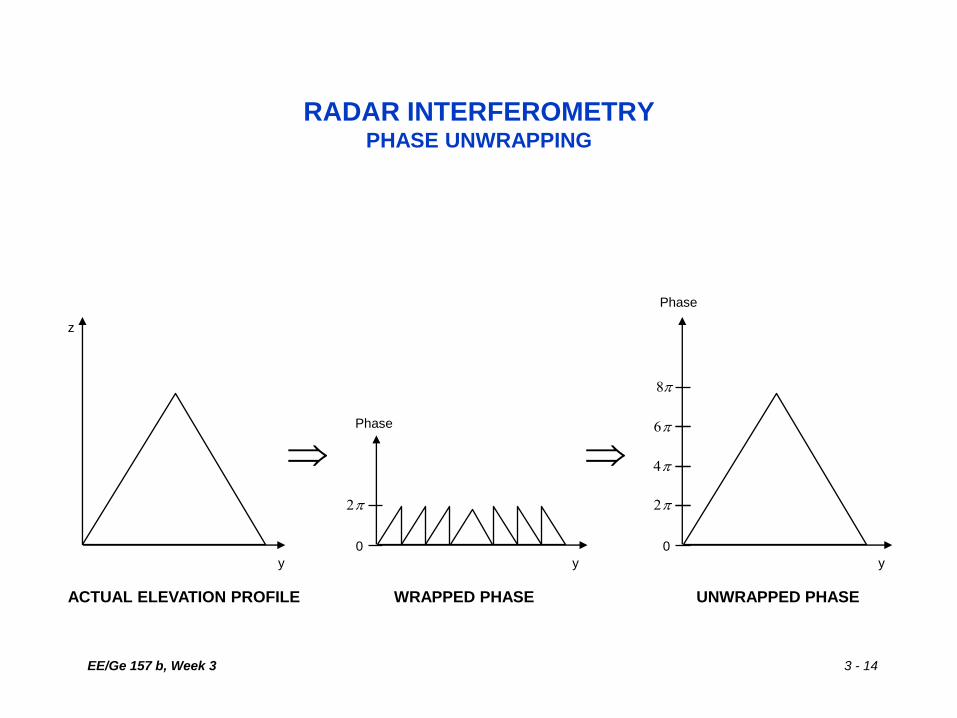
EE/Ge 157 b, Week 3 3 - 14
RADAR INTERFEROMETRYPHASE UNWRAPPING
z
y
ACTUAL ELEVATION PROFILE
y
Phase
0
2
WRAPPED PHASE
y
Phase
0
2
4
6
8
UNWRAPPED PHASE

EE/Ge 157 b, Week 3 3 - 15
RADAR INTERFEROMETRYAmbiguity Height & Phase Wrapping
Wavelength = 5.66 cm Wavelength = 24 cm
Relief exceeds ambiguity height,
resulting in wrapped phases
Relief does not exceed ambiguity height;
Phase is not wrapped
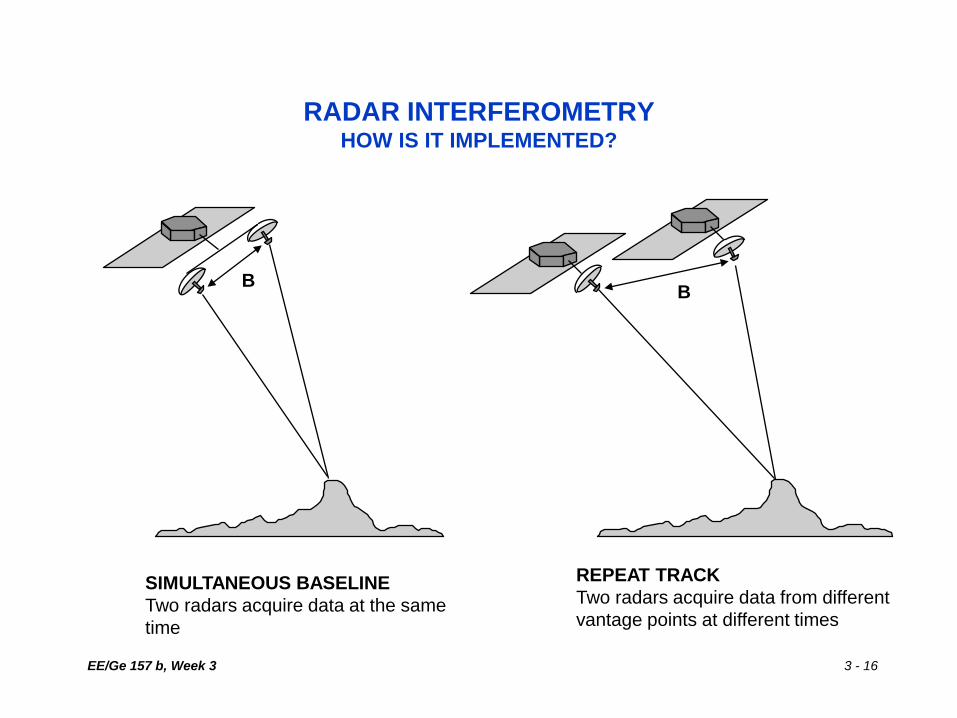
EE/Ge 157 b, Week 3 3 - 16
RADAR INTERFEROMETRYHOW IS IT IMPLEMENTED?
BB
SIMULTANEOUS BASELINE
Two radars acquire data at the same
time
REPEAT TRACK
Two radars acquire data from different
vantage points at different times

EE/Ge 157 b, Week 3 3 - 17
RADAR INTERFEROMETRYCOMPARISON OF TECHNIQUES
IMPLEMENTATION ADVANTAGES DISADVANTAGES
Simultaneous Baseline • Known baseline • Difficult to get adequatebaseline in space
• No temporal decorrelation • High data rate from tworadars
• Typically better performance • Typically higher cost
Repeat Track • Lower data rate from oneradar
• Temporal decorrelation
• Lower cost • Baseline not well known andmay be changing
• Depending on orbit, anybaseline can be realized

EE/Ge 157 b, Week 3 3 - 18
Range S phere
Doppler Cone
VelocityVector
Phase Cone
AircraftPosition
BaselineVector
S catterer is at intersection of RangeS phere, Doppler Cone and Phase
Cone
INTERFEROMETRIC SAR PROCESSING GEOMETRY

EE/Ge 157 b, Week 3 3 - 19

EE/Ge 157 b, Week 3 3 - 20
PRINCIPLES OF IMAGING RADARSAR IMAGE PROJECTION
A three-dimensional image is projectedonto a two-dimensional plane, causingcharacteristic image distortions:
• b’ appears closer than a’ in radar imageLAYOVER
• d’ and e’ are closer together in radarimage
FORESHORTENING
• h to i not illuminated by the radarRADAR SHADOW
a c d f g i
be
b’a’
c’d’
e’
g’h’
i’
f’
Radar Image Plane
h

EE/Ge 157 b, Week 3 3 - 21
RADAR INTERFEROMETRYEXAMPLE: TOPSAR DATA

EE/Ge 157 b, Week 3 3 - 22
RADAR INTERFEROMETRYIS IT POSSIBLE TO USE THE SPACE SHUTTLE TO MAP THE EARTH? (1994)
• With the weight of a typical radar payload,
the shuttle can be launched into an orbit
with 57 degrees inclination, and altitude <=
250 km. The typical time available for
mapping is <= 10 days
• There is a 10 day repeat orbit with altitude
234 km, giving 159 orbits in 10 days
• The required swath width at 57 degrees
inclination would be 211 km
• Using the SIR-C hardware in a “scanSAR”
mode, we can record a 225 km swath,
providing 7 km overlap at each side
Equator
Swath
57 o

EE/Ge 157 b, Week 3 3 - 23
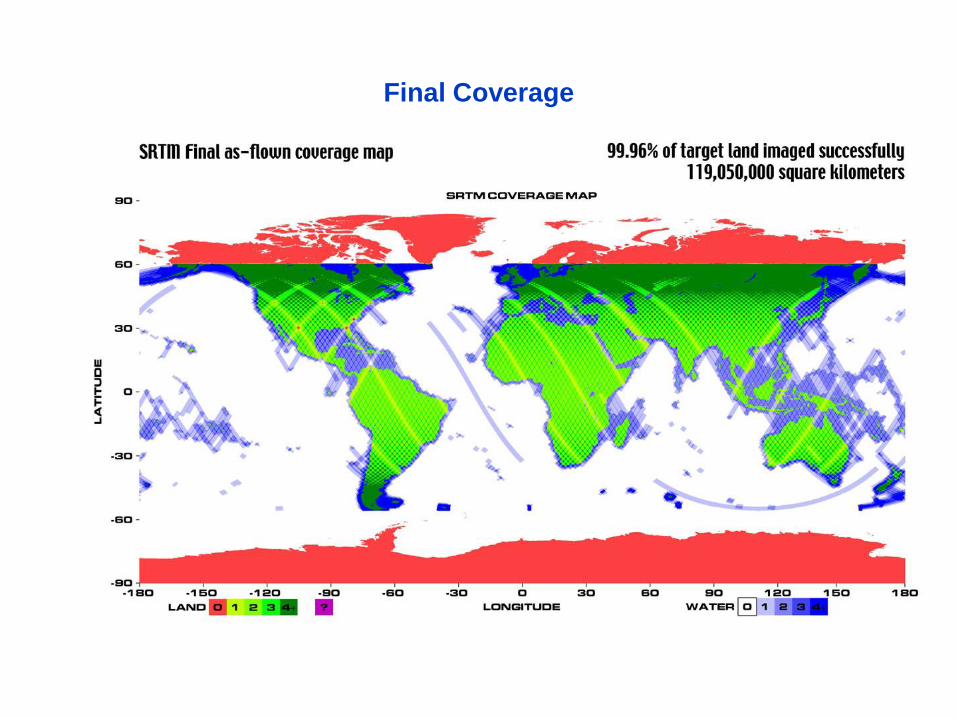
Shuttle Radar Topography Mission Objectives
• Acquire a C-band radar interferometric data set sufficient for the production of digital
topographic of the Earth’s landmass accessible from a 57° inclination orbit.
• Acquire ancillary data (position, attitude, radar performance and calibration) sufficient
to allow processing the C-band data set into data products meeting the following
specifications
– 1 arcsecond posting (~ 30 m)
– 16 m absolute height accuracy
– 10 m relative height accuracy
• Generate terrain-corrected georeferenced image products coincident with the acquired
digital elevation data set.
• SRTM is a cooperative project of the NASA and NIMA in the U.S.A., and the DLR in
Germany. The Italian Space Agency is cooperating with DLR by contributing flight
hardware previously flown in 1994, and by participating in data processing.

EE/Ge 157 b, Week 3 3 - 24
The Mast

EE/Ge 157 b, Week 3 3 - 25
SRTM Hardware lowered into Payload Bay
EE/Ge 157 b, Week 3 3 - 26
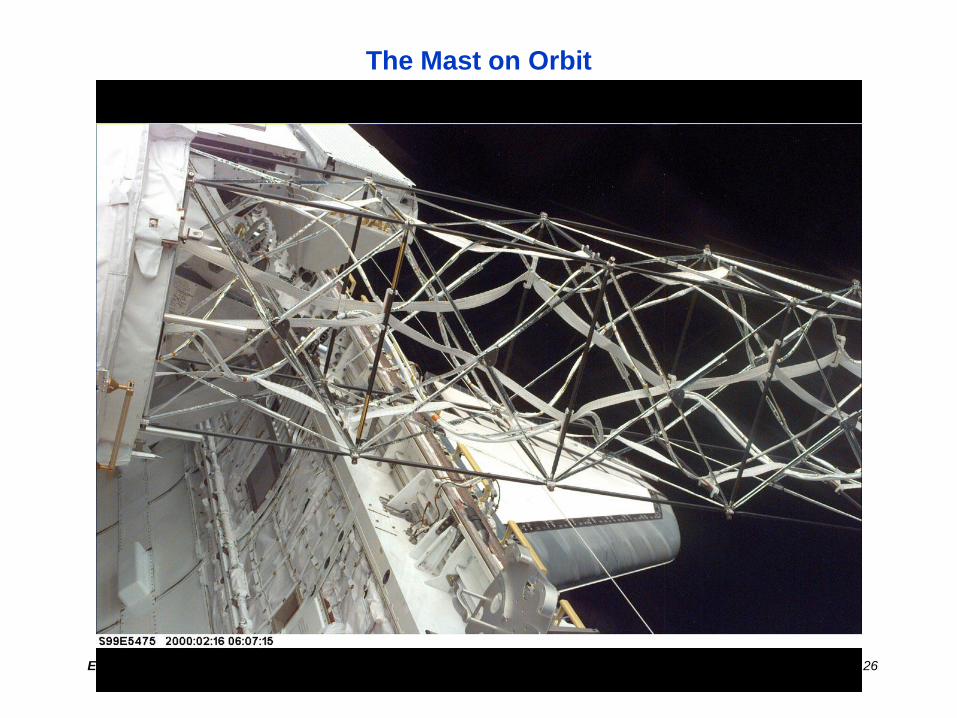
The Mast on Orbit

EE/Ge 157 b, Week 3 3 - 27
The Mast on Orbit
EE/Ge 157 b, Week 3 3 - 28
Final Coverage

EE/Ge 157 b, Week 3 3 - 29
Radar Image: Bahia, Brazil
EE/Ge 157 b, Week 3 3 - 30
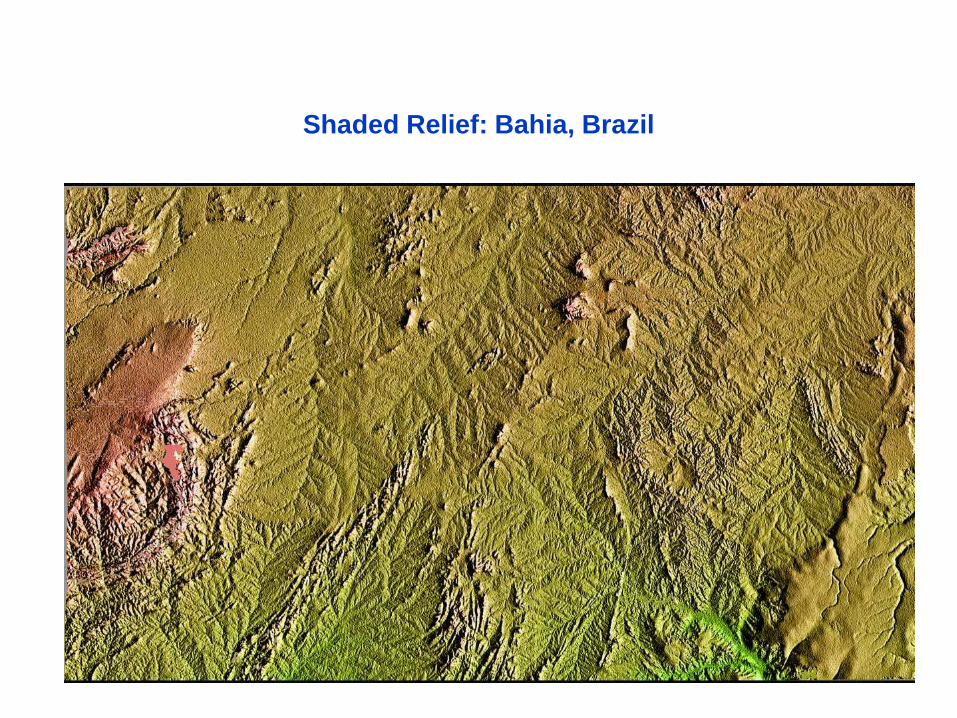
Shaded Relief: Bahia, Brazil
EE/Ge 157 b, Week 3 3 - 31
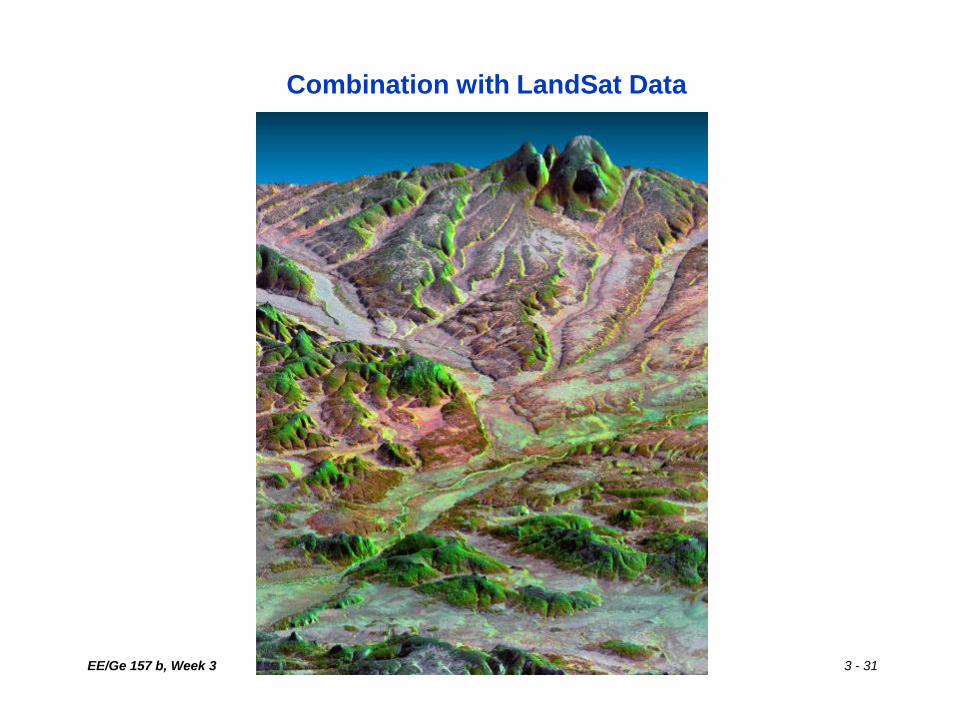
Combination with LandSat Data
EE/Ge 157 b, Week 3 3 - 32
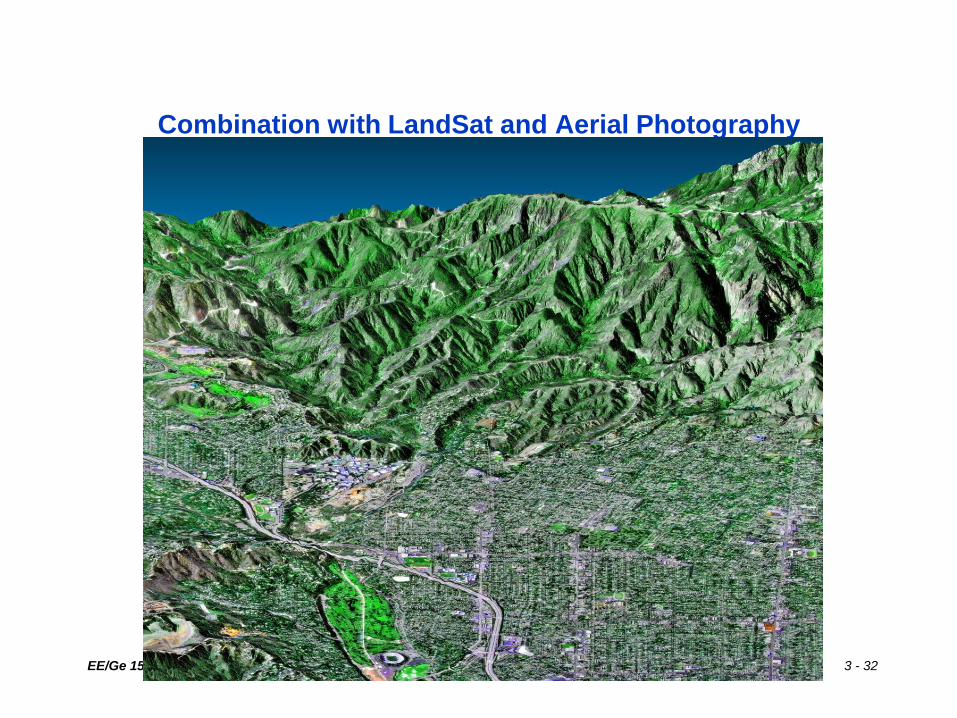
Combination with LandSat and Aerial Photography
EE/Ge 157 b, Week 3 3 - 33
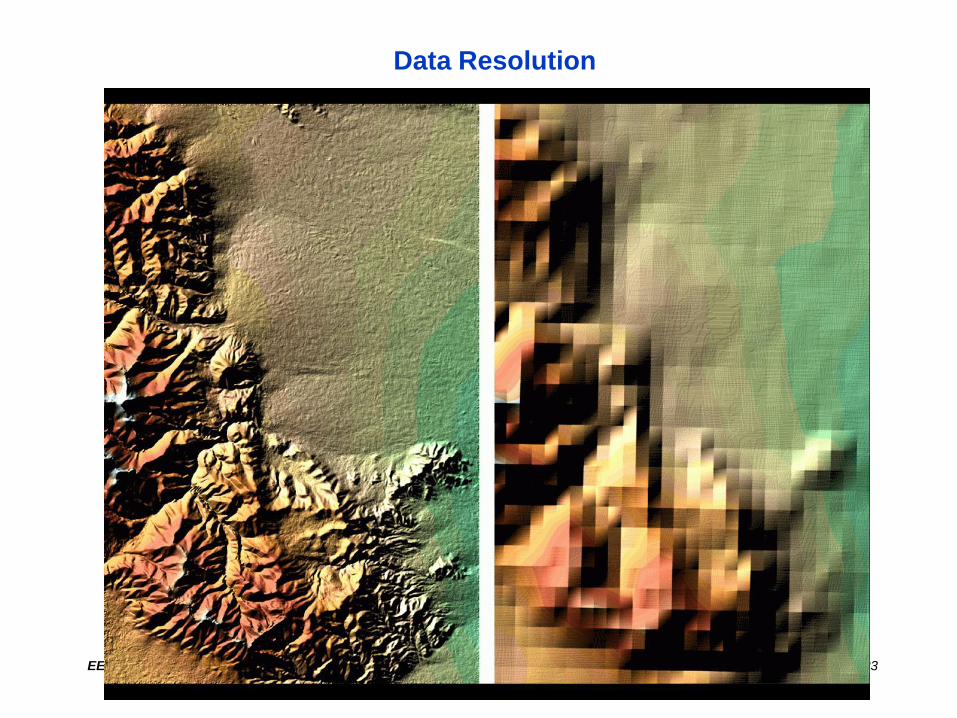
Data Resolution

EE/Ge 157 b, Week 3 3 - 34
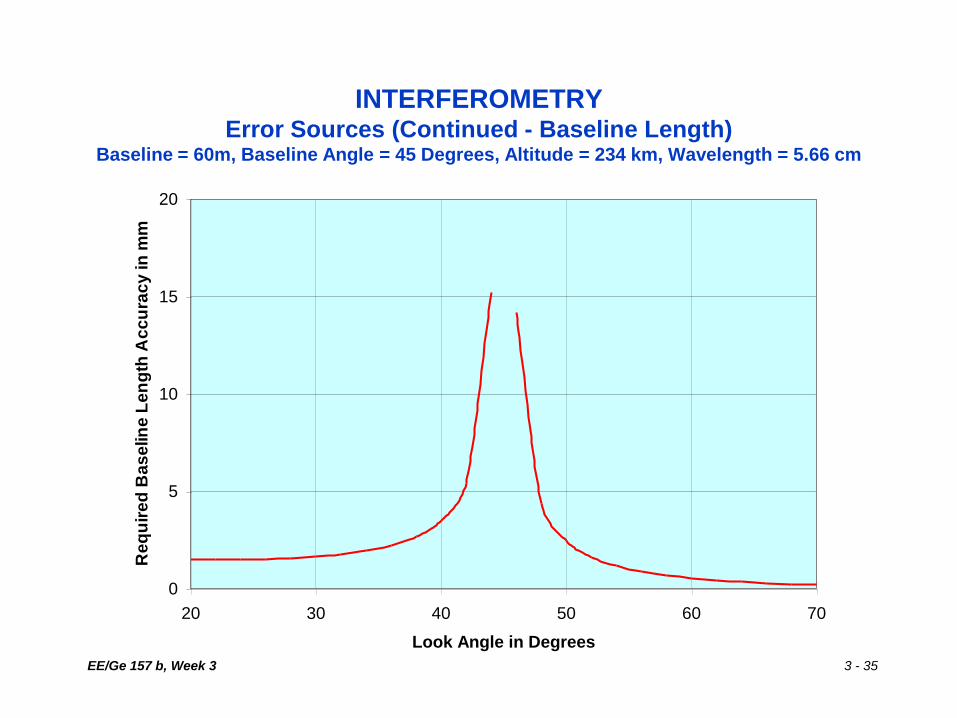
INTERFEROMETRY
Error Sources
• From the trigonometry, we see that the elevation of the point is given by
• The accuracy with which we can measure the elevation depends on how well we
measure the position of the radar platform (h), the radar slant range and the angle .
• The angle is derived from the measurement of the interferometric radar phase.
Therefore, the accuracy of the elevation is also influenced by how accurately we
measure the interferometric radar phase (,the baseline length (B) and orientation
angle , and the radar wavelength (.
• The general expression for the elevation error is derived by adding the errors
• The measurement uncertainty is taken into account through the terms
cos hyz
2
2
2
2
2
2
2
2
2
2
2
2
2
BhzB
zzzzz
h
z
i
SNR
1
EE/Ge 157 b, Week 3 3 - 35
INTERFEROMETRYError Sources (Continued - Baseline Length)
Baseline = 60m, Baseline Angle = 45 Degrees, Altitude = 234 km, Wavelength = 5.66 cm
0
5
10
15
20
20 30 40 50 60 70
Look Angle in Degrees
Re
qu
ire
d B
as
elin
e L
en
gth
Ac
cu
rac
y in
mm
EE/Ge 157 b, Week 3 3 - 36
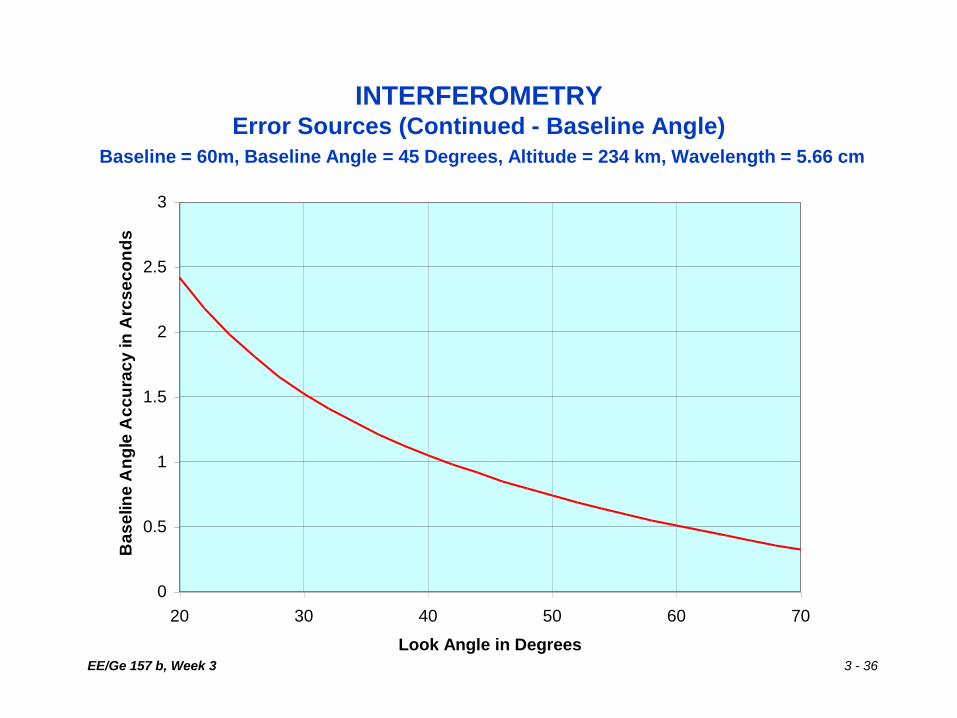
INTERFEROMETRYError Sources (Continued - Baseline Angle)
Baseline = 60m, Baseline Angle = 45 Degrees, Altitude = 234 km, Wavelength = 5.66 cm
0
0.5
1
1.5
2
2.5
3
20 30 40 50 60 70
Look Angle in Degrees
Ba
se
lin
e A
ng
le A
cc
ura
cy
in
Arc
se
co
nd
s

EE/Ge 157 b, Week 3 3 - 37
INTERFEROMETRYError Sources (Continued - Signal-to-noise ratio)
Baseline = 60m, Baseline Angle = 45 Degrees, Altitude = 234 km, Wavelength = 5.66 cm
20
25
30
35
40
45
20 30 40 50 60 70
Look Angle in Degrees
Re
qu
ire
de
Sig
nla
-to
-No
ise
Ra
tio
in
dB

![DRAGON'S LAIR G e n e v i e v e D i d i o n K - 8 M a y 2 ... · upcoming events ee]a ee]a a ee]a a ee]a ee]a a a ee]a ee]a ee]a ee]a ee]a ee]a ee]a ee]a ee]a dragon's lair g e n](https://img.pdfslide.us/doc/110x75/5edb079c09ac2c67fa68b1f0/dragons-lair-g-e-n-e-v-i-e-v-e-d-i-d-i-o-n-k-8-m-a-y-2-upcoming-events-eea.jpg)