Embed Size (px)
Citation preview
EE 368: IMAGE PROCESSING PROJECT JUNE 2011 1
Key-word Guided Word Spotting In Printed TextVinay Raj Hampapur, Tahrina Rumu, Umit Yoruk
Abstract—Optical character recognition (OCR) is an openproblem and continues to be a challenging problem in academia.In this paper, we proposed and implemented a text detec-tion framework which could be run on mobile platforms. Weevaluated two methods - Segmentation by dilation and SmartSegmentation - that would effectively isolate text at differentdistances. We then evaluated three methods namely Correlation,Shape Context and Harris Corner that would discern betweentext using the user defined text to synthetically generated corre-sponding template. It was found that Shape Context and HarrisCorner methods effectively discern between words and that onlyHarris Corner in conjunction with profiling, owing to its fastcomputation speed, was suited for mobile platform use.
Index Terms—Text identification, segmentation, harris corners,corelation, dilation, bounding box, connected regions
I. INTRODUCTION
TEXT Recognition is usually carried out via OpticalCharacter Recognition(OCR) [2]. In this paper, we treat
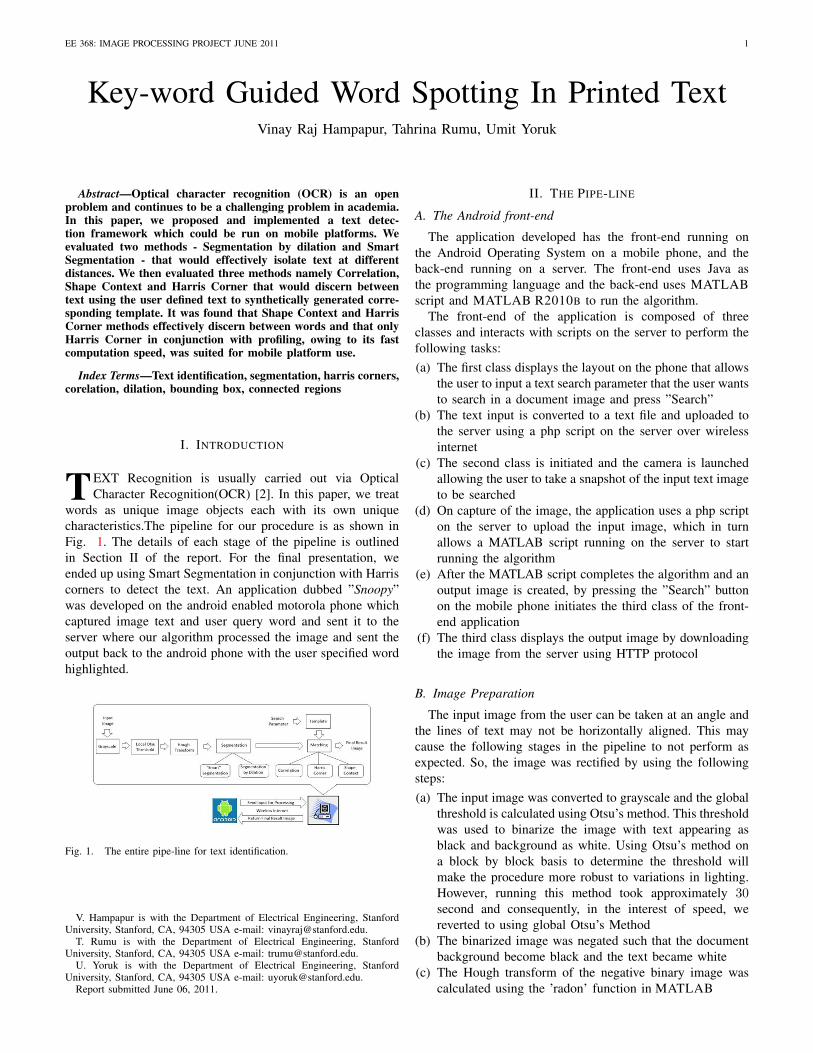
words as unique image objects each with its own uniquecharacteristics.The pipeline for our procedure is as shown inFig. 1. The details of each stage of the pipeline is outlinedin Section II of the report. For the final presentation, weended up using Smart Segmentation in conjunction with Harriscorners to detect the text. An application dubbed ”Snoopy”was developed on the android enabled motorola phone whichcaptured image text and user query word and sent it to theserver where our algorithm processed the image and sent theoutput back to the android phone with the user specified wordhighlighted.
Fig. 1. The entire pipe-line for text identification.
V. Hampapur is with the Department of Electrical Engineering, StanfordUniversity, Stanford, CA, 94305 USA e-mail: [email protected].
T. Rumu is with the Department of Electrical Engineering, StanfordUniversity, Stanford, CA, 94305 USA e-mail: [email protected].
U. Yoruk is with the Department of Electrical Engineering, StanfordUniversity, Stanford, CA, 94305 USA e-mail: [email protected].
Report submitted June 06, 2011.
II. THE PIPE-LINE
A. The Android front-end
The application developed has the front-end running onthe Android Operating System on a mobile phone, and theback-end running on a server. The front-end uses Java asthe programming language and the back-end uses MATLABscript and MATLAB R2010B to run the algorithm.
The front-end of the application is composed of threeclasses and interacts with scripts on the server to perform thefollowing tasks:(a) The first class displays the layout on the phone that allows
the user to input a text search parameter that the user wantsto search in a document image and press ”Search”
(b) The text input is converted to a text file and uploaded tothe server using a php script on the server over wirelessinternet
(c) The second class is initiated and the camera is launchedallowing the user to take a snapshot of the input text imageto be searched
(d) On capture of the image, the application uses a php scripton the server to upload the input image, which in turnallows a MATLAB script running on the server to startrunning the algorithm
(e) After the MATLAB script completes the algorithm and anoutput image is created, by pressing the ”Search” buttonon the mobile phone initiates the third class of the front-end application
(f) The third class displays the output image by downloadingthe image from the server using HTTP protocol
B. Image Preparation
The input image from the user can be taken at an angle andthe lines of text may not be horizontally aligned. This maycause the following stages in the pipeline to not perform asexpected. So, the image was rectified by using the followingsteps:(a) The input image was converted to grayscale and the global
threshold is calculated using Otsu’s method. This thresholdwas used to binarize the image with text appearing asblack and background as white. Using Otsu’s method ona block by block basis to determine the threshold willmake the procedure more robust to variations in lighting.However, running this method took approximately 30second and consequently, in the interest of speed, wereverted to using global Otsu’s Method
(b) The binarized image was negated such that the documentbackground become black and the text became white
(c) The Hough transform of the negative binary image wascalculated using the ’radon’ function in MATLAB
EE 368: IMAGE PROCESSING PROJECT JUNE 2011 2
(d) The bin (rho, theta) with the max count was found andthe angle, theta, of that bin was found. This angle is thedominant angle that is the angle of rotation of the image
(e) The image was then rotated by this angle dominant anglein the opposite direction, making the text lines horizontal
(f) Since the image size was preserved using the crop at-tribute, the black edges are found and removed by regiondetection
The processed clean and rectified image was then passed onto the next stage of the pipeline.
C. Segmentation
Two methods were evaluated to successfully isolate wordsfrom the text document. The details of those methods areoutlined below:
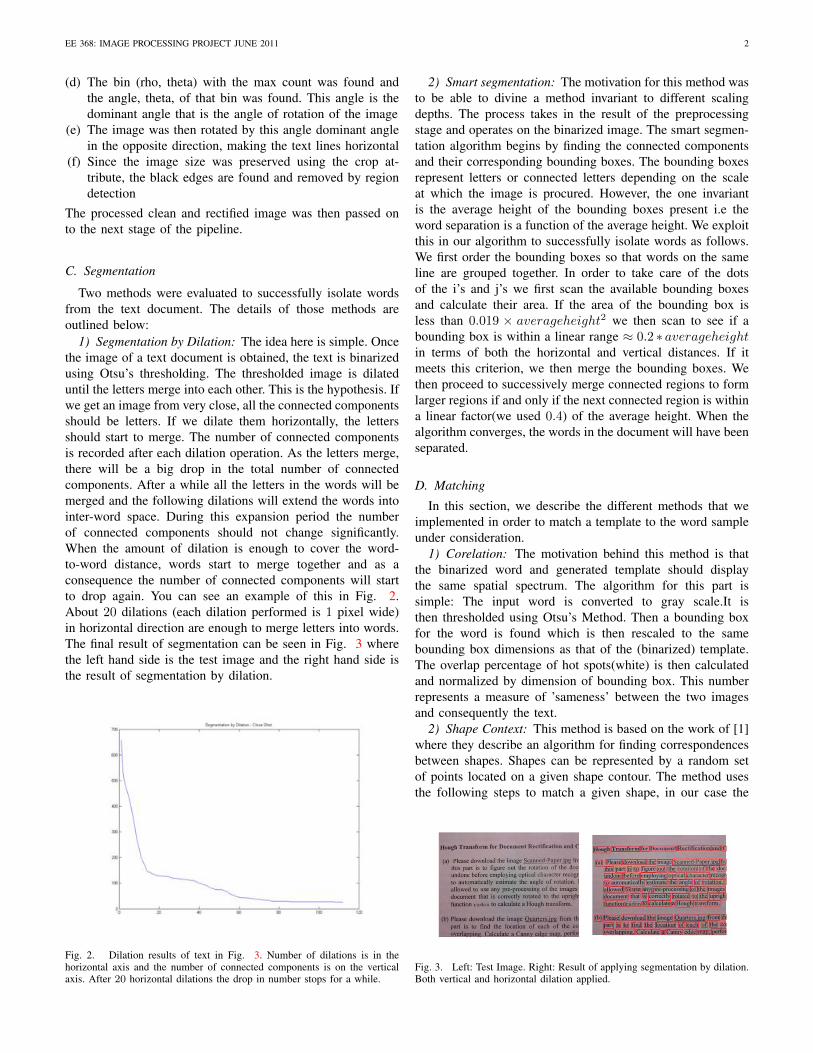
1) Segmentation by Dilation: The idea here is simple. Oncethe image of a text document is obtained, the text is binarizedusing Otsu’s thresholding. The thresholded image is dilateduntil the letters merge into each other. This is the hypothesis. Ifwe get an image from very close, all the connected componentsshould be letters. If we dilate them horizontally, the lettersshould start to merge. The number of connected componentsis recorded after each dilation operation. As the letters merge,there will be a big drop in the total number of connectedcomponents. After a while all the letters in the words will bemerged and the following dilations will extend the words intointer-word space. During this expansion period the numberof connected components should not change significantly.When the amount of dilation is enough to cover the word-to-word distance, words start to merge together and as aconsequence the number of connected components will startto drop again. You can see an example of this in Fig. 2.About 20 dilations (each dilation performed is 1 pixel wide)in horizontal direction are enough to merge letters into words.The final result of segmentation can be seen in Fig. 3 wherethe left hand side is the test image and the right hand side isthe result of segmentation by dilation.
Fig. 2. Dilation results of text in Fig. 3. Number of dilations is in thehorizontal axis and the number of connected components is on the verticalaxis. After 20 horizontal dilations the drop in number stops for a while.
2) Smart segmentation: The motivation for this method wasto be able to divine a method invariant to different scalingdepths. The process takes in the result of the preprocessingstage and operates on the binarized image. The smart segmen-tation algorithm begins by finding the connected componentsand their corresponding bounding boxes. The bounding boxesrepresent letters or connected letters depending on the scaleat which the image is procured. However, the one invariantis the average height of the bounding boxes present i.e theword separation is a function of the average height. We exploitthis in our algorithm to successfully isolate words as follows.We first order the bounding boxes so that words on the sameline are grouped together. In order to take care of the dotsof the i’s and j’s we first scan the available bounding boxesand calculate their area. If the area of the bounding box isless than 0.019 × averageheight2 we then scan to see if abounding box is within a linear range ≈ 0.2 ∗ averageheightin terms of both the horizontal and vertical distances. If itmeets this criterion, we then merge the bounding boxes. Wethen proceed to successively merge connected regions to formlarger regions if and only if the next connected region is withina linear factor(we used 0.4) of the average height. When thealgorithm converges, the words in the document will have beenseparated.
D. Matching
In this section, we describe the different methods that weimplemented in order to match a template to the word sampleunder consideration.
1) Corelation: The motivation behind this method is thatthe binarized word and generated template should displaythe same spatial spectrum. The algorithm for this part issimple: The input word is converted to gray scale.It isthen thresholded using Otsu’s Method. Then a bounding boxfor the word is found which is then rescaled to the samebounding box dimensions as that of the (binarized) template.The overlap percentage of hot spots(white) is then calculatedand normalized by dimension of bounding box. This numberrepresents a measure of ’sameness’ between the two imagesand consequently the text.
2) Shape Context: This method is based on the work of [1]where they describe an algorithm for finding correspondencesbetween shapes. Shapes can be represented by a random setof points located on a given shape contour. The method usesthe following steps to match a given shape, in our case the
Fig. 3. Left: Test Image. Right: Result of applying segmentation by dilation.Both vertical and horizontal dilation applied.
EE 368: IMAGE PROCESSING PROJECT JUNE 2011 3
template word, to another shape, i.e. the segmented word fromthe input image.
(a) The edges of the shape contour of the words was foundusing Canny edge detection
(b) A random set of points that lie on these edges of thetemplate word and and another set of points for thesegmented word was found
(c) The shape context of each point found above was com-puted. The concept of calculating the shape context de-scriptors was taken from [1]
(d) The cost matrix containing the cost of matching each pointon the template word to each point on the segmented wordwas calculated. A chi-square test statistic was used as theshape context cost of matching the set of points
(e) The Hungarian method was used to do one-to-one match-ing using the cost matrix, minimizing the total cost ofmatching points on the two shapes
(f) Using the point correspondences from the above step,the template word shape edges was warped using atransformation (in our case the regularized ’thin platespline’ model) aligning the template word shape contourto the segmented word shape contour. Two independentTPS models were used to model the x and y co-ordinatetransformations, which combine to give the full transfor-mation. The bending energy, the measure of how muchtransformation is required to bring the two shapes intoalignment, for the transformation was also calculated
(g) The ”shape distance” between each pair of points on thetwo shapes was then calculated using a weighted sum ofthe shape context distance, the image appearance distance,and the bending energy.
(h) A threshold value was picked for the total matching costand shape distance calculated between the template shapeand the segmented word shape to identify the shapes beingsimilar or dissimilar.
The above steps were implemented using MATLAB and theresult of hit or miss between two images was passed on to thenext stage in the pipeline.The modifications adapted to thistechnique are detailed in the following paragraphs.
The regular shape context method described in the literaturecompares all the edge points in the word to all of the edgepoints in the template. This is computationally intensive andtakes too much time to get a result. In order to speed upthe computation and increase the flexibility of the comparisonmetric, we performed some modifications to the algorithm.
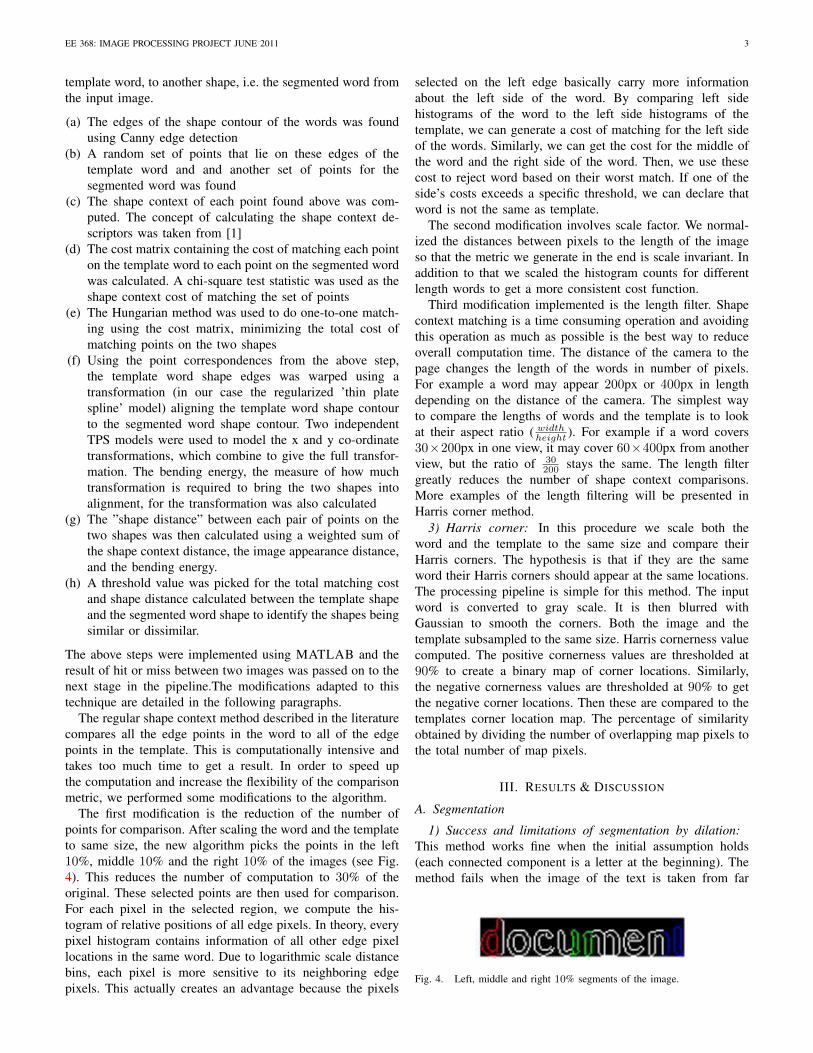
The first modification is the reduction of the number ofpoints for comparison. After scaling the word and the templateto same size, the new algorithm picks the points in the left10%, middle 10% and the right 10% of the images (see Fig.4). This reduces the number of computation to 30% of theoriginal. These selected points are then used for comparison.For each pixel in the selected region, we compute the his-togram of relative positions of all edge pixels. In theory, everypixel histogram contains information of all other edge pixellocations in the same word. Due to logarithmic scale distancebins, each pixel is more sensitive to its neighboring edgepixels. This actually creates an advantage because the pixels
selected on the left edge basically carry more informationabout the left side of the word. By comparing left sidehistograms of the word to the left side histograms of thetemplate, we can generate a cost of matching for the left sideof the words. Similarly, we can get the cost for the middle ofthe word and the right side of the word. Then, we use thesecost to reject word based on their worst match. If one of theside’s costs exceeds a specific threshold, we can declare thatword is not the same as template.
The second modification involves scale factor. We normal-ized the distances between pixels to the length of the imageso that the metric we generate in the end is scale invariant. Inaddition to that we scaled the histogram counts for differentlength words to get a more consistent cost function.
Third modification implemented is the length filter. Shapecontext matching is a time consuming operation and avoidingthis operation as much as possible is the best way to reduceoverall computation time. The distance of the camera to thepage changes the length of the words in number of pixels.For example a word may appear 200px or 400px in lengthdepending on the distance of the camera. The simplest wayto compare the lengths of words and the template is to lookat their aspect ratio ( width
height ). For example if a word covers30×200px in one view, it may cover 60×400px from anotherview, but the ratio of 30
200 stays the same. The length filtergreatly reduces the number of shape context comparisons.More examples of the length filtering will be presented inHarris corner method.
3) Harris corner: In this procedure we scale both theword and the template to the same size and compare theirHarris corners. The hypothesis is that if they are the sameword their Harris corners should appear at the same locations.The processing pipeline is simple for this method. The inputword is converted to gray scale. It is then blurred withGaussian to smooth the corners. Both the image and thetemplate subsampled to the same size. Harris cornerness valuecomputed. The positive cornerness values are thresholded at90% to create a binary map of corner locations. Similarly,the negative cornerness values are thresholded at 90% to getthe negative corner locations. Then these are compared to thetemplates corner location map. The percentage of similarityobtained by dividing the number of overlapping map pixels tothe total number of map pixels.
III. RESULTS & DISCUSSION
A. Segmentation
1) Success and limitations of segmentation by dilation:This method works fine when the initial assumption holds(each connected component is a letter at the beginning). Themethod fails when the image of the text is taken from far
Fig. 4. Left, middle and right 10% segments of the image.
EE 368: IMAGE PROCESSING PROJECT JUNE 2011 4
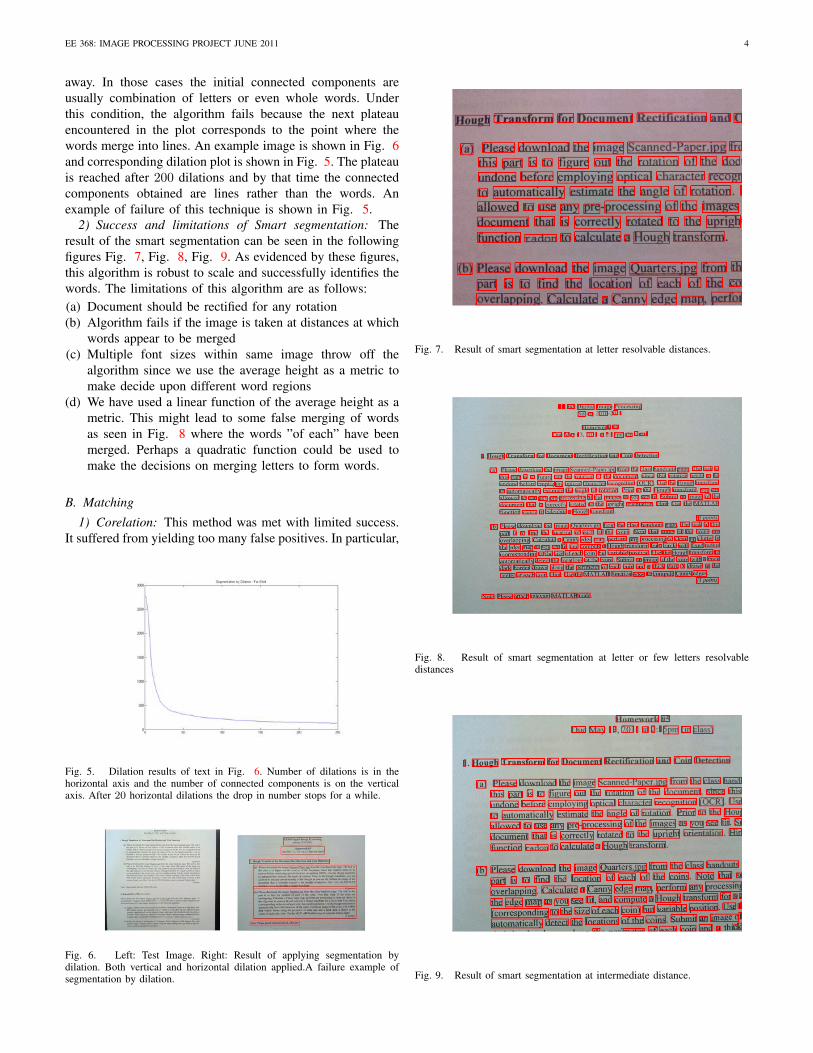
away. In those cases the initial connected components areusually combination of letters or even whole words. Underthis condition, the algorithm fails because the next plateauencountered in the plot corresponds to the point where thewords merge into lines. An example image is shown in Fig. 6and corresponding dilation plot is shown in Fig. 5. The plateauis reached after 200 dilations and by that time the connectedcomponents obtained are lines rather than the words. Anexample of failure of this technique is shown in Fig. 5.
2) Success and limitations of Smart segmentation: Theresult of the smart segmentation can be seen in the followingfigures Fig. 7, Fig. 8, Fig. 9. As evidenced by these figures,this algorithm is robust to scale and successfully identifies thewords. The limitations of this algorithm are as follows:(a) Document should be rectified for any rotation(b) Algorithm fails if the image is taken at distances at which
words appear to be merged(c) Multiple font sizes within same image throw off the
algorithm since we use the average height as a metric tomake decide upon different word regions
(d) We have used a linear function of the average height as ametric. This might lead to some false merging of wordsas seen in Fig. 8 where the words ”of each” have beenmerged. Perhaps a quadratic function could be used tomake the decisions on merging letters to form words.
B. Matching
1) Corelation: This method was met with limited success.It suffered from yielding too many false positives. In particular,
Fig. 5. Dilation results of text in Fig. 6. Number of dilations is in thehorizontal axis and the number of connected components is on the verticalaxis. After 20 horizontal dilations the drop in number stops for a while.
Fig. 6. Left: Test Image. Right: Result of applying segmentation bydilation. Both vertical and horizontal dilation applied.A failure example ofsegmentation by dilation.
Fig. 7. Result of smart segmentation at letter resolvable distances.
Fig. 8. Result of smart segmentation at letter or few letters resolvabledistances
Fig. 9. Result of smart segmentation at intermediate distance.
EE 368: IMAGE PROCESSING PROJECT JUNE 2011 5
running this algorithm on Fig. 15 yielded a corelation value of0.7932 and running the same algorithm on Fig. 16 yielded acorelation value of 0.7324. Running the algorithm on similartest cases did not yield any discernable threshold which wecould use to conclusively identify and separate text. Resultscould perhaps have been improved by only trying to comparewords of similar length.
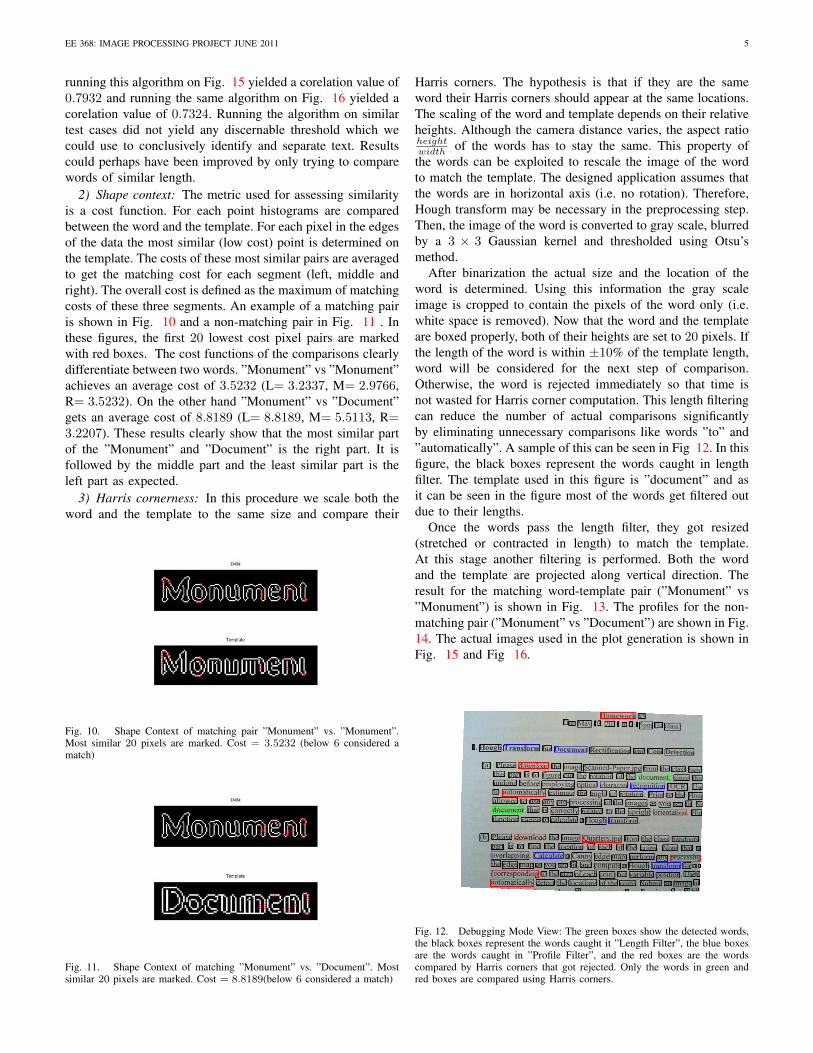
2) Shape context: The metric used for assessing similarityis a cost function. For each point histograms are comparedbetween the word and the template. For each pixel in the edgesof the data the most similar (low cost) point is determined onthe template. The costs of these most similar pairs are averagedto get the matching cost for each segment (left, middle andright). The overall cost is defined as the maximum of matchingcosts of these three segments. An example of a matching pairis shown in Fig. 10 and a non-matching pair in Fig. 11 . Inthese figures, the first 20 lowest cost pixel pairs are markedwith red boxes. The cost functions of the comparisons clearlydifferentiate between two words. ”Monument” vs ”Monument”achieves an average cost of 3.5232 (L= 3.2337, M= 2.9766,R= 3.5232). On the other hand ”Monument” vs ”Document”gets an average cost of 8.8189 (L= 8.8189, M= 5.5113, R=3.2207). These results clearly show that the most similar partof the ”Monument” and ”Document” is the right part. It isfollowed by the middle part and the least similar part is theleft part as expected.
3) Harris cornerness: In this procedure we scale both theword and the template to the same size and compare their
Fig. 10. Shape Context of matching pair ”Monument” vs. ”Monument”.Most similar 20 pixels are marked. Cost = 3.5232 (below 6 considered amatch)
Fig. 11. Shape Context of matching ”Monument” vs. ”Document”. Mostsimilar 20 pixels are marked. Cost = 8.8189(below 6 considered a match)
Harris corners. The hypothesis is that if they are the sameword their Harris corners should appear at the same locations.The scaling of the word and template depends on their relativeheights. Although the camera distance varies, the aspect ratioheightwidth of the words has to stay the same. This property ofthe words can be exploited to rescale the image of the wordto match the template. The designed application assumes thatthe words are in horizontal axis (i.e. no rotation). Therefore,Hough transform may be necessary in the preprocessing step.Then, the image of the word is converted to gray scale, blurredby a 3 × 3 Gaussian kernel and thresholded using Otsu’smethod.
After binarization the actual size and the location of theword is determined. Using this information the gray scaleimage is cropped to contain the pixels of the word only (i.e.white space is removed). Now that the word and the templateare boxed properly, both of their heights are set to 20 pixels. Ifthe length of the word is within ±10% of the template length,word will be considered for the next step of comparison.Otherwise, the word is rejected immediately so that time isnot wasted for Harris corner computation. This length filteringcan reduce the number of actual comparisons significantlyby eliminating unnecessary comparisons like words ”to” and”automatically”. A sample of this can be seen in Fig 12. In thisfigure, the black boxes represent the words caught in lengthfilter. The template used in this figure is ”document” and asit can be seen in the figure most of the words get filtered outdue to their lengths.
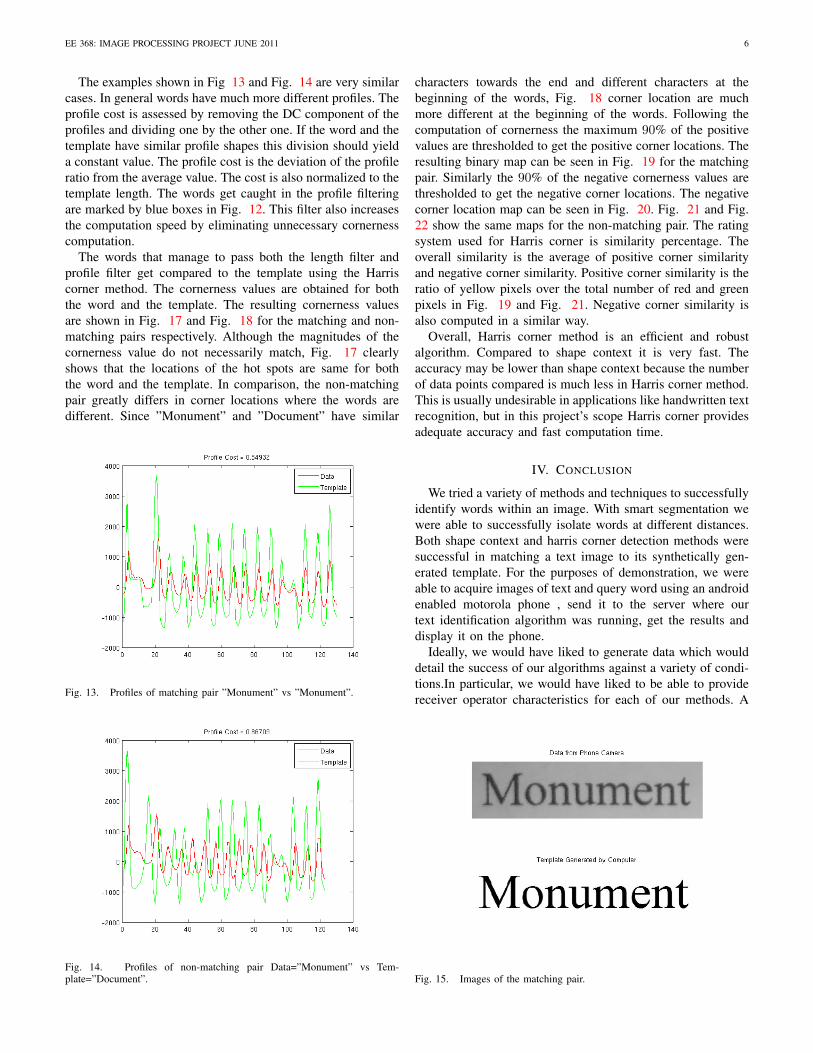
Once the words pass the length filter, they got resized(stretched or contracted in length) to match the template.At this stage another filtering is performed. Both the wordand the template are projected along vertical direction. Theresult for the matching word-template pair (”Monument” vs”Monument”) is shown in Fig. 13. The profiles for the non-matching pair (”Monument” vs ”Document”) are shown in Fig.14. The actual images used in the plot generation is shown inFig. 15 and Fig 16.
Fig. 12. Debugging Mode View: The green boxes show the detected words,the black boxes represent the words caught it ”Length Filter”, the blue boxesare the words caught in ”Profile Filter”, and the red boxes are the wordscompared by Harris corners that got rejected. Only the words in green andred boxes are compared using Harris corners.
EE 368: IMAGE PROCESSING PROJECT JUNE 2011 6
The examples shown in Fig 13 and Fig. 14 are very similarcases. In general words have much more different profiles. Theprofile cost is assessed by removing the DC component of theprofiles and dividing one by the other one. If the word and thetemplate have similar profile shapes this division should yielda constant value. The profile cost is the deviation of the profileratio from the average value. The cost is also normalized to thetemplate length. The words get caught in the profile filteringare marked by blue boxes in Fig. 12. This filter also increasesthe computation speed by eliminating unnecessary cornernesscomputation.
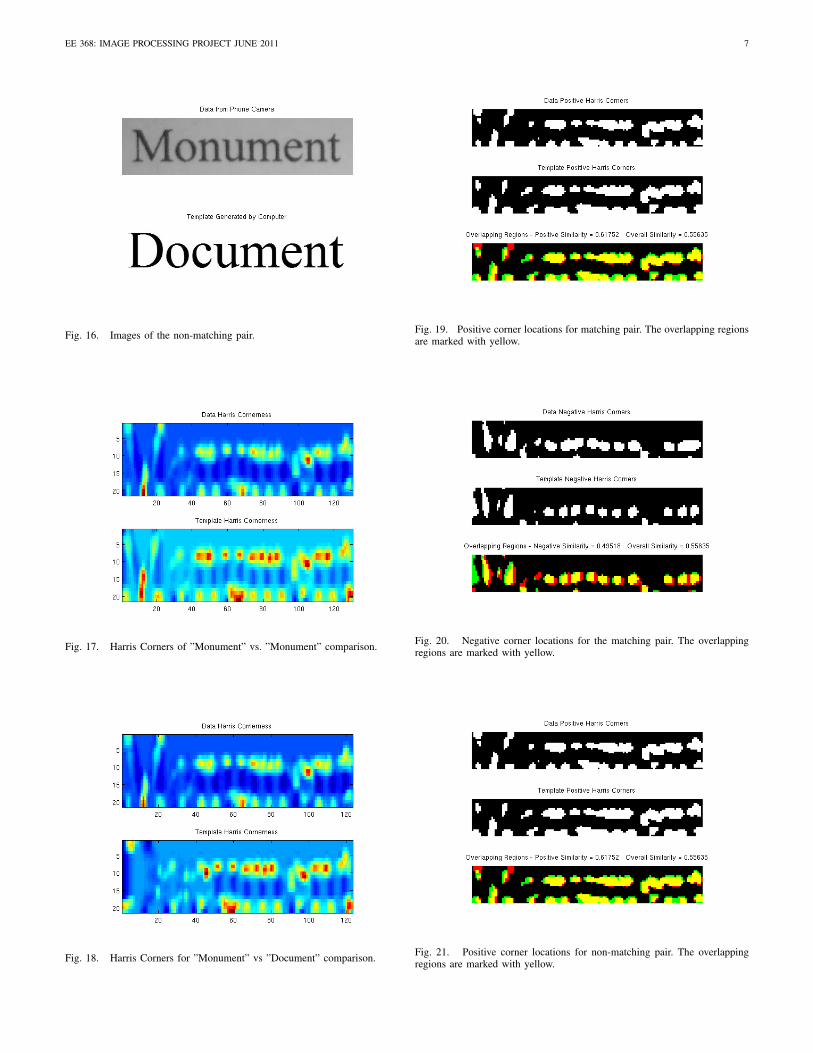
The words that manage to pass both the length filter andprofile filter get compared to the template using the Harriscorner method. The cornerness values are obtained for boththe word and the template. The resulting cornerness valuesare shown in Fig. 17 and Fig. 18 for the matching and non-matching pairs respectively. Although the magnitudes of thecornerness value do not necessarily match, Fig. 17 clearlyshows that the locations of the hot spots are same for boththe word and the template. In comparison, the non-matchingpair greatly differs in corner locations where the words aredifferent. Since ”Monument” and ”Document” have similar
Fig. 13. Profiles of matching pair ”Monument” vs ”Monument”.
Fig. 14. Profiles of non-matching pair Data=”Monument” vs Tem-plate=”Document”.
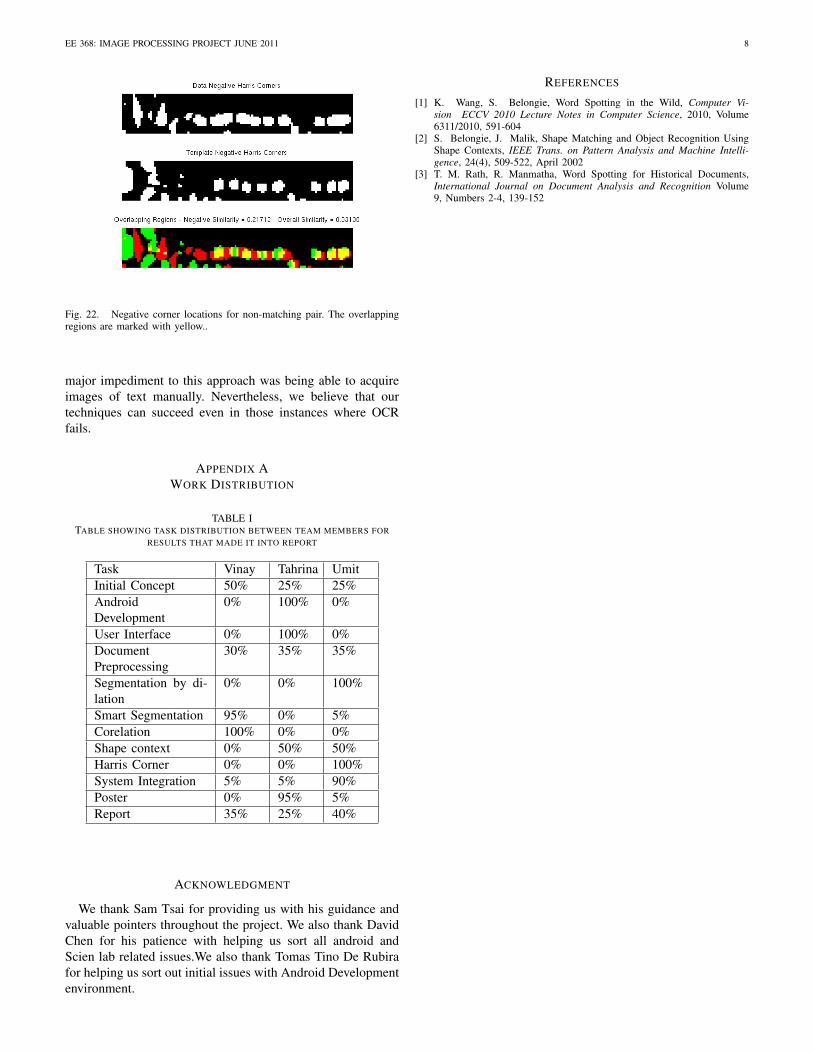
characters towards the end and different characters at thebeginning of the words, Fig. 18 corner location are muchmore different at the beginning of the words. Following thecomputation of cornerness the maximum 90% of the positivevalues are thresholded to get the positive corner locations. Theresulting binary map can be seen in Fig. 19 for the matchingpair. Similarly the 90% of the negative cornerness values arethresholded to get the negative corner locations. The negativecorner location map can be seen in Fig. 20. Fig. 21 and Fig.22 show the same maps for the non-matching pair. The ratingsystem used for Harris corner is similarity percentage. Theoverall similarity is the average of positive corner similarityand negative corner similarity. Positive corner similarity is theratio of yellow pixels over the total number of red and greenpixels in Fig. 19 and Fig. 21. Negative corner similarity isalso computed in a similar way.
Overall, Harris corner method is an efficient and robustalgorithm. Compared to shape context it is very fast. Theaccuracy may be lower than shape context because the numberof data points compared is much less in Harris corner method.This is usually undesirable in applications like handwritten textrecognition, but in this project’s scope Harris corner providesadequate accuracy and fast computation time.
IV. CONCLUSION
We tried a variety of methods and techniques to successfullyidentify words within an image. With smart segmentation wewere able to successfully isolate words at different distances.Both shape context and harris corner detection methods weresuccessful in matching a text image to its synthetically gen-erated template. For the purposes of demonstration, we wereable to acquire images of text and query word using an androidenabled motorola phone , send it to the server where ourtext identification algorithm was running, get the results anddisplay it on the phone.
Ideally, we would have liked to generate data which woulddetail the success of our algorithms against a variety of condi-tions.In particular, we would have liked to be able to providereceiver operator characteristics for each of our methods. A
Fig. 15. Images of the matching pair.
EE 368: IMAGE PROCESSING PROJECT JUNE 2011 7
Fig. 16. Images of the non-matching pair.
Fig. 17. Harris Corners of ”Monument” vs. ”Monument” comparison.
Fig. 18. Harris Corners for ”Monument” vs ”Document” comparison.
Fig. 19. Positive corner locations for matching pair. The overlapping regionsare marked with yellow.
Fig. 20. Negative corner locations for the matching pair. The overlappingregions are marked with yellow.
Fig. 21. Positive corner locations for non-matching pair. The overlappingregions are marked with yellow.
EE 368: IMAGE PROCESSING PROJECT JUNE 2011 8
Fig. 22. Negative corner locations for non-matching pair. The overlappingregions are marked with yellow..
major impediment to this approach was being able to acquireimages of text manually. Nevertheless, we believe that ourtechniques can succeed even in those instances where OCRfails.
APPENDIX AWORK DISTRIBUTION
TABLE ITABLE SHOWING TASK DISTRIBUTION BETWEEN TEAM MEMBERS FOR
RESULTS THAT MADE IT INTO REPORT
Task Vinay Tahrina UmitInitial Concept 50% 25% 25%AndroidDevelopment
0% 100% 0%
User Interface 0% 100% 0%DocumentPreprocessing
30% 35% 35%
Segmentation by di-lation
0% 0% 100%
Smart Segmentation 95% 0% 5%Corelation 100% 0% 0%Shape context 0% 50% 50%Harris Corner 0% 0% 100%System Integration 5% 5% 90%Poster 0% 95% 5%Report 35% 25% 40%
ACKNOWLEDGMENT
We thank Sam Tsai for providing us with his guidance andvaluable pointers throughout the project. We also thank DavidChen for his patience with helping us sort all android andScien lab related issues.We also thank Tomas Tino De Rubirafor helping us sort out initial issues with Android Developmentenvironment.
REFERENCES
[1] K. Wang, S. Belongie, Word Spotting in the Wild, Computer Vi-sion ECCV 2010 Lecture Notes in Computer Science, 2010, Volume6311/2010, 591-604
[2] S. Belongie, J. Malik, Shape Matching and Object Recognition UsingShape Contexts, IEEE Trans. on Pattern Analysis and Machine Intelli-gence, 24(4), 509-522, April 2002
[3] T. M. Rath, R. Manmatha, Word Spotting for Historical Documents,International Journal on Document Analysis and Recognition Volume9, Numbers 2-4, 139-152