Embed Size (px)
Citation preview
Edward Kaye1,2, Kie Honjo3,4, Ana Petrovic-Poljak5, Robert van Reekum6, David Streiner1,6,7,8,9, Alan Wilson6,10, Sandra Black3,4,11, Morris Freedman4,11,12,13, Pablo Rusjan10, Sylvain Houle10, Paul Verhoeff1,6,12,14
1Kunin-Lunenfeld Applied Research Unit, Baycrest; 2Institute of Medical Science, University of Toronto; 3Division of Neurology, Sunnybrook Health Sciences Centre; 4Division of Neurology, University of Toronto; 5Mood Clinic, Baycrest; 6Department of Psychiatry, University of Toronto; 7Department of Psychiatry and Neuroscience, McMaster University; 8McMaster Child Health Research Institute; 9Health Systems Research and Consultation Unit, CAMH; 10PET Centre, CAMH; 11Rotman Research Institute, Baycrest; 12Memory Clinic, Baycrest; 13Division of Neurology, Baycrest; 14Department of Psychiatry,
Baycrest
Introduction
1) Apathy correlates with amyloid plaque burden in the cingulate cortex, dorsolateral prefrontal cortex (DLPFC), orbitofrontal cortex (OFC).
2) Depression/dysphoria correlates with amyloid plaque burden in the medial temporal lobe (MTL), DLPFC, OFC.
3) Agitation/aggression correlates with amyloid plaque burden in the DLPFC, anterior cingulate cortex, temporal cortex.
• Alzheimer’s disease (AD) is the most common form of dementia.
• >80% of AD patients display at least one neuropsychiatric symptom (mood, psychotic, or behavioural).
• A primary pathology in AD is the presence of beta-amyloid, which accumulates into extraneuronal plaques.
• These plaques may be imaged with the radiolabeled tracer [11C]SB-13.
• Question: Do patients with greater disturbances in particular neuropsychiatric symptoms also have greater amyloid plaque burden in particular brain regions?
Hypotheses
Methods
Do Amyloid Plaques Correlate with Behavioural Symptoms in Alzheimer’s Disease?
• 10 mild AD patients (age 72 + 13 years; MMSE scores, 22.3 + 2.9) underwent 2 separate scans:
1. Magnetic Resonance Imaging (MRI) scan.2. Positron Emission Tomography (PET) scan following injection of about 10 mCi of [11C]SB-13.
• Administered the Neuropsychiatric Inventory (NPI) to an informed caregiver to assess 12 behavioural disturbances.
• Employed a semi-automatic brain extraction method to trace brain regions of interest (ROIs) on the T1-weighted MRI images, manually traced cerebellar grey matter.
• Coregistered MRI data with PET data (used AIR, FSL).
• Estimated regional amyloid plaque with the Standardized Uptake Value (SUV) for each ROI, calculated by normalizing tissue concentration (nCi/mL) by injected dose per body mass (nCi/g). Ratios of region of interest over cerebellum (the reference region) were also calculated (SUVRs). Both estimates were derived from the 40-90 minute interval post-injection of the tracer [11C]SB-13.
• Calculated correlations between NPI scores and regional SUVs and SUVRs using Pearson’s r, alpha=0.05.
Results
Table 2. Pearson correlation coefficients between mean total NPI score and regional SUVs.
This project was supported by:• Alzheimer’s Association • Finkler Graduate Student Fellowship• Harry C. Sharpe Fellowship• Scace Graduate Fellowship for Research in Alzheimer’s• University of Toronto Institute of Medical Science Fellowship
Acknowledgments
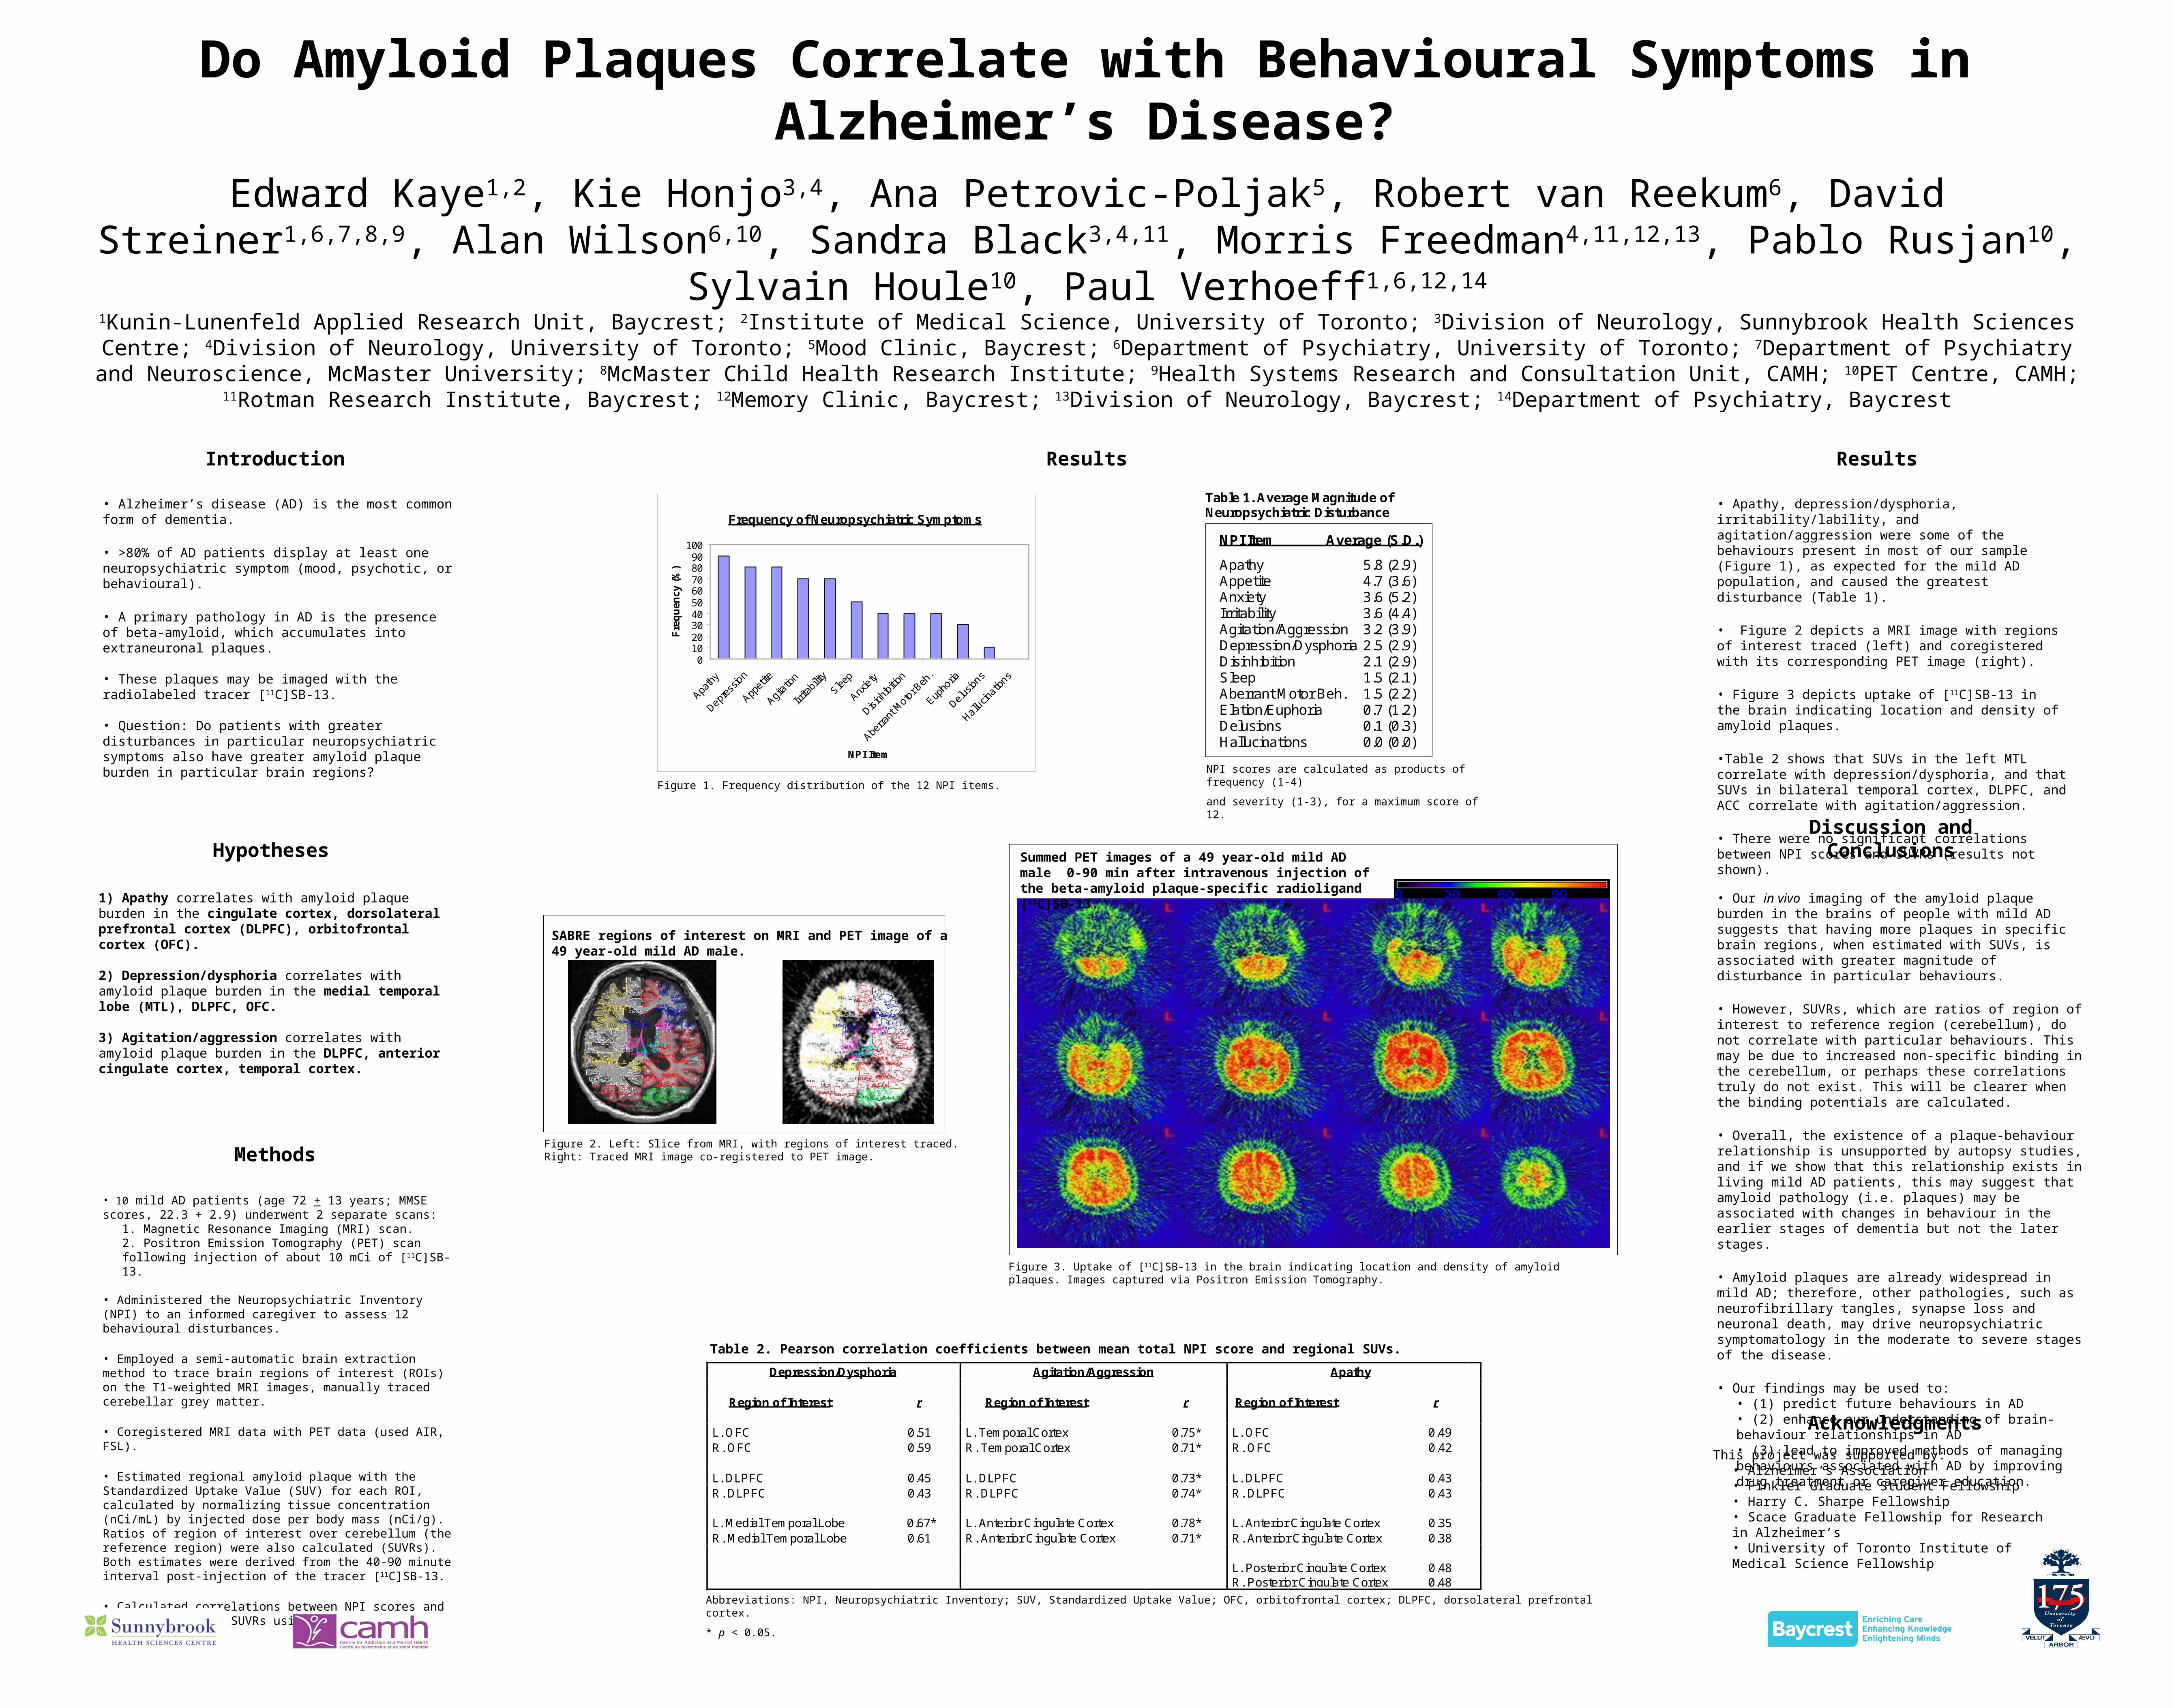
• Apathy, depression/dysphoria, irritability/lability, and agitation/aggression were some of the behaviours present in most of our sample (Figure 1), as expected for the mild AD population, and caused the greatest disturbance (Table 1).
• Figure 2 depicts a MRI image with regions of interest traced (left) and coregistered with its corresponding PET image (right).
• Figure 3 depicts uptake of [11C]SB-13 in the brain indicating location and density of amyloid plaques.
•Table 2 shows that SUVs in the left MTL correlate with depression/dysphoria, and that SUVs in bilateral temporal cortex, DLPFC, and ACC correlate with agitation/aggression.
• There were no significant correlations between NPI scores and SUVRs (results not shown).
Discussion and Conclusions
• Our in vivo imaging of the amyloid plaque burden in the brains of people with mild AD suggests that having more plaques in specific brain regions, when estimated with SUVs, is associated with greater magnitude of disturbance in particular behaviours.
• However, SUVRs, which are ratios of region of interest to reference region (cerebellum), do not correlate with particular behaviours. This may be due to increased non-specific binding in the cerebellum, or perhaps these correlations truly do not exist. This will be clearer when the binding potentials are calculated.
• Overall, the existence of a plaque-behaviour relationship is unsupported by autopsy studies, and if we show that this relationship exists in living mild AD patients, this may suggest that amyloid pathology (i.e. plaques) may be associated with changes in behaviour in the earlier stages of dementia but not the later stages.
• Amyloid plaques are already widespread in mild AD; therefore, other pathologies, such as neurofibrillary tangles, synapse loss and neuronal death, may drive neuropsychiatric symptomatology in the moderate to severe stages of the disease.
• Our findings may be used to:• (1) predict future behaviours in AD • (2) enhance our understanding of brain-behaviour relationships in AD • (3) lead to improved methods of managing behaviours associated with AD by improving drug treatment or caregiver education.
Abbreviations: NPI, Neuropsychiatric Inventory; SUV, Standardized Uptake Value; OFC, orbitofrontal cortex; DLPFC, dorsolateral prefrontal cortex.
* p < 0.05.
Results
Summed PET images of a 49 year-old mild AD male 0-90 min after intravenous injection of the beta-amyloid plaque-specific radioligand [11C]SB-13.
Figure 3. Uptake of [11C]SB-13 in the brain indicating location and density of amyloid plaques. Images captured via Positron Emission Tomography.
SABRE regions of interest on MRI and PET image of a 49 year-old mild AD male.
Figure 2. Left: Slice from MRI, with regions of interest traced. Right: Traced MRI image co-registered to PET image.
Frequency of Neuropsychiatric Symptoms
0102030405060708090
100
Apath
y
Depres
sion
Appet
ite
Agitatio
n
Irrita
bility
Sleep
Anxie
ty
Disinh
ibitio
n
Aberra
nt M
otor B
eh.
Eupho
ria
Delusion
s
Hallucin
ations
NPI Item
Fre
qu
ency
(%
)
NPI Item Average (S.D.)
Apathy 5.8 (2.9) Appetite 4.7 (3.6) Anxiety 3.6 (5.2) Irritability 3.6 (4.4) Agitation/Aggression 3.2 (3.9) Depression/Dysphoria 2.5 (2.9) Disinhibition 2.1 (2.9) Sleep 1.5 (2.1) Aberrant Motor Beh. 1.5 (2.2) Elation/Euphoria 0.7 (1.2) Delusions 0.1 (0.3) Hallucinations 0.0 (0.0)
Table 1. Average Magnitude ofNeuropsychiatric Disturbance
NPI scores are calculated as products of frequency (1-4)
and severity (1-3), for a maximum score of 12.Figure 1. Frequency distribution of the 12 NPI items.
Depression/Dysphoria Agitation/Aggression Apathy
Region of Interest r Region of Interest r Region of Interest r
L. OFC 0.51 L. Temporal Cortex 0.75* L. OFC 0.49 R. OFC 0.59 R. Temporal Cortex 0.71* R. OFC 0.42
L. DLPFC 0.45 L. DLPFC 0.73* L. DLPFC 0.43 R. DLPFC 0.43 R. DLPFC 0.74* R. DLPFC 0.43
L. Medial Temporal Lobe 0.67* L. Anterior Cingulate Cortex 0.78* L. Anterior Cingulate Cortex 0.35 R. Medial Temporal Lobe 0.61 R. Anterior Cingulate Cortex 0.71* R. Anterior Cingulate Cortex 0.38
L. Posterior Cingulate Cortex 0.48 R. Posterior Cingulate Cortex 0.48


![Kiran Bailey and K. S. Gurumurthy - COnnecting REpositories · 2020. 1. 24. · Mirko Poljak et al [10] have reported the improvement in the dc performance of bulk FinFET in comparison](https://img.pdfslide.us/doc/110x75/60c4d4f9b07b35417b4e634a/kiran-bailey-and-k-s-gurumurthy-connecting-repositories-2020-1-24-mirko.jpg)