Embed Size (px)
Citation preview

FSI TECHNICAL INFORMATION SERIES
Volume 2 No. 2 2020
Rapid Assessment of Fire affected Forest Areas in the Country based on MODIS-detections
following a Sampling Approach
Ministry of Environment, Forest & Climate Change
FOREST SURVEY OF INDIAभारतीय वन सव ण
Government of India
ISBN: 978-81-941018-5-7

© FOREST SURVEY OF INDIA
ISBN: 978-81-941018-5-7

FSI TECHNICAL INFORMATION SERIES
Volume 2 No. 2 2020
Rapid Assessment of Fire affected Forest Areas in the
Country based on MODIS-detections following a
Sampling Approach
Dr. Subhash Ashutosh Concept, Methodology, Technical guidance
Smt. Meenakshi Joshi, Dr. Sunil Chandra Technical supervision
Harshi Jain, Satyendra Kumar Spatial data processing and analysis
Vikas Guisan, Tanay Das, Anupam Pal Spatial data processing
Forest Survey of India
Ministry of Environment, Forest & Climate Change, Government of India
Kaulagarh Road, Dehradun - 248195
ISBN: 978-81-941018-5-7


Abstract
Assessment of burnt forest area provides an important input for understanding the
ecological, social as well as economic impacts of forest fires. The present study aims to
develop a methodology for rapid assessment of burnt forest areas at the country-wide scale
based on a statistical sampling approach. Forest Survey of India issues alerts of forest fires
based on near-real time detections of forest fires by MODIS sensor. Detected forest fires
in the country based on MODIS data during the fire season of 2019-2020 has been used
as population for assessing the burnt forest areas in the country. The total burnt forest area
in India for the fire season 2019-2020 (i.e. from 01st November, 2019 to 30th June, 2020)
has been assessed 11,094 sq. km with 95% confidence level, which is 1.56% of the total
forest cover area of the country. Among the different physiographic zones, the maximum
forest burnt area has been found in Deccan (5626 sq. km) followed by Central Highlands
(2160 sq. km). These two physiographic zones together has contributed to 70% of the total
forest burnt areas. In contrast, north-east region with maximum number of MODIS-
detected forest fire points in the last fire season, has only 12.50% of the total forest burnt
areas. The methodology developed is a simple and reliable procedure to estimate the
forest burnt areas in a cost-effective and time-efficient manner. The burnt area estimation
would be a useful data for damage assessment and planning restoration activities in fire
affected forest areas.


FSI Technical Information Series Volume 2, No. 2 2020 1
Rapid Assessment of Fire affected Forest Areas in the Country based
on MODIS-detections following a Sampling Approach
1. Introduction
Forests play a crucial role in the flow of ecosystem services. They are the storehouses of
biodiversity (ISFR 2019) and means for survival and sustenance of a large proportion of
India’s population (Malik & Dhanda, 2003). Fire is one among the important components
for shaping its flora and fauna. It is necessary for the proper functioning of forest
ecosystems. However, protecting forests from undesirable and uncontrollable fires is a
major challenge for India. More than 29,000 forest fire incidents were reported in the
country in the year 2018-2019. More than 36% of the country’s forest cover is prone to
frequent fires, out of which, approximately 10% is extremely to very highly prone to fires
(ISFR 2019). Every year 2-5 % of forests are affected by fires damaging the precious
ecological resources. Severe forest fires can cause irreparable damages and long-lasting
impacts on the ecosystem. The frequency as well as intensity of forest fires has increased
due to escalated anthropogenic activities and changes in the climate (Overpeck et al.,
1990; Roy, 2004).India needs to strengthen its efforts for efficiently managing the forest
fires to achieve its goals set for green India (Dogra et al., 2018).
Remote Sensing and Geographical information system (GIS) technology-based measures
have proved to be effective in control and management of forest fires (Sharma et al., 2012;
Negi& Kumar, 2016; ISFR 2017). The satellite based remote sensing methods, their
interpretation and analysis can be applied to monitor active fires, estimate burnt area, and
understand various factors affecting the forest fire regime to formulate a robust forest fire
management plan.
FSI has been carrying out forest fire monitoring at national level since 2004 using Remote
Sensing and GIS technology with the main objective of detecting active forest fires at
nascent stage and to inform State Forest Departments about the forest fire incidences on
near real time basis (Technical Information Series, FSI, 2019a). FSI uses Moderate
Resolution Imaging Spectro-radiometer (MODIS) data with 1km X 1km spatial resolution
and Suomi-National Polar-orbiting Partnership (SNPP)-Visible Infrared Imaging
Radiometer Suite (VIIRS) data with 375m X 375m spatial resolution.
FSI Technical Information Series Volume 2, No. 2 2020 2
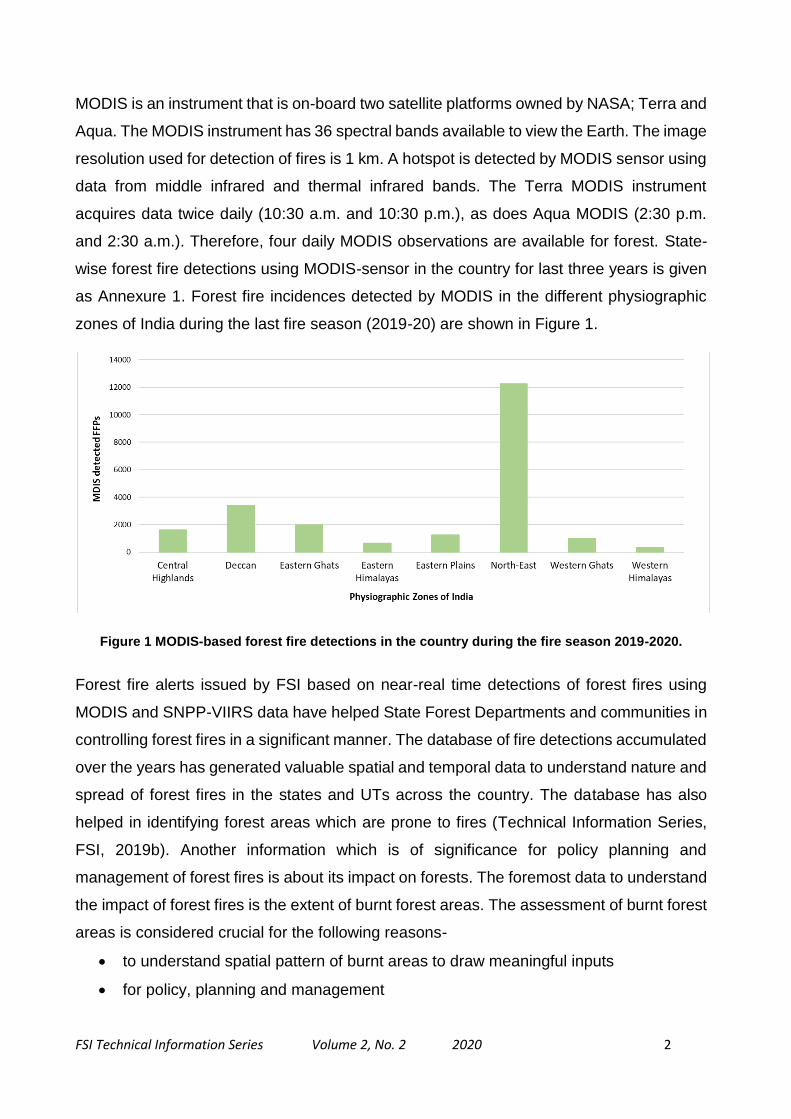
MODIS is an instrument that is on-board two satellite platforms owned by NASA; Terra and
Aqua. The MODIS instrument has 36 spectral bands available to view the Earth. The image
resolution used for detection of fires is 1 km. A hotspot is detected by MODIS sensor using
data from middle infrared and thermal infrared bands. The Terra MODIS instrument
acquires data twice daily (10:30 a.m. and 10:30 p.m.), as does Aqua MODIS (2:30 p.m.
and 2:30 a.m.). Therefore, four daily MODIS observations are available for forest. State-
wise forest fire detections using MODIS-sensor in the country for last three years is given
as Annexure 1. Forest fire incidences detected by MODIS in the different physiographic
zones of India during the last fire season (2019-20) are shown in Figure 1.
Figure 1 MODIS-based forest fire detections in the country during the fire season 2019-2020.
Forest fire alerts issued by FSI based on near-real time detections of forest fires using
MODIS and SNPP-VIIRS data have helped State Forest Departments and communities in
controlling forest fires in a significant manner. The database of fire detections accumulated
over the years has generated valuable spatial and temporal data to understand nature and
spread of forest fires in the states and UTs across the country. The database has also
helped in identifying forest areas which are prone to fires (Technical Information Series,
FSI, 2019b). Another information which is of significance for policy planning and
management of forest fires is about its impact on forests. The foremost data to understand
the impact of forest fires is the extent of burnt forest areas. The assessment of burnt forest
areas is considered crucial for the following reasons-
to understand spatial pattern of burnt areas to draw meaningful inputs
for policy, planning and management

FSI Technical Information Series Volume 2, No. 2 2020 3
for estimation of loss to flora, fauna, soil, carbon
for recognizing appropriate rehabilitation requirements
for formulating suitable restoration activities
Information on the extent of burnt forest areas to a reasonable accuracy is possible by
burnt area mapping using appropriate remote sensing data. The burnt forest areas show a
conspicuous signature on the satellite images. However, wall-to-wall mapping of the entire
country is a time consuming and expensive exercise. Therefore, in the present study, a
sampling-based approach taking MODIS-based near-real time forest fire points
(NRT-FFPs) as a population of forest fire locations has been followed for developing a
methodology for rapid assessment of burnt forest areas in the country. The results of the
study present an assessment of the same for the entire country during last fire season i.e.
November 2019 to June 2020.
2. Objectives
The present study has been carried out at the country level with the following objectives-
i. develop a methodology for rapid assessment of fire affected forest areas (burnt
area) using sampling method of MODIS-based near-real time forest fire detections
ii. assess fire affected forest areas (burnt area) in the country during 2019-2020 forest
fire season using the above sampling-based methodology in different physiographic
zones.
The assessment year for the present study is the fire season 2019-2020 (01st November,
2019 to 30th June, 2020).
FSI Technical Information Series Volume 2, No. 2 2020 4
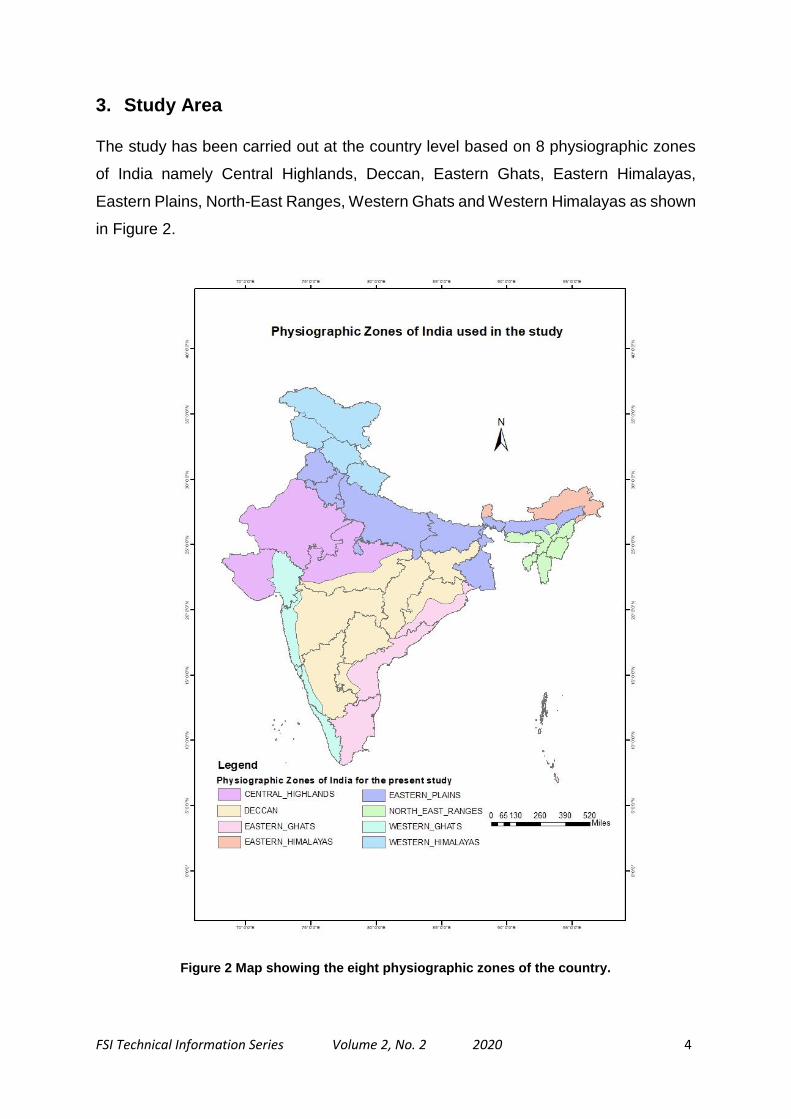
3. Study Area
The study has been carried out at the country level based on 8 physiographic zones
of India namely Central Highlands, Deccan, Eastern Ghats, Eastern Himalayas,
Eastern Plains, North-East Ranges, Western Ghats and Western Himalayas as shown
in Figure 2.
Figure 2 Map showing the eight physiographic zones of the country.

FSI Technical Information Series Volume 2, No. 2 2020 5
4. Material and Methods
4.1 Data and Software used
India Physiographic Zones boundary(Source: Forest Survey of India (FSI))
Masking layer (composite of Forest Cover Map and Administrative or RFA
boundaries of the country) as used in filtering process of forest fire points in the
FSI’s Near-real time (NRT) Forest Fire Alert System detections (Source: FSI)
Forest Cover Map of India – 2019 (Source: FSI)
Forest Fire Alerts database generated by FSI based on near-real time (NRT)
detections by MODIS for the fire season 2019-2020(Source: FSI)
Remote Sensed dataset of the study area-
o Moderate Resolution Imaging Spectroradiometer (MODIS) – for NRT Forest
Fire Points
o Sentinel 2– Satellite Imagery for Fire affected area delineation
Softwares - Arc GIS, Google Earth Engine, MS-Excel
4.2 Methodology
Stratified Random Selection of the MODIS-detected FSI NRT Forest Fire Points in various physiographic zones of India
i. A stratified random sampling approach was followed for the rapid assessment of
the burnt area due to forest fires in the country during the last forest fire season
i.e. 01st November 2019 to 30th June 2020.
ii. All the detected forest fire points (FFPs) based on MODIS-sensor during the fire
season formed the population. Map showing the total forest fire detections based
on MODIS by FSI in the fire season 2019-2020 is given in Annexure 2.
iii. The spatial layer of eight physiographic zones (PZ) of India namely Central
Highlands, Deccan, Eastern Ghats, Eastern Himalayas, Eastern Plains, North-
East Ranges, Western Ghats and Western Himalayas was used for the
stratification.
iv. Stratified random sampling was used to select the sample in such a manner that
number of FFPs in each strata (physiographic zone) was in proportion to the forest
cover area under the strata (probability proportional to size). Random number
generated using MS Excel were used to select the samples in each strata.
v. Based on a pilot study on 240 randomly selected MODIS forest fire points with
coefficient of variability (CV= 161.45) and allowable error of 20%, a sample size

FSI Technical Information Series Volume 2, No. 2 2020 6
of 250 MODIS- detected forest fire points was selected for carrying out the present
study. Table 1 details the distribution of the sample MODIS-detected FFPs in the
PZs of the country. Map showing the distribution of the sample MODIS-detected
FFPs in the eight physiographic zones of India is given in Annexure 3.
Table 1 Distribution of sample MODIS-detected forest fire points (FFPS) in the eight physiographic zones of India.
S. No. Physiographic
Zones Geographic Area
(in sq. km) Forest Cover (FC) Area (in sq. km)
No. of Sample FFPs in each Zone w.r.t. FC
1 Central Highlands 655134 64059 22
2 Deccan 981219 206249 67
3 Eastern Ghats 344988 88914 33
4 Eastern Himalayas 89327 70029 26
5 Eastern Plains 576034 56846 21
6 North Eastern
Ranges 115598 86348 36
7 Western Ghats 193213 76455 30
8 Western Himalayas 331956 63348 23
Total 3287469 712249 258
Delineation of the fire affected forest area polygons using Google Earth Engine (GEE) and Count of Total MODIS detections (Sample FFPs and repeat detections intersecting the fire affected forest area polygons)
vi. Using Google Earth Engine(GEE) platform, fire affected areas corresponding
to each of these randomly selected forest fire points were visually interpreted
on the screen, delineated and then estimated using Sentinel-2 satellite imagery
(based on pre-fire and post-fire images). Pre and post fire satellite images of
the two forest fire events and their digitized fire affected area polygons have
been illustrated in Annexure 4. Some polygons of fire affected forest areas
showed more than one FFP due to the repeat detections by MODIS where the
active fire continued till the subsequent passes of MODIS sensor. Though,
there were more than one detections in such polygons but they have been
referred as single ‘forest fire event’ (FFE).
vii. Each fire affected forest area polygon corresponds to a forest fire event
corresponding to each of these randomly selected forest fire points. The terms
forest fire points, fire affected forest area polygons and forest fire events have
been used interchangeably in this study.
viii. For total MODIS detections for a single fire event, all the MODIS detected forest
fire points intersecting with the fire affected area polygon of the fire were

FSI Technical Information Series Volume 2, No. 2 2020 7
considered as the total detections (sum of sample forest fire point and repeat
detections) corresponding to that particular forest fire event or forest fire
affected polygon.
ix. The complete dataset of 258 sample forest fire points (of the total MODIS-
detected forest fire points in the country for the fire season 2019-2020) was
analysed in excel and corresponding charts and tables were prepared.
Rapid Assessment of the fire affected forest areas for estimation at the country-level
x. Based on the number of detections in sample FFPs, total number of sample fire
events and forest area affected by fire in the sample FFPs, an average
numerical value was calculated for the estimation of total number of fire events
and total fire affected forest area in different physiographic zones of the country.
xi. Based on the above calculated values, the total fire affected forest area in the
country was estimated for the fire season 2019-2020.
Figure 3 depicts the flowchart for the methodology followed in the present study.
Figure 3 Methodology followed for the rapid assessment of fire affected forest area in the country
based on remote sensing and sampling technique using NRT MODIS-detected forest fire points.
Proportionate Stratified Sampling Technique Spatial Layer of Physiographic Zones of India
Google Earth Engine platform Sentinel-2 Satellite Imagery
FSI’s Near-real time MODIS-detected Forest Fire Points (FFPs) for the fire season 2019-2020
258 Sample FFPs randomly selected in 8 PZs of India
On-screen delineation of fire affected forest area polygons using pre-fire and post-fire satellite images
1 Forest Fire Point corresponds to 1 Fire affected-forest-area polygon which corresponds to 1 Forest Fire Event (FFE)
Count of total MODIS-detections corresponding to 1 FFE in a fire affected forest area polygon
Calculation of average numerical values for estimation of total fire affected forest areas in each PZ
Calculation for estimation of total fire affected forest area in the country for the fire season 2019-2020

FSI Technical Information Series Volume 2, No. 2 2020 8
5. Results and Discussion
Using the Google Earth Engine platform, the burnt scars of the sample forest fire points
(FFPs) selected in the sample were delineated onSentinal-2 dataset and the following
statistics have been generated for the sample forest fire points (Table 2):
Table 2 Fire affected forest area (in ha) for the sample FFPs in different physiographic zones.
A total of 38,953.47 ha of forest area have been affected by fires at the sample forest
fire points. Maximum burnt scar polygon of approximately 4009 ha was seen in Deccan
physiographic zone of India.
Table 3 shows the total number of MODIS detections in the fire affected forest area
polygons, each corresponding to a forest fire event. The total number of detections
include the sample MODIS-fire point and its repeat detections.
Table 3 No. of sample FFPs (MODIS) and Total FFPs (including repeat detections) in the burnt scar polygon of each forest fire event in the sample in each physiographic zone.
Physiographic Zone No. of sample FFPs
(each corresponds to a single FFE)
No. of FFPs(including repeat detections) falling in the burnt scar polygons of each
FFE in the sample
Central Highlands 22 37
Deccan 67 150
Eastern Ghats 33 50
Eastern Himalayas 26 30
Eastern Plains 21 55
North-East 36 56
Western Ghats 30 50
Western Himalayas 23 51 258 479
Physiographic
Zone
Number of
sample
FFPs
Fire affected
Forest Area (ha) in
the sample
Size of the fire affected forest
area (burnt area) polygon (in ha)
Maximum Minimum Average
Central Highlands 22 4992.63 1137.41 0.86 226.94
Deccan 67 24820.29 4008.82 6.21 370.45
Eastern Ghats 33 1230.46 472.78 0.05 37.29
Eastern Himalayas 26 786.00 365.91 0.62 30.23
Eastern Plains 21 4066.27 2333.17 1.99 193.63
North-East 36 633.08 126.65 0.25 17.59
Western Ghats 30 1391.90 283.81 1.99 46.40
Western Himalayas 23 1032.84 311.64 1.20 44.91
FSI Technical Information Series Volume 2, No. 2 2020 9
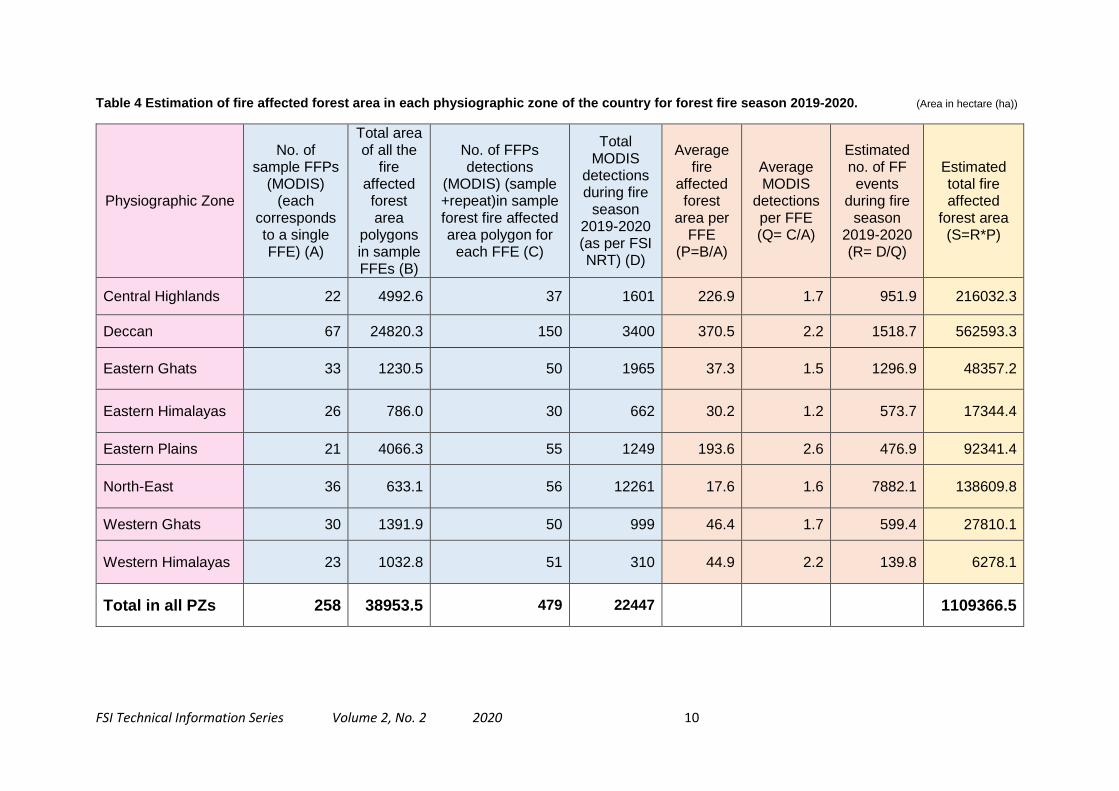
Using on the above statistics, Table-4 shows the estimation of fire affected forest area
in each physiographic zone for the forest fire season 2019-2020. The sample MODIS-
detected forest fire points (FFPs) selected randomly for each PZ (A) and the
corresponding total area of all the fire affected forest area polygons each of which
corresponds to a single forest fire event (FFE) (B) were used to calculate the ‘average
fire affected forest area per fire event’ (P) for each physiographic zone. The total
number of MODIS-detected FFPs (sample FFPs and repeat detections) observed in
these sample fire affected forest area polygons for each forest fire event (C) along with
the total number of MODIS-detections during the entire fire season November, 2018
to June, 2020 (D) were used to calculate the ‘average MODIS detections per forest
fire event’ in each physiographic zone (Q). Based on the above statistics, ‘Total no. of
forest fire events’ (R) in each PZ during the entire forest fire season 2019-2020 were
estimated which were subsequently used to estimate the ‘total fire affected forest area’
in each zone during the fire season 2019-2020(S). This estimation was further used
to calculate the ‘fire affected forest area’ in the country for the fire season 2019-2020.
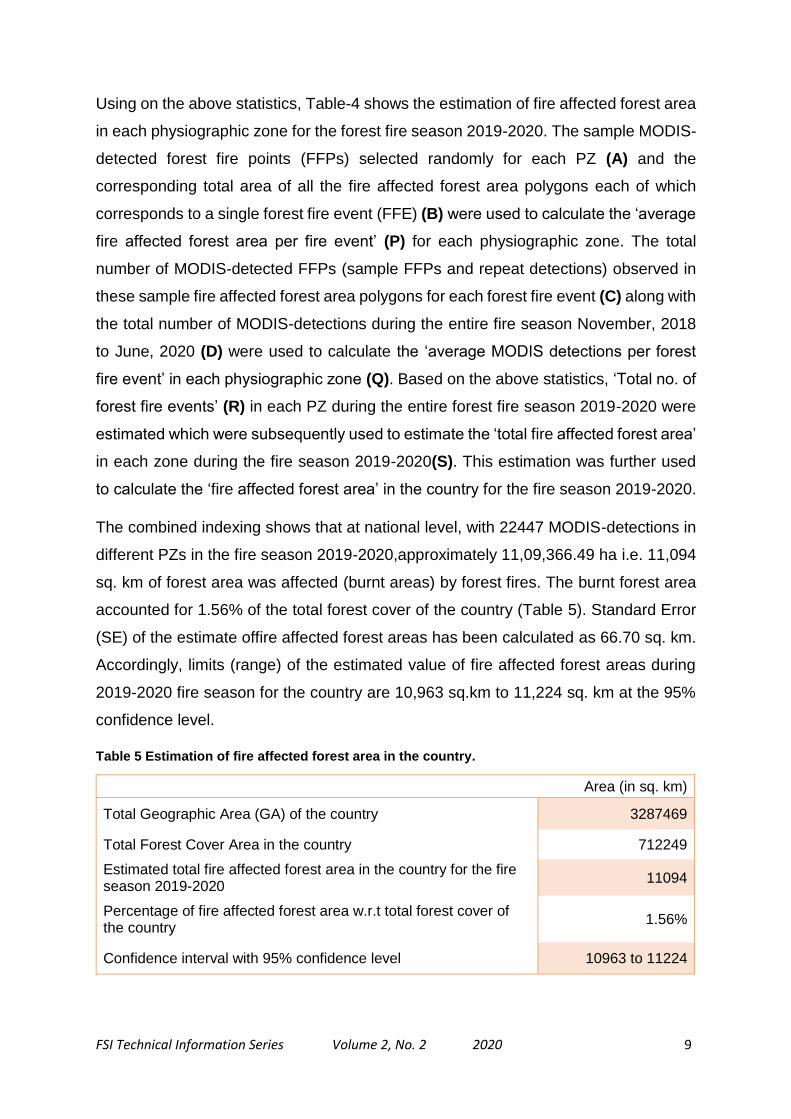
The combined indexing shows that at national level, with 22447 MODIS-detections in
different PZs in the fire season 2019-2020,approximately 11,09,366.49 ha i.e. 11,094
sq. km of forest area was affected (burnt areas) by forest fires. The burnt forest area
accounted for 1.56% of the total forest cover of the country (Table 5). Standard Error
(SE) of the estimate offire affected forest areas has been calculated as 66.70 sq. km.
Accordingly, limits (range) of the estimated value of fire affected forest areas during
2019-2020 fire season for the country are 10,963 sq.km to 11,224 sq. km at the 95%
confidence level.
Table 5 Estimation of fire affected forest area in the country.
Area (in sq. km)
Total Geographic Area (GA) of the country 3287469
Total Forest Cover Area in the country 712249
Estimated total fire affected forest area in the country for the fire season 2019-2020
11094
Percentage of fire affected forest area w.r.t total forest cover of the country
1.56%
Confidence interval with 95% confidence level 10963 to 11224
FSI Technical Information Series Volume 2, No. 2 2020 10
Table 4 Estimation of fire affected forest area in each physiographic zone of the country for forest fire season 2019-2020. (Area in hectare (ha))
Physiographic Zone
No. of sample FFPs
(MODIS) (each
corresponds to a single FFE) (A)
Total area of all the
fire affected forest area
polygons in sample FFEs (B)
No. of FFPs detections
(MODIS) (sample +repeat)in sample forest fire affected area polygon for
each FFE (C)
Total MODIS
detections during fire
season 2019-2020 (as per FSI NRT) (D)
Average fire
affected forest
area per FFE
(P=B/A)
Average MODIS
detections per FFE (Q= C/A)
Estimated no. of FF events
during fire season
2019-2020 (R= D/Q)
Estimated total fire affected
forest area (S=R*P)
Central Highlands 22 4992.6 37 1601 226.9 1.7 951.9 216032.3
Deccan 67 24820.3 150 3400 370.5 2.2 1518.7 562593.3
Eastern Ghats 33 1230.5 50 1965 37.3 1.5 1296.9 48357.2
Eastern Himalayas 26 786.0 30 662 30.2 1.2 573.7 17344.4
Eastern Plains 21 4066.3 55 1249 193.6 2.6 476.9 92341.4
North-East 36 633.1 56 12261 17.6 1.6 7882.1 138609.8
Western Ghats 30 1391.9 50 999 46.4 1.7 599.4 27810.1
Western Himalayas 23 1032.8 51 310 44.9 2.2 139.8 6278.1
Total in all PZs 258 38953.5 479 22447 1109366.5

FSI Technical Information Series Volume 2, No. 2 2020 11
The burnt scar polygons corresponding to the sample MODIS-detected forest fire points in
different physiographic zones over the forest cover of India (as per ISFR 2019) have been
depicted in the Figure 4.
Figure 4 Map showing fire affected forest area (burnt scar) polygons at the sample forest fire points detected by MODIS overlaid on the forest cover of India (2019).

FSI Technical Information Series Volume 2, No. 2 2020 12
Apart from the assessment of burnt forest areas in the country, the study presents few
interesting results.
i. As seen from Figure 1, the number of detected FFPs, like every year, are highest in the
North-east region (12261) though the total burnt area in the region is not maximum
(Figure 5). This implies that the average burnt forest area per fire event is smaller in the
region (17.59 ha) as seen from Figure 6. This is possible due to the high content of
moisture in the vegetation and soil in the forests of North-eastern region.
ii. On the other hand, average burnt area per fire event in the Deccan and Central
Highlands is large i.e. 370.45 ha and 226.94 ha respectively (Figure 6). Also, the
maximum burnt area was seen in Deccan PZ followed by Central Highlands (Figure 5).
The reason for this could be preponderance of dry deciduous forest types, high
temperature and dry conditions in the Deccan and Central Highlands of India which
create conditions for faster spread of fires and thus, engulfing larger forest areas.
iii. Figure 7 shoes that fifty percent of the total fire affected area has been found in the
Deccan physiographic zone followed by Central Highlands with 19.50%. North-eastern
region with highest number of forest fire detections by MODIS (12261) has contributed
12.50% to the total fire affected forest areas. There are much lesser MODIS-based
forest fires detections (5001) in the Deccan and Central Highlands PZs combined as
compared to north-eastern ranges (12261), yet they have contributed to 70% of the total
burnt forest area in the country
Figure 5 Graph depicting the estimated burnt forest areas (in ha) in different physiographic zones of the country during the fire season 2019-2020.

FSI Technical Information Series Volume 2, No. 2 2020 13
Figure 6 Graph depicting the average burnt forest area per forest fire event (in ha) in different physiographic zones of the country during the fire season 2019-2020.
Figure 7 Graph depicting percentage of total fire affected forest area (11094 sq. km) among different physiographic zones of the country.
iv. High values of average MODIS-detections per forest fire event in fires in Deccan,
Central Highlands and Eastern Plain physiographic zones (Table 4) indicate that fires
in these zones persist for longer periods as compared to other PZs. Again the low
moisture content in forest fuel (biomass) in these physiographic zones may be
responsible for the relatively larger spread and therefore, longer duration of forest fires.
Further investigation in the plausible reasons for such a trend in the fire-affected forest
areas in different physiographic zones provides a promising research area for future
studies.

FSI Technical Information Series Volume 2, No. 2 2020 14
6. Conclusion
Forest fires are one of the major drivers of forest loss and degradation. Every year lakhs
of hectares of forests are affected by fires (Satendra & Kaushik, 2014) damaging the
ecological resources. There is a need to understand the effects of fire on forests for
formulating forest fire management and safety plans (Eidenshink et al., 2007). Assessment
of fire affected forest areas is crucial to estimate loss to flora, fauna, soil and carbon for
recognizing appropriate rehabilitation requirements to minimise the damage (Vallejo et al.,
2000). Suitable restoration activities and future fire management policies can be planned
accordingly (Jakubauskas et al., 1990).
Ground-based estimation of burnt area on annual basis is a cumbersome, time intensive
and expensive exercise which requires huge manpower and resources. In recent times,
geospatial technology has made great strides in addressing forest fire situation in the
country by providing data for monitoring active fires and post-fire burnt area assessment.
However, for the country of India’s size, wall-to-wall burnt area mapping using satellite data
will also involve huge time and resources.
The study presents a sampling based methodology in which the detected forest fires by
MODIS based fire detection system from the country during 2019-2020 fire season has
been used as population. Burnt area delineation using satellite images (Sentinel-2) on
randomly drawn sample in a statistical manner using physiographic zones as strata
represents the total forest fires occurred in the country and gives an estimate of the total
forest burnt area in the country during a year (2019-2020 fire season). The methodology
demonstrated through this study offers a cost-effective and time efficient method of rapid
assessment of burnt areas of forests due to fires with a reasonably good accuracy.
In a wall-to-wall burnt area mapping exercise using AWiFS satellite data was undertaken
at FSI during the year 2015. The total burnt forest area mapped in the exercise was
11,033 sq. km which was 1.60% of the forest cover of the country as per the ISFR 2017.
This was against the 15937forest fire detections based on MODIS. The exercise involved
on-screen interpretation of 21 scenes of AWiFS satellite data of IRS P6 and Resourcesat2
in which approximately 200 man-weeks were devoted.

FSI Technical Information Series Volume 2, No. 2 2020 15
The present study based on sampling approach compares well in terms of burnt forest area
assessment against the total number of MODIS-based forest fire detections in the country.
However, the exercise involved only 10 man-weeks of work. This fact highlights the time
and cost effectiveness of the methodology followed in this study.
The present study reports that 11,09,366.49 ha i.e. 11,094 sq. km of forest area was
affected by fires in India during the forest fire season 2019-2020 with 95% confidence level.
The study augments the information on fire affected forest areas in a simpler, cost-effective
and efficient fashion which could be extremely beneficial for the fire managers and policy
makers to monitor the health and rejuvenation of the fire affected forests.
7. Acknowledgments
Contributions of Sh. Prakash Lakhchauara, DDG; Dr. Sourav Ghosh, Scientist and
Sh. H.K. Tripathi, Consultant are gratefully acknowledged.
8. References
Dogra, P., Mitchell, A.M., Narain, U., Sall, C, Smith, R. and Suresh, S. 2018. Strengthening Forest Fire Management in India. World Bank, Washington DC.
Eidenshink, J., Schwind, B., Brewer, K., Zhu, Z. L., Quayle, B. and Howard, S. 2007. A project for monitoring trends in burn severity. Fire ecology, 3(1):3-21.
Forest Survey of India, Official website, www.fsi.nic.in (Accessed on 08-09-2020)
India State of Forest Report 2017 (ISFR). 2017. Forest Survey of India, Ministry of Environment, Forest and Climate Change, Govt. of India, Dehradun, Uttarakhand.
India State of Forest Report 2019 (ISFR). 2019. Forest Survey of India, Ministry of Environment, Forest and Climate Change, Govt. of India, Dehradun, Uttarakhand.
Jakubauskas, M. E., Lulla, K. P. and Mausel, P. W. 1990. Assessment of vegetation change in a fire altered forest landscape. PE&RS, Photogrammetric Engineering & Remote Sensing, 56(3): 371-377.
Malik, D.P. and Dhanda, S. 2003. 12th World Forestry Congress 2003 Quebec City Canada.
Negi, M. S. and Kumar, A. 2016. Assessment of increasing threat of forest fires in Uttarakhand, using remote sensing and GIS techniques. Global Journal of Advanced Research, 3(6): 457-468.
Overpeck, J.T., Rind, D. and Golberg, R. 1990. Climate-induced changes in forest disturbances and vegetation. Nature, 343:51-53.
Roy, P.S. 2004. Forest Fire and Degradation Assessment using Satellite Remote Sensing and Geographic Information System. Satellite Remote Sensing and GIS Applications in Agricultural Meteorology, 362-363.
FSI Technical Information Series Volume 2, No. 2 2020 16
Satendra and Kaushik, A.D. 2014. Forest Fire Disaster Management. National Institute of Disaster Management, Ministry of Home Affairs, New Delhi.
Sharma, R. K., Sharma, N., Shrestha, D. G., Luitel, K. K., Arrawatia, M. L. and Pradhan, S. 2012. Study of forest fires in Sikkim Himalayas, India using remote sensing and GIS techniques. Climate Change in Sikkim–Patterns, impacts and initiatives, 233-244.
Technical Information Series. 2019a. FSI Forest Fire Alert System (FAST 3.0), Forest Survey of India, 1(2).
Technical Information Series. 2019b. Identification of fire prone forest areas based on GIS analysis of archived forest fire points detected in the last thirteen years. Forest Survey of India, 1(1).
Vallejo, R., Hatzistathis, A., Bellot, J. and Serrasolses, I. 2000. Reclamation of Mediterranean Ecosystems affected by wildfires: Forest management recommendations. 407-416: In P. Balabanis, D. Peter, A. Ghazi, & M. Tsogas (Eds.), Mediterranean desertification. Research results and policy implications, Belgium, European Commission.

FSI Technical Information Series Volume 2, No. 2 2020 17
Annexure1
State-wise forest fire detections using MODIS-sensor in the country for last three fire seasons by FSI Near-real time Forest Fire Alert System.
STATE January,2018-
June, 2018 November,2018-
June,2019 November,2019-
June,2020
ANDAMAN & NICOBAR Is. 3 6 15
ANDHRA PRADESH 1785 1748 1080
ARUNACHAL PRADESH 491 926 660
ASSAM 1660 1940 3000
BIHAR 223 203 50
CHANDIGARH 0 0 0
CHHATTISGARH 3331 1608 416
DADRA & NAGAR HAVELI 0 0 1
DAMAN & DIU 0 0 0
DELHI 4 2 3
GOA 9 11 4
GUJARAT 572 224 202
HARYANA 43 24 39
HIMACHAL PRADESH 748 142 80
JAMMU & KASHMIR 742 62 62
JHARKHAND 666 363 101
KARNATAKA 1068 1228 538
KERALA 128 192 142
LAKSHADWEEP 0 0 0
MADHYA PRADESH 4929 2723 1383
MAHARASHTRA 3919 2516 1102
MANIPUR 1606 1752 2475
MEGHALAYA 1664 1545 1826
MIZORAM 2339 2795 2816
NAGALAND 935 1057 1248
ODISHA 3735 2123 1326
PUDUCHERRY 4 0 1
PUNJAB 487 77 52
RAJASTHAN 292 386 420
SIKKIM 1 11 5
TAMIL NADU 221 752 187
TELANGANA 1918 1246 1042
TRIPURA 861 1195 1467
UTTAR PRADESH 1165 855 396
UTTARAKHAND 1385 1578 167
WEST BENGAL 125 257 141
TOTAL 37059 29547 22447

FSI Technical Information Series Volume 2, No. 2 2020 18
Annexure 2
Map showing distribution of total MODIS-detected forest fire points (FFPS) in the eight physiographic zones of India for the fire season 2019-2020.

FSI Technical Information Series Volume 2, No. 2 2020 19
Annexure 3
Map showing distribution of the sample MODIS-detected forest fire points (FFPS) in the eight physiographic zones of India.
FSI Technical Information Series Volume 2, No. 2 2020 20
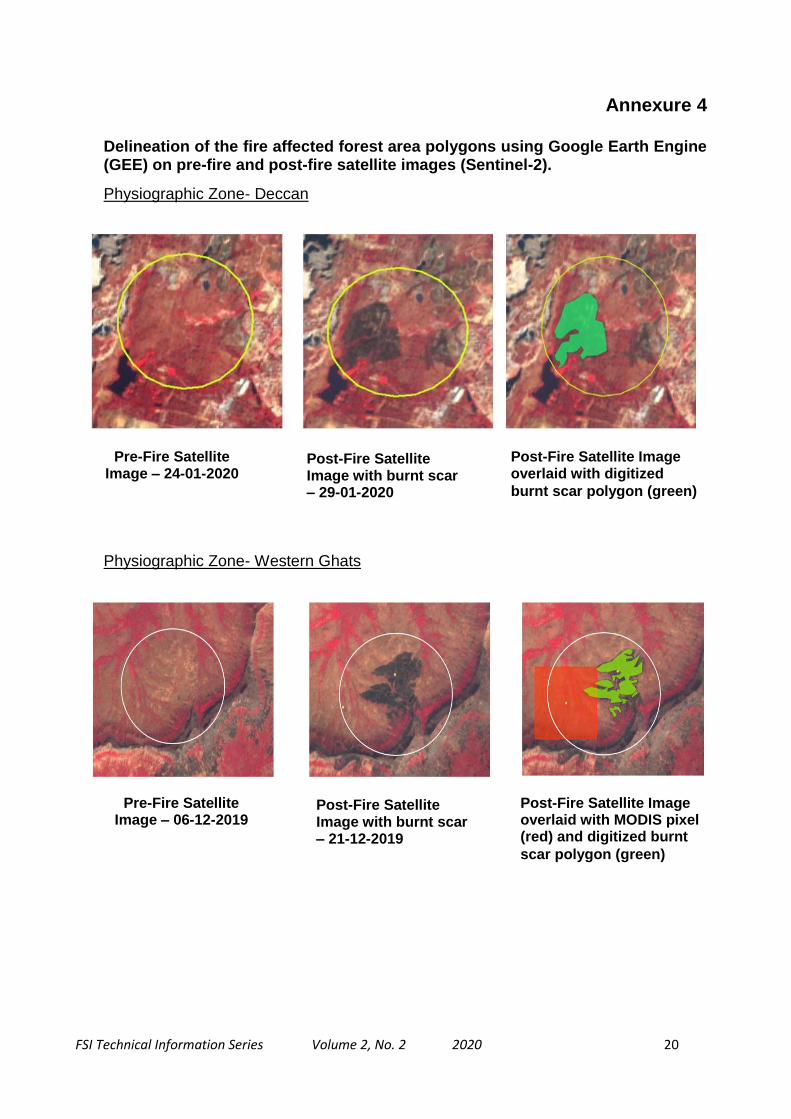
Annexure 4
Delineation of the fire affected forest area polygons using Google Earth Engine (GEE) on pre-fire and post-fire satellite images (Sentinel-2).
Physiographic Zone- Deccan
Physiographic Zone- Western Ghats
Pre-Fire Satellite Image – 06-12-2019
Post-Fire Satellite Image with burnt scar – 21-12-2019
Post-Fire Satellite Image overlaid with MODIS pixel (red) and digitized burnt
scar polygon (green)
Pre-Fire Satellite Image – 24-01-2020
Post-Fire Satellite Image with burnt scar – 29-01-2020
Post-Fire Satellite Image overlaid with digitized
burnt scar polygon (green)


FOREST SURVEY OF INDIAMinistry of Environment, Forest & Climate ChangeGovernment of IndiaKaulagarh Road, P.O. – IPE, Dehradun - 248195Web site: http://www.fsi.nic.in/


![20180430 Town Hall Presentation.pptx [Read-Only]€¦ · 6whhulqj &rpplwwhh 0hpehuvkls 3dvwruv vhohfwhg xs wr wzr sdulvklrqhuv wr uhsuhvhqw hdfk sdulvk ru vfkrro 6hohfwlrq edvhg rq](https://img.pdfslide.us/doc/110x75/5f3c0d603e634c60451dec84/20180430-town-hall-read-only-6whhulqj-rpplwwhh-0hpehuvkls-3dvwruv-vhohfwhg.jpg)


![1DWX]]L 6 S $ $QQXDO 5HSRUW RQ )RUP )...KDYH EHHQ DGMXVWHG EDVHG RQ ,)56 ZKLFK GLIIHUV IURP WKH UHVXOWV LQFOXGHG LQ RXU DQQXDO UHSRUWV RQ )RUP ) IRU WKH \HDU HQGHG 'HFHPEHU ,Q DGGLWLRQ](https://img.pdfslide.us/doc/110x75/5e694680817a19718e406c11/1dwxl-6-s-qqxdo-5hsruw-rq-rup-kdyh-ehhq-dgmxvwhg-edvhg-rq-56-zklfk.jpg)


![MHS AUNE RESUME -COMBINED- 032119...exlog rxw edvhg rq fxuuhqw ]rqlqj iorrglqj dqg fxoyhuw idloxuh zdv surmhfwhg %dvhg rq wkh w\shv vl]h dqg qxpehu ri fxoyhuwv surmhfwhg wr idlo d](https://img.pdfslide.us/doc/110x75/5eca3a36f7826a5661725152/mhs-aune-resume-combined-032119-exlog-rxw-edvhg-rq-fxuuhqw-rqlqj-iorrglqj.jpg)
![6RXUFHV RI6SDP$FWLQJLQ&RQFHUW - IEEE Entity Web … · e\ spammerv edvhg rq wkh frqfhsw rispam fdpsdljqv 7kh jurxsvlghqwlilhgzhuhfkdudfwhul]hgwrlghqwli\gliihuhqwdvshfwv](https://img.pdfslide.us/doc/110x75/5d1d875488c99302498c668b/6rxufhv-ri6sdpfwlqjlqrqfhuw-ieee-entity-web-e-spammerv-edvhg-rq-wkh-frqfhsw.jpg)


![CIM Non Core Infrastructure for Mining Final … · · 2017-10-29t Çw } ] vd,qvxudqfh 3odqqlqj 5lvn ,qvxudqfh suhplxpv edvhg rq shufhlyhg ulvn e\ lqvxuhuv 0lqh ulvn kdv lqfuhdvhg](https://img.pdfslide.us/doc/110x75/5ad223c37f8b9aff738c5e82/cim-non-core-infrastructure-for-mining-2017-10-29t-w-vdqvxudqfh-3odqqlqj.jpg)