Embed Size (px)
Citation preview
EDUCATIVE ASSESSMENT &MEANINGFUL SUPPORT2018 edTPA Administrative Report
Released October 2019
®

Copyright © 2019 Board of Trustees of the Leland Stanford Junior University. All rights reserved.
The edTPA trademarks are owned by The Board of Trustees of the Leland Stanford Junior University.
Use of the edTPA trademarks is permitted only pursuant to the terms of a written license agreement.
Copyright © 2019 Pearson Education, Inc. or its affiliate(s). All rights reserved. Pearson, P.O. Box 226, Amherst, MA 01004
edTPA Annual Administrative Report
Data range: 1/1/2018 – 12/31/2018
Copyright © 2019 Board of Trustees of the Leland Stanford Junior University. All rights reserved.
Copyright © 2019 Pearson Education, Inc. or its affiliate(s). All rights reserved. Pearson, P.O. Box 226, Amherst, MA 01004 ii
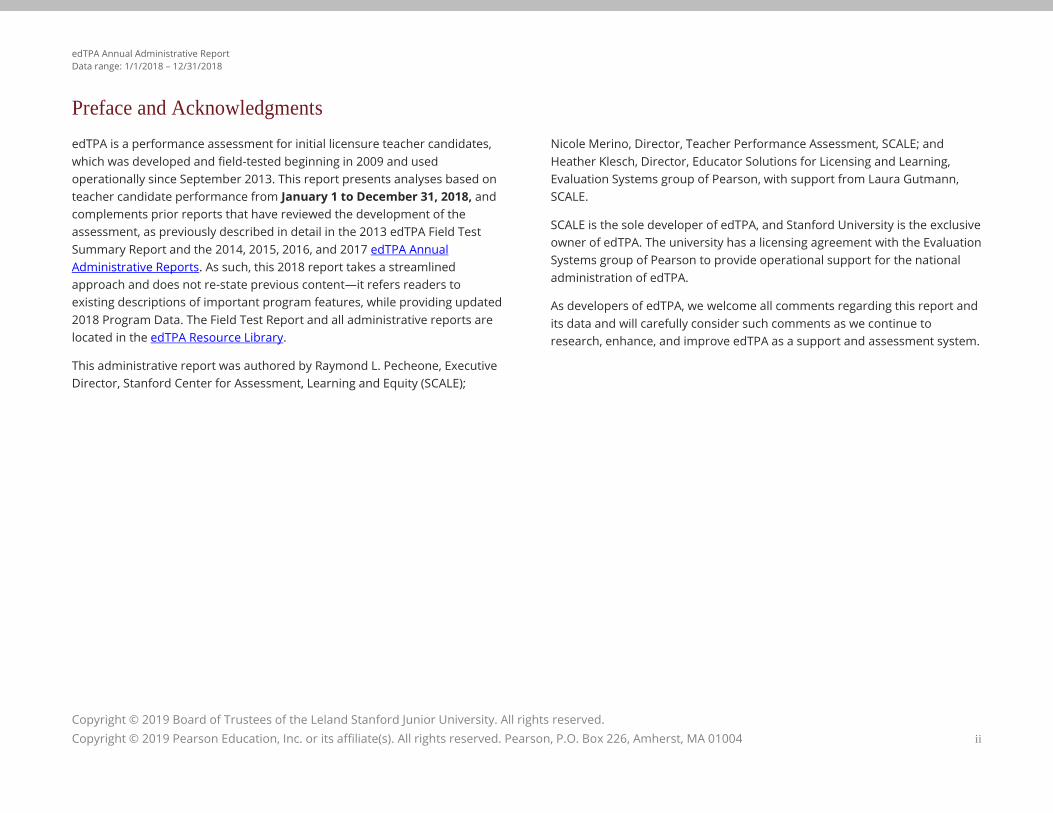
Preface and Acknowledgments
edTPA is a performance assessment for initial licensure teacher candidates,
which was developed and field-tested beginning in 2009 and used
operationally since September 2013. This report presents analyses based on
teacher candidate performance from January 1 to December 31, 2018, and
complements prior reports that have reviewed the development of the
assessment, as previously described in detail in the 2013 edTPA Field Test
Summary Report and the 2014, 2015, 2016, and 2017 edTPA Annual
Administrative Reports. As such, this 2018 report takes a streamlined
approach and does not re-state previous content—it refers readers to
existing descriptions of important program features, while providing updated
2018 Program Data. The Field Test Report and all administrative reports are
located in the edTPA Resource Library.
This administrative report was authored by Raymond L. Pecheone, Executive
Director, Stanford Center for Assessment, Learning and Equity (SCALE);
Nicole Merino, Director, Teacher Performance Assessment, SCALE; and
Heather Klesch, Director, Educator Solutions for Licensing and Learning,
Evaluation Systems group of Pearson, with support from Laura Gutmann,
SCALE.
SCALE is the sole developer of edTPA, and Stanford University is the exclusive
owner of edTPA. The university has a licensing agreement with the Evaluation
Systems group of Pearson to provide operational support for the national
administration of edTPA.
As developers of edTPA, we welcome all comments regarding this report and
its data and will carefully consider such comments as we continue to
research, enhance, and improve edTPA as a support and assessment system.
edTPA Annual Administrative Report
Data range: 1/1/2018 – 12/31/2018
Copyright © 2019 Board of Trustees of the Leland Stanford Junior University. All rights reserved.
Copyright © 2019 Pearson Education, Inc. or its affiliate(s). All rights reserved. Pearson, P.O. Box 226, Amherst, MA 01004 iii
Table of Contents
PREFACE AND ACKNOWLEDGMENTS ................................................. II
TABLE OF CONTENTS ........................................................................ III
EXECUTIVE SUMMARY .......................................................................1
EDTPA DESIGN.......................................................................................... 1
EDTPA’S EDUCATIVE PURPOSE – A SUPPORT AND ASSESSMENT SYSTEM ............ 2
SCORER TRAINING, MONITORING, AND RELIABILITY OF SCORES ......................... 2
CANDIDATE PERFORMANCE ......................................................................... 3
CONCLUSION............................................................................................. 3
EXTERNAL LINKS TO PROGRAM FEATURES ..........................................5
INTRODUCTION .................................................................................6
STATES PARTICIPATING IN EDTPA ................................................................. 6
ROLE OF THE PARTNERS .............................................................................. 6
RELIABILITY AND VALIDITY EVIDENCE .................................................8
INTER-RATER AGREEMENT .......................................................................... 8
INTERNAL CONSISTENCY ............................................................................ 10
INTERNAL STRUCTURE .............................................................................. 11
CANDIDATE PERFORMANCE ............................................................. 13
OVERALL SCORES ..................................................................................... 13
TASK AND RUBRIC SCORES .......................................................................... 14
PERFORMANCE BY CONTENT FIELD ............................................................. 15
PERFORMANCE BY CONSEQUENTIAL USE ..................................................... 16
MODELED CANDIDATE PASSING RATES ........................................................ 16
PERFORMANCE BY DEMOGRAPHIC SUBGROUPS ............................................ 17
CONCLUSION........................................................................................... 23
APPENDIX A: INTERNAL STRUCTURE ................................................. 24
APPENDIX B: PERFORMANCE BY CONTENT FIELD .............................. 27
APPENDIX C: SCORE DISTRIBUTIONS BY CONTENT FIELD ................... 30
APPENDIX D: PORTFOLIOS REPRESENTED BY STATE .......................... 32
APPENDIX E: CONSEQUENTIAL USE BY CONTENT FIELD ..................... 33
APPENDIX F: ANOVAS AND POST-HOC ANALYSES ............................. 35
CITATIONS ....................................................................................... 38
edTPA Annual Administrative Report
Data range: 1/1/2018 – 12/31/2018
Copyright © 2019 Board of Trustees of the Leland Stanford Junior University. All rights reserved.
Copyright © 2019 Pearson Education, Inc. or its affiliate(s). All rights reserved. Pearson, P.O. Box 226, Amherst, MA 01004 1
Executive Summary
The Stanford Center for Assessment, Learning and Equity (SCALE), the
American Association of Colleges of Teacher Education (AACTE), and the
Evaluation Systems group of Pearson are pleased to release the 2018
Administrative Report. This report presents candidate performance data
from over 45,300 candidates who participated in edTPA during the fifth full
operational year (January 1 to December 31, 2018), associated analyses
affirming reliability of scoring, and validity evidence supporting its intended
use as a measure of readiness to teach and a metric used to inform program
approval or accreditation. As in previous years, all analyses and results have
been informed and reviewed by a technical advisory committee of nationally
recognized psychometricians and meet the technical standards for licensure
assessments set forth by AERA, APA, & NCME (2014).
SCALE and AACTE commend the 870+ educator preparation programs in 41
states that have contributed to the development and field testing of edTPA
and its use since 2009. We also commend the teaching candidates who have
engaged with edTPA during the development stages, and since the
operational launch in September 2013, as a reflective experience that
demonstrates the knowledge, skills, and abilities embedded in their real
teaching with real students in real classrooms across the country. Moreover,
edTPA was purposefully designed to reflect the job-related teaching tasks
that are represented in the National Board for Professional Teaching
Standards (NBPTS) as it pertains to the skills and competencies attained as
part of teacher preparation.
Developed by subject-specific faculty design teams and staff at SCALE, with
input from hundreds of teachers and teacher educators from across the
country, edTPA is the first nationally available, educator-designed
support and assessment system for teachers entering the profession. It
provides a measure of teacher candidates’ readiness to teach that can inform
licensure, accreditation decisions, and program completion. Most
importantly, edTPA is an educative assessment that supports candidate
learning and preparation program renewal.
edTPA Design
edTPA is a subject-specific performance assessment that evaluates a
common set of teaching principles and teaching behaviors as well as
pedagogical strategies that are focused on specific content learning
outcomes for P–12 students. SCALE’s extensive Review of Research on
Teacher Education provides the conceptual and empirical rationale for
edTPA’s three-task design and the rubrics’ representation of initial
competencies needed to be ready to teach. The assessment systematically
examines an authentic cycle of teaching aimed at subject-specific student
learning goals, using evidence derived from candidates’ practice in their
student teaching or internship placement. A cycle of teaching, captured by
the three tasks that compose an edTPA portfolio, includes:
1. planning,
2. instruction, and
3. assessment of student learning.
Authentic and job-related evidence includes lesson plans, instructional
materials, student assignments and assessments, feedback on student work,
and unedited video recordings of instruction. Also assessed through the
three tasks are candidates’ abilities to develop their students’ academic
language and to justify and analyze their own teaching practices.
All 28 edTPA handbooks share approximately 80% of their design, assessing
pedagogical constructs that underlie the integrated cycle of planning,
instruction, and assessment. The other 20% features key subject-specific
components of teaching and learning drawn from the content standards for
student learning and pedagogical standards of national organizations. For
example, consistent with the National Council of Teachers of Mathematics
standards, the elementary, middle childhood, and secondary mathematics
versions of edTPA require candidates to demonstrate subject-specific, grade-
level-appropriate pedagogy in mathematics. The assessment requires that
the central focus of their learning segment supports students’ development
edTPA Annual Administrative Report
Data range: 1/1/2018 – 12/31/2018
Copyright © 2019 Board of Trustees of the Leland Stanford Junior University. All rights reserved.
Copyright © 2019 Pearson Education, Inc. or its affiliate(s). All rights reserved. Pearson, P.O. Box 226, Amherst, MA 01004 2
of conceptual understanding, procedural fluency, and problem
solving/reasoning skills of a standards-based topic; that their lesson design
includes mathematics-pertinent language demands and supports; and that
assessments provide opportunities for students to demonstrate
development of mathematics concepts and reasoning skills.
edTPA’s Educative Purpose – A Support and Assessment System
Unlike typical licensure assessments external to programs, edTPA is intended
to be embedded in a teacher preparation program and to be “educative” for
candidates, faculty, and programs. Candidates deepen their understanding
of teaching while preparing for edTPA and reflecting on their strengths and
challenges as they move forward into the profession. For faculty and
programs, the various edTPA resources and candidate, program, and
campus results can be used to determine areas of program strength and
curricular renewal (Whittaker, Pecheone, & Stansbury, 2018; Pecheone &
Whittaker, 2016). In addition, the professional growth plan resource uses
edTPA results and other evidence of teaching to inform candidates’ goal
setting for induction and the early years of teaching.
Since edTPA launched its first “online community” in 2011, membership has
grown to about 10,660 faculty from over 870 teacher preparation programs.
The website (edtpa.AACTE.org) also includes publicly available materials for
various stakeholders. In addition to the website, edTPA offers a National
Academy of experienced consultants available to provide professional
development to new users and to network in a learning community across
the country. Lastly, programs using edTPA are provided with a variety of
tools and reporting formats to access, analyze, and make decisions about
their own candidate performance data, as well as state and national
summary reports.
Scorer Training, Monitoring, and Reliability of Scores
Educators play a critical role in the scoring of edTPA. Over 3,000 qualified
teachers and teacher educators now serve as scorer trainers, supervisors, or
scorers. Scorers must be P–12 teachers or teacher preparation faculty with
significant pedagogical content knowledge in the field in which they score, as
well as have experience working as instructors or mentors for novice
teachers (e.g., NBTPS teachers). Before becoming an official edTPA scorer,
educators must go through an extensive scorer training curriculum
developed by SCALE and meet qualification standards demonstrated by
scoring consistently and accurately. Once scorers qualify and score
operationally, they are systematically monitored during the scoring process
(through quality monitoring processes such as backreading,
validity/calibration portfolios, and requalification exercises) to ensure that
they continue to score reliably.
Scorer reliability was evaluated using several different statistical tests. In a
random sample of 3,470 portfolios double-scored independently by two
scorers, the scorers assigned either the same or adjacent scores (total
agreement) in approximately 96% of all cases. Kappa n agreement rates
reveal that scorers tend to assign scores within +/- 1 and rarely assign scores
that differ by more than 1 point (overall kappa n reliability = .91). As in all
previous reports, all reliability coefficients indicate a high degree of internal
consistency of rubrics to the measured construct (readiness to teach). These
results are consistent with the Standards for Educational and Psychological
Testing (AERA, APA, & NCME, 2014) technical standards for licensure
assessments of this type and support the use of edTPA scores as a reliable,
consistent estimate of a prospective teacher’s readiness to teach.
edTPA was developed as an authentic, subject-specific, performance-based
support and assessment system of a candidate’s readiness to teach.
Following the validity guidelines presented in the Standards for Educational
and Psychological Testing (AERA, APA, & NCME, 2014), our previous reports
define the constructs assessed by edTPA and present evidence that
examines its use and interpretations. The validity sections review sources of
validity evidence for edTPA. These include the empirical research and theory
on which the development was based; the design process and content
development to ensure that the assessment represents the skills, knowledge,
and abilities that represent a candidate’s readiness to teach; and evidence
edTPA Annual Administrative Report
Data range: 1/1/2018 – 12/31/2018
Copyright © 2019 Board of Trustees of the Leland Stanford Junior University. All rights reserved.
Copyright © 2019 Pearson Education, Inc. or its affiliate(s). All rights reserved. Pearson, P.O. Box 226, Amherst, MA 01004 3
based on content and internal structure. Each year we present results from
Confirmatory Factor Analyses (CFA) and a polytomous item response theory
(IRT) model that provide empirical support for the edTPA constructs of
planning, instruction, and assessment. This year’s report affirms our previous
findings.
Candidate Performance
This report presents performance data from 45,365 first-attempt officially
scored edTPA submissions including average scores and distributions overall
by task and by rubric for the entire sample, as well as for each of the 28
individual content fields. The total score, computed as an aggregation of
scores on a 5-point scale across 15 rubrics, ranges from 5 to 75 total points.
The average edTPA score across 45,365 portfolios from fields with 15-rubric
handbooks (including the first 15 rubrics of Elementary Education: Literacy
with Mathematics Task 4 and Elementary Education: Mathematics with
Literacy Task 4 handbooks) was 44.3, with a total standard deviation of 6.4,
and a common standard error of measurement of 4.33 (Lord, 1959).
Performance by task is an aggregation of scores on the 5 rubrics that make
up each of the three tasks; these range from 5 to 25 points for each task.
Scores across content fields were examined overall, as well as disaggregated
based on state-wide policy regarding consequential edTPA use—that is,
whether or not the results of edTPA are used to make consequential
decisions about candidates or programs. Based on the national
recommended professional performance standard of 42 (note that to date
no state has a cut score of 42), the pass rate for all candidates who submitted
an edTPA portfolio in 2018 was 72.0% across all states, and 74.0% in states
using the assessment consequentially. Note that cut scores vary by state as
do passing rates, and to date state cut scores range from 35 to 41. See
details in the body of the report for pass rates by cut score.
Due to large differences in sample size, populations represented within
the sample, and small numbers of total submissions in certain fields,
interpretations and comparisons across fields should be approached
with caution and should not be generalized across the entire
profession.
When submitting an edTPA portfolio for official scoring, the candidate is
asked to provide demographic information in several categories: gender,
ethnicity, teaching placement context (including school location [city, rural,
suburb, or town]), length of placement, student characteristics (% English
learner, % special education eligibility, % free/reduced lunch), program type
(traditional or alternative route), education level, and primary language.
Portfolios submitted in states that have policy for consequential use of
edTPA were used to examine performance by these demographic categories
(N of 38,721). These analyses revealed that all demographic variables taken
together explained less than 3% of the total variance in edTPA scores.
Differences by racial/ethnic group were small, women generally scored more
highly than men, and suburban teachers on average scored more highly than
teachers in other teaching contexts. Performance differences were found
between African American and White candidates, with differences in mean
performance at less than one half of a standard deviation, although African
American candidates are closing the mean performance gap. Small sample
sizes for some groups and differences in group sizes prevent strong
generalizations.
edTPA is committed to providing equal opportunity for all teacher candidates
and will continue to explore research in this area as well as monitor
candidate performance, scorer training, assessment design, and
implementation for any potential sources of differential impact.
Conclusion
As with the Field Test data (2013) and those of the previous administrative
reports for 2014, 2015, 2016, and 2017, data presented here are consistent
with the technical standards of APA, AERA, and NCME (2014) and support the
use of edTPA to grant an initial license to pre-service teacher candidates as
well as to inform state and national accreditation. The reporting of
performance of all candidates who submitted edTPA portfolios in 2018 is
presented for all content fields and informs the use of edTPA across states.

edTPA Annual Administrative Report
Data range: 1/1/2018 – 12/31/2018
Copyright © 2019 Board of Trustees of the Leland Stanford Junior University. All rights reserved.
Copyright © 2019 Pearson Education, Inc. or its affiliate(s). All rights reserved. Pearson, P.O. Box 226, Amherst, MA 01004 4
As is the case with NBPTS, educative use of a performance-based assessment
is more than a testing exercise completed by a candidate. edTPA’s emphasis
on support for implementation mirrors the NBPTS use of professional
networks of experienced users to assist others as they prepare for the
assessment. The opportunities for educator preparation program faculty and
their P–12 partners to engage with edTPA are instrumental to its power as an
educative tool. The extensive and growing library of resources developed by
SCALE, the National Academy of consultants, and state infrastructures of
learning communities for faculty and program leaders promote edTPA as a
tool for candidate and program learning. As candidates are provided with
formative opportunities to develop and practice the constructs embedded in
edTPA throughout their programs and reflect on their edTPA experience with
faculty and P–12 partners, they are more likely to internalize the cycle of
effective teaching (planning, instruction, and assessment) as a way of
thinking about practice—a way of thinking about students and student
learning that will sustain them in the profession well beyond their early years
in the classroom.

edTPA Annual Administrative Report
Data range: 1/1/2018 – 12/31/2018
Copyright © 2019 Board of Trustees of the Leland Stanford Junior University. All rights reserved.
Copyright © 2019 Pearson Education, Inc. or its affiliate(s). All rights reserved. Pearson, P.O. Box 226, Amherst, MA 01004 5
External Links to Program Features
Comparatively to previous year reports, the 2018 Administrative Report is a
streamlined version similar to the structure of the 2017 report. We present
only the most up-to-date information about program participation and
resources, followed by the findings for validity and reliability, and candidate
performance. Links to previously published reports and resources are
provided for the following topics:
National Academy
edTPA Reports (including Semi-Annual Reporting)
States Participating in edTPA and State Policy Summary
Scoring:
Scorer Training
Scoring Model
Candidate Submissions, Originality, Score Confirmation, and Retakes
Validity Evidence:
Content Validity and Job Analysis
Construct Validity
Consequential Validity
Concurrent Validity
Predictive Validity
Standard Setting – National and State
Supporting Committees:
Policy Advisory Council
Technical Advisory Committee
edTPA Annual Administrative Report
Data range: 1/1/2018 – 12/31/2018
Copyright © 2019 Board of Trustees of the Leland Stanford Junior University. All rights reserved.
Copyright © 2019 Pearson Education, Inc. or its affiliate(s). All rights reserved. Pearson, P.O. Box 226, Amherst, MA 01004 6
Introduction
States Participating in edTPA
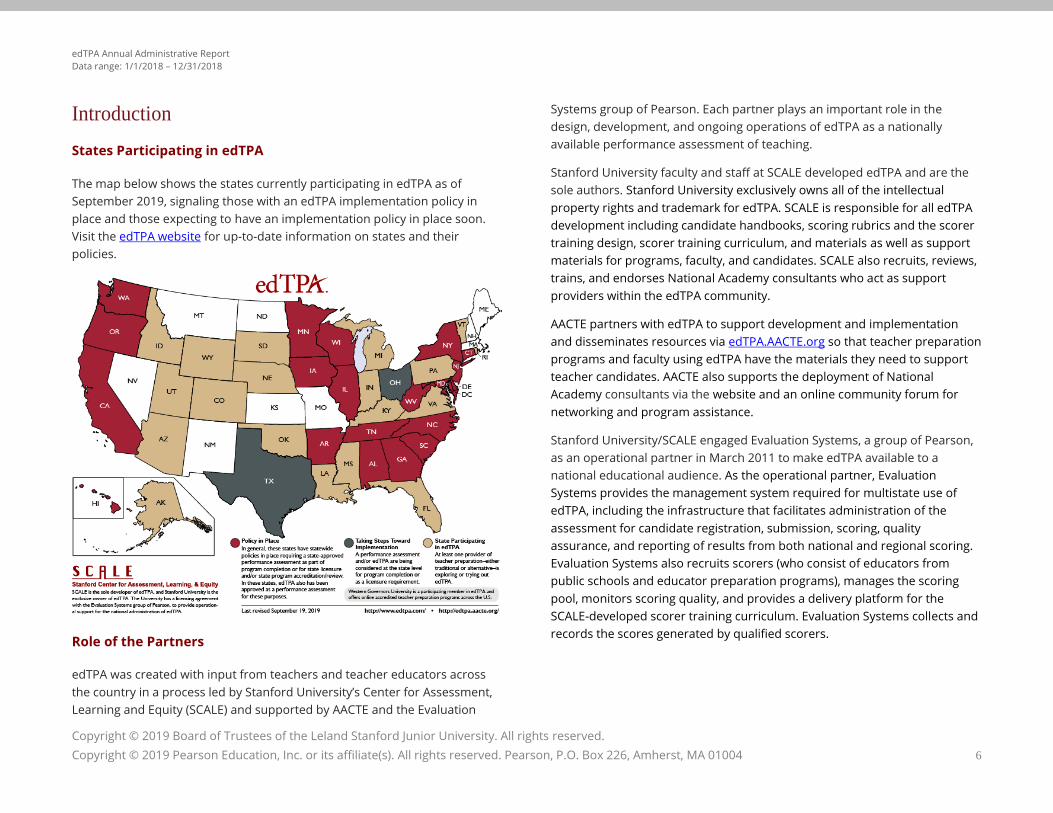
The map below shows the states currently participating in edTPA as of
September 2019, signaling those with an edTPA implementation policy in
place and those expecting to have an implementation policy in place soon.
Visit the edTPA website for up-to-date information on states and their
policies.
Role of the Partners
edTPA was created with input from teachers and teacher educators across
the country in a process led by Stanford University’s Center for Assessment,
Learning and Equity (SCALE) and supported by AACTE and the Evaluation
Systems group of Pearson. Each partner plays an important role in the
design, development, and ongoing operations of edTPA as a nationally
available performance assessment of teaching.
Stanford University faculty and staff at SCALE developed edTPA and are the
sole authors. Stanford University exclusively owns all of the intellectual
property rights and trademark for edTPA. SCALE is responsible for all edTPA
development including candidate handbooks, scoring rubrics and the scorer
training design, scorer training curriculum, and materials as well as support
materials for programs, faculty, and candidates. SCALE also recruits, reviews,
trains, and endorses National Academy consultants who act as support
providers within the edTPA community.
AACTE partners with edTPA to support development and implementation
and disseminates resources via edTPA.AACTE.org so that teacher preparation
programs and faculty using edTPA have the materials they need to support
teacher candidates. AACTE also supports the deployment of National
Academy consultants via the website and an online community forum for
networking and program assistance.
Stanford University/SCALE engaged Evaluation Systems, a group of Pearson,
as an operational partner in March 2011 to make edTPA available to a
national educational audience. As the operational partner, Evaluation
Systems provides the management system required for multistate use of
edTPA, including the infrastructure that facilitates administration of the
assessment for candidate registration, submission, scoring, quality
assurance, and reporting of results from both national and regional scoring.
Evaluation Systems also recruits scorers (who consist of educators from
public schools and educator preparation programs), manages the scoring
pool, monitors scoring quality, and provides a delivery platform for the
SCALE-developed scorer training curriculum. Evaluation Systems collects and
records the scores generated by qualified scorers.
edTPA Annual Administrative Report
Data range: 1/1/2018 – 12/31/2018
Copyright © 2019 Board of Trustees of the Leland Stanford Junior University. All rights reserved.
Copyright © 2019 Pearson Education, Inc. or its affiliate(s). All rights reserved. Pearson, P.O. Box 226, Amherst, MA 01004 7
edTPA as a Support and Assessment System
Unlike typical licensure assessments external to programs, edTPA is intended
to be embedded in a teacher preparation program and to be “educative” for
candidates, faculty, and programs. Candidates deepen their understanding
of teaching through use of formative resources and materials while
preparing for edTPA, and the score reports provide feedback on candidates’
strengths and challenges as they move forward into their first years of
teaching. For faculty and programs, the various edTPA resources and
candidate, program, and campus results can be used to identify areas of
program strength and determine areas for curricular renewal (Pecheone &
Whittaker, 2016; Whittaker, Pecheone, and Stansbury, 2018).
Summary of resources
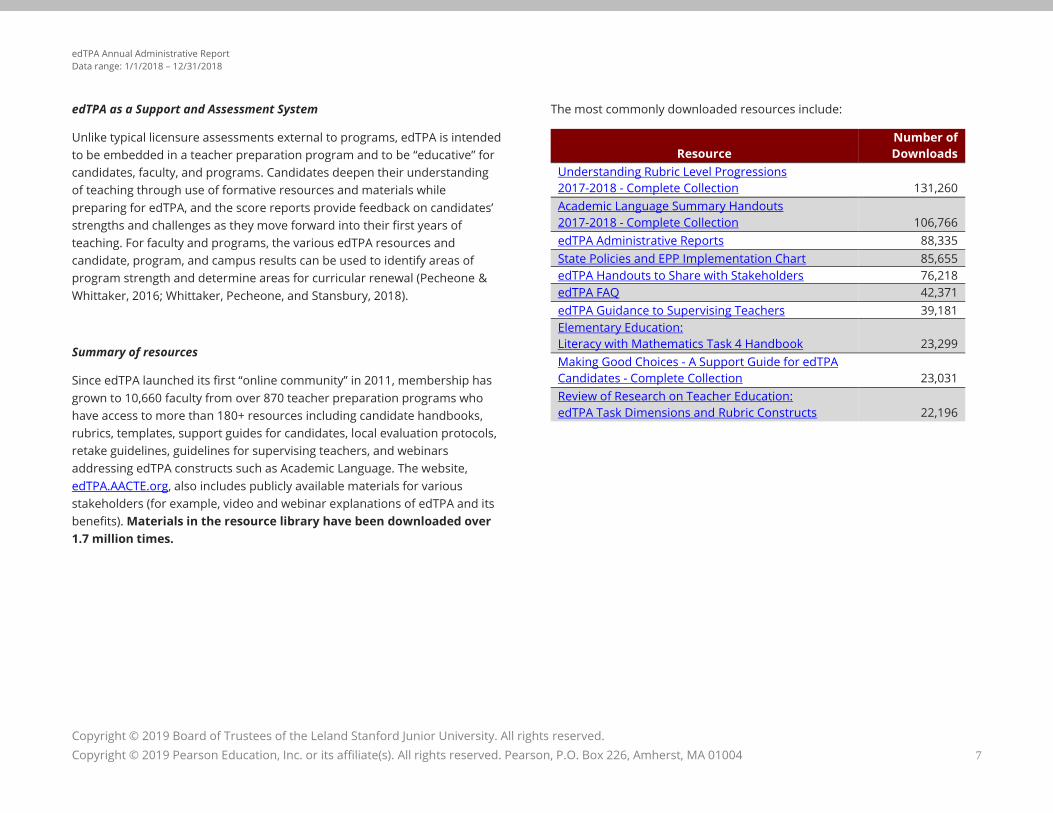
Since edTPA launched its first “online community” in 2011, membership has
grown to 10,660 faculty from over 870 teacher preparation programs who
have access to more than 180+ resources including candidate handbooks,
rubrics, templates, support guides for candidates, local evaluation protocols,
retake guidelines, guidelines for supervising teachers, and webinars
addressing edTPA constructs such as Academic Language. The website,
edTPA.AACTE.org, also includes publicly available materials for various
stakeholders (for example, video and webinar explanations of edTPA and its
benefits). Materials in the resource library have been downloaded over
1.7 million times.
The most commonly downloaded resources include:
Resource
Number of
Downloads
Understanding Rubric Level Progressions
2017-2018 - Complete Collection
131,260
Academic Language Summary Handouts
2017-2018 - Complete Collection
106,766
edTPA Administrative Reports 88,335
State Policies and EPP Implementation Chart 85,655
edTPA Handouts to Share with Stakeholders 76,218
edTPA FAQ 42,371
edTPA Guidance to Supervising Teachers 39,181
Elementary Education:
Literacy with Mathematics Task 4 Handbook
23,299
Making Good Choices - A Support Guide for edTPA
Candidates - Complete Collection
23,031
Review of Research on Teacher Education:
edTPA Task Dimensions and Rubric Constructs
22,196
edTPA Annual Administrative Report
Data range: 1/1/2018 – 12/31/2018
Copyright © 2019 Board of Trustees of the Leland Stanford Junior University. All rights reserved.
Copyright © 2019 Pearson Education, Inc. or its affiliate(s). All rights reserved. Pearson, P.O. Box 226, Amherst, MA 01004 8
Reliability and Validity Evidence
Inter-Rater Agreement
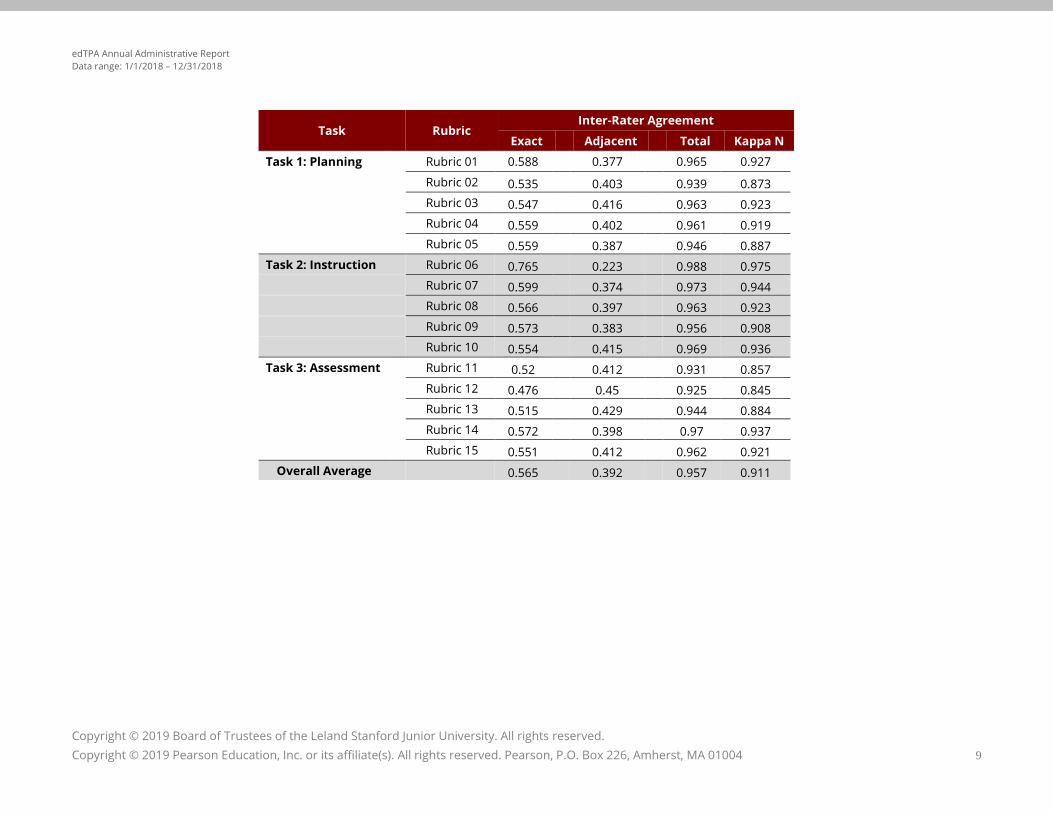
The table below shows inter-rater agreement for the 2018 edTPA
administration cycle. The table shows agreement rates for each rubric as well
as for judgments overall. Inter-rater agreement (IRA) measures to what
extent multiple raters provide ratings of items or performance tasks
consistently. The check of inter-rater agreement is part of the general quality
control for a scoring process, and it requires a process that randomly assigns
portfolios to be read by two scorers, independently. It is customary to
summarize IRA for three levels of granularity (Chodorow & Burnstein, 2004;
Powers, 2000; Stemler & Tsai, 2008), such as:
• Exact agreement – proportion of cases in which the first and second
scores match exactly;
• Adjacent agreement – proportion of cases in which the first and
second scores are apart by one score point, in absolute value; and
• Total agreement – proportion of cases in which the pairs of scores
are +/- 1 score point apart from each other.
The data set included 3,470 complete submissions that were scored
independently by two scorers as part of the random sample of double-
scored portfolios for the 2018 administration cycle. Across all 15 rubrics,
independent scorers assigned the same score (exact agreement) in
approximately 56.5% of all cases. Scorers assigned scores that were one
point apart (adjacent agreement) in approximately 39.2% of all instances.
When combining exact and adjacent agreement into a total agreement,
scorers assigned scores that were the same or +/- 1 point apart in
approximately 95.7% of all cases. These exact and adjacent agreement rates
are consistent with past edTPA operational years, and with that of other
performance assessments, such as the NBPTS.
The kappa n provides chance-corrected total agreement, or inter-rater
agreement measures that result from removing total agreement that may
have occurred randomly (Brennan & Prediger, 1981). Chance-corrected
agreement ranges from zero to one. There are no widely accepted guidelines
for what constitutes an adequate value of the coefficients, although higher
values represent greater levels of agreement. The table below shows kappa n
ranged from 0.845 (rubric 12) to 0.975 (rubric 6), with an average value of
0.911. This outcome corroborates that scorers tend to assign scores within
+/- 1 and rarely assign scores that differ by more than 1 point. The overall
chance-corrected total agreement rate is consistent in magnitude with the
kappa n rate found in prior operational years.
edTPA Annual Administrative Report
Data range: 1/1/2018 – 12/31/2018
Copyright © 2019 Board of Trustees of the Leland Stanford Junior University. All rights reserved.
Copyright © 2019 Pearson Education, Inc. or its affiliate(s). All rights reserved. Pearson, P.O. Box 226, Amherst, MA 01004 9
Task Rubric Inter-Rater Agreement
Exact Adjacent Total Kappa N
Task 1: Planning Rubric 01 0.588 0.377 0.965 0.927
Rubric 02 0.535 0.403 0.939 0.873
Rubric 03 0.547 0.416 0.963 0.923
Rubric 04 0.559 0.402 0.961 0.919
Rubric 05 0.559 0.387 0.946 0.887
Task 2: Instruction Rubric 06 0.765 0.223 0.988 0.975
Rubric 07 0.599 0.374 0.973 0.944
Rubric 08 0.566 0.397 0.963 0.923
Rubric 09 0.573 0.383 0.956 0.908
Rubric 10 0.554 0.415 0.969 0.936
Task 3: Assessment Rubric 11 0.52 0.412 0.931 0.857
Rubric 12 0.476 0.45 0.925 0.845
Rubric 13 0.515 0.429 0.944 0.884
Rubric 14 0.572 0.398 0.97 0.937
Rubric 15 0.551 0.412 0.962 0.921
Overall Average 0.565 0.392 0.957 0.911
edTPA Annual Administrative Report
Data range: 1/1/2018 – 12/31/2018
Copyright © 2019 Board of Trustees of the Leland Stanford Junior University. All rights reserved.
Copyright © 2019 Pearson Education, Inc. or its affiliate(s). All rights reserved. Pearson, P.O. Box 226, Amherst, MA 01004 10
Internal Consistency
Cronbach’s alpha is a measure of internal consistency of raw test scores, an
important characteristic of test scores that indicates the extent to which the
items of the assessment measure the intended common construct
(Cronbach, 1951). Cronbach’s alpha estimates range from zero to one, and
higher values reflect higher levels of consistency of a person’s scores across
the items (rubrics).
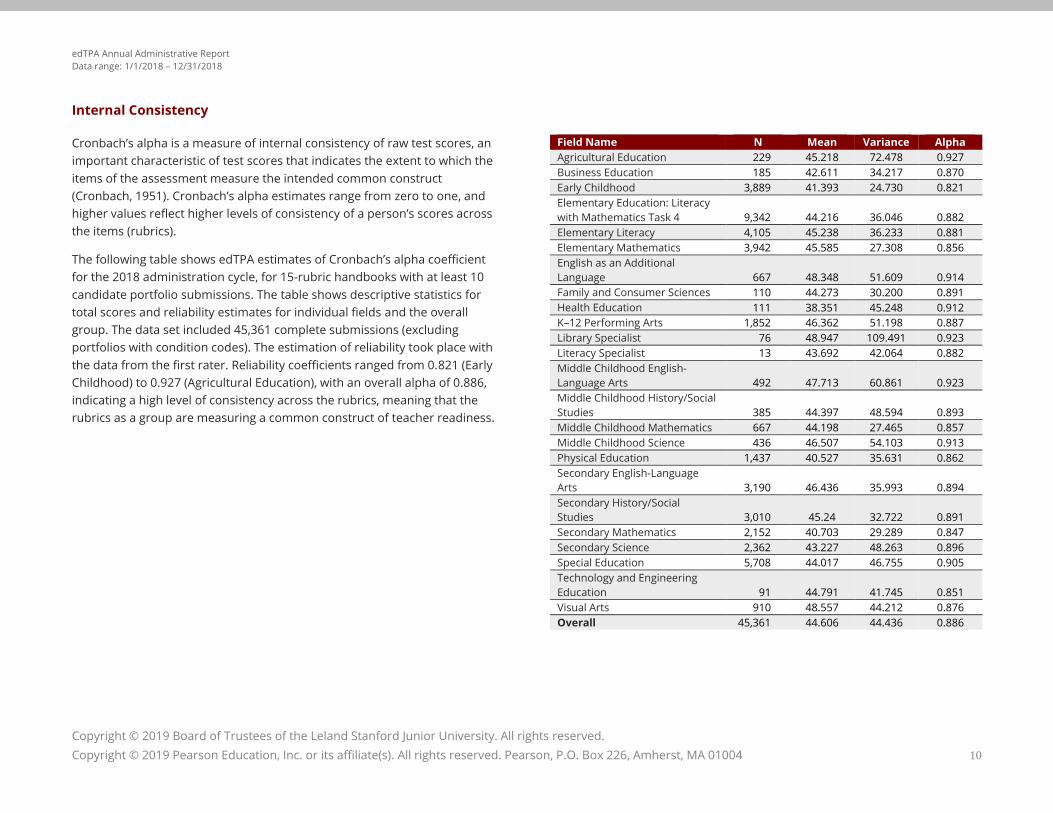
The following table shows edTPA estimates of Cronbach’s alpha coefficient
for the 2018 administration cycle, for 15-rubric handbooks with at least 10
candidate portfolio submissions. The table shows descriptive statistics for
total scores and reliability estimates for individual fields and the overall
group. The data set included 45,361 complete submissions (excluding
portfolios with condition codes). The estimation of reliability took place with
the data from the first rater. Reliability coefficients ranged from 0.821 (Early
Childhood) to 0.927 (Agricultural Education), with an overall alpha of 0.886,
indicating a high level of consistency across the rubrics, meaning that the
rubrics as a group are measuring a common construct of teacher readiness.
Field Name N Mean Variance Alpha
Agricultural Education 229 45.218 72.478 0.927
Business Education 185 42.611 34.217 0.870
Early Childhood 3,889 41.393 24.730 0.821
Elementary Education: Literacy
with Mathematics Task 4 9,342 44.216 36.046 0.882
Elementary Literacy 4,105 45.238 36.233 0.881
Elementary Mathematics 3,942 45.585 27.308 0.856
English as an Additional
Language 667 48.348 51.609 0.914
Family and Consumer Sciences 110 44.273 30.200 0.891
Health Education 111 38.351 45.248 0.912
K–12 Performing Arts 1,852 46.362 51.198 0.887
Library Specialist 76 48.947 109.491 0.923
Literacy Specialist 13 43.692 42.064 0.882
Middle Childhood English-
Language Arts 492 47.713 60.861 0.923
Middle Childhood History/Social
Studies 385 44.397 48.594 0.893
Middle Childhood Mathematics 667 44.198 27.465 0.857
Middle Childhood Science 436 46.507 54.103 0.913
Physical Education 1,437 40.527 35.631 0.862
Secondary English-Language
Arts 3,190 46.436 35.993 0.894
Secondary History/Social
Studies 3,010 45.24 32.722 0.891
Secondary Mathematics 2,152 40.703 29.289 0.847
Secondary Science 2,362 43.227 48.263 0.896
Special Education 5,708 44.017 46.755 0.905
Technology and Engineering
Education 91 44.791 41.745 0.851
Visual Arts 910 48.557 44.212 0.876
Overall 45,361 44.606 44.436 0.886
edTPA Annual Administrative Report
Data range: 1/1/2018 – 12/31/2018
Copyright © 2019 Board of Trustees of the Leland Stanford Junior University. All rights reserved.
Copyright © 2019 Pearson Education, Inc. or its affiliate(s). All rights reserved. Pearson, P.O. Box 226, Amherst, MA 01004 11
Internal Structure
The use of edTPA rubrics, tasks, or overall scores depends on the intended
purpose as well as the policy and approach to implementation of each
program and state. The score on a particular rubric provides a candidate’s
level of readiness on the particular skill/ability being measured and informs
conversations about the strengths and weaknesses of a particular candidate
or a preparation program. Scores on each of the rubrics and total scores for
the three edTPA tasks are reported to candidates, programs, and states to
inform decisions and level of competency for each of the three components
of the teaching cycle (planning, instruction, and assessment). The final score
is the summed score across rubrics in all three tasks and is used as an overall
measure of readiness to teach. As a valid assessment, the claim is made that
the scoring procedure appropriately summarizes relevant aspects of
performance and is applied accurately and consistently for all candidates.
This is based on evidence that the scoring rules are appropriate and that the
data fit the scoring model. The analyses of the internal structure of edTPA
provide psychometric evidence that supports the structure of levels within
each rubric, the fit of rubrics within the three edTPA tasks, and the use of a
single summed total score to represent candidates’ overall performance. The
accuracy and consistency of the scoring process is supported by the scoring
model, scorer training, double scoring procedures, and quality management
outlined in previously published administrative reports.
Confirmatory Factor Analyses
Exploratory factor analyses of 2013 field test data provided support for the
use of a total score on edTPA to summarize a candidate’s performance, as
well as for the underlying task structure (see pg. 22 of the edTPA 2013 Field
Summary Report). These analyses have been provided in all past
1 Condition codes are applied to one or more rubrics when the candidate’s materials do not comply
with edTPA evidence requirements (e.g., inaudible video, missing artifact, wrong artifact) and are
therefore unscorable.
administrative reports. CFAs test whether patterns (correlations) among
observed scores on a set of test items conform to hypothesized structures
(Brown, 2006), providing validity evidence based on a test’s “internal
structure” to support score interpretations (AERA, APA, & NCME, 2014).
These analyses included all 2018 first-time edTPA submissions and excluded
incomplete portfolios and portfolios with condition codes.1 In cases where a
portfolio was double scored, only the first rater’s score is included in the
analyses. CFA models were estimated based on the observed sample
covariance matrix among rubric scores for the 2018 administration cycle.
Models were estimated using maximum likelihood estimation with standard
errors and scaled chi-square fit statistics, as implemented in the R package
“lavaan” (Rosseel, 2012), to fit all models.
Based on the design and interpretation of the edTPA total score, a 1-factor
model in which all rubric scores load on a single latent factor was estimated.
To account for the task-based design and structure of edTPA portfolios, a 3-
factor model with correlated factors and with each rubric loading only on its
associated task was also estimated. All factor loadings for the three-factor
solution were positive and statistically significant as anticipated (most
standardized loadings were greater than .6 in the 3-factor model). Table A in
Appendix A presents the estimated standardized factor loadings for the 1-
and 3-factor models in the full sample of portfolios. Table B presents the
estimated correlations among the task factors in the 3-factor model, which
are also strongly positive and statistically significant. The large magnitude of
the correlations further supports the interpretation that edTPA rubrics
measure three highly interrelated sub-dimensions—planning, instruction,
and assessment—of a single readiness-to-teach construct.
edTPA Annual Administrative Report
Data range: 1/1/2018 – 12/31/2018
Copyright © 2019 Board of Trustees of the Leland Stanford Junior University. All rights reserved.
Copyright © 2019 Pearson Education, Inc. or its affiliate(s). All rights reserved. Pearson, P.O. Box 226, Amherst, MA 01004 12
IRT: Partial Credit Model
As outlined in prior administrative reports, a polytomous item response
theory (IRT) model, the partial credit model (PCM; Masters, 1982), was fit to
the same sample of edTPA submissions included in the CFA models. The PCM
provides a statistical model of the probability that a candidate earns each
possible rubric score as a function of a single, continuous, underlying
dimension “theta.”
The unidimensional PCM was fit to the 2018 sample of candidates. Models
were estimated using marginal maximum likelihood. As noted above, edTPA
scores are derived from the ratings of a single scorer who scores the entire
portfolio; rubric scores may reflect some rater effects. Additionally, the
results presented below are based on aggregating data across credential
areas. Because edTPA is used based on a single total score calculated equally
across fields with 15 rubrics, this analysis provides evidence about how this
measure functions overall.
To evaluate fit, INFIT mean square statistics were computed for each rubric
and examined to identify rubrics with INFIT values less than 0.75 or greater
than 1.33, which would suggest a lack of fit. Plots of expected and observed
rubric scores across the theta range were compared across the theta range
to identify potential model misfit. A Wright Map depicting the distribution of
candidate proficiency estimates alongside rubric threshold parameter
estimates was inspected to determine (a) whether rubric thresholds
conformed to the expected ordering and (b) whether the rubric thresholds
for each score point were well-distributed across the range of the theta
distribution. Finally, to summarize precision of theta estimates, the test
information function and conditional standard error of estimate were plotted
across the range of the theta distribution, and a person separation reliability
index was estimated.
Inspection of the Wright Maps and rubric parameter estimates showed the
hypothesized ordering of rubric thresholds and demonstrated that the
Thurstonian thresholds (proficiency level at which a candidate has a 50%
chance of scoring above a given score level) were located across the entire
range of estimated candidate performance on the theta scale (see Appendix
A, Table A-3). The test information function (and hence standard error of
measurement in the theta metric) was consistent across the range of
candidate performance. To summarize, these results provide information
about the level of performance at which candidates are likely to move
from one possible rubric score to the next. The fact that these points
are distributed across the theta distribution affirms that edTPA rubrics
are constructed to provide useful discriminating information about
candidate performance at different levels of overall performance.

edTPA Annual Administrative Report
Data range: 1/1/2018 – 12/31/2018
Copyright © 2019 Board of Trustees of the Leland Stanford Junior University. All rights reserved.
Copyright © 2019 Pearson Education, Inc. or its affiliate(s). All rights reserved. Pearson, P.O. Box 226, Amherst, MA 01004 13
Candidate Performance
Overall Scores
The following figure presents the score distribution of 45,365 edTPA
portfolios, in fields scored based on 15 rubrics and submitted January 1 to
December 31, 2018, the fifth full calendar year for which edTPA was used
consequentially.
This represents the distribution of final scores on all complete portfolios
scored on five separate rubrics within each of the three major edTPA tasks:
planning, instruction, and assessment. There are five levels of possible
performance for each rubric, with level 3 characterizing “ready to teach” and
a total score range from 15 to 75. This figure shows that scores are normally
distributed across this range. The dip in scores around 37–40 is an artifact of
the double scoring process automatically applied to all portfolios that fall
within the state or national double-scoring band. Figures presenting further
information on the distribution of these portfolios (distribution based on first
score only, and distribution within cut band) are found in Appendix B.
This document includes some materials that are test secure and/or confidential for other reasons. As such, it should not be circulated to unauthorized persons. The accompanying notes are an integral part of this document.
Frequency
0100200300400500600700800900
100011001200130014001500160017001800190020002100220023002400250026002700280029003000310032003300340035003600370038003900400041004200
Total Score (15 Rubrics)
15
20
25
30
35
40
45
50
55
60
65
70
75
edTPA Annual Administrative Report
Data range: 1/1/2018 – 12/31/2018
Copyright © 2019 Board of Trustees of the Leland Stanford Junior University. All rights reserved.
Copyright © 2019 Pearson Education, Inc. or its affiliate(s). All rights reserved. Pearson, P.O. Box 226, Amherst, MA 01004 14
Task and Rubric Scores
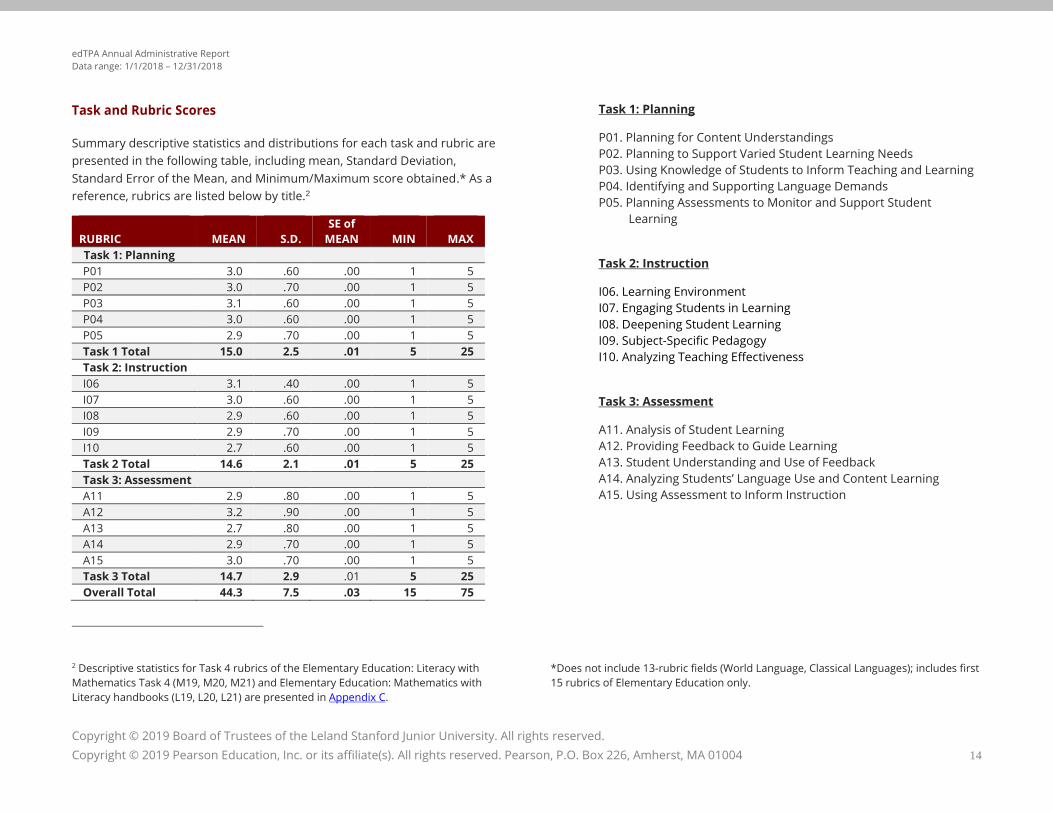
Summary descriptive statistics and distributions for each task and rubric are
presented in the following table, including mean, Standard Deviation,
Standard Error of the Mean, and Minimum/Maximum score obtained.* As a
reference, rubrics are listed below by title.2
RUBRIC
MEAN
S.D.
SE of
MEAN
MIN
MAX
Task 1: Planning
P01 3.0 .60 .00 1 5
P02 3.0 .70 .00 1 5
P03 3.1 .60 .00 1 5
P04 3.0 .60 .00 1 5
P05 2.9 .70 .00 1 5
Task 1 Total 15.0 2.5 .01 5 25
Task 2: Instruction
I06 3.1 .40 .00 1 5
I07 3.0 .60 .00 1 5
I08 2.9 .60 .00 1 5
I09 2.9 .70 .00 1 5
I10 2.7 .60 .00 1 5
Task 2 Total 14.6 2.1 .01 5 25
Task 3: Assessment
A11 2.9 .80 .00 1 5
A12 3.2 .90 .00 1 5
A13 2.7 .80 .00 1 5
A14 2.9 .70 .00 1 5
A15 3.0 .70 .00 1 5
Task 3 Total 14.7 2.9 .01 5 25
Overall Total 44.3 7.5 .03 15 75
2 Descriptive statistics for Task 4 rubrics of the Elementary Education: Literacy with
Mathematics Task 4 (M19, M20, M21) and Elementary Education: Mathematics with
Literacy handbooks (L19, L20, L21) are presented in Appendix C.
Task 1: Planning
P01. Planning for Content Understandings
P02. Planning to Support Varied Student Learning Needs
P03. Using Knowledge of Students to Inform Teaching and Learning
P04. Identifying and Supporting Language Demands
P05. Planning Assessments to Monitor and Support Student
Learning
Task 2: Instruction
I06. Learning Environment
I07. Engaging Students in Learning
I08. Deepening Student Learning
I09. Subject-Specific Pedagogy
I10. Analyzing Teaching Effectiveness
Task 3: Assessment
A11. Analysis of Student Learning
A12. Providing Feedback to Guide Learning
A13. Student Understanding and Use of Feedback
A14. Analyzing Students’ Language Use and Content Learning
A15. Using Assessment to Inform Instruction
*Does not include 13-rubric fields (World Language, Classical Languages); includes first
15 rubrics of Elementary Education only.
edTPA Annual Administrative Report
Data range: 1/1/2018 – 12/31/2018
Copyright © 2019 Board of Trustees of the Leland Stanford Junior University. All rights reserved.
Copyright © 2019 Pearson Education, Inc. or its affiliate(s). All rights reserved. Pearson, P.O. Box 226, Amherst, MA 01004 15
The average edTPA score across 45,365 portfolios from fields with 15-rubric
handbooks was 44.3, with a standard deviation of 6.4. This average
performance shows a slight decrease (from 44.7 in 2017) in mean scores and
reduction in the standard deviation. As a reference, the 2013 field test data
average score was 42.8 (SD = 8.17). As per previous years, scores ranged
across the entire range of possible scores, from 15 to 75.
Candidate performance by task shows that candidates performed most
highly on the planning task (mean = 15.0), followed by the assessment task
(14.7), and then the instruction task (mean = 14.6).
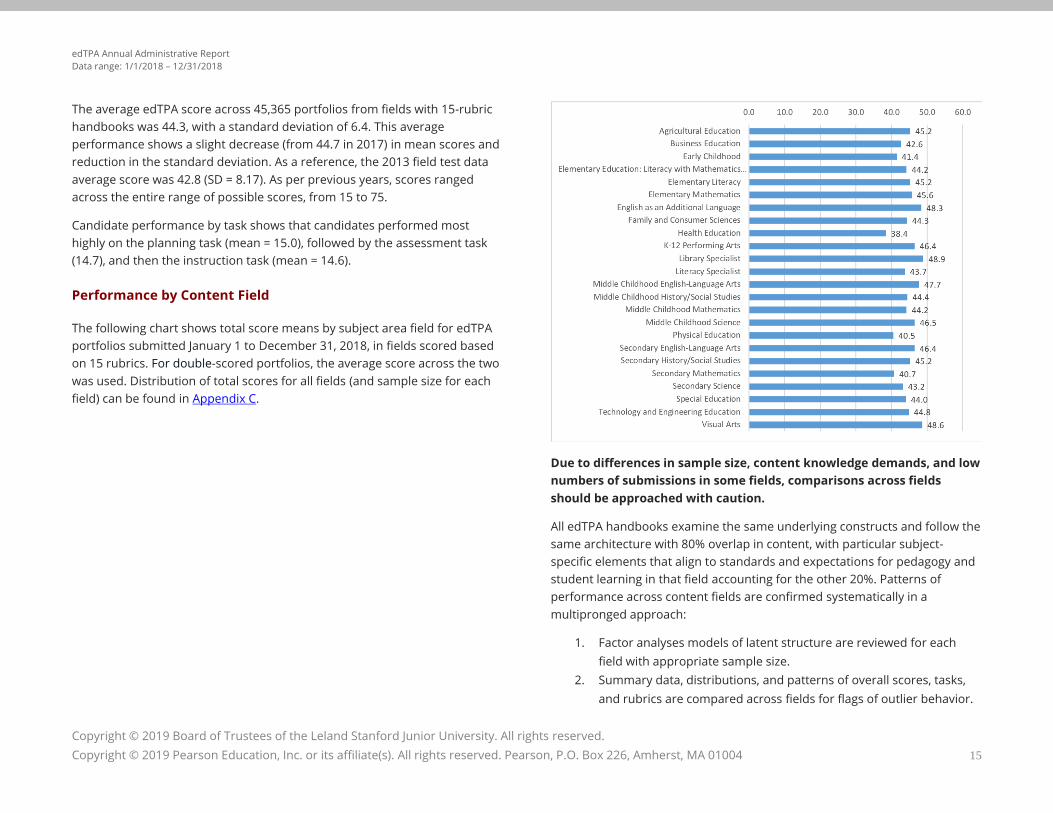
Performance by Content Field
The following chart shows total score means by subject area field for edTPA
portfolios submitted January 1 to December 31, 2018, in fields scored based
on 15 rubrics. For double-scored portfolios, the average score across the two
was used. Distribution of total scores for all fields (and sample size for each
field) can be found in Appendix C.
Due to differences in sample size, content knowledge demands, and low
numbers of submissions in some fields, comparisons across fields
should be approached with caution.
All edTPA handbooks examine the same underlying constructs and follow the
same architecture with 80% overlap in content, with particular subject-
specific elements that align to standards and expectations for pedagogy and
student learning in that field accounting for the other 20%. Patterns of
performance across content fields are confirmed systematically in a
multipronged approach:
1. Factor analyses models of latent structure are reviewed for each
field with appropriate sample size.
2. Summary data, distributions, and patterns of overall scores, tasks,
and rubrics are compared across fields for flags of outlier behavior.
edTPA Annual Administrative Report
Data range: 1/1/2018 – 12/31/2018
Copyright © 2019 Board of Trustees of the Leland Stanford Junior University. All rights reserved.
Copyright © 2019 Pearson Education, Inc. or its affiliate(s). All rights reserved. Pearson, P.O. Box 226, Amherst, MA 01004 16
3. Indices of reliability (internal consistency, exact and adjacent
agreement by rubric, kappa ns) are reviewed for each field with
appropriate sample size.
4. Scoring trainers and supervisors are consulted to confirm scoring
and backreading processes and flag any recurring questions from
scorers.
5. Experts in each profession are consulted to review the data, and to
discuss alignment of the handbook to the standards and
expectations of the profession.
6. Input from programs and faculty using edTPA via the Online
Community at edTPA.AACTE.org and email to SCALE or AACTE staff
are reviewed.
7. Review and clarification of handbooks, scorer training, and support
materials is conducted annually based on all quantitative and
qualitative data.
Performance by Consequential Use
edTPA portfolios officially scored in the 2018 operational year represent
submissions from candidates in 37 states. Of the 45,365 15-rubric field
portfolios scored, 6,644 were submitted by candidates in states that do not
currently have policy for edTPA use, and 38,721 were submitted in states
with consequential policy. States without policy with submissions in 2018 are
AZ, CO, CT, HI, IN, KY, LA, MD, MI, MO, MS, NE, NV, OH, OK, PA, TX, UT, VA, and
WY. States with consequential policy and submissions in 2018 are AL, AR, CA,
DE, GA, IL, IA, MN, NC, NJ, NY, OR, SC, TN, WA, WI, and WV. Appendix D
presents the approximate percentage of portfolios coming from each state,
and Appendix E shows overall performance (mean, standard deviation, and
number of submissions) by field in states without state-wide policy for use of
edTPA, and states where such policy exists.
State policy mandating edTPA for purposes of teacher licensure and/or
program evaluation results in greater consistency for use and
implementation. It was therefore hypothesized that submissions from states
with official policy would have higher average scores than those from states
without edTPA policy. As predicted, edTPA scores were higher in states with
policy requiring edTPA, with policy states having a mean of 44.65 and non-
policy states having a mean of 42.55. This finding is consistent with
expectations given the increased consistency of implementation and support
structures, as well as levels of effort and motivation, that come about as a
result of state-wide policy for consequential assessment.
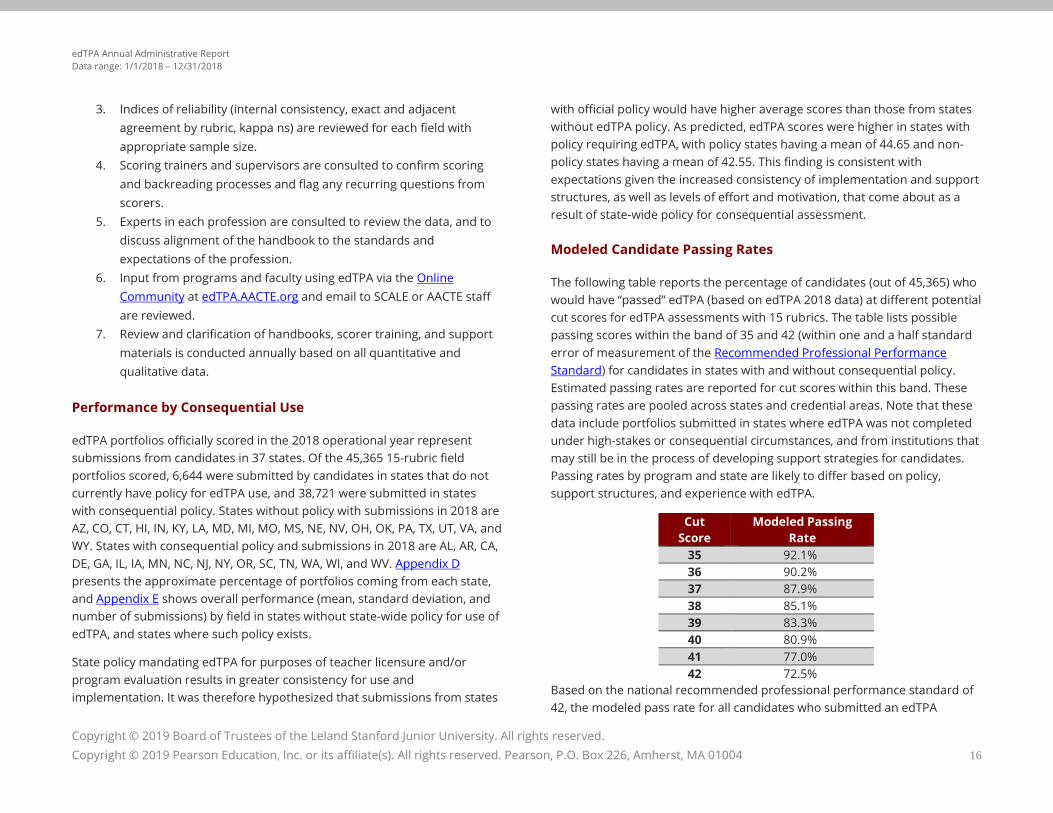
Modeled Candidate Passing Rates
The following table reports the percentage of candidates (out of 45,365) who
would have “passed” edTPA (based on edTPA 2018 data) at different potential
cut scores for edTPA assessments with 15 rubrics. The table lists possible
passing scores within the band of 35 and 42 (within one and a half standard
error of measurement of the Recommended Professional Performance
Standard) for candidates in states with and without consequential policy.
Estimated passing rates are reported for cut scores within this band. These
passing rates are pooled across states and credential areas. Note that these
data include portfolios submitted in states where edTPA was not completed
under high-stakes or consequential circumstances, and from institutions that
may still be in the process of developing support strategies for candidates.
Passing rates by program and state are likely to differ based on policy,
support structures, and experience with edTPA.
Cut
Score
Modeled Passing
Rate
35 92.1%
36 90.2%
37 87.9%
38 85.1%
39 83.3%
40 80.9%
41 77.0%
42 72.5%
Based on the national recommended professional performance standard of
42, the modeled pass rate for all candidates who submitted an edTPA
edTPA Annual Administrative Report
Data range: 1/1/2018 – 12/31/2018
Copyright © 2019 Board of Trustees of the Leland Stanford Junior University. All rights reserved.
Copyright © 2019 Pearson Education, Inc. or its affiliate(s). All rights reserved. Pearson, P.O. Box 226, Amherst, MA 01004 17
portfolio in 2018 was 72.0%. Note that to date, passing scores established by
states range from 35 to 41 (for 15-rubric handbooks).
See the State edTPA Policy Overview for the most up-to-date information on
state policies and any established state consequential score information,
including planned adjustments over time.
Performance by Demographic Subgroups
When submitting an edTPA portfolio for official scoring, the candidate is
asked to provide demographic information in several categories: gender,
ethnicity, teaching placement context, program type, education level, and
primary language. Analyses of performance by subgroup within these
categories included only 15-rubric handbook portfolios submitted in
states that have policy for consequential use of edTPA (total N=38,721).
The analyses revealed small differences in performance across some of the
subgroups. It is important to note that the difference in sample sizes of
some of the subgroups within each demographic category may affect
the ability to generalize these results to the national pre-service
teaching population; all estimates of performance should not be
overgeneralized and should be interpreted with caution. Further,
differences in performance do not take into account any prior or experiential
differences in the applicant pool, differences in program quality or
preparation of candidates, and other factors that may contribute to a
candidate’s score and cause differences in performance. Lastly, a difference
in mean score may not necessarily influence pass rates at various cut scores
required by individual states. See the section below for modeled pass rates
by demographic group by cut score.
What follows is a description of subgroup performance in the following
categories: Teaching Context (School Locale and Teaching Placement),
Ethnicity, Primary Language, Gender, and Education Level. Finally, a
regression analysis was conducted to examine the contribution of these
demographic categories in explaining and interpreting edTPA candidate
scores.
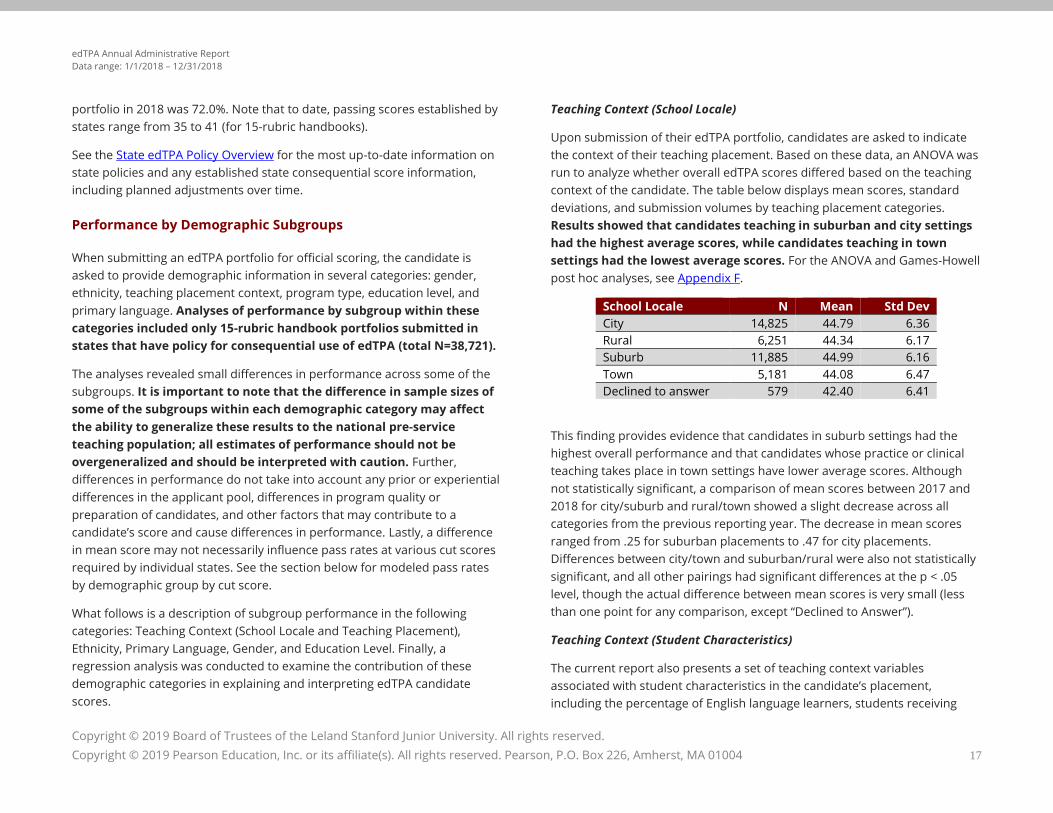
Teaching Context (School Locale)
Upon submission of their edTPA portfolio, candidates are asked to indicate
the context of their teaching placement. Based on these data, an ANOVA was
run to analyze whether overall edTPA scores differed based on the teaching
context of the candidate. The table below displays mean scores, standard
deviations, and submission volumes by teaching placement categories.
Results showed that candidates teaching in suburban and city settings
had the highest average scores, while candidates teaching in town
settings had the lowest average scores. For the ANOVA and Games-Howell
post hoc analyses, see Appendix F.
School Locale N Mean Std Dev
City 14,825 44.79 6.36
Rural 6,251 44.34 6.17
Suburb 11,885 44.99 6.16
Town 5,181 44.08 6.47
Declined to answer 579 42.40 6.41
This finding provides evidence that candidates in suburb settings had the
highest overall performance and that candidates whose practice or clinical
teaching takes place in town settings have lower average scores. Although
not statistically significant, a comparison of mean scores between 2017 and
2018 for city/suburb and rural/town showed a slight decrease across all
categories from the previous reporting year. The decrease in mean scores
ranged from .25 for suburban placements to .47 for city placements.
Differences between city/town and suburban/rural were also not statistically
significant, and all other pairings had significant differences at the p < .05
level, though the actual difference between mean scores is very small (less
than one point for any comparison, except “Declined to Answer”).
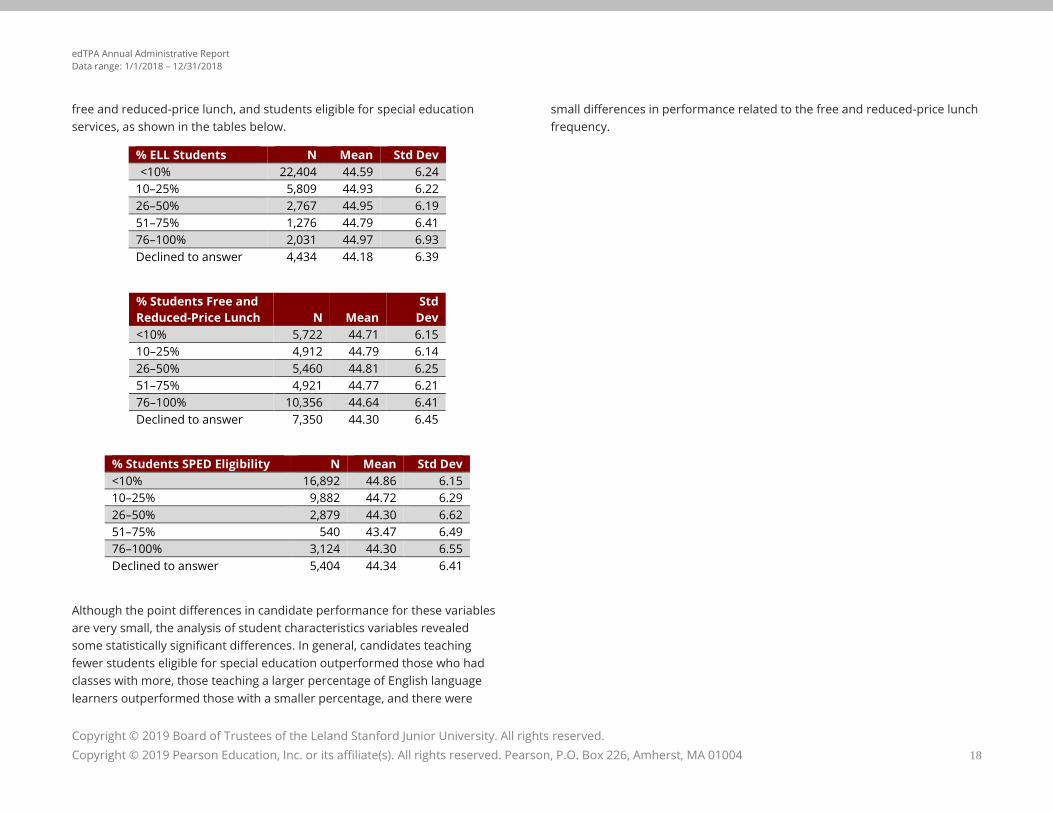
Teaching Context (Student Characteristics)
The current report also presents a set of teaching context variables
associated with student characteristics in the candidate’s placement,
including the percentage of English language learners, students receiving
edTPA Annual Administrative Report
Data range: 1/1/2018 – 12/31/2018
Copyright © 2019 Board of Trustees of the Leland Stanford Junior University. All rights reserved.
Copyright © 2019 Pearson Education, Inc. or its affiliate(s). All rights reserved. Pearson, P.O. Box 226, Amherst, MA 01004 18
free and reduced-price lunch, and students eligible for special education
services, as shown in the tables below.
% ELL Students N Mean Std Dev
<10% 22,404 44.59 6.24
10–25% 5,809 44.93 6.22
26–50% 2,767 44.95 6.19
51–75% 1,276 44.79 6.41
76–100% 2,031 44.97 6.93
Declined to answer 4,434 44.18 6.39
% Students Free and
Reduced-Price Lunch
N
Mean
Std
Dev
<10% 5,722 44.71 6.15
10–25% 4,912 44.79 6.14
26–50% 5,460 44.81 6.25
51–75% 4,921 44.77 6.21
76–100% 10,356 44.64 6.41
Declined to answer 7,350 44.30 6.45
% Students SPED Eligibility N Mean Std Dev
<10% 16,892 44.86 6.15
10–25% 9,882 44.72 6.29
26–50% 2,879 44.30 6.62
51–75% 540 43.47 6.49
76–100% 3,124 44.30 6.55
Declined to answer 5,404 44.34 6.41
Although the point differences in candidate performance for these variables
are very small, the analysis of student characteristics variables revealed
some statistically significant differences. In general, candidates teaching
fewer students eligible for special education outperformed those who had
classes with more, those teaching a larger percentage of English language
learners outperformed those with a smaller percentage, and there were
small differences in performance related to the free and reduced-price lunch
frequency.
edTPA Annual Administrative Report
Data range: 1/1/2018 – 12/31/2018
Copyright © 2019 Board of Trustees of the Leland Stanford Junior University. All rights reserved.
Copyright © 2019 Pearson Education, Inc. or its affiliate(s). All rights reserved. Pearson, P.O. Box 226, Amherst, MA 01004 19
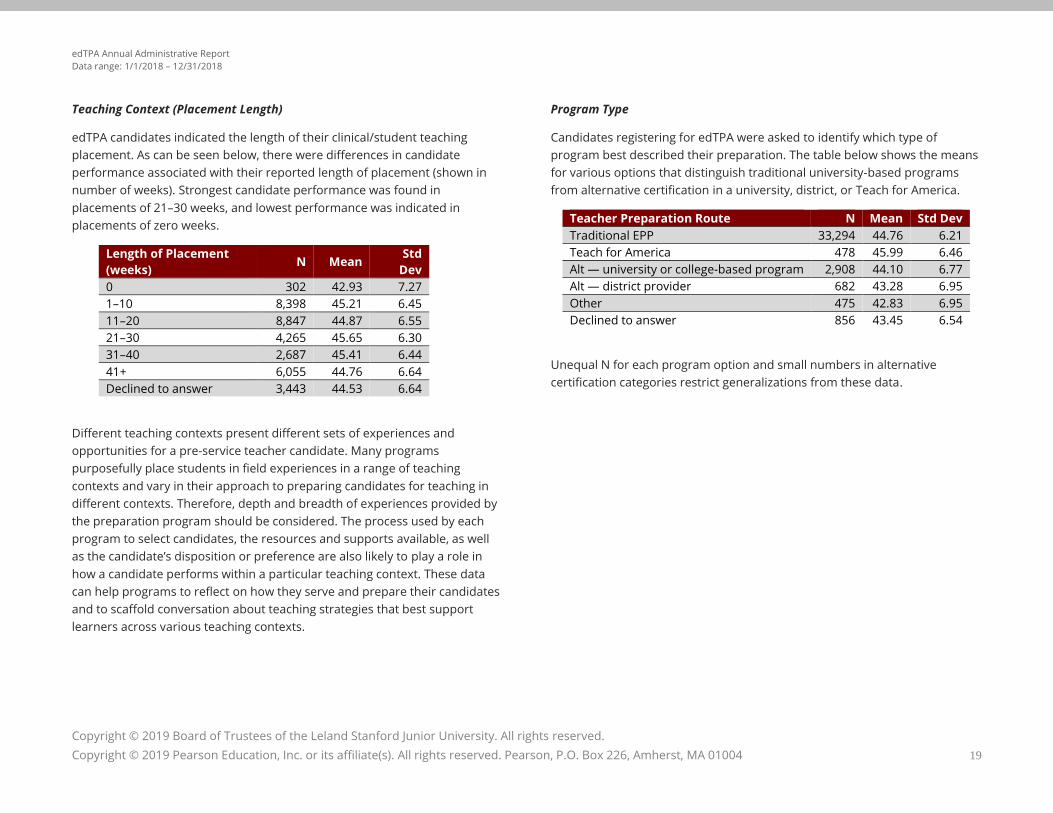
Teaching Context (Placement Length)
edTPA candidates indicated the length of their clinical/student teaching
placement. As can be seen below, there were differences in candidate
performance associated with their reported length of placement (shown in
number of weeks). Strongest candidate performance was found in
placements of 21–30 weeks, and lowest performance was indicated in
placements of zero weeks.
Length of Placement
(weeks) N Mean
Std
Dev
0 302 42.93 7.27
1–10 8,398 45.21 6.45
11–20 8,847 44.87 6.55
21–30 4,265 45.65 6.30
31–40 2,687 45.41 6.44
41+ 6,055 44.76 6.64
Declined to answer 3,443 44.53 6.64
Different teaching contexts present different sets of experiences and
opportunities for a pre-service teacher candidate. Many programs
purposefully place students in field experiences in a range of teaching
contexts and vary in their approach to preparing candidates for teaching in
different contexts. Therefore, depth and breadth of experiences provided by
the preparation program should be considered. The process used by each
program to select candidates, the resources and supports available, as well
as the candidate’s disposition or preference are also likely to play a role in
how a candidate performs within a particular teaching context. These data
can help programs to reflect on how they serve and prepare their candidates
and to scaffold conversation about teaching strategies that best support
learners across various teaching contexts.
Program Type
Candidates registering for edTPA were asked to identify which type of
program best described their preparation. The table below shows the means
for various options that distinguish traditional university-based programs
from alternative certification in a university, district, or Teach for America.
Teacher Preparation Route N Mean Std Dev
Traditional EPP 33,294 44.76 6.21
Teach for America 478 45.99 6.46
Alt — university or college-based program 2,908 44.10 6.77
Alt — district provider 682 43.28 6.95
Other 475 42.83 6.95
Declined to answer 856 43.45 6.54
Unequal N for each program option and small numbers in alternative
certification categories restrict generalizations from these data.
edTPA Annual Administrative Report
Data range: 1/1/2018 – 12/31/2018
Copyright © 2019 Board of Trustees of the Leland Stanford Junior University. All rights reserved.
Copyright © 2019 Pearson Education, Inc. or its affiliate(s). All rights reserved. Pearson, P.O. Box 226, Amherst, MA 01004 20
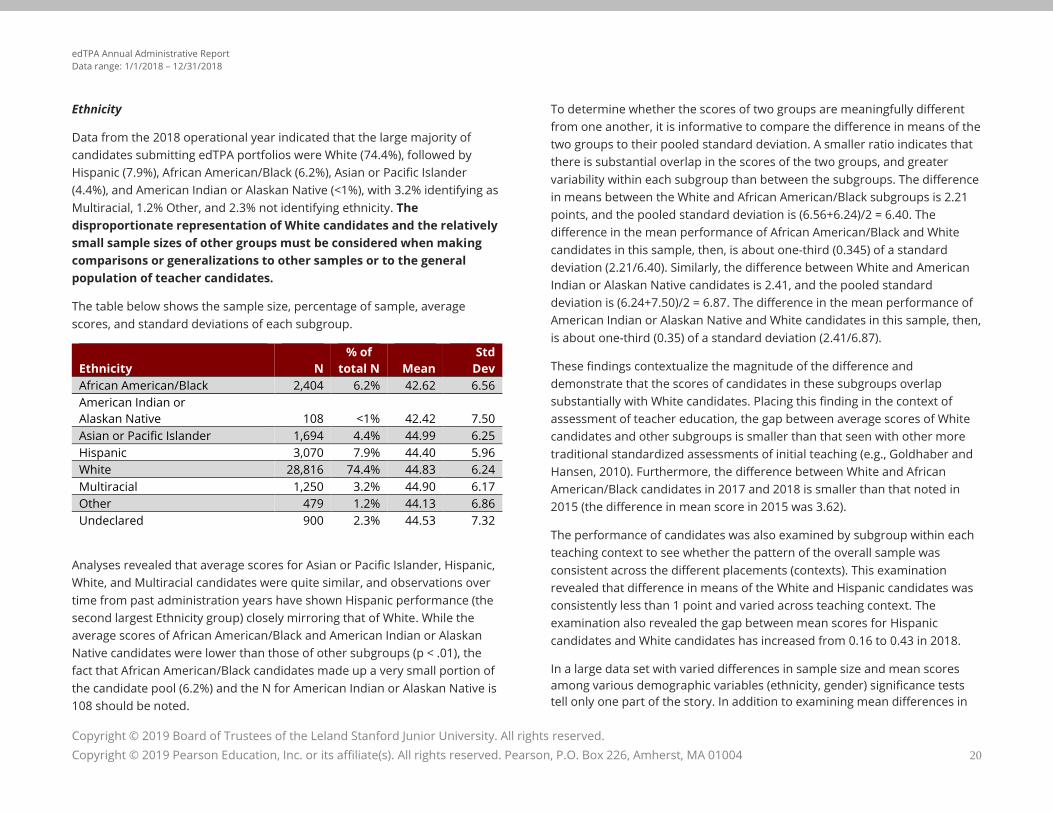
Ethnicity
Data from the 2018 operational year indicated that the large majority of
candidates submitting edTPA portfolios were White (74.4%), followed by
Hispanic (7.9%), African American/Black (6.2%), Asian or Pacific Islander
(4.4%), and American Indian or Alaskan Native (<1%), with 3.2% identifying as
Multiracial, 1.2% Other, and 2.3% not identifying ethnicity. The
disproportionate representation of White candidates and the relatively
small sample sizes of other groups must be considered when making
comparisons or generalizations to other samples or to the general
population of teacher candidates.
The table below shows the sample size, percentage of sample, average
scores, and standard deviations of each subgroup.
Ethnicity
N
% of
total N
Mean
Std
Dev
African American/Black 2,404 6.2% 42.62 6.56
American Indian or
Alaskan Native
108 <1%
42.42
7.50
Asian or Pacific Islander 1,694 4.4% 44.99 6.25
Hispanic 3,070 7.9% 44.40 5.96
White 28,816 74.4% 44.83 6.24
Multiracial 1,250 3.2% 44.90 6.17
Other 479 1.2% 44.13 6.86
Undeclared 900 2.3% 44.53 7.32
Analyses revealed that average scores for Asian or Pacific Islander, Hispanic,
White, and Multiracial candidates were quite similar, and observations over
time from past administration years have shown Hispanic performance (the
second largest Ethnicity group) closely mirroring that of White. While the
average scores of African American/Black and American Indian or Alaskan
Native candidates were lower than those of other subgroups (p < .01), the
fact that African American/Black candidates made up a very small portion of
the candidate pool (6.2%) and the N for American Indian or Alaskan Native is
108 should be noted.
To determine whether the scores of two groups are meaningfully different
from one another, it is informative to compare the difference in means of the
two groups to their pooled standard deviation. A smaller ratio indicates that
there is substantial overlap in the scores of the two groups, and greater
variability within each subgroup than between the subgroups. The difference
in means between the White and African American/Black subgroups is 2.21
points, and the pooled standard deviation is (6.56+6.24)/2 = 6.40. The
difference in the mean performance of African American/Black and White
candidates in this sample, then, is about one-third (0.345) of a standard
deviation (2.21/6.40). Similarly, the difference between White and American
Indian or Alaskan Native candidates is 2.41, and the pooled standard
deviation is (6.24+7.50)/2 = 6.87. The difference in the mean performance of
American Indian or Alaskan Native and White candidates in this sample, then,
is about one-third (0.35) of a standard deviation (2.41/6.87).
These findings contextualize the magnitude of the difference and
demonstrate that the scores of candidates in these subgroups overlap
substantially with White candidates. Placing this finding in the context of
assessment of teacher education, the gap between average scores of White
candidates and other subgroups is smaller than that seen with other more
traditional standardized assessments of initial teaching (e.g., Goldhaber and
Hansen, 2010). Furthermore, the difference between White and African
American/Black candidates in 2017 and 2018 is smaller than that noted in
2015 (the difference in mean score in 2015 was 3.62).
The performance of candidates was also examined by subgroup within each
teaching context to see whether the pattern of the overall sample was
consistent across the different placements (contexts). This examination
revealed that difference in means of the White and Hispanic candidates was
consistently less than 1 point and varied across teaching context. The
examination also revealed the gap between mean scores for Hispanic
candidates and White candidates has increased from 0.16 to 0.43 in 2018.
In a large data set with varied differences in sample size and mean scores
among various demographic variables (ethnicity, gender) significance tests
tell only one part of the story. In addition to examining mean differences in
edTPA Annual Administrative Report
Data range: 1/1/2018 – 12/31/2018
Copyright © 2019 Board of Trustees of the Leland Stanford Junior University. All rights reserved.
Copyright © 2019 Pearson Education, Inc. or its affiliate(s). All rights reserved. Pearson, P.O. Box 226, Amherst, MA 01004 21
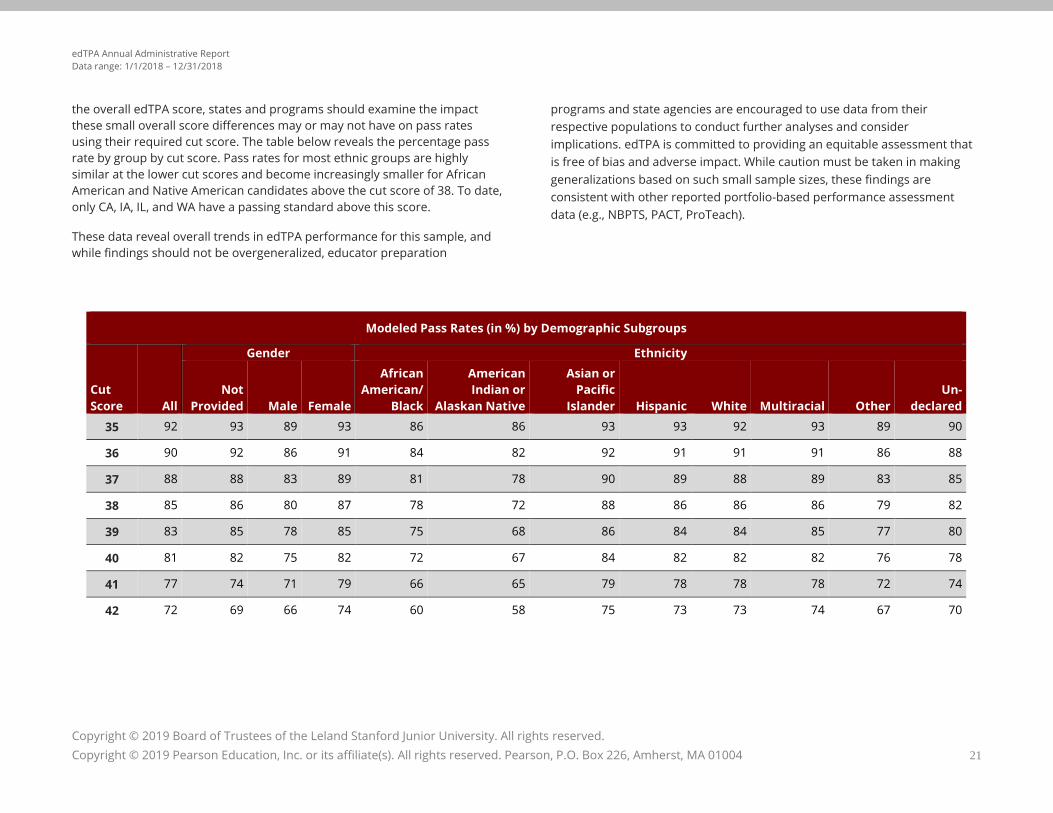
the overall edTPA score, states and programs should examine the impact
these small overall score differences may or may not have on pass rates
using their required cut score. The table below reveals the percentage pass
rate by group by cut score. Pass rates for most ethnic groups are highly
similar at the lower cut scores and become increasingly smaller for African
American and Native American candidates above the cut score of 38. To date,
only CA, IA, IL, and WA have a passing standard above this score.
These data reveal overall trends in edTPA performance for this sample, and
while findings should not be overgeneralized, educator preparation
programs and state agencies are encouraged to use data from their
respective populations to conduct further analyses and consider
implications. edTPA is committed to providing an equitable assessment that
is free of bias and adverse impact. While caution must be taken in making
generalizations based on such small sample sizes, these findings are
consistent with other reported portfolio-based performance assessment
data (e.g., NBPTS, PACT, ProTeach).
Modeled Pass Rates (in %) by Demographic Subgroups
Cut
Score All
Gender Ethnicity
Not
Provided Male Female
African
American/
Black
American
Indian or
Alaskan Native
Asian or
Pacific
Islander Hispanic White Multiracial Other
Un-
declared
35 92 93 89 93 86 86 93 93 92 93 89 90
36 90 92 86 91 84 82 92 91 91 91 86 88
37 88 88 83 89 81 78 90 89 88 89 83 85
38 85 86 80 87 78 72 88 86 86 86 79 82
39 83 85 78 85 75 68 86 84 84 85 77 80
40 81 82 75 82 72 67 84 82 82 82 76 78
41 77 74 71 79 66 65 79 78 78 78 72 74
42 72 69 66 74 60 58 75 73 73 74 67 70
edTPA Annual Administrative Report
Data range: 1/1/2018 – 12/31/2018
Copyright © 2019 Board of Trustees of the Leland Stanford Junior University. All rights reserved.
Copyright © 2019 Pearson Education, Inc. or its affiliate(s). All rights reserved. Pearson, P.O. Box 226, Amherst, MA 01004 22
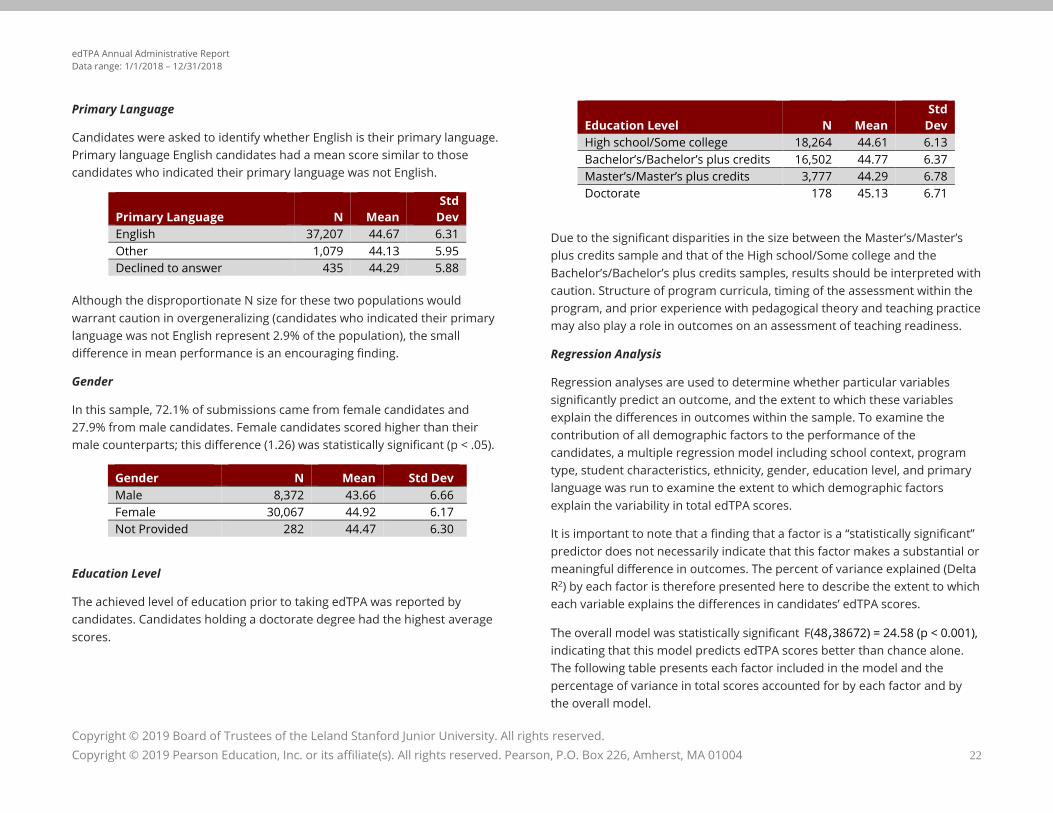
Primary Language
Candidates were asked to identify whether English is their primary language.
Primary language English candidates had a mean score similar to those
candidates who indicated their primary language was not English.
Primary Language
N
Mean
Std
Dev
English 37,207 44.67 6.31
Other 1,079 44.13 5.95
Declined to answer 435 44.29 5.88
Although the disproportionate N size for these two populations would
warrant caution in overgeneralizing (candidates who indicated their primary
language was not English represent 2.9% of the population), the small
difference in mean performance is an encouraging finding.
Gender
In this sample, 72.1% of submissions came from female candidates and
27.9% from male candidates. Female candidates scored higher than their
male counterparts; this difference (1.26) was statistically significant (p < .05).
Gender N Mean Std Dev
Male 8,372 43.66 6.66
Female 30,067 44.92 6.17
Not Provided 282 44.47 6.30
Education Level
The achieved level of education prior to taking edTPA was reported by
candidates. Candidates holding a doctorate degree had the highest average
scores.
Education Level
N
Mean
Std
Dev
High school/Some college 18,264 44.61 6.13
Bachelor’s/Bachelor’s plus credits 16,502 44.77 6.37
Master’s/Master’s plus credits 3,777 44.29 6.78
Doctorate 178 45.13 6.71
Due to the significant disparities in the size between the Master’s/Master’s
plus credits sample and that of the High school/Some college and the
Bachelor’s/Bachelor’s plus credits samples, results should be interpreted with
caution. Structure of program curricula, timing of the assessment within the
program, and prior experience with pedagogical theory and teaching practice
may also play a role in outcomes on an assessment of teaching readiness.
Regression Analysis
Regression analyses are used to determine whether particular variables
significantly predict an outcome, and the extent to which these variables
explain the differences in outcomes within the sample. To examine the
contribution of all demographic factors to the performance of the
candidates, a multiple regression model including school context, program
type, student characteristics, ethnicity, gender, education level, and primary
language was run to examine the extent to which demographic factors
explain the variability in total edTPA scores.
It is important to note that a finding that a factor is a “statistically significant”
predictor does not necessarily indicate that this factor makes a substantial or
meaningful difference in outcomes. The percent of variance explained (Delta
R2) by each factor is therefore presented here to describe the extent to which
each variable explains the differences in candidates’ edTPA scores.
The overall model was statistically significant F(48,38672) = 24.58 (p < 0.001),
indicating that this model predicts edTPA scores better than chance alone.
The following table presents each factor included in the model and the
percentage of variance in total scores accounted for by each factor and by
the overall model.
edTPA Annual Administrative Report
Data range: 1/1/2018 – 12/31/2018
Copyright © 2019 Board of Trustees of the Leland Stanford Junior University. All rights reserved.
Copyright © 2019 Pearson Education, Inc. or its affiliate(s). All rights reserved. Pearson, P.O. Box 226, Amherst, MA 01004 23
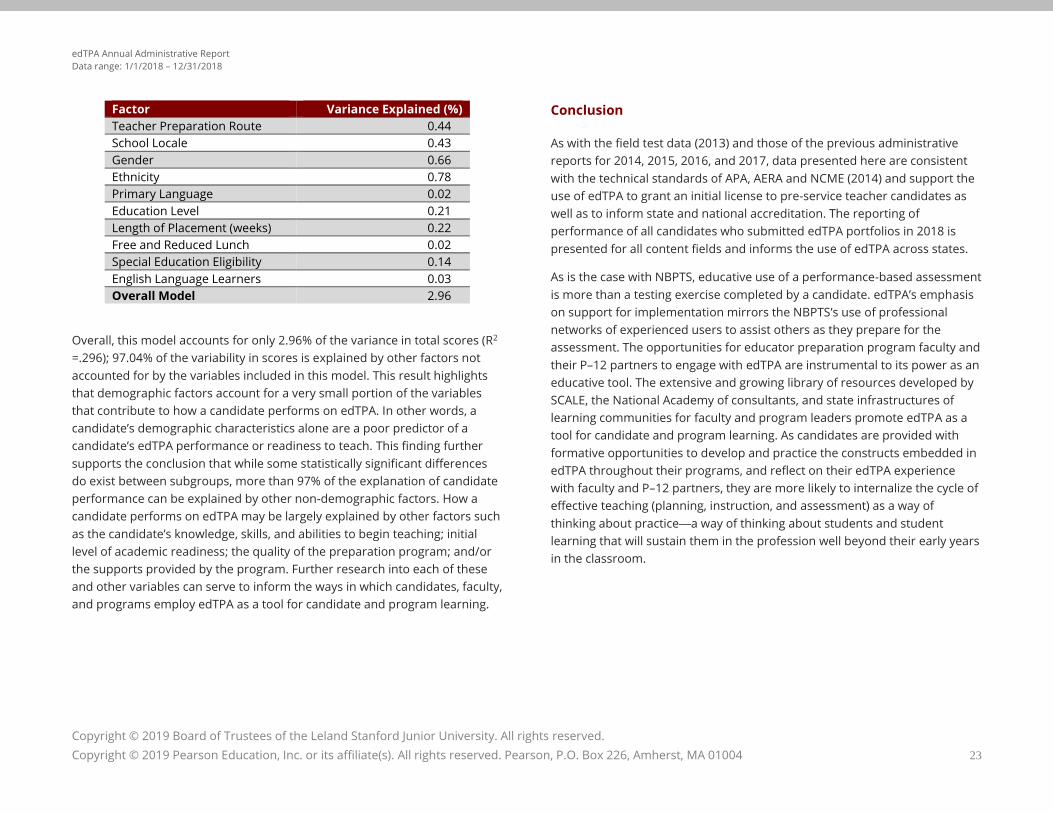
Factor Variance Explained (%)
Teacher Preparation Route 0.44
School Locale 0.43
Gender 0.66
Ethnicity 0.78
Primary Language 0.02
Education Level 0.21
Length of Placement (weeks) 0.22
Free and Reduced Lunch 0.02
Special Education Eligibility 0.14
English Language Learners 0.03
Overall Model 2.96
Overall, this model accounts for only 2.96% of the variance in total scores (R2
=.296); 97.04% of the variability in scores is explained by other factors not
accounted for by the variables included in this model. This result highlights
that demographic factors account for a very small portion of the variables
that contribute to how a candidate performs on edTPA. In other words, a
candidate’s demographic characteristics alone are a poor predictor of a
candidate’s edTPA performance or readiness to teach. This finding further
supports the conclusion that while some statistically significant differences
do exist between subgroups, more than 97% of the explanation of candidate
performance can be explained by other non-demographic factors. How a
candidate performs on edTPA may be largely explained by other factors such
as the candidate’s knowledge, skills, and abilities to begin teaching; initial
level of academic readiness; the quality of the preparation program; and/or
the supports provided by the program. Further research into each of these
and other variables can serve to inform the ways in which candidates, faculty,
and programs employ edTPA as a tool for candidate and program learning.
Conclusion
As with the field test data (2013) and those of the previous administrative
reports for 2014, 2015, 2016, and 2017, data presented here are consistent
with the technical standards of APA, AERA and NCME (2014) and support the
use of edTPA to grant an initial license to pre-service teacher candidates as
well as to inform state and national accreditation. The reporting of
performance of all candidates who submitted edTPA portfolios in 2018 is
presented for all content fields and informs the use of edTPA across states.
As is the case with NBPTS, educative use of a performance-based assessment
is more than a testing exercise completed by a candidate. edTPA’s emphasis
on support for implementation mirrors the NBPTS’s use of professional
networks of experienced users to assist others as they prepare for the
assessment. The opportunities for educator preparation program faculty and
their P–12 partners to engage with edTPA are instrumental to its power as an
educative tool. The extensive and growing library of resources developed by
SCALE, the National Academy of consultants, and state infrastructures of
learning communities for faculty and program leaders promote edTPA as a
tool for candidate and program learning. As candidates are provided with
formative opportunities to develop and practice the constructs embedded in
edTPA throughout their programs, and reflect on their edTPA experience
with faculty and P–12 partners, they are more likely to internalize the cycle of
effective teaching (planning, instruction, and assessment) as a way of
thinking about practice—a way of thinking about students and student
learning that will sustain them in the profession well beyond their early years
in the classroom.
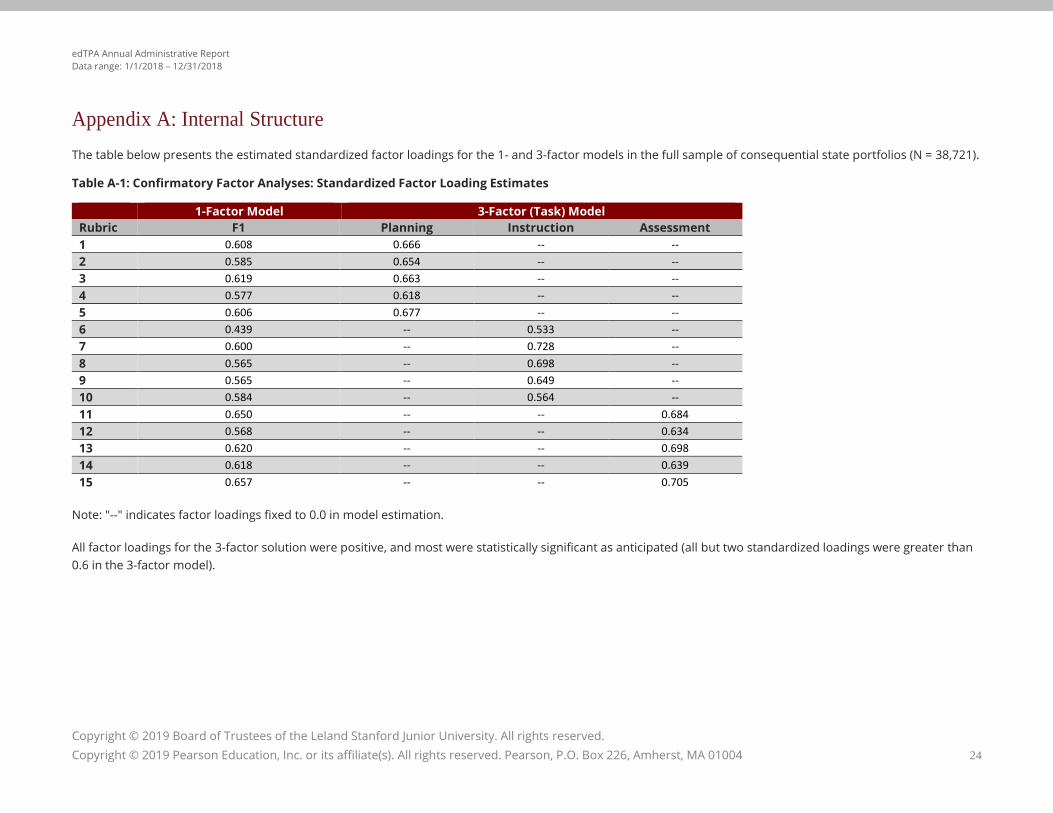
edTPA Annual Administrative Report
Data range: 1/1/2018 – 12/31/2018
Copyright © 2019 Board of Trustees of the Leland Stanford Junior University. All rights reserved.
Copyright © 2019 Pearson Education, Inc. or its affiliate(s). All rights reserved. Pearson, P.O. Box 226, Amherst, MA 01004 24
Appendix A: Internal Structure
The table below presents the estimated standardized factor loadings for the 1- and 3-factor models in the full sample of consequential state portfolios (N = 38,721).
Table A-1: Confirmatory Factor Analyses: Standardized Factor Loading Estimates
1-Factor Model 3-Factor (Task) Model
Rubric F1 Planning Instruction Assessment
1 0.608 0.666 -- --
2 0.585 0.654 -- --
3 0.619 0.663 -- --
4 0.577 0.618 -- --
5 0.606 0.677 -- --
6 0.439 -- 0.533 --
7 0.600 -- 0.728 --
8 0.565 -- 0.698 --
9 0.565 -- 0.649 --
10 0.584 -- 0.564 --
11 0.650 -- -- 0.684
12 0.568 -- -- 0.634
13 0.620 -- -- 0.698
14 0.618 -- -- 0.639
15 0.657 -- -- 0.705
Note: "--" indicates factor loadings fixed to 0.0 in model estimation.
All factor loadings for the 3-factor solution were positive, and most were statistically significant as anticipated (all but two standardized loadings were greater than
0.6 in the 3-factor model).

edTPA Annual Administrative Report
Data range: 1/1/2018 – 12/31/2018
Copyright © 2019 Board of Trustees of the Leland Stanford Junior University. All rights reserved.
Copyright © 2019 Pearson Education, Inc. or its affiliate(s). All rights reserved. Pearson, P.O. Box 226, Amherst, MA 01004 25
Table A-2: Confirmatory Factor Analyses: Task Factor Correlation Matrix
The table below presents the estimated correlations among the task factors in the 3-factor model.
Planning Instruction Assessment
Planning 1.000 -- --
Instruction 0.711 1.000 --
Assessment 0.780 0.714 1.000
The task factor correlations are moderately strong and statistically significant. This result supports the edTPA structure consisting of three correlated abilities:
Planning, Instruction, and Assessment.
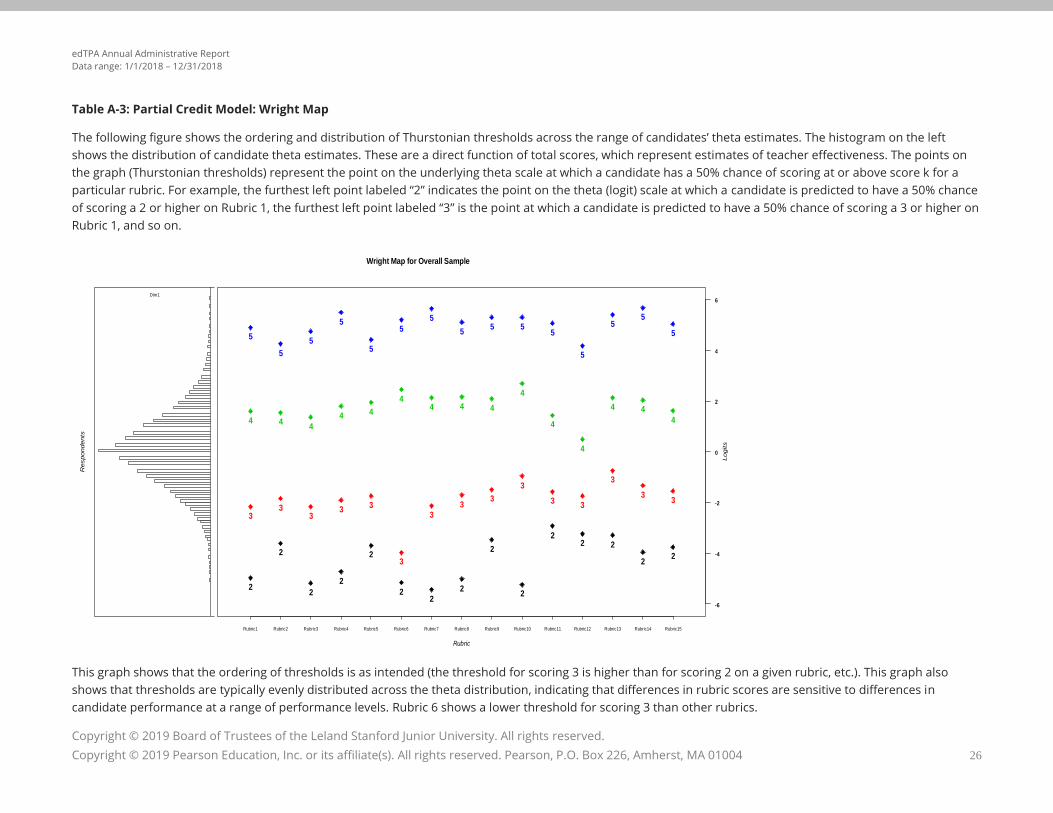
edTPA Annual Administrative Report
Data range: 1/1/2018 – 12/31/2018
Copyright © 2019 Board of Trustees of the Leland Stanford Junior University. All rights reserved.
Copyright © 2019 Pearson Education, Inc. or its affiliate(s). All rights reserved. Pearson, P.O. Box 226, Amherst, MA 01004 26
Table A-3: Partial Credit Model: Wright Map
The following figure shows the ordering and distribution of Thurstonian thresholds across the range of candidates’ theta estimates. The histogram on the left
shows the distribution of candidate theta estimates. These are a direct function of total scores, which represent estimates of teacher effectiveness. The points on
the graph (Thurstonian thresholds) represent the point on the underlying theta scale at which a candidate has a 50% chance of scoring at or above score k for a
particular rubric. For example, the furthest left point labeled “2” indicates the point on the theta (logit) scale at which a candidate is predicted to have a 50% chance
of scoring a 2 or higher on Rubric 1, the furthest left point labeled “3” is the point at which a candidate is predicted to have a 50% chance of scoring a 3 or higher on
Rubric 1, and so on.
This graph shows that the ordering of thresholds is as intended (the threshold for scoring 3 is higher than for scoring 2 on a given rubric, etc.). This graph also
shows that thresholds are typically evenly distributed across the theta distribution, indicating that differences in rubric scores are sensitive to differences in
candidate performance at a range of performance levels. Rubric 6 shows a lower threshold for scoring 3 than other rubrics.
Rubric
-6
-4
-2
0
2
4
6
Logits
2
2
2
2
2
22
2
2
2
22 2
22
33
33
3
3
3
33
3
33
3
33
4 44
4 4
44 4 4
4
4
4
4 4
4
5
5
5
5
5
5
5
55 5
5
5
55
5
Rubric1 Rubric2 Rubric3 Rubric4 Rubric5 Rubric6 Rubric7 Rubric8 Rubric9 Rubric10 Rubric11 Rubric12 Rubric13 Rubric14 Rubric15
Wright Map for Overall Sample
Respondents
Dim1
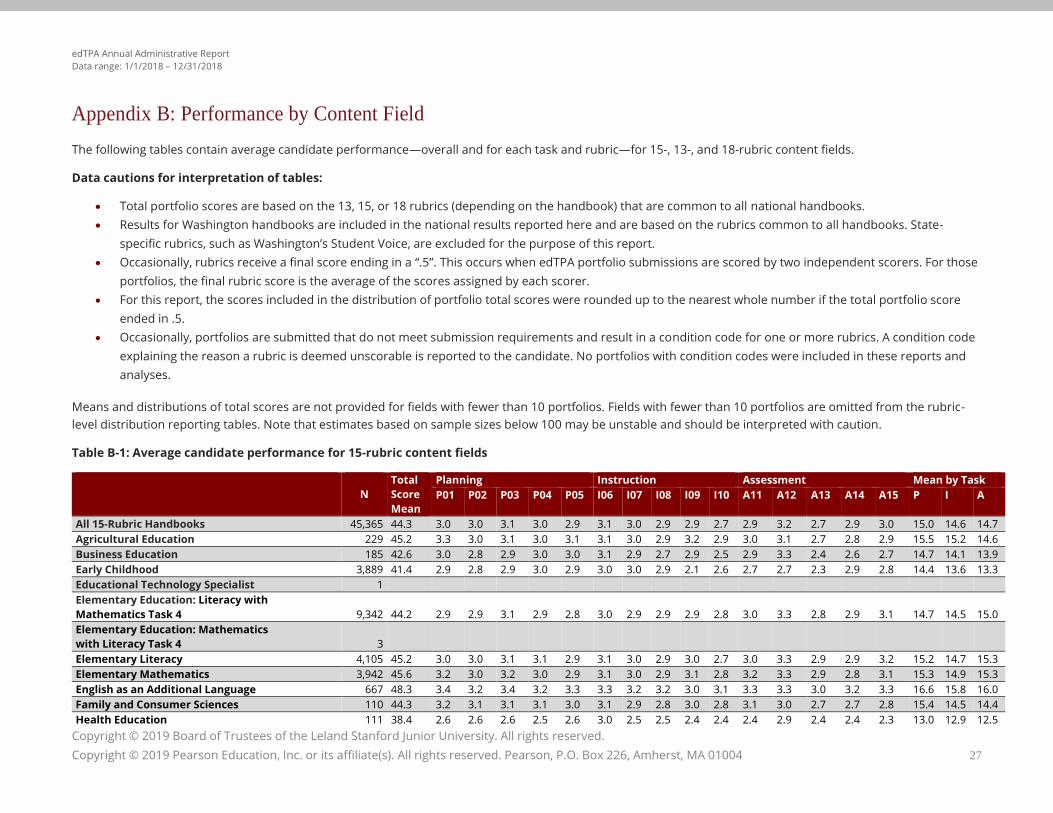
edTPA Annual Administrative Report
Data range: 1/1/2018 – 12/31/2018
Copyright © 2019 Board of Trustees of the Leland Stanford Junior University. All rights reserved.
Copyright © 2019 Pearson Education, Inc. or its affiliate(s). All rights reserved. Pearson, P.O. Box 226, Amherst, MA 01004 27
Appendix B: Performance by Content Field
The following tables contain average candidate performance—overall and for each task and rubric—for 15-, 13-, and 18-rubric content fields.
Data cautions for interpretation of tables:
• Total portfolio scores are based on the 13, 15, or 18 rubrics (depending on the handbook) that are common to all national handbooks.
• Results for Washington handbooks are included in the national results reported here and are based on the rubrics common to all handbooks. State-
specific rubrics, such as Washington’s Student Voice, are excluded for the purpose of this report.
• Occasionally, rubrics receive a final score ending in a “.5”. This occurs when edTPA portfolio submissions are scored by two independent scorers. For those
portfolios, the final rubric score is the average of the scores assigned by each scorer.
• For this report, the scores included in the distribution of portfolio total scores were rounded up to the nearest whole number if the total portfolio score
ended in .5.
• Occasionally, portfolios are submitted that do not meet submission requirements and result in a condition code for one or more rubrics. A condition code
explaining the reason a rubric is deemed unscorable is reported to the candidate. No portfolios with condition codes were included in these reports and
analyses.
Means and distributions of total scores are not provided for fields with fewer than 10 portfolios. Fields with fewer than 10 portfolios are omitted from the rubric-
level distribution reporting tables. Note that estimates based on sample sizes below 100 may be unstable and should be interpreted with caution.
Table B-1: Average candidate performance for 15-rubric content fields
N
Total
Score
Mean
Planning Instruction Assessment Mean by Task
P01 P02 P03 P04 P05 I06 I07 I08 I09 I10 A11 A12 A13 A14 A15 P I A
All 15-Rubric Handbooks 45,365 44.3 3.0 3.0 3.1 3.0 2.9 3.1 3.0 2.9 2.9 2.7 2.9 3.2 2.7 2.9 3.0 15.0 14.6 14.7
Agricultural Education 229 45.2 3.3 3.0 3.1 3.0 3.1 3.1 3.0 2.9 3.2 2.9 3.0 3.1 2.7 2.8 2.9 15.5 15.2 14.6
Business Education 185 42.6 3.0 2.8 2.9 3.0 3.0 3.1 2.9 2.7 2.9 2.5 2.9 3.3 2.4 2.6 2.7 14.7 14.1 13.9
Early Childhood 3,889 41.4 2.9 2.8 2.9 3.0 2.9 3.0 3.0 2.9 2.1 2.6 2.7 2.7 2.3 2.9 2.8 14.4 13.6 13.3
Educational Technology Specialist 1
Elementary Education: Literacy with
Mathematics Task 4 9,342 44.2 2.9 2.9 3.1 2.9 2.8 3.0 2.9 2.9 2.9 2.8 3.0 3.3 2.8 2.9 3.1 14.7 14.5 15.0
Elementary Education: Mathematics
with Literacy Task 4
3
Elementary Literacy 4,105 45.2 3.0 3.0 3.1 3.1 2.9 3.1 3.0 2.9 3.0 2.7 3.0 3.3 2.9 2.9 3.2 15.2 14.7 15.3
Elementary Mathematics 3,942 45.6 3.2 3.0 3.2 3.0 2.9 3.1 3.0 2.9 3.1 2.8 3.2 3.3 2.9 2.8 3.1 15.3 14.9 15.3
English as an Additional Language 667 48.3 3.4 3.2 3.4 3.2 3.3 3.3 3.2 3.2 3.0 3.1 3.3 3.3 3.0 3.2 3.3 16.6 15.8 16.0
Family and Consumer Sciences 110 44.3 3.2 3.1 3.1 3.1 3.0 3.1 2.9 2.8 3.0 2.8 3.1 3.0 2.7 2.7 2.8 15.4 14.5 14.4
Health Education 111 38.4 2.6 2.6 2.6 2.5 2.6 3.0 2.5 2.5 2.4 2.4 2.4 2.9 2.4 2.4 2.3 13.0 12.9 12.5
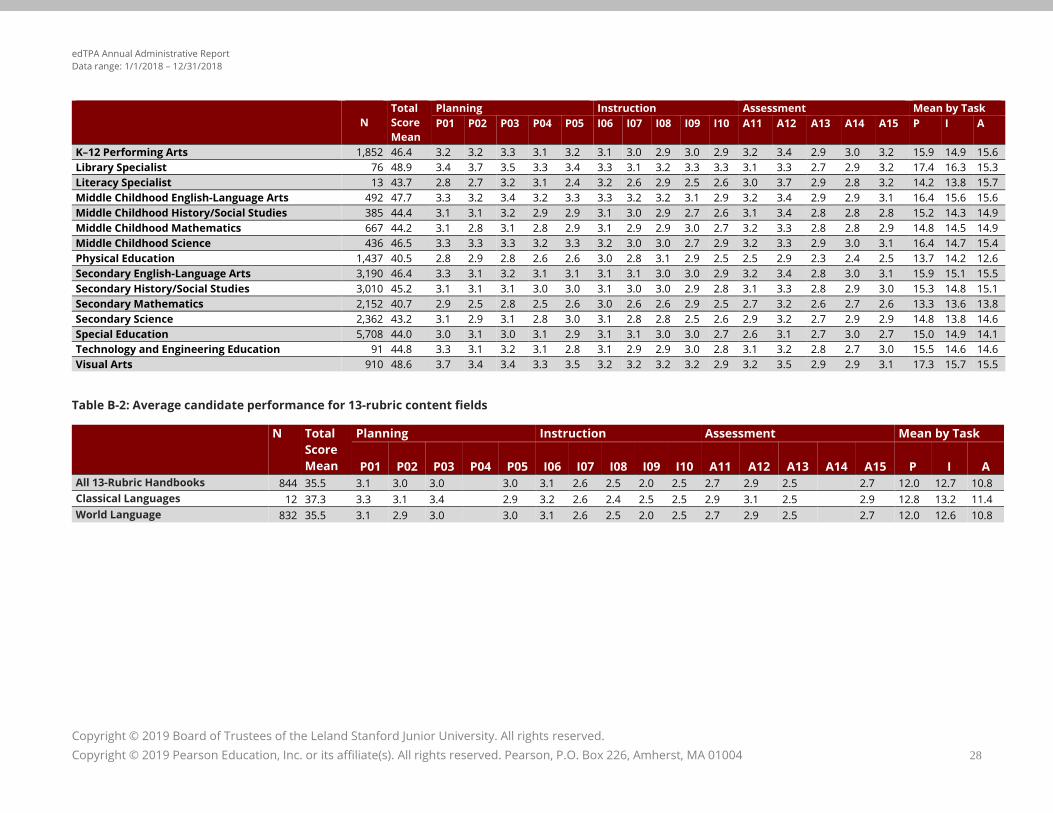
edTPA Annual Administrative Report
Data range: 1/1/2018 – 12/31/2018
Copyright © 2019 Board of Trustees of the Leland Stanford Junior University. All rights reserved.
Copyright © 2019 Pearson Education, Inc. or its affiliate(s). All rights reserved. Pearson, P.O. Box 226, Amherst, MA 01004 28
N
Total
Score
Mean
Planning Instruction Assessment Mean by Task
P01 P02 P03 P04 P05 I06 I07 I08 I09 I10 A11 A12 A13 A14 A15 P I A
K–12 Performing Arts 1,852 46.4 3.2 3.2 3.3 3.1 3.2 3.1 3.0 2.9 3.0 2.9 3.2 3.4 2.9 3.0 3.2 15.9 14.9 15.6
Library Specialist 76 48.9 3.4 3.7 3.5 3.3 3.4 3.3 3.1 3.2 3.3 3.3 3.1 3.3 2.7 2.9 3.2 17.4 16.3 15.3
Literacy Specialist 13 43.7 2.8 2.7 3.2 3.1 2.4 3.2 2.6 2.9 2.5 2.6 3.0 3.7 2.9 2.8 3.2 14.2 13.8 15.7
Middle Childhood English-Language Arts 492 47.7 3.3 3.2 3.4 3.2 3.3 3.3 3.2 3.2 3.1 2.9 3.2 3.4 2.9 2.9 3.1 16.4 15.6 15.6
Middle Childhood History/Social Studies 385 44.4 3.1 3.1 3.2 2.9 2.9 3.1 3.0 2.9 2.7 2.6 3.1 3.4 2.8 2.8 2.8 15.2 14.3 14.9
Middle Childhood Mathematics 667 44.2 3.1 2.8 3.1 2.8 2.9 3.1 2.9 2.9 3.0 2.7 3.2 3.3 2.8 2.8 2.9 14.8 14.5 14.9
Middle Childhood Science 436 46.5 3.3 3.3 3.3 3.2 3.3 3.2 3.0 3.0 2.7 2.9 3.2 3.3 2.9 3.0 3.1 16.4 14.7 15.4
Physical Education 1,437 40.5 2.8 2.9 2.8 2.6 2.6 3.0 2.8 3.1 2.9 2.5 2.5 2.9 2.3 2.4 2.5 13.7 14.2 12.6
Secondary English-Language Arts 3,190 46.4 3.3 3.1 3.2 3.1 3.1 3.1 3.1 3.0 3.0 2.9 3.2 3.4 2.8 3.0 3.1 15.9 15.1 15.5
Secondary History/Social Studies 3,010 45.2 3.1 3.1 3.1 3.0 3.0 3.1 3.0 3.0 2.9 2.8 3.1 3.3 2.8 2.9 3.0 15.3 14.8 15.1
Secondary Mathematics 2,152 40.7 2.9 2.5 2.8 2.5 2.6 3.0 2.6 2.6 2.9 2.5 2.7 3.2 2.6 2.7 2.6 13.3 13.6 13.8
Secondary Science 2,362 43.2 3.1 2.9 3.1 2.8 3.0 3.1 2.8 2.8 2.5 2.6 2.9 3.2 2.7 2.9 2.9 14.8 13.8 14.6
Special Education 5,708 44.0 3.0 3.1 3.0 3.1 2.9 3.1 3.1 3.0 3.0 2.7 2.6 3.1 2.7 3.0 2.7 15.0 14.9 14.1
Technology and Engineering Education 91 44.8 3.3 3.1 3.2 3.1 2.8 3.1 2.9 2.9 3.0 2.8 3.1 3.2 2.8 2.7 3.0 15.5 14.6 14.6
Visual Arts 910 48.6 3.7 3.4 3.4 3.3 3.5 3.2 3.2 3.2 3.2 2.9 3.2 3.5 2.9 2.9 3.1 17.3 15.7 15.5
Table B-2: Average candidate performance for 13-rubric content fields
N Total
Score
Mean
Planning Instruction Assessment Mean by Task
P01 P02 P03 P04 P05 I06 I07 I08 I09 I10 A11 A12 A13 A14 A15 P I A
All 13-Rubric Handbooks 844 35.5 3.1 3.0 3.0 3.0 3.1 2.6 2.5 2.0 2.5 2.7 2.9 2.5 2.7 12.0 12.7 10.8
Classical Languages 12 37.3 3.3 3.1 3.4 2.9 3.2 2.6 2.4 2.5 2.5 2.9 3.1 2.5 2.9 12.8 13.2 11.4
World Language 832 35.5 3.1 2.9 3.0 3.0 3.1 2.6 2.5 2.0 2.5 2.7 2.9 2.5 2.7 12.0 12.6 10.8
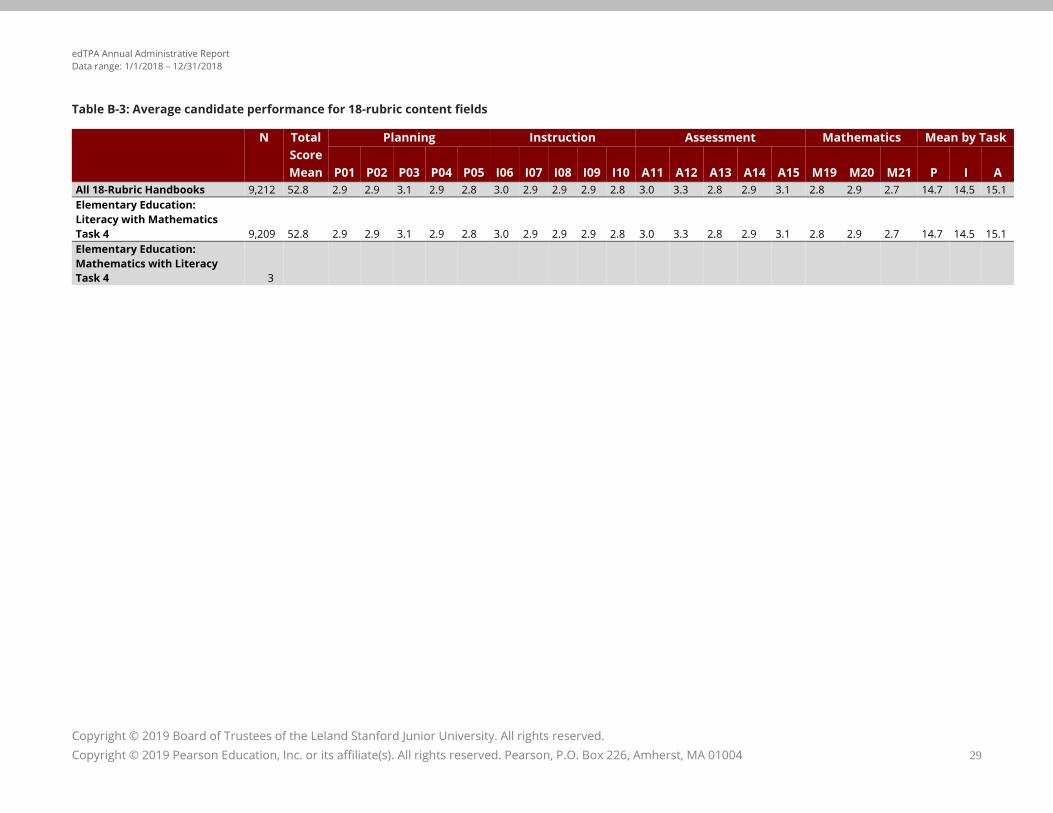
edTPA Annual Administrative Report
Data range: 1/1/2018 – 12/31/2018
Copyright © 2019 Board of Trustees of the Leland Stanford Junior University. All rights reserved.
Copyright © 2019 Pearson Education, Inc. or its affiliate(s). All rights reserved. Pearson, P.O. Box 226, Amherst, MA 01004 29
Table B-3: Average candidate performance for 18-rubric content fields
N Total
Score
Mean
Planning Instruction Assessment Mathematics Mean by Task
P01 P02 P03 P04 P05 I06 I07 I08 I09 I10 A11 A12 A13 A14 A15 M19 M20 M21 P I A
All 18-Rubric Handbooks 9,212 52.8 2.9 2.9 3.1 2.9 2.8 3.0 2.9 2.9 2.9 2.8 3.0 3.3 2.8 2.9 3.1 2.8 2.9 2.7 14.7 14.5 15.1
Elementary Education:
Literacy with Mathematics
Task 4 9,209 52.8 2.9 2.9 3.1 2.9 2.8 3.0 2.9 2.9 2.9 2.8 3.0 3.3 2.8 2.9 3.1 2.8 2.9 2.7 14.7 14.5 15.1
Elementary Education:
Mathematics with Literacy
Task 4 3
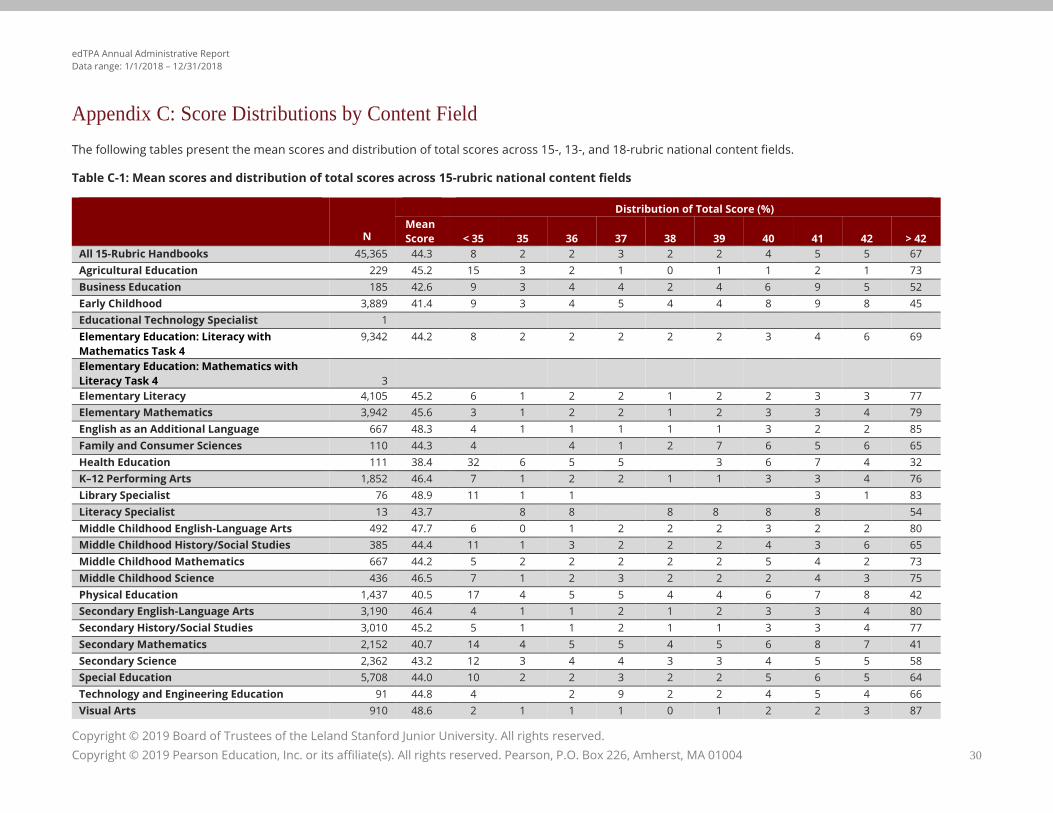
edTPA Annual Administrative Report
Data range: 1/1/2018 – 12/31/2018
Copyright © 2019 Board of Trustees of the Leland Stanford Junior University. All rights reserved.
Copyright © 2019 Pearson Education, Inc. or its affiliate(s). All rights reserved. Pearson, P.O. Box 226, Amherst, MA 01004 30
Appendix C: Score Distributions by Content Field
The following tables present the mean scores and distribution of total scores across 15-, 13-, and 18-rubric national content fields.
Table C-1: Mean scores and distribution of total scores across 15-rubric national content fields
N
Distribution of Total Score (%)
Mean
Score < 35 35 36 37 38 39 40 41 42 > 42
All 15-Rubric Handbooks 45,365 44.3 8 2 2 3 2 2 4 5 5 67
Agricultural Education 229 45.2 15 3 2 1 0 1 1 2 1 73
Business Education 185 42.6 9 3 4 4 2 4 6 9 5 52
Early Childhood 3,889 41.4 9 3 4 5 4 4 8 9 8 45
Educational Technology Specialist 1
Elementary Education: Literacy with
Mathematics Task 4
9,342 44.2 8 2 2 2 2 2 3 4 6 69
Elementary Education: Mathematics with
Literacy Task 4
3
Elementary Literacy 4,105 45.2 6 1 2 2 1 2 2 3 3 77
Elementary Mathematics 3,942 45.6 3 1 2 2 1 2 3 3 4 79
English as an Additional Language 667 48.3 4 1 1 1 1 1 3 2 2 85
Family and Consumer Sciences 110 44.3 4 4 1 2 7 6 5 6 65
Health Education 111 38.4 32 6 5 5 3 6 7 4 32
K–12 Performing Arts 1,852 46.4 7 1 2 2 1 1 3 3 4 76
Library Specialist 76 48.9 11 1 1 3 1 83
Literacy Specialist 13 43.7 8 8 8 8 8 8 54
Middle Childhood English-Language Arts 492 47.7 6 0 1 2 2 2 3 2 2 80
Middle Childhood History/Social Studies 385 44.4 11 1 3 2 2 2 4 3 6 65
Middle Childhood Mathematics 667 44.2 5 2 2 2 2 2 5 4 2 73
Middle Childhood Science 436 46.5 7 1 2 3 2 2 2 4 3 75
Physical Education 1,437 40.5 17 4 5 5 4 4 6 7 8 42
Secondary English-Language Arts 3,190 46.4 4 1 1 2 1 2 3 3 4 80
Secondary History/Social Studies 3,010 45.2 5 1 1 2 1 1 3 3 4 77
Secondary Mathematics 2,152 40.7 14 4 5 5 4 5 6 8 7 41
Secondary Science 2,362 43.2 12 3 4 4 3 3 4 5 5 58
Special Education 5,708 44.0 10 2 2 3 2 2 5 6 5 64
Technology and Engineering Education 91 44.8 4 2 9 2 2 4 5 4 66
Visual Arts 910 48.6 2 1 1 1 0 1 2 2 3 87
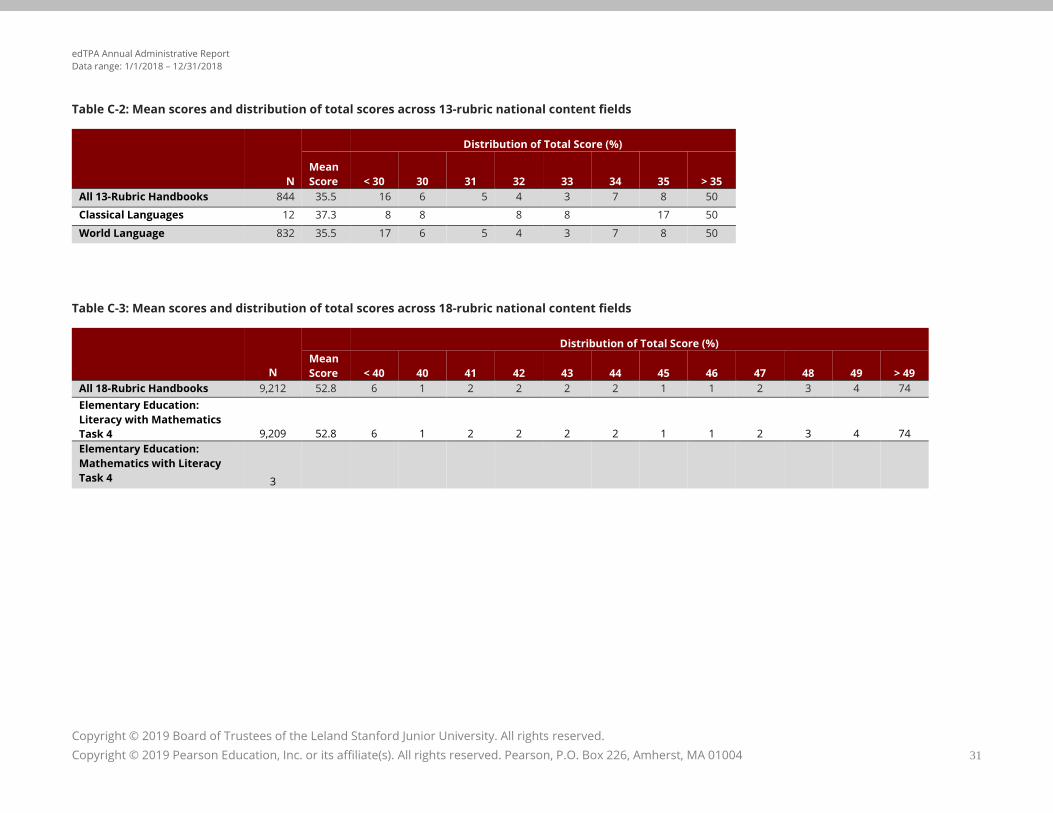
edTPA Annual Administrative Report
Data range: 1/1/2018 – 12/31/2018
Copyright © 2019 Board of Trustees of the Leland Stanford Junior University. All rights reserved.
Copyright © 2019 Pearson Education, Inc. or its affiliate(s). All rights reserved. Pearson, P.O. Box 226, Amherst, MA 01004 31
Table C-2: Mean scores and distribution of total scores across 13-rubric national content fields
N
Distribution of Total Score (%)
Mean
Score < 30 30 31 32 33 34 35 > 35
All 13-Rubric Handbooks 844 35.5 16 6 5 4 3 7 8 50
Classical Languages 12 37.3 8 8 8 8 17 50
World Language 832 35.5 17 6 5 4 3 7 8 50
Table C-3: Mean scores and distribution of total scores across 18-rubric national content fields
N
Distribution of Total Score (%)
Mean
Score < 40 40 41 42 43 44 45 46 47 48 49 > 49
All 18-Rubric Handbooks 9,212 52.8 6 1 2 2 2 2 1 1 2 3 4 74
Elementary Education:
Literacy with Mathematics
Task 4 9,209 52.8 6 1 2 2 2 2 1 1 2 3 4 74
Elementary Education:
Mathematics with Literacy
Task 4 3
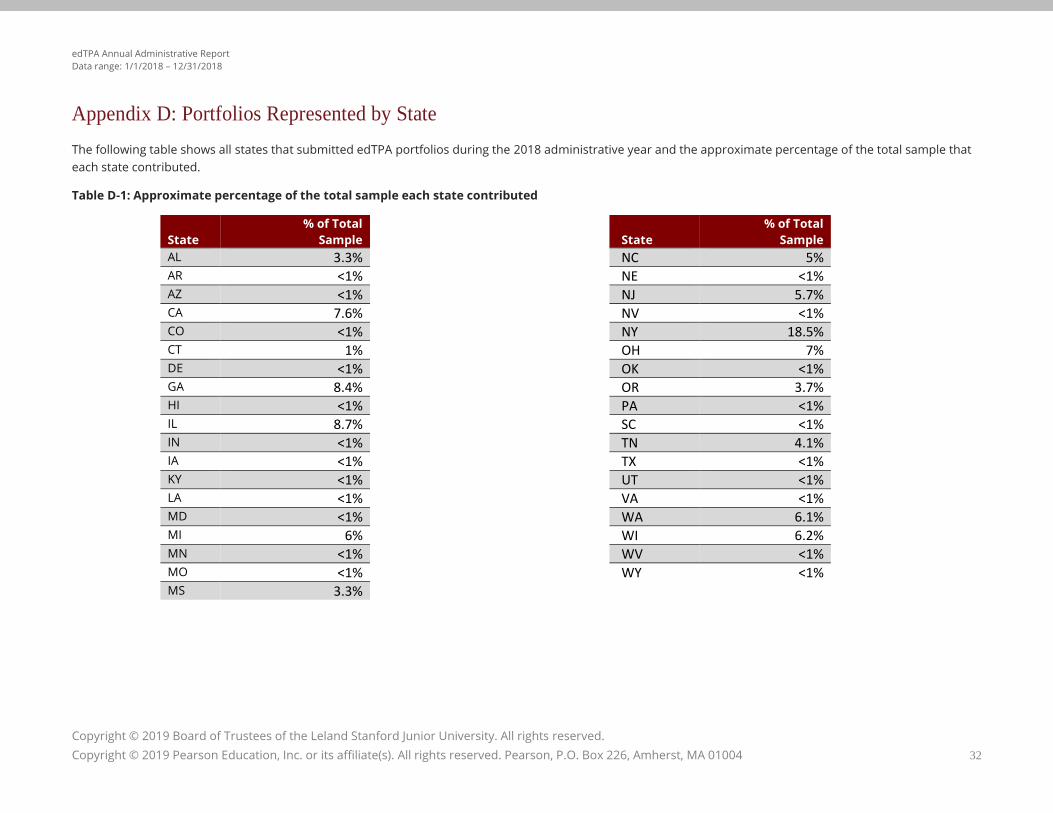
edTPA Annual Administrative Report
Data range: 1/1/2018 – 12/31/2018
Copyright © 2019 Board of Trustees of the Leland Stanford Junior University. All rights reserved.
Copyright © 2019 Pearson Education, Inc. or its affiliate(s). All rights reserved. Pearson, P.O. Box 226, Amherst, MA 01004 32
Appendix D: Portfolios Represented by State
The following table shows all states that submitted edTPA portfolios during the 2018 administrative year and the approximate percentage of the total sample that
each state contributed.
Table D-1: Approximate percentage of the total sample each state contributed
State
% of Total
Sample
AL 3.3%
AR <1%
AZ <1%
CA 7.6%
CO <1%
CT 1%
DE <1%
GA 8.4%
HI <1%
IL 8.7%
IN <1%
IA <1%
KY <1%
LA <1%
MD <1%
MI 6%
MN <1%
MO <1%
MS 3.3%
State
% of Total
Sample
NC 5%
NE <1%
NJ 5.7%
NV <1%
NY 18.5%
OH 7%
OK <1%
OR 3.7%
PA <1%
SC <1%
TN 4.1%
TX <1%
UT <1%
VA <1%
WA 6.1%
WI 6.2%
WV <1%
WY <1%
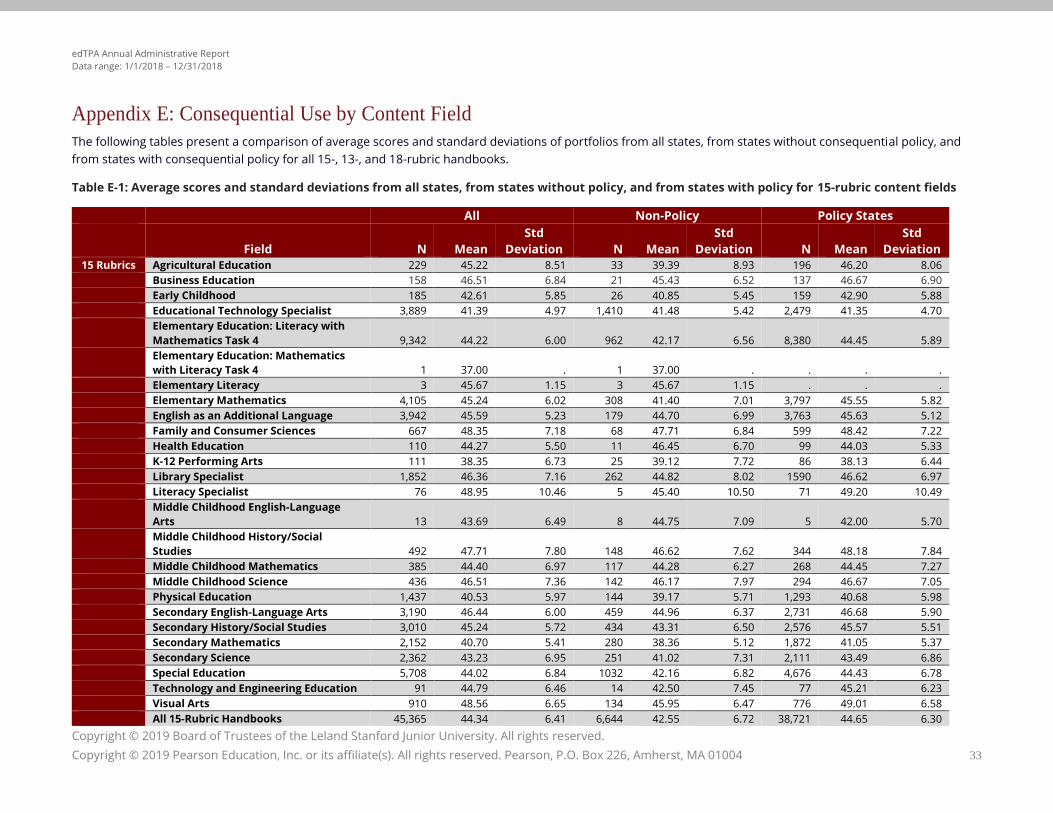
edTPA Annual Administrative Report
Data range: 1/1/2018 – 12/31/2018
Copyright © 2019 Board of Trustees of the Leland Stanford Junior University. All rights reserved.
Copyright © 2019 Pearson Education, Inc. or its affiliate(s). All rights reserved. Pearson, P.O. Box 226, Amherst, MA 01004 33
Appendix E: Consequential Use by Content Field
The following tables present a comparison of average scores and standard deviations of portfolios from all states, from states without consequential policy, and
from states with consequential policy for all 15-, 13-, and 18-rubric handbooks.
Table E-1: Average scores and standard deviations from all states, from states without policy, and from states with policy for 15-rubric content fields
All Non-Policy Policy States
Field N Mean
Std
Deviation N Mean
Std
Deviation N Mean
Std
Deviation
15 Rubrics Agricultural Education 229 45.22 8.51 33 39.39 8.93 196 46.20 8.06
Business Education 158 46.51 6.84 21 45.43 6.52 137 46.67 6.90
Early Childhood 185 42.61 5.85 26 40.85 5.45 159 42.90 5.88
Educational Technology Specialist 3,889 41.39 4.97 1,410 41.48 5.42 2,479 41.35 4.70
Elementary Education: Literacy with
Mathematics Task 4 9,342 44.22 6.00 962 42.17 6.56 8,380 44.45 5.89
Elementary Education: Mathematics
with Literacy Task 4 1 37.00 . 1 37.00 . . . .
Elementary Literacy 3 45.67 1.15 3 45.67 1.15 . . .
Elementary Mathematics 4,105 45.24 6.02 308 41.40 7.01 3,797 45.55 5.82
English as an Additional Language 3,942 45.59 5.23 179 44.70 6.99 3,763 45.63 5.12
Family and Consumer Sciences 667 48.35 7.18 68 47.71 6.84 599 48.42 7.22
Health Education 110 44.27 5.50 11 46.45 6.70 99 44.03 5.33
K-12 Performing Arts 111 38.35 6.73 25 39.12 7.72 86 38.13 6.44
Library Specialist 1,852 46.36 7.16 262 44.82 8.02 1590 46.62 6.97
Literacy Specialist 76 48.95 10.46 5 45.40 10.50 71 49.20 10.49
Middle Childhood English-Language
Arts 13 43.69 6.49 8 44.75 7.09 5 42.00 5.70
Middle Childhood History/Social
Studies 492 47.71 7.80 148 46.62 7.62 344 48.18 7.84
Middle Childhood Mathematics 385 44.40 6.97 117 44.28 6.27 268 44.45 7.27
Middle Childhood Science 436 46.51 7.36 142 46.17 7.97 294 46.67 7.05
Physical Education 1,437 40.53 5.97 144 39.17 5.71 1,293 40.68 5.98
Secondary English-Language Arts 3,190 46.44 6.00 459 44.96 6.37 2,731 46.68 5.90
Secondary History/Social Studies 3,010 45.24 5.72 434 43.31 6.50 2,576 45.57 5.51
Secondary Mathematics 2,152 40.70 5.41 280 38.36 5.12 1,872 41.05 5.37
Secondary Science 2,362 43.23 6.95 251 41.02 7.31 2,111 43.49 6.86
Special Education 5,708 44.02 6.84 1032 42.16 6.82 4,676 44.43 6.78
Technology and Engineering Education 91 44.79 6.46 14 42.50 7.45 77 45.21 6.23
Visual Arts 910 48.56 6.65 134 45.95 6.47 776 49.01 6.58
All 15-Rubric Handbooks 45,365 44.34 6.41 6,644 42.55 6.72 38,721 44.65 6.30
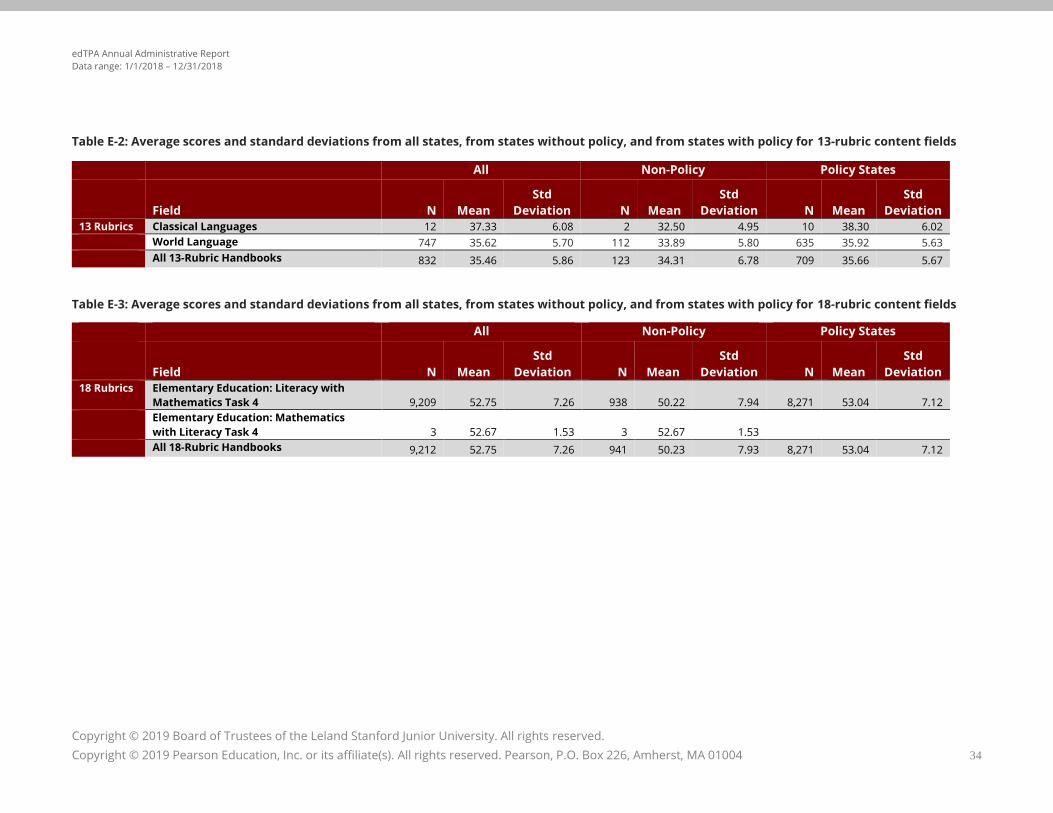
edTPA Annual Administrative Report
Data range: 1/1/2018 – 12/31/2018
Copyright © 2019 Board of Trustees of the Leland Stanford Junior University. All rights reserved.
Copyright © 2019 Pearson Education, Inc. or its affiliate(s). All rights reserved. Pearson, P.O. Box 226, Amherst, MA 01004 34
Table E-2: Average scores and standard deviations from all states, from states without policy, and from states with policy for 13-rubric content fields
All Non-Policy Policy States
Field N Mean
Std
Deviation N Mean
Std
Deviation N Mean
Std
Deviation
13 Rubrics Classical Languages 12 37.33 6.08 2 32.50 4.95 10 38.30 6.02
World Language 747 35.62 5.70 112 33.89 5.80 635 35.92 5.63
All 13-Rubric Handbooks 832 35.46 5.86 123 34.31 6.78 709 35.66 5.67
Table E-3: Average scores and standard deviations from all states, from states without policy, and from states with policy for 18-rubric content fields
All Non-Policy Policy States
Field N Mean
Std
Deviation N Mean
Std
Deviation N Mean
Std
Deviation
18 Rubrics Elementary Education: Literacy with
Mathematics Task 4 9,209 52.75 7.26 938 50.22 7.94 8,271 53.04 7.12
Elementary Education: Mathematics
with Literacy Task 4 3 52.67 1.53 3 52.67 1.53
All 18-Rubric Handbooks 9,212 52.75 7.26 941 50.23 7.93 8,271 53.04 7.12
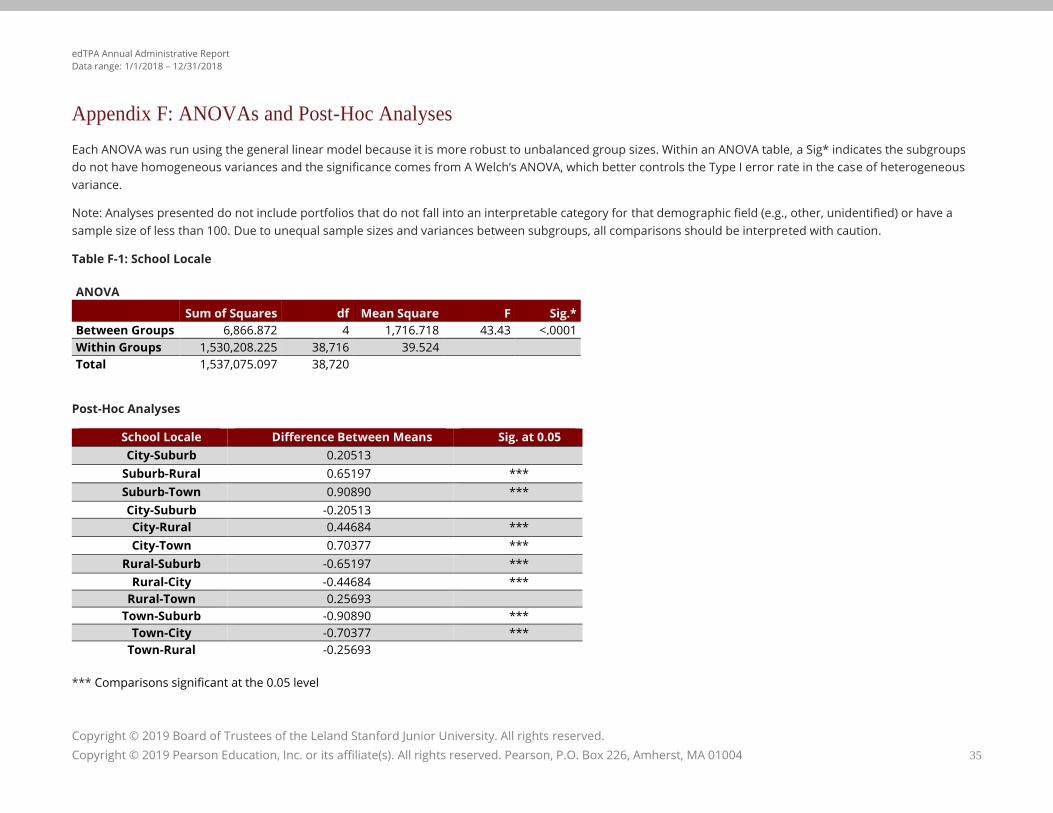
edTPA Annual Administrative Report
Data range: 1/1/2018 – 12/31/2018
Copyright © 2019 Board of Trustees of the Leland Stanford Junior University. All rights reserved.
Copyright © 2019 Pearson Education, Inc. or its affiliate(s). All rights reserved. Pearson, P.O. Box 226, Amherst, MA 01004 35
Appendix F: ANOVAs and Post-Hoc Analyses
Each ANOVA was run using the general linear model because it is more robust to unbalanced group sizes. Within an ANOVA table, a Sig* indicates the subgroups
do not have homogeneous variances and the significance comes from A Welch’s ANOVA, which better controls the Type I error rate in the case of heterogeneous
variance.
Note: Analyses presented do not include portfolios that do not fall into an interpretable category for that demographic field (e.g., other, unidentified) or have a
sample size of less than 100. Due to unequal sample sizes and variances between subgroups, all comparisons should be interpreted with caution.
Table F-1: School Locale
ANOVA
Sum of Squares df Mean Square F Sig.*
Between Groups 6,866.872 4 1,716.718 43.43 <.0001
Within Groups 1,530,208.225 38,716 39.524
Total 1,537,075.097 38,720
Post-Hoc Analyses
School Locale Difference Between Means Sig. at 0.05
City-Suburb 0.20513
Suburb-Rural 0.65197 ***
Suburb-Town 0.90890 ***
City-Suburb -0.20513
City-Rural 0.44684 ***
City-Town 0.70377 ***
Rural-Suburb -0.65197 ***
Rural-City -0.44684 ***
Rural-Town 0.25693
Town-Suburb -0.90890 ***
Town-City -0.70377 ***
Town-Rural -0.25693
*** Comparisons significant at the 0.05 level
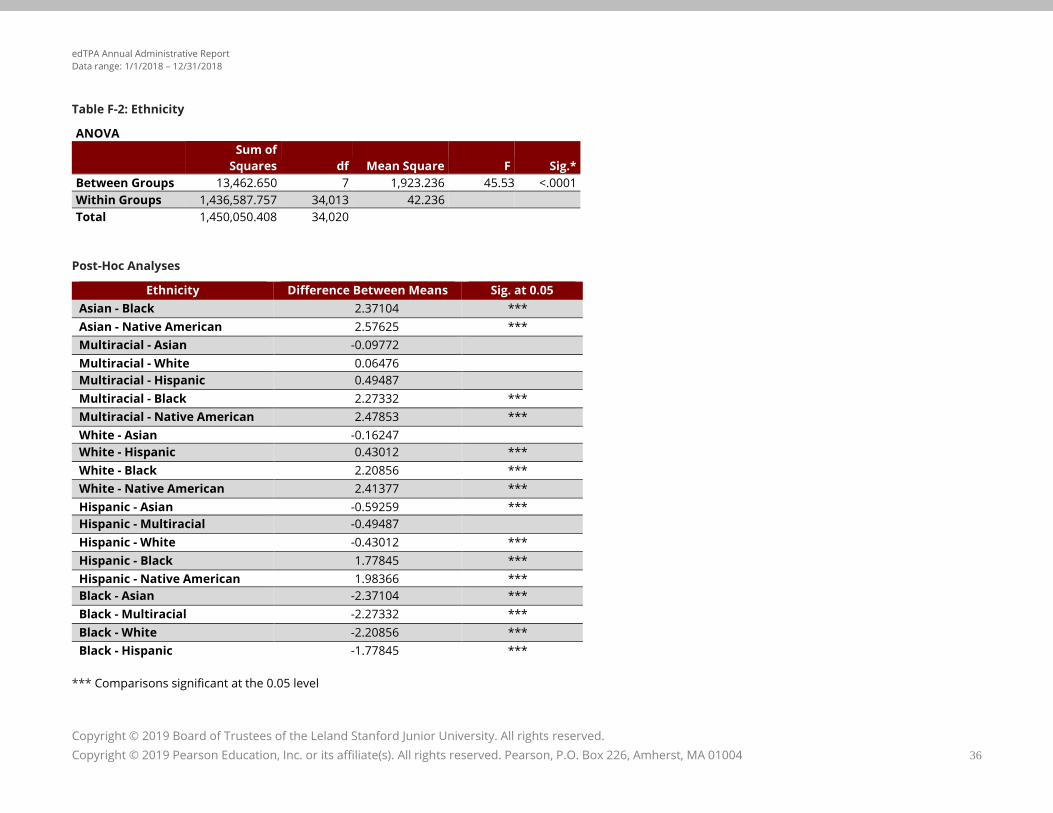
edTPA Annual Administrative Report
Data range: 1/1/2018 – 12/31/2018
Copyright © 2019 Board of Trustees of the Leland Stanford Junior University. All rights reserved.
Copyright © 2019 Pearson Education, Inc. or its affiliate(s). All rights reserved. Pearson, P.O. Box 226, Amherst, MA 01004 36
Table F-2: Ethnicity
ANOVA
Sum of
Squares df Mean Square F Sig.*
Between Groups 13,462.650 7 1,923.236 45.53 <.0001
Within Groups 1,436,587.757 34,013 42.236
Total 1,450,050.408 34,020
Post-Hoc Analyses
Ethnicity Difference Between Means Sig. at 0.05
Asian - Black 2.37104 ***
Asian - Native American 2.57625 ***
Multiracial - Asian -0.09772
Multiracial - White 0.06476
Multiracial - Hispanic 0.49487
Multiracial - Black 2.27332 ***
Multiracial - Native American 2.47853 ***
White - Asian -0.16247
White - Hispanic 0.43012 ***
White - Black 2.20856 ***
White - Native American 2.41377 ***
Hispanic - Asian -0.59259 ***
Hispanic - Multiracial -0.49487
Hispanic - White -0.43012 ***
Hispanic - Black 1.77845 ***
Hispanic - Native American 1.98366 ***
Black - Asian -2.37104 ***
Black - Multiracial -2.27332 ***
Black - White -2.20856 ***
Black - Hispanic -1.77845 ***
*** Comparisons significant at the 0.05 level
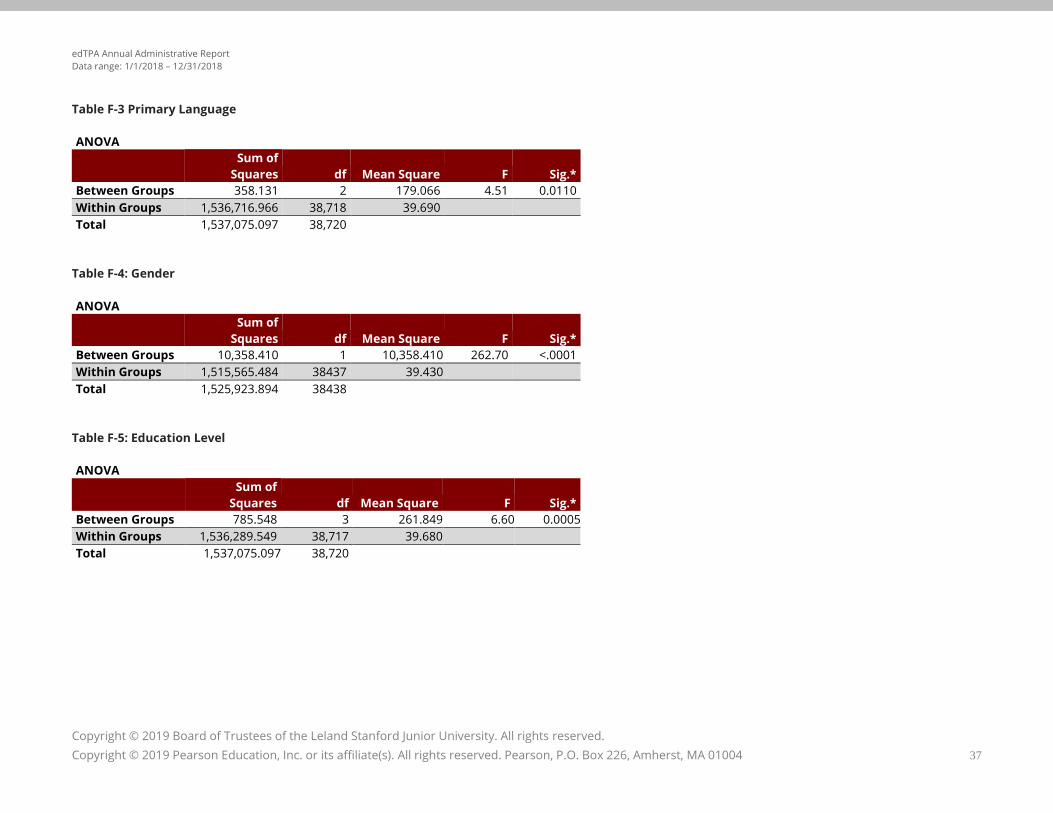
edTPA Annual Administrative Report
Data range: 1/1/2018 – 12/31/2018
Copyright © 2019 Board of Trustees of the Leland Stanford Junior University. All rights reserved.
Copyright © 2019 Pearson Education, Inc. or its affiliate(s). All rights reserved. Pearson, P.O. Box 226, Amherst, MA 01004 37
Table F-3 Primary Language
ANOVA
Sum of
Squares df Mean Square F Sig.*
Between Groups 358.131 2 179.066 4.51 0.0110
Within Groups 1,536,716.966 38,718 39.690
Total 1,537,075.097 38,720
Table F-4: Gender
ANOVA
Sum of
Squares df Mean Square F Sig.*
Between Groups 10,358.410 1 10,358.410 262.70 <.0001
Within Groups 1,515,565.484 38437 39.430
Total 1,525,923.894 38438
Table F-5: Education Level
ANOVA
Sum of
Squares df Mean Square F Sig.*
Between Groups 785.548 3 261.849 6.60 0.0005
Within Groups 1,536,289.549 38,717 39.680
Total 1,537,075.097 38,720
edTPA Annual Administrative Report
Data range: 1/1/2018 – 12/31/2018
Copyright © 2019 Board of Trustees of the Leland Stanford Junior University. All rights reserved.
Copyright © 2019 Pearson Education, Inc. or its affiliate(s). All rights reserved. Pearson, P.O. Box 226, Amherst, MA 01004 38
Citations
American Educational Research Association, American Psychological Association, National Council on Measurement in Education. (2014). Standards for educational and
psychological testing. Washington, DC: American Educational Research Association.
Brennan, R. L., & Prediger, D. J. (1981). Coefficient Kappa: Some uses, misuses, and alternatives. Educational and Psychological Measurement, 41(3), 687–699.
Brown, T. A. (2006). Confirmatory factor analysis for applied research. New York: The Guilford Press.
Chodorow, M., & Burstein, J. (2004). Beyond essay length: Evaluating e-raters’ performance on TOEFL testing. ETS Research Report Series, 2004(1), i–38.
Cronbach, L. J. (1951). Coefficient alpha and the internal structure of tests. Psychometrika, 16, 297–334.
Goldhaber, D., & Hansen, M. (2010). Race, gender, and teacher testing: How informative a tool is teacher licensure testing? American Educational Research Journal, 47(1), 218–
251.
Lord, F. M. (1959). Tests of the same length do have the same standard error of measurement. Educational and Psychological Measurement, 19(2), 233-239.
Masters, G. N. (1982). A Rasch model for partial credit scoring. Psychometrika, 47(2), 149–174.
Pecheone, R. L., &, Whittaker, A. (2016). Well prepared teachers inspire student learning. Kappan, 97(7), 8–13.
Powers, D. E. (2000). Computing reader agreement for the GRE Writing Assessment. Princeton, NJ: Educational Testing Service.
Rosseel, Y. (2012). Lavaan: An R package for structural equation modeling. Journal of Statistical Software, 48(2), 1–36.
Stanford Center for Assessment, Learning and Equity (SCALE). (2013). edTPA Field test: Summary report. Palo Alto, CA: Author.
Stanford Center for Assessment, Learning and Equity (SCALE). (2015). Educative assessment and meaningful support: 2014 edTPA Administrative Report. Palo Alto, CA:
Author.
Stanford Center for Assessment, Learning and Equity (SCALE). (2016). Educative assessment and meaningful support: 2015 edTPA Administrative Report. Palo Alto, CA:
Author.
Stanford Center for Assessment, Learning and Equity (SCALE). (2017). Educative assessment and meaningful support: 2016 edTPA Administrative Report. Palo Alto, CA:
Author.
Stemler, S. E., & Tsai, J. (2008). Best practices in interrater reliability: Three common approaches. Best practices in quantitative methods, 29-4.
Tanguay, C. L., Many, J. E., Ariail, M., Bhatnagar, R., & Emerson, J. (2019). An Organic Model for edTPA Exploration and Implementation. In K. Winter, H. Pinter, & M. Watson
(Eds.), Performance-Based Assessment in 21st Century Teacher Education (pp. 42-80). Hershey, PA: IGI Global. doi:10.4018/978-1-5225-8353-0.ch003
Whittaker, A., Pecheone, R., and Stansbury, K. (2018). Fulfilling our educative mission: A response to edTPA critique. Education Policy Analysis Archives, 26(30), 1–16.