Embed Size (px)
Citation preview

Educational Options and Performance of Military-Connected School Districts Research Study – Final Report
Sami Kitmitto
Mette Huberman
Charles Blankenship
Stephanie Hannan
Dwayne Norris
Bruce Christenson
American Institutes for Research
2800 Campus Drive Suite 200
San Mateo, CA 94403
May 24, 2011
“American Institutes for Research” is a registered trademark. All other brand, product, or company names are trademarks or registered trademarks of their respective owners.

Final Report May 24, 2011
i
Research for this report was conducted for the U.S. Department of Defense Education Activity under Contract Number HE1254-10-C-0013 by the American Institutes for Research. Ronald Kunz served as the contracting officer and David Butler served as the contracting officer’s representative.
Contributors from the American Institutes for Research include: Sami Kitmitto (Project Director), Dwayne Norris (Principal Investigator), Mette Huberman, Charles Blankenship, Stephanie Hannan, Bruce Christenson , Clarisse Haxton, AnGelica Alsbrooks, Lisa Cruz, Patrice Fabel, David Miser, and Shameka Thomas.
This report is in the public domain. Authorization to reproduce it in whole or in part is granted. While permission to reprint this publication is not necessary, the suggested citation is:
Kitmitto, S., Huberman, M., Blankenship, C., Hannan, S., Norris, D., & Christenson, B. (2011). Educational Options and Performance of Military-Connected School Districts Research Study – Final Report. American Institutes for Research: San Mateo, CA.
Copies of this report may be found on DoDEA’s Military K-12 Partnership website: http://militaryk12partners.dodea.edu/
This report contains website addresses for information created and maintained by private organizations. This information is provided for the reader’s convenience. The Department of Defense Education Activity is not responsible for controlling or guaranteeing the accuracy, relevance, timeliness, or completeness of this outside information. Further, the inclusion of information or a website address does not reflect the importance of the organization; nor is it intended to endorse any views expressed, or products or services offered.
Special thanks to Ron Astor, Anita Chandra, Shelley MacDermid Wadsworth, and Marleen Wong, who reviewed the analysis plan and the final report, providing excellent advice. Thanks also to Johannes Bos at AIR for providing essential guidance throughout the project.

Final Report May 24, 2011
ii
Executive Summary The Department of Defense Education Activity (DoDEA) has commissioned this study from the American Institutes for Research (AIR) to better understand the educational achievement of children in military-connected local educational agencies (LEAs) and the educational options available to military children in these LEAs. The Department of Defense (DoD) recognizes that the public education available to children of military families is a primary quality-of-life concern, and that concerns about the availability and quality of elementary and secondary education options impact readiness, job satisfaction, and retention of military personnel. A majority of the children in military families attend a public school near the military installation to which one or both of their parents are assigned.
The study aims to improve the DoD’s understanding of how military-connected school districts compare to other districts and of the educational options available to military children. It also aims to inform educational programs in multiple agencies, including DoDEA and the U.S. Department of Education, about the experiences of military-connected children and the resources available to them, while serving as a first step in understanding how military-connected school districts are performing.
AIR collected and analyzed data to investigate many of the same questions that parents might ask when considering the education of their children: What are the characteristics of the school district? How well does the district educate its students? If students in the public school district are not performing well, what other education options are available? AIR also interviewed School Liaison Officers (SLOs) to enhance understanding of the challenges unique to military families (the SLO’s role is to help families navigate these issues).
Research Questions The three specific research questions that AIR investigated are as follows:
Research question 1: What are the key similarities and differences between military-connected LEAs and non-military-connected LEAs, in areas including student achievement, school adequate yearly progress (AYP) status, and demographics, among others?
Research question 2: What are the educational opportunities available for children from military families whose neighborhood schools are identified as “in need of improvement” as defined by the No Child Left Behind Act of 2001?
Research question 3: What are the challenges faced by parents of military families in securing quality schooling options for their children when the child's public school is identified as in need of improvement?
Each research question required separate, though sometimes overlapping and complementary, research methodologies and analyses. Each research question and the methodological details

Final Report May 24, 2011
iii
surrounding its analysis are discussed separately in this report. Research question 1 was investigated using existing data to provide comparisons between military-connected and all other districts in states with military-connected districts.1 The average achievement in military-connected districts was not only compared with the average achievement in non-military-connected districts but also with the average achievement in non-military-connected districts with similar student characteristics and urbanicity.2 For research question 2, existing data were first employed by AIR researchers to allow them to gauge the availability of some of the potential educational options. Second, for options where existing data were not available, AIR went directly to state and district websites to collect information. For research question 3, eight SLOs were interviewed to provide their perspective on the issues military families face in providing their children with a quality education.
Summary of Findings AIR first compared districts on size and location and found that on average, military-connected districts were larger and more urban than non-military-connected districts. Second, comparisons of demographic characteristics, educational inputs, and finances were made in two ways: first, military-connected districts were compared to other districts overall without regard for size or location; second, military-connected districts were compared to other districts of similar size and location (urbanicity). Across the two types of comparisons, the following observations can be made about military-connected districts:
1. Military-connected districts had similar or fewer students in subpopulations associated with higher needs—English language learners, students with disabilities, students in poverty (free- or reduced-price lunch eligible);
2. Military-connected districts appeared more diverse overall (fewer white students and more black students), but when compared with other districts with similar size and location this was not the case (military-connected districts had more white students, similar percentages of black students, and fewer Hispanic students when adjusted for location and size);
3. Military-connected districts and other districts had similar counts of students per staff; and
4. Military-connected districts had lower cost-adjusted expenditures per pupil, but the difference was negligible when compared to similar sized and located districts.
Next, AIR compared the educational performance of military-connected and other districts in the same state. AIR found that when all military-connected districts were compared to all other
1 Military-connected districts were identified using Impact Aid data and student classifications. This report considered students that had a parent on active duty in the uniformed services (as defined by section 101 of title 37, United States Code) as military-connected. A military-connected districts was defined as one that had an average daily attendance (ADA) of military-connected students greater than 400, or had an ADA of whom 10 percent or more were military-connected students. 2 Urbanicity is defined as the degree to which a district is considered urban.

Final Report May 24, 2011
iv
districts in the same state they had significantly higher performance. However, when military-connected districts were compared to districts in the same state that were similar in size, location (urbanicity), and student demographics, military-connected districts did not have significantly higher performance. These results indicate that while military-connected districts might have higher performance than all other districts in the same state, this difference is largely explained by factors typically associated with higher performance (size, location, and student body) rather than something uniquely different about military-connected districts. Districts with fewer poor students (free/reduced-price lunch eligible) and fewer English language learners generally perform better than other districts and this appears to be the case with military-connected districts.
Regarding educational opportunities, using existing data, AIR found that at a minimum, approximately one out of five students in military-connected districts was in a school that the family chose rather than being assigned by geographic default:
9.3 percent of all students were in private schools; and
Of the students enrolled in public schools, 8 percent of those in military-connected districts were in magnet schools (compared to 4.9 percent in other districts) and 2.3 percent were in charter schools.
These figures on private, magnet, and charter school enrollment do not take into account students who were able to choose a regular public school through inter- or intra-district transfer programs. Also, it is possible that within the military-connected districts that were studied, these rates were higher for military families than non-military families.
Additionally, AIR found:
Military-connected districts had similar percentages of students in private schools, charter schools, and special education schools as other districts;
Military-connected districts had more students in magnet schools than other districts; When examining military-connected districts with at least one school identified as being
in need of improvement, there were no significant differences in the findings.
From examination of military-connected districts’ websites, AIR found that:
Almost all of these districts provided information on programs for advanced coursework or options for gifted students (94.6 percent) and students in special education (98.6 percent);
Over three-fourths of military-connected districts (76.0 percent) provided information on open enrollment or transfer within a district, and almost half (47.7 percent) provided information on inter-district transfer;

Final Report May 24, 2011
v
While many students were in states that had some sort of policy for vouchers or tuition tax credits (23.0 percent), the proportion of students enrolled in such programs in districts that had information about them was small (2.6 percent);
Most students in military-connected districts were in states that had a state virtual schools initiative or an online initiative (80.0 percent) and most students (62.4 percent) were in districts that themselves offered online options; and
When examining military-connected districts with at least one school identified as in need of improvement, there was rarely a significant difference in the findings (however, they were more likely to be in a state that had a full-time online school).
From interviews with eight SLOs, AIR found that:
Three of the eight SLOs explicitly mentioned that the perceived quality of schools in their area affects families’ decision to relocate to their installations;
Six of eight SLOs reported overcrowding or lack of capacity of schools in their area;
Half of the eight SLOs expressed concern about the quality of special education in their area or state, and almost all of the SLOs indicated that families with special education children presented the most challenges for them because of the amount of time they require; and
Useful tools exist to aid military-families with transition and other issues: o The Interstate Compact on the Educational Opportunity for Military Children (the
Compact) was unanimously recognized as a useful tool, but in some places the Compact had not been fully implemented even though it had been adopted by the state;
o According to half of the SLOs, the Military Child Education Coalition program Student 2 Student helped with issues around the social and emotional impact of transition; and
o A few SLOs reported that the Exceptional Family Member Program (particularly the Marine Corps’ implementation of the program) provided good support for families with special education children.
Further Research The findings of this study indicate some future areas of research for further understanding the educational opportunities and performance in military-connected districts as well as the challenges that military families face. First, while analysis of military-connected and other districts points to some key comparisons using a variety of controls, it would also be important to further understand variation among military-connected districts. While results in this report were broken down by concentration of military-connected students, other factors that might explain differences among military-connected districts are the size of the military installation, the branch of military, and the demographics of the military-connected students (rather than just the demographics of all students).

Final Report May 24, 2011
vi
Second, interviews with or surveys of military families would be an important next step in truly understanding their needs and concerns. The interviews of eight SLOs were informative but not representative, and did not solicit input directly from parents as stakeholders. Further research could seek to interview or survey a sample of military families that would be representative of various types of installations and branches of the service to obtain a picture of how they view the challenges they face and choices they make in educating their children.
Third, a follow-up investigation of the quality and availability of schools and programs for students in special education and gifted and talented students would be an important complement to the results presented in this report. Investigation of existing databases and of state and district websites provided evidence of the existence of such schools and programs, but did not capture their quality nor indicate whether those programs were overenrolled (and therefore not truly an option for parents). Further research could select a sample of such districts to investigate issues of program quality and whether over-enrollment presents a barrier. Since this sort of information is not easily available, this investigation would likely require interviews of district officials, school officials, and program administrators.

Final Report May 24, 2011
vii
Contents
Executive Summary ........................................................................................................................ ii
Introduction ..................................................................................................................................... 1
Research Questions ................................................................................................................... 1
Overview ................................................................................................................................... 2
Central Challenge for Children of Military Families in Public Schools .............................. 2
Institutional Response to Needs of Students from Military Families .................................. 3
Research on Schooling of Students from Military Families in Public Schools ................... 6
Expanding the Knowledge Base on Schooling of Children in Military Families ................ 8
Research Question 1 ....................................................................................................................... 8
Overview ................................................................................................................................... 8
Data ........................................................................................................................................... 9
Methodology ........................................................................................................................... 10
Definition of Military-Connected Districts and the Comparison Group ............................ 10
Comparisons: Unadjusted and Adjusted ............................................................................ 12
Results ..................................................................................................................................... 13
District Size and Location .................................................................................................. 13
District Comparisons .......................................................................................................... 14
District Comparisons by Concentration of Military-Connected Students .......................... 18
Educational Performance ................................................................................................... 20
Educational Performance, Controlling for District and Student Characteristics ................ 22
Research Question 2 ..................................................................................................................... 27
Overview ................................................................................................................................. 27
Methodology ........................................................................................................................... 28
NCES Databases ................................................................................................................. 28
Data Collected from State and District Websites ............................................................... 30
Other Sources of Information on School Choice Options .................................................. 33
Results by Type of School Choice Option .............................................................................. 33
Private Schools ................................................................................................................... 33
Charter, Magnet, and Special Education Schools .............................................................. 34
Gifted and Talented Programs and Programs for Students with Disabilities ..................... 35
Open Enrollment ................................................................................................................ 37
Vouchers and Tax Credits .................................................................................................. 38

Final Report May 24, 2011
viii
Virtual Schools ................................................................................................................... 40
Other Findings from State and District-Level Data Collection .......................................... 42
Research Question 3 ..................................................................................................................... 43
Overview ................................................................................................................................. 43
Methodology ........................................................................................................................... 44
Selection of SLOs ............................................................................................................... 44
Interview Protocol .............................................................................................................. 45
Data Profiles ....................................................................................................................... 45
Data Analysis ..................................................................................................................... 46
Findings................................................................................................................................... 46
Backgrounds of SLOs ........................................................................................................ 46
School Quality and Choice ................................................................................................. 47
The Use of the Compact ..................................................................................................... 49
Social and Emotional Issues ............................................................................................... 49
Students in Special Education ............................................................................................ 50
Students with Other Special Needs .................................................................................... 50
Military Leadership Involvement ....................................................................................... 51
SLO Strategies .................................................................................................................... 52
SLO Obstacles .................................................................................................................... 52
SLO Suggestions for Improvements ....................................................................................... 53
Advice to Other SLOs ............................................................................................................. 54
Limitations of Findings ........................................................................................................... 54
Further Research ........................................................................................................................... 54
Bibliography ................................................................................................................................. 56
Appendix A ................................................................................................................................... 60
A.1. Unweighted Results ........................................................................................................ 60
A.2. School Choice Data Collection Instrument Elements ..................................................... 63
A.3. Choice Options: Definitions for Data Collection ............................................................ 66
A.4. Instructions for Data Collection ...................................................................................... 70
Appendix B ................................................................................................................................... 74
Appendix B.1. Interview Protocol .......................................................................................... 74
Appendix B.2. Interview Topics ............................................................................................. 79
Appendix B.3. Sample District and School Data Profile ........................................................ 81

Final Report May 24, 2011
1
Introduction The Department of Defense Education Activity (DoDEA) has commissioned this study from the American Institutes for Research (AIR) to better understand the educational achievement of children in military-connected local educational agencies (LEAs) and the educational options available to military children in these LEAs. The Department of Defense (DoD) recognizes that the public education available to children of military families is a primary quality-of-life concern, and that concerns about the availability and quality of elementary and secondary education options impact readiness, job satisfaction, and retention of military personnel. A majority of the children in military families attend a public school near the military installation to which one or both of their parents are assigned.
The study aims to improve the DoD’s understanding of how military-connected school districts compare to other districts and of the educational options available to military children. It also aims to inform educational programs in multiple agencies, including DoDEA and the U.S. Department of Education, about the experiences of military-connected children and the resources available to them, while serving as a first step in understanding how military-connected school districts are performing.
AIR collected and analyzed data to investigate many of the same questions that parents might ask when considering the education of their children: What is the school district like? How well does the district educate its students? If students in the public school district are not performing well, what other education options are available? AIR also interviewed School Liaison Officers (SLOs) to better understand the challenges unique to military families (the SLO’s role is to help families navigate these issues).
Research Questions The three specific research questions that AIR investigated are as follows:
Research question 1: What are the key similarities and differences between military-connected LEAs and non-military-connected LEAs, in areas including student achievement, school adequate yearly progress (AYP) status, and demographics, among others?
Research question 2: What are the educational opportunities available for children from military families whose neighborhood schools are identified as “in need of improvement” as defined by the No Child Left Behind Act of 2001?
Research question 3: What are the challenges faced by parents of military families in securing quality schooling options for their children when the child's public school is identified as being in need of improvement?

Final Report May 24, 2011
2
Each research question required separate, though sometimes overlapping and complementary, research methodologies and analyses. Each research question and the methodological details surrounding its analysis are discussed separately in this report. Research question 1 was investigated using existing data to provide comparisons between military-connected and all other districts in states with military-connected districts. The average achievement in military-connected districts was not only compared to the average achievement in non-military-connected districts but also to the average in non-military-connected districts with similar student characteristics and urbanicity. For research question 2, existing data were first employed by AIR researchers to allow us to gauge the availability of some of the potential educational options. Second, for options for which existing data were not available, AIR went directly to state and district websites to collect information. For research question 3, eight SLOs were interviewed to provide their perspective on the issues military families face in providing their children with a quality education.
Overview
Central Challenge for Children of Military Families in Public Schools The children of military personnel living in the United States are typically enrolled in either special DoD schools known as Domestic Dependents Elementary and Secondary Schools (DDESS) or in public schools that are generally near the installations to which one or both parents are assigned. A majority of children of military personnel are enrolled in local public school systems. In 1998–99, an estimated 416,000 children of military families were enrolled in local public schools, compared to approximately 34,000 in DDESS schools (Buddin, Gill, & Zimmer, 2001).3,4 Given changes in the Armed Forces over the past decade, a focus of the DoD is on assisting communities and LEAs to prepare for projected increases in the relocation of “military dependent students” as a result of Base Realignment and Closure (BRAC), Global Defense Posture Realignment (GDPR), and Grow the Force.5,6 Military families are typically reassigned every three years and have little choice in their assignments (Buddin et al., 2001). The average child in a military family moves six to nine times during his or her school career, which is three times more often than the average non-military child during a school career (DoDEA, n.d.-b). Family mobility creates a variety of challenges for military families seeking a quality education for their children. The Secondary Education 3 Buddin et al. (2001) note that of U.S. children overall about 11 percent attended private and 1.5 percent attended home schools. They surmise that those percentages were roughly similar to those for children from military families. 4 By 2008, the number enrolled in DDESS schools had declined to 25,600. While the number in public schools in 2008 is not known at this time, the DoD counts of school-age children 6 to18 of active duty members of the Armed Forces numbered decreased from 718,367 in 1999 (Department of Defense, 2008) to 652,623 in 2008 (Department of Defense, 2008). 5 DoD and ED Memorandum of Understanding (MOU) signed June 25, 2008 (Department of Defense and Department of Education, 2008). 6 The DoD’s use of the term “military dependent students” includes both military and civilian employees of the DoD (Department of Defense, n.d.).

Final Report May 24, 2011
3
Transition Study (SETS), which the U.S. Army requested that the Military Child Education Coalition (MCEC) conduct in 1999, identified transfer records, course sequencing, graduation requirements, and inclusion in extracurricular activities as some of the transitional issues facing students from military families. In addition to meeting academic challenges, students from military families may also struggle with social and emotional issues in adjusting to frequent relocation. The challenges to and stresses on students and their family can be exacerbated in the case of special needs students (Shinseki, 2001). The deployment of a parent creates additional stress on students in military families, and challenges continue after the parent returns from deployment (Chandra, Martin, Hawkins, & Richardson, 2010).
While there are many unique challenges that military families and their children face, it is also important to note that on average they have characteristics that are associated with lower need. Previous research has indicated that military-connected students are less often eligible for free- or reduced-price lunch, less often have a disability, more often have parents that have graduated from high school, and more often are in a two-parent household (Buddin et al., 2001).
Institutional Response to Needs of Students from Military Families A variety of institutional resources to assist military families with school-age children and the public school systems that serve them have evolved over time. The evolution of programs and resources reflects recognition of the multifaceted challenges faced by military families and school systems, and an awareness of the need for a more coordinated response to the needs of military families (including, among other things, school choice options). Key institutional responses include governmental aid programs to affected LEAs, closer cooperation among various government and educational entities to facilitate the relocation process for students in military families, and emergence of voluntary associations to inform military personnel with school-age children and advocate on their behalf. Some of the key institutional developments include the following:
U.S. Department of Education Federal Impact Aid Programs: Influenced by the growth of military forces during the Korean War that led to rapid increases in the school-age population near some military bases, the Federal government instituted a program in 1950 to provide relief for local school districts that were impacted by military and other activities of the Federal government (Buddin et al., 2001:5). The Impact Aid program is authorized in Title VIII of the Elementary and Secondary Education Act of 1965 (ESEA) and administered by the Department of Education (ED). Most of the aid provided to school districts is based not only on the number of children of active duty military personnel,7 but also children of civilian Federal employees, children living on Indian reservations, and children living in Federally owned low-rent housing, which together constitute Federally connected children. The largest of four Impact Aid programs provides Basic Support Payments (BSP) to help districts that meet certain minimum criteria
7 Including a small number of children of foreign military officers

Final Report May 24, 2011
4
cover part of the cost connected with educating Federally connected children.8 The maximum amount of aid for which a district is eligible is determined by an estimate of the local contribution of funds per pupil multiplied by a weighted number of Federally connected students.9 Weight adjustments are assigned to 10 different categories of Federally connected students, some of which distinguish between children of military parents living on or off base and between children of Federal civilian employees living on or off Federal property. As the Impact Aid program is generally not fully funded, these maximum amounts are adjusted downward by a formula intended to provide larger proportions of BSP funding to districts that are more heavily affected by enrollment of Federally connected students. Smaller Impact Aid programs administered by ED include payments for Federally connected children with disabilities, construction grants, and payments to assist local districts that have lost a portion of their local tax base because of Federal ownership of property.
DoD Impact Aid Programs: In 1991, Congress authorized DoD to operate a supplemental Impact Aid program that targeted assistance to LEAs that would benefit children of military personnel and DoD civilian employees. The DoD has operated three aid programs pursuant to various authorizations of the National Defense Authorization Act (NDAA). The largest is the DoD Supplement to Impact Aid program, which targets LEAs that are heavily impacted by the presence of Federally connected students (which includes children of members of the armed forces and children of civilian employees of the DoD).10 The DoD also manages Impact Aid funds that reimburse districts for money spent on military-connected students with severe disabilities11 and provide financial assistance to LEAs that are heavily impacted by increases or reductions in the numbers of military-connected students.12
Memorandum of Understanding (MOU) Between DoD and ED: Following an NDAA authorization for fiscal year (FY) 2007, the DoD and ED signed an MOU in 2008 to provide a more comprehensive and cohesive structure for their collaboration on addressing the quality of education and unique challenges faced by children of military families (Department of Defense and Department of Education Working Group, n.d.).
8 A district is eligible for BSP funding if the number of Federally connected students is at least 400, or at least 3 percent of the district’s total average daily attendance (ADA). 9 The weight-adjusted number of Federally connected students in a district is referred to as “weighted Federal student units,” or WFSUs. 10 Heavily impacted LEAs are those with 20 percent or more daily attendance of military dependent children in the previous school year as counted on the district’s Federal Impact Aid application. 11 Whereas military-connected students include dependent children of both military and civilian personnel, a military dependent child refers to a dependent child with a parent on active military duty—including a parent who is an accredited military foreign officer of a foreign government (Department of Defense, n.d.). 12 The “large scale rebasing” or “BRAC” program funds are available to districts that have (or would have had) at least 20 percent military dependent student in average daily attendance as counted on their Federal Impact Aid application for the previous year, and have had an increase or decrease of no less than 5 percent or 250 military dependent students.

Final Report May 24, 2011
5
Department of Defense Education Activity (DoDEA): The DoDEA represents over 60 years of DoD experience serving military families and their children through DoD school programs overseas and stateside. The mission of the DoDEA expanded earlier this decade when the DoD received legislative authority through the NDAA to promote partnerships between the DoDEA and LEAs. The DoDEA launched a plan to develop partnerships with schools and school districts that focus on educational best practices, seamless student transitions between schools, and deployment support services; facilitate state and local agreements that positively impact the education and well-being of children from military families; and extend opportunities for student learning via online and other research-based models (Department of Defense, 2008).
School Liaison Officer (SLO) Program: Each of the four services has SLOs at its installations to assist military parents and their school-age children with educational opportunities and information needed to succeed in school. SLOs serve both on-base and off-base students. The SLO works in partnership with the local schools and school districts to meet the needs of the children of military families. The SLO is the primary advisor to installation commanders on matters related to schools serving the installation and related to the schooling of children of military personnel assigned to that installation (Department of Defense, 2009).
Interstate Compact: The Council of State Governments (CSG) and DoD drafted an Interstate Compact to address the transitional issues faced by military families in dealing with school enrollment, eligibility, and graduation or placement requirements (Jackson, 2010). The Compact became effective in 2008 following its legislative adoption by 10 states, and it had been adopted in 32 states by June 2010 (Department of Defense, 2010).
Non-profit Organizations: Voluntary and other non-profit organizations and programs have emerged over the years to support military families with school-age children and the school systems that serve them. The following are examples of such organizations:
The Military Child Education Coalition (MCEC), established in 1998 following a national conference on the needs of military children, is focused on ensuring quality educational opportunities for all military-connected children affected by mobility, family separation, and transition (Military Child Education Coalition, n.d.). The organization conducts qualitative research, creates and publishes guidebooks on various education topics for military families with school-age children, and develops training materials and institutes for key stakeholders, such as educators, military program staff, parents, and students. Through its conferences and website, MCEC also promotes communication and networking among impacted schools and military installations around educational issues related to children from military families.
The Military Impacted School Association (MISA) is a national organization of school superintendents that was formed in 1986. The organization advocates for funding and legislation supportive of military families and of schools and school districts impacted by military students. It promotes new learning opportunities for students and conducts workshops on transition and deployment issues.

Final Report May 24, 2011
6
The Military Child Initiative (MCI) is a DoD-sponsored center at Johns Hopkins University that is applying research-based findings from the Longitudinal Study on Adolescent Health to improve outcomes for highly mobile students, such as the children of military parents, by fostering parental involvement and the student’s sense of connectedness (i.e., the student’s belief that adults in the school care about his or her learning and about him or her as an individual) (Department of Defense, 2006). The center collects and disseminates information on research and best practices concerning connectedness and parental involvement.
Research on Schooling of Students from Military Families in Public Schools The relevant research on children in military families includes both qualitative and quantitative studies. The Secondary Education Transition Study, from 2001, was a qualitative, action-oriented study of nine school districts that helped identify specific challenges and essential supports for transitioning students and offered practical recommendations for steps that schools or military officials could take to improve the transition for students or to be of help to parents and teachers. The problems identified and the associated recommendations were compiled into a set of guiding principles that formed the basis of a memorandum of agreement among officials from the nine school districts in the study. The purpose of the memorandum was to facilitate the institutionalization of reciprocal agreements designed to ease the transition experience for students from military families.
In a more recent study, MCEC examined the experience of transitioning military families with children who have special needs. The study concluded that families who have children with special needs require consistency and coordination of educational services from one location to another to insure a smooth transfer. The key to the success of the transition is effective communication between military families and the programs (Barrett, 2008).
In a 2001 study commissioned by the Office of the Secretary of Defense (OSD), Buddin and his colleagues at RAND’s National Defense Research Institute conducted the most extensive quantitative analysis to date of LEAs serving children of military families. Their study focused on the workings of the Impact Aid program, with special emphasis on its implications for children of military families. The report documented the prevalence of military children in LEAs, examined the relationship of prevalence of military children to the resources and quality of schooling in LEAs, and attempted to assess the extent to which there is evidence of extra costs to LEAs of educating children from military families compared to children from civilian families.
The RAND study reports that about 80 percent of children of military families were concentrated in 116 LEAs with more than 1,000 military students, while the other children of military families attended schools in over 600 LEAs (Buddin et al., 2001). The average student from a military family was in a district where children of military families represented approximately 22 percent of students. The LEAs in which children from military families represented over half of student enrollment were generally in isolated and remote locations. As a result of the low civilian

Final Report May 24, 2011
7
housing stock in such locations, the vast majority of children from military families in those locations lived on base. Nationally, however, two-thirds of children from military families lived off base.
In assessing resource use in LEAs serving children from military families compared with other LEAs, Buddin and his colleagues also examined expenditures per pupil and pupil-teacher ratios. Specifically, they isolated the effects military-connected students have on resource use with a model that controls for a variety of funding sources, demographic factors, and costs that affect LEA expenditures. Because the Impact Aid program funding formulas provide much greater assistance to LEAs for on-base as compared to off-base children from military families, the authors considered the effects for each type of student, finding that expenditures per pupil and pupil-teacher ratios did not vary significantly with the district’s share of on-base military children. However, the expenditures per pupil fell and the pupil teacher ratio increased as the district’s share of off-base children of military families expanded.
Based on the Impact Aid reimbursement rates at the time of the study, the authors concluded that Impact Aid reimbursements for children from on-base military families are sufficient to ease the burden on the LEA, but that the resources of the LEA are strained when off-base children of military families represent a sizeable share of district enrollment. However, the authors also concluded that the implications of the latter for school quality may be modest or inconsequential, as the relative magnitude of the effect of off-base children of military families on district resources is small (Buddin et al., 2001:81–82).
A subsequent ED-sponsored evaluation (Kitmitto et al., 2007) examined the amount of financial burden on districts serving various types of Federally connected students. The AIR researchers confirmed Buddin et al.’s conclusion that the Impact Aid program adequately compensates districts serving children from on-base military families. In fact, they found that Federally connected districts actually spent more per pupil for each percentage point increase in attendance of military children from on-base families compared with demographically similar districts that were not Federally connected, suggesting that districts may be overcompensated for children from on-base military families. Kitmitto et al. also found that districts serving children from off-base military families were undercompensated for the costs associated with serving those children, and therefore bore an additional financial burden from the presence of those students.
As a further assessment of the quality of schooling in LEA districts serving children of military families, Buddin et al. compared the aggregate district-level student test results in 1998–99 for military-connected LEAs (defined as districts with 3 percent or more enrollment of children from military families) to non-military-connected LEAs in the same state. The study used data from six states that at the time represented over half of all military enrollments. The authors recognized that aggregate data do not allow for control of family background factors that may distort test score patterns. However, they found that military-connected LEAs generally have test

Final Report May 24, 2011
8
scores at or above the state mean, and at or above demographically similar districts in their states.
The RAND study also attempted to examine whether the cost to LEAs of educating a child from a military family is more or less than that for children from non-military families. The relevant cost considerations included student mobility, participation in free and reduced-price lunch programs, share of students in special education, and adjustments that districts need to make for year-to-year enrollment variability of students from military families. Military-connected students had some characteristics associated with higher costs (higher mobility) and others associated with lower cost (fewer free/reduced-price lunch eligible, fewer in special education). Due to these conflicting results the authors were not able to conclusively determine whether there was a difference in cost between serving a military-connected child and serving a child that was not military connected.
Expanding the Knowledge Base on Schooling of Children in Military Families The preceding overview highlights the evolution of 1) institutional programs responding to the needs of children of military families, and 2) the school systems serving military children and the research informing and documenting those responses. However, the educational landscape has changed substantially over the last decade with the adoption of state testing standards and implementation of other NCLB reforms, and the mobility of military families has increased in response to the changing defense needs of the country. The research presented in this report is an attempt to provide a fuller and more up-to-date understanding of educational outcomes and opportunities for children of military families that will provide policymakers with updated information and will provide policy guidance to military officials, educators, parents, legislators, and other interested stakeholders.
Research Question 1 What are the key similarities and differences between military-connected LEAs and non-military-connected LEAs, in areas including student achievement, school adequate yearly progress (AYP) status, and demographics, among others?
Overview To address research question 1, existing data on the population of U.S. public school districts were assembled and analyzed. Comparisons were made between military-connected districts and all other districts in states that contained at least one military-connected district. The report presents these analyses both unadjusted and adjusted for urbanicity and geographic location. In comparisons of academic performance, in addition to controlling for urbanicity and location, the analyses control for a variety of student demographics using regression analysis.

Final Report May 24, 2011
9
Data Data used in the analysis for this research question all come from existing data sources, which are often published with a lag; the 2008–09 school year was chosen for analysis because most data were available for this year but not yet for more recent years.
Impact Aid program office data. Military-connected districts were identified using administrative data from the Impact Aid program office for the 2008–09 school year. The Impact Aid program data contain information necessary to calculate Impact Aid Basic Support Payments, including the average daily attendance (ADA) of various categories of Federally connected students. Two of the categories are considered for the purposes of this study to comprise military-connected students:
1. Students who resided on Federal property and had a parent on active duty in the uniformed services (as defined by section 101 of title 37, United States Code); and
2. Students who did not reside on Federal property and had a parent on active duty in the uniformed services (as defined by section 101 of title 37, United States Code).
The Impact Aid program data also contained the ADA for the whole district. The percentage of students who were military connected was calculated by the sum of the ADA of the two categories of military-connected students, divided by the ADA of the whole district.
Common Core of Data (CCD). For district and school characteristics, AIR relied on the National Center for Education Statistics (NCES) CCD for the 2008–09 school year. These files contain information on district characteristics such as urbanicity and the number of staff members per pupil, as well as student demographic characteristics such as race/ethnicity breakdowns and the percentages of students who were eligible for free/reduced-price lunch, who had disabilities, and who were English language learners.
U.S. Census Bureau’s Public School Finance Data. Information on district expenditures per pupil came from the U.S. Census Bureau’s Public School Finance Data, in which the most recent year corresponded to the 2007–08 school year.13
EdFacts. Educational outcome data for districts and schools for 2008–09 were received from EdFacts at the U.S. Department of Education (ED). The EdFacts initiative serves as a central repository for school and district performance data. Data received from EdFacts included the percentage of students in each district that were considered proficient on state assessments as well as indicators for which districts and schools were identified as in need of improvement.
13 These data are often republished by NCES as part of the CCD. However, at the time of the study, the NCES version of the file was not available.

Final Report May 24, 2011
10
Methodology
Definition of MilitaryConnected Districts and the Comparison Group For research questions 1 and 2 of this study, a military-connected district is defined as follows:
A military-connected district (or LEA) is a district that applied for Federal 8003 Impact Aid dollars and either had an average daily attendance (ADA) of military-connected students greater than 400, or had an ADA of whom 10 percent or more were military-connected students.
This definition was applied to the 2008–09 school year Impact Aid program data, and 214 military-connected districts were identified for this study.
Figure 1 displays the distribution of these 214 military-connected districts by percentage of all students in the district that are military connected and by the total number of students in the district that are military connected. The concentration of districts in the upper left hand side of the figure illustrates that districts with high concentrations of military-connected students tend to be smaller districts. Districts with the largest numbers of military-connected students tend to also be very large districts, such that the large number comprises no more than half the student body. These districts with large numbers of military-connected students are concentrated in the bottom right hand corner of the figure.

Final Report May 24, 2011
11
Figure 1: Plot of percentage of students in a district that are military connected, by the number of military-connected students in districts identified as military connected
Administrative Impact Aid data are currently the only available comprehensive source of information on where military-connected students are being educated. It is possible that there are some districts that educate enough military-connected students to meet the definition of a military-connected district but do not apply for Impact Aid. Such districts would not be included in this study. Additionally, it should be noted that when locating near a military installation, military families may be able to choose which district they live in, and there are a number of factors, such as affordability, proximity to the base, employment opportunities for spouses, and quality of schools that may influence this decision.
The comparison group for this study consisted of districts not identified as military connected in the 40 states that contained at least one military-connected district.14 The comparison group was further limited to districts that were operational in 2008–09 and were directly responsible for schools and students as opposed to purely administrative entities. The comparison group contained 10,823 districts.
14 The ten states without a military-connected district were: Delaware, Indiana, Iowa, Michigan, Minnesota, New Hampshire, Oregon, Vermont, West Virginia, and Wisconsin.
Final Report May 24, 2011
12
Comparisons: Unadjusted and Adjusted The first part of the analysis was a comparison of average characteristics between military-connected and other districts both unadjusted and adjusted for urbanicity, state, and district size. The results provide two ways to look at military-connected districts. On one hand, it is useful to know if military-connected districts are different, on average, than other districts. The unadjusted means provide such a comparison. On the other hand, some of the differences observed between military-connected and non-military-connected districts may be because military-connected districts tend to be situated in certain states or locales, or are of a certain size. Therefore, it is also useful to know how military-connected districts compare to similarly situated and sized districts. For this report, AIR calculated regression-adjusted means that provided a comparison of military-connected districts to other districts in the same state, of the same urbanicity, and of a similar size.
For consistency and comparison of results, the differences between military-connected and other districts, both unadjusted and adjusted, were calculated using a regression model that included an intercept, a military-connected indicator, and, for adjusted means only, covariates. Estimated equations followed the following specifications:
Unadjusted means
Adjusted means
Where
Variable is the district-level variable of interest;
MC is an indicator variable that equals 1 if the district was military-connected and 0 otherwise;
LogEnrollment is the natural log of the district’s total enrollment;
Urbanicityu is a set of urbanicity indicator variables that equal 1 if the district is of urbanicity type u and 0 otherwise;
States is a set of state indicator variables that equal 1 if the district is in state s and 0 otherwise.
The difference in unadjusted means was obtained by estimation of from the unadjusted model. Adjusted means were calculated for each variable using the adjusted model and evaluating all

Final Report May 24, 2011
13
control variables at their mean values. The difference in adjusted means was obtained by
estimation of .
Though AIR had information on all districts and hence a data set representing the entire population of students in the 2008–09 school year, the data are treated as a sample for the purposes of statistical inference. The intent of this study is to generalize the results to inform policy. Therefore, differences between military-connected and other districts were tested for statistical significance using the heteroscedasticity-consistent standard errors estimated in the regression equations. The p-value, which ranges from 0 to 1, represents the likelihood that a result could be found purely by chance. A difference whose p-value is less than .05 is considered to have a low likelihood of having been obtained purely by chance and is therefore designated as statistically significant.
All of the results were calculated using district enrollment as a weight. When enrollment is used to weight results, districts with more students are counted more than districts with fewer students. Results, therefore, will reflect the characteristics of the average student in military-connected and other districts. While the data are at the district level, AIR’s interest is in the students, and hence it was necessary to weight the data to make sure that very small districts would not skew the results disproportionally.
It should be noted that though AIR used district enrollment as a weight, the authors did not compare military-connected students to other students but did compare students in military-connected districts, some of whom are students from military families and some of whom are not, to students in other districts. A comparison of military-connected students to other students would have required individual-level student data, which would have been too time-consuming and costly to collect for the purposes of this study.
Results
District Size and Location As a precursor to comparing adjusted and unadjusted means for district characteristics of interest, comparisons of the key control factors, size and urbanicity, are provided. Table 1 shows that military-connected districts were, on average, much larger than other districts.15 Differences in urbanicity, which was compared using NCES-provided district descriptors, show that military-connected districts were more often classified as located in urban and suburban areas and less often in towns and rural areas than non-military-connected districts.16 The differences between the percentages of each type were statistically significant.
15 Mean enrollment was not calculated with weights. Means by urbanicity type were calculated using enrollment as weight as described above. 16 NCES classifies districts with a set of 12 urban-centric locale codes that describe a school’s location ranging from “large city” to “rural.” Three of these locale codes designate “city” locations (“city, large,” “city, medium,” and

Final Report May 24, 2011
14
Table 1: District enrollment and percent enrollment in districts by urbanicity classification
Military-connected
districts Non-military-
connected districts
Difference P-value Mean Mean
District Size
Enrollment 21,383 3,512 17,872* <0.001
(36,635) (12,199)
District Urbanicity
City 37.2 29.9 7.4* 0.029
(48.3) (45.8)
Suburb 50.6 37.4 13.2* <0.001
(50.0) (48.4)
Town 4.0 11.8 -7.9* <0.001
(19.5) (32.3)
Rural 8.2 20.9 -12.7* <0.001 (27.5) (40.6)
N 214 10,663 * Significant difference (p<.05). Statistical testing was performed using a t-test and Satterthwaite approximation of the degrees of freedom when calculating the p-values with the assumption of unequal variances. Standard deviations are in parentheses below means.
Source: NCES Common Core of Data Local Education Agency Universe Survey File: School Year 2008–09; NCES Common Core of Data Public Elementary/ Secondary School Universe Survey File: School Year 2008–09.
District Comparisons The comparison of military-connected and other districts was made in three different dimensions: student demographics, educational inputs, and finances. For student demographics, the percentages of special needs populations, free/reduced-price lunch eligible, English language learners, and students with disabilities were compared. Race/ethnicity breakdowns were also compared. The resources that districts have to provide a quality education can be measured in physical terms, such as the number of teachers and staff per pupil, or in monetary terms (expenditures per pupil). What money buys (e.g., quality staff, books, facilities), not the money itself, is ultimately what is important. However, data available for this study on physical educational inputs were limited to counts of staff members in each district. The number of students per teacher is a traditional metric of comparison. Because there were differences across states in which staff members were classified as teachers versus other types of support staff, the average number of students per certified staff member was also calculated to provide a more reliable comparison across states. All teachers and support staff fall within the realm of certified staff, which includes teachers, administrators, support staff, guidance counselors/directors, and librarians.
“city, small”) and apply to “territory inside an urbanized area and inside a principal city.” The “rural” locale codes apply to “census-defined rural territory” (NCES, http://nces.ed.gov/ccd/rural_locales.asp, retrieved November 9, 2010).

Final Report May 24, 2011
15
In addition to comparisons in terms of pupil per staff, differences in expenditures per pupil were also calculated to provide a more comprehensive measure of resources used to educate students. One drawback to comparing expenditures across districts is that a dollar in one district might not buy what a dollar does in another district due to differences in the costs of the same resources (e.g., teacher salaries). To account for differences in costs, expenditures per pupil were adjusted using an index of labor costs across districts. The Comparable Wage Index (CWI) uses the average of non-teacher, college graduate salaries in a local area as an index. This cost adjustment of expenditures per pupil should not be confused with the location and size-adjusted means that are calculated. The cost adjustment was executed by dividing the expenditures per pupil variable by the CWI index to create a new variable, cost-adjusted expenditures per pupil, whose variation across military-connectedness was then further adjusted for location and size, as discussed above. Looking at the unadjusted numbers in table 2, the results show that compared to other districts, military-connected districts:
Had fewer students with disabilities (12.0 percent versus 12.8 percent);
Had more black students (22.5 percent versus 16.5 percent) and fewer white students (44.3 percent versus 52.4 percent); and
Had lower expenditures per pupil in cost-adjusted terms ($9,889 versus $10,380).
Also, while military-connected districts had lower cost-adjusted expenditures per pupil on average, the measures of physical educational inputs (students per teacher and students per certified staff) were nearly identical for military-connected and other districts.

Final Report May 24, 2011
16
Table 2: Unadjusted means and differences in district demographics, inputs, and finances
Military-connected districts
Non-military-connected districts
Difference P-value Mean type Mean Mean
District Student Demographics Percent English language learners
Unadjusted 9.2 10.2 -0.9 0.513 (8.9) (11.6)
Adjusted 6.8 10.4 -3.6* <0.001
Percent students with disabilities Unadjusted 12.0 12.8 -0.9* 0.012 (3.1) (4.2)
Adjusted 12.9 12.7 0.2 0.474
Percent free/reduced-price lunch eligible
Unadjusted 41.4 45.0 -3.6 0.058 (15.2) (23.7)
Adjusted 39.7 45.2 -5.6* 0.001
Race/ethnicity Percent American Indian/Alaska Native
Unadjusted 1.0 1.2 -0.2 0.221 (1.9) (6.0)
Adjusted 0.8 1.3 -0.5* 0.032
Percent Asian/Pacific Islander
Unadjusted 8.3 4.7 3.6 0.177 (14.0) (7.4)
Adjusted 5.5 5.1 0.5 0.367
Percent Hispanic Unadjusted 21.7 23.6 -1.9 0.503 (21.8) (25.4)
Adjusted 19.8 23.8 -4.0* 0.030
Percent black Unadjusted 22.5 16.5 6.0* 0.014 (19.5) (20.1)
Adjusted 16.1 17.3 -1.1 0.504
Percent white Unadjusted 44.3 52.4 -8.0* 0.002 (20.3) (31.1)
Adjusted 55.4 51.0 4.4* 0.026
District Inputs Students per teacher
Unadjusted 16.4 16.0 0.3 0.407 (2.7) (3.9)
Adjusted 16.0 16.1 -0.1 0.462
Students per certified staff
Unadjusted 13.8 13.7 0.1 0.781 (2.5) (3.7)
Adjusted 13.6 13.7 -0.1 0.546
District Finances Expenditures per pupil
Unadjusted $9,688 $10,037 -$349 0.277 (2,195) (3,175)
Adjusted $9,668 $10,039 -$371* 0.012
Cost-adjusted expenditures per pupil
Unadjusted $9,889 $10,380 -$492* 0.044 (1,735) (2,965)
Adjusted $10,173 $10,344 -$172 0.247
N 214 10,661
* Significant difference (p<.05).
NOTE: N counts vary slightly for each variable due to missing data. Standard deviations for unadjusted numbers are in parentheses below means.
Source: NCES Common Core of Data Local Education Agency Universe Survey File: School Year 2008–09; NCES Common Core of Data Public Elementary/ Secondary School Universe Survey File: School Year 2008–09; Census Financial F-33 Data, 2008; and NCES Comparable Wage Index Data, 2005.

Final Report May 24, 2011
17
The analysis above points out some key differences and similarities between military and other districts. The question is: do these differences remain when limiting the comparisons to similarly situated districts? To address this question, regression-adjusted means were calculated and military-connected districts were compared to other districts in the same state, in the same urbanicity category, and of the same size.
Looking at the adjusted means the picture is in some aspects different. As shown in table 2, once means were adjusted for state, urbanicity, and size, compared to other districts, military-connected districts:
Had fewer English language learners (6.8 percent versus 10.4 percent) and fewer free- or reduced-price lunch eligible students, but similar percentages of students with disabilities;
Had fewer American Indian/Alaska Native students (0.8 percent versus 1.3 percent) and fewer Hispanic students (19.8 percent versus 23.8 percent), but similar percentages of black students and, contrary to unadjusted means, more white students;
Had similar amounts of students per staff member, as with the unadjusted results; and
Had lower expenditures per pupil, but similar expenditures per pupil once they were cost adjusted.
Proper interpretation of the unadjusted versus adjusted results depends on the question being asked. As explained above, both unadjusted and adjusted means provide appropriate comparisons, but they answer different questions. If one is interested in how the characteristics of the average military-connected district compare to the average non-military-connected district, the unadjusted means are appropriate. If one is interested in the characteristics of military-connected districts compared to similarly situated and similarly sized districts, the adjusted means are appropriate.
Across the two sets of results, the following observations can be made:
1. Military-connected districts had similar or fewer special needs students (English language learners and students with disabilities);
2. Military-connected districts had fewer students eligible for free or reduced-price lunch, though this difference was smaller and not statistically significant in the comparison of unadjusted means;
3. Military-connected districts appeared more diverse (fewer white students and more black students) in the comparison of unadjusted means, but had more white students, similar percentages of black students, and fewer Hispanic students when adjusted for location and size;
4. Military-connected districts and other districts had similar counts of students per staff; 5. Military-connected districts had fewer cost-adjusted expenditures per pupil, but much of
this difference was due to location and size.

Final Report May 24, 2011
18
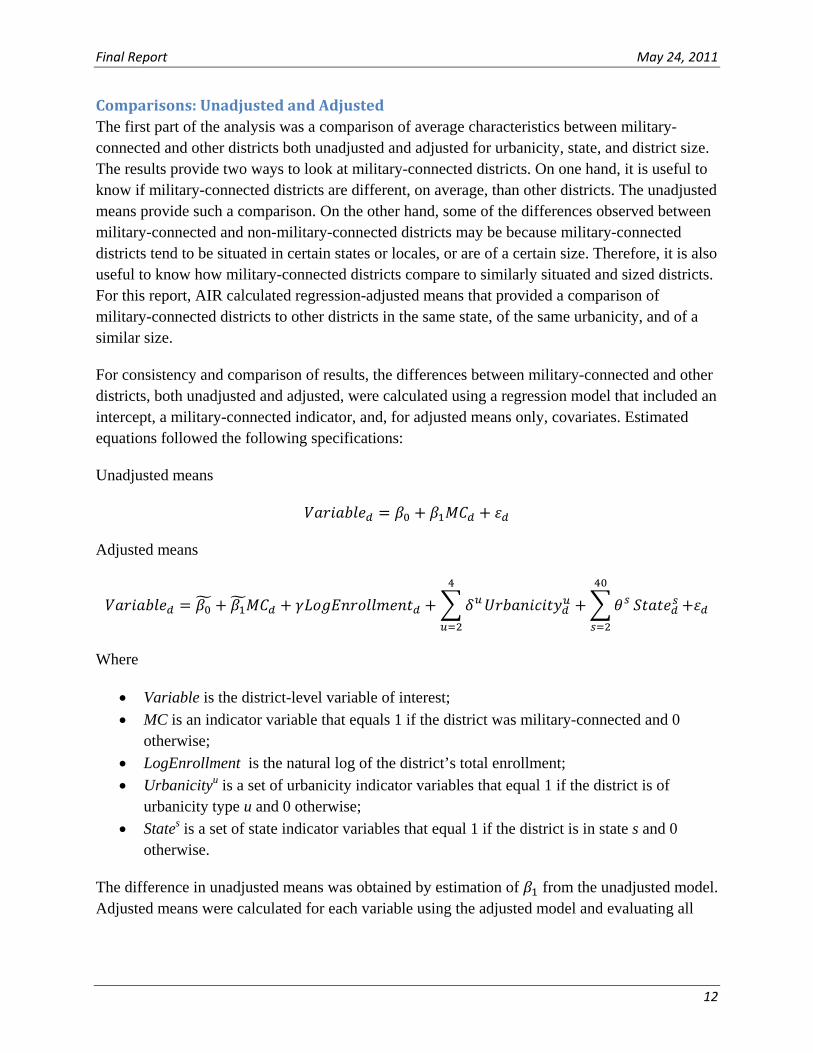
District Comparisons by Concentration of MilitaryConnected Students In the discussion of the research methodology, figure 1 illustrated the variation in the percentage of students that are military connected. In table 3 below, the relationship between the concentration of military-connected students in a district and the differences in characteristics compared to non-military-connected districts is explored. Mean differences were calculated by quartile of percentage of students in the district that were military connected, with “1” being the lowest concentration and “4” being the highest concentration. Table 3. Unadjusted and adjusted differences between military-connected and other districts by quartiles of the percentage of students who are military connected
Quartile of percent of students military
connected
Unadjusted differences (military-connected
– other)
Adjusted differences (military-connected
– other)
Estimate P-value Estimate P-value
District Student Demographics Percent English language learners
1 0.6 0.759 -3.0* 0.033
2 0.3 0.914 -2.2* 0.037
3 -6.3* <0.001 -6.3* <0.001
4 -7.0* <0.001 -7.0* <0.001 Percent students with disabilities
1 -1.2* 0.020 0.1 0.804
2 -0.7 0.161 0.3 0.508
3 1.0 0.114 0.8 0.157
4 -0.5 0.186 -0.1 0.829 Percent free/reduced-price lunch eligible
1 -5.1* 0.042 -7.1* 0.002
2 1.7 0.579 -3.0 0.211
3 -7.3* 0.045 -3.2 0.245
4 -4.0 0.201 -5.3 0.154
Race/ethnicity Percent American Indian/Alaska Native
1 -0.3 0.343 -0.6 0.121
2 -0.4 0.088 -0.5 0.095
3 -0.1 0.664 -0.6 0.068
4 0.3 0.413 0.0 0.973 Percent Asian/ Pacific Islander
1 1.8 0.115 1.2 0.144
2 11.6 0.235 -0.3 0.643
3 -1.4* <0.001 -1.2 0.147
4 -0.5 0.390 -0.3 0.489 Percent Hispanic 1 1.8 0.623 -2.3 0.402
2 -3.6 0.543 -3.7 0.239
3 -11.4* 0.001 -8.5* <0.001
4 -13.3* 0.000 -9.6* <0.001 Percent black 1 6.1 0.084 -3.8 0.140
2 3.0 0.451 -0.7 0.788
3 8.2 0.138 8.4* 0.006
4 11.2* 0.001 2.6 0.385 Percent white 1 -10.1* 0.002 4.2 0.137
2 -10.7* 0.047 5.2 0.094
3 3.7 0.469 1.0 0.750
4 1.6 0.626 6.2 0.060 (table continued on the next page)
Final Report May 24, 2011
19
Table 3. Unadjusted and adjusted differences between military-connected and other districts by quartiles of the percentage of students who are military connected (continued)
Quartile of percent of students military
connected
Unadjusted differences (military-connected
– other)
Adjusted differences (military-connected
– other)
Estimate P-value Estimate P-value District Inputs
Students per teacher
1 0.5 0.394 -0.1 0.726
2 0.0 0.962 -0.4 0.278
3 0.4 0.436 0.0 0.831
4 -0.1 0.789 0.1 0.690 Students per certified staff
1 0.3 0.583 0.0 0.822
2 -0.3 0.544 -0.5 0.184
3 0.1 0.766 0.2 0.203
4 -0.3 0.582 0.2 0.527 District Finances
Expenditures per pupil
1 -149 0.766 -177 0.472
2 -455 0.305 -575* 0.005
3 -626 0.058 -616* 0.012
4 -1093* 0.002 -667* <0.001 Cost-adjusted expenditures per pupil
1 -691* 0.043 -195 0.375
2 -92 0.834 -177 0.501
3 -127 0.654 -55 0.818
4 -530 0.076 -147 0.358
* Significant difference (p<.05).
NOTE: N counts vary slightly for each variable due to missing data. Standard deviations for unadjusted numbers are in parentheses below means.
Source: NCES Common Core of Data Local Education Agency Universe Survey File: School Year 2008–09; NCES Common Core of Data Public Elementary/ Secondary School Universe Survey File: School Year 2008–09; Census Financial F-33 Data, 2008; and NCES Comparable Wage Index Data, 2005. The concentration of the percentage of students who are military connected may influence these comparisons in two ways. First, observed difference might be a result of military-connected children simply having different demographics, something that is not possible to test with the data available. Second, since military installations are not randomly placed throughout the country, location and size are also potential factors that might create differences when compared to all other districts. This report does not attempt to separate out the extent to which the two factors might explain observed differences, but the calculation of adjusted means was conducted in an attempt to control for size and location as possible factors. A priori, the expectation is that if there are differences between military-connected and other districts, those differences would be more evident in military-connected districts with higher concentrations of military-connected students than those with lower concentrations. Looking at unadjusted means in table 3, this pattern was not evident except in a few cases: the percentage of students who were English language learners (ELLs) (higher quartiles have fewer ELL students), the percentage of students who were Hispanic (higher quartiles have fewer Hispanic students), and expenditures per pupil (higher quartiles had lower expenditures per pupil). After adjusting for district size and location, a similar pattern of differences remained, but the differences were smaller as a result of the regression adjustment.

Final Report May 24, 2011
20
For expenditures per pupil, it is important to note that apparent differences between the quartiles were substantial when there were no cost or size/location adjustments but that these differences disappeared after these adjustments were made. The raw differences between military-connected and other districts ranged from -$149 in the first quartile to -$1,093 in the fourth. After size/location adjustments these became -$177 in the first quartile to -$667 in the fourth. However, when the means were cost adjusted, whether they were also adjusted for location and size or not, military-connected districts in the first quartile were the least similar to non-military-connected districts.17 The percentage of students who are black and the percentage of students who are white also show idiosyncratic results by quartile: looking at unadjusted differences between the quartiles, there was less similarity to non-military-connected districts in the lower quartiles than the higher quartiles in the percentage of white students; in looking at regression-adjusted differences, the third quartile was, for both variables, significantly different from the second and fourth quartiles. Thus, there were no clear patterns in the differences in these characteristics across the quartiles.
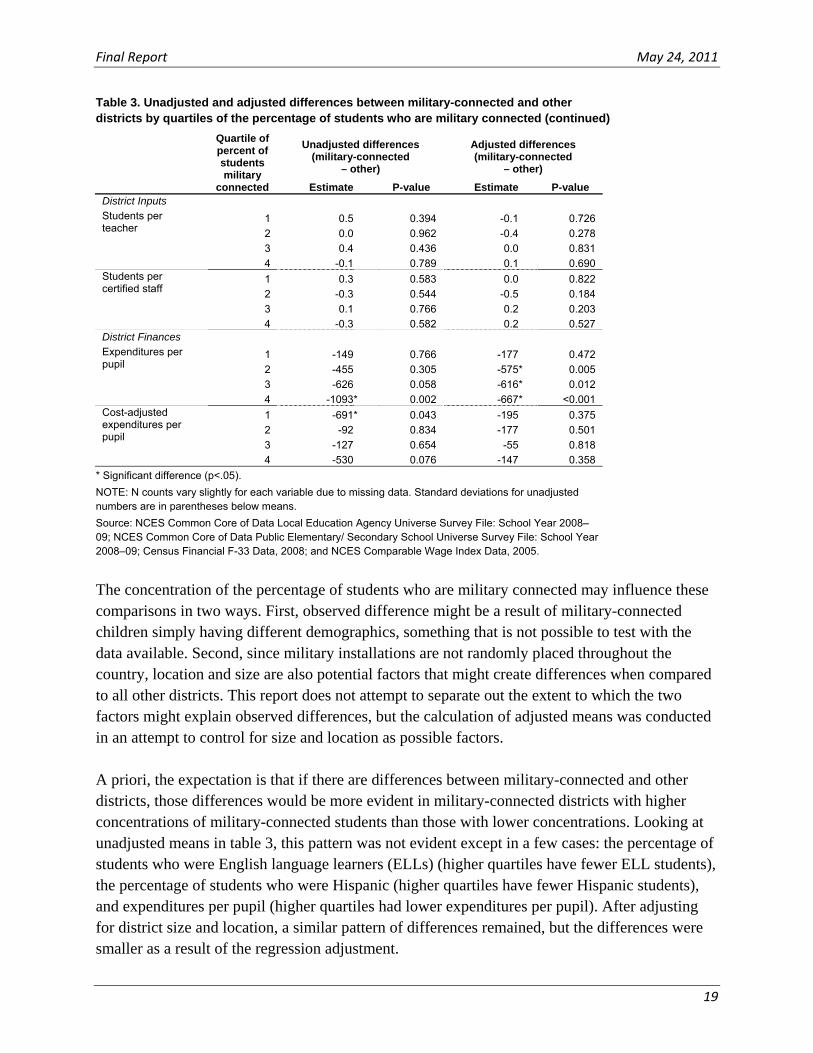
Educational Performance Ultimately, the most important concern of education policy makers is the academic achievement of children. Military parents are interested in sending their children to schools and districts that have high achievement, and are concerned when they are stationed in areas where local school districts underperform. For this report, AIR compared the educational performance of military-connected districts with that of other districts, using federally mandated district and school-level accountability measures obtained from EdFacts. The primary measures used were the percentage of students scoring proficient on state assessments in each district in mathematics and English Language Arts (ELA). Secondary measures used were the “adequate yearly progress” and “in need of improvement” indicators that accompanied the No Child Left Behind legislation.
This section of the report compares these measures between military-connected and non-military-connected districts. In the following section, the percent-proficient comparisons are explored in more depth using regression analysis. As shown in the previous section, there are multiple ways to perform comparisons like these; the regression analysis, described in depth below, provides the ability to account for numerous factors, including state and urbanicity differences as well as demographic differences.
Percent Proficient on State Assessments The reported percent proficient is not comparable across states because states do not use a common test to measure proficiency, nor necessarily have similar standards for what is considered proficient. Additionally, tests are generally not comparable across grades. Hence, to
17 Note: tests were not preformed to check if the different results by quartile were statistically different from each other.

Final Report May 24, 2011
21
report a common and comparable measure of proficiency across states, it was necessary to standardize the data within a state and within a grade before analyzing them. Reported percent proficient scores were “normalized” within each grade and state by subtracting the state’s and grade’s mean percent proficient and dividing by the standard deviation. This standardization distinguishes this analysis from other previously reported comparisons where differences across states contributed to the calculated differences between military-connected and non-military-connected districts. Here, military-connected districts are compared to other districts in their own state.
Averages based on these standardized scores, which are in standard deviation units, are reported in table 4. Students in military-connected districts performed better in mathematics (0.12 standard deviations higher) and English language arts (ELA) (0.19 standard deviations higher).18 Both of these differences are statistically significant; a 0.l2 standard deviation change in mathematics would move a district from the 44th percentile to the 49th percentile of all districts in the country. In reading, a 0.19 standard deviation change would move a district from the 42nd percentile to the 51st percentile.
Table 4: Percentage of students in districts proficient on state mathematics and English language arts assessments
Military-connected districts Non-military-connected
districts
State Assessment Mean Mean Difference P-value Average percent proficient – Math 0.105 -0.017 0.122* 0.022
(0.75) (0.91)
Average percent proficient – ELA 0.165 -0.030 0.195* 0.001
(0.78) (0.94)
N 209 9,775
* Significant difference (p<.05). Statistical testing was performed using a t-test and Satterthwaite approximation of the degrees of freedom when calculating the p-values with the assumption of unequal variances.
NOTE: N counts vary slightly for each variable due to missing data. Standard deviations are in parentheses below means. Source: EdFacts 2008–09.
While these data show that military-connected districts have performance levels that are somewhat better than other districts, it is important to note what these numbers might and might not reflect. First, as discussed above, these data may reflect the fact that military families, when locating near a military installation, can choose the district they live in and may choose a district with better schools. In this case, districts with better schools will be more likely to be identified as “military connected” than districts with poor schools that are similarly near an installation.
18 It is important to emphasize that that these percent proficient numbers represent all students in military-connected districts, not just military-connected students. In future research, AIR will be making comparisons of the performance of military-connected students to other students. At present, data for such comparisons are not yet available.

Final Report May 24, 2011
22
Second, the data do not reflect cross-state differences. These data tell us that military-connected districts perform better than other districts in the same state; however, military families may still face challenges if asked to relocate to a state that has poor overall performance. Because they were standardized within each state, the data used did not allow cross-state comparisons.
District Adequate Yearly Progress and In Need of Improvement Status Other measures of academic performance include whether a district is making adequate yearly progress (AYP), which is best understood as meeting designated performance targets; and whether a district is “in need of improvement,” which is best understood as a situation in which performance targets have not regularly been met. Exact definitions differ by state. These measures are mandated by the Federal No Child Left Behind Act of 2001. They are fairly broad, as there are many different reasons why a district might fail to make AYP and eventually be in need of improvement. Nevertheless, the measures are useful as secondary indicators of educational performance for comparing military-connected and other districts.
Table 5 shows a comparison of these district-level indicators between military-connected and non-military-connected districts. The percentage of students enrolled in a military-connected district that was making AYP (a positive indicator), 32.2 percent, was lower than that enrolled in other districts, 37.5 percent—but this difference was not statistically significant. For districts in need of improvement (a negative indicator), 42.0 percent of military-connected district enrollment was in a district that was in need of improvement, compared with 44.9 percent of non-military-connected district enrollment. This difference was also not statistically significant.
Table 5: Percent enrollment in districts and schools making AYP and in need of improvement
Military-connected districts Non-military-connected
districts
Accountability Measure Mean Mean Difference P-value Percent of students in districts making AYP 32.2 37.5 -5.3 0.101
(46.7) (48.4)
Percent of students in districts in need of improvement 42.0 44.9 -3.0 0.392
(49.3) (49.7)
N 214 10,617
* Significant difference (p<.05). Statistical testing was performed using a t-test and Satterthwaite approximation of the degrees of freedom when calculating the p-values with the assumption of unequal variances.
NOTE: N counts vary slightly for each variable due to missing data. Standard deviations are in parentheses below means. Source: EdFacts 2008–09.
Educational Performance, Controlling for District and Student Characteristics Performance in military-connected districts was next compared to performance in other “similar” districts—districts in similar locations (with regard to urbanicity and state) and with similar student characteristics. This analysis describes not just how military-connected districts compare

Final Report May 24, 2011
23
to other districts in their states, but how they compare to similar districts in terms of their location and background characteristics. Analyses were again performed separately for mathematics and ELA. Factors that were used to define “similar districts” were: the percentage of students eligible for free or reduced-price lunch, the percentage of English language learners, the percentage of students with a disability, the percentage of students in various race/ethnicity categories, and indicators of district location (city, suburb, town, or rural area).
Comparisons were performed using weighted ordinary least squares regression analysis with standard error corrections for the clustering of districts within states.19 Differences in percent proficient across states were already factored out in the standardization process. However, standard errors still needed to be adjusted to take into account clustering of districts within states, as the error terms for districts in the same state may still be correlated.20 The regression model followed the following specification:
β β M
Where:
is the standardized percent proficient for district d; M is an indicator that = 1 if district d is military connected and = 0 otherwise;
is a vector of district characteristics, including percentages of students’ race/ethnic backgrounds, percent eligible for free and reduced-price lunch, percent that are English language learners, percent that have disabilities, and percent that are classified as “migrant”;
is an urbanicity-type indictor that = 1 if district d is of urbanicity type u and = 0 otherwise;
is a state indicator that = 1 if district d is in state s and = 0 otherwise; and is a state-specific error term.
The model was estimated separately for mathematics and ELA, and each was estimated in four stages. The stages are as follows: first, an ordinary least squares (OLS) model with only the military-connected indicator was estimated with no standard error correction for clustering within states; second, the same model was estimated with the standard error correction; third, urbanicity controls were added to the model; and, fourth, student demographic controls were added.
19 To adjust the standard errors for clustering, the GENMOD procedure and REPEATED statement in SAS were used. 20 Attempts were made to model this clustering within states using hierarchical linear modeling (HLM) techniques. There was particular interest in whether the military-connected indicator might vary across states. The HLM analysis was abandoned however to accommodate the standardizing of state percent proficient scores. Standardizing meant that within each state scores had a mean of zero and standard deviation of one. Because there were a number of states with only one military-connected district there was not enough variation to treat the coefficient on the military-connected indicator as random.

Final Report May 24, 2011
24
Additionally, AIR estimated regressions using two different specifications of “military connected”: one specification using a military-connected indicator as described above and a second specification using indicators for quartiles of the percentage of students who were military connected. The military-connected indicator provides an overall comparison of military-connected districts compared to other districts, similar to the other comparisons presented thus far. The use of quartiles of the percentage of students that are military connected allows the difference between those and the non-military-connected districts to differ according to the concentration of military-connected students. Theoretically, one would expect districts with low percentages of military-connected students (in the first quartile) to be more like non-military-connected districts, and districts with high percentages of military-connected students (in the fourth quartile) to be more different from non-military-connected districts. In other words, one would expect any differences between military-connected and other districts to be more pronounced among districts with higher concentrations of military-connected students. This predicted pattern of differences did not emerge in the analysis of background characteristics discussed above; it is explored again here with analysis of achievement via the second regression specification.
The regressions were estimated using data on grades 3 through 8 and using only observations that did not have missing values for any of the independent variables used in the analysis. This resulted in the elimination of 15.8 percent of all districts in the sample. Results for each subject, stage of estimation, and specification are presented in table 6.
Final Report May 24, 2011
25
Table 6: Regression Results of Standardized Percent Proficient Measures in Mathematics and English Language Arts
Mathematics Model 1 Model 2 Model 3 Model 4
Coefficient P-value Coefficient P-value Coefficient P-value Coefficient P-valueMilitary-connected indicator 0.097* 0.004 0.097 0.169 0.196* 0.024 0.036 0.696 Military-connected quartiles
Quartile 1 0.099* 0.021 0.099 0.415 0.194 0.151 -0.049 0.702
Quartile 2 0.120 0.071 0.120 0.280 0.229* 0.026 0.204* 0.006
Quartile 3 0.176 0.108 0.176 0.558 0.168 0.503 0.230 0.139
Quartile 4 -0.021 0.820 -0.021 0.900 0.164 0.313 -0.048 0.639
N 8408 8408 8408 8408
Model specification Clustered standard errors
District enrollment (log) Urbanicity indicators
Student demographics
English language arts
Model 1 Model 2 Model 3 Model 4
Coefficient P-value Coefficient P-value Coefficient P-value Coefficient P-valueMilitary-connected indicator 0.173* 0.000 0.173* 0.022 0.306* 0.001 0.168 0.054 Military-connected quartiles
Quartile 1 0.151* 0.001 0.151 0.307 0.290 0.052 0.013 0.921
Quartile 2 0.175* 0.010 0.175 0.238 0.306* 0.022 0.266* 0.017
Quartile 3 0.211 0.060 0.211 0.567 0.205 0.510 0.228 0.300
Quartile 4 0.252* 0.009 0.252 0.054 0.453* 0.002 0.180* 0.022
N 8408 8408 8408 8408
Model specification Clustered standard errors District enrollment (log) Urbanicity indicators Student demographics
* Significant difference (p<.05).
Source: EdFacts 2008–09. NCES Common Core of Data Local Education Agency Universe Survey File: School Year 2008–09; NCES Common Core of Data Public Elementary/ Secondary School Universe Survey File: School Year 2008–09.
As discussed above, without taking student demographics and other factors into account, military-connected districts performed better than other districts in mathematics and English language arts. This result was again demonstrated when the sample was limited to the regression sample (see the military-connected indicator row in table 6, model 1), though the difference

Final Report May 24, 2011
26
between military-connected and other districts was slightly smaller.21 After adjusting standard errors for clustering of districts in states (model 2), the significance of the difference in mathematics was lost. Holding constant urbanicity and size (model 3) accentuated the positive differences between military-connected and other districts.
Adding background factors into the model as controls in the final specification (model 4) changed the results: using this specification, the difference in mathematics achievement was close to zero and the difference in ELA achievement was smaller than the initial estimate with no control variables. Both differences were no longer statistically different from zero. These findings suggest that while military-connected districts performed better than other districts without controls, differences in district characteristics—in particular, student demographics—accounted for enough of the observed difference that the difference was attenuated and no longer statistically significant. Thus, in a straight two-way comparison of military-connected and non-military-connected districts, the former perform no better or worse than the latter once background variables are controlled for in the analysis.
Using quartiles of the percentage of military-connected students allowed consideration of how the results might be different for different concentrations of military-connected students. After ordering military-connected districts from low to high by their concentration of military-connected students, they were divided into four equal-sized groups, or “quartiles.” Indicator variables were created that equaled “1” for each district in the quartile group and “0” otherwise. Non-military-connected districts had a “0” for all four quartile indicators. These four indicators were then used in the regression model in place of the military-connected indicator.
Unadjusted regression results using percent-military-connected quartiles instead of the indicator revealed a general tendency for districts with larger percentages of military-connected students to perform better relative to other districts (model 1). The exception was for the fourth quartile in mathematics, where districts with high concentrations of military-connected students performed similarly to other districts. Also, in mathematics, only in the first quartile was the difference relative to other districts statistically significant. In reading, all but the third quartile were statistically different from non-military-connected districts.22
In the final model (model 4), after controlling for urbanicity and student characteristics, results in ELA continued to show a pattern of increasing magnitude of difference from other districts with increases in the percentage of military-connected students. In mathematics, however, the magnitude of differences was large in the second and third quartile, though only the second had a statistically significant difference: .20 standard deviations, which, when evaluated at the mean, translates to an increase from the 42nd to the 52nd percentile of district performance. In reading, 21 Note that if model 1 were estimated on the same population of districts as used in table 6, the magnitude of the estimate would be exactly the same. 22 Note: Tests were not preformed to check if the different results by quartile were statistically different from each other.

Final Report May 24, 2011
27
the second and third quartiles also showed greater differences compared to non-military-connected districts, and out of the four quartiles, only the differences associated with the second and the fourth quartiles were statistically significant: in the second quartile, the difference was .27 standard deviations, equivalent to a jump from the 41st to 54th percentile of district performance; in the fourth quartile, the difference was .18 standard deviations, equivalent to a jump from the 41st to 50th percentile.
This pattern of findings using national school district data is consistent with the findings of Buddin et al. (2001): military-connected districts appear to have better academic performance than other districts. Using statistical adjustments to reflect clustering by state, urbanicity indicators, and student demographic controls, the estimated differences in student performance between military-connected districts and non-military-connected districts were no longer statistically significant. In ELA, this was largely due to imprecision in the estimates—the apparent magnitude of the difference was similar to that found in models that did not control for these factors. The ELA regressions provided some limited evidence that districts with low concentrations of military-connected students were closer in performance to other districts, while districts with higher concentrations of military-connected students generally performed better. This pattern of differences, however, was not tested for statistical significance and was not evident in mathematics.
Research Question 2 What are the educational opportunities available for children from military families whose neighborhood schools are identified as “in need of improvement” as defined by the No Child Left Behind Act of 2001?
Overview This second research question investigates educational opportunities available in districts that educate children of military families and in particular those districts whose neighborhood schools are identified as being in need of improvement under NCLB. The district level is, as described in research question 1, also the level at which “military connected” is identified, and there are, as above, 214 military-connected districts. Ideally, to focus on military families whose neighborhood schools are identified as in need of improvement, researchers would use school-level enrollment information for children of military families. Unfortunately, such enrollment information currently only exists at the district level. To overcome this limitation, analyses were carried out not only for all military-connected districts, but also for the subset of these (93 of the 214) that had one or more schools identified as in need of improvement. To address research question 2, data were compiled on the prevalence of various school choice options, with an emphasis on those that applied to gifted students and students with disabilities. Information for this research question was gathered using two methods. First, data provided by

Final Report May 24, 2011
28
NCES for the 2008–09 school year allowed geographic linking of private, charter, magnet, and special education schools to school districts. Second, information on educational opportunities was gathered from numerous online sources, including state education agency websites, school choice interest groups, news articles, and most importantly, the websites of individual school districts. Information was gathered by five data collectors during September and October of 2010. All of this information created a rich inventory of the options available to students in military-connected school districts, along with some indication of how visible these options were to parents. Additionally, one important school choice option is home schooling; data on home schooling were not available, and this choice option was not included in the analysis. Table 7 summarizes the various school options for which data were collected and categories of data sources from which information was gathered. Table 7: Types of school choice included in the study by data source
Choice type NCES databases State and related
websites District websites External
sources/reports
Charter schools ● ● ●
Magnet schools ● † ●
Private schools ●
Special education ● ●
Gifted/talented ●
Dual enrollment ●
Open enrollment ● ● ●
Vouchers ● ●
Virtual schools ● ●
†Due to difficulty differentiating and identifying magnet schools and magnet programs based solely on information provided by district websites, AIR does not report on the magnet school/program information collected from school district websites though it was a category used in data collection.
Methodology
NCES Databases The best source of information on magnet, charter, and special education schools is the school-level Common Core of Data (CCD). The best and perhaps only source of information on private schools is the Private School Universe Survey (PSS), also published by NCES. The PSS is an attempt to compile an accurate and complete list of private schools operated throughout the nation, containing data very similar to those found in CCD. The PSS differs from CCD, however, in that it is conducted only biennially, with the most recent available year being 2007–08. Because school districts were the unit of analysis considered in this report, the school-level data sources discussed above had to be linked to the local education agencies (districts) for which they provided information on school choice options. This linking for magnet, charter, special

Final Report May 24, 2011
29
education, and private schools, however, could not be done with existing identifying codes. For every public school in the CCD (including charter, magnet, and special education schools) there was an associated school district code, but the code only indicated which administrative unit operated the school. The code did not necessarily indicate which district’s students were served, or might have been served, by the school. Many districts encompassed charter schools that operated independently of the surrounding district. These schools clearly provided an alternative to the local district-operated schools but are not identified by the code as such. Similarly, special education schools might serve students residing within a particular district, but these schools may operate under the auspices of another entity (e.g., the state, a supervisory union, or regional educational service agency). And, the private schools from the PSS are fully independent, without any identifying codes to link them directly to districts. Since identifying codes could not be used, for this study, magnet, charter, special education, and private schools were linked geographically to the districts for which they provided options. The geographical information that defined these linkages existed in the form of school district boundaries, locations of school district central offices, and the locations of the individual schools. The U.S. Census Bureau’s Topologically Integrated Geographic Encoding and Referencing system (TIGER) 2009 (U.S. Dept. of Commerce, 2009) provided updated district boundary files. The geographic coordinates for district offices and individual schools were provided by district and school-level CCD data for magnet, charter, and special education schools, and by PSS data for private schools. Two approaches were explored to geographically link schools to districts. First, schools were linked to districts according to their physical location within a school district’s boundaries. This approach, while parsimonious, ignored the substantial variation in district size; schools might fall within the boundary of a very large school district, but if, for example, the width of that district was a hundred miles or more, these schools would not present options for students throughout. An alternative approach used the location of the district office to identify all schools found within a certain radius. A similar study (Figlio & Hart, 2010) used a five-mile radius for this purpose. While using a radius around the district headquarters solved the problem of variations in district size, it created new complications: 1) the location of the district office might not be proximal to the majority of students, 2) a distance of five miles might be considered far in some locales but not in others, and 3) it ignores geographical features such as rivers, mountain ranges, and roads, which greatly impact travel time. For this study, geographical linking using district boundaries was chosen as the preferred method. To address the variation in district size, results are presented in terms of the percentage of district enrollment rather than as counts. For example, larger districts, because of their size, are more likely to have higher counts of all types of schools. The percentage of enrollment in a

Final Report May 24, 2011
30
particular school type provides a better comparison across districts of varying sizes for the prevalence of schooling options. The research question specifically inquires about options for families whose neighborhood school is identified for improvement. Since information on attendance of military-connected students was only available at the district level, addressing this issue brought some challenges. Here again there were two approaches considered. One approach would have been to calculate these statistics for districts identified for improvement. Instead, a second approach was chosen: statistics were calculated for districts with at least one school identified for improvement. Since it is not possible to identify which schools military-connected students attend, this approach is inclusive of all potential situations where a student might be attending a school in need of improvement. Finally, in order to provide context to the results for military-connected districts, similar analyses were performed for all local education agencies in the 40 states containing military-connected districts. The use of Census and NCES databases meant that data on these school choice options were available for all school districts and allowed for such comparisons. Though the research question is specifically about military-connected districts, the prevalence of options in districts in the same 40 states provided a useful benchmark for comparison.
Data Collected from State and District Websites To provide insight about educational opportunities available to military-connected students, AIR developed a systematic process for collecting information from state and district websites. Web-based data collection had a key benefit: it provided information not only on the existence of school choice options, but also on the visibility of those options in a place where parents would look for them. In addition to district-level information, state-level information was also collected to provide information on state-level policies that affect educational opportunities. District-level information was collected exclusively from district websites, while state-level information was collected from state education agency websites, as well as school choice interest group websites, news articles, and various other online sources which were checked against official state-published information. Initially, the impetus for the data collection had been to gather information on inter- and intra-district transfer, also called open enrollment, along with information on vouchers and tuition tax credit scholarships. These were types of school choice that could not be captured using existing databases such as CCD. As the design of the data collection instrument evolved, the scope of the data collection expanded. It became clear that a more comprehensive analysis of the choice options could be achieved with only marginal extension of effort. The state and district websites offered a wealth of information beyond open enrollment and voucher policy. To the extent that this information was relevant to the study it was recorded for eventual analysis.

Final Report May 24, 2011
31
The data collection process utilized an instrument that was constructed to ensure a systematic collection of school choice information. The instrument contained two parts, one for state policy and one for district policy, and listed each of the key policy elements that data collectors were searching for on websites. The district-level component included items related to open enrollment policies (including both intra-district and inter-district transfer policies), vouchers, tuition tax credit scholarships, dual enrollment, online courses, special education and gifted programs, and the presence of information intended for military families. For each of the categories of school choice and related options, data collectors gathered information on the allocation systems used to determine participation when options were filled to capacity. Two basic types of allocation system were identified: those that treated all students equally and allocated spaces on a first come, first served basis, and all other types, which took student characteristics into account. The latter included programs and schools with specific admission criteria, as well as lotteries and other systems that might give priority to certain applicants. For these allocation systems, data collectors recorded the groups that received priority. Finally, staff collected information on the availability of transportation support for specific district choice programs. The state-level information consisted of information on state-wide school choice policies and programs, such as open enrollment, voucher policies, tuition tax credit and scholarship programs, and policies specifically for military families. The school choice elements used in the data collection instrument are listed in appendix A.2. Additionally, two other documents were developed for use in the data collection process: a procedures guide and a document containing definitions. The procedures guide provided data collectors parameters for their review of district websites, and tips for making that review efficient. The definitions document ensured a shared understanding among data collectors of the various programs and policies they might encounter and search for on websites. Both documents helped increase consistency among data collectors. These documents are available in appendix A.3 and A.4, respectively. Given the varied nature of information provided on district websites and the varied nature of certain programs, AIR established a criterion for what would be considered a choice option: the policy or program must have been available for application, use, or enrollment for students living anywhere within the district (though it was permissible for it to target a specific sub-population). Thus, any policy or program restricted to students based on where they resided (such as one offered only to students enrolled in a particular school) was not a school choice option. For example, a performing arts magnet school serving students from throughout its district would have been counted as a school choice option, but a performing arts program in a school restricted to students enrolled in that particular school would not. Before beginning the official data collection process, two data collectors piloted the finalized data collection form and protocol, each gathering information for six districts and two states. The

Final Report May 24, 2011
32
task leader reviewed this effort and clarified the questions that arose. The pilot effort tested the usability of the instrument and general protocol, while at the same offering an orientation to the two participating data collectors. It also yielded qualitative information about the process and nature of school choice policy as revealed by school district and other websites. This information was critical for final refinement of the data collection instruments and methodology. Using the data collection instrument, as well as the supplemental definition and instruction guides, school choice information was compiled for the 214 military-connected districts and the 40 states in which they operated. Data collectors were instructed to spend one hour collecting district-level information and two hours collecting state-level information, but were given some discretion to spend slightly more or less time depending on what the situation warranted. Time limits were necessary for administrative reasons, but also supported the methodological goals: searches mimicked what a parent might find with a reasonable expenditure of effort. Unlike the analysis described above (using extant data from NCES for assessing availability of charter, magnet, and private schools), a comparison of the prevalence of educational options in non-military-connected districts was not possible here. A collection of information for the nearly 10,000 non-military-connected districts or a representative sample of these districts was beyond the scope of this study. Throughout the data collection process, additional efforts were made to ensure consistency across data collectors. The lead data collector provided a thorough orientation to the other data collectors. The orientation included repeating the data collection effort for a selected district and a state that had already been coded. This allowed questions to be answered as they came up, and served to minimize subjectivity and increase inter-rater reliability among the team members. Though many steps were taken to ensure uniformity and reliability in data collection, it is important to note that results from this data collection effort may contain some error, particularly regarding the district-level elements, as the information provided by district websites was not always systematic, consistent, or up to date, and there was likely some subjectivity in its interpretation by data collectors.23 Upon completion of the data collection process, 23 of the 214 districts were randomly selected and recoded by a different data collector to address the question of reliability. Despite the extensive efforts to maximize consistency, some discrepancies were found between the initial and the recoded information; in some cases additional material not found in the original coding was uncovered. Because of the time limits imposed on the initial data collection, these “false negatives” were an anticipated part of the data collection methodology. For this reason, the
23 As an example of the difficulties encountered on district websites, data collectors found one district that stated on its website that it did not allow inter-district transfer. However, upon inspection of a manual of district policy, also located on its website, there was information on provisions for inter-district transfer for homeless students and students in special education.

Final Report May 24, 2011
33
existence of school choice programs as indicated by the data collection should be interpreted as providing a “floor” on the true presence of such options. In addition, districts may also have offered types of choice that were not mentioned on their websites.
Other Sources of Information on School Choice Options Though data on virtual school options were obtained from the district-level data collection, information was also extracted from “Keeping Pace with K-12 Online Learning” (Evergreen Education Group, 2009). This report provides profiles of online learning opportunities for each state and contains information about state laws and policies for online learning. Information contained in the report was summarized into a single table showing the available options for each of the 40 states containing military-connected school districts.
Results by Type of School Choice Option Results are presented by type of school choice option in the following order and categories: private schools; charter, magnet, and special education schools; gifted and talented programs and programs for students with disabilities; open enrollment; vouchers and tax credits; virtual schools; and other findings.
Private Schools Table 8 provides a breakdown of enrollment in private schools compared to public schools as well as a breakdown of private school types. As these private school data came from nationally representative databases, a comparison to all other school districts operating in the same 40 states was possible. Enrollment in private schools was basically the same for each of the three district types: 9.4 percent of enrollment in non-military-connected districts, 9.3 percent in all military-connected districts, and 9.9 percent in military-connected districts with schools in need of improvement. Differences between military-connected districts and other districts in the types of private schools were all statistically significant, however. Military-connected districts had fewer students in “regular” private schools due to having more students in Montessori, special emphasis, and early childhood schools. Military-connected districts also had significantly fewer students in special education and alternative/other schools.

Final Report May 24, 2011
34
Table 8: Percentage of student enrollment in local public and private schools and by private school type, for non-military-connected districts, military-connected districts, and military-connected districts with schools in need of improvement
Military-connected districts
Military-connected with schools in need
of improvement Non-military-
connected districts
Public schools 90.7 90.1 90.6
Private schools 9.3 9.9 9.4 Regular 83.5 85.5 87.0* Montessori 4.5 3.7 3.2* Special emphasis 3.0 2.7 2.1* Special education 1.8 2.1 2.4* Alternative/other 1.0 1.8 1.3* Early childhood 6.2 4.1 4.0*
N 214 93 10,809
* Significant difference from military-connected districts (p<.05). Statistical testing was performed using a t-test and Satterthwaite approximation of the degrees of freedom when calculating the p-values with the assumption of unequal variances.
Note:
Special emphasis – schools such as a science or math school, performing arts school, talented or gifted school, foreign language immersion school.
Alternative/ other – offered a curriculum designed to provide alternative or nontraditional education that does not fall in the other categories.
Source: NCES Common Core of Data Local Education Agency Universe Survey File: School Year 2008–09; NCES Common Core of Data Public Elementary/ Secondary School Universe Survey File: School Year 2008–09; NCES Private School Universe Survey, “Public-Use Data File,” 2007–08.
Charter, Magnet, and Special Education Schools Information on enrollment in charter, magnet, and special education schools is provided in table 9. Within military-connected districts, over 10 percent of students were in magnet, charter, or special education public schools. Including enrollment in private schools from table 8 above, these results indicate that almost one in five students enrolled in military-connected districts is in a school of his or her choice, be it private, magnet, charter, or special education. As above, this information comes from a nationally representative database, so a comparison of military-connected to other districts is provided in the table. For the most part, these numbers provide evidence of the similarity between military-connected districts and other districts. There was, however, a significant difference in the percentage of students enrolled in magnet schools. Enrollment in magnet schools was higher in military-connected districts (8.0 percent of public school enrollment) than in all other districts (4.9 percent of non-military-connected public school enrollment). Magnet school enrollment was even greater (9.1 percent of public school enrollment) when the sample was limited to military-connected districts with a school in need of improvement, but this was not significantly different from military-connected districts as a whole.

Final Report May 24, 2011
35
Table 9: Percentage of student enrollment in local public schools by public school type, for non-military-connected districts, military-connected districts, and military-connected districts with schools in need of improvement
Military-connected districts
Military-connected districts with schools
in need of improvement
Non-military-connected districts
All public schools 90.7 90.1 90.6
Regular public schools 89.5 87.7 92.2*
Magnet schools 8.0 9.1 4.9*
Charter schools 2.3 2.9 2.8
Special education schools 0.3 0.3 0.3
All private schools 9.3 9.9 9.4
N 214 93 10,809
* Significant difference from military-connected districts (p<.05). Statistical testing was performed using a t-test and Satterthwaite approximation of the degrees of freedom when calculating the p-values with the assumption of unequal variances.
Source: NCES Common Core of Data Local Education Agency Universe Survey File: School Year 2008–09; NCES Common Core of Data Public Elementary/ Secondary School Universe Survey File: School Year 2008–09; NCES Private School Universe Survey, “Public-Use Data File,” 2007–08.
Gifted and Talented Programs and Programs for Students with Disabilities One of the emphases of this report is on the education of students with disabilities and gifted and talented students. Students with disabilities are sometimes served by dedicated schools. In table 9 it was reported that a very small percentage of students attended special education schools (0.25 percent in military-connected districts); this is small even relative to the population of students with disabilities which is estimated to be 13 percent in grade 4 and 12 percent in grade 8 by the National Assessment of Education Progress (NCES, 2009). Instead, many students with disabilities and gifted and talented students relied on programs offered within regular public schools. As part of the district-level data collection, information about gifted and talented programs and programs for students with mental, psychological, or physical disabilities was collected. Along with this information, the presence of dual or concurrent enrollment programs (programs that allow high school students to take college-level courses for full credit) was also recorded. The results are presented in table 10. Almost all districts were found to have information about special education programs and options for gifted and talented students on their websites, and over 70 percent had information about dual enrollment.

Final Report May 24, 2011
36
Table 10: Percentage of student enrollment in districts offering online information about options for students with disabilities, programs for gifted/talented students, and dual enrollment for military-connected districts and military-connected districts with schools in need of improvement
Policies, programs and tailored information found on district websites
All military-connected districts
Military-connected districts with schools in
need of improvement
Percent Percent
Special education programs 98.6 99.9
Advanced coursework/options for gifted students 94.6 94.8
Dual enrollment 71.9 75.2
N 214 93
* Significant difference from military-connected districts (p<.05). Statistical testing was performed using a t-test and Satterthwaite approximation of the degrees of freedom when calculating the p-values with the assumption of unequal variances.
Information gathered from districts’ websites during the month of September 2010.
Note: For all of these categories participation must not be limited to students based on their location. Programs that are only available to students who live within a certain catchment area are excluded.
Special education – Information about programs or schools that offer special education services to disabled students or others with psychological or behavioral disturbances. In nearly every case this equates to special education schools and programs, it may also include programs for students without specific learning disabilities. For instance, in one case this includes an independent study program targeted at those who are likely to drop out or have other problems that prohibit regular attendance in their local high school.
Advanced coursework – Information about any program that offers elevated curriculum or instruction such as academic magnets, gifted programs, and other programs and schools offering advanced learning opportunities to students regardless of the location of their residence within the district
Dual enrollment – Information about programs which allow students to take college level courses for credit. Generally these involve partnerships between school districts and nearby community colleges
On the one hand, these results for special education programs may not be surprising: given the requirement for special education services under the Individuals with Disabilities Education Act (IDEA), one might expect all districts to have special education programs. The methodology used in this report, however, captured not what was simply present in a district, but what was present and also communicated to parents via the website. The communication of information on district websites indicated that districts were at least somewhat proactive in communicating with parents and students about these services. The provision of programs for gifted and talented and high-achieving students, including dual enrollment, does not have a mandate such as that made by IDEA for students with disabilities. There may be, however, motivation for districts to provide and advertise programs for gifted and talented students if they are interested in retaining those high-achieving students. AIR found that information about these programs was almost as common as information about programs for students with disabilities. One caveat is that these results are weighted by student enrollment; districts with more students are counted proportionally more. In appendix A.1, table A.3 shows that only 79.4 percent of districts had gifted/talented programs. The discrepancy between this result and the student-weighted result reported in table 10 indicates that smaller districts were not providing

Final Report May 24, 2011
37
information on district websites and possibly did not have gifted and talented programs. Dual enrollment was also less prevalent when looking at unweighted results. This might be due to the fact that many smaller school districts are geographically situated in rural areas where there may not be a local college with which districts can partner, making dual enrollment more difficult. It is important to note that these results do not provide information about the quality of the programs nor their availability for enrollment to military families. While there is no reason to believe that programs are of low quality or unavailable, programs may not necessarily be viable options if they are not of good quality or are overenrolled and hard to find placement in. In addition, certain types of programs and schooling options have application processes at certain times of year that can be prohibitive to military families who may need to relocate in the middle of a school year.
Open Enrollment Numerous sources on the web provided information on the presence of open enrollment policies (intra-district policies allowing a student to transfer to a different school within the district and inter-district policies allowing a student to transfer to a school in another district) at the state level, while individual school district websites supplied corresponding information at the district level. The presence of state-level policies for open enrollment did not guarantee that the policies were available to all students. The presence of these policies did, however, offer the necessary framework for families and students to have pursued these options. Indeed, some state-level policies may do nothing more than allow for voluntary participation on behalf of local school districts, which the districts then have a choice to implement or not. Table 11 shows the prevalence of state-level and district-level open enrollment policies among military-connected districts as well as among the subset of those with schools in need of improvement. At the state level, over half of enrollment in military-connected districts was in states with state-level policies for open enrollment: 56.7 percent of enrollment was in states with intra-district policies and 53.7 percent in states with inter-district policies. A comparison to the district-level percentages exposes an interesting dichotomy in terms of district- and state-level policy. Information on policies governing intra-district transfer (open enrollment within the district) was more common (76.0 percent of enrollment) at the district level than at the state level; however, information on policies regarding inter-district transfer (open enrollment between districts) was less common (47.7 percent of enrollment) at the district level. This finding may be expected given the methodology: districts may be more likely to provide information on intra-district transfer, where students are not entering or leaving their jurisdiction, on their websites than to discuss inter-district transfer, where the policy involves potentially losing students to other districts.

Final Report May 24, 2011
38
Table 11: Percentage of student enrollment in districts with state-level or district-level open enrollment policies, for military-connected districts and military-connected districts with schools in need of improvement
All military-connected districts
Military-connected districts with schools
in need of improvement
Percent Percent
State policies
Intra-district open enrollment policy 56.7 65.7 Inter-district open enrollment policy 53.7 59.2
District policies
Intra-district open enrollment policy 76.0 75.9 Inter-district open enrollment policy 47.7 44.3
N 214 93
* Significant difference from military-connected districts (p<.05). Statistical testing was performed using a t-test and Satterthwaite approximation of the degrees of freedom when calculating the p-values with the assumption of unequal variances.
All data were collected in September 2010. State-level data were collected from numerous sources on the internet including state websites, news articles, websites of school choice advocates, NCES reports, and so forth. District-level data were gathered from districts’ websites.
Results for the subset of military-connected districts with schools in need of improvement were similar to those for all military-connected districts. These military-connected districts did have a higher proportion of enrollment in states with open enrollment policies, both for intra- and inter-district transfer, but this difference, though large in magnitude, was not statistically significant. For district-level policies the percentages of enrollment were almost identical between all military-connected districts and those with schools in need of improvement. The caveat discussed in the methodology section should be reiterated: potential limits on the ability of data collectors to find information about a particular district policy, in this case open enrollment, mean that the number of policies found must serve as a floor for the presence of that option. In other words, the district-level percentages shown in table 11 potentially under-represent the actual presence of such policies—but again, an option that is unknown to parents does not provide families with an additional educational opportunity. This caveat also applies to state-level policy, but is less relevant because most state-level information is readily available in the public record and is disseminated via multiple channels.
Vouchers and Tax Credits While school choice is manifest in many forms, publically funded vouchers have historically been at the core of the push for increased school choice. Examples of voucher programs include those implemented in Milwaukee, Wisconsin, as well as less controversial town tuitioning programs in Maine and Vermont, where some small towns elect to give educational vouchers to children rather than operate local public schools. Over time, due to legal and other challenges faced by voucher programs, tax credits have come to represent another way to facilitate enrollment in alternative institutions, typically private schools, rather than in traditional

Final Report May 24, 2011
39
neighborhood public schools. There are two variations on “tax credit” programs that are of interest with respect to school choice:
1. Tax credits/deductions for school tuition; and 2. Tax credits/deductions for individual or corporate donations to scholarship programs that
provide funding for students to attend a K-12 school of their choice.
The first allows families to claim a tax credit or deduction for tuition paid for their children to attend a private school. The second allows an individual or business to claim a tax credit or deduction for a donation to school tuition organizations (STOs), referred to as scholarship funding organizations (SFOs) in some states. The STOs/SFOs then provide selected students with scholarships to private schools.24 Table 12 presents results for state and district-level policies on vouchers and tax credits. While 23.0 percent of students in military-connected districts were in states that had policies for vouchers or tax credits, far fewer, 2.6 percent, were in districts that discussed or implemented those policies at the local level.25 There are a few possible explanations for this result. First, some of the voucher and tax credit programs at the state level were targeted at specific student subpopulations and were not open to all students. Florida, Georgia, Oklahoma, and Utah had voucher programs, but they were limited to students with disabilities. Louisiana and Ohio both had multiple voucher programs, each of which served some subset of the total population. The states listed here account for almost all of the state-level voucher programs. Similarly, tax credit scholarship programs may have been limited to subsets of the student population rather than being open to all. The numbers presented below therefore are not a reflection of the policies that all students were facing. Second, since both of these vehicles of choice (vouchers and tuition tax credits) have the negative side effect of reducing funding for public schools (directly in the case of vouchers, or indirectly through declining enrollment due to tax credit scholarships), school districts would not necessarily have chosen to implement them voluntarily or advertise them as options even when they were available.
24 There are some programs that allow individuals or businesses to claim a tax credit or deduction for a donation to a public school. This type of program was not of interest since it did not serve to increase school choice options for students, though it may have increased the quality of public school education. 25 Only 4 of the 214 military-connected districts had mention of a voucher or tuition tax credit on their website. Of those four, only one mentioned vouchers.

Final Report May 24, 2011
40
Table 12: Percentage of student enrollment in military-connected districts with state-level or district-level voucher and tuition tax credit policies, for military-connected districts and military-connected districts with schools in need of improvement
All military-connected districts
Military-connected districts with schools
in need of improvement
Percent Percent
State policies
Voucher 19.9 23.1 Tuition tax credit scholarship 19.9 26.4 Voucher or tuition tax credit scholarship 23.0 26.4
District policies
Voucher 1.6 2.5 Tuition tax credit scholarship 1.0 0.8 Voucher or tuition tax credit scholarship 2.6 3.4
N 214 93
* Significant difference from military-connected districts (p<.05). Statistical testing was performed using a t-test and Satterthwaite approximation of the degrees of freedom when calculating the p-values with the assumption of unequal variances.
All data were collected in September 2010. State-level data were collected from numerous sources on the internet including state websites, news articles, websites of school choice advocates, NCES reports, and so forth. District-level data were gathered from districts’ websites.
Virtual Schools One important resource on the availability of online courses was the previously mentioned “Keeping Pace with K-12 Online Learning” (Evergreen Education Group, 2009). This report provides profiles of online learning opportunities for each state and contained information about state laws and policies for online learning. The report distinguishes the following types of virtual school policies (page 5):
“State virtual schools are created by legislation or by a state-level agency, and/or administered by a state education agency, and/or funded by a state appropriation or grant for the purpose of providing online learning opportunities across the state.”
“State-led online initiatives are different from state virtual schools in that these initiatives typically offer online tools and resources for schools across the state but do not have a centralized student enrollment or registration system for students in online courses.”
“In full-time online programs, sometimes called cyberschools, students enroll and earn credit issued by the school towards academic advancement based on successful completion of the courses (or other designated learning opportunities) provided by the school. Many full-time online schools are charter schools.”
The report categorized programs for each state as either full time or supplemental, and also indicated whether they were available to all students at the elementary, middle, and high school

Final Report May 24, 2011
41
grade ranges. In addition to this state-level information, the district-level data collection recorded the presence of information about online course options on district websites. Since many districts now provide online resources for students, data collectors were instructed to record only the cases where it was clear that the online courses were an alternative to regular instruction and were not simply supplemental educational resources. Table 13 shows information from both the report and the district-level data collection. While the educational rigor and viability of these options as alternatives to attendance in district-assigned schools is unknown, it is clear that such options were widespread, with over four out of five students (86.4 percent) in military-connected districts in states that had a state virtual school or online initiative. The prevalence of information about online courses, however, was lower (62.4 percent) on district websites. Interestingly, the unweighted rate (presented in table A.6 in appendix A.1) was lower still, with only 37.9 percent of districts providing information about online courses. Thus, larger districts were more likely to provide information on this option than smaller districts. Table 13: Percentage of student enrollment in districts with state-level or district-level online policies and options, for military-connected districts and military-connected districts with schools in need of improvement
Military-connected districts
Military-connected with schools in need
of improvement Percent Percent
“Keeping Pace with K-12 Online Learning”
State virtual school or state led online initiative 86.4 83.6
State virtual school 75.6 70.3
State led online initiative 10.8 13.4
State has fulltime online schools 51.0 66.2*
State has fulltime online schools for all students 28.0 39.9*
District-level data collection
Online courses 62.4 70.3
N 214 93
* Significant difference from military-connected districts (p<.05) . Statistical testing was performed using a t-test and Satterthwaite approximation of the degrees of freedom when calculating the p-values with the assumption of unequal variances.
Source: “Keeping Pace with K-12 Online Learning” (Evergreen Education Group, 2009) and information gathered from districts’ websites during the month of September 2010.
These rates were similar for students in military-connected districts in need of improvement compared to students in all military-connected districts. Military-connected districts with schools in need of improvement did, however, have significantly more students in states with online schools.

Final Report May 24, 2011
42
Other Findings from State and DistrictLevel Data Collection Beyond the broad categories of school choice discussed in the preceding sections, a number of other relevant findings emerged from the district- and state-level data collection efforts.
Information for Military Families At the state level, data collectors were instructed to record the presence of policies targeting the specific needs of military families. At the district level, data collectors were instructed to note whether or not the district provided information specifically intended for military families. At the state level, 94.2 percent of enrollment in military-connected districts was in states that had some policy related to military families. However, in every case but one the policy recorded had to do with the state joining the Compact. From the district-level data collection, the district provided some form of information specifically intended for military families on its website for 47.5 percent of students in military-connected districts. The percentage was higher for military-connected districts with schools in need of improvement (54.2 percent). The extent of information on district websites, however, ranged greatly in the extent to which they indicated districts were making efforts to accommodate the needs of military children. On one end of the spectrum some districts simply had notices to military families to fill out Impact Aid forms or links to the Compact. Typically the information provided was in the form of links to external resources. These included links to the DoD, DoDEA, military family associations, and online tutoring programs. The external organizations ranged from advocacy groups, such as the Military Child Education Coalition, to organizations that provide services to military families, such as Families OverComing Under Stress, to online tutoring resources with programs for military children, such as Army OneSource tutoring. Some districts had special guides and/or Q&A documents geared towards military families. A few districts had specific policies or programs specifically for military students or military families:
One district provided tutoring for military-connected students;
One district had information about excused absences for children with a parent about to deploy overseas;
One school in one district partnered with the Army’s “Operation Military Kids,” an Army initiative to provide programs and services to military-connected students, and to organize a family camp for those students and their families;
Two districts had programs that provided counseling support to military children and their families; and
Four districts employed their own military-family liaison: o In two of the four the staff member was tasked only with providing information
to families about existing resources; o In another one of the four the staff member was additionally tasked with helping
to develop those resources; and

Final Report May 24, 2011
43
o In the last of the four districts, the staff member was additionally tasked with providing education to local schools about the needs of military-connected students.
NCLB Choice Options The research question asks specifically about choice options made available to students enrolled in schools that are in need of improvement. In these circumstances, under NCLB, districts must offer parents the option to transfer their child to another school that has not been determined to be in need of improvement. A large-scale study conducted by AIR and RAND (U.S. Department of Education, Office of Planning, Evaluation and Policy Development, Policy and Program Support Service, 2008), found that the use of this option had remained low due to a variety of factors, including parental preference, lack of available alternative schools within the district, and shortcomings in informing parents of the option. Therefore, data collectors were instructed to look for information provided by the district that made this option clear to parents. Of all students enrolled in military-connected districts, 65.8 percent were enrolled in districts that discuss the NCLB school choice provision somewhere on their website. This percentage is higher, 75.5 percent, when looking at the subset of military-connected districts with at least one school in the district identified for improvement.
Preference/Priority for Military Children in DistrictLevel Options The district-level data collection recorded how school choice options were allocated to children in cases where participation was limited. If a simple waiting list was used, and no priority, preference, or set of requirements was given for specific subgroups, data collectors indicated that. In cases where priority was given to certain subgroups, or if participation was limited to certain subgroups, that was recorded as well. Of all children in military-connected school districts in which intra-district open enrollment was an option, 10.1 percent were in districts that gave priority to children of military families; for inter-district open enrollment this was 6.9 percent, and for online courses this was 21.7 percent. None of the other school choice categories had instances in which children of military families either had priority or were the only subgroup to which participation was offered.
Research Question 3 What are the challenges faced by parents of military families in securing quality schooling options for their children when their child's public school is identified as in need of improvement?
Overview To address research question 3, AIR interviewed eight School Liaison Officers (SLOs) to assess the challenges faced by parents of military families in securing what they believe are high-quality educational options for their children. Specifically, interviews sought answers to the following questions:
Final Report May 24, 2011
44
1. To what extent does school quality affect plans of military families to relocate, including relocation pursuant to a permanent change of duty station?
2. What are the educational needs of children, including special needs students, from military families that attend schools in need of improvement?
3. What is the level of involvement of military leadership in the education issues faced by military parents?
4. How do SLOs help military families address these challenges and what obstacles do they encounter in doing so?
It should be noted that parents would have been an excellent source of information to address this research question, and AIR recommends this as an avenue for future research. However, due to funding and time limitations, it was beyond the scope of this study to field a representative survey of military parents. Instead, a sample of eight SLOs were interviewed, as they serve as liaisons between military parents and school districts and therefore are knowledgeable informants about the challenges parents face in securing quality educational options for their children.
Methodology
Selection of SLOs AIR selected the 8 SLOs from a list of 21 names provided by DoDEA. Two SLOs were sampled from each of the four military branches: the Air Force, the Army, the Marine Corps, and the Navy. To ensure that the SLO informants could comment on the experiences of large numbers of military families, the study team gave SLOs associated with larger installations preference in selection. SLOs worked with between 1 and 11 districts, with an average of 4 districts each.26 Most of these districts (25 out of 31) were located in either cities (14) or suburbs (11). Only 6 of the 31 districts were located in either towns (1) or rural areas (5).
Attempts were made to sample installations with non-DoDEA public schools located on them, with the assumption that a closer relationship would exist between SLOs and schools in these situations. However, only two of the installations (the two Army bases) had non-DoDEA schools on base and one of the sampled Marine Corps installations had DoDEA schools on the installation. Additionally, geographic diversity within the sample was sought; the SLOs represented the following eight states: Arizona, California, Louisiana, Mississippi, North Carolina, Texas, Virginia, and Washington. However, a sample of eight SLOs, in spite of these sampling criteria, is not representative of all SLOs.
26 These numbers are based on information SLOs provided prior to the phone interviews. During the interviews, some SLOs indicated that they worked with additional districts not initially listed.

Final Report May 24, 2011
45
Interview Protocol Before drafting the interview protocol, AIR developed a list of variables. Besides serving as a guide for analyses, the variables list facilitated review and input, ensuring that all essential variables were captured. Equally important, it helped to ensure that interviewers did not ask unnecessary or redundant questions. Using the variables list as a guide, the study team developed an interview protocol and circulated the draft internally for review. The interview protocol covered the following overall topics: 1) SLO background, 2) SLO role and responsibilities, 3) characteristics of local districts and schools, 4) challenges faced by parents, 5) military leadership involvement, and 6) SLO responses to challenges. Each overall topic covered a number of sub-topics. For example, the section on parent challenges included questions about a) parents’ knowledge and use of local schooling options, b) the extent to which school quality affects military families’ plans to relocate, c) transition issues with which military families struggle; d) the extent to which parents who have children with unique needs are able to meet their educational needs, and e) other challenges that parents face in securing quality schooling options for their children. (For a full copy of the interview protocol, see appendix B.1.) To help prepare the SLOs for the interview, AIR staff sent the overall interview topics and subtopics via email in advance (see appendix B.2).
Data Profiles Prior to the interviews, AIR’s research team created separate district and school data profiles for each of the eight SLOs’ locales. The data profile included information on district and school demographics and performance, as well as state and district school choice policies and options in each of the eight states and local areas. The profile included information on district grade span, district student enrollment, district and school AYP status, district mathematics and ELA passing rates, and number of schools in each district. It also included a state level summary of school choice policies and a table of the district or districts’ school choice options, including number of magnet schools/programs, charter schools, and private schools, as well as the availability of intra- or inter district transfer, vouchers, dual enrollment, special education programs, gifted programs, and online programs. (See appendix B.3 for an example of a district and school profile.) This information was shared with the SLOs and reviewed by AIR staff prior to the interviews.
The purpose of the data profiles was to provide background information about the districts the SLOs indicated they worked with. It also served as a way to corroborate rather than collect this type of information during the interviews, which reduced the interview time burden on the respondents. During the interview, the interviewer referenced the data profiles and asked the SLOs to respond to the accuracy of information.
The district and school data profiles proved to be very helpful in providing background and contextual information before the interview, and led to more in-depth conversations around school quality and educational options for military parents.

Final Report May 24, 2011
46
Data Analysis The interviews were conducted in September 2010 and lasted 60–90 minutes. All interviews were audio-recorded, summarized in written form, and coded according to the following topics: 1) SLO background; 2) role and responsibilities of the SLO; 3) quality and choice of educational options; 4) relocation and transition issues; 5) educational needs of subgroup populations; 6) military leadership involvement; and 7) solutions to challenges. Subsequently, AIR staff analyzed these topics for themes and patterns to provide information on the four specific research questions. The study team also noted differences by military branch or geographic location to identify key similarities and differences by respondent subgroup.
Findings The findings are organized around the four specific research questions listed above. This section first summarizes the backgrounds of the SLOs, followed by findings for each of the four research questions. The section also includes SLO suggestions for improvements, their advice to other SLOs, and the limitations of the SLO findings from the researchers’ point of view.
Backgrounds of SLOs To get a sense of the SLOs’ backgrounds, they were asked about their length of tenure as SLOs and their educational backgrounds. Most of the SLOs were relatively new in their positions. Of the eight SLOs, six had been in their current role between one and two years. The other two respondents had spent 4 and 10 years as a SLO, respectively. It should be noted that each branch’s SLO program had been in effect for different lengths of time and was potentially implemented differently across branches. Thus, both the length of the SLO’s tenure and the length of the SLO program, as well as the implementation of the program, may affect the perceptions and responses provided by the SLOs. Furthermore, a majority of the SLOs held graduate degrees (one Ph.D. and six master’s degrees). The remaining SLO had a bachelor’s degree.
The SLOs were asked about their previous work experience relevant to their role as a SLO. All but one SLO reported having K-12 teaching experience and one had experience teaching at a university. Five SLOs also indicated that they had worked in some administrative capacity in schools and districts as school principals and district administrators. In addition, five of the eight respondents mentioned having prior military experience or having been exposed to the military through serving in the military, working as a civilian for the military, or having family members who served in the military.

Final Report May 24, 2011
47
1. To what extent does school quality affect military families’ plans to relocate, including relocation due to a permanent change of duty station?
To address this research question, interviewers asked SLOs various questions about relocation and transition issues related to school quality and choice, the use of the Compact,27 and strategies parents and SLOs engage in to deal with social and emotional issues.
School Quality and Choice Three of the eight SLOs, located in Arizona, Louisiana, and Mississippi, explicitly mentioned that the perceived quality of schools in their area affects families’ decisions about relocating to their installations:
“Sometimes the family will stay behind and just the member comes because of the schools. In some of those cases, the member will be here for a year and then the family comes because they realize that it could be four or five [years] that the member could stay.”
“I spoke to a chief about a month or two ago and he told me that he knew five chiefs that decided to retire instead of coming here because their kids would be forced to go to schools that are assigned here.”
“We are not where we want to be education-wise in [state]. We do have some great schools but we need to get better, and some parents don’t want to get stationed here…”
In addition to perceived poor performance of schools, six SLOs also reported on overcrowding or lack of capacity of schools in their areas. As one Marine Corps SLO noted:
“We do have capacity issues with most of our schools since our community is growing so quickly. We had 12,000 troops that came within the last few years, so every year our student population has gone up. We are getting enough students for a school every year, though they are not necessarily building a new school every year.”
Other issues reported by SLOs affecting access to quality schools included school budget cuts affecting the availability of physical education, libraries, and dual enrollment programs (two SLOs); poor school building quality (two SLOs); lack of school transportation (one SLO); and waiting lists for on-base housing, which is required for eligibility to attend DoDEA schools on base (one SLO).
Though a majority of military families choose traditional public schools according to the SLOs, some parents try to improve their children’s educational options through charter and magnet
27 The Council of State Governments and Department of Defense drafted an Interstate Compact to address the transitional issues faced by military families in dealing with school enrollment, eligibility, and graduation or placement requirements (Jackson, 2010). The Compact became effective in 2008 following its legislative adoption by 10 states and it had been adopted in 35 states by September 2010.

Final Report May 24, 2011
48
schools (when they are available, of good quality, and not over-subscribed), private schools (if parents can afford them), online programs, and home schooling. In fact, four SLOs explicitly mentioned that some military parents at their installations choose home schooling because they are not satisfied with the quality of education in their areas.
“We do have several families [who do home schooling]. They can live in the area they decide they want… [for] some it’s religion-related and some feel that all [STATE] schools are not performing where they feel comfortable sending their kids.”
Other strategies mentioned by SLOs that parents engage in to improve the quality of schooling for their children are to deliberately choose their place of residence to get access to better quality schools, and to use intra- and inter-district transfers. Intra-district transfers are available in all of the sampled areas and inter-district transfer options exist in seven of the eight locations, as shown in table 14; three SLOs indicated that parents take advantage of these options.
Table 14: School choice options and programs in the eight SLO locales
Locale 1 (AZ)
Locale 2 (CA)
Locale 3 (LA)
Locale 4 (MS)
Locale 5 (NC)
Locale 6 (TX)
Locale 7 (VA)
Locale 8 (WA)
Magnet schools
Charter schools
Private schools
Intra-district transfer
Inter-district transfer
Vouchers
Dual enrollment
Special education Schools/programs
Gifted programs
Online programs
Source: Interviews with the School Liaison Officers for each locale, locale school district websites, NCES Common Core of Data Local Education Agency Universe Survey File: School Year 2008–09, NCES Common Core of Data Public Elementary/Secondary School Universe Survey File: School Year 2008–09, and EdFacts School and LEA AYP data, School Year 2008–09 MCB.
In addition to intra- and inter-district transfer policies, all eight SLOs worked with districts that have private schools, special education schools/programs, and gifted programs, as table 14 illustrates. Furthermore, more than half of the SLOs’ locales have dual enrollment programs (7), magnet schools or programs (5), online programs (5), and charter schools (5). Only one SLO worked with districts that provide students school vouchers. Thus, overall the eight locales in the study offer at least 6 of the 10 possible school choice options and programs examined, with the locale in Mississippi offering the fewest options (the only place with only 6 out of 10 options or programs available).
Final Report May 24, 2011
49
The Use of the Compact All of the SLOs recognized the usefulness of the Compact in dealing with transition issues, but in some places the Compact has not been fully implemented, even though it has been adopted by all eight states in this sample. SLOs reported issues such as a lack of information and training on the Compact from the state’s department of education (four SLOs), a process that takes too long (one SLO), and resistance at the district level because of a loss of local control (one SLO).
“Our families aren’t using it too much because it hasn’t come down from our state and a lot of districts still don’t know about it. As much as we inform our districts, we are not in a position of authority over districts to tell them what they can or cannot do.”
However, when the Compact process is implemented well, SLOs reported that it effectively helps military families with transition issues such as high school credit transfers (e.g., algebra, foreign language), high school graduation requirements (e.g., exit exams, course completion requirements), different kindergarten age entrance requirements (e.g., 4 versus 5 years of age), and child immunization rules. A Navy SLO provided the following example of the usefulness of the Compact:
“It is very useful. We had one school district that wouldn’t allow a student into school because of immunization, because our clinic wouldn’t allow that child in for seven to ten days since they were very busy. Under the interstate Compact a military child has thirty days to get their immunization. Once we explained it to the district they let the child into school and we didn’t have any problems.”
Social and Emotional Issues Even though social and emotional issues were covered only briefly in the interviews, half of the SLOs reported that military students frequently struggle with adapting to a new school environment and often find themselves without friends. To deal with these social and emotional transition issues, half of the SLOs reported on the usefulness of the Military Child Education Coalition program Student 2 Student, which helps middle and high school students adjust to a new school. According to one Marine Corps SLO:
“We have heard really positive things from parents as well as schools themselves.”
However, another Marine Corps SLO felt that the program, though valuable, is too expensive:
“The cost is very high and that is for the name, trademark, and the trainers involved. I guess in my mind it is very commercial because of this and it doesn’t really need that. [But] it is a welcoming program for students where students help new students transition into the school system.”

Final Report May 24, 2011
50
2. What are the educational needs of children, including special needs students, from military families who attend schools in need of improvement?
Students in Special Education Almost all of the SLOs indicated that families that include children who qualify for special education present the most challenges because of the amount of time they require, compounded by the high number of cases in some locations. As one Air Force SLO explained,
“The overarching issue is that they come with IEPs [Individual Education Plans] and every state’s special education policy is different.”
SLOs reported that parents expect and demand the same services that their children received in their previous state, but these services may not exist in the new state due to different policies, practices, and funding levels. At least half of the SLOs also expressed concerns about the quality of special education in their area or state, such as districts not following IEP regulations and a lack of inclusion of students in special education into general education classrooms. As another Air Force SLO noted,
“They’re not following some of the IEP regulations and rules. They tend to want to lessen the service instead of continue on or increase any of the service. They have recently dis-enrolled some of their students because they did not feel they needed to be there.”
Three of the SLOs, including the two Marine Corps SLOs, reported feeling well supported by their Exceptional Family Member Program, which assigns a case worker to each family with a special education child and helps the family navigate the special education system. Conversely, one Navy SLO expressed concern about special education recently having been added as a core duty for Navy SLOs:
“With people with no education background—and there are SLO officers who have not been teachers or have not taken graduate classes in special ed—that can be a very difficult system to try and navigate.”
Students with Other Special Needs SLOs had mixed opinions about the quality of programs for other special needs students, in particular in their reactions to programs for gifted and talented students. Two SLOs commented on the high quality of programs for gifted students in their areas, whereas three others reported the opposite. One Air Force SLO specifically mentioned that programs for gifted and talented students are not challenging enough according to parents, and that English learners are not well supported either. This installation is located in one of the three states where the overall quality of schools is perceived as being poor.

Final Report May 24, 2011
51
3. What is the level of involvement of military leadership in the education issues faced by military parents?
Military Leadership Involvement The SLOs reported different levels of involvement of their military leadership in education issues. Some SLOs communicate mainly through email with their leadership, whereas others attend regular meetings or communicate daily and directly, in person, with their commanding officers. Additionally, most military leaders leave all direct interaction with schools and districts to the SLO. However, the two Army SLOs reported that their leaders visit schools and interact with superintendents on a regular basis. For example, at one Army base the Commanding General holds a “superintendent night” at his house, where he invites all local superintendents and military leadership for the purpose of building relationships. This Commanding General also has an initiative through which school administrators, counselors, and other school staff are invited to spend a day on the base.
Generally, the SLOs (with one exception) felt that their commanding officers are adequately involved, as indicated by this Marine Corps SLO:
“I think the development of the family programs and SLO program is indicative of the command’s intention to meet the needs of their populations, so I really don’t see a need for improvements on the command side.”
4. How do SLOs help military families address these challenges and what obstacles do they encounter in doing so?
A majority of the respondents described their role as entailing three aspects: 1) assisting families with education-related issues, 2) developing relationships and interacting with school and district personnel, and 3) keeping the command informed about education policies at the state and district levels as well as about other education issues affecting military families.
Five of the eight installations in the study had been assigned 1 SLO; the remaining three had 2, 3, and 3.5 SLOs, respectively. However, some of the SLOs who were the only SLO on their installation teamed up with SLOs from other installations. It appeared that SLOs who are able to collaborate with other SLOs feel less isolated and are better able to carry out their job. For example, SLOs on a large installation divide up the local districts among them, which facilitates the development of more in-depth relationships with a smaller number of districts. Collaboration across installations includes activities such as training of school and district personnel. SLOs also participate in online networks, as one Navy SLO described:
“We are in constant contact with each other. We have a homeport webpage where SLOs can post their best practices and talk with each other. Our regional SLOs will put information on there that we need to keep up with not only our region but others so we can see any new announcements.”

Final Report May 24, 2011
52
SLO Strategies The SLOs engage in a variety of strategies to assist parents with education-related issues and challenges. A majority of the SLOs communicate with parents through emails, phone calls, and face-to-face meetings. Three SLOs also noted that they use websites, newsletters, and information packets to share information with military families. Additionally, two respondents mentioned that they help create and maintain home school networks, and two others described collaborations with a number of programs on and off base that provide support and resources for military families. One SLO shared the following strategy for assisting parents:
“Most of my parents are aware of the issues with their children but they need somebody to make sure that when they speak to the educators, they don’t speak above their heads and they have a witness so they won’t get off track on what they are trying to do. I normally know the principal and call them ahead. We make sure the meeting is an amicable meeting.”
To develop relationships with schools and learn about local education-related issues, five SLOs reported that they engage in the following activities:
o Regular attendance at School Board and PTA meetings o Training of district and school personnel in military-related issues (e.g., military
culture, transition issues) o Hosting education fairs and other events on their installations
As an example, an Army SLO explained that the installation has developed a process called the Process Action Team, where they meet with the local districts on a regular basis to discuss education issues:
“All nine districts are invited to come meet with us on a quarterly basis. What we do is address any kind of issues that are really city-wide. So the parent has an issue with one school, we take care of it with one school. But if we start seeing trends, then we address those things city-wide. So, even tiny districts that don’t have military-connected students are kept in the loop in terms of number of soldiers that are coming in and things that are happening here on the post, etc.”
Some installations also develop formal school partnerships, where military units partner with schools and volunteer their time for tutoring, field trips, and helping with traffic. Finally, a few SLOs mentioned participating in state and local education networks as another way of staying up to date with local and state education policies and issues.
SLO Obstacles In addition to obstacles already described (e.g., the Compact not being fully implemented; problems encountered with special education), two SLOs mentioned that they did not have enough resources to carry out their jobs effectively at the beginning of their assignments. Issues

Final Report May 24, 2011
53
included delays in getting an email account, not having enough materials to provide to families and schools, and not being provided a laptop computer to use for presentation purposes.
SLO Suggestions for Improvements The SLOs suggested a number of possible solutions to the challenges military families face. The suggestions ranged from providing more information and training to education personnel and parents to gathering data on military-connected students and parent opinions on school quality.
The Compact. Half of the SLOs suggested that improvements to the implementation of the Compact would help alleviate transition issues for military children. Many of them noted that district and school staff are not well informed about the Compact because the information has not been provided to them directly by the state’s department of education. They suggested improvements to the implementation of the Compact through training of education personnel and increased collaboration between the state department of education and the military.
“I think there should be collaboration with the state department of ed on the interstate Compact with the military and Department of Defense. I think there needs to be more collaboration on that and really looking at how it can be implemented in a way so that it can really help families and the districts.”
Special Education. In addition, half of the SLOs also noted that providing parents with more assistance and training on the special education process would help alleviate issues concerning parents of children with special needs.
“If we can get parents more knowledgeable on their rights and their children’s rights when it comes to special education, I think a lot of the solutions could be resolved.”
Student Database. Two SLOs recommended creating a database of local military-connected students to be able to better serve military families. Because SLOs are currently unaware of how many military-connected students they serve in their local areas and who those students are, they cannot optimally assist every military family with education-related issues.
“The Garrison Commander wants to be able to create a database so we know how many military-connected students we have, where they are, and at what grade level. They would be able to check this information on a monthly basis so we would have an updated database. Because right now besides what schools tells us, we don’t know.”
Parent Survey. Additionally, two SLOs suggested conducting a national military parent satisfaction survey related to educational options and quality. A parent survey would help SLOs gain insight into how to improve their practices to better serve the population.
“I wish there was a national survey on parent satisfaction where we could compare [the quality of schools] apples to apples…That would be a great undertaking for the DoD.”

Final Report May 24, 2011
54
School Liaison Process. Finally, two SLOs offered suggestions for the school liaison process. For example, one SLO suggested that military families be required to visit the SLO office when they move to a new base, so that every family receives information about the schools, programs, and policies in the area. Another SLO proposed having military liaisons hired directly by the districts, and proposed placing a military liaison at the state’s department of education to improve effectiveness and better serve the population.
Advice to Other SLOs At the end of the interview, the interviewer asked the SLOs what advice they would offer to other SLOs based on their experiences. Half of the SLOs advised other SLOs to develop strong partnerships with schools and districts. They also stressed the importance of knowing local and state policies, as well as visiting local schools.
“You have to actually go to the schools – going to the schools is more than 50 percent of the solutions. The principals need to know who you are, what you stand for, and the principal’s boss, which is the superintendent, needs to know who you are and what you stand for. It makes all the difference in the world. If they know who you represent, they know you are speaking for the service and for that entire community. The fact that you are collaborating with them to prevent problems, to me, it makes all the differences.”
Limitations of Findings It is important to reiterate that a sample of eight SLOs is not representative of all SLOs. However, given these initial findings, it would be beneficial to study a representative sample of SLOs to examine possible differences across military branches, including how long the SLO program has been in place, the number of SLOs on an installation, the length of tenure of the SLO, and the size and location of the installation. Furthermore, to truly understand the perceptions and experiences of parents and military leadership, it would be important to interview or survey them as well.
Further Research The findings of this study indicate some future areas of research for further understanding the educational opportunities and performance in military-connected districts as well as the challenges that military families face. First, while analysis of military-connected and other districts point to some key comparisons using a variety of controls, it would also be important to further understand variation among military-connected districts. While results in this report were broken down by concentration of military-connected students, other factors that might explain differences among military-connected districts are the size of the military installation, the branch of military, and the demographics of the military-connected students (rather than just the demographics of all students).

Final Report May 24, 2011
55
Second, interviews with or surveys of military families would be an important next step in truly understanding their needs and concerns. The interviews of eight SLOs were informative but not representative, and did not solicit input directly from parents as stakeholders. Further research could seek to interview or survey a sample of military families that would be representative of various types of installations and branches of the service to obtain a picture of how they view the challenges they face and choices that they make in educating their children.
Third, a follow-up investigation of the quality and availability of schools and programs for students in special education and gifted and talented students would be an important complement to the results presented in this report. Investigation of existing databases and of state and district websites provided evidence of the existence of such schools and programs but did not capture their quality nor indicate whether those programs are overenrolled (and therefore not truly an option for parents). Further research could select a sample of such districts to investigate issues of program quality and whether overenrollment presents a barrier. Since this sort of information is not easily available, this investigation would likely require interviews of district officials, school officials, and program administrators.

Final Report May 24, 2011
56
Bibliography
Barrett, J. (2008). Transitioning military children with special needs. Exceptional Parent, 38(4):88-89.
Blum, R.W. and Libbey, H.P., (2004). School connectedness – Strengthening health and
education outcomes of teenagers: Executive summary. Journal of School Health, 74(7):231-232.
Brown, C. (2006). Relatively Equal Opportunity in the Armed Forces: Impacts on Children in
Military Families (Draft). Buddin, R., Gill, B. P., and Zimmer, R. W., (2001). Impact Aid and the Education of Military
Children, (DRR-2326-OSD). Santa Monica, CA: RAND, page 2. Buddin, R., Gill, B., & Zimmer, R. (2004). Examining federal Impact Aid’s reimbursement for
local school districts. Contemporary Economic Policy, 22(4), 534-543.
Butler, Tara. (2009). State Education Activities to Support Mission Growth. NGA Center for Best Practices. Issue Brief.
Chandra, A., Lara-Cinisomo, S. Jaycox, L.H., Tanielian, T., Burns, R.M., Ruder, T. & Han, B.
(2010). Children on the Homefront: The experience of children from military families. Pediatrics, 125:16-25.
Chandra, A., Martin, L.T., Hawkins, S.A., & Richardson, A. (2010). The Impact of Parental
Deployment on Child Social and Emotional Functioning: Perspectives of School Staff. Journal of Adolescent Health, 46(3):218-223.
Department of Defense and Department of Education Working Group. (n.d.). Progress Report on
DoD and ED Implementation of MOU – July-September 2008. Available at: http://www.militaryk12partners.dodea.edu/docs/reference_mouprogress_200807.pdf
Department of Defense and Department of Education. Memorandum of Understanding between
department of Defense and Department of Education, signed June 25, 2008. Available at: http://www.defense.gov/news/d20080625doddoe1.pdf
Department of Defense Education Activity. (n.d.-a). DoDEA data center, enrollment activity.
Available at: http://www.dodea.edu/datacenter/enrollment.cfm [2003–04 enrollment data, downloaded April 18, 2010].
Department of Defense Education Activity. (n.d.-b). Educational partnerships. Downloaded
April 18, 2010, from: http://www.dodea.edu/partnerships

Final Report May 24, 2011
57
Department of Defense. Demographics 2008; Profile of the Military Community. Downloaded March 24, 2011, from: http://cs.mhf.dod.mil/content/dav/mhf/QOL‐Library/Project20Documents/MilitaryHOMEFRONT/Reports/200820Demographics.pdf
Department of Defense. (2006). Report on Assistance to Local Educational Agencies for Defense
Dependents Education, November 7, 2006. Department of Defense. (2008). Update to the Report on Assistance to Local Educational
Agencies for Defense Dependents Education, March 2008. Department of Defense. (2009). Report on Assistance to Local Educational Agencies for Defense
Dependents Education, September 2009, pp. 19-23; and DoDEA website, downloaded April 18, 2010, from: http://www.militaryk12partners.dodea.edu/reference_SLOsexplained.html
Department of Defense. (2010). Update to the Report on Assistance to Local Educational
Agencies for Defense Dependents Education, June 2010. Department of Defense. (n.d.). Terms and acronyms. Downloaded April 20, 2010, from:
http://www.militaryhomefront.dod.mil/portal/page/mhf/MHF/MHF_DETAIL_1?section_id=20.40.500.130.0.0.0.0.0¤t_id=20.40.500.130.500.60.0.0.0
Engel, R., Gallagher, L., & Lyle, D. (2006). Military Deployments and Children’s Academic
Achievement: Evidence from Department of Defense Education Activity Schools. Prepared for the U.S. Military Academy. Working Draft as of 20 December 2006.
Ericsson, K.A. & Simon, H.A. (1980). Verbal reports as data. Psychological Review, 87, 215-
251. Evergreen Education Group. (2009). Keeping pace with K-12 online learning. Available at:
http://kpk12.com/wp‐content/uploads/KeepingPace09‐fullreport.pdf Figlio, D., & Hart, C. M. D. (2010). Competitive Effects of Means-Tested School Vouchers.
NBER Working Paper No. 16056. Goertz, M., & Stiefel, L. (1998). School-Level Resource Allocation in Urban Public Schools.
Journal of Education Finance. 23(4), 435-46. Grady, S., and Bielick, S. (2010). Trends in the Use of School Choice: 1993 to 2007 (NCES
2010-004). National Center for Education Statistics, Institute of Education Sciences, U.S. Department of Education. Washington, DC.
Jackson, M. “Education support for military families.” Leadership, March/April 2010: 12-14.

Final Report May 24, 2011
58
Kitmitto, S., Sherman, J., & Madsen, S. (2008). Evaluation of the Impact Aid Program. Washington, DC: U.S. Department of Education Office of Planning, Evaluation and Policy Development.
Means, B., Toyama, Y., Murphy, R., Bakia, M. & Jones, K. (2009). Evaluation of Evidence-
Based Practices in Online Learning: A Meta-Analysis and Review of Online Learning Studies. Prepared for U.S. Department of Education Office of Planning, Evaluation, and Policy Development Policy and Program Studies Service.
Military Child Education Coalition. (n.d.). Accessed March 20, 2010, from:
http://www.militarychild.org/about‐us/. National Center for Education Statistics. (2009). The Nation’s Report Card: Mathematics 2009
(NCES 2010–451). Institute of Education Sciences, U.S. Department of Education, Washington, D.C.
Shinseki, E.K. (2001). U.S. Army Secondary Education Transition Study (SETS) – Executive
Summary. Available at http://www.k12.wa.us/OperationMilitaryKids/pubdocs/USARMYExecutiveSummary.PDF.
Smrekar, C., Guthrie, J., Owens, D., & Sims, P. (2001). March Toward Excellence: School
Success and Minority Student Achievement in Department of Defense Schools. Prepared for the National Education Goals Panel.
Taylor, J., Chan, T., Chinen, M., Brodziak de los Reyes, I., Boyle, A., Tanenbaum, C., Petroccia,
M., & Carlson Le Floch, K. (2010). English Learner Student Achievement in Five States: Volume II—National Evaluation of Title III Implementation. Washington, DC: American Institutes for Research.
U.S. Census Bureau, Governments Division, Educational Finance and Special Statistics Branch,
“Public Elementary–Secondary Education Finance Data,” 2007–08, Final. U.S. Department of Commerce, U.S. Census Bureau, Geography Division, Cartographic
Products Management Branch, 2009 TIGER/Line® Shapefiles, Elementary, Secondary, and Unified School Districts.
U.S. Department of Education, National Center for Education Statistics, Common Core of Data
(CCD), “Local Education Agency (School District) Universe Survey Data,” 2008–09, Version 1a.
U.S. Department of Education, National Center for Education Statistics, Common Core of Data
(CCD), “Public Elementary/Secondary School Universe Survey Data,” 2007–08, Version 1b.

Final Report May 24, 2011
59
U.S. Department of Education, National Center for Education Statistics, Common Core of Data (CCD), “Public Elementary/Secondary School Universe Survey Data,” 2008–09, Version 1b.
U.S. Department of Education, National Center for Education Statistics, Common Core of Data
(CCD), “Public Elementary/Secondary School Universe Survey Data,” 2009-10, Preliminary.
U.S. Department of Education, National Center for Education Statistics, Education Finance
Statistics Center (EDFIN), Comparable Wage Index (CWI), 2005 School District CWI, Version 1a.
U.S. Department of Education, National Center for Education Statistics, Private School Universe
Survey, “Public-Use Data File,” 2007–08. U.S. Department of Education, Office of Planning, Evaluation and Policy Development, EDFacts
SY 2008–09, Washington, DC, 2010. U.S. Department of Education, Office of Planning, Evaluation and Policy Development, Policy
and Program Studies Service. (2008). State and Local Implementation of the No Child Left Behind Act, Volume IV—Title I School Choice and Supplemental Educational Services: Interim Report, Washington, D.C.
U.S. Department of Education, Office of Elementary and Secondary Education, Impact Aid
Program Data, SY 2008–09, Washington, DC, 2010.
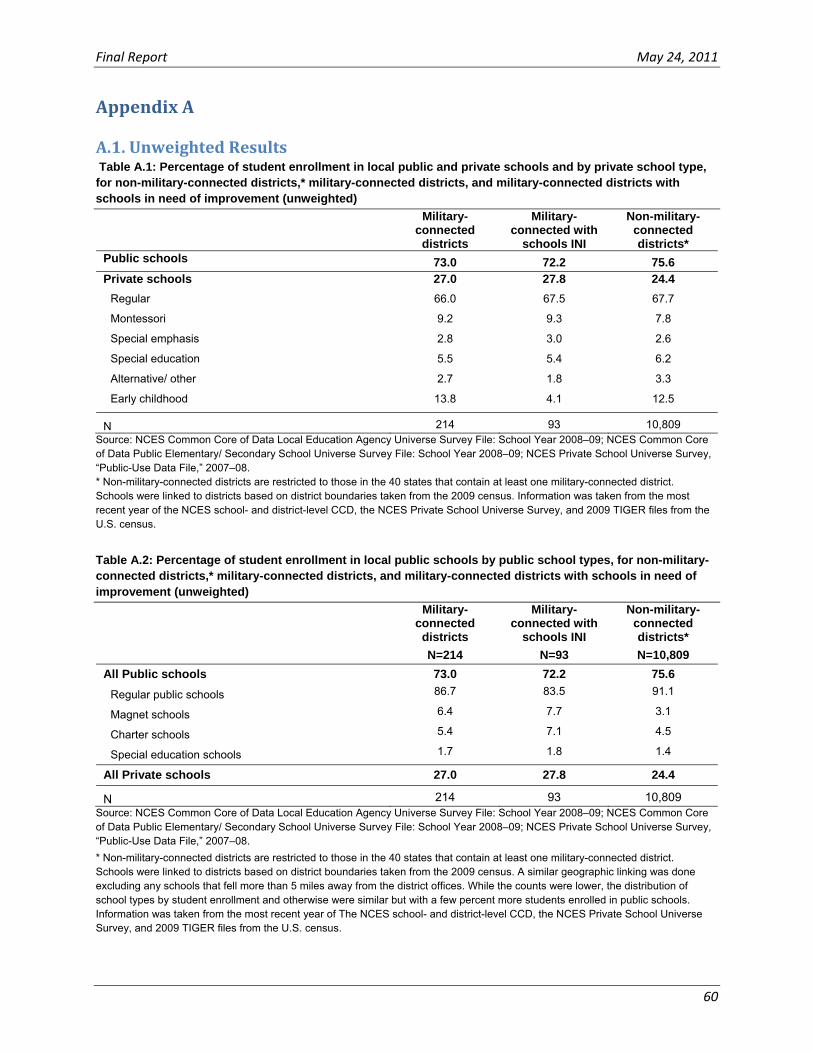
Final Report May 24, 2011
60
Appendix A
A.1. Unweighted Results Table A.1: Percentage of student enrollment in local public and private schools and by private school type, for non-military-connected districts,* military-connected districts, and military-connected districts with schools in need of improvement (unweighted)
Military-connected
districts
Military-connected with
schools INI
Non-military-connected districts*
Public schools 73.0 72.2 75.6 Private schools 27.0 27.8 24.4
Regular 66.0 67.5 67.7
Montessori 9.2 9.3 7.8
Special emphasis 2.8 3.0 2.6
Special education 5.5 5.4 6.2
Alternative/ other 2.7 1.8 3.3
Early childhood 13.8 4.1 12.5
N 214 93 10,809 Source: NCES Common Core of Data Local Education Agency Universe Survey File: School Year 2008–09; NCES Common Core of Data Public Elementary/ Secondary School Universe Survey File: School Year 2008–09; NCES Private School Universe Survey, “Public-Use Data File,” 2007–08. * Non-military-connected districts are restricted to those in the 40 states that contain at least one military-connected district. Schools were linked to districts based on district boundaries taken from the 2009 census. Information was taken from the most recent year of the NCES school- and district-level CCD, the NCES Private School Universe Survey, and 2009 TIGER files from the U.S. census.
Table A.2: Percentage of student enrollment in local public schools by public school types, for non-military-connected districts,* military-connected districts, and military-connected districts with schools in need of improvement (unweighted)
Military-connected
districts
Military-connected with
schools INI
Non-military-connected districts*
N=214 N=93 N=10,809
All Public schools 73.0 72.2 75.6
Regular public schools 86.7 83.5 91.1
Magnet schools 6.4 7.7 3.1
Charter schools 5.4 7.1 4.5
Special education schools 1.7 1.8 1.4
All Private schools 27.0 27.8 24.4
N 214 93 10,809 Source: NCES Common Core of Data Local Education Agency Universe Survey File: School Year 2008–09; NCES Common Core of Data Public Elementary/ Secondary School Universe Survey File: School Year 2008–09; NCES Private School Universe Survey, “Public-Use Data File,” 2007–08.
* Non-military-connected districts are restricted to those in the 40 states that contain at least one military-connected district. Schools were linked to districts based on district boundaries taken from the 2009 census. A similar geographic linking was done excluding any schools that fell more than 5 miles away from the district offices. While the counts were lower, the distribution of school types by student enrollment and otherwise were similar but with a few percent more students enrolled in public schools. Information was taken from the most recent year of The NCES school- and district-level CCD, the NCES Private School Universe Survey, and 2009 TIGER files from the U.S. census.

Final Report May 24, 2011
61
Table A.3: Percentage of student enrollment in districts offering online information about options for students with disabilities, programs for gifted/talented students, and dual enrollment for military-connected districts and military-connected districts with schools in need of improvement (unweighted)
Policies, programs and tailored information found on district websites
All military-connected
districts
Military-connected districts with schools INI
Percent Percent
Special education programs 92.5 98.9
Advanced coursework / options for gifted students 79.4 87.1
Dual enrollment 49.5 55.9
N 214 93 Information gathered from districts’ websites during the month of September 2010. For all of these categories participation must not be limited to students based on their location. Programs that are only available to students who live within a certain catchment area are excluded.
Special education – Information about programs or schools that offer special education services to disabled students or others with psychological or behavioral disturbances. In nearly every case this equates to special education schools and programs; it may also include programs for students without specific learning disabilities. For instance, in one case this includes an independent study program targeted at those who are likely to drop out or have other problems that prohibit regular attendance in their local high school.
Advanced coursework – Information about any program that offers elevated curriculum or instruction such as academic magnets, gifted programs, and other programs and schools offering advanced learning opportunities to students regardless of the location of their residence within the district
Dual enrollment – Information about programs that allow students to take college level courses for credit. Generally these involve partnerships between school districts and nearby community colleges
Table A.4: Percentage of student enrollment in districts with state-level or district-level open enrollment policies, for military-connected districts and military-connected districts with schools in need of improvement (unweighted)
All military-connected districts
Military-connected districts with schools INI
Percent Percent
State policies
Intra-district open enrollment policy 54.2 58.1
Inter-district open enrollment policy 65.9 62.4
District policies
Intra-district open enrollment policy 56.1 67.7
Inter-district open enrollment policy 44.4 49.5
N 214 93 All data were collected in September 2010. State-level data were collected from numerous sources on the internet, including state websites, news articles, websites of school choice advocates, NCES reports, and so forth. District-level data were gathered from districts’ websites.

Final Report May 24, 2011
62
Table A.5: Percentage of student enrollment in military-connected districts with state-level or district-level voucher and tuition tax credit policies, for military-connected districts and military-connected districts with schools in need of improvement (unweighted)
All military-connected districts
Military-connected districts with schools INI
Percent Percent
State policies
Voucher 16.8 14.0
Tuition tax credit scholarship 18.7 19.4
Voucher or tuition tax credit scholarship 25.2 19.4
District policies
Voucher 0.5 1.0
Tuition tax credit scholarship 1.4 1.0
Voucher or tuition tax credit scholarship 1.9 2.2
N 214 93 All data were collected in September 2010. State-level data were collected from numerous sources on the internet, including state websites, news articles, websites of school choice advocates, NCES reports, and so forth. District-level data were gathered from districts’ websites.
Table A.6: Percentage of student enrollment in districts with state-level or district-level online policies and options, for military-connected districts and military-connected districts with schools in need of improvement (unweighted)
Military-connected
districts Military-connected
with schools INI Percent Percent
“Keeping Pace with K-12 Online Learning” State virtual school or state led online initiative 79.9 91.4
State virtual school 61.2 65.6
State led online initiative 18.7 25.8
State has fulltime online schools 50.5 61.3
State has fulltime online schools for all students 22.0 28.0
District-level data collection
Online courses 37.9 47.3
N 214 93 Source: “Keeping Pace with K-12 Online Learning” (Evergreen Education Group, 2009) and information gathered from districts’ websites during the month of September 2010.

Final Report May 24, 2011
63
A.2. School Choice Data Collection Instrument Elements The following table lists the elements that make up the data collection instrument for gathering information about state and district school choice policies.
Variable Name State Form
District Form Variable Label / Prompt Possible Values
State X X The state in which district resides (two-letter state abbreviation, e.g., CA)
AK-WY
District X Name of military-connected district District name
LEA ID X NCES district identifier (LEAID) 9999999
State Level Summary of School Choice Policies
X
Short (two-paragraph maximum) summary of school choice policy at the state level, including the names of any relevant choice programs operated by the state
text
State Level Policies Citation / Notes
X Other notes or citations relating to state policy summary, including any relevant URLs
text and links
Open Enrollment X Does the state have an open enrollment policy in place?
yes | no | information not available
State Voucher Policy
X Does the state have a school voucher policy?
yes | no | information not available
State Tuition Tax Credit / Scholarships Program
X
Is there a tuition tax credit or similar scholarship program in place? yes | no | information
not available
Number of STOs / SFOs
X
If the state has a tuition tax credit or similar scholarship program how many school tuition organizations or scholarship funding organizations (STO/SFO) are operating within the state?
number of STOs/SFOs | information not available
Avg. Scholarship / Voucher
X
For states with vouchers or tax credit scholarships, what is the average yearly per pupil voucher or scholarship amount in dollars?
dollar amount | information not available | not applicable
Number of Children Participating
X
For states with vouchers or tax credit scholarships, how many children are participating in voucher or scholarship program?
number of children | information not available | not applicable
Number of Schools Participating
X
For states with vouchers or tax credit scholarships, how many schools are receiving students from the voucher or scholarship program?
number of schools | information not available | not applicable
State Policies for Military Families
X Provide a listing of any state education
policies related specifically to military families
text
Do State Policies X If the state has policies related text

Final Report May 24, 2011
64
Variable Name State Form
District Form Variable Label / Prompt Possible Values
for Military Families Increase Choice Options?
specifically to military families, do any of those policies increase school choice options for military families? Please include a description of the policy and how it impacts school choice
State Level Comments
X Provide any comments or citations that were not covered in the previous sections
text and links
District-Level Summary of School Choice Policies
X
Short (2 paragraph maximum) summary of school choice policy at the district level, including the names of any relevant choice programs operated by the state
text
District-Level Policy Citations / Notes
X Other notes or citations relating to district policy summary including any relevant URLs
text and links
Open Enrollment / Intra-District Transfer
X Does the district have inter-district transfer options?
yes | no |not available
Open Enrollment / Inter-District Transfer
X Does the district have intra-district transfer options?
yes | no |not available
District Voucher/Tuition Tax Credit Scholarships Policy
X
Does the district have a voucher, tuition tax credit scholarship program/policy in place, and if so is it clearly different from any state level policies/programs?
yes | yes and it differs from state | no | information not available
Dual Enrollment X Does the district offer a dual enrollment program/policy in place?
yes | no |not available
Programs for Special Needs Students
X
Does the district have programs for special needs students (including Special Education Programs for students with disabilities—Does not include gifted or advanced learning)?
yes | no |not available
Gifted Programs or Other Advanced Learning Programs
X
Does the district offer gifted programs or other advanced learning opportunities? yes | no |not available
Online Courses X Does the district offer online courses? yes | no |not available
Other School Choice Programs
X Please list any other choice options that are available at the district level
text
NCLB Choice Information
X
If specific information pertaining to NCLB school choice options is given for any district schools, indicate the URL where this information is found
URL | information not available
Contact Given for District Choice Options
X Is there contact information or a district department given that is specifically responsible for school
text and links or contact information | information not available

Final Report May 24, 2011
65
Variable Name State Form
District Form Variable Label / Prompt Possible Values
choice programs?
Information for or about Military Families / Local Military Installations
X
Is there any information on the district website which is intended for, or related to, military families? If so please describe the information and include the URL and any associated contact information.
text and links | information not available
District-Level Comments
X
Please list any other notes or comments about district-level school choice options. Please include necessary citations or links to relevant sources if not given elsewhere.
text and links
Overall Comments
X X
Please list any other notes or comments about district or state level school choice options not given elsewhere. Please include necessary citations or links to relevant sources if not given elsewhere.
text and links

Final Report May 24, 2011
66
A.3. Choice Options: Definitions for Data Collection
Note on choice options: All choice options collected in the instrument must allow application and/or enrollment from students living anywhere within the district. Neighborhood schools may have certain aspects of choice discussed below (e.g., a themed program or a special education program), but if that aspect (e.g., program) is not open to application/enrollment from students outside of the school’s catchment area (even though it may be made available by open enrollment) then that school/program is not considered an “option” under this study.
Open Enrollment/IntraDistrict Transfer (within District)
Open enrollment (or intra-district transfer) refers to an educational choice policy that allows students to enroll in any public school in their district, provided the school has not reached its maximum enrollment capacity. In some cases all schools within a district enroll only students who apply (all enrollment in these districts is open enrollment), while in others enrollment occurs in the standard fashion, matching students to schools based on their catchment area or home address, and additional empty spaces are open to those students who apply for them. Open enrollment should not be confused with school transfer options given to students enrolled in schools identified for improvement (aka “in need of improvement”, “program improvement,” consistently failing to make AYP, persistently dangerous, etc…) or deemed persistently dangerous under the Federal NCLB policy. For clarification about this type of choice see the instruction documents entry for the NCLB choice item on the district data collection sheet. If in doubt please ask task leader. Search terms: open enrollment, universal choice, intra-district transfer, transfer within district, transfer, admission, feeder pattern, catchment, neighborhood, voluntary transfer
Open Enrollment/InterDistrict Transfer (outside District)
Open enrollment (or inter-district transfer) refers to an educational choice policy that allows students to enroll in a public school outside the district, provided that school has not reached its maximum capacity number for of students. Search terms: open enrollment, universal choice, inter-district transfer, transfer, admission, voluntary transfer
Vouchers/Tuition Tax Credit Scholarship Program/Town Tuitioning
Good definitions of vouchers and tuition tax credit programs can be found here: http://en.wikipedia.org/wiki/School_choice A list of voucher and tuition tax credit programs is available here: http://www.edchoice.org/School-Choice/School-Choice-Programs.aspx (AIR does not know how comprehensive this list is, and it may be out of date. Please check the state and district websites before trusting its accuracy.) In short, a voucher is public money given to a family for them to spend at a private school of their choice.

Final Report May 24, 2011
67
A tuition tax credit scholarship accomplishes a similar goal, providing public money for students to spend on private schools, but it does so through different means. Tax credits are given for individuals who donate money to one of several school tuition organizations (STOs or in Florida SFOs – scholarship funding organizations), which then issue funds to students for enrollment in private schools. Town tuitioning is a program where a town provides students with vouchers to attend a public school or non-religious private school. These are only offered when the town is rural and does not have a school. These programs are available in Vermont and Maine. Search terms: voucher, tuition tax credit scholarship, School Tuition Organization, STO, SFO, town tuitioning
Magnet/Small Learning Community/Academy/Other Programs
Magnets are public schools that often have specialized curricula and are intended to draw students from a wider geographic area than regular public schools (hence the term magnet). The specialization can be a theme or focus like science, technology, art or vocational programs. Some magnets have competitive entrance requirements and may focus on providing elevated educational opportunities to students in comparison to curricula offered at traditional public schools. A Small Learning Community (SLC), a type of school within a school, subdivides a large school population into smaller, autonomous groups of students and teachers. These SLCs are often themed. An academy is another type of themed school or themed program within a school. Like magnet schools, academies can focus on specific areas like science, math, technology, or art. Academies can also have a vocational focus. Though many academies may happen to be charter schools, and it may not be practical for data collectors to try to differentiate which academies are and are not charters, any academies that are obviously charters (e.g., have charter in their name, or are listed on the page showing district charter schools) will not be counted since charters are being excluded from the data collection. Any other type of program which offers specialized curricula to students who live anywhere within the district, and which are not captured by other categories of choice should be included in this category as well. The magnets/SLCs/academies and other similar programs captured in this item must allow students living anywhere in the district to apply. (This is true for magnets by definition.) It’s important to note that magnets and other similar programs which offer higher level coursework, or advanced curriculum, should also be captured under the category for programs for gifted students or programs offering advanced coursework. That is, an “academic magnet” may be classified here as well as the category for gifted/advanced learning/IB, etc… Search terms: magnet, themed, small learning community, academy Common themes: Art, arts, music, technical, science, engineering
Dual Enrollment
Dual enrollment programs allow students to enroll in post-secondary courses, such as at a community college or university, when they are in high school. In these programs, students may take classes at an approved institution of higher education for credit toward their high school diploma, as well as for college credit.

Final Report May 24, 2011
68
(Note: This does NOT include AP courses because AP courses are specific to particular schools and do not offer options to students living anywhere in a school district.) Search terms: dual enrollment, university partnership, college credit (not AP), community college
Programs for Special Needs Students
Special education programs are designed for students with special needs, such as challenges with learning, communication challenges, emotional and behavioral disorders, physical disabilities, and developmental disorders. (Note: AIR is only looking for special education programs and schools that are open to students across the district.) Search terms: special education, IEP
Gifted Programs or Other Programs Offering Advanced Learning Opportunities
This category includes any programs such as those for gifted students or International Baccalaureate programs which offer higher level coursework, or advanced curriculum. Gifted programs are designed for children who have been identified as gifted or talented. International Baccalaureate (IB) is a scripted academic program that high school students can take to earn an IB diploma. There are IB schools and IB programs within schools. IB programs also exist at the elementary school level and may or may not be available to all students within the district. See the note below. While a particular program or school may be identified here as well as under the magnets/academies heading, DO NOT include dual enrollment courses. Also, AIR is interested in this section primarily in those identified as academically gifted. Musically gifted, athletically gifted, visual or performing arts programs and other programs not limited to academic or intellectually gifted children should be recorded in the section for magnets/academies/theme programs, but not here. Though AIR is not collecting information related to charter school options, if there are charters listed by the district which clearly provide the sort of advanced curriculum being focused on in this category, those schools or programs should be counted. There may be programs that fall in this category that we’ve not mentioned. If in doubt please ask Task leader for input. (Note: AIR is only looking for gifted/advanced learning/IB programs and schools that are open to students across the district.) Search terms: gifted, advanced learning, International Baccalaureate, IB, accelerated learning, challenging
Online Courses
Online courses allow students to take courses through online learning programs, or e-learning programs. These courses should offer core coursework and are different from online educational programs designed purely as a supplement to regular classroom instruction. These may be particularly common in more rural communities. Search terms: online, virtual, e-learning

Final Report May 24, 2011
69
Other search terms include during data collection: priority, lottery, waitlist, transportation, military, military families, school choice, school options, application Note: For this study, AIR uses other methods to capture information about charters and is not collecting information about them in the data collection sheet. But AIR does want collectors to be aware of what charters are so that they are not confused with the other choice options listed above.
Charter Schools Note: For this study, AIR uses other methods to capture information about charters and is not collecting information about them in the data collection sheet. But AIR does want collectors to be aware of what charters are so that they are not confused with the other choice options listed above. Charter schools are public elementary or secondary schools with more autonomy than non-charter, traditional public schools (especially having to do with teachers and the curriculum). Charters may be approved by school districts or state boards of education, and can be operated by private companies, universities, or various other organizations. In some states like Arizona the majority of charters may be considered their own school district and contain only a single school.
Allocation Systems Two types of allocation methods are identified on the checklist, 1) First-come-first-served or "Blind Admission,” and 2) Priority/Weighting/Application Criteria System. These items are not mutually exclusive since a district might use both methods for a single type of school choice. For instance a district may have multiple magnet schools, some of which use a simple first-come-first-served waitlist while others give priority to students who are siblings of already enrolled students or require certain application criteria to be met (e.g. GPA, or test scores). Please indicate any and all methods which are made explicit by the district website. In general, if in doubt please ask task leader for input.
1. Firstcomefirstserved/Blind Admission – These systems do NOT take into account students characteristics or abilities. Admission is given on a first-come-first-served basis and a wait list is often used to determine the order of admission.
2. Priority/weighting/application criteria system – Priority, weighting, and application criteria systems are bound together to represent any allocation method that is not first-come-first-served or “blind admission.” These include both systems where preference or weight is given to students who meet certain characteristics as well as systems which limit participation to those meeting certain requirements. Or simply, any system that is not a first-come-first-serve waitlist.
Other Notes/Definitions “Catchment area” is the local area and population from which a public school has students
assigned to it.
Feeder schools /feeder school continuity and other terms indicate a priority is given to students in lower levels schools which typically feed into a higher level school. For instance a middle school may have 90 of its students come from a single elementary school. This
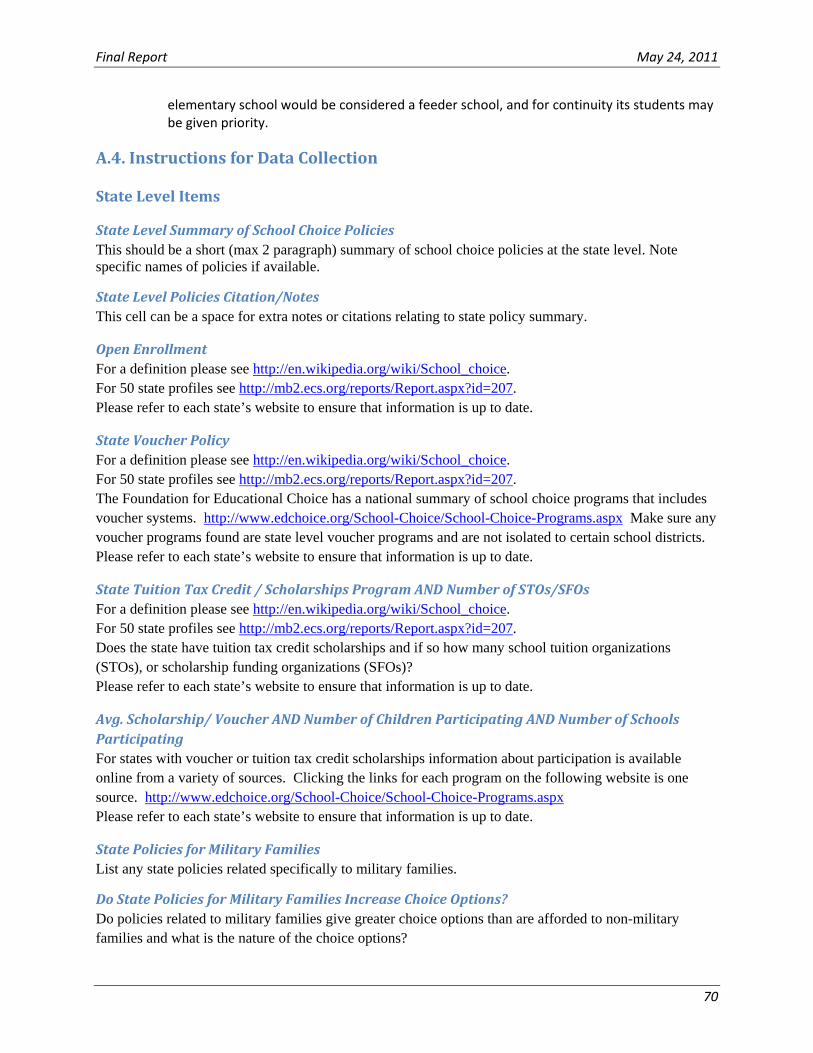
Final Report May 24, 2011
70
elementary school would be considered a feeder school, and for continuity its students may be given priority.
A.4. Instructions for Data Collection
State Level Items
State Level Summary of School Choice Policies This should be a short (max 2 paragraph) summary of school choice policies at the state level. Note specific names of policies if available.
State Level Policies Citation/Notes This cell can be a space for extra notes or citations relating to state policy summary.
Open Enrollment For a definition please see http://en.wikipedia.org/wiki/School_choice. For 50 state profiles see http://mb2.ecs.org/reports/Report.aspx?id=207. Please refer to each state’s website to ensure that information is up to date.
State Voucher Policy For a definition please see http://en.wikipedia.org/wiki/School_choice. For 50 state profiles see http://mb2.ecs.org/reports/Report.aspx?id=207. The Foundation for Educational Choice has a national summary of school choice programs that includes voucher systems. http://www.edchoice.org/School-Choice/School-Choice-Programs.aspx Make sure any voucher programs found are state level voucher programs and are not isolated to certain school districts. Please refer to each state’s website to ensure that information is up to date.
State Tuition Tax Credit / Scholarships Program AND Number of STOs/SFOs For a definition please see http://en.wikipedia.org/wiki/School_choice. For 50 state profiles see http://mb2.ecs.org/reports/Report.aspx?id=207. Does the state have tuition tax credit scholarships and if so how many school tuition organizations (STOs), or scholarship funding organizations (SFOs)? Please refer to each state’s website to ensure that information is up to date.
Avg. Scholarship/ Voucher AND Number of Children Participating AND Number of Schools Participating For states with voucher or tuition tax credit scholarships information about participation is available online from a variety of sources. Clicking the links for each program on the following website is one source. http://www.edchoice.org/School-Choice/School-Choice-Programs.aspx Please refer to each state’s website to ensure that information is up to date.
State Policies for Military Families List any state policies related specifically to military families.
Do State Policies for Military Families Increase Choice Options? Do policies related to military families give greater choice options than are afforded to non-military families and what is the nature of the choice options?

Final Report May 24, 2011
71
State Level Comments List any other comments that may be important for understanding state information pertaining to school choice.
District Level Items
District Level Summary of School Choice Policies Because reality doesn’t always fit perfectly into checkboxes, please use this area to summarize textually school choice in the district. This should be seen as an optional item that can be used at the discretion of the data collector.
District Level Policy Citations/Notes This is a cell that can be used to record any other important citations or notes that may be needed to help understand the district information that’s recorded in the other cells.
Sections for Various Options (Open enrollment/vouchers/magnets, etc…) Here’s an image showing one of the sections we are referring to. Note what we refer to in the text below as top, second, and third level items below.
Descriptions and definitions of these types of choice option programs can be found in the definitions document. The definitions document also includes some information that will help to distinguish the various types of student allocation methods.
Top Level Item For each type of choice option, if district offers the option and district students can participate regardless of their residence location then indicate ‘yes.’ If district provides no information then indicate ‘not available.’ If the district clearly states that it does not offer a certain type of option then indicate ‘no.’
Second Level Items The second level items (First-come-first-served or "Blind Admission" and Priority/Weighting/Application Criteria System) can be left blank (skipped) if the top level item indicating the existence of a choice
Top Level Item
Second Level
Third Level

Final Report May 24, 2011
72
option in a district is ‘no’ or ‘not available’. Otherwise, if the district does offer that type of choice, then both of the second level items should be filled out. The two second level items are not mutually exclusive. For instance, a district might have two magnet schools and one uses first-come-first-serve, and the other uses a priority based lottery system. Further discussion is given in the definitions document.
Firstcomefirstserved or "Blind Admission" If the district says that it allocates spaces using a waitlist, or admits students on a first-come-first-served basis, then indicate ‘yes.’ If the district does not state how they handle admittance or participation in the program then indicate ‘not available.’ If they state that other methods are used or state explicitly that waitlists are not used then indicate ‘no.’
Priority/Weighting/Application Criteria System If the district says that it allocates spaces using any system which gives priority to certain student groups, or is restricted to students who meet certain requirements, then indicate ‘yes.’ If the district does not state how they handle admittance or participation in the program then indicate ‘not available.’ If they state that other methods are used or state explicitly that preference is not given to any students then indicate ‘no.’
Third Level Items The third level items only need to be filled out if a priority/weight based/application criteria system is used, otherwise these items can be skipped over and left blank. For each type of category please indicate if it’s a consideration in admitting students into the program. If a particular category is used to allocate spots to students, indicate so by entering a ‘1’, otherwise if a particular category is not mentioned, or if the district states explicitly that they don’t take that factor into consideration, then indicate that by entering a ‘0.’ In other words, 1 = yes, and 0 = no or information not available. If there are student factors or characteristics mentioned by the district that are not in the checklist, please include these in the “other” category.
Other School Choice Programs If there are other programs that offer choice options to students living anywhere within the district, and you feel that these are important or relevant, please describe these programs. Alternatively you can skip the item leaving it blank.
NCLB Choice Information Under Federal NCLB mandates, schools that fail to make adequate yearly progress (AYP) two years running must offer students the opportunity to transfer to higher performing schools. We are interested in whether or not districts are making these options clear to parents through the district website. We are not however interested in general descriptions of NCLB policy and related terms. What we want to capture are cases where the district has made some effort to inform parents that they may be eligible for this type of school choice.

Final Report May 24, 2011
73
For this item, if the district does offer specific information about NCLB choice options that may be available to parents of students enrolled in the district please indicate the URL of the page that gives this information. We may follow up on these districts later to investigate what type of information is being given and how it’s being given. If no information is found indicate ‘not available.’
Contact Given for District Choice options For this item we are interested in whether the district has a specific department or person who is responsible for providing information to parents about school choice, or administering or overseeing certain types of school choice. If there is a person or group listed by the district please include either their contact information (email is fine), or a link to the page that provides that information. If no information is found indicate ‘not available.’
Information for or about Military Families/local military installations We’d like to know whether or not the district provides information aimed specifically at military families or their children. If it does, please briefly describe the nature of that information or include a link to the page. If no information is found indicate ‘not available.’
District Level Comments If any additional comments are needed to understand the information collected for the district, or there was other information the district provided which might be relevant please feel free to include that information here. Alternatively you can skip the item, leaving it blank.

Final Report May 24, 2011
74
Appendix B
Appendix B.1. Interview Protocol
DoDEA – School Liaison Officer (SLO) Interview Respondent: Title (if not SLO): Date: Interviewer: Branch: Consent form received: Note-taker: State: Length of interview:
Thanks again for taking the time to speak with me this morning/afternoon. ____ is also here with me, taking notes during our conversation. As explained in the consent form, this project is funded by the DoD Education Activity (DoDEA). As part of our project, we are assessing the challenges faced by parents of military families in securing high quality educational options for their children, in particular when their child's public school is identified for improvement. We will be creating a report that will summarize the findings across all of our SLO interviews. Before we start, I would like to cover some logistical issues. This interview will take about 60 to 90 minutes. You are free to end it at any time and to pass on any question you do not wish to answer. I would like to assure you that all information obtained today will only be used for purposes of this study to share your insights into the challenges parents face in securing high quality education for their children. We will not be using your name in the report but we may possibly include quotes from this interview, however they will not be attributed to you. I’d like permission to record our conversation for note taking purposes. No one outside the research team will listen to the recording unless you give your permission. If at any point you would like me to turn the recorder off, just let me know. Would that be OK? Do you have any questions before we begin?

Final Report May 24, 2011
75
I: SLO Background I’d like to start by learning a bit about your background.
1. How long have you served as a SLO? 2. What is your educational background?
3. Can you briefly describe any previous work experience that is relevant to your role as a
SLO (e.g., district administrator, teacher, counselor)?
II: SLO Role and Responsibilities Next, I would like to talk to you about your role and responsibilities as a SLO.
4. How would you describe or define your role as a SLO?
5. [If not covered above] What are your main responsibilities as a SLO? How many parents or families are you responsible for and how many do you interact
with? Do you spend equal time with each parent or family, or are there some that require more
attention from you than others? What percent of families are associated with active duty versus reserve or National
Guard? How do you communicate with parents and what do you communicate about? How often does this communication take place? Similarly, how many districts and/or schools do you interact with? Who are your point of contacts and how do you communicate with them? How often does this communication take place and what do you communicate about? Finally, how do you communicate with military leadership and who do you communicate
with? How often does this communication take place and what do you communicate about?
III: Characteristics of Local Districts and Schools Now I would like to ask you about the characteristics of the local districts and schools in your area to get a sense of the overall quality of schooling and schooling options. Did you get a chance to review the data profile we sent to you in advance?
6. Let’s start with the accuracy of the district demographic information. How accurate is the information we sent you about the district(s) you indicated that you work with in terms of its/their:
Grade span? Student enrollment? Location? AYP status? Performance level?
7. How about the accuracy of the school level information in terms the:
Number of schools?

Final Report May 24, 2011
76
Type of schools? Their AYP status?
8. How would you describe the quality of schools in terms of their:
Class sizes? What is the general class size and is there a difference across grade levels? Quality of staffing? Quality of facilities? Level of resources (funding, materials, technology)? Availability of electives and extracurricular activities? Other quality indicators?
9. Is there a difference in school quality across elementary and secondary schools? [IF YES]
Please explain what these differences entail.
10. Let’s look at the school choice policies in [STATE]. How accurate is this information as far as you know?
11. How about the school choice options in the district(s) you work with. How accurate is this
information in terms of availability of [TAILOR TO AVAILABLE SCHOOL CHOICE OPTIONS]:
Magnet schools or programs? [IF AVAILABLE] What is the quality of these schools and programs?
Charter schools? [IF AVAILABLE] What is the quality of charter schools? Private schools? [IF AVAILABLE] Which ones are available (e.g., religious, other)? What
is the quality of these schools? Intra- or inter-district transfers? Also known as open-enrollment public schools. School vouchers? Dual enrollment? Special education schools or programs? [IF AVAILABLE] What is the quality of these
schools and programs? Gifted programs? Online programs?
IV: Challenges Faced by Parents As you know, the main focus of this study is to understand the challenges parents face in securing quality schooling options for their children.
12. Let’s begin with parents’ involvement in and use of local schooling options. On average, what is the level of involvement of parents in choosing schooling options for
their children? How about their level of knowledge of local schooling options? To what extent do parents choose regular public schools for their children? And what are
the reasons for this choice (e.g., good quality regular public schools, lack of other school choices, cannot afford private schools)?
To what extent do parents choose other schooling options for their children? And what are the reasons for these choices? [GO THROUGH EACH CHOICE BUT ONLY ASK IF AVAILABLE IN LOCAL AREA]
o Magnet schools or programs o Charter schools o Private schools o Intra- or inter-district transfers (open-enrollment public schools)

Final Report May 24, 2011
77
o School vouchers o Dual enrollment o Special education schools or programs o Gifted programs o Online programs o Homeschooling [ASK OF EVERYONE]
13. To what extent does school quality affect military families’ plans to relocate?
To what degree are families able to choose to relocate or to stay in their current location if desired?
Are interstate compacts available for parents in your state? [IF YES] To what degree do parents use these compacts and how useful are they?
Are parents able to choose their place of residence in the local area to have better access to quality public schools? [IF YES] To what degree do parents do this?
14. When having to relocate, what are some of the transition issues that military families
struggle with? Academic issues (e.g., different curricula, teachers, classmates)? Social issues (e.g., lack of friends)? Emotional issues (e.g., trouble adapting to new environment)? Practical issues (e.g., having to find/move into new home)?
15. To what extent are parents who have children with unique needs able to meet their
educational needs? What are the educational options for children: With physical impairments? With learning disabilities? With social/emotional needs? Who are English learners? Who are gifted or talented?
16. Are there other challenges that parents face in securing quality schooling options for their
children that we have not already discussed?
V: Military Leadership Involvement Next, I’d like to ask you about the level of involvement of military leadership in your military installation.
17. What is the level of involvement of military leadership in educational issues? What are their perceptions of the ability to secure quality schooling options for military
families? To what extent do they interact and communicate with parents around these issues? To what extent do they interact and communicate with districts and schools around these
issues?
VI: SLO Solutions to Challenges Finally, I’d like to ask you about some possible solutions to the challenges we have discussed.
18. Overall, what are possible solutions you see as a SLO in securing quality schooling options for military families?

Final Report May 24, 2011
78
19. [IF MENTIONED ABOVE] How about solutions for families around relocation and transition issues?
20. [IF MENTIONED ABOVE] What about solutions for improving educational options for
subgroup populations (i.e., special education students, English learners, gifted and talented students)?
21. [IF MENTIONED ABOVE] How about solutions to working with military leadership around
these issues?
22. What are ways that SLOs can work more effectively with local districts and schools?
23. Based on your experience, what advice would you give to other SLOs about securing quality schooling options for military families?
VII: Other Issues
24. Is there anything else you would like to tell me about the challenges you face as a SLO and/or parents face in securing quality schooling options for their children?
Thank you very much for taking the time to speak with us today!

Final Report May 24, 2011
79
Appendix B.2. Interview Topics
DoDEA – School Liaison Officer (SLO) Interview Topics I: SLO Background
1. Length of tenure
2. Educational background
3. Relevant work experience
II: SLO Role and Responsibilities
4. Description of SLO role
5. Main responsibilities as SLO
III: Characteristics of Local Districts and Schools
6. Accuracy of local district demographics (information will be provided prior to interview)
7. Accuracy of local school level information (information will be provided prior to interview)
8. Description of the quality of local schools (from the point of view of SLO during interview)
9. Accuracy of school choice options in local area (information will be provided prior to interview)
IV: Challenges Faced by Parents
10. Parents’ involvement in and use of local schooling options
11. Extent to which school quality affects military families’ plans to relocate
12. Transition issues that military families struggle with
13. Extent to which parents who have children with unique needs are able to meet their educational needs
14. Other challenges that parents face in securing quality schooling options for their children
V: Military Leadership Involvement
15. Level of involvement of military leadership in educational issues
VI: SLO Solutions to Challenges
16. Overall solutions in securing quality schooling options for military families
Final Report May 24, 2011
80
17. Solutions for families around relocation and transition issues
18. Solutions for improving educational options for subgroup populations 19. Solutions to working with military leadership around these issues
20. Ways that SLOs can work more effectively with local districts and schools
21. Advice to other SLOs about securing quality schooling options for military families
VII: Other Issues
22. Anything else about the challenges faced by SLOs and/or parents in securing quality schooling options for children

Final Report May 24, 2011
81
Appendix B.3. Sample District and School Data Profile
District and School Data Profile for Locale #7 (VA)
District Characteristics: Demographics and Performance
District Grade Span
Student Enrollment
Location Met AYP
District Improvement
Status
Math: % Passed
English: % Passed
District #1 PK‐12 34,431 City No No 78% 83%
District #2 PK‐12 21,806 City No No 82% 83%
District #3 Pk‐12 2,491 Suburb No No 91% 94%
Sources: NCES Common Core of Data Local Education Agency Universe Survey File: School Year 2008–09; NCES Common Core of Data Public Elementary/Secondary School Universe Survey File: School Year 2008–09; EdFacts School and LEA AYP data, School Year 2008–09, Virginia Department of Education. Retrieved on September 1, 2010, from http://www.doe.virginia.gov
School Characteristics: Demographics and Performance
District # Schools Total
Elem. Middle High K‐12 6‐12 Other# Schools That Met
AYP
# Schools That Did Not Meet
AYP
# of Schools Not Required to Meet AYP
District #1 51 37 9 5 0 0 0 33 16 2
District #2 35 24 7
4 0 0 0 19 15 1
District #3 4 2 1 1 0 0 0 4 0 0
Sources: NCES Common Core of Data Local Education Agency Universe Survey File: School Year 2008–09; NCES Common Core of Data Public Elementary/Secondary School Universe Survey File: School Year 2008–09; EdFacts School and LEA AYP data, School Year 2008–09.
State School Choice Policies Virginia has a public school open enrollment policy but it does not have a private school choice program.
The state has a limited charter school law and it allows for limited public virtual schooling. Virginia has a
k‐12 scholarship program, CHOICES, which is funded by the Clare Booth Luce Policy Institute. During the
2008 General Assembly Session, HB 767 was passed, which allows parents to provide a program of study
or curriculum which may be delivered through a correspondence school or a distance learning program
or in any other manner to meet the requirements for home instruction. In addition, the state has a
school choice policy for military children. The House Bill 1443 ensures that students whose parents are
deployed outside the United States will continue to be admitted to public schools in the Commonwealth
without tuition. Sources: Virginia Department of Education Online. Retrieved on August 31, 2010, from http://www.doe.virginia.gov/ ; "School
Choice in Virginia | The Foundation For Educational Choice." Home | The Foundation For Educational Choice. Retrieved on

Final Report May 24, 2011
82
September 1, 2010, from http://www.edchoice.org/School‐Choice/State/VA.aspx; “Virginia | The Heritage Foundation."
Conservative Policy Research and Analysis | The Heritage Foundation. Retrieved on September 1, 2010, from
http://www.heritage.org/applications/schoolchoice/va
District School Choice Options School Choice District #1 District #2 District #3
Number of Magnet Schools 4 1 0
Number of Charter Schools 0 1 0
Number of Private Schools 28 13 0
Intra‐District Transfer No Yes Yes
Inter‐District Transfer No No Yes
Vouchers No No No
Dual Enrollment Yes No No
Special Ed. Schools/Programs Yes Yes Yes
Gifted Programs Yes Yes Yes
Online Programs No Yes No
Source: School District #1 Website. Retrieved on August 30, 2010; School District #2 Website. Retrieved on September 1, 2010;
School District #3 Website. Retrieved on September 1, 2010; NCES Common Core of Data Local Education Agency Universe
Survey File: School Year 2008–09; NCES’ 2007‐2008 Private School Universe Survey Data:
http://nces.ed.gov/surveys/pss/pssdata.asp; US Census Bureau, 2009 TIGER/Line® Shapefiles, District Boundaries:
http://www2.census.gov/cgi‐bin/shapefiles2009/national‐files
Note: Counts based on CCD and Census data are preliminary and subject to change. Some private schools may not be captured
by the Private School Universe Survey. Counts taken from CCD/Census linkage are limited to schools listed as operational in
2008‐2009 and schools that are listed as either regular, special education, or are missing the CCD school type indicator. Note
that some programs for special needs students may be classified by CCD’s type indicator as “other” and are therefore not
counted in our tabulations. For the yes/no items, information is based on what was found on the district website and “no” is
equivalent to “not available”.