Embed Size (px)
Citation preview
EDUCATIONAL OPPORTUNITY GAP OVERSIGHT AND ACCOUNTABILITY COMMITTEE July 31, 2012
Educational Service District 113
6005 Tyee Dr SW
Tumwater, Washington 98512
8:30 am - 5:15 pm
8:30-8:45 Introductions and Updates
8:45-9:30 Elementary and Secondary Education Act (ESEA) Flexibility Waiver
Bob Harmon, Assistant Superintendent of Special Programs and Federal Accountability
Sue Cohn, Ed.D. School Improvement Specialist
9:30-10:15 Committee Participation Update
Compensation Technical Working Group-Frieda Takamura, Sili Savusa (15 min –
presentation & questions)
Quality Education Council-Adie Simmons (15 min – presentation & questions)
Data Governance Work Group-James Smith (15 min – presentation & questions)
10:15-10:55 State Board of Education Presentation on Graduation Requirements and Achievement Index
Sarah Rich, Policy Director
Linda Drake, Senior Policy Analyst
10:55-11:40 Legislative and Budget Update
Kelci Karl-Robinson, Director of Financial Policy and Research
11:40-12:00 Public Comment
12:00-1:15 Working Lunch-Continuance of morning conversations and EOGOAC Statutory Charge and
Policy Recommendations Review and Discussion
Maria Flores, Associate Director of Innovation, Research and Policy
1:15-2:00 The Parent’s Union
Mary Bergstrom, Director of Membership
Eddie Sumlin, Associate Director of Membership
2:00-2:45 Teach for America-Puget Sound
Lindsay Hill, Executive Director
2:45-3:30 The Martinez Foundation
Holli Martinez, Co-Founder and President
Evie Livingston, Program Director
Martinez Foundation Fellows: Anthony Longoria-3rd
year teacher at Garfield HS, Monico
DeLeon-4th year teacher at Selah School District, Joana Chacon-3
rd year teacher at
Mercer Middle School, Marina Pita-2nd
year teacher Concord Elementary
3:30-4:15 Washington Educator Skills Test-Basic and Endorsement
Patti Larriva, Director of Educator Assessments, Professional Educator Standards Board
David Brenna, Senior Policy Analyst, Professional Educator Standards Board
4:15-5:00 Recruiting Washington Teachers program
Mea Moore, Director of Educator Pathways, Professional Educator Standards Board
5:00-5:15 Public Comment
Meeting Notes Educational Opportunity Gap Oversight and Accountability Committee July 31, 2012 Committee Members and alternates in attendance: Adie Simmons, Office of the Education Ombudsman (OEO) Andrew Kelly, Alternate for Randy Dorn Ben Kodama, Alternate for Frieda Takamura Fiasili Savusa, Commission on Asian Pacific American Affairs (Pacific American) Frieda Takamura, Commission on Asian Pacific American Affairs (Asian American) Dr. James Smith, Alternate for Wanda Billingsly Lillian Ortiz-Self, Commission on Hispanic American Affairs Representative John McCoy, House of Representatives Representative Sharon Tomiko Santos, House of Representatives Senator Steve Litzow, Senate Sharonne Navas, Alternate for Lillian Ortiz-Self Wanda Billingsly, Commission on African American Affairs Staff and Public in attendance: Anthony Longoria, the Martinez Foundation Bob Harmon, Assistant Superintendent of Special Programs and Federal Accountability Dave Powell, Stand for Children David Brenna, Senior Policy Analyst, PESB Donna Hanson, Executive Assistant- OSPI Ed Prince, Commission on African American Affairs Eddie Sumlin, Associate Director of Membership, The Parent’s Union Evie Livingston, the Martinez Foundation Holli Martinez, Co-Founder and President- the Martinez Foundation Jackie LeSage, Samoan National Nurses Association Joana Chacon, the Martinez Foundation Kelci Karl-Robinson, Director of Financial Policy and Research Lidia Mori, Senate Early Learning and K12 Community Linda Drake, Senior Policy Analyst State Board of Education Lindsay Hill, Executive Director, Teach for America-Puget Sound Maggie Wilkens, LEV Maria Flores, Associate Director, Innovation Research and Policy-OSPI Marina Pita, the Martinez Foundation Mary Bergstrom, Director of Membership-The Parent’s Union Mea Moore, Director of Educator Pathways, PESB Monica De Leon, the Martinez Foundation Patti Larriva, Director of Educator Assessments, PESB Rosalund Jenkins, League of Education Voters Sarah Rich, Policy Director- State Board of Education Sue Cohn, Ed.D School Improvement Specialist Committee Members not in attendance: Bernard Thomas, Tribal Nations Governor’s Office of Indian Affairs Superintendent Randy Dorn, Office of Superintendent of Public Instruction (OSPI) Representative Kevin Parker, House of Representatives
Meeting Notes Educational Opportunity Gap Oversight and Accountability Committee July 31, 2012 Senator Rosemary McAuliffe, Senate Senator Steve Hobbs, Senate Superintendent Randy Dorn, OSPI Introductions and Updates The meeting was called to order at 8:39 a.m. by the Committee Chairman, Representative Santos. Committee introductions were made. Presenters and public introductions were made. Elementary and Secondary Education Act (ESEA) Flexibility Waiver Presenter: Bob Harmon, Assistant Superintendent of Special Programs and Federal Accountability Presenter: Sue Cohn, Ed.D. School Improvement Specialist
Inefficient to disaggregate data too broadly. Problematic not to have further disaggregated data for the Asian Pacific Islander population. Clarify which line represents the Hispanic population. Important to include disaggregated data of African American student populations as well.
Charter schools are on the horizon. We should mandate 100 percent success versus 50 percent success for student populations. What do I tell my community about what can be perceived as lower standards?
The committee and communities need to be provided a list of acronyms. The Department of Early Learning has a model that could serve as an example.
Was there an analyses conducted about the goal (50 percent vs. 100 percent). If you haven’t done the analyses to meet 100 percent by 2020, how do you know if it is doable?
Follow up on social/emotional learning and requests for PBIS and social/emotional services. OSPI has said that Title I funds are not to be used for these types of services.
It feels like we are moving the achievement gap to a different system. We need to understand how we incorporate the research and information from the various communities.
Committee Participation Update Presenter: Frieda Takamura, Commission on Asian Pacific American Affairs (Asian American) Presenter: Fiasili Savusa, Commission on Asian Pacific American Affairs (Pacific American)
Compensation Technical Work Group- A request was made for a full presentation of the findings of the Work Group to this committee in the future.
The final Report is posted on the OSPI Web site. Maria will send the link to the report to the committee members.
Presenter: Adie Simmons, Office of the Education Ombudsman (OEO) The council last met in December 2011, with the next meeting scheduled for August. They will connect
with the Compensation Technical Work Group at that time. There was a discussion of the QEC recommendations including Early Learning and Transitional Bilingual
Program. In addition, it was noted that the McCleary discussion has the possibility to change the dynamics.
Presenter: Dr. James Smith, Alternate for Wanda Billingsly This committee is definitely data driven. It is charged with ensuring the committee makes data
understandable, with an effort to eliminate the duplication of reporting requirements by the state and federal government.
We need people who can interpret the data and help communities understand the individual student’s needs.
Meeting Notes Educational Opportunity Gap Oversight and Accountability Committee July 31, 2012
What type of progress is the committee making in getting data from the districts? o There is a burden on schools/districts to generate data. Much of the data being generated is to
satisfy the state and the federal government requirements. We are striving to avoid some of the duplication and satisfy the need for the information.
It’s a mix on how much data the schools are providing. It depends on training and resources. Schools need a standardized system for reporting data; however, there is no funding source to meet this need.
We need data which shows the disciplinary impacts on different student groups particularly students of color and special education. Also, we need collection of data around the diversity of the work force in schools and what type of preparation they receive.
State Board of Education Presentation on Graduation Requirements and Achievement Index Presenter: Sarah Rich, Policy Director Presenter: Linda Drake, Senior Policy Analyst Sarah Rich, Policy Director, SBE. Washington Achievement Index
The comment was made that it would be helpful to see the data separated by elementary and high school. Another comment on the grace period provided for ELL students- The current index takes into account three years of data for ELL students. Federal laws states one year proficiency.
Are there provisions in place for students with other identified language deficiencies? Are there accommodations available?
o Growth Index is included in the accountability system. There are concerns about increasing the number of graduates without addressing the amount of
remediation. Raised concerns regarding the shortage of math teachers, and appreciated the comment of not marginalizing students. A frequent concern from parents is that graduation requirements are not aligned with the college admission standards.
Legislative and Budget Update Presenter: Kelci Karl-Robinson, Director of Financial Policy and Research
We need to identify areas where we should request full presentations to the committee. Request for a full presentation on Collaborative Schools and the Truancy Laws and a full presentation on the Educator Sign Language Interpreter Standards.
Request for a list of acronyms to share with the various communities.
Public Comment: The public was invited to provide comment. No members of the public asked to speak. Working Lunch-Continuance of morning conversations and EOGOAC Statutory Charge and Policy Recommendations Review and Discussion Presenter: Maria Flores, Associate Director of Innovation, Research and Policy
SBE chart needs to be disaggregated including higher education and community and technical colleges. We are not mandated to provide an interim report, but there is value in the report in sharing information
with our communities. We provided an interim report to members earlier this year. The annual report is a legislative mandate.
Meeting Notes Educational Opportunity Gap Oversight and Accountability Committee July 31, 2012
The committee needs to review what OSPI is using in terms of cultural competence and the standards we are asking teachers to use. How can the committee get this information? Each ethic committee group should have received a request to appoint a member to the Student Achievement Council.
Reminder that when we talk about cultural competent staff, we need to address retention of culturally competent staff.
Mandate to support and facilitate parent and community involvement and outreach. There is a lack of uniformity across the state about what this means.
We need cultural relevance for each group. Add the administrators/principals who also experience the same type of marginalization. What types of mentoring programs are put in place for teachers and administrators?
The Parent’s Union Presenter: Mary Bergstrom, Director of Membership Presenter: Eddie Sumlin, Associate Director of Membership
The Parents Union is a new nonprofit founded by Scott Oki. Scott Oki wrote Outrageous Learning. They are a values-based organization with a foundation of family value. The organization launched in January. Their web site will be available in September with parent resources. They serve as a navigator for parents directing them to resources.
Five essential ingredients for each student’s success: a great teacher, empowered school leaders, great curriculum, safe school environment and engaged and empowered parents and community.
One goal is uniting a diverse community of parents to help their students achieve in school while placing value in the parents’ contributions.
There were several questions submitted by members attempting to fully understand this organization and their purpose. Suggestions were made to the presenters that the organization needs to do their homework about how to approach the different communities, particularly non-English speaking communities.
You’re not a direct service organization or a political advocacy group. Still struggling with understanding what the organization does. Need to understand how you communicate with the communities. Need to do your homework about how to approach the different communities, particularly non-English speaking communities.
Teach for America-Puget Sound Presenter: Lindsay Hill, Executive Director
Teach for America is a 21 year old organization with 10,000 teachers this year. One-third of their teachers are identified as teachers of color. Teachers are located in schools in Seattle School District, Federal Way School District, and new this year to the Renton School District.
What is your retention rate of teachers of color vs. white teachers? o Seventy-eight percent stay after their first year, and ninety-two percent remain after their
second year. These numbers are based on national-level data. There are tensions around this program with teachers and teachers union. Can you talk a bit about this?
o All teachers are members of their teacher unions, and TFA works with the Washington Education Association (WEA) as well. TFA applicants go through the same hiring process as other candidates. Teachers work hard to collaborate with all the teachers. There are long term teachers from this program.
Meeting Notes Educational Opportunity Gap Oversight and Accountability Committee July 31, 2012
Educational system has a hard time recruiting diverse staff. What is your secret to recruiting a diverse staff? What other strategies do you use? o Partnering with colleges and student representatives in all fields since they are not just focusing on
the education field. The Martinez Foundation Presenter: Holli Martinez, Co-Founder and President Evie Livingston, Program Director Martinez Foundation Presenter: Anthony Longoria-3rd year teacher at Garfield HS Presenter: Monica DeLeon-4th year teacher at Selah School District Presenter: Joana Chacon-3rd year teacher at Mercer Middle School Presenter: Marina Pita-2nd year teacher Concord Elementary
Their organization is four years old, with 50 fellows currently teaching or in the pipeline to teach. You speak our passion. Can you speak to your secret to retention? What important components need to
be present? o Research has found inductive supports are the secret.
How do you keep from becoming assimilated by the system? o There is a certain level of assimilation necessary to achieve, but our Foundation provides a safe place.
In order to increase the diverse pool of educators, we have to address the money issue. It is important as educators of color to know who you are because that is how you bridge to your students of color. There is an authentication. Expect an invitation for future presentations to the legislature, etc.
Washington Educator Skills Test-Basic and Endorsement Presenter: Patti Larriva, Director of Educator Assessments, Professional Educator Standards Board Presenter: David Brenna, Senior Policy Analyst, Professional Educator Standards Board
PESB receives yearly updates on the West B and those who are having difficulty in passing the test. The dilemma is how to craft a policy that doesn’t lower the standards and yet still has a chance of
working. The West B was a biased test and hopes that it has been corrected. Have you done any research with
students to find out why they aren’t entering the teacher pool? o We have antidotal information about why this is happening; among the reasons is test fatigue.
There needs to be a MOU with the K12 system and higher education to identify strong candidates for teaching and help prepare students to take the West B. Many students were asked if they were recruited and most said no.
The testing parts can be taken at separate times, and this is helpful for some candidates to be more successful in passing the test. Sometimes the registration fee and test fee can be a barrier, as there are limited numbers of vouchers available at the college to assist with fees.
Recruiting Washington Teachers program Presenter: Mea Moore, Director of Educator Pathways, Professional Educator Standards Board
They are attempting to address the disparity between the diversity of teachers versus the student population.
Does Western Washington University fund its own program? o Funding is some CTE money and teachers are doing their work outside of the classroom without
stipends. Most of money goes to support summer college activities.
Meeting Notes Educational Opportunity Gap Oversight and Accountability Committee July 31, 2012
Why did North Seattle quit? o North Seattle had an incredibly ambitious program including four high schools. It became logistically
and financially impossible for North Seattle to manage the program. The best model seems to be focused in one high school.
Public Comment: The public was invited to provide comment. No members of the public asked to speak. With no further action, the meeting was adjourned at 4:30 p.m.
Educational Opportunity Gap Oversight and Accountability Committee
July 31, 2012
McCleary Supreme Court Decision: “The State has not complied with its Article IX, Section 1 duty to make ample provision for the education of all children in Washington”
Supreme Court retained jurisdiction over the case to “monitor implementation of the reforms under ESHB 2261”
8 legislators will assist legal counsel in the submittal of periodic reports summarizing the legislative actions taken towards implementing reforms
2
HB 2824 created a joint task force with 8 legislative members and 3 Governor appointees to: ◦ Recommend one preferred alternative for a
permanent funding mechanism to fund basic education
Should the funding option include no new revenues, the task force must identify what areas in the budget must be eliminated or reduced
Final Report due 12/31/12
3
ESSB 5895 clarifies requirements for new teacher and principal evaluation systems initiated through E2SSB 6696 in 2010:
• New evaluation system must start by 2013–14 school year and be fully operational by 2015-16 school year
• All provisional and probationary classroom teachers must receive comprehensive evaluation in 2013-14
• OSPI to create rules:
• Sept. 1, 2012 - Identification of three instructional and three leadership frameworks
• Dec. 1, 2012 - Prescribe a common method for calculating the comprehensive and focused evaluations
4
$5,767,000 appropriated for FY 13 to: • Provide evaluator training for all principals and
assistant principals through OSPI (Beginning August 2012)
• Provide additional regional implementation grants (RIG) for district collaboration and evaluation model development through ESDs (Beginning September 2012)
• Provide grants to pilot districts to continue studying specific aspects of evaluation design and implementation issues
5
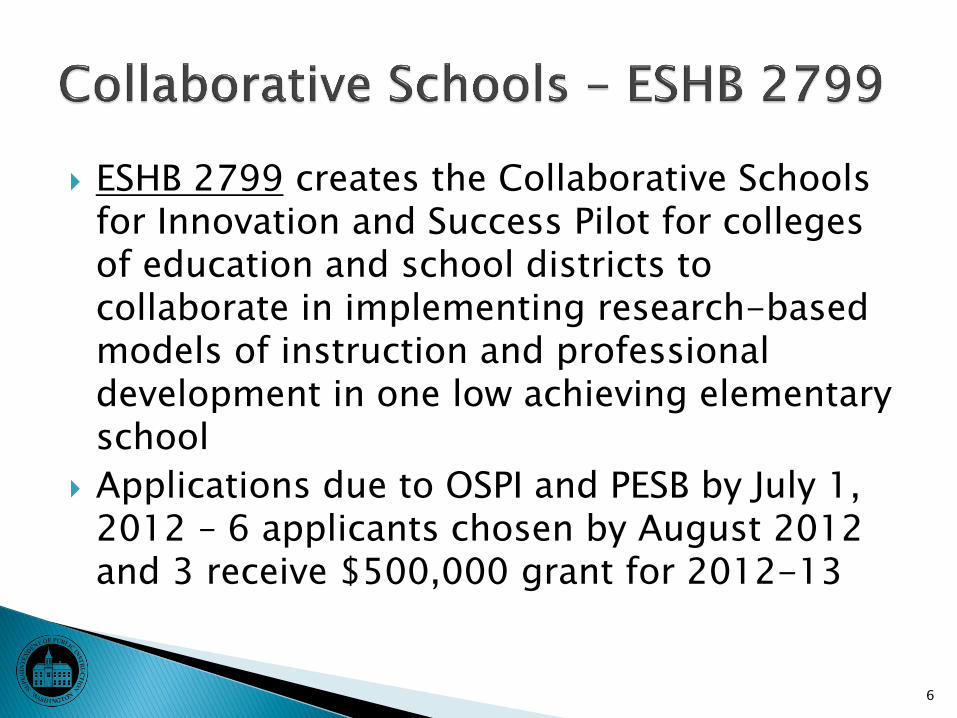
ESHB 2799 creates the Collaborative Schools for Innovation and Success Pilot for colleges of education and school districts to collaborate in implementing research-based models of instruction and professional development in one low achieving elementary school
Applications due to OSPI and PESB by July 1, 2012 – 6 applicants chosen by August 2012 and 3 receive $500,000 grant for 2012-13
6
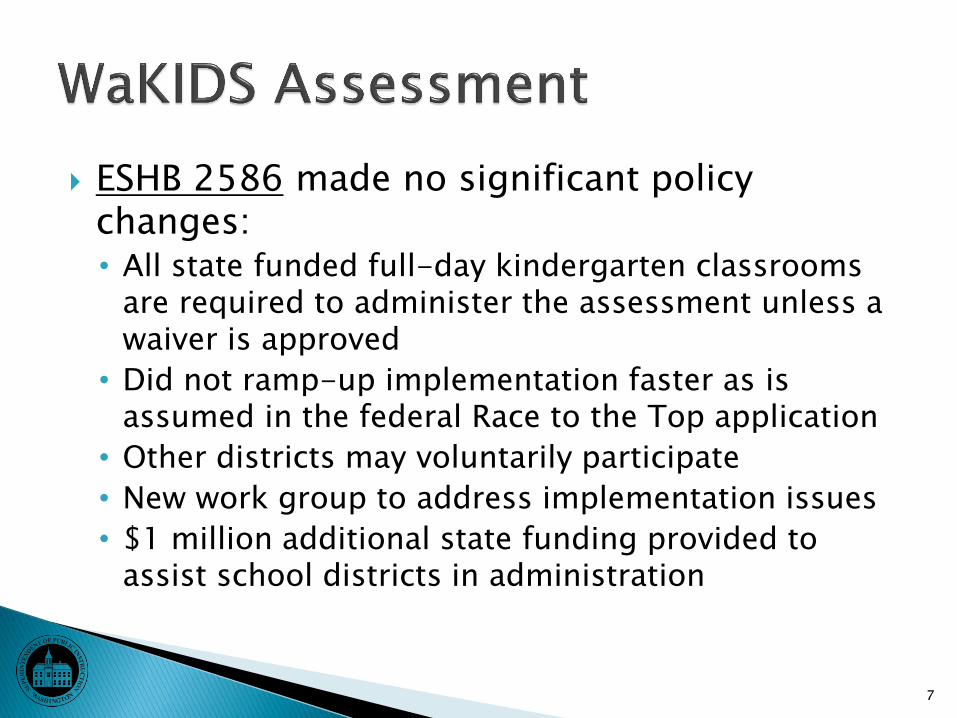
ESHB 2586 made no significant policy changes: • All state funded full-day kindergarten classrooms
are required to administer the assessment unless a waiver is approved
• Did not ramp-up implementation faster as is assumed in the federal Race to the Top application
• Other districts may voluntarily participate
• New work group to address implementation issues
• $1 million additional state funding provided to assist school districts in administration
7
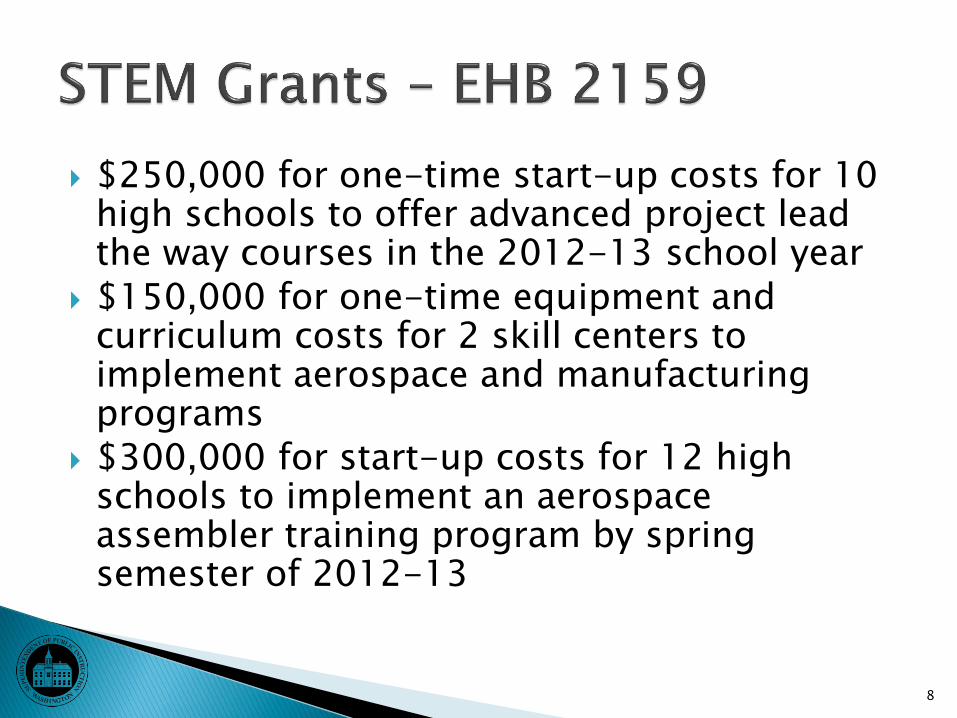
$250,000 for one-time start-up costs for 10 high schools to offer advanced project lead the way courses in the 2012-13 school year
$150,000 for one-time equipment and curriculum costs for 2 skill centers to implement aerospace and manufacturing programs
$300,000 for start-up costs for 12 high schools to implement an aerospace assembler training program by spring semester of 2012-13
8
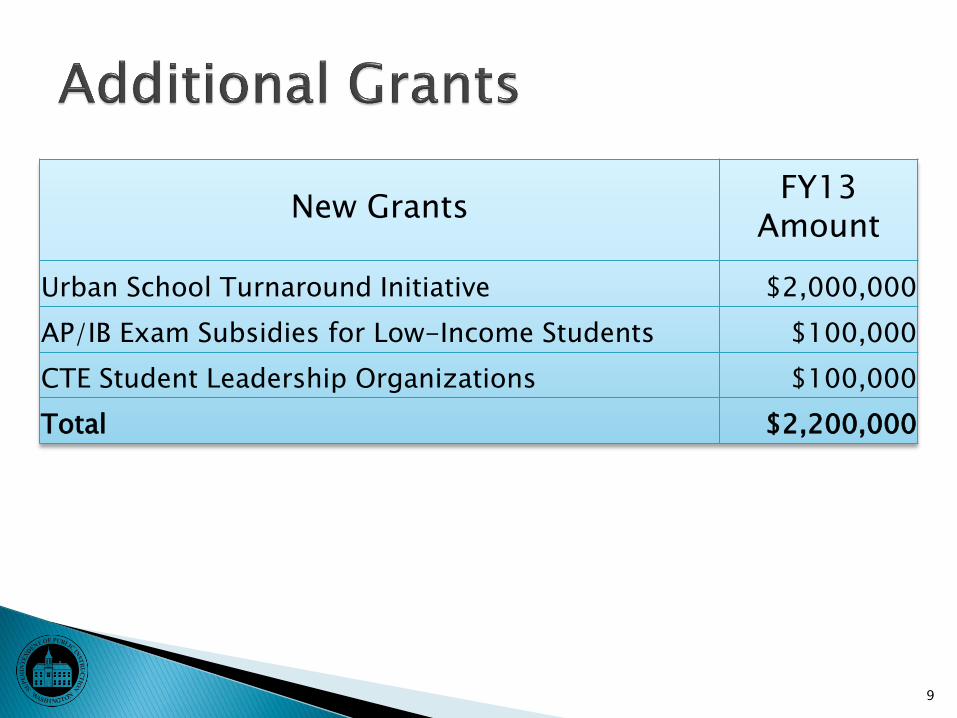
New Grants FY13
Amount
Urban School Turnaround Initiative $2,000,000
AP/IB Exam Subsidies for Low-Income Students $100,000
CTE Student Leadership Organizations $100,000
Total $2,200,000
9
A new funding model that provides a scaled funding formula based on levels of English language proficiency and supplemental funding for students that exit TBIP will not be implemented in 2012-13
However, ◦ OSPI is required to submit a budget request for the
2013-15 biennium; and the
◦ Education funding taskforce is to provide recommendations for a revised model
10
PESB is provided $25,000 to develop standards and identify interpreter assessments that: ◦ Include both written and performance assessments,
◦ Is offered by a national organization
◦ Assess more than one sign system
PESB will make the standards and assessments available for school district use
11
ESB 5974 includes national STEM exams to the list that qualify for postsecondary credit
HB 2160 requires PESB to include the integration of STEM in the teacher certification standards, assessment and renewal requirements
SSB 6041 adds elementary schools to the potential STEM lighthouse designees
12
E2SHB 2337 directs OSPI to: ◦ Develop an easily accessible, free library of openly
licensed courseware aligned with the Common Core standards
◦ Advertise the availability of openly licensed courseware to school districts
◦ Provide professional development programs regarding the creation, use and continuous improvement of open courseware
13
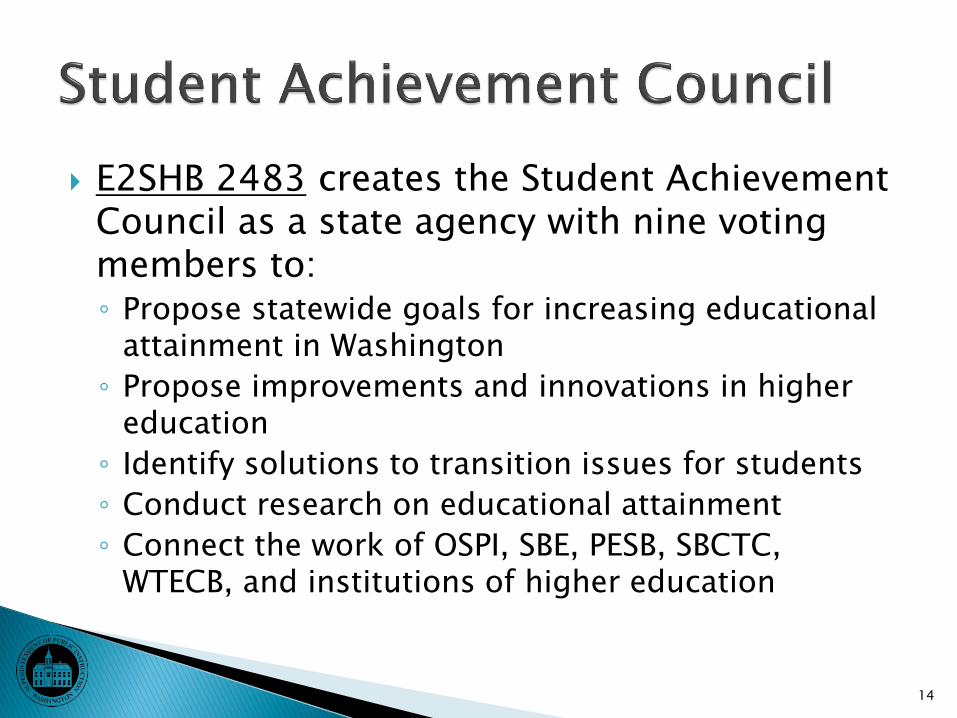
E2SHB 2483 creates the Student Achievement Council as a state agency with nine voting members to: ◦ Propose statewide goals for increasing educational
attainment in Washington
◦ Propose improvements and innovations in higher education
◦ Identify solutions to transition issues for students
◦ Conduct research on educational attainment
◦ Connect the work of OSPI, SBE, PESB, SBCTC, WTECB, and institutions of higher education
14
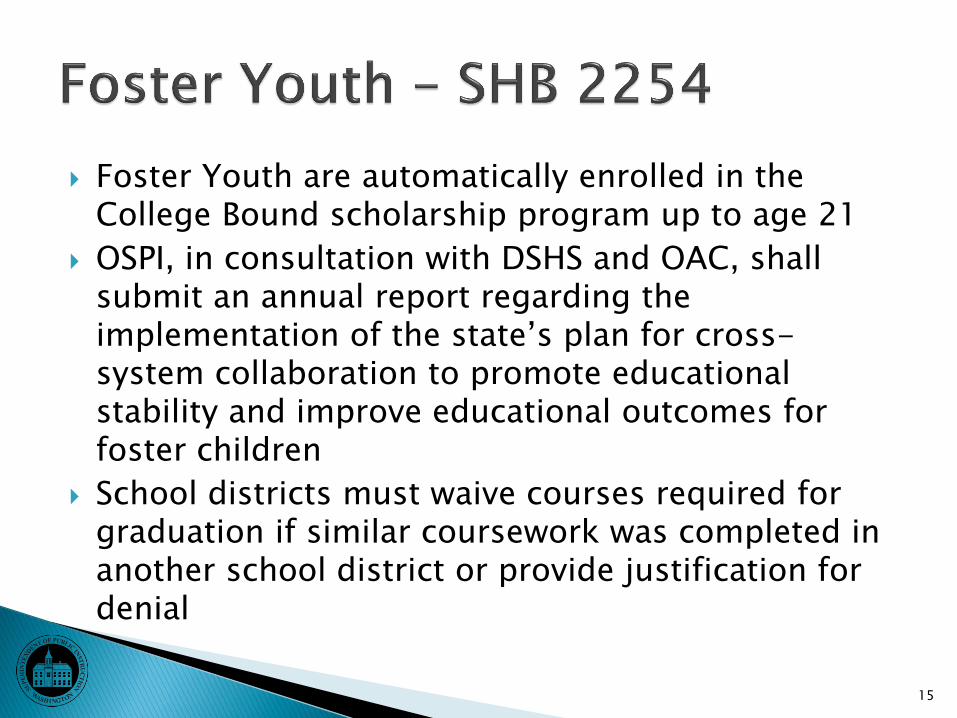
Foster Youth are automatically enrolled in the College Bound scholarship program up to age 21
OSPI, in consultation with DSHS and OAC, shall submit an annual report regarding the implementation of the state’s plan for cross-system collaboration to promote educational stability and improve educational outcomes for foster children
School districts must waive courses required for graduation if similar coursework was completed in another school district or provide justification for denial
15
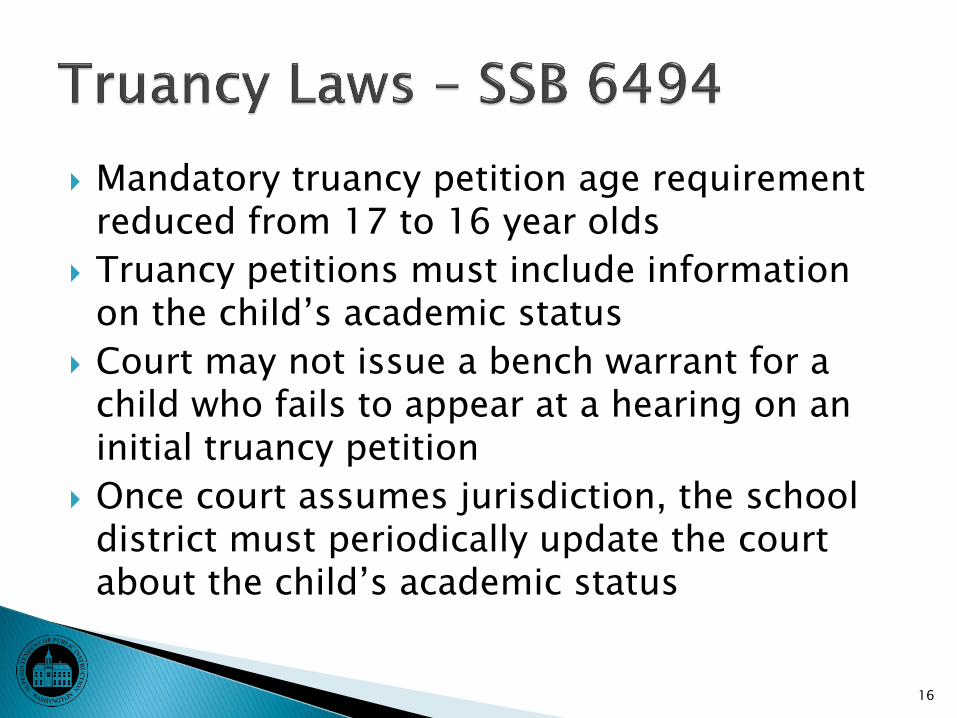
Mandatory truancy petition age requirement reduced from 17 to 16 year olds
Truancy petitions must include information on the child’s academic status
Court may not issue a bench warrant for a child who fails to appear at a hearing on an initial truancy petition
Once court assumes jurisdiction, the school district must periodically update the court about the child’s academic status
16
17
Final bills may be obtained at the State Legislature website at www.leg.wa.gov
Please email additional questions to: [email protected]
18
Washington State Board of Education 1
The Washington Achievement Index
Sarah Rich, Policy Director
Washington State Board of Education
July 2012
Washington State Board of Education 2
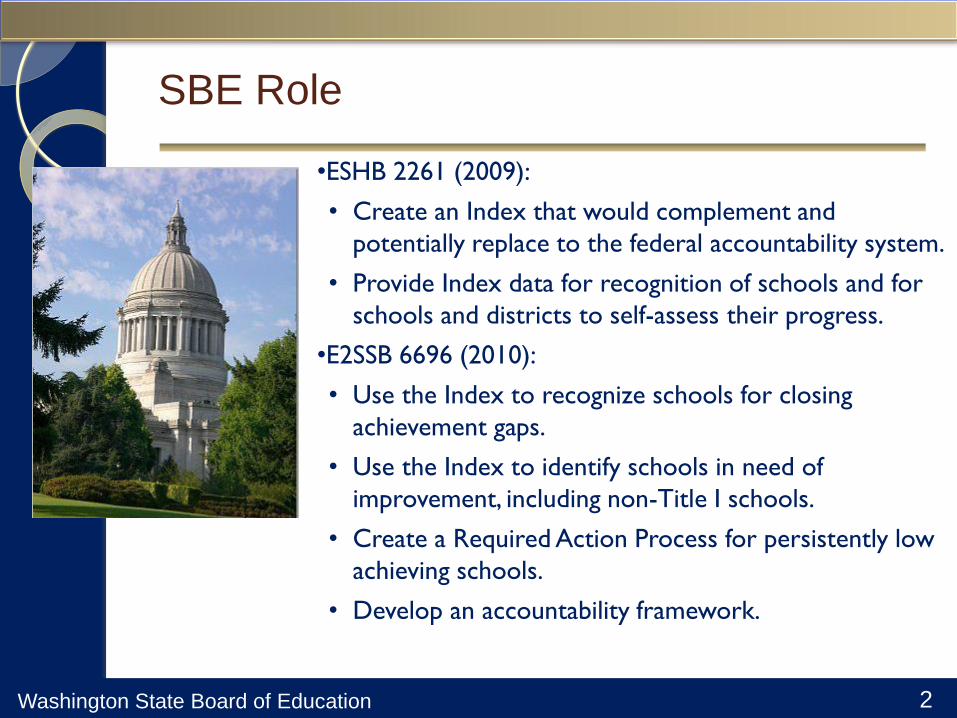
SBE Role
•ESHB 2261 (2009):
• Create an Index that would complement and
potentially replace to the federal accountability system.
• Provide Index data for recognition of schools and for
schools and districts to self-assess their progress.
•E2SSB 6696 (2010):
• Use the Index to recognize schools for closing
achievement gaps.
• Use the Index to identify schools in need of
improvement, including non-Title I schools.
• Create a Required Action Process for persistently low
achieving schools.
• Develop an accountability framework.
Washington State Board of Education 3
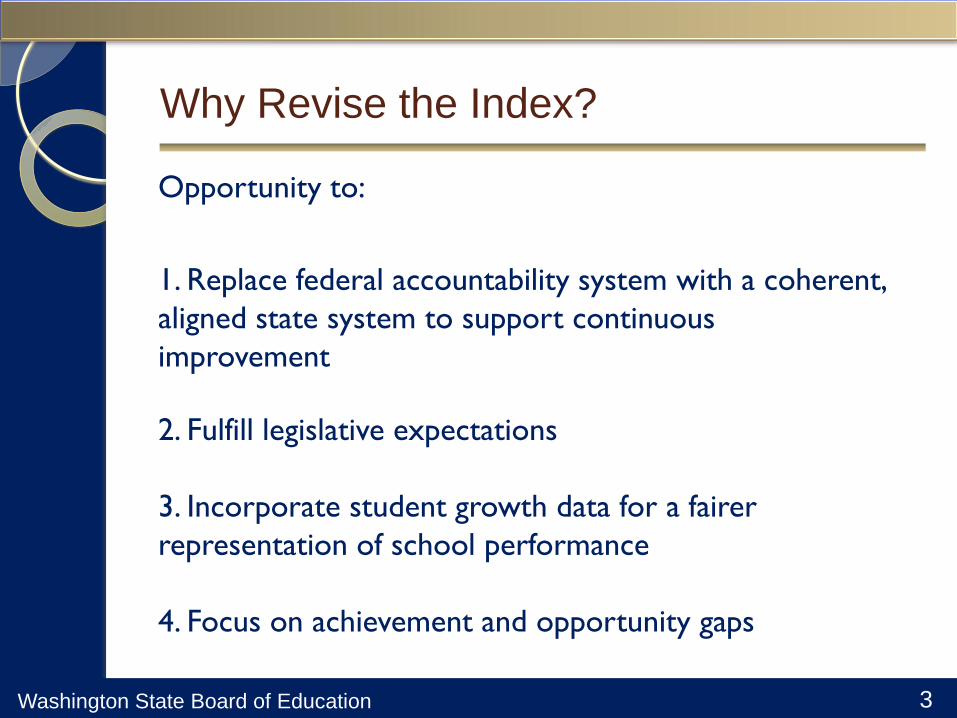
Opportunity to:
1. Replace federal accountability system with a coherent,
aligned state system to support continuous
improvement
2. Fulfill legislative expectations
3. Incorporate student growth data for a fairer
representation of school performance
4. Focus on achievement and opportunity gaps
Why Revise the Index?
Washington State Board of Education 4
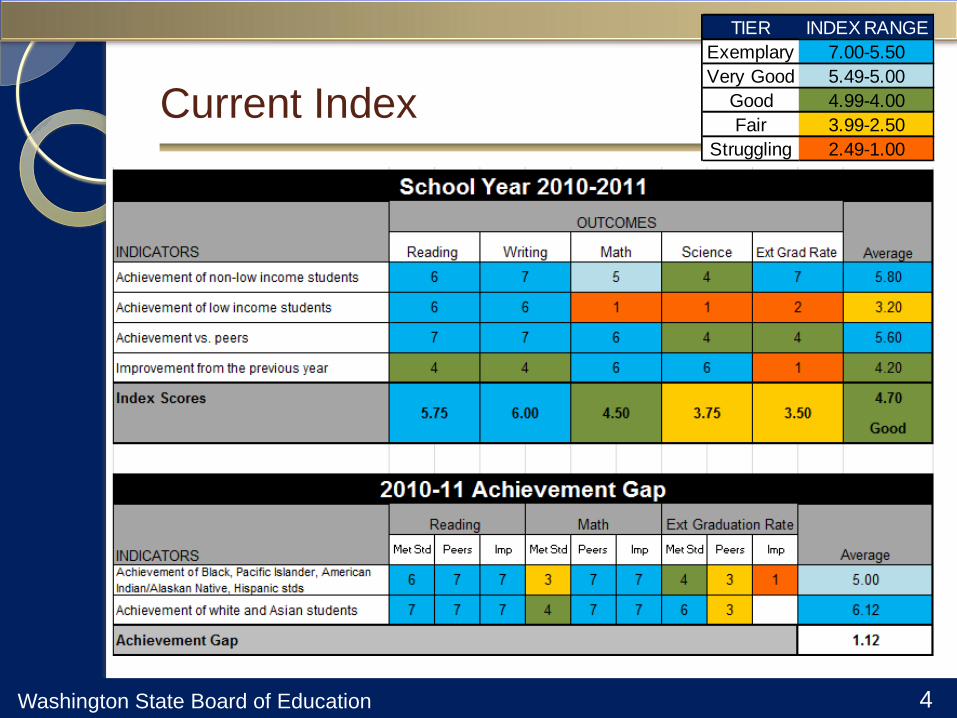
Current Index
TIER INDEX RANGE
Exemplary 7.00-5.50
Very Good 5.49-5.00
Good 4.99-4.00
Fair 3.99-2.50
Struggling 2.49-1.00
Washington State Board of Education 5
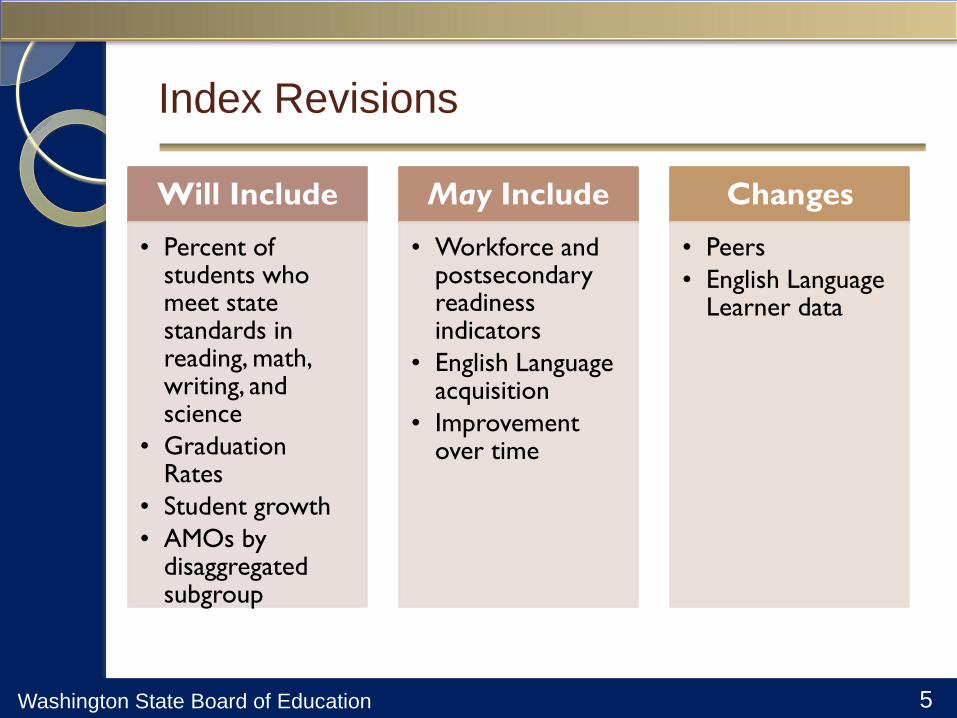
Index Revisions
Will Include
• Percent of students who meet state standards in reading, math, writing, and science
• Graduation Rates
• Student growth
• AMOs by disaggregated subgroup
May Include
• Workforce and postsecondary readiness indicators
• English Language acquisition
• Improvement over time
Changes
• Peers
• English Language Learner data
Washington State Board of Education 6
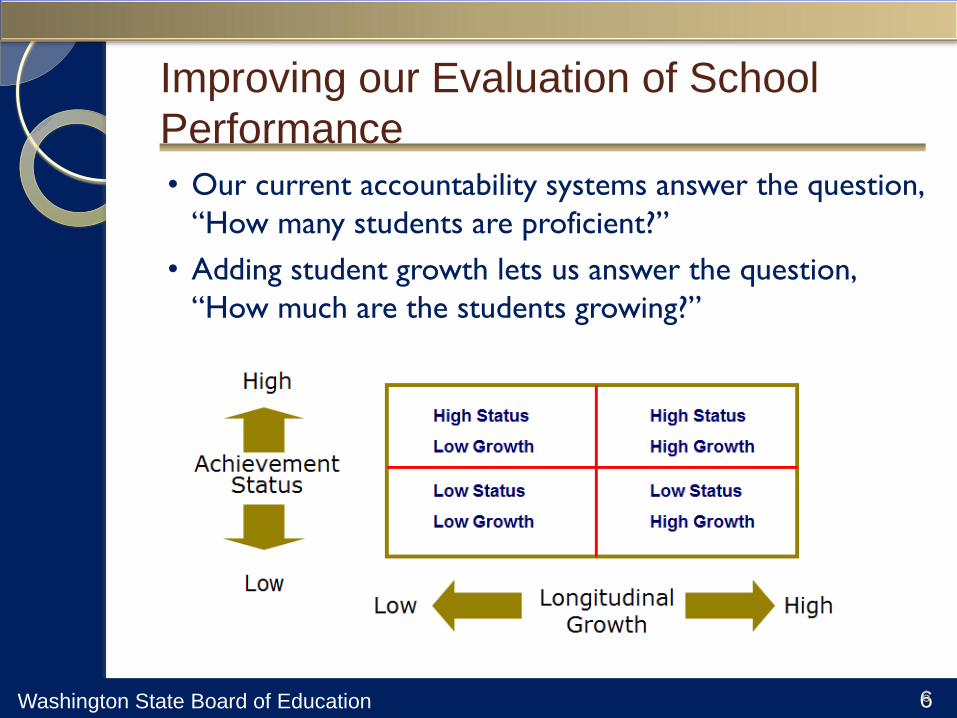
Improving our Evaluation of School
Performance
• Our current accountability systems answer the question,
“How many students are proficient?”
• Adding student growth lets us answer the question,
“How much are the students growing?”
6
Washington State Board of Education 7
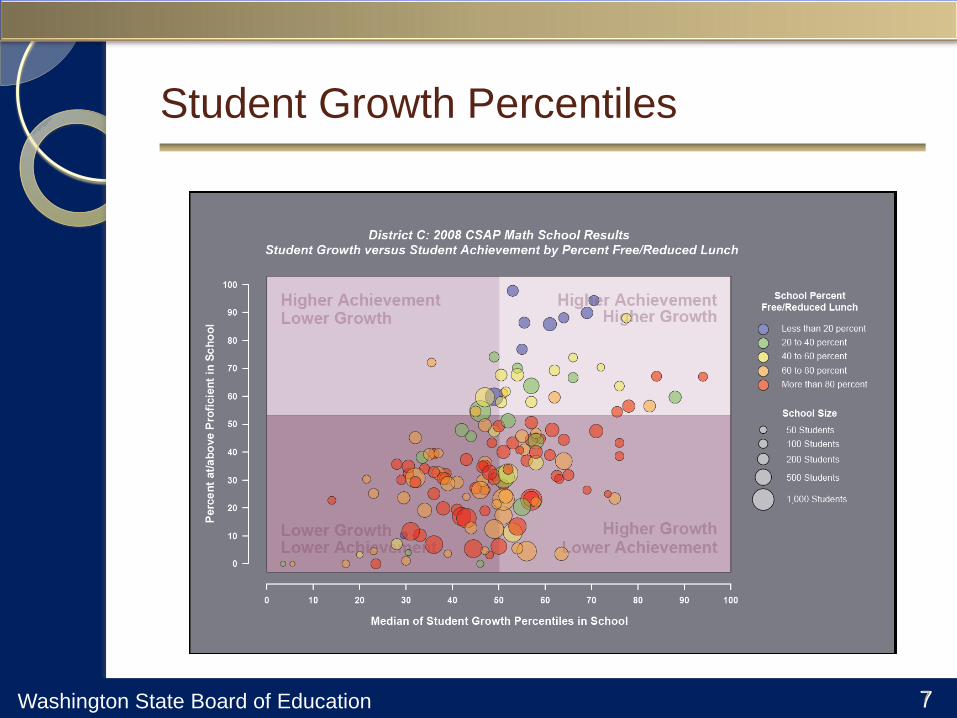
Student Growth Percentiles
7
Washington State Board of Education 8
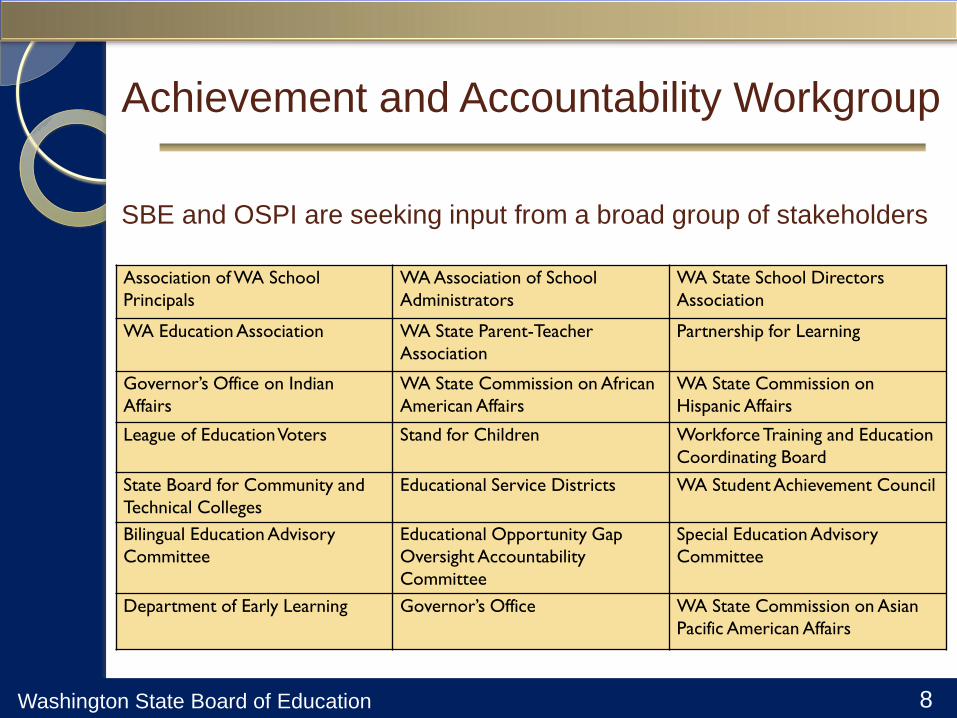
Achievement and Accountability Workgroup
Association of WA School
Principals
WA Association of School
Administrators
WA State School Directors
Association
WA Education Association WA State Parent-Teacher
Association
Partnership for Learning
Governor’s Office on Indian
Affairs
WA State Commission on African
American Affairs
WA State Commission on
Hispanic Affairs
League of Education Voters Stand for Children Workforce Training and Education
Coordinating Board
State Board for Community and
Technical Colleges
Educational Service Districts WA Student Achievement Council
Bilingual Education Advisory
Committee
Educational Opportunity Gap
Oversight Accountability
Committee
Special Education Advisory
Committee
Department of Early Learning Governor’s Office WA State Commission on Asian
Pacific American Affairs
SBE and OSPI are seeking input from a broad group of stakeholders
Washington State Board of Education 9
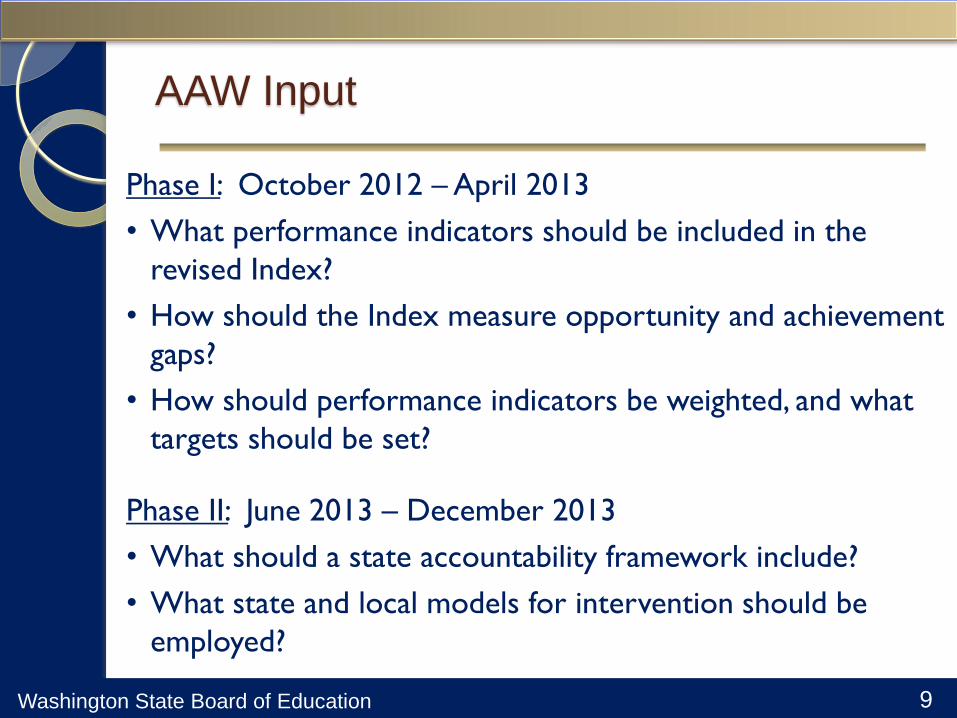
AAW Input
Phase I: October 2012 – April 2013
• What performance indicators should be included in the
revised Index?
• How should the Index measure opportunity and achievement
gaps?
• How should performance indicators be weighted, and what
targets should be set?
Phase II: June 2013 – December 2013
• What should a state accountability framework include?
• What state and local models for intervention should be
employed?
Washington State Board of Education 10
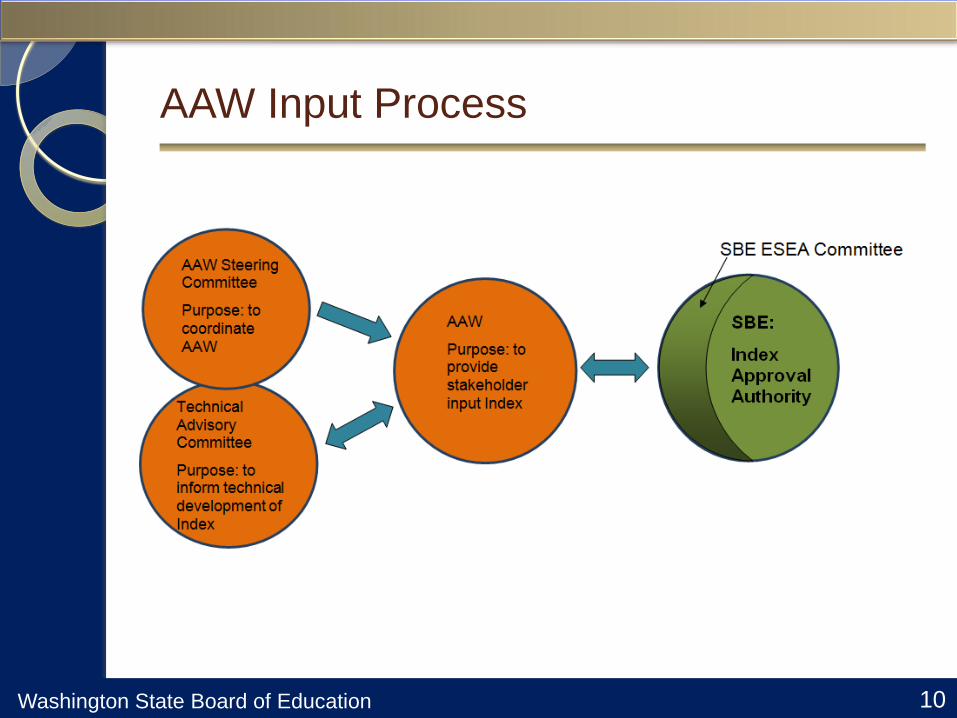
AAW Input Process
Washington State Board of Education 11
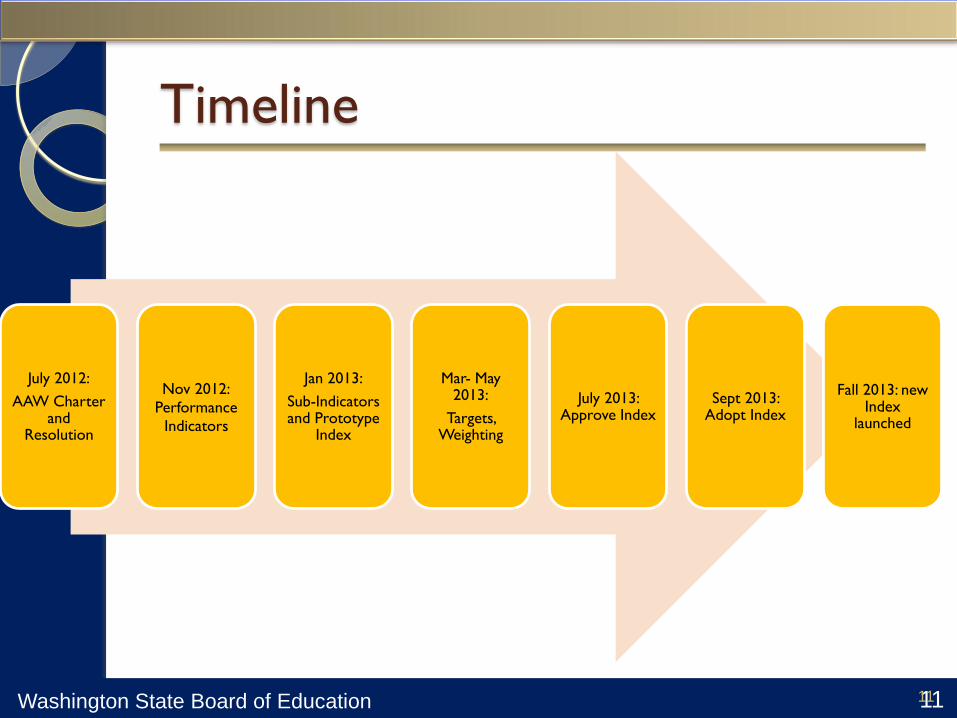
July 2012:
AAW Charter and
Resolution
Nov 2012:
Performance
Indicators
Jan 2013:
Sub-Indicators and Prototype
Index
Mar- May 2013:
Targets, Weighting
July 2013: Approve Index
Sept 2013: Adopt Index
Fall 2013: new Index
launched
Timeline
11
ESEA FLEXIBILITY REQUEST
Background
Highlights of Principle 2
School Identification
Requirements
Supports & Services
July 31, 2012
Bob Harmon, Assistant Superintendent, OSPI
Sue Cohn, School Improvement Specialist, OSPI
ESEA Flexibility
• Share background for ESEA Flexibility Request
• Describe highlights of Principle 2
• Outline criteria used for each classification of
schools identified through Principle 2
• Share requirements for identified schools and
their districts and support/services OSPI will
provide
• Respond to questions
GOALS FOR WEBINAR
2
ESEA Flexibility
BACKGROUND FOR
ESEA FLEXIBILITY REQUEST
3
ESEA Flexibility
WHY DID WASHINGTON STATE APPLY?
This is the right decision for Washington State. Over 1176
schools and 113 districts across our state were identified as “in
improvement” based on 2010-11 state assessments. So we
know our current AYP system doesn’t work.
We need a new way to measure progress and provide resources
to support our work. This request gives us the opportunity to
set new annual learning targets and frees up to $58 million
across our state to address the needs of struggling students and
schools. It provides the flexibility Washington needs to ensure
ALL students graduate with college- and career-ready skills.
Randy Dorn
Superintendent of Public Instruction
4
ESEA Flexibility
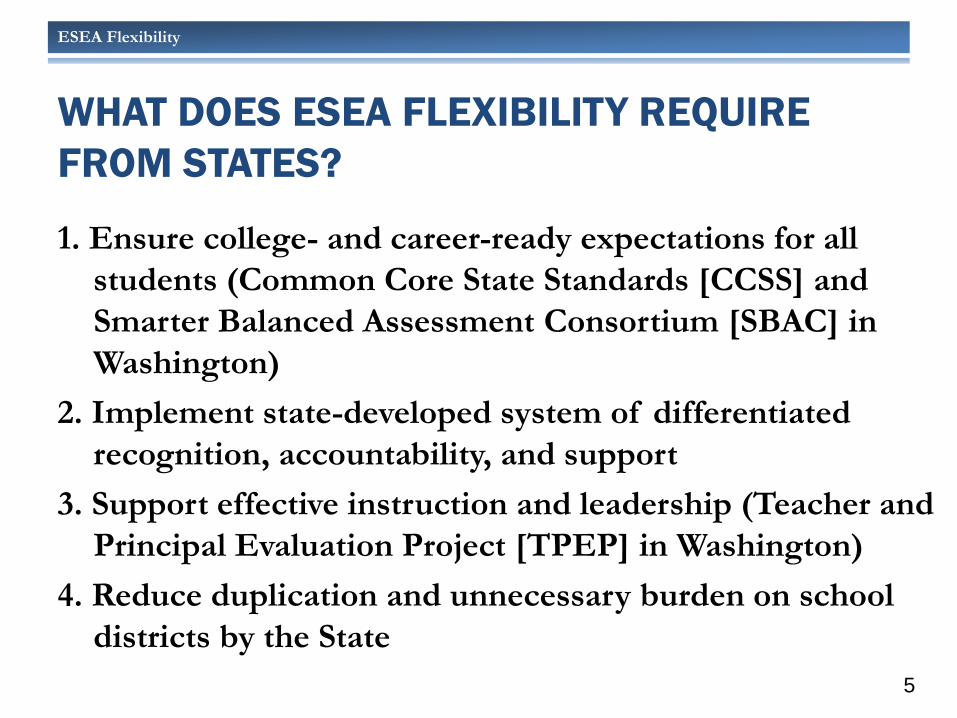
WHAT DOES ESEA FLEXIBILITY REQUIRE
FROM STATES?
1. Ensure college- and career-ready expectations for all
students (Common Core State Standards [CCSS] and
Smarter Balanced Assessment Consortium [SBAC] in
Washington)
2. Implement state-developed system of differentiated
recognition, accountability, and support
3. Support effective instruction and leadership (Teacher and
Principal Evaluation Project [TPEP] in Washington)
4. Reduce duplication and unnecessary burden on school
districts by the State
5
ESEA Flexibility
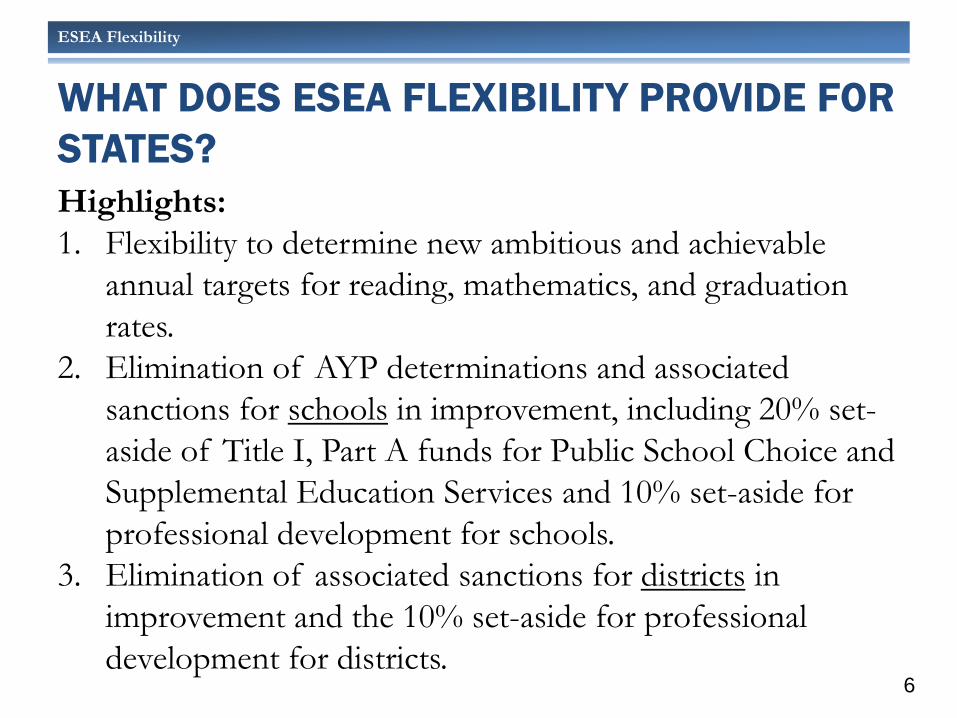
WHAT DOES ESEA FLEXIBILITY PROVIDE FOR
STATES?
Highlights:
1. Flexibility to determine new ambitious and achievable
annual targets for reading, mathematics, and graduation
rates.
2. Elimination of AYP determinations and associated
sanctions for schools in improvement, including 20% set-
aside of Title I, Part A funds for Public School Choice and
Supplemental Education Services and 10% set-aside for
professional development for schools.
3. Elimination of associated sanctions for districts in
improvement and the 10% set-aside for professional
development for districts.
6
ESEA Flexibility Package USED/OSPI
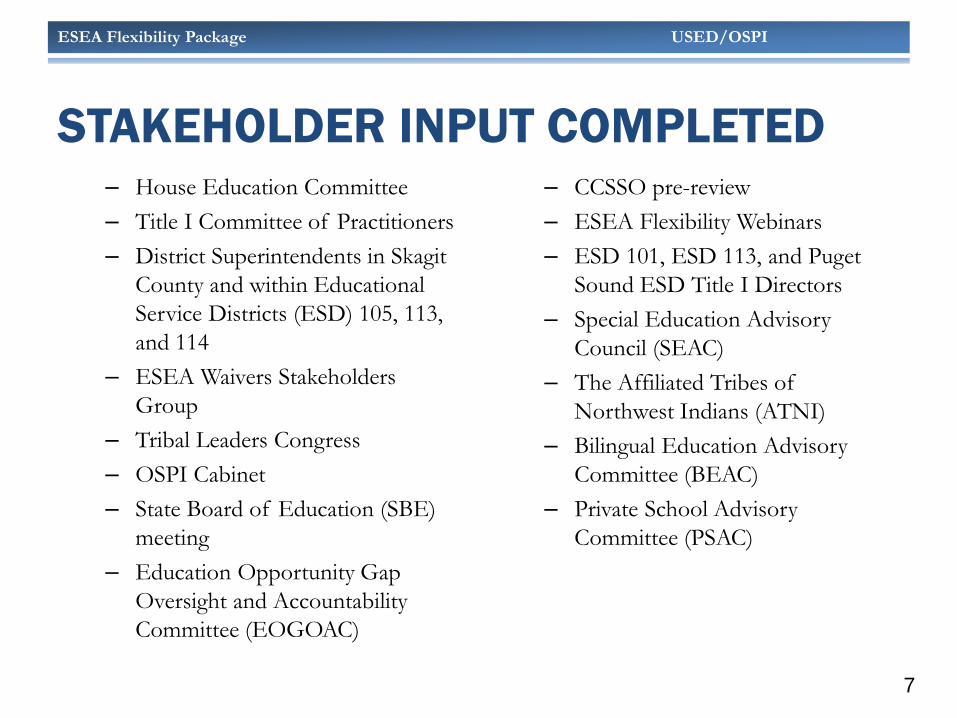
STAKEHOLDER INPUT COMPLETED – House Education Committee
– Title I Committee of Practitioners
– District Superintendents in Skagit
County and within Educational
Service Districts (ESD) 105, 113,
and 114
– ESEA Waivers Stakeholders
Group
– Tribal Leaders Congress
– OSPI Cabinet
– State Board of Education (SBE)
meeting
– Education Opportunity Gap
Oversight and Accountability
Committee (EOGOAC)
– CCSSO pre-review
– ESEA Flexibility Webinars
– ESD 101, ESD 113, and Puget
Sound ESD Title I Directors
– Special Education Advisory
Council (SEAC)
– The Affiliated Tribes of
Northwest Indians (ATNI)
– Bilingual Education Advisory
Committee (BEAC)
– Private School Advisory
Committee (PSAC)
7
ESEA Flexibility
UNPACKING PRINCIPLE 2
• Principle 2: Implement state-
developed system of differentiated
recognition, accountability, and
support.
8
ESEA Flexibility
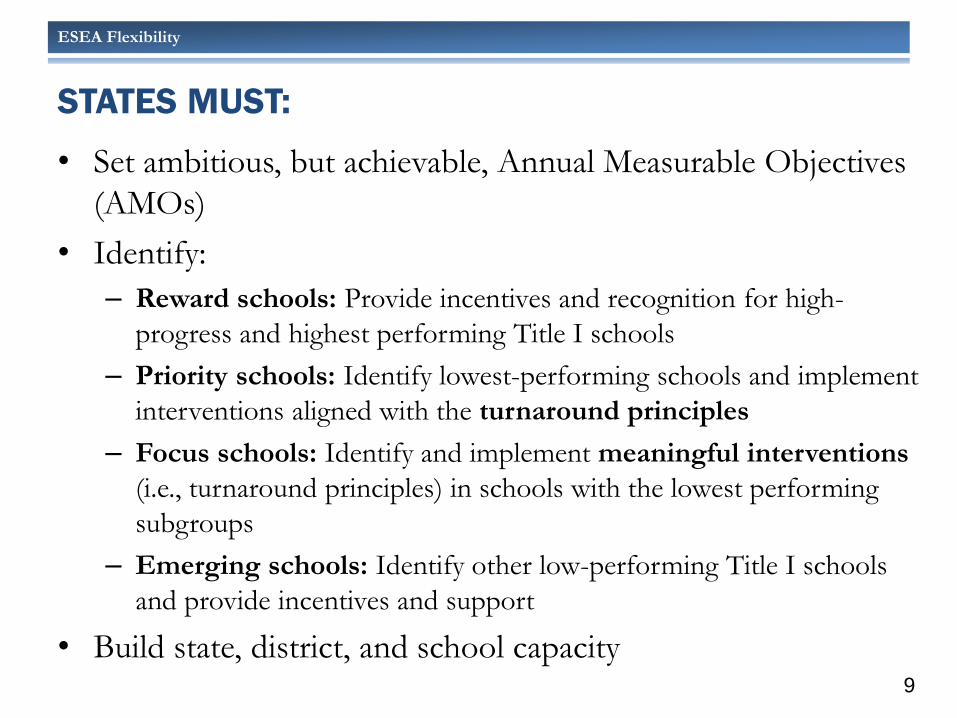
STATES MUST:
• Set ambitious, but achievable, Annual Measurable Objectives
(AMOs)
• Identify:
– Reward schools: Provide incentives and recognition for high-
progress and highest performing Title I schools
– Priority schools: Identify lowest-performing schools and implement
interventions aligned with the turnaround principles
– Focus schools: Identify and implement meaningful interventions
(i.e., turnaround principles) in schools with the lowest performing
subgroups
– Emerging schools: Identify other low-performing Title I schools
and provide incentives and support
• Build state, district, and school capacity 9
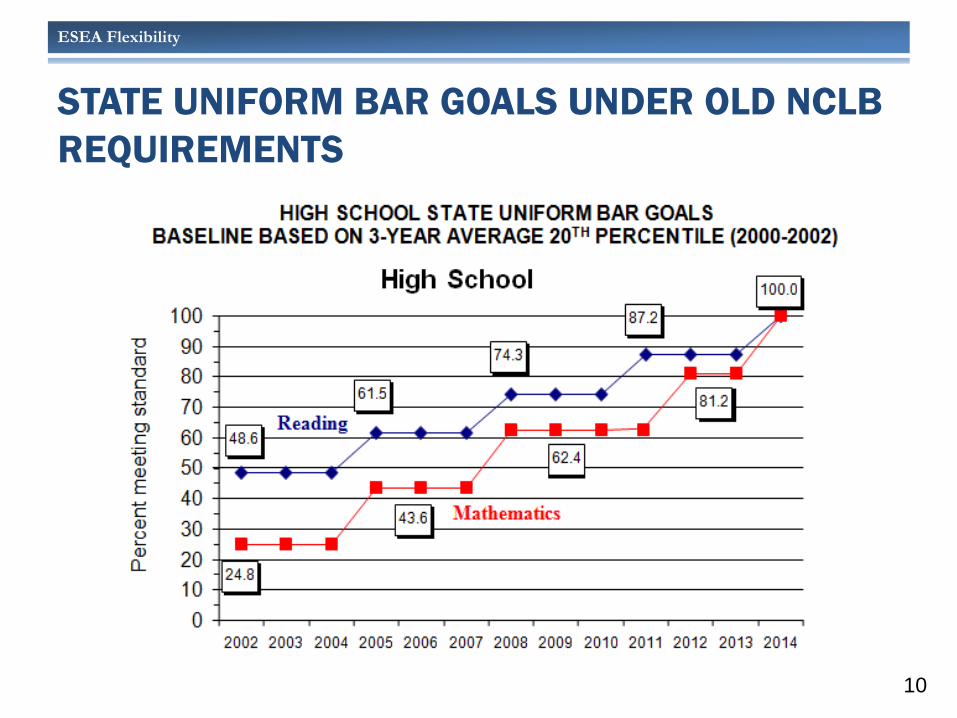
ESEA Flexibility
STATE UNIFORM BAR GOALS UNDER OLD NCLB
REQUIREMENTS
10
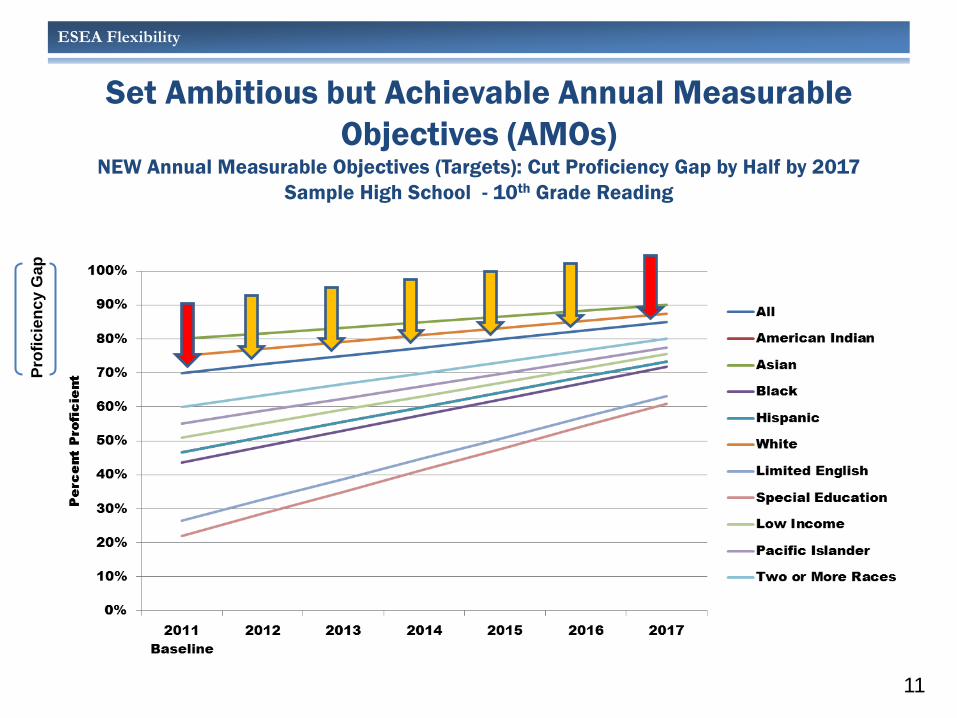
ESEA Flexibility
Set Ambitious but Achievable Annual Measurable
Objectives (AMOs) NEW Annual Measurable Objectives (Targets): Cut Proficiency Gap by Half by 2017
Sample High School - 10th Grade Reading
11
Pro
fic
ien
cy G
ap
ESEA Flexibility
CRITERIA USED TO
IDENTIFY SCHOOLS
12
ESEA Flexibility
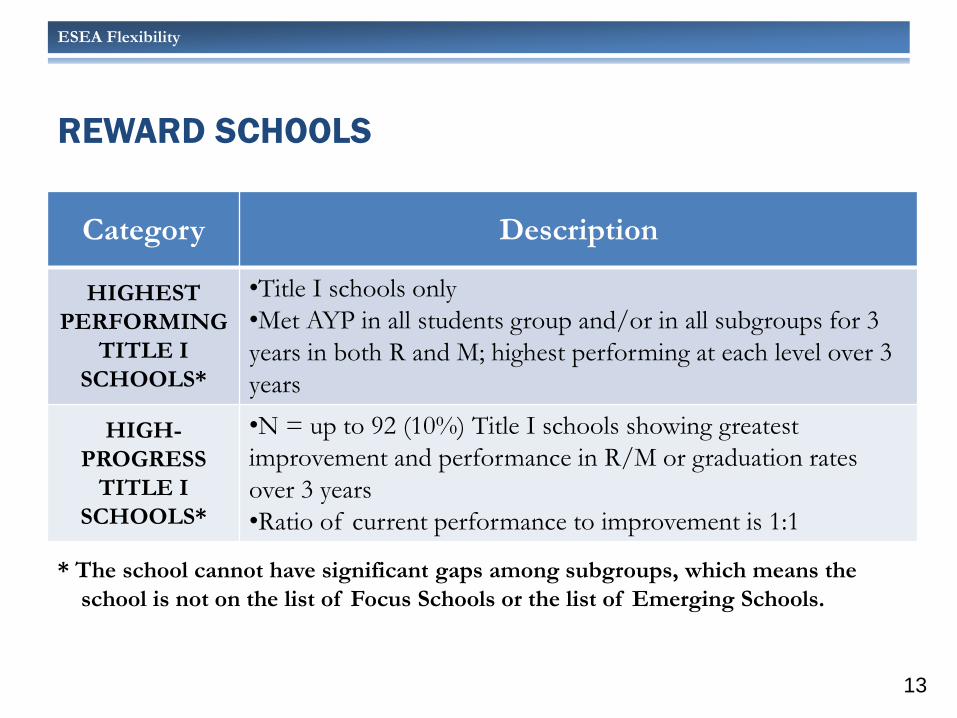
REWARD SCHOOLS
* The school cannot have significant gaps among subgroups, which means the
school is not on the list of Focus Schools or the list of Emerging Schools.
13
Category Description
HIGHEST
PERFORMING
TITLE I
SCHOOLS*
•Title I schools only
•Met AYP in all students group and/or in all subgroups for 3
years in both R and M; highest performing at each level over 3
years
HIGH-
PROGRESS
TITLE I
SCHOOLS*
•N = up to 92 (10%) Title I schools showing greatest
improvement and performance in R/M or graduation rates
over 3 years
•Ratio of current performance to improvement is 1:1
ESEA Flexibility
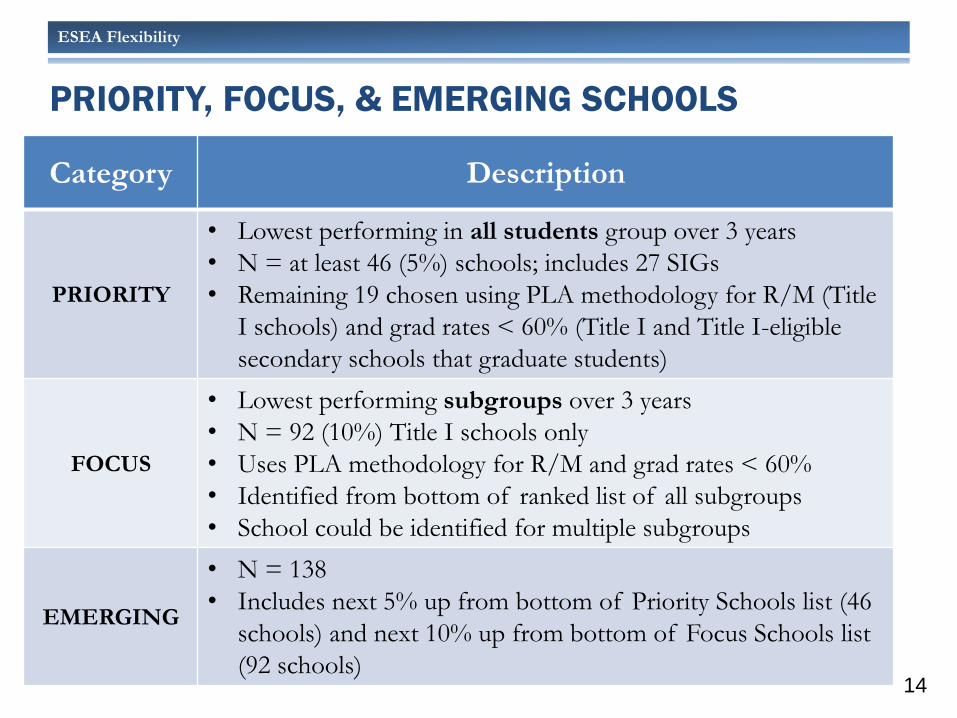
PRIORITY, FOCUS, & EMERGING SCHOOLS
14
Category Description
PRIORITY
• Lowest performing in all students group over 3 years
• N = at least 46 (5%) schools; includes 27 SIGs
• Remaining 19 chosen using PLA methodology for R/M (Title
I schools) and grad rates < 60% (Title I and Title I-eligible
secondary schools that graduate students)
FOCUS
• Lowest performing subgroups over 3 years
• N = 92 (10%) Title I schools only
• Uses PLA methodology for R/M and grad rates < 60%
• Identified from bottom of ranked list of all subgroups
• School could be identified for multiple subgroups
EMERGING
• N = 138
• Includes next 5% up from bottom of Priority Schools list (46
schools) and next 10% up from bottom of Focus Schools list
(92 schools)
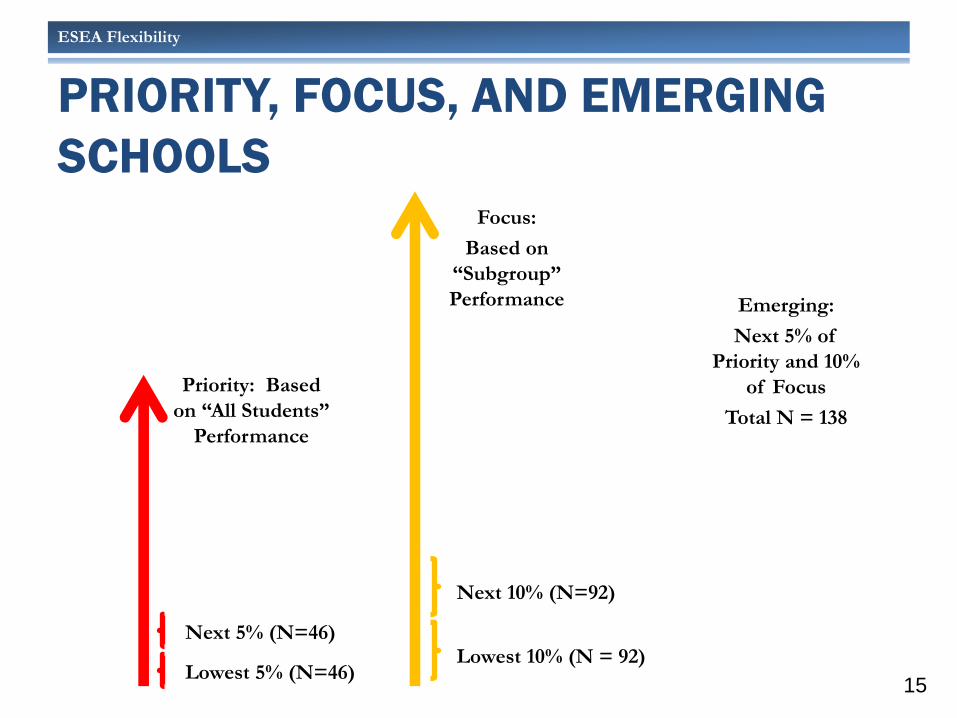
ESEA Flexibility
Priority: Based
on “All Students”
Performance
PRIORITY, FOCUS, AND EMERGING
SCHOOLS
Lowest 5% (N=46) Lowest 10% (N = 92)
Next 10% (N=92)
Next 5% (N=46)
Next 5% (N=46)
Emerging:
Next 5% of
Priority and 10%
of Focus
Total N = 138
Focus:
Based on
“Subgroup”
Performance
Next 10% (N=92)
15
ESEA Flexibility
REQUIREMENTS FOR SCHOOLS
IDENTIFIED AS
PRIORITY, FOCUS, OR EMERGING
16
ESEA Flexibility
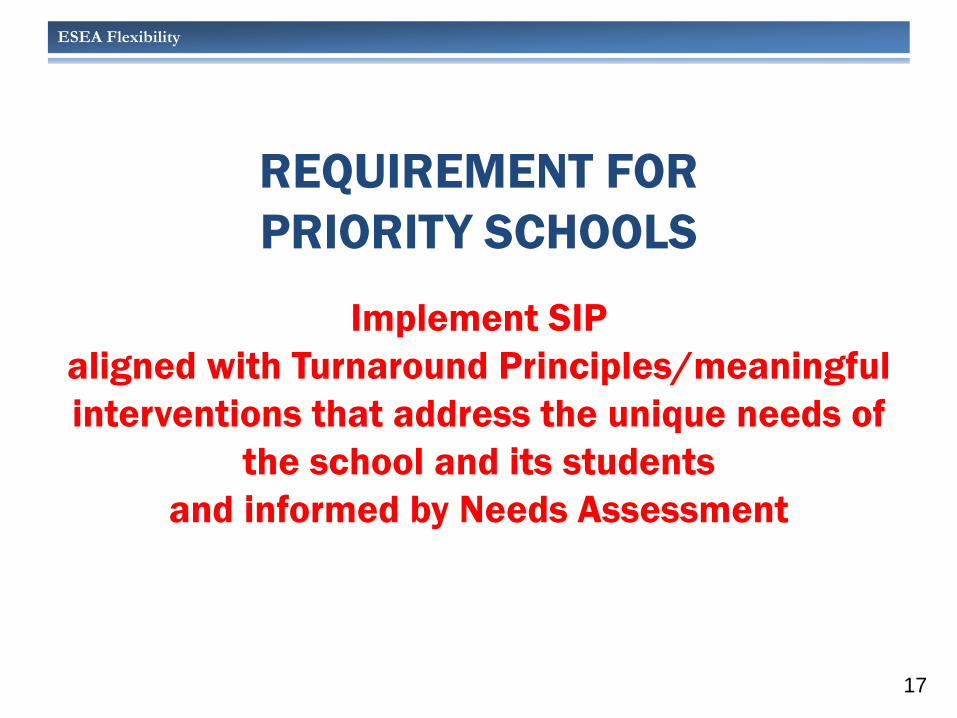
REQUIREMENT FOR
PRIORITY SCHOOLS
Implement SIP
aligned with Turnaround Principles/meaningful
interventions that address the unique needs of
the school and its students
and informed by Needs Assessment
17
ESEA Flexibility
PRIORITY, FOCUS, AND EMERGING SCHOOLS
18
Requirement Priority Focus Emerging
Engage in Needs Assessment or NA (Sept – Oct) √ √ √
Develop SIP using findings from NA; use OSPI’s 8-
step process and on-line planning tool; submit plan for
review and feedback (Oct – Nov)
√* √* √**
Implement SIP aligned with Turnaround Principles √ √***
Implement SIP aligned with meaningful interventions
that match unique needs of school and subgroups √ √ √
Engage in PD aligned with turnaround model and/or
meaningful interventions √ √ √
Develop 90-day benchmark plans to monitor progress √ √ √
District: Set-aside up to 20% of Title I, Part A funds;
ensure school(s) implements SIP as designed; build
capacity to sustain
√ √ √
*Use findings from external Needs Assessment (NA)
**Use findings from internal Needs Assessment (NA)
***If Emerging School is identified from Priority Schools list
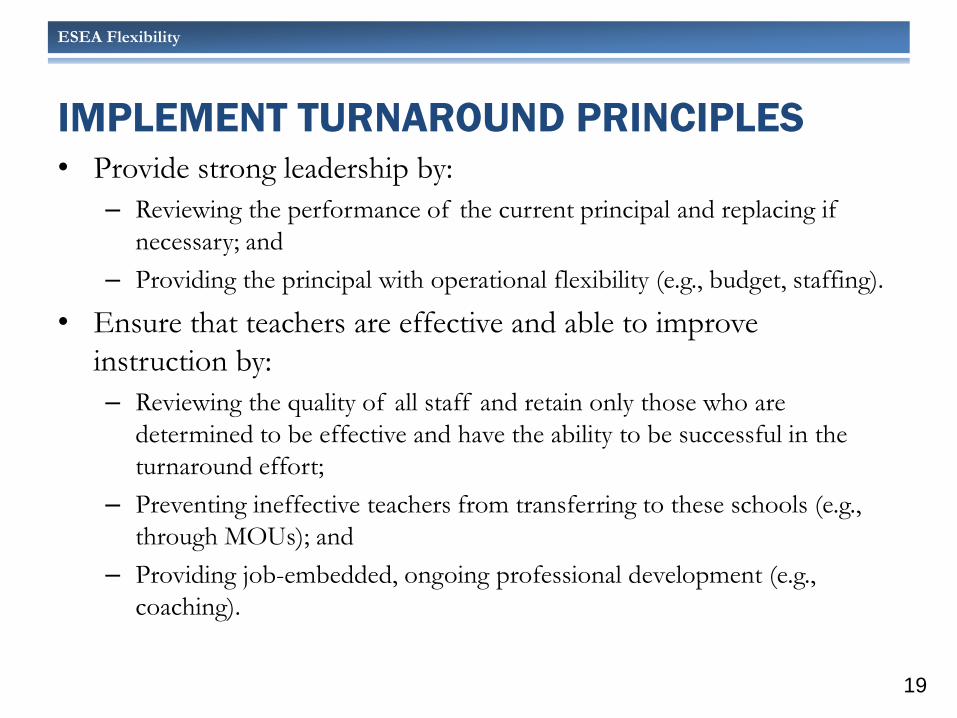
ESEA Flexibility
• Provide strong leadership by:
– Reviewing the performance of the current principal and replacing if
necessary; and
– Providing the principal with operational flexibility (e.g., budget, staffing).
• Ensure that teachers are effective and able to improve
instruction by:
– Reviewing the quality of all staff and retain only those who are
determined to be effective and have the ability to be successful in the
turnaround effort;
– Preventing ineffective teachers from transferring to these schools (e.g.,
through MOUs); and
– Providing job-embedded, ongoing professional development (e.g.,
coaching).
IMPLEMENT TURNAROUND PRINCIPLES
19
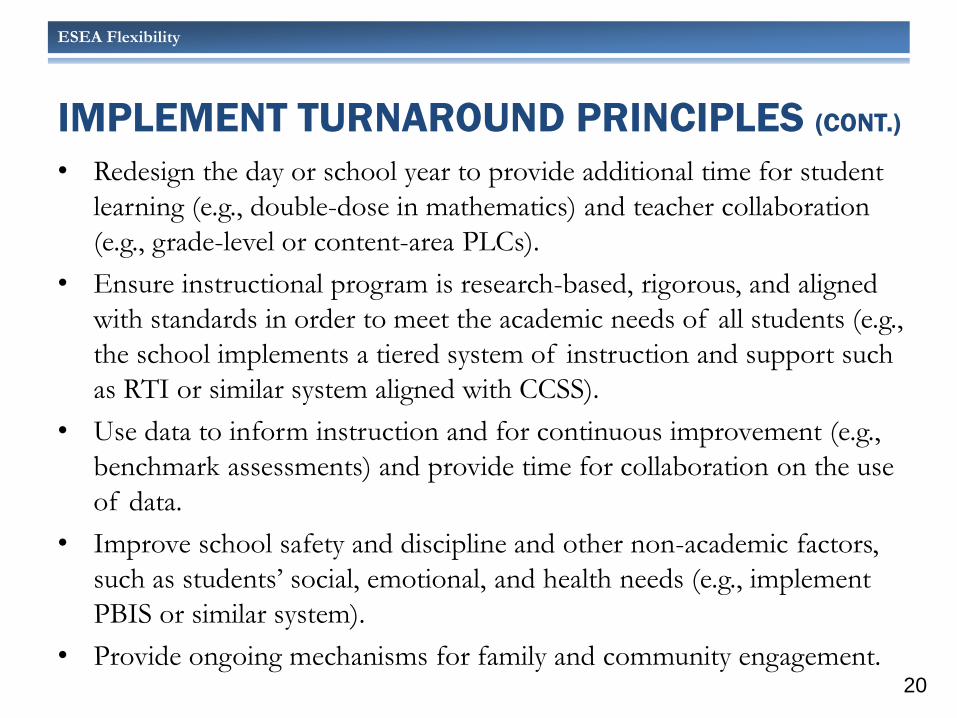
ESEA Flexibility
• Redesign the day or school year to provide additional time for student
learning (e.g., double-dose in mathematics) and teacher collaboration
(e.g., grade-level or content-area PLCs).
• Ensure instructional program is research-based, rigorous, and aligned
with standards in order to meet the academic needs of all students (e.g.,
the school implements a tiered system of instruction and support such
as RTI or similar system aligned with CCSS).
• Use data to inform instruction and for continuous improvement (e.g.,
benchmark assessments) and provide time for collaboration on the use
of data.
• Improve school safety and discipline and other non-academic factors,
such as students’ social, emotional, and health needs (e.g., implement
PBIS or similar system).
• Provide ongoing mechanisms for family and community engagement.
IMPLEMENT TURNAROUND PRINCIPLES (CONT.)
20
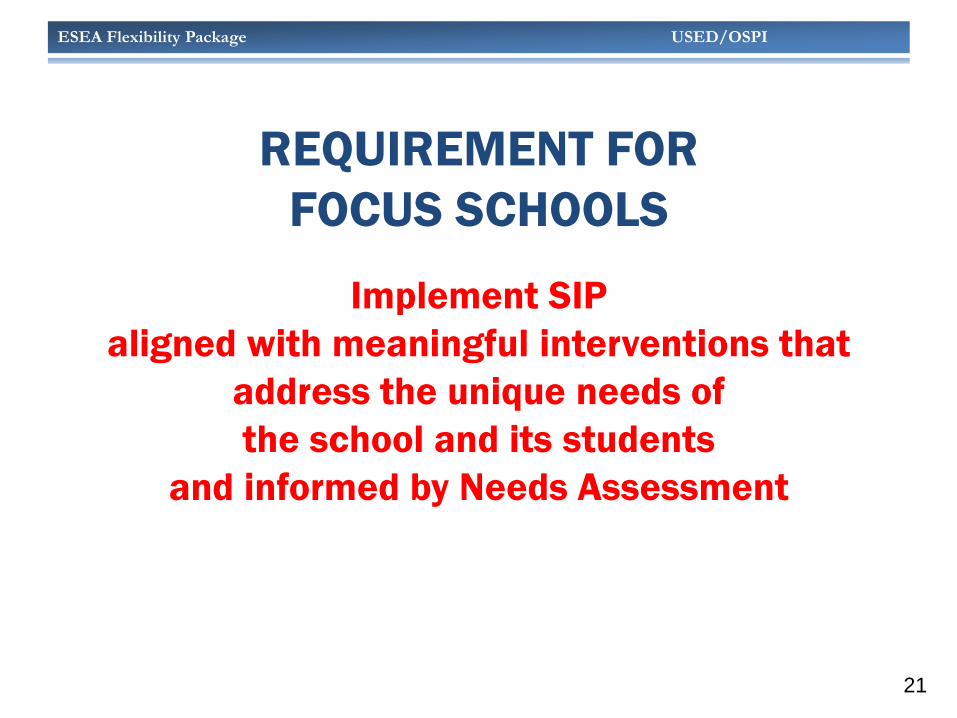
ESEA Flexibility Package USED/OSPI
REQUIREMENT FOR
FOCUS SCHOOLS
Implement SIP
aligned with meaningful interventions that
address the unique needs of
the school and its students
and informed by Needs Assessment
21
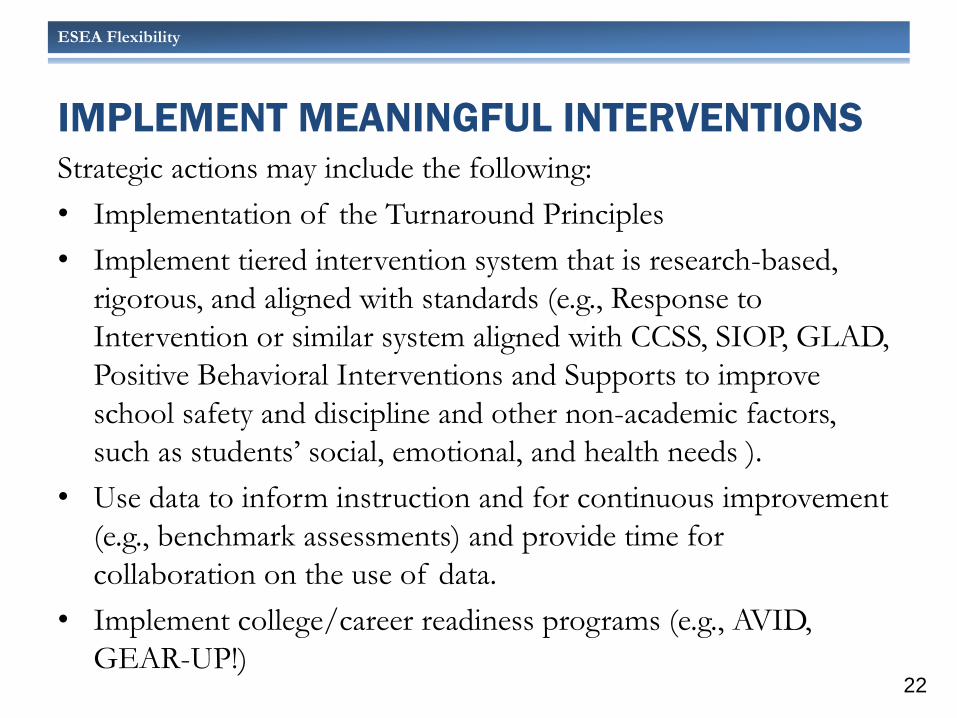
ESEA Flexibility
Strategic actions may include the following:
• Implementation of the Turnaround Principles
• Implement tiered intervention system that is research-based,
rigorous, and aligned with standards (e.g., Response to
Intervention or similar system aligned with CCSS, SIOP, GLAD,
Positive Behavioral Interventions and Supports to improve
school safety and discipline and other non-academic factors,
such as students’ social, emotional, and health needs ).
• Use data to inform instruction and for continuous improvement
(e.g., benchmark assessments) and provide time for
collaboration on the use of data.
• Implement college/career readiness programs (e.g., AVID,
GEAR-UP!)
IMPLEMENT MEANINGFUL INTERVENTIONS
22
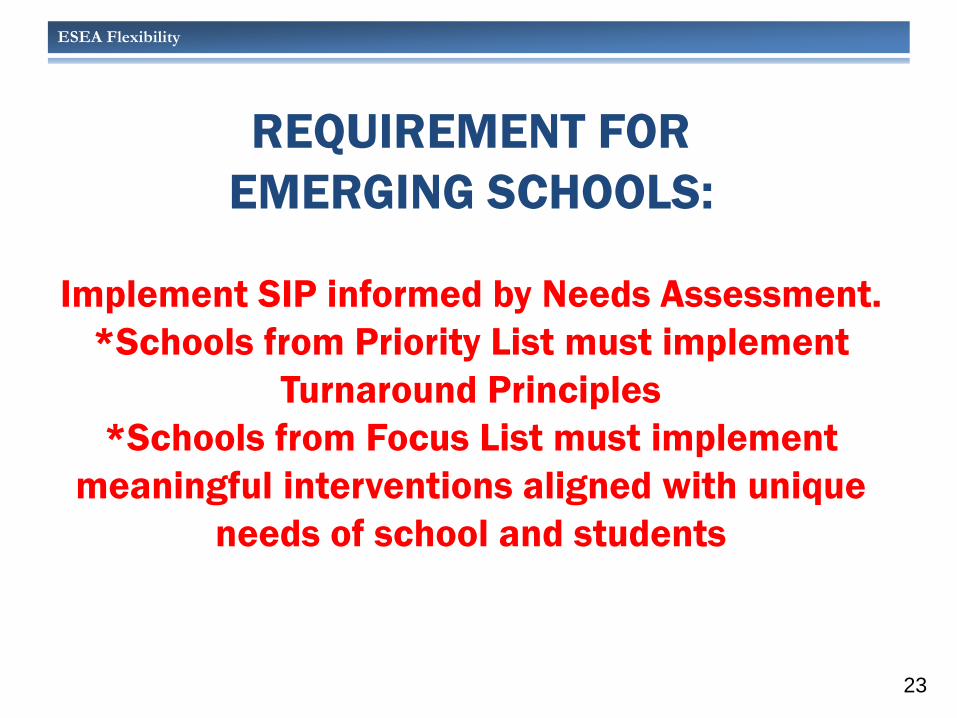
ESEA Flexibility
REQUIREMENT FOR
EMERGING SCHOOLS:
Implement SIP informed by Needs Assessment.
*Schools from Priority List must implement
Turnaround Principles
*Schools from Focus List must implement
meaningful interventions aligned with unique
needs of school and students
23
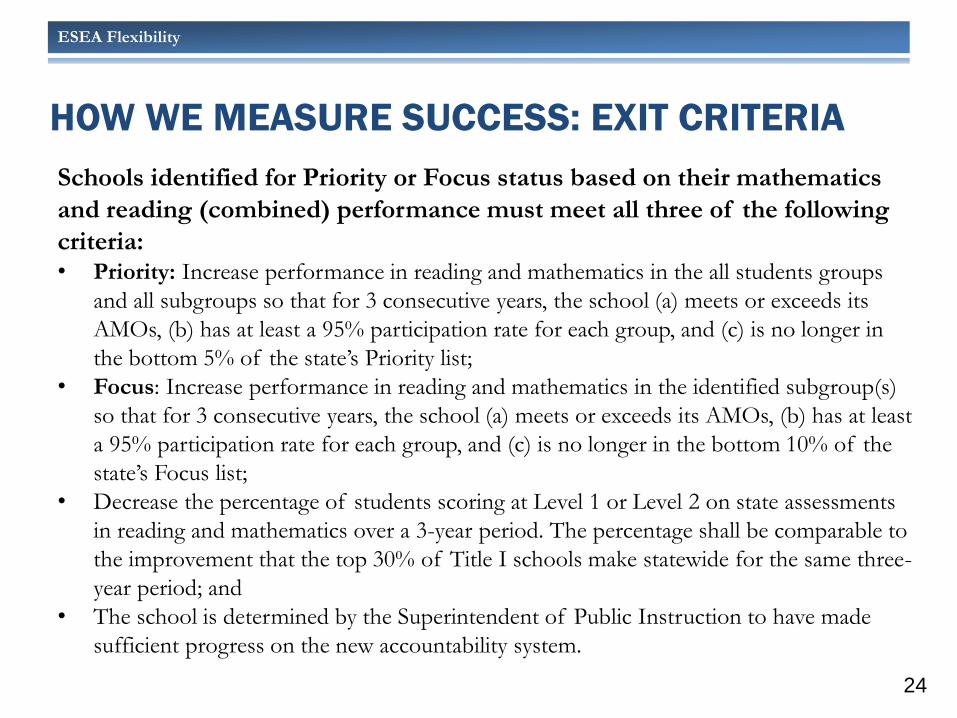
ESEA Flexibility
Schools identified for Priority or Focus status based on their mathematics
and reading (combined) performance must meet all three of the following
criteria: • Priority: Increase performance in reading and mathematics in the all students groups
and all subgroups so that for 3 consecutive years, the school (a) meets or exceeds its
AMOs, (b) has at least a 95% participation rate for each group, and (c) is no longer in
the bottom 5% of the state’s Priority list;
• Focus: Increase performance in reading and mathematics in the identified subgroup(s)
so that for 3 consecutive years, the school (a) meets or exceeds its AMOs, (b) has at least
a 95% participation rate for each group, and (c) is no longer in the bottom 10% of the
state’s Focus list;
• Decrease the percentage of students scoring at Level 1 or Level 2 on state assessments
in reading and mathematics over a 3-year period. The percentage shall be comparable to
the improvement that the top 30% of Title I schools make statewide for the same three-
year period; and
• The school is determined by the Superintendent of Public Instruction to have made
sufficient progress on the new accountability system.
HOW WE MEASURE SUCCESS: EXIT CRITERIA
24
ESEA Flexibility
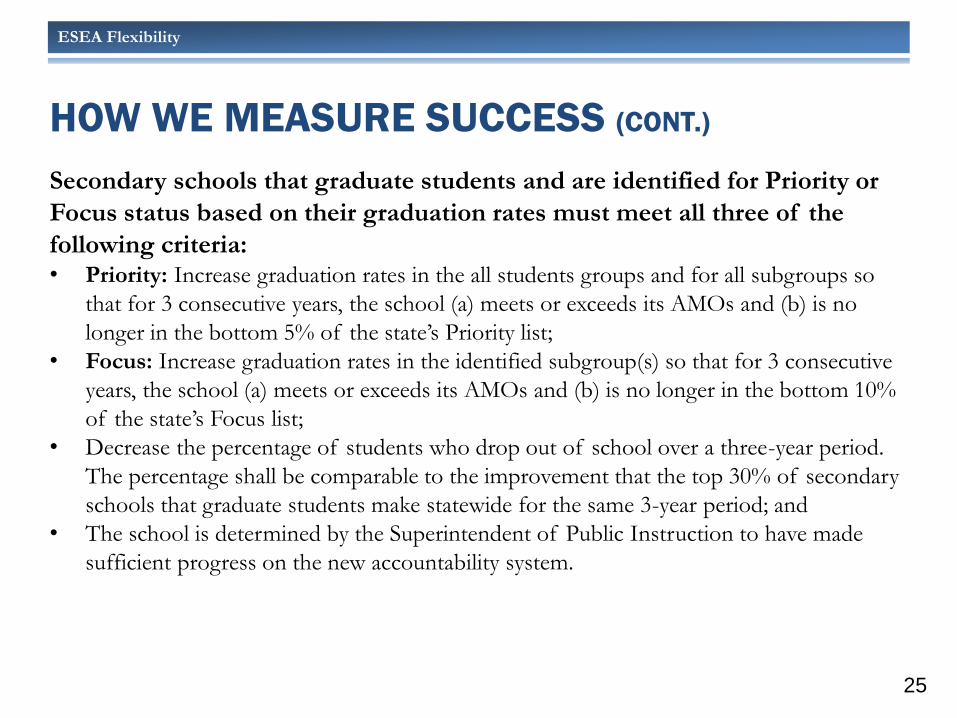
Secondary schools that graduate students and are identified for Priority or
Focus status based on their graduation rates must meet all three of the
following criteria: • Priority: Increase graduation rates in the all students groups and for all subgroups so
that for 3 consecutive years, the school (a) meets or exceeds its AMOs and (b) is no
longer in the bottom 5% of the state’s Priority list;
• Focus: Increase graduation rates in the identified subgroup(s) so that for 3 consecutive
years, the school (a) meets or exceeds its AMOs and (b) is no longer in the bottom 10%
of the state’s Focus list;
• Decrease the percentage of students who drop out of school over a three-year period.
The percentage shall be comparable to the improvement that the top 30% of secondary
schools that graduate students make statewide for the same 3-year period; and
• The school is determined by the Superintendent of Public Instruction to have made
sufficient progress on the new accountability system.
HOW WE MEASURE SUCCESS (CONT.)
25
ESEA Flexibility
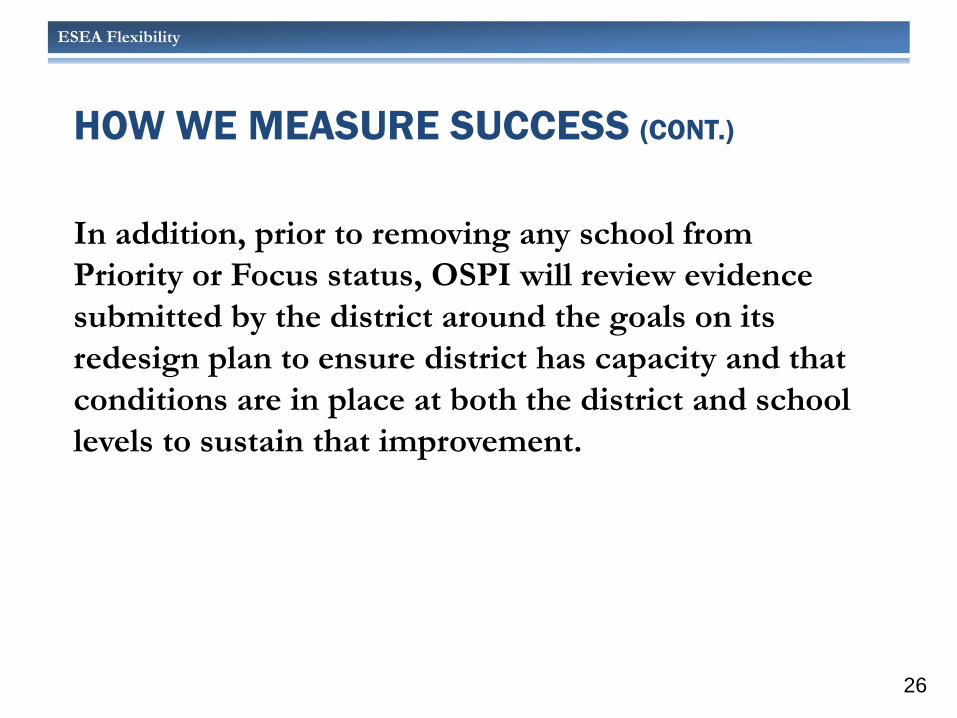
In addition, prior to removing any school from
Priority or Focus status, OSPI will review evidence
submitted by the district around the goals on its
redesign plan to ensure district has capacity and that
conditions are in place at both the district and school
levels to sustain that improvement.
HOW WE MEASURE SUCCESS (CONT.)
26
ESEA Flexibility
SUPPORTS AND SERVICES
27
ESEA Flexibility
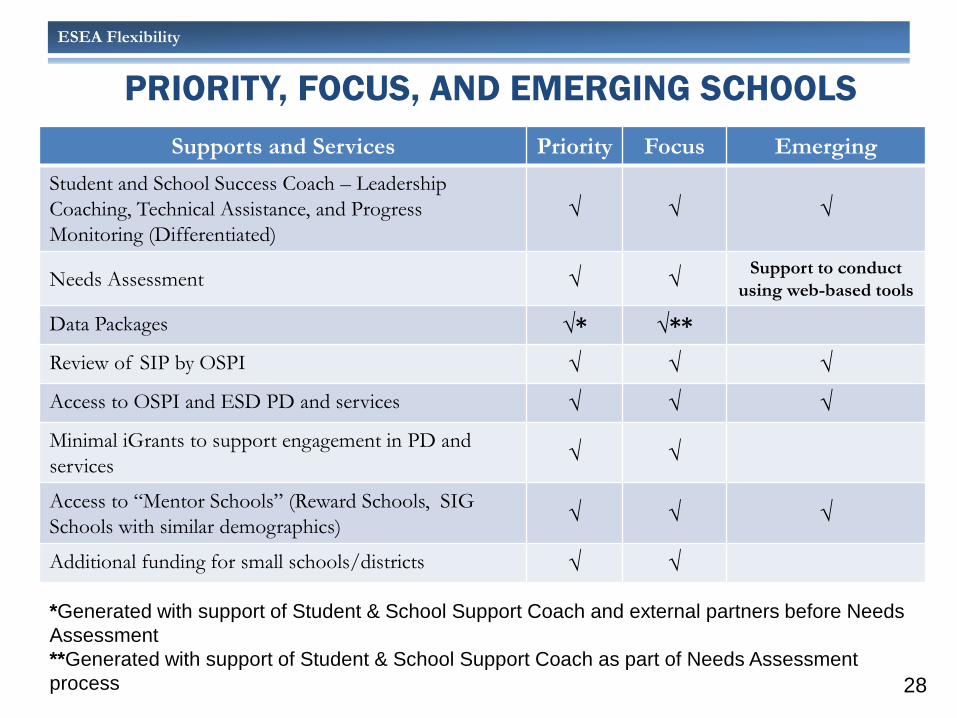
PRIORITY, FOCUS, AND EMERGING SCHOOLS
28
Supports and Services Priority Focus Emerging
Student and School Success Coach – Leadership
Coaching, Technical Assistance, and Progress
Monitoring (Differentiated)
√ √ √
Needs Assessment √ √ Support to conduct
using web-based tools
Data Packages √* √**
Review of SIP by OSPI √ √ √
Access to OSPI and ESD PD and services √ √ √
Minimal iGrants to support engagement in PD and
services √ √
Access to “Mentor Schools” (Reward Schools, SIG
Schools with similar demographics) √ √ √
Additional funding for small schools/districts √ √
*Generated with support of Student & School Support Coach and external partners before Needs
Assessment
**Generated with support of Student & School Support Coach as part of Needs Assessment
process
ESEA Flexibility
CLOSURE…QUESTIONS
29
Updated February 28, 2012 | Page 1
ESEA FLEXIBILITY REQUEST SUMMARY Overview Washington's ESEA Flexibility Request aligns with the State’s long-range education priorities and goals. It builds on recent statewide reform efforts that raise the bar beyond current requirements of the No Child Left Behind (NCLB) accountability system, with the intended outcome of preparing all students with college- and career-ready skills and knowledge. The request outlines Washington’s system of setting clear, high expectations; collecting information to determine progress toward those expectations; and working with schools and districts to provide the necessary supports and interventions to improve outcomes. The request highlights Washington’s focus on the performance of individual students and subgroups, with a continued commitment to publicly report disaggregated data for all subgroups and to target supports to schools with subgroups that are not meeting their targets. Washington's system incentivizes continuous improvement for all schools and districts and is particularly focused on intensive supports and interventions to the most struggling schools. The process to develop a new accountability system, under the leadership of the State Board of Education (SBE) and Office of Superintendent of Public Instruction (OSPI) and in collaboration with the Washington State Legislature’s Joint Select Committee on Educational Accountability, is also described. The request also outlines the strategies and timeline to ensure college-and career-ready standards and assessments for all students, including students with disabilities, English language learners, and students from historically underserved subgroups. In addition, the request describes Washington’s Teacher and Principal Evaluation Project and next steps as we move forward to full implementation of the leadership and instructional frameworks in 2014-15. A comprehensive summary of the ESEA Flexibility Request follows.
Summary of the ESEA Flexibility Request and Process 1. What is the ESEA flexibility opportunity?
Last September, the U.S. Department of Education (ED) announced guidelines for state educational agencies (OSPI in Washington State) to apply for flexibility that would allow relief from existing sanctions under the No Child Left Behind (NCLB) accountability system. 2. Why did ED choose this time to offer states flexibility opportunities?
NCLB refers to the 2002 iteration of the Elementary and Secondary Education Act (ESEA) that was first passed by Congress in the mid-1960s and has been periodically reauthorized since then. NCLB was supposed to be reauthorized in 2007, but Congress has not been able to agree on a reauthorization package—meaning the existing law stayed in effect. ED and Education Secretary Arne Duncan offered the flexibility partly because of frustration with Congress over the delay, and partly because of the almost universal frustration among educators and many educational advocates regarding NCLB and its unwieldy and often unenforceable adequate yearly progress (AYP) regulations and sanctions. 3. What are the benefits of being granted this flexibility?
States receiving this flexibility are relieved of NCLB rules regarding Adequate Yearly Progress (AYP), including consequences for Title I schools and districts that do not meet the elementary, middle, and secondary proficiency levels in state testing for math and reading. This means that the roughly two-thirds of schools in Washington that did not make AYP in 2011 would not have to (a) send Public School Choice letters or (b) set aside 20% of their Title I allocation for Supplementary Educational Service (SES) providers and for supporting students who leave the district under Public School Choice. This flexibility will give other relief from certain rules, but most districts will benefit most from Public School Choice and SES flexibility. The request also provides states with flexibility to determine new ambitious and achievable annual targets for state assessments in Reading and Mathematics and for graduation rates. 4. If this flexibility is granted, when will relief from these regulations go into effect?
Relief begins immediately after the flexibility is granted. 5. Did Washington apply for an ESEA Flexibility Request?
Yes. On February 27, with Superintendent Dorn’s concurrence, Washington submitted an ESEA Flexibility Request. Superintendent Dorn chose the February date to assure that, once flexibility is granted, the school choice and 20% set-aside relief will go into effect for 2012–13. Waiting until September to submit the request would likely have the effect of delaying relief until 2013–14. 6. What must the State do to qualify for this flexibility?
ED has established four principles that must be met. Principle 1—College- and Career-Ready Expectations for All Students Principle 2—State-Developed Differentiated Recognition, Accountability, and Support Principle 3—Supporting Effective Instruction and Leadership Principle 4—Reducing Duplication and Unnecessary Burden on Districts by the State
For Washington, Principle 1—College- and Career-Ready Expectations for All Students—is met primarily through our adoption of the Common Core State Standards (CCSS) in English language arts and mathematics and the state’s plan to implement CCSS. Additionally, Washington
Updated February 28, 2012 | Page 2
State’s role as a lead state with SMARTER Balanced Assessment Consortium (SBAC) satisfies the requirement to administer high-quality assessments to all students by 2014-15. The major “lift” for Washington is contained in Principle 2—State-Developed Differentiated Recognition, Accountability, and Support—which essentially is the construction of a new state accountability system. Principle 3—Supporting Effective Instruction and Leadership—is met through the teacher/principal evaluation components of E2SSB 6696 and ESSB 5985. Principle 4—Reducing Duplication and Unnecessary Burden on Districts by the State—is an ongoing task in all states. 7. Is stakeholder input a necessary part of the ESEA Flexibility Request?
Yes. ED rules specifically call for stakeholder input, especially teachers and their representatives, school and district administrators, plus diverse groups such as students, parents, community-based organizations, civil rights organizations, organizations representing students with disabilities and English learners, business organizations, Indian tribes, and Title I Committee of Practitioners. Efforts have been made to engage all of those groups and other educational stakeholders. In addition, OSPI, working with the SBE, produced a draft and multiple revisions of the request; each of these documents was posted on the OSPI website. Stakeholders were asked to provide input on the initial draft. Superintendent Dorn reviewed survey input from those who analyzed the draft prior to making his submission decision. NOTE: Over 75% of survey respondents recommended that Superintendent Dorn submit the request to ED. 8. Where can more information about the ESEA Flexibility Request be found?
The Washington State ESEA Flexibility Request can be found at www.k12.wa.us/ESEA/PublicNotice.aspx. *****************************************************************************************************
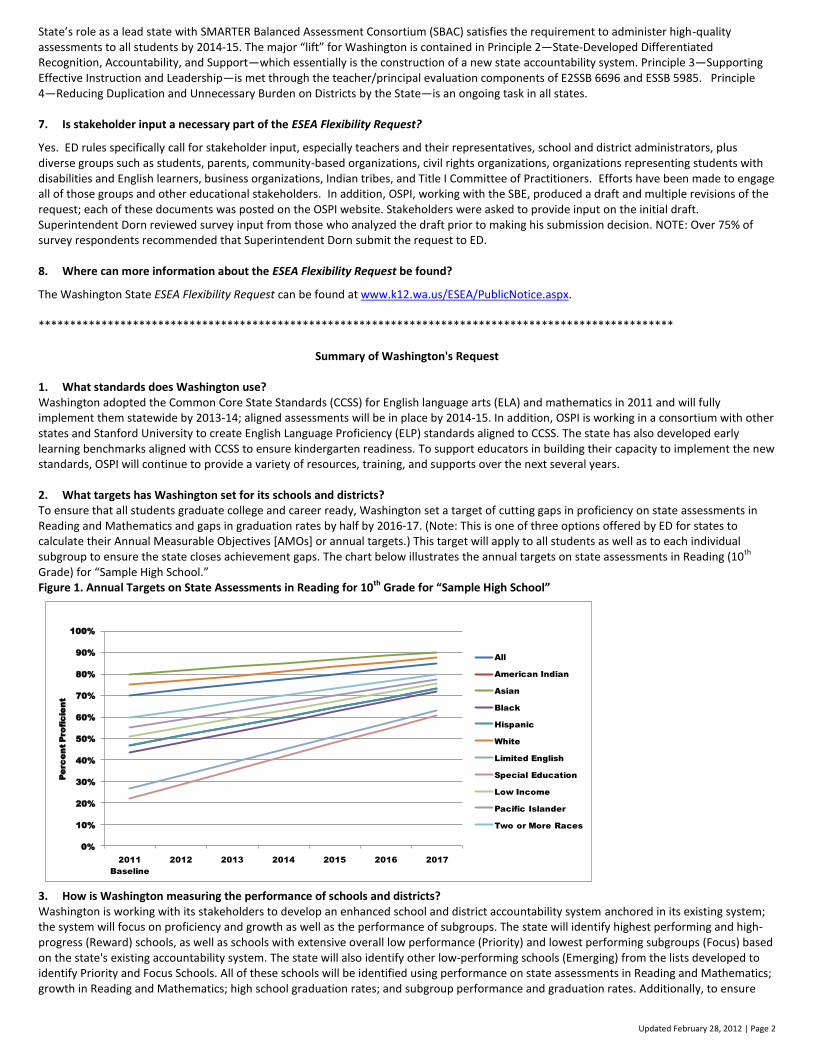
Summary of Washington's Request 1. What standards does Washington use? Washington adopted the Common Core State Standards (CCSS) for English language arts (ELA) and mathematics in 2011 and will fully implement them statewide by 2013-14; aligned assessments will be in place by 2014-15. In addition, OSPI is working in a consortium with other states and Stanford University to create English Language Proficiency (ELP) standards aligned to CCSS. The state has also developed early learning benchmarks aligned with CCSS to ensure kindergarten readiness. To support educators in building their capacity to implement the new standards, OSPI will continue to provide a variety of resources, training, and supports over the next several years. 2. What targets has Washington set for its schools and districts? To ensure that all students graduate college and career ready, Washington set a target of cutting gaps in proficiency on state assessments in Reading and Mathematics and gaps in graduation rates by half by 2016-17. (Note: This is one of three options offered by ED for states to calculate their Annual Measurable Objectives [AMOs] or annual targets.) This target will apply to all students as well as to each individual subgroup to ensure the state closes achievement gaps. The chart below illustrates the annual targets on state assessments in Reading (10th Grade) for “Sample High School.” Figure 1. Annual Targets on State Assessments in Reading for 10th Grade for “Sample High School” 3. How is Washington measuring the performance of schools and districts? Washington is working with its stakeholders to develop an enhanced school and district accountability system anchored in its existing system; the system will focus on proficiency and growth as well as the performance of subgroups. The state will identify highest performing and high-progress (Reward) schools, as well as schools with extensive overall low performance (Priority) and lowest performing subgroups (Focus) based on the state's existing accountability system. The state will also identify other low-performing schools (Emerging) from the lists developed to identify Priority and Focus Schools. All of these schools will be identified using performance on state assessments in Reading and Mathematics; growth in Reading and Mathematics; high school graduation rates; and subgroup performance and graduation rates. Additionally, to ensure
0%
10%
20%
30%
40%
50%
60%
70%
80%
90%
100%
2011
Baseline
2012 2013 2014 2015 2016 2017
Pe
rc
en
t P
ro
fic
ie
nt
All
American Indian
Asian
Black
Hispanic
White
Limited English
Special Education
Low Income
Pacific Islander
Two or More Races
Updated February 28, 2012 | Page 3
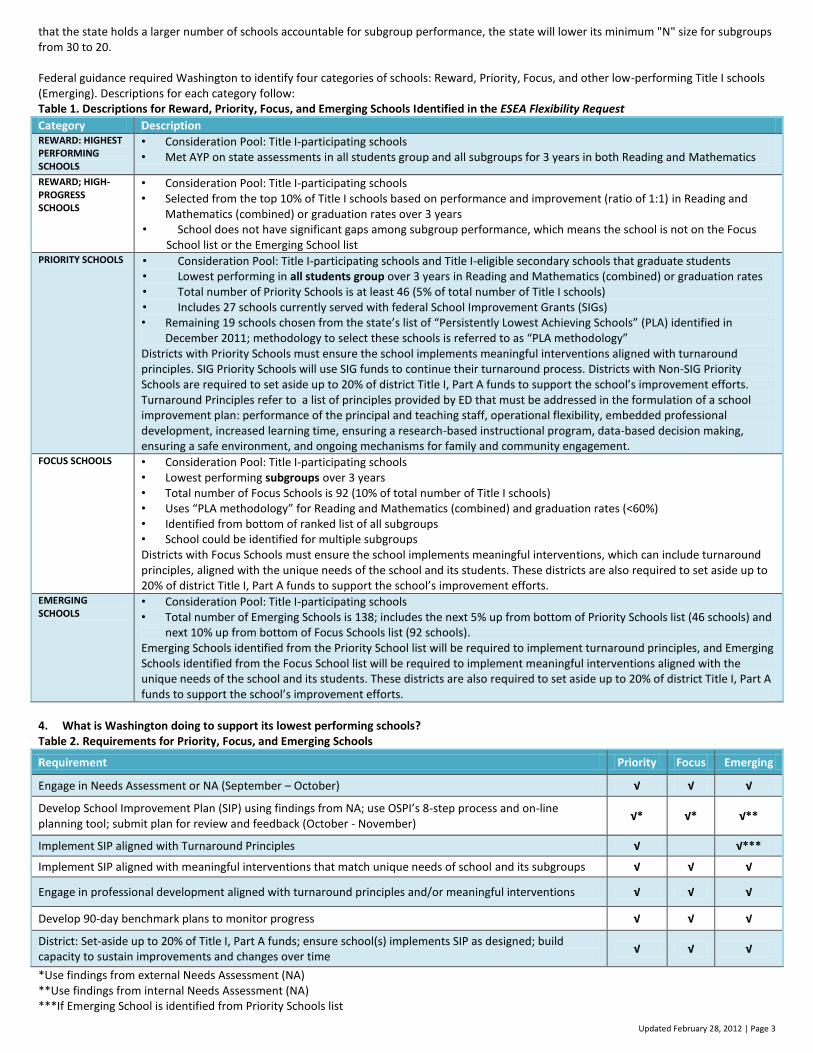
that the state holds a larger number of schools accountable for subgroup performance, the state will lower its minimum "N" size for subgroups from 30 to 20. Federal guidance required Washington to identify four categories of schools: Reward, Priority, Focus, and other low-performing Title I schools (Emerging). Descriptions for each category follow: Table 1. Descriptions for Reward, Priority, Focus, and Emerging Schools Identified in the ESEA Flexibility Request
Category Description REWARD: HIGHEST PERFORMING SCHOOLS
• Consideration Pool: Title I-participating schools • Met AYP on state assessments in all students group and all subgroups for 3 years in both Reading and Mathematics
REWARD; HIGH-PROGRESS SCHOOLS
• Consideration Pool: Title I-participating schools • Selected from the top 10% of Title I schools based on performance and improvement (ratio of 1:1) in Reading and
Mathematics (combined) or graduation rates over 3 years • School does not have significant gaps among subgroup performance, which means the school is not on the Focus
School list or the Emerging School list PRIORITY SCHOOLS • Consideration Pool: Title I-participating schools and Title I-eligible secondary schools that graduate students
• Lowest performing in all students group over 3 years in Reading and Mathematics (combined) or graduation rates • Total number of Priority Schools is at least 46 (5% of total number of Title I schools) • Includes 27 schools currently served with federal School Improvement Grants (SIGs) • Remaining 19 schools chosen from the state’s list of “Persistently Lowest Achieving Schools” (PLA) identified in
December 2011; methodology to select these schools is referred to as “PLA methodology” Districts with Priority Schools must ensure the school implements meaningful interventions aligned with turnaround principles. SIG Priority Schools will use SIG funds to continue their turnaround process. Districts with Non-SIG Priority Schools are required to set aside up to 20% of district Title I, Part A funds to support the school’s improvement efforts. Turnaround Principles refer to a list of principles provided by ED that must be addressed in the formulation of a school improvement plan: performance of the principal and teaching staff, operational flexibility, embedded professional development, increased learning time, ensuring a research-based instructional program, data-based decision making, ensuring a safe environment, and ongoing mechanisms for family and community engagement.
FOCUS SCHOOLS • Consideration Pool: Title I-participating schools • Lowest performing subgroups over 3 years • Total number of Focus Schools is 92 (10% of total number of Title I schools) • Uses “PLA methodology” for Reading and Mathematics (combined) and graduation rates (<60%) • Identified from bottom of ranked list of all subgroups • School could be identified for multiple subgroups Districts with Focus Schools must ensure the school implements meaningful interventions, which can include turnaround principles, aligned with the unique needs of the school and its students. These districts are also required to set aside up to 20% of district Title I, Part A funds to support the school’s improvement efforts.
EMERGING SCHOOLS
• Consideration Pool: Title I-participating schools • Total number of Emerging Schools is 138; includes the next 5% up from bottom of Priority Schools list (46 schools) and
next 10% up from bottom of Focus Schools list (92 schools). Emerging Schools identified from the Priority School list will be required to implement turnaround principles, and Emerging Schools identified from the Focus School list will be required to implement meaningful interventions aligned with the unique needs of the school and its students. These districts are also required to set aside up to 20% of district Title I, Part A funds to support the school’s improvement efforts.
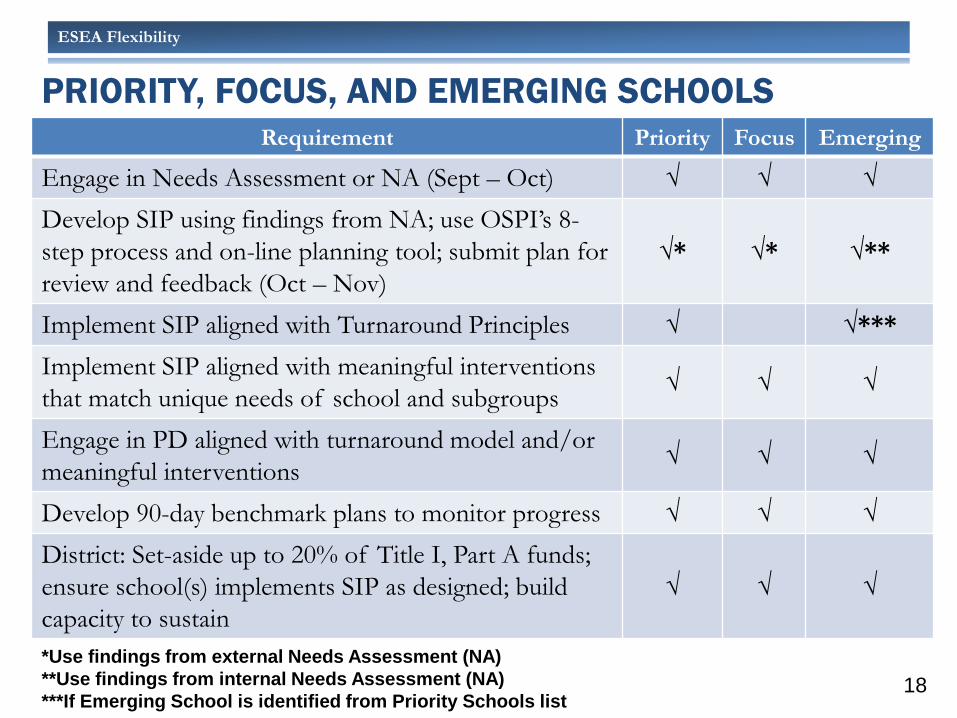
4. What is Washington doing to support its lowest performing schools? Table 2. Requirements for Priority, Focus, and Emerging Schools
Requirement Priority Focus Emerging
Engage in Needs Assessment or NA (September – October) √ √ √
Develop School Improvement Plan (SIP) using findings from NA; use OSPI’s 8-step process and on-line planning tool; submit plan for review and feedback (October - November)
√* √* √**
Implement SIP aligned with Turnaround Principles √
√***
Implement SIP aligned with meaningful interventions that match unique needs of school and its subgroups √ √ √
Engage in professional development aligned with turnaround principles and/or meaningful interventions √ √ √
Develop 90-day benchmark plans to monitor progress √ √ √
District: Set-aside up to 20% of Title I, Part A funds; ensure school(s) implements SIP as designed; build capacity to sustain improvements and changes over time
√ √ √
*Use findings from external Needs Assessment (NA) **Use findings from internal Needs Assessment (NA) ***If Emerging School is identified from Priority Schools list
Updated February 28, 2012 | Page 4
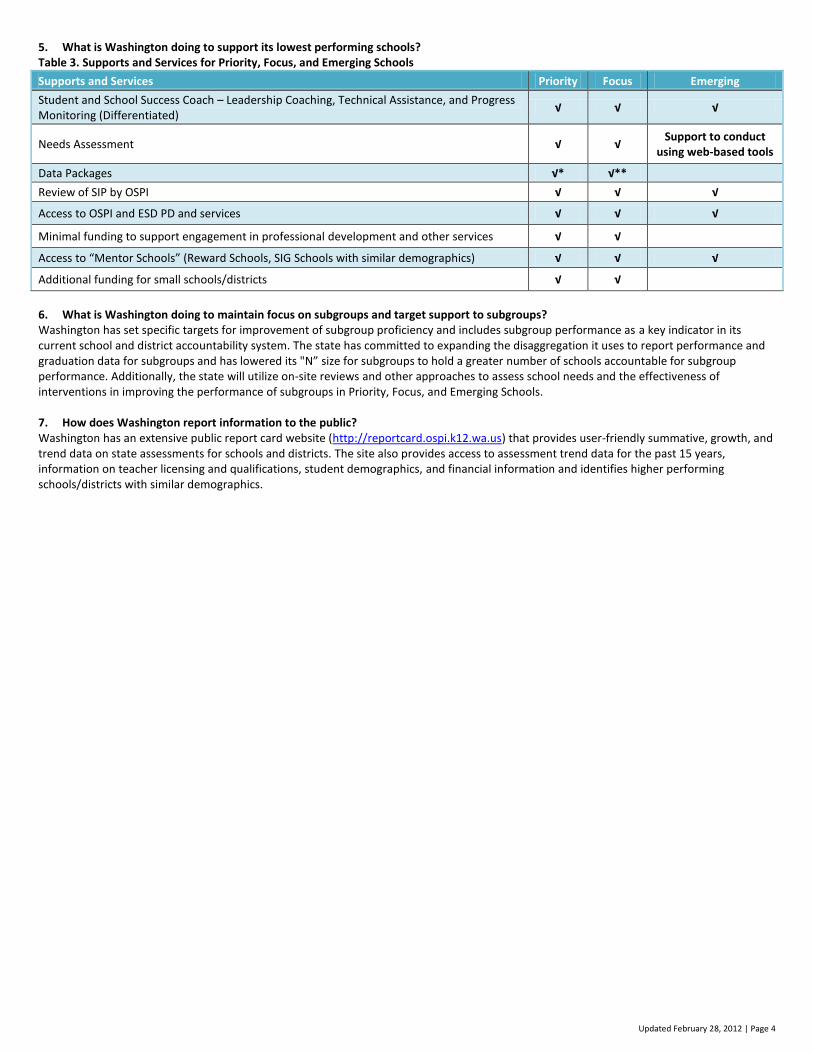
5. What is Washington doing to support its lowest performing schools? Table 3. Supports and Services for Priority, Focus, and Emerging Schools
Supports and Services Priority Focus Emerging
Student and School Success Coach – Leadership Coaching, Technical Assistance, and Progress Monitoring (Differentiated)
√ √ √
Needs Assessment √ √ Support to conduct
using web-based tools
Data Packages √* √**
Review of SIP by OSPI √ √ √
Access to OSPI and ESD PD and services √ √ √
Minimal funding to support engagement in professional development and other services √ √
Access to “Mentor Schools” (Reward Schools, SIG Schools with similar demographics) √ √ √
Additional funding for small schools/districts √ √
6. What is Washington doing to maintain focus on subgroups and target support to subgroups? Washington has set specific targets for improvement of subgroup proficiency and includes subgroup performance as a key indicator in its current school and district accountability system. The state has committed to expanding the disaggregation it uses to report performance and graduation data for subgroups and has lowered its "N” size for subgroups to hold a greater number of schools accountable for subgroup performance. Additionally, the state will utilize on-site reviews and other approaches to assess school needs and the effectiveness of interventions in improving the performance of subgroups in Priority, Focus, and Emerging Schools. 7. How does Washington report information to the public? Washington has an extensive public report card website (http://reportcard.ospi.k12.wa.us) that provides user-friendly summative, growth, and trend data on state assessments for schools and districts. The site also provides access to assessment trend data for the past 15 years, information on teacher licensing and qualifications, student demographics, and financial information and identifies higher performing schools/districts with similar demographics.
The Washington State Board of Education 1
Update on
Washington State
Graduation Requirements
PRESENTATION TO THE EDUCATIONAL
OPPORTUNITY GAP OVERSIGHT AND
ACCOUNTABILITY COMMITTEE, JULY 31, 2012
Linda Drake, Senior Policy Analyst
The Washington State Board of Education 2
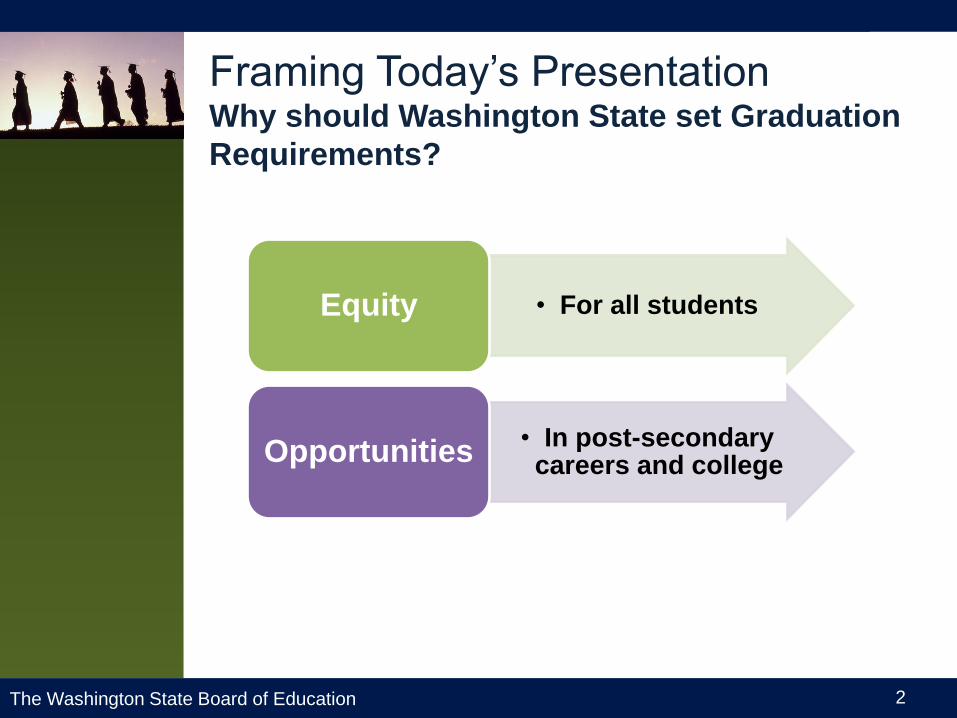
Framing Today’s Presentation Why should Washington State set Graduation
Requirements?
• For all students Equity
• In post-secondary careers and college Opportunities
8/6/2012
2
The Washington State Board of Education 3
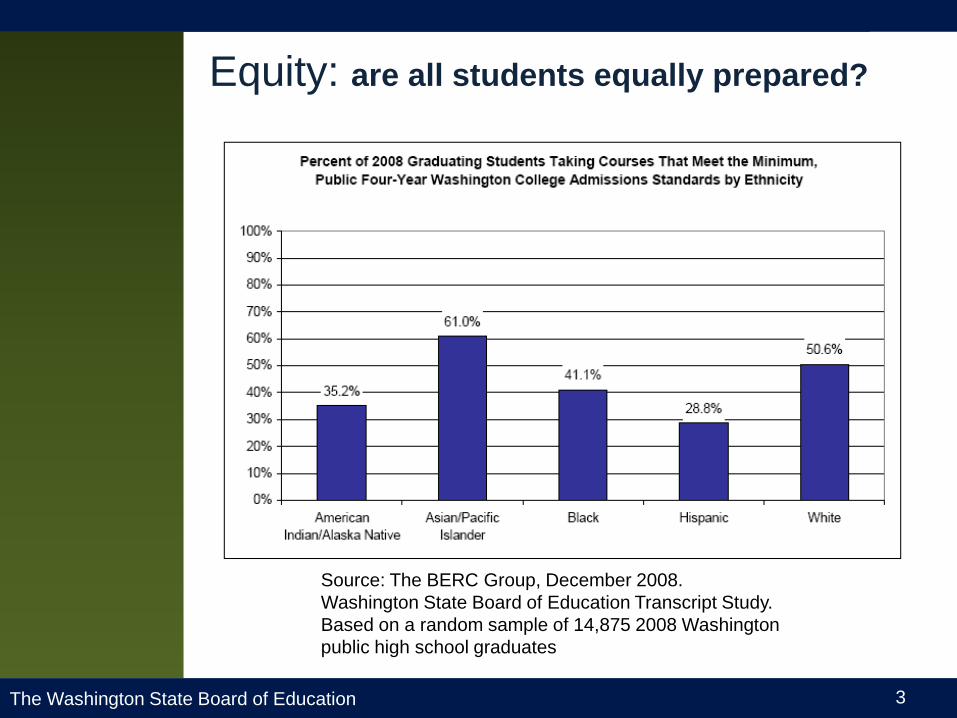
Equity: are all students equally prepared?
Source: The BERC Group, December 2008.
Washington State Board of Education Transcript Study.
Based on a random sample of 14,875 2008 Washington
public high school graduates
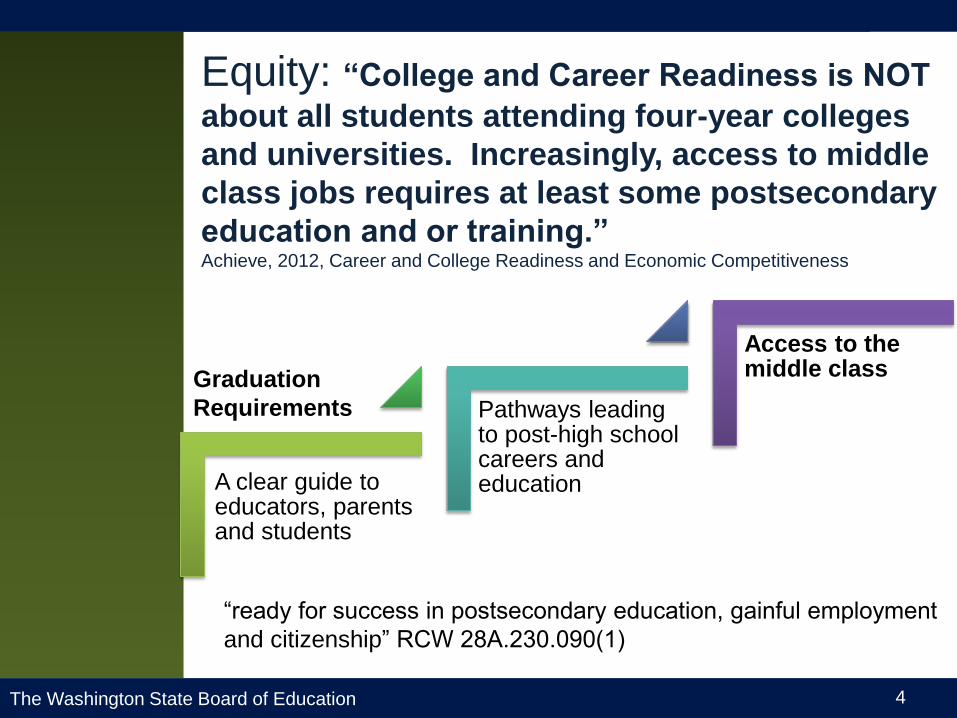
The Washington State Board of Education 4
Equity: “College and Career Readiness is NOT
about all students attending four-year colleges
and universities. Increasingly, access to middle
class jobs requires at least some postsecondary
education and or training.” Achieve, 2012, Career and College Readiness and Economic Competitiveness
8/6/2012
4
A clear guide to educators, parents and students
Pathways leading to post-high school careers and education
Access to the middle class Graduation
Requirements
“ready for success in postsecondary education, gainful employment
and citizenship” RCW 28A.230.090(1)
The Washington State Board of Education 5
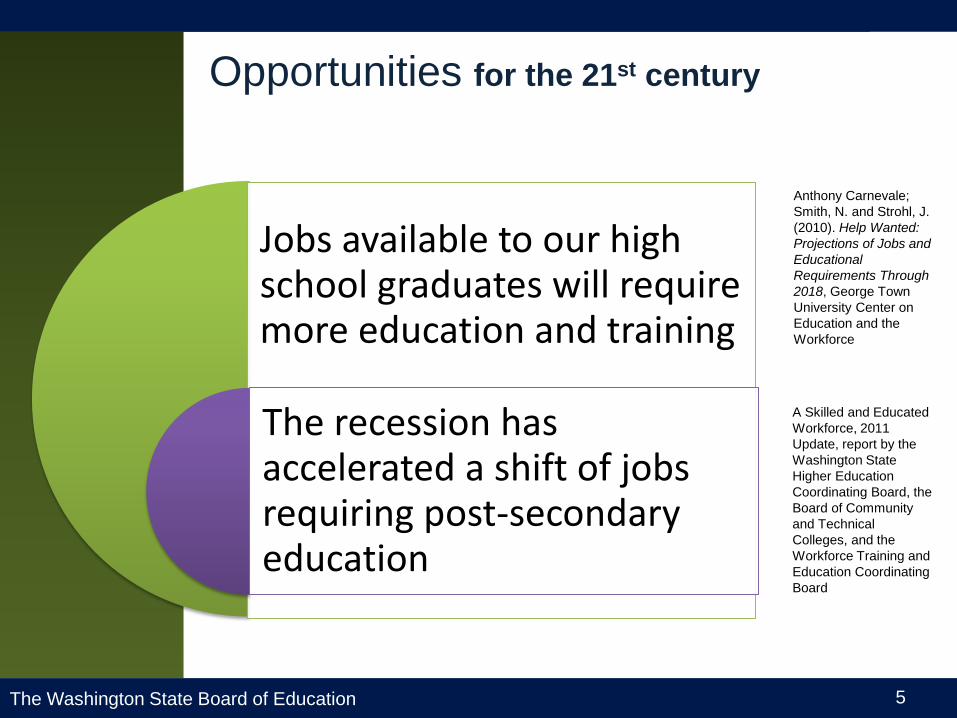
Opportunities for the 21st century
Jobs available to our high school graduates will require more education and training
The recession has accelerated a shift of jobs requiring post-secondary education
Anthony Carnevale;
Smith, N. and Strohl, J.
(2010). Help Wanted:
Projections of Jobs and
Educational
Requirements Through
2018, George Town
University Center on
Education and the
Workforce
A Skilled and Educated
Workforce, 2011
Update, report by the
Washington State
Higher Education
Coordinating Board, the
Board of Community
and Technical
Colleges, and the
Workforce Training and
Education Coordinating
Board
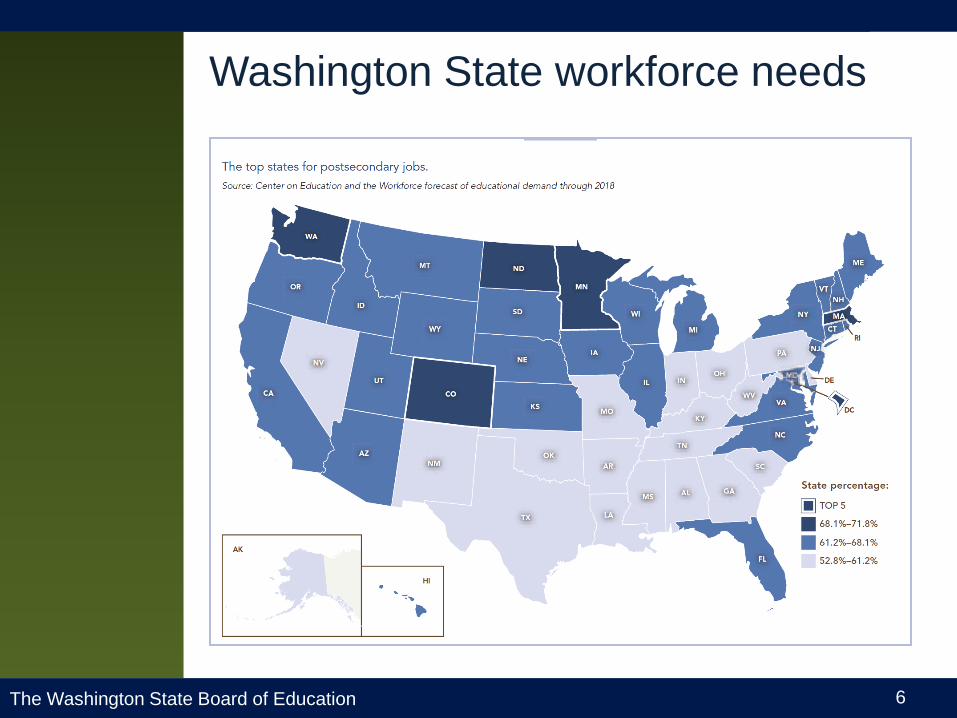
The Washington State Board of Education 6
Washington State workforce needs
8/6/2012
6
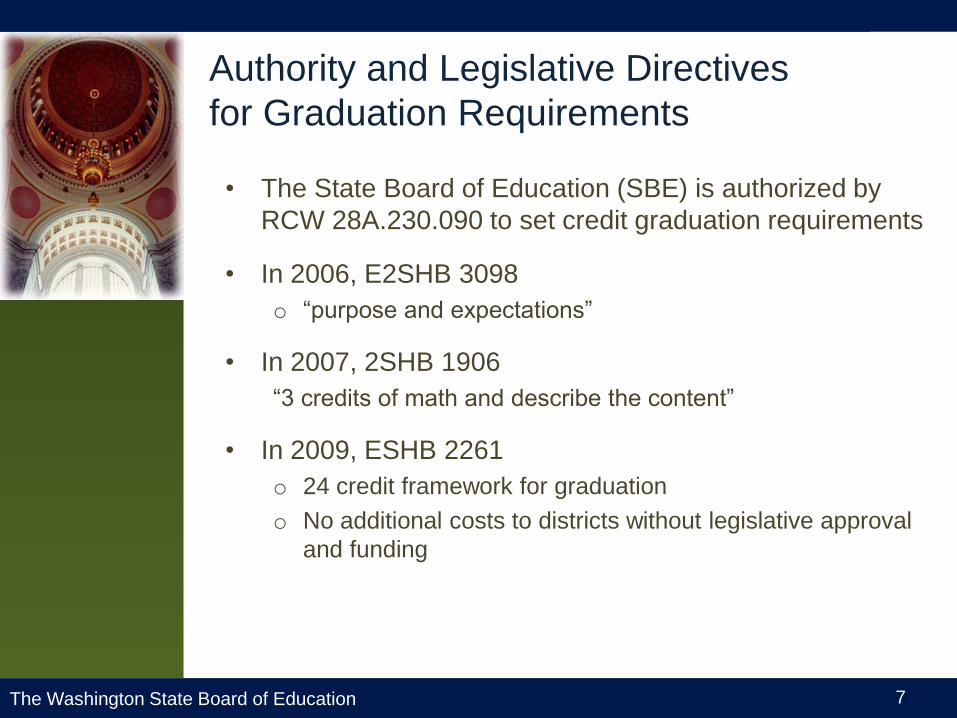
The Washington State Board of Education 7
Authority and Legislative Directives
for Graduation Requirements
• The State Board of Education (SBE) is authorized by
RCW 28A.230.090 to set credit graduation requirements
• In 2006, E2SHB 3098
o “purpose and expectations”
• In 2007, 2SHB 1906
“3 credits of math and describe the content”
• In 2009, ESHB 2261
o 24 credit framework for graduation
o No additional costs to districts without legislative approval
and funding
8/6/2012
7
The Washington State Board of Education 8
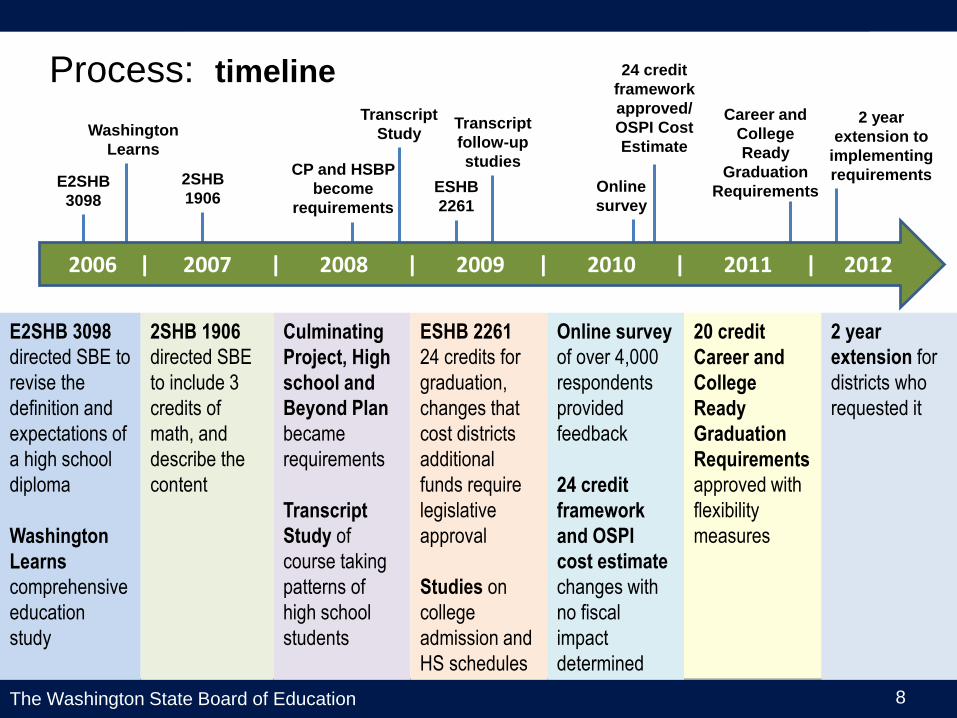
Process: Timeline
8/6/2012
8
E2SHB
3098
2SHB
1906 ESHB
2261
Transcript
Study Washington
Learns
CP and HSBP
become
requirements
Transcript
follow-up
studies
Online
survey
24 credit
framework
approved/
OSPI Cost
Estimate
Career and
College
Ready
Graduation
Requirements
2 year
extension to
implementing
requirements
E2SHB 3098
directed SBE to
revise the
definition and
expectations of
a high school
diploma
Washington
Learns
comprehensive
education
study
2SHB 1906
directed SBE
to include 3
credits of
math, and
describe the
content
Culminating
Project, High
school and
Beyond Plan
became
requirements
Transcript
Study of
course taking
patterns of
high school
students
ESHB 2261
24 credits for
graduation,
changes that
cost districts
additional
funds require
legislative
approval
Studies on
college
admission and
HS schedules
Online survey
of over 4,000
respondents
provided
feedback
24 credit
framework
and OSPI
cost estimate
changes with
no fiscal
impact
determined
20 credit
Career and
College
Ready
Graduation
Requirements
approved with
flexibility
measures
2 year
extension for
districts who
requested it
Process: timeline
2006 | 2007 | 2008 | 2009 | 2010 | 2011 | 2012
The Washington State Board of Education 9
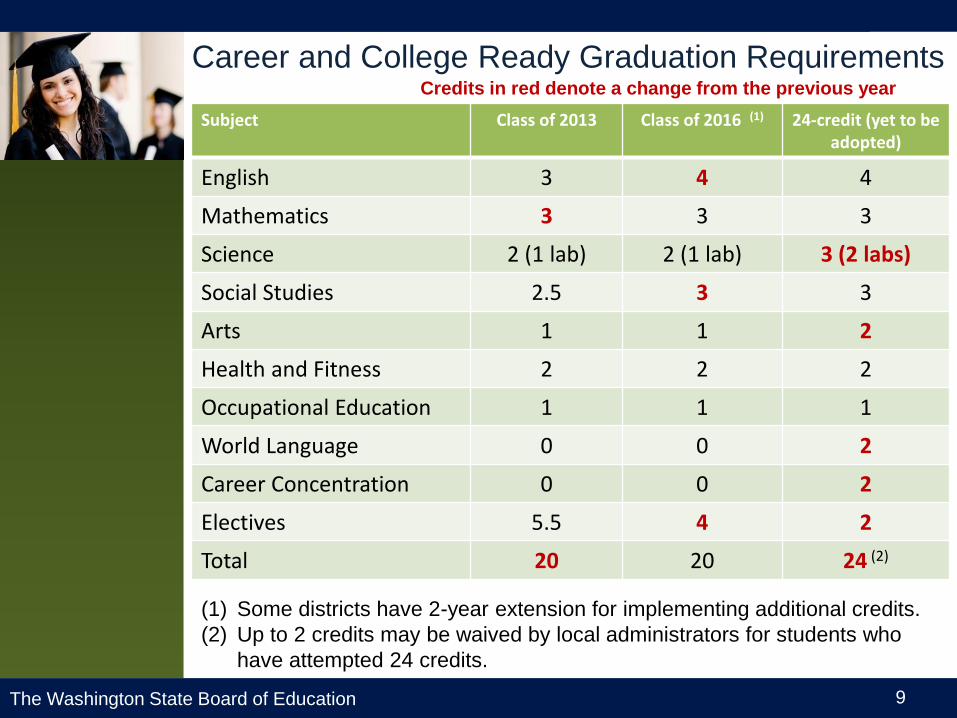
Career and College Ready Graduation Requirements
Subject Class of 2013 Class of 2016 (1) 24-credit (yet to be adopted)
English 3 4 4
Mathematics 3 3 3
Science 2 (1 lab) 2 (1 lab) 3 (2 labs)
Social Studies 2.5 3 3
Arts 1 1 2
Health and Fitness 2 2 2
Occupational Education 1 1 1
World Language 0 0 2
Career Concentration 0 0 2
Electives 5.5 4 2
Total 20 20 24 (2)
8/6/2012
9
(1) Some districts have 2-year extension for implementing additional credits.
(2) Up to 2 credits may be waived by local administrators for students who
have attempted 24 credits.
Credits in red denote a change from the previous year
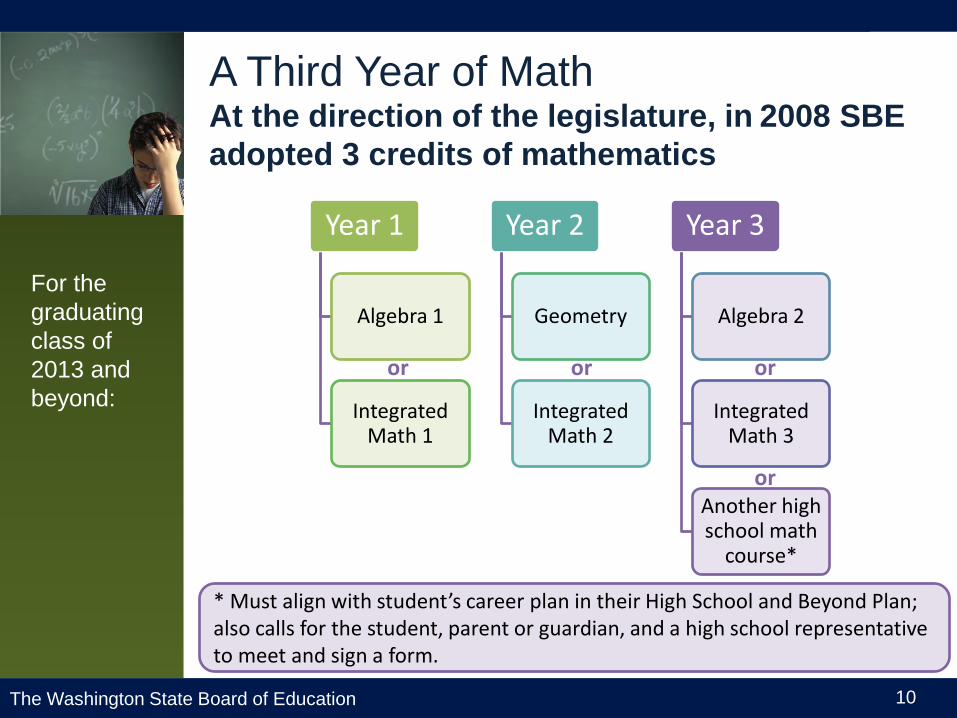
The Washington State Board of Education 10
A Third Year of Math At the direction of the legislature, in 2008 SBE
adopted 3 credits of mathematics
Year 1
Algebra 1
Integrated Math 1
Year 2
Geometry
Integrated Math 2
Year 3
Algebra 2
Integrated Math 3
Another high school math
course*
8/6/2012
10
or or or
or
* Must align with student’s career plan in their High School and Beyond Plan; also calls for the student, parent or guardian, and a high school representative to meet and sign a form.
For the
graduating
class of
2013 and
beyond:
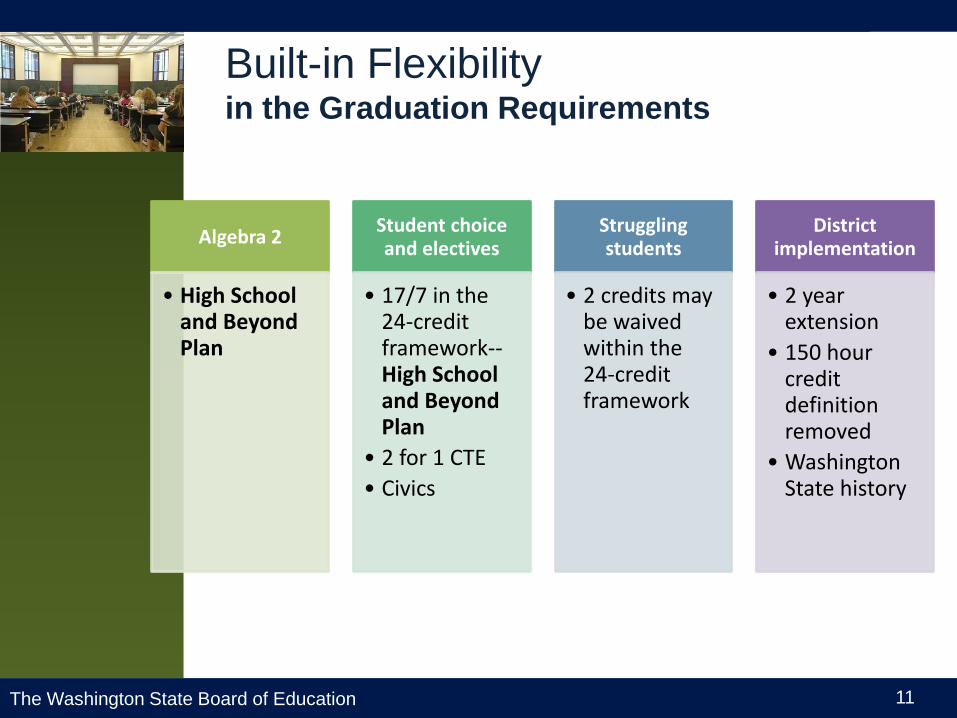
The Washington State Board of Education 11
Built-in Flexibility in the Graduation Requirements
Algebra 2
• High School and Beyond Plan
Student choice and electives
• 17/7 in the 24-credit framework--High School and Beyond Plan
• 2 for 1 CTE
• Civics
Struggling students
• 2 credits may be waived within the 24-credit framework
District implementation
• 2 year extension
• 150 hour credit definition removed
• Washington State history
8/6/2012
11
The Washington State Board of Education 12
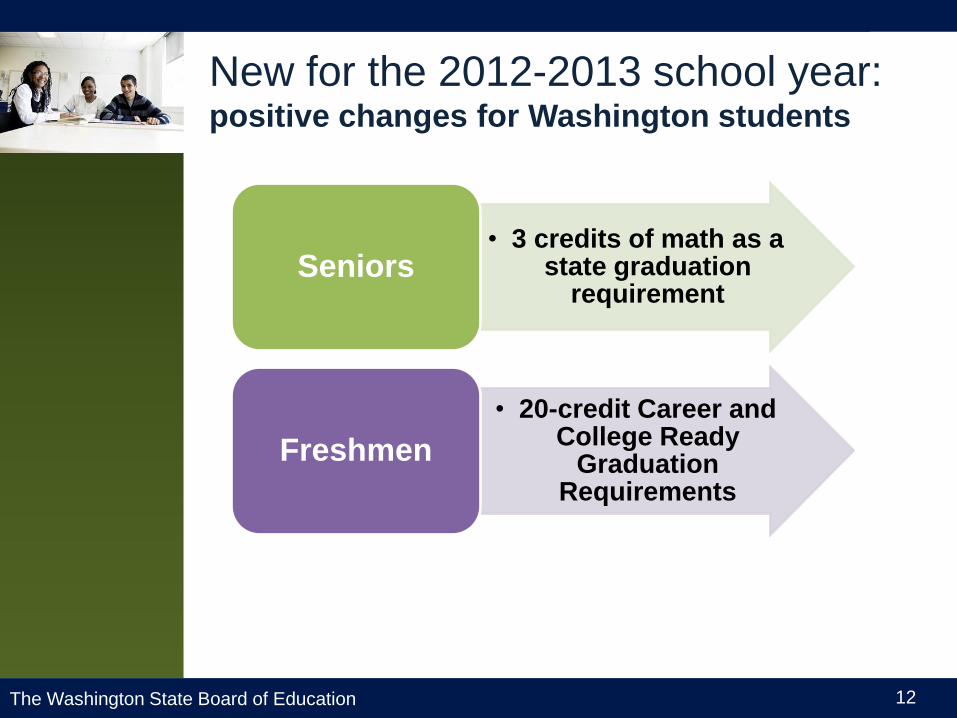
New for the 2012-2013 school year: positive changes for Washington students
8/6/2012
12
• 3 credits of math as a state graduation
requirement Seniors
• 20-credit Career and College Ready
Graduation Requirements
Freshmen
The Washington State Board of Education 13
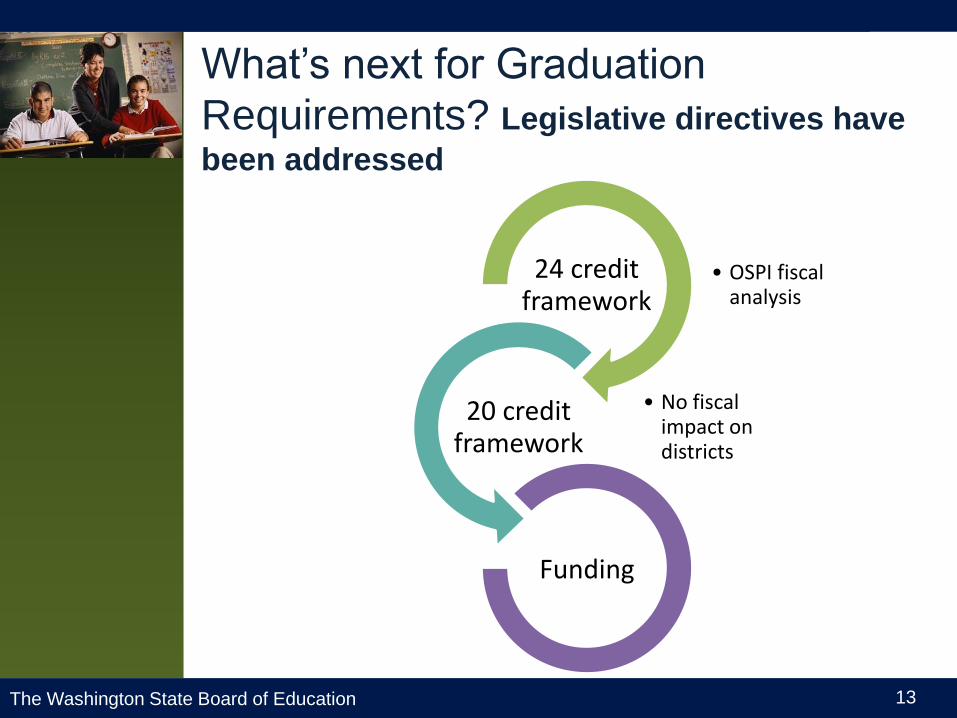
What’s next for Graduation
Requirements? Legislative directives have
been addressed
• OSPI fiscal analysis
24 credit framework
• No fiscal impact on districts
20 credit framework
Funding
8/6/2012
13
The Washington State Board of Education 14
Questions?
For more information, contact:
Linda Drake
260.725.6028
8/6/2012
14
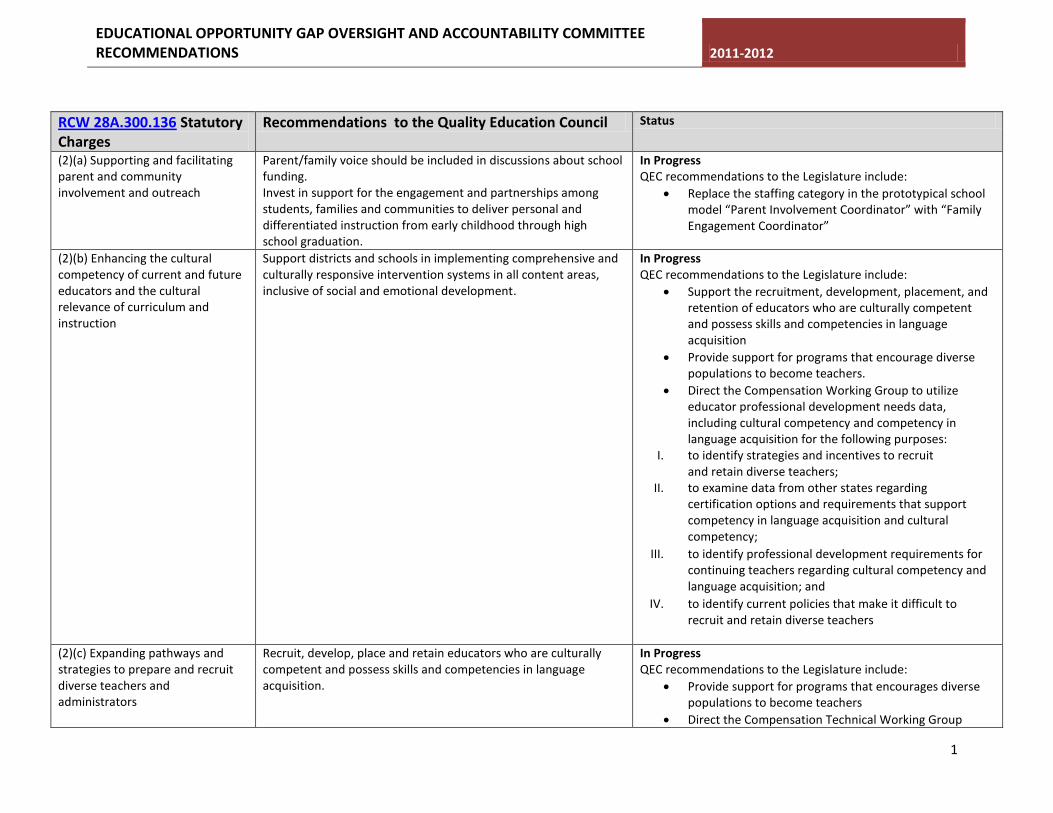
EDUCATIONAL OPPORTUNITY GAP OVERSIGHT AND ACCOUNTABILITY COMMITTEE RECOMMENDATIONS 2011-2012
1
RCW 28A.300.136 Statutory Charges
Recommendations to the Quality Education Council Status
(2)(a) Supporting and facilitating parent and community involvement and outreach
Parent/family voice should be included in discussions about school funding. Invest in support for the engagement and partnerships among students, families and communities to deliver personal and differentiated instruction from early childhood through high school graduation.
In Progress QEC recommendations to the Legislature include:
Replace the staffing category in the prototypical school model “Parent Involvement Coordinator” with “Family Engagement Coordinator”
(2)(b) Enhancing the cultural competency of current and future educators and the cultural relevance of curriculum and instruction
Support districts and schools in implementing comprehensive and culturally responsive intervention systems in all content areas, inclusive of social and emotional development.
In Progress QEC recommendations to the Legislature include:
Support the recruitment, development, placement, and retention of educators who are culturally competent and possess skills and competencies in language acquisition
Provide support for programs that encourage diverse populations to become teachers.
Direct the Compensation Working Group to utilize educator professional development needs data, including cultural competency and competency in language acquisition for the following purposes:
I. to identify strategies and incentives to recruit and retain diverse teachers;
II. to examine data from other states regarding certification options and requirements that support competency in language acquisition and cultural competency;
III. to identify professional development requirements for continuing teachers regarding cultural competency and language acquisition; and
IV. to identify current policies that make it difficult to recruit and retain diverse teachers
(2)(c) Expanding pathways and strategies to prepare and recruit diverse teachers and administrators
Recruit, develop, place and retain educators who are culturally competent and possess skills and competencies in language acquisition.
In Progress QEC recommendations to the Legislature include:
Provide support for programs that encourages diverse populations to become teachers
Direct the Compensation Technical Working Group
EDUCATIONAL OPPORTUNITY GAP OVERSIGHT AND ACCOUNTABILITY COMMITTEE RECOMMENDATIONS 2011-2012
2
identify strategies and incentives to recruit and retain diverse teachers
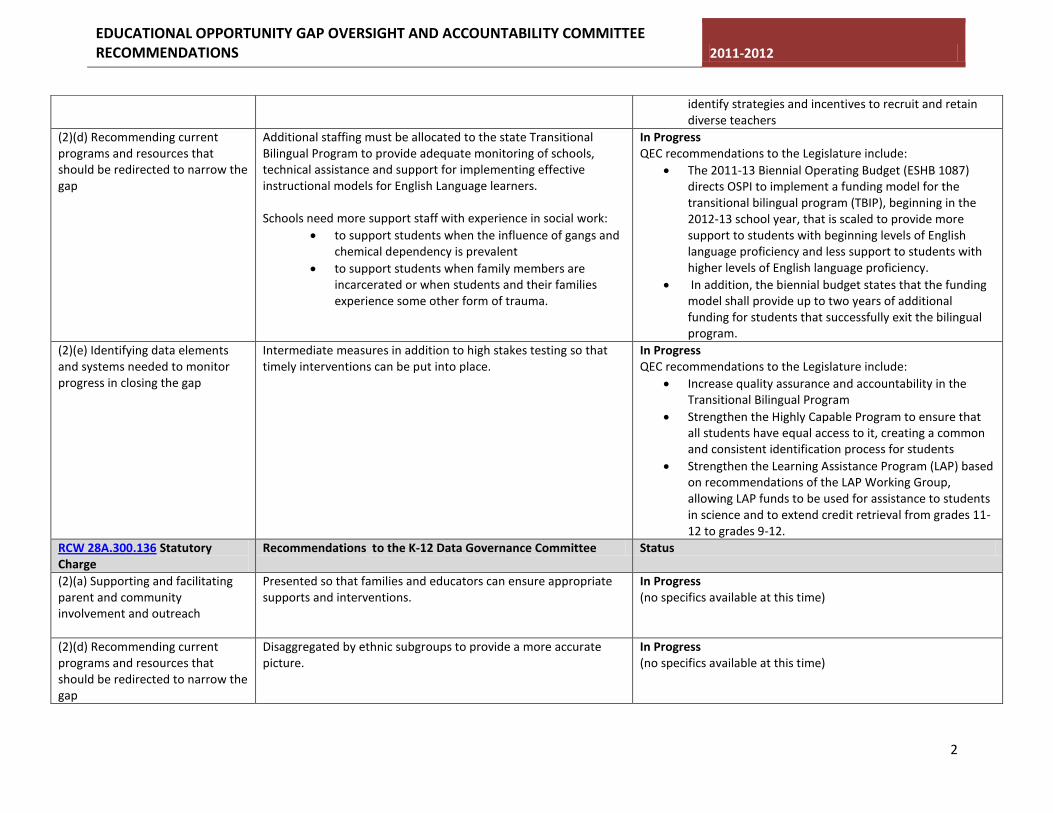
(2)(d) Recommending current programs and resources that should be redirected to narrow the gap
Additional staffing must be allocated to the state Transitional Bilingual Program to provide adequate monitoring of schools, technical assistance and support for implementing effective instructional models for English Language learners. Schools need more support staff with experience in social work:
to support students when the influence of gangs and chemical dependency is prevalent
to support students when family members are incarcerated or when students and their families experience some other form of trauma.
In Progress QEC recommendations to the Legislature include:
The 2011-13 Biennial Operating Budget (ESHB 1087) directs OSPI to implement a funding model for the transitional bilingual program (TBIP), beginning in the 2012-13 school year, that is scaled to provide more support to students with beginning levels of English language proficiency and less support to students with higher levels of English language proficiency.
In addition, the biennial budget states that the funding model shall provide up to two years of additional funding for students that successfully exit the bilingual program.
(2)(e) Identifying data elements and systems needed to monitor progress in closing the gap
Intermediate measures in addition to high stakes testing so that timely interventions can be put into place.
In Progress QEC recommendations to the Legislature include:
Increase quality assurance and accountability in the Transitional Bilingual Program
Strengthen the Highly Capable Program to ensure that all students have equal access to it, creating a common and consistent identification process for students
Strengthen the Learning Assistance Program (LAP) based on recommendations of the LAP Working Group, allowing LAP funds to be used for assistance to students in science and to extend credit retrieval from grades 11-12 to grades 9-12.
RCW 28A.300.136 Statutory Charge
Recommendations to the K-12 Data Governance Committee Status
(2)(a) Supporting and facilitating parent and community involvement and outreach
Presented so that families and educators can ensure appropriate supports and interventions.
In Progress (no specifics available at this time)
(2)(d) Recommending current programs and resources that should be redirected to narrow the gap
Disaggregated by ethnic subgroups to provide a more accurate picture.
In Progress (no specifics available at this time)
EDUCATIONAL OPPORTUNITY GAP OVERSIGHT AND ACCOUNTABILITY COMMITTEE RECOMMENDATIONS 2011-2012
3
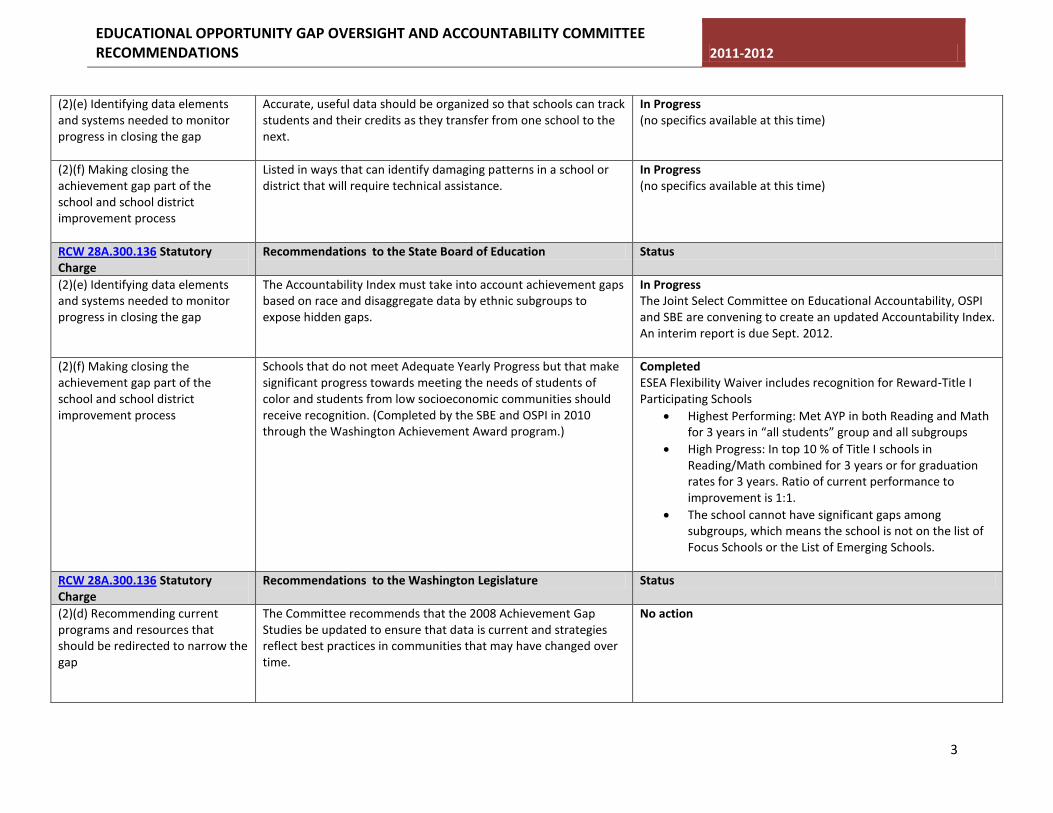
(2)(e) Identifying data elements and systems needed to monitor progress in closing the gap
Accurate, useful data should be organized so that schools can track students and their credits as they transfer from one school to the next.
In Progress (no specifics available at this time)
(2)(f) Making closing the achievement gap part of the school and school district improvement process
Listed in ways that can identify damaging patterns in a school or district that will require technical assistance.
In Progress (no specifics available at this time)
RCW 28A.300.136 Statutory Charge
Recommendations to the State Board of Education Status
(2)(e) Identifying data elements and systems needed to monitor progress in closing the gap
The Accountability Index must take into account achievement gaps based on race and disaggregate data by ethnic subgroups to expose hidden gaps.
In Progress The Joint Select Committee on Educational Accountability, OSPI and SBE are convening to create an updated Accountability Index. An interim report is due Sept. 2012.
(2)(f) Making closing the achievement gap part of the school and school district improvement process
Schools that do not meet Adequate Yearly Progress but that make significant progress towards meeting the needs of students of color and students from low socioeconomic communities should receive recognition. (Completed by the SBE and OSPI in 2010 through the Washington Achievement Award program.)
Completed ESEA Flexibility Waiver includes recognition for Reward-Title I Participating Schools
Highest Performing: Met AYP in both Reading and Math for 3 years in “all students” group and all subgroups
High Progress: In top 10 % of Title I schools in Reading/Math combined for 3 years or for graduation rates for 3 years. Ratio of current performance to improvement is 1:1.
The school cannot have significant gaps among subgroups, which means the school is not on the list of Focus Schools or the List of Emerging Schools.
RCW 28A.300.136 Statutory Charge
Recommendations to the Washington Legislature Status
(2)(d) Recommending current programs and resources that should be redirected to narrow the gap
The Committee recommends that the 2008 Achievement Gap Studies be updated to ensure that data is current and strategies reflect best practices in communities that may have changed over time.
No action
EDUCATIONAL OPPORTUNITY GAP OVERSIGHT AND ACCOUNTABILITY COMMITTEE RECOMMENDATIONS 2011-2012
4
RCW 28A.300.136 Statutory Charge
Recommendations to the Office of Superintendent of Public Instruction
Status
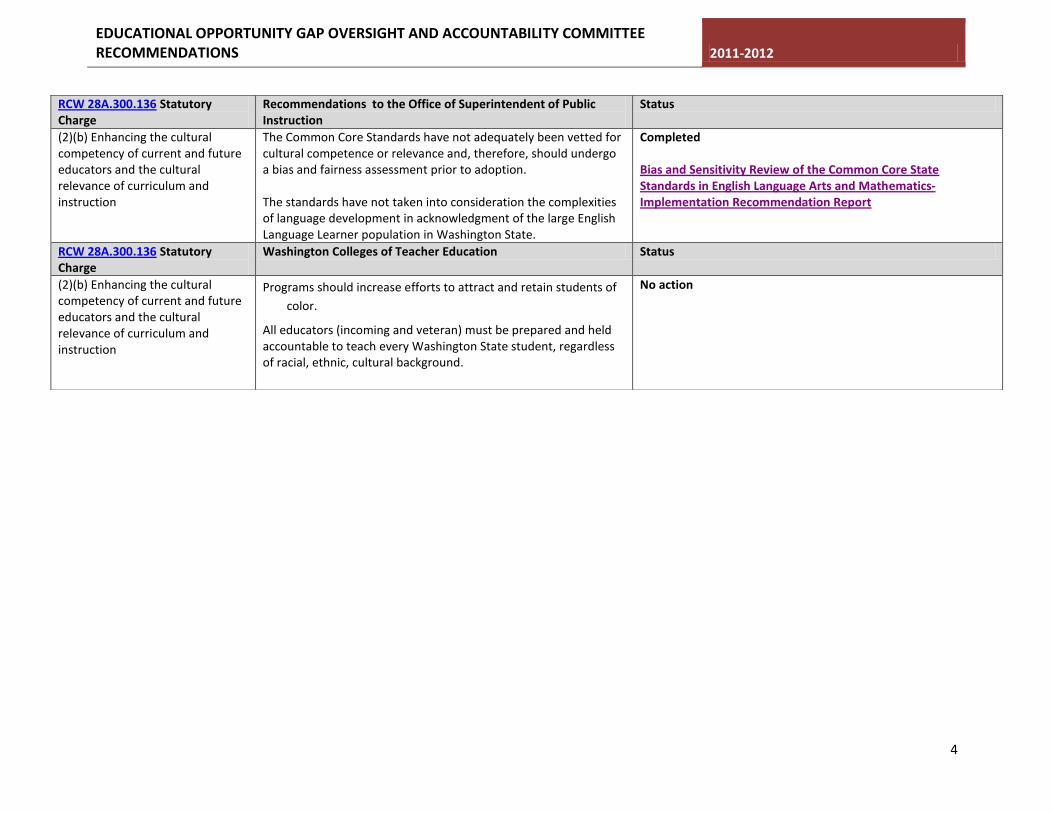
(2)(b) Enhancing the cultural competency of current and future educators and the cultural relevance of curriculum and instruction
The Common Core Standards have not adequately been vetted for cultural competence or relevance and, therefore, should undergo a bias and fairness assessment prior to adoption. The standards have not taken into consideration the complexities of language development in acknowledgment of the large English Language Learner population in Washington State.
Completed Bias and Sensitivity Review of the Common Core State Standards in English Language Arts and Mathematics-Implementation Recommendation Report
RCW 28A.300.136 Statutory Charge
Washington Colleges of Teacher Education Status
(2)(b) Enhancing the cultural competency of current and future educators and the cultural relevance of curriculum and instruction
Programs should increase efforts to attract and retain students of
color.
All educators (incoming and veteran) must be prepared and held accountable to teach every Washington State student, regardless of racial, ethnic, cultural background.
No action
1
Teach For America-
Seattle Tacoma
Educational Opportunity Gap Oversight and
Accountability Committee
Lindsay Hill, Executive Director
<Insert Date Here>
2
1 Teach For America Overview
3 Partnership with University of Washington (U-ACT)
2 Our Corps Members
4 Our School Partnerships
Agenda
3
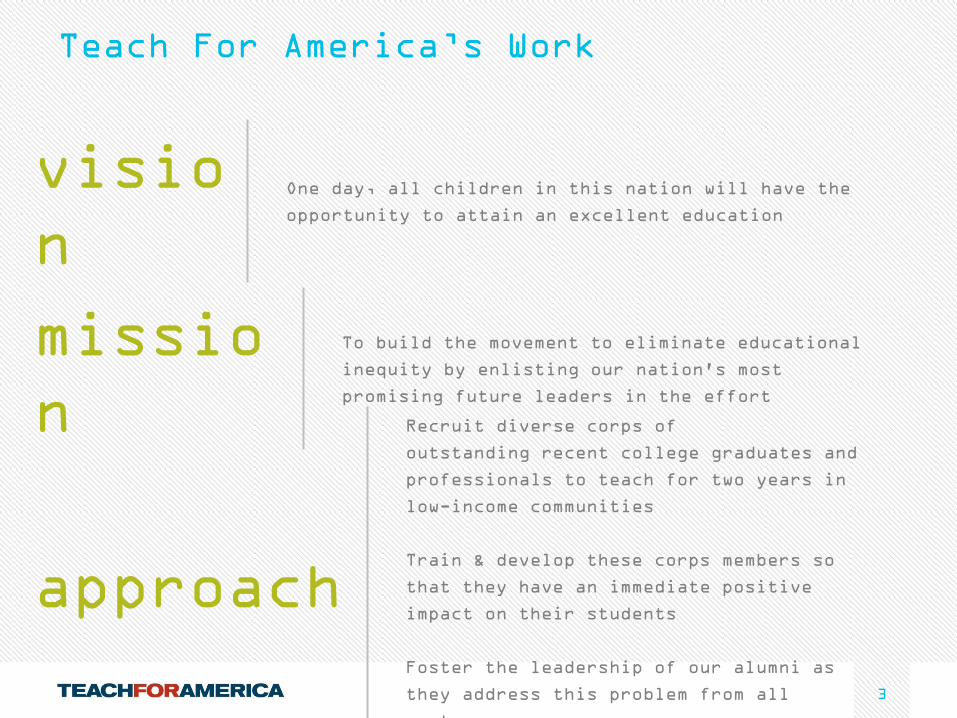
visio
n
One day, all children in this nation will have the
opportunity to attain an excellent education
missio
n
To build the movement to eliminate educational
inequity by enlisting our nation's most
promising future leaders in the effort
Teach For America’s Work
approach
Recruit diverse corps of
outstanding recent college graduates and
professionals to teach for two years in
low-income communities
Train & develop these corps members so
that they have an immediate positive
impact on their students
Foster the leadership of our alumni as
they address this problem from all
sectors
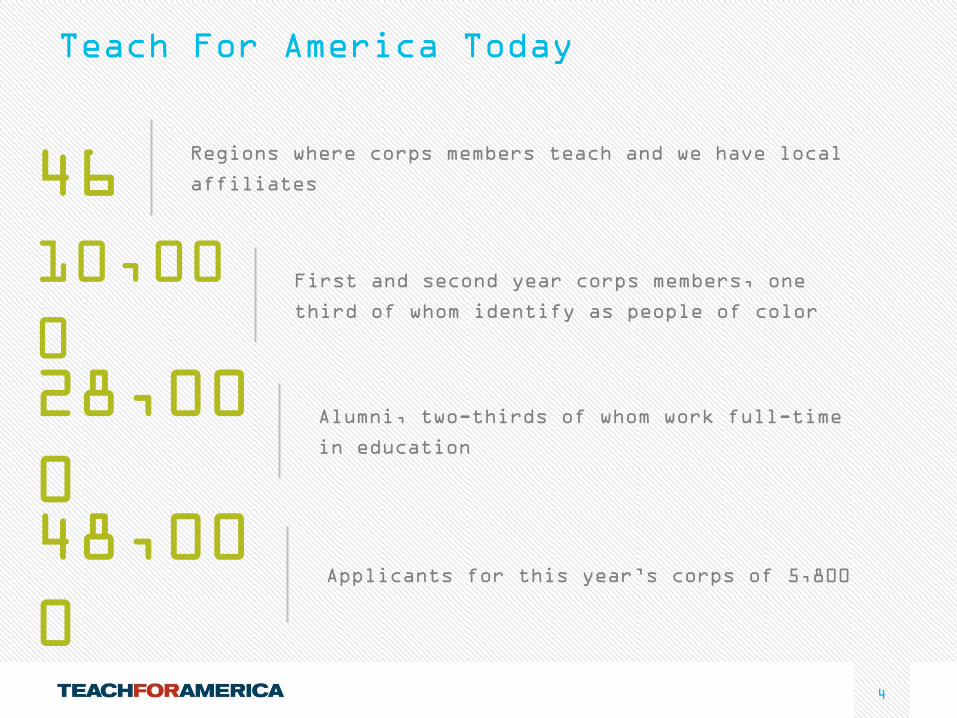
4
46 Regions where corps members teach and we have local
affiliates
10,00
0
First and second year corps members, one
third of whom identify as people of color
28,00
0
Alumni, two-thirds of whom work full-time
in education
Teach For America Today
48,00
0 Applicants for this year’s corps of 5,800
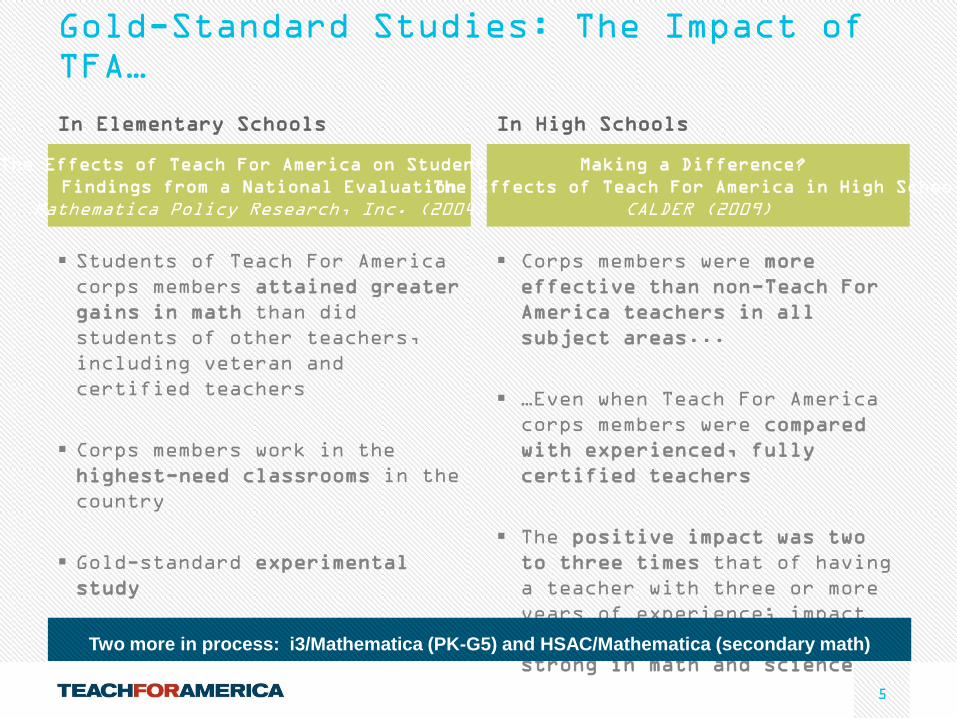
5
Gold-Standard Studies: The Impact of
TFA…
In Elementary Schools In High Schools
The Effects of Teach For America on Students:
Findings from a National Evaluation
Mathematica Policy Research, Inc. (2004)
Making a Difference?
The Effects of Teach For America in High School
CALDER (2009)
Students of Teach For America
corps members attained greater
gains in math than did
students of other teachers,
including veteran and
certified teachers
Corps members work in the
highest-need classrooms in the
country
Gold-standard experimental
study
Corps members were more
effective than non-Teach For
America teachers in all
subject areas...
…Even when Teach For America
corps members were compared
with experienced, fully
certified teachers
The positive impact was two
to three times that of having
a teacher with three or more
years of experience; impact
levels were particularly
strong in math and science Two more in process: i3/Mathematica (PK-G5) and HSAC/Mathematica (secondary math)
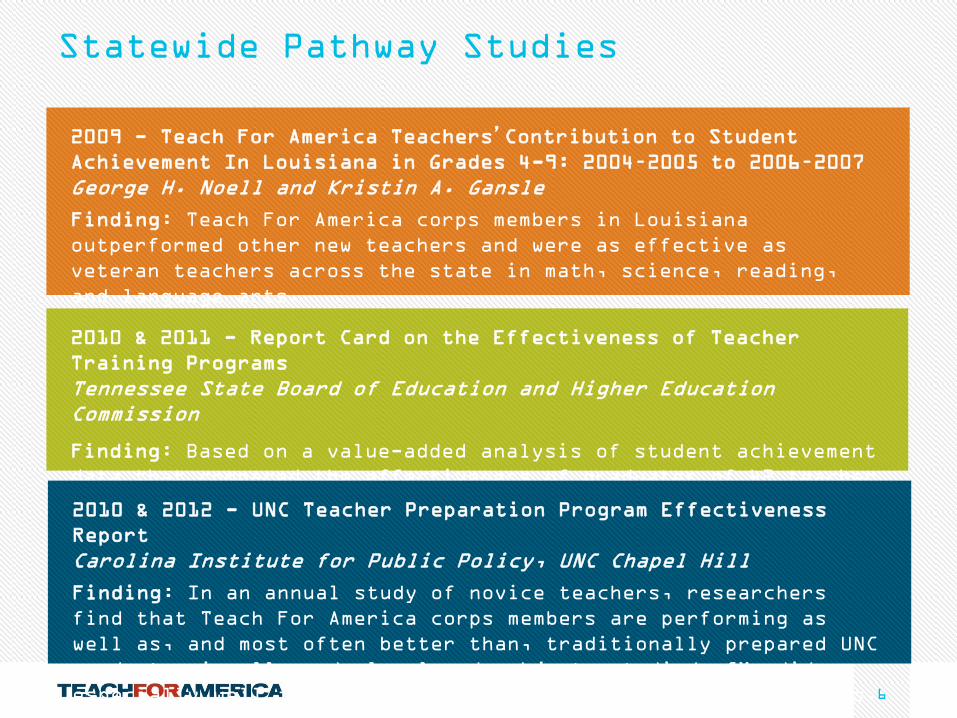
6
Statewide Pathway Studies
2010 & 2011 - Report Card on the Effectiveness of Teacher
Training Programs
Tennessee State Board of Education and Higher Education
Commission
Finding: Based on a value-added analysis of student achievement
data that compared the effectiveness of graduates of 42 teacher
preparation programs, Teach For America was the top teacher
preparation program in the state of Tennessee.
2009 - Teach For America Teachers’Contribution to Student Achievement In Louisiana in Grades 4-9: 2004–2005 to 2006–2007
George H. Noell and Kristin A. Gansle
Finding: Teach For America corps members in Louisiana
outperformed other new teachers and were as effective as
veteran teachers across the state in math, science, reading,
and language arts.
2010 & 2012 - UNC Teacher Preparation Program Effectiveness
Report
Carolina Institute for Public Policy, UNC Chapel Hill
Finding: In an annual study of novice teachers, researchers
find that Teach For America corps members are performing as
well as, and most often better than, traditionally prepared UNC
graduates in all grade level and subjects studied. CMs did
especially well in mathematics and in all high school subjects.
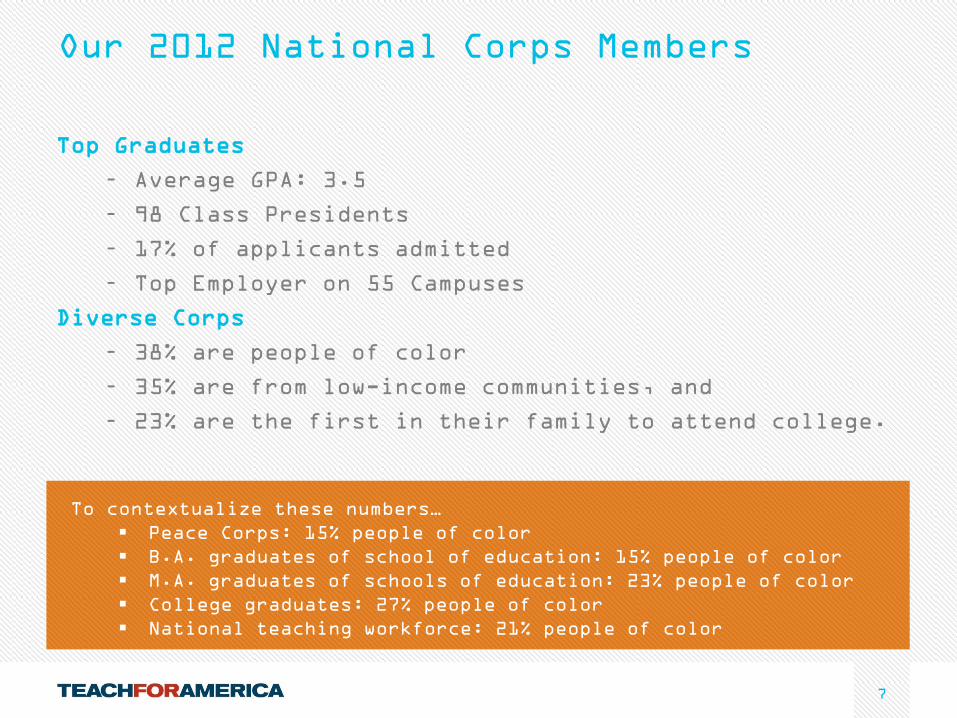
7
Our 2012 National Corps Members
Top Graduates
– Average GPA: 3.5
– 98 Class Presidents
– 17% of applicants admitted
– Top Employer on 55 Campuses
Diverse Corps
– 38% are people of color
– 35% are from low-income communities, and
– 23% are the first in their family to attend college.
To contextualize these numbers…
Peace Corps: 15% people of color
B.A. graduates of school of education: 15% people of color
M.A. graduates of schools of education: 23% people of color
College graduates: 27% people of color
National teaching workforce: 21% people of color
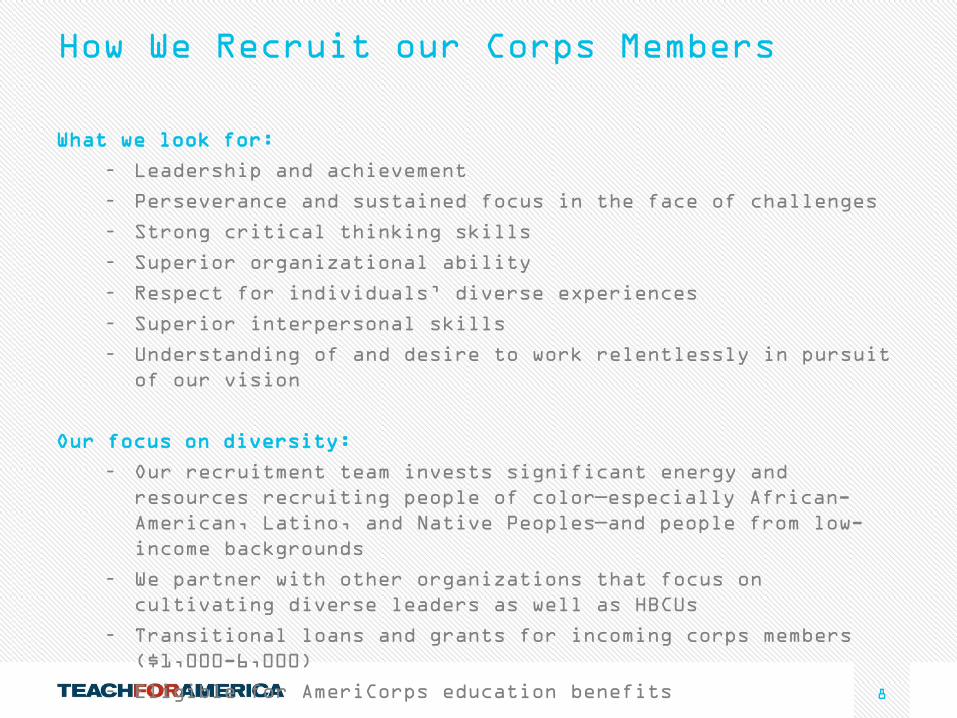
8
How We Recruit our Corps Members
What we look for:
– Leadership and achievement
– Perseverance and sustained focus in the face of challenges
– Strong critical thinking skills
– Superior organizational ability
– Respect for individuals’ diverse experiences
– Superior interpersonal skills
– Understanding of and desire to work relentlessly in pursuit
of our vision
Our focus on diversity:
– Our recruitment team invests significant energy and
resources recruiting people of color—especially African-
American, Latino, and Native Peoples—and people from low-
income backgrounds
– We partner with other organizations that focus on
cultivating diverse leaders as well as HBCUs
– Transitional loans and grants for incoming corps members
($1,000-6,000)
– Eligible for AmeriCorps education benefits
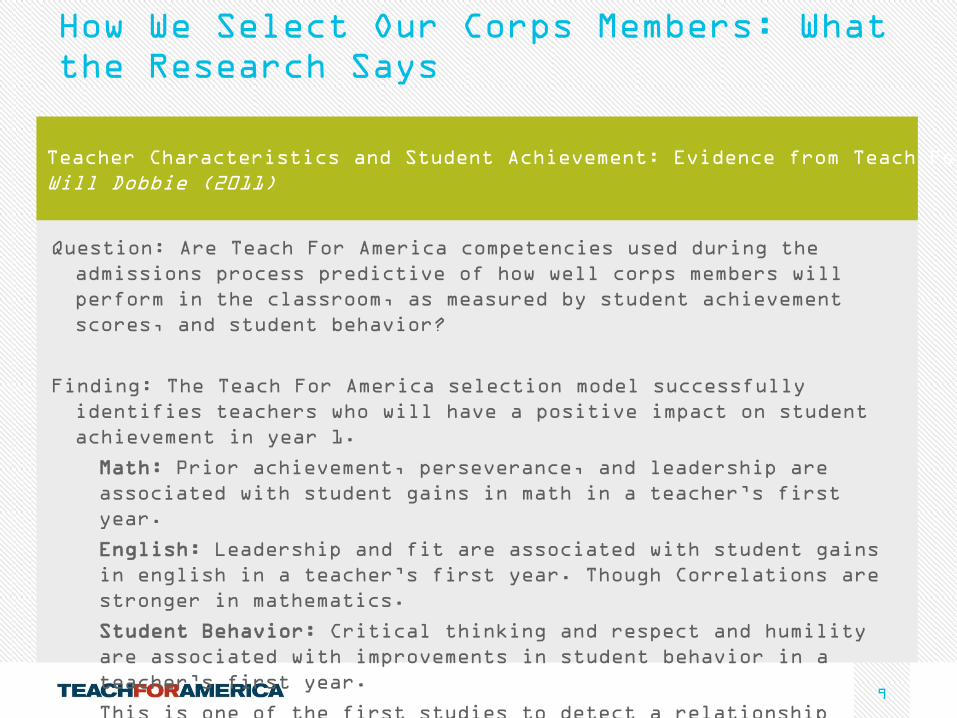
9
How We Select Our Corps Members: What
the Research Says
Question: Are Teach For America competencies used during the
admissions process predictive of how well corps members will
perform in the classroom, as measured by student achievement
scores, and student behavior?
Finding: The Teach For America selection model successfully
identifies teachers who will have a positive impact on student
achievement in year 1.
Math: Prior achievement, perseverance, and leadership are
associated with student gains in math in a teacher’s first
year.
English: Leadership and fit are associated with student gains
in english in a teacher’s first year. Though Correlations are
stronger in mathematics.
Student Behavior: Critical thinking and respect and humility
are associated with improvements in student behavior in a
teacher’s first year.
This is one of the first studies to detect a relationship
between student success and observable teacher characteristics
that can be measured prior to service.
Teacher Characteristics and Student Achievement: Evidence from Teach For America
Will Dobbie (2011)
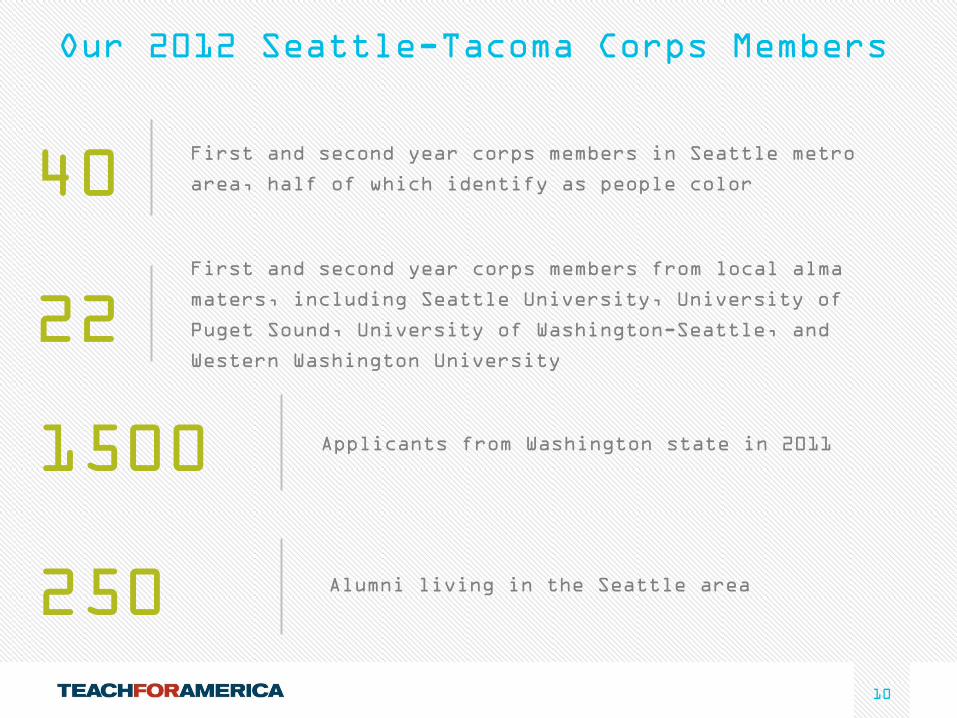
10
40 First and second year corps members in Seattle metro
area, half of which identify as people color
250
Our 2012 Seattle-Tacoma Corps Members
22 First and second year corps members from local alma
maters, including Seattle University, University of
Puget Sound, University of Washington-Seattle, and
Western Washington University
1500 Applicants from Washington state in 2011
Alumni living in the Seattle area
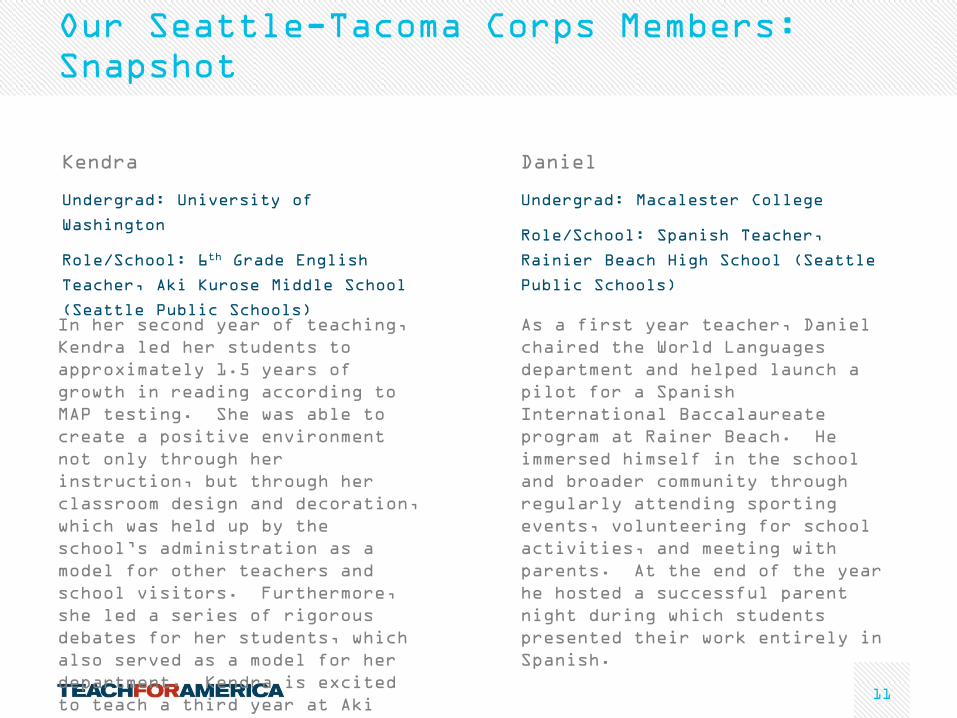
11
Kendra
Undergrad: University of
Washington
Role/School: 6th Grade English
Teacher, Aki Kurose Middle School
(Seattle Public Schools)
Daniel
Undergrad: Macalester College
Role/School: Spanish Teacher,
Rainier Beach High School (Seattle
Public Schools)
In her second year of teaching,
Kendra led her students to
approximately 1.5 years of
growth in reading according to
MAP testing. She was able to
create a positive environment
not only through her
instruction, but through her
classroom design and decoration,
which was held up by the
school’s administration as a
model for other teachers and
school visitors. Furthermore,
she led a series of rigorous
debates for her students, which
also served as a model for her
department. Kendra is excited
to teach a third year at Aki
Kurose Middle School.
As a first year teacher, Daniel
chaired the World Languages
department and helped launch a
pilot for a Spanish
International Baccalaureate
program at Rainer Beach. He
immersed himself in the school
and broader community through
regularly attending sporting
events, volunteering for school
activities, and meeting with
parents. At the end of the year
he hosted a successful parent
night during which students
presented their work entirely in
Spanish.
Our Seattle-Tacoma Corps Members:
Snapshot
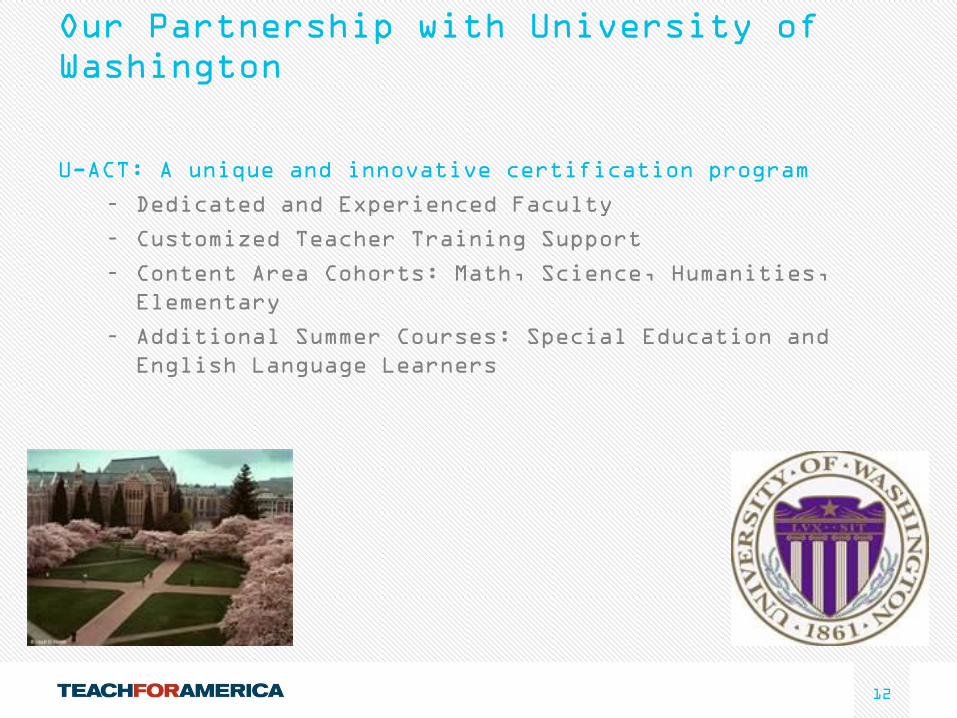
12
Our Partnership with University of
Washington
U-ACT: A unique and innovative certification program
– Dedicated and Experienced Faculty
– Customized Teacher Training Support
– Content Area Cohorts: Math, Science, Humanities,
Elementary
– Additional Summer Courses: Special Education and
English Language Learners
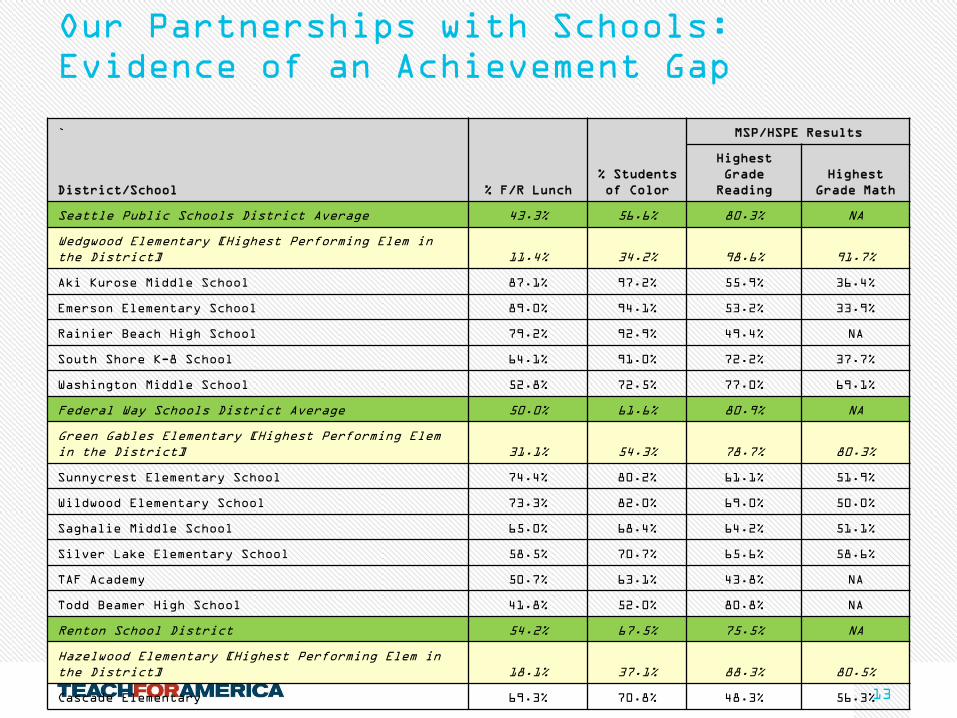
13
Our Partnerships with Schools:
Evidence of an Achievement Gap
`
% Students
of Color
MSP/HSPE Results
District/School % F/R Lunch
Highest
Grade
Reading
Highest
Grade Math
Seattle Public Schools District Average 43.3% 56.6% 80.3% NA
Wedgwood Elementary [Highest Performing Elem in
the District] 11.4% 34.2% 98.6% 91.7%
Aki Kurose Middle School 87.1% 97.2% 55.9% 36.4%
Emerson Elementary School 89.0% 94.1% 53.2% 33.9%
Rainier Beach High School 79.2% 92.9% 49.4% NA
South Shore K-8 School 64.1% 91.0% 72.2% 37.7%
Washington Middle School 52.8% 72.5% 77.0% 69.1%
Federal Way Schools District Average 50.0% 61.6% 80.9% NA
Green Gables Elementary [Highest Performing Elem
in the District] 31.1% 54.3% 78.7% 80.3%
Sunnycrest Elementary School 74.4% 80.2% 61.1% 51.9%
Wildwood Elementary School 73.3% 82.0% 69.0% 50.0%
Saghalie Middle School 65.0% 68.4% 64.2% 51.1%
Silver Lake Elementary School 58.5% 70.7% 65.6% 58.6%
TAF Academy 50.7% 63.1% 43.8% NA
Todd Beamer High School 41.8% 52.0% 80.8% NA
Renton School District 54.2% 67.5% 75.5% NA
Hazelwood Elementary [Highest Performing Elem in
the District] 18.1% 37.1% 88.3% 80.5%
Cascade Elementary 69.3% 70.8% 48.3% 56.3%
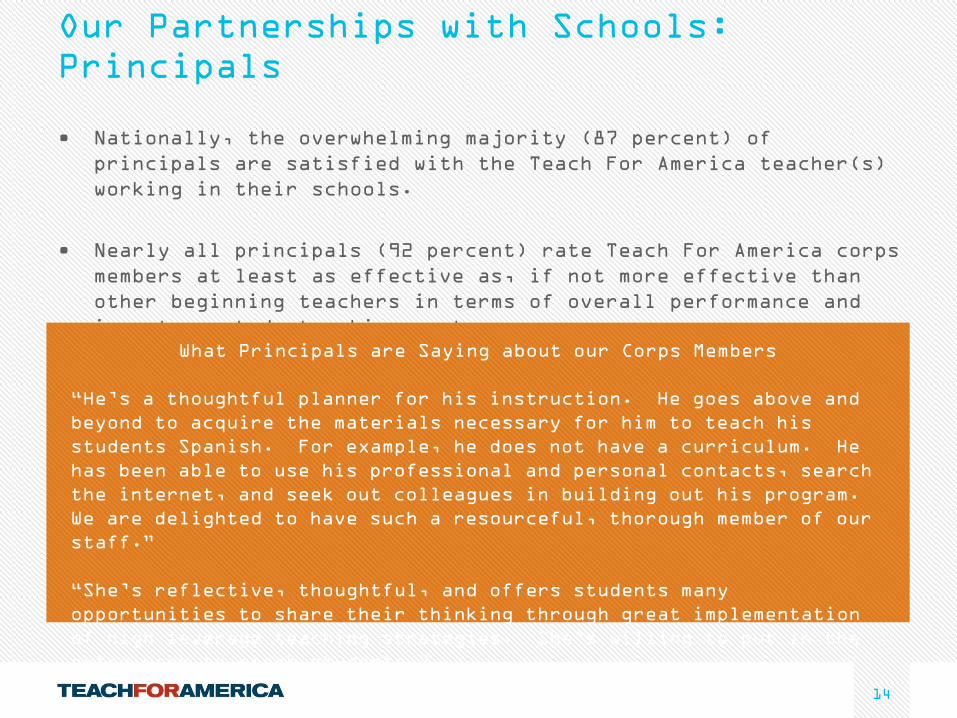
14
Our Partnerships with Schools:
Principals
• Nationally, the overwhelming majority (87 percent) of
principals are satisfied with the Teach For America teacher(s)
working in their schools.
• Nearly all principals (92 percent) rate Teach For America corps
members at least as effective as, if not more effective than
other beginning teachers in terms of overall performance and
impact on student achievement.
What Principals are Saying about our Corps Members
“He’s a thoughtful planner for his instruction. He goes above and
beyond to acquire the materials necessary for him to teach his
students Spanish. For example, he does not have a curriculum. He
has been able to use his professional and personal contacts, search
the internet, and seek out colleagues in building out his program.
We are delighted to have such a resourceful, thorough member of our
staff.”
“She’s reflective, thoughtful, and offers students many
opportunities to share their thinking through great implementation
of high leverage teaching strategies. She’s willing to put in the
extra work to reach students.”
15 15
Questions // Comments
16 16
One day, all
children in this
nation will have
the opportunity to
attain an excellent
education.


![[EDUCATIONAL OPPORTUNITY GAP OVERSIGHT …EDUCATIONAL OPPORTUNITY GAP OVERSIGHT AND ACCOUNTABILITY COMMITTEE] October 15, 2013 Working lunch- Heritage College of Education and ELL](https://img.pdfslide.us/doc/110x75/5aa9596a7f8b9a77188cba24/educational-opportunity-gap-oversight-educational-opportunity-gap-oversight.jpg)