Embed Size (px)
Citation preview
Educational Attainment of Foster Youth: Achievement and Graduation
Outcomes for Children in State Care
Mason Burley and
Mina Halpern
November 2001

Educational Attainment of Foster Youth:
Achievement and Graduation Outcomes for Children in State Care
Mason Burley and
Mina Halpern
November 2001
WASHINGTON STATE INSTITUTE FOR PUBLIC POLICY 110 East Fifth Avenue, Suite 214
Post Office Box 40999 Olympia, Washington 98504-0999
Telephone: (360) 586-2677
FAX: (360) 586-2793 URL: http://www.wsipp.wa.gov
Document Number: 01-11-3901
WASHINGTON STATE INSTITUTE FOR PUBLIC POLICY Mission The Washington Legislature created the Washington State Institute for Public Policy in 1983. A Board of Directors—representing the legislature, the governor, and public universities—governs the Institute, hires the director, and guides the development of all activities. The Institute’s mission is to carry out practical research, at legislative direction, on issues of importance to Washington State. The Institute conducts research activities using its own policy analysts, academic specialists from universities, and consultants. New activities grow out of requests from the Washington legislature and executive branch agencies, often directed through legislation. Institute staff work closely with legislators, as well as legislative, executive, and state agency staff to define and conduct research on appropriate state public policy topics. Current assignments include projects in welfare reform, criminal justice, education, youth violence, and social services. Board of Directors Senator Karen Fraser Dennis Braddock, Department of Social and Health Services Senator Jeanine Long Marty Brown, Office of Financial Management Senator Betti Sheldon Douglas Baker, Washington State University Senator James West David Dauwalder, Central Washington University Representative Ida Ballasiotes Marsha Landolt, University of Washington Representative Jeff Gombosky Thomas L. "Les" Purce, The Evergreen State College Representative Helen Sommers Ken Conte, House Office of Program Research Representative Steve Van Luven Stan Pynch, Senate Committee Services Staff Roxanne Lieb, Director Steve Aos, Associate Director
CONTENTS Executive Summary.............................................................................................................. 1 I. Background .................................................................................................................. 3 II. Foster Youth and Education: Previous Research ........................................................ 5 III. How Does the Educational Achievement of Foster Youth Compare With Other Students in Washington State?................................................. 11 IV. What Are the Graduation Prospects for Foster Youth?............................................... 19 V. Foster Care and Education: Options for Information Sharing .................................... 27 Appendices Appendix A: School-wide Assessments—Regression Results .......................................... 33 Appendix B: Long-Term Foster Youth Assessments—Regression Results ....................... 35 Appendix C: Grade 11 High School Completion—Regression Results.............................. 37 Acknowledgements The authors wish to thank Janis Avery from Treehouse for her assistance in providing feedback for the study design and for her efforts in convening a review panel of knowledgeable individuals. Tammy Cordova, Sherry Brummel, and Cindy Ellingson from DSHS Children’s Administration helped facilitate access to the data necessary for this study. Jim Mowrey from DSHS and Julie Stachowiak from the Seattle/King County Public Health Department also provided assistance and material related to the Passport program. We also acknowledge the contribution of Ed Strozyk and Pete Bylsma from the Office of the Superintendent of Public Instruction (OSPI) in lending their expertise regarding state education data.

1
EXECUTIVE SUMMARY Over 12,000 school-age children in Washington State lived in out-of-home care sometime during the past 12 months because of abuse, neglect, abandonment, or family conflict. Nearly half of these children leave state care within 60 days. A significant number, however, spend an extended period of time in foster care or group homes. These long-term foster youth remain state dependents until they move to a permanent placement or until they turn age 18. Until that time, state caseworkers, foster parents, court officials, and others assume responsibility for the health, safety, and education of foster youth. While their physical well-being is followed, little is known about the overall educational status of foster youth. The 2000 Washington State Legislature directed the Washington State Institute for Public Policy (Institute) to:
… review and summarize existing research that identifies problems and barriers to improved educational attainment of children in long-term foster care and suggest ways to improve the availability of information about the educational experiences of these children. EHB 2487 (§ 607(5)).
This report summarizes findings from a statewide analysis of the educational attainment of foster youth in Washington’s public school system. The study results demonstrate:
• Foster youth score, on average, 15 to 20 percentile points below non-foster youth in statewide achievement tests.
• Only 59 percent of foster youth enrolled in 11th grade complete high school by the end of grade 12. The completion rate for non-foster youth is 86 percent.
• Even after statistically controlling for a variety of factors, a youth that enters foster care is likely to have lower test scores and graduation rates.
• At both the elementary and secondary levels, twice as many foster youth had repeated a grade, changed schools during the year, or enrolled in special education programs compared with non-foster youth.
• Surprisingly, a youth’s length of stay in foster care and other placement characteristics do not appear to be related to educational attainment. Foster youth in short-term care, for example, have on average the same educational deficits as children in long-term foster care.
While this study does not evaluate any particular interventions or programs to assist foster youth with education issues, it does quantify the gap between foster youth and other students in Washington State. This research also identifies the important individual, family, and school issues that are related to a student’s success in school.
Currently, very little information about a student’s educational background is shared among foster parents, educators, and social workers. This report draws attention to the important factors associated with academic achievement and suggests improvements in maintaining and updating educational records for youth in foster care.

3
I. BACKGROUND Between June 2000 and July 2001, nearly 18,500 children in Washington State spent time in foster homes or group homes as a result of abuse, neglect, abandonment, or family conflict. Approximately 70 percent (12,800) of these foster care youth are school-age children. Foster care youth remain in custody of the state, which acts in loco parentis (in the place of parents) on behalf of the minor. As such, the state assumes the rights and responsibilities in providing for the health, safety, and well-being of foster youth. Youth in foster care typically have troubled backgrounds and multiple emotional and developmental problems that place high demands on foster parents.1 While the health and safety needs of foster youth are easier to observe and document, the educational progress of these youth is often more difficult to follow. Recognizing educational problems becomes particularly challenging when youth move in and out of foster homes and enroll in multiple schools or school districts. Once foster children reach age 18 and “age out” of state care, their future prospects will be greatly enhanced or reduced according to their previous achievements in school. The 2000 Washington State Legislature directed the Washington State Institute for Public Policy (Institute) to:
… review and summarize existing research that identifies problems and barriers to improved educational attainment of children in long-term foster care and suggest ways to improve the availability of information about the educational experiences of these children. EHB 2487 (§ 607(5)).
In addition to summarizing research findings from existing national studies, this report includes a detailed analysis on the educational outcomes of Washington State foster care youth. This analysis examines a variety of factors related to educational success, comparing outcomes of youth in long-term foster care with the state’s school-age population. Previous national research on education and foster youth has been limited, usually focusing on small populations of older adolescents. This earlier work primarily describes educational outcomes of foster youth without comparing their achievements with other non-foster care students. Without such a comparison, it is difficult to estimate how a child’s foster care status is associated with educational achievement. For this report, we merged data from the child welfare system and the public schools to detail the educational experience of students, including foster youth, from elementary school through high school completion.
1 For additional detail about the problems of foster youth and survey responses from parent caretakers, see Lucy Berliner and David Fine, Long-Term Foster Care in Washington: Children’s Status and Placement Decision-Making (Olympia, WA: Washington State Institute for Public Policy, June 2001).
4
This study includes:
• A review of the literature pertaining to the educational status of foster youth, including the circumstances relating to poor educational outcomes for foster youth.
• A comparison of educational achievement (test scores) for foster youth and non-foster youth in grades 3, 6, and 9 in Washington State.
• An examination of the educational completion (graduation) prospects for foster youth in 11th grade compared with non-foster youth in 11th grade in Washington State.
• Options for improving information sharing between school districts, educational institutions, and child welfare agencies. Maintaining a foster youth’s records through school, especially information signaling progress or warning signs, can ensure continuity in a youth’s educational experience and help teachers and caseworkers provide support to the youth.
5
II. FOSTER YOUTH AND EDUCATION: PREVIOUS RESEARCH Previous Studies Examining School Performance and Foster Care Youth Achievement. Several studies have evaluated the educational achievement of children in foster care. These studies primarily use grade point average (GPA) and whether or not a student is performing at grade level to assess achievement and determine academic performance. A 1990 Oregon survey of 424 foster parents found significant educational gaps among children in foster care. In response to the question, “Overall, how is this child performing in current grade?” nearly 40 percent responded that their foster child was performing below grade level.2 The same Oregon survey found that for foster children in elementary, middle, and high school, nearly the same proportion performed below grade level (37 percent).3 Studies reviewed by White found similar results of foster children performing below grade level, ranging from 34 to 41 percent. In comparison, U.S. Census figures show that 20 percent of all school-age children (foster and non-foster) are not at grade level.4 In November 2000, the Washington State Children’s Administration implemented a pilot project to screen children within the first month they are in an out-of-home placement. This project, called Kidscreen, provides a standardized, validated means to assess a child’s need for services at the point he or she enters care. The initial review of the program found that 55 percent of school-age children in the Kidscreen pilot had completed an educational status review.5 Of these, 45 percent were identified as having problems in school. This study, however, does not indicate what percentage of non-foster care youth would have been identified as having school problems.
2 Jim White, Jan Carrington, and Patricia Freeman, A Study of the Educational Status of Foster Children in Oregon: Research & Statistics (Portland: Oregon Department of Human Resources, Children’s Services Division, November 1990), 5. 3 Ibid., Appendix. 4 Ibid., 3. 5 Office of Children’s Administration Research, Kidscreen: Evaluation Report (Olympia, WA: Department of Social and Health Services, Children’s Administration, February 2001), 18.
6
Completion. High school graduation or completion is an important educational outcome and has been a primary focus of existing research efforts related to foster children. Studies have shown that foster youth are much less likely to have a high school diploma than their non-foster counterparts.6 Mech aggregated four studies of foster youth entering adulthood and found an average high school completion rate of 58 percent among these youth. 7 In contrast, U.S. Census figures reveal that 84 percent of young adults 20 to 24 years of age have high school or high school equivalency diplomas.8 The Washington State Department of Social and Health Services (DSHS) Children’s Administration found that between January and June 2000, 34 percent of those leaving foster care at age 18 or older had a high school diploma or GED.9 An additional 38 percent of these individuals were currently enrolled in educational or vocational programs, leaving 28 percent of emancipated foster youth who had no educational involvement.
6 Wendy Whiting Blome, “What Happens to Foster Kids: Educational Experiences of a Random Sample of Foster Care Youth and a Matched Group of Non-Foster Care Youth,” Child and Adolescent Social Work Journal 14 (February 1997): 41; Ronna Cook, E. Fleishman, and V. Grimes, A National Evaluation of Title IV-E Foster Care Independent Living Programs for Youth, Phase 2 (Final Report) Volume 1, Westat, Inc., Report to Department of Health and Human Services, Administration for Children, Youth, and Families (Washington, D.C.: U.S. Department of Health and Human Services, 1991); Ronna J. Cook, “Are We Helping Foster Care Youth Prepare for Their Future? Special Issue: Preparing Foster Youth for Adulthood,” Children and Youth Services Review 16 (1994); Annick-Camille Dumaret, Marthe Coppel-Batsch, and Simone Couraud, “Adult Outcome of Children Reared for Long-Term Periods in Foster Families,” Child Abuse & Neglect 21 (1997): 916; Mark E. Courtney and Irving Piliavin, Foster Youth Transitions to Adulthood: Outcomes 12 to 18 Months After Leaving Out-of-Home Care (University of Wisconsin-Madison: School of Social Work and Institute for Research on Poverty, July 1998 [Revised August 1998]), 3; Edmund V. Mech, “Foster Youths in Transition: Research Perspectives on Preparation for Independent Living,” Child Welfare 73 (1994): 607. 7 Mech, 607. The studies used in Mech’s aggregate completion estimate were written by Fanshel (1990), Festinger (1983), Barth (1993), and Cook (1991). 8 Mech, 607. 9 Washington State Department of Social and Health Services, Children’s Administration Efforts to Monitor Educational Status of Youth Leaving Foster Care (Olympia, WA, May 23, 2001).
7
Previous Studies Examining Factors That Explain the Lower Educational Attainment of Foster Care Youth Low educational attainment among foster youth is not easily explained by a single cause. Instead, a variety of interrelated factors affect a foster child’s school performance, including pre-care experiences such as neglect and abuse, poverty, emotional challenges, and behavioral issues. Understanding the nature of these relationships at different developmental stages can lead to the appropriate targeting of services and supports as foster youth move through the school system. Pre-Care Experience. While low academic attainment of foster youth may be related to a number of factors, Sawyer and Dubowitz found that the experiences of children prior to a foster care placement have lasting and profound effects.10 Nationally, the number of children placed in foster care due to abuse, neglect, and prenatal alcohol exposure has rapidly increased in the past 15 years.11 In Washington State, the number of out-of-home placements increased from approximately 7,400 children in 1995 to over 8,200 children by 2000.12 Approximately 61 percent of these foster care children entered state care because of neglect or child abuse on the part of one or both parents.13 In addition, foster youth may have difficulty developing relationships with other adults, such as their foster parents and teachers, because of earlier disruptions in their family.14 Poverty. In 1990, the National Center for Children in Poverty (NCCP) reported that “poor children are vastly overrepresented in the U.S. foster care system.”15 Kerckhoff found that the socioeconomic status of a family contributes to a youth’s success in adulthood more than education, skill level, or personal initiative.16 According to NCCP, parents with low socioeconomic status are “less able than other parents to prevent their children’s exposure to harm and to promote positive health and developmental outcomes.”17 Low
10 Richard J. Sawyer and Howard Dubowitz, “School Performance of Children in Kinship Care,” Child Abuse & Neglect 18 (July 1994): 594. 11 Robert Ayasse, “Addressing the Needs of Foster Children: The Foster Youth Services Program,” Social Work in Education 17 (October 1995): 207. 12 Washington State Department of Social and Health Services, Children’s Administration 2000 Annual Performance Report (Olympia, WA, 2001). 13 Research and Data Analysis, Children Placed in Out Of Home Care (Olympia, WA: Washington State Department of Social and Health Services, Executive Management Information System, 2000). Other studies have found just over 50 percent of placements are attributed to abuse or neglect of children. See J. I. Takayama, E. Wolfe, and K. P. Coulter, “Relationship Between Reason for Placement and Medical Findings Among Children in Foster Care,” Pediatrics (1998): 101, 201-207. 14 Sherri Seyfried, Peter J. Pecora, A. Chris Downs, Phyllis Levine, and John Emerson, “Assessing the Educational Outcomes of Children in Long-Term Foster Care: First Findings,” School Social Work Journal 24 (Winter 2000): 69. 15 National Center for Children in Poverty, Five Million Children: A Statistical Profile of Our Poorest Citizens (Columbia University: School of Public Health, 1990): 60. 16 Alan Kerckhoff, Richard Campbell, Jerry Trott, and Vered Kraus, “The Transmission of Socioeconomic Status and Prestige in Great Britain and the United States,” Sociological Forum 4 (1989): 156. 17 National Center for Children in Poverty, 62.
8
socioeconomic status has been associated with school failure, partly because children from this background do not receive the same level of early education as children from a higher socioeconomic background.18 Emotional Challenges. Many youth in foster care face emotional challenges that affect their academic performance. Using interviews and administrative data from a representative sample of children in foster care, Berliner and Fine found that 71 percent of foster youth had emotional or behavioral problems.19 In summarizing existing research, dosReis notes that between 40 and 60 percent of foster youth have at least one psychiatric disorder.20 A study linking administrative records of school and child welfare systems in Illinois found that 13 percent of foster children were categorized by school officials as emotionally disturbed compared with less than 2 percent of their non-foster peers.21 The trauma of being taken into care and leaving their families, possibly due to neglect or abuse on the part of their parents, can contribute to a sense of abandonment and low self-esteem for foster youth. 22 Yet many of these youth may have problems that are not identified by caseworkers or teachers. Ayasse notes that foster youth are more prone than their non-foster peers to experience withdrawal, anxiety, depression, inability to concentrate, and lack of social skills.23 Findings from Aldgate, et al. point out that each of these factors can influence students’ ability to focus and do well in school.24 Special Education Services for Children Needing Extra Assistance in School. The 1975 federal Individuals with Disabilities Education Act (IDEA) established the Individual Education Plan (IEP) and guaranteed all children the opportunity to attend school regardless of learning, developmental, emotional, or physical disabilities. This law applies to many children in foster care. Caregivers surveyed in Washington State report that 44 percent of the children in family foster care had learning problems, 35 percent had attention deficit disorder, 37 percent were slow learners, 16 percent had a mental retardation or developmental delay, and 18 percent had speech or language problems. One-third of the children in family foster care had received special education services within the previous three months.25 An Oregon survey conducted in 1990 found that 39 percent of foster children had an IEP, and 16 percent were in special education compared with 9 percent of all school-age children.26
18 Ibid. 19 Berliner and Fine, 12. 20 Susan dosReis, Julie Magno Zito, Daniel Safer, and Karen Soeken, “Mental Health Services for Youths in Foster Care and Disabled Youths,” American Journal of Public Health 91 (July 2001): 1094-1099. 21 Robert M. Goerge, John Van Voorhis, Stephen Grant, Katherine Casey, and Major Robinson, “Special-Education Experiences of Foster Children: An Empirical Study,” Child Welfare 71 (Sep/Oct 1992): 429. 22 Jane Aldgate, Matthew Colton, Deborah Ghate, and Anthony Heath, “Educational Attainment and Stability in Long-Term Foster Care,” Children & Society 6 (1992): 92. 23 Ayasse, 209. 24 Aldgate, Colton, Ghate, and Heath (1992), 242. 25 Berliner and Fine, 12. 26 White (1990), 1.
9
Instability. Children in foster care may experience a great deal of instability if they are moved from placement to placement. Repeatedly changing schools disrupts the educational process and can hinder a child’s ability to learn and succeed academically. Calvin estimates that “when students change schools they lose an average of four to six months of educational progress.”27 School records are often lost or are not transferred in a timely manner, which can result in a delay in student enrollment or difficulties in receiving needed services for special needs students.28 Moreover, a lack of continuity exists as students adjust to different curriculum, standards, and teachers, possibly finding that they have to repeat material already covered at the previous school or that they have missed various credits and are behind the rest of the class. Previous Research Findings on Foster Youth After They Reach Adulthood Outcomes. For all youth, prospects for future successes depend heavily on educational achievement.29 Seyfried, et al. note that for foster youth coming from fragmented family backgrounds, educational attainment and job skill preparation are especially critical to achieving self-sufficiency as adults.30 Many young adults leaving foster care, however, do not reach a level of economic independence. A 1994 study conducted by Westat found that four years after leaving care, 51 percent of former foster youth were unemployed, and 40 percent were receiving some form of public assistance.31
27 Elizabeth Calvin, Make a Difference in a Child’s Life: A Manual for Helping Children and Youth Get What They Need in School (TeamChild and Casey Family Programs, September 2001), 1. 28 Sandra Altshuler, “A Reveille for School Social Workers: Children in Foster Care Need Our Help,” Social Work in Education (April 1997): 123. 29 Sonia Jackson, “Educating Children in Residential and Foster Care,” Oxford Review of Education 20 (1994): 267. 30 Sherri Seyfried, Peter J. Pecora, A. Chris Downs, Phyllis Levine, and John Emerson, “Assessing the Educational Outcomes of Children in Long-Term Foster Care: First Findings,” School Social Work Journal 24 (Winter 2000): 69. 31 Westat, Inc., A National Evaluation of Title IV-E Foster Care Independent Living Programs for Youth: Phase 2 Final Report (Rockville, MA: Westat, Inc, 1991).
10
Because of the urgency to provide for a child’s critical needs, such as protection and safety, the educational progress of foster youth may not receive adequate attention.34 In most states, the educational needs of foster children are not consistently tracked by caseworkers, increasing the likelihood that a child’s educational problems will not be addressed by either the school or child welfare agency. The research presented in this report provides the first comprehensive analysis of the educational attainment of foster youth in Washington and suggests methods of improving information-sharing between schools and child welfare agencies.
32 Blome, 42. 33 Washington State Department of Social and Health Services, Children’s Administration 2000 Annual Performance Report (Olympia, WA, 2001). 34 Linda Jacobson, “One-on-One,” Education Week on the Web, September 9, 1998.
Emancipation and Independent Living Programs. On foster youths’ 18th birthday, they are legally emancipated from the foster care system. According to Blome, many of these youth are not prepared to live independently and cannot rely on a family support network.32 In the late 1980s, the federal government established Independent Living Programs to assist adolescent foster youth with education and employment by providing life-skills training and support services up to age 21. The Foster Care Independence Act of 1999 (also known as the Chaffee Act), expanded the mission and doubled the amount of federal funding, from $70 million to $140 million, for independent living services.
Every year in Washington State, approximately 350 youth are legally emancipated from the foster care system upon reaching age 18. Approximately 600 foster youth aged 16 to 21 were referred to Independent Living Services in Washington during 2000.33
11
III. HOW DOES THE EDUCATIONAL ACHIEVEMENT OF FOSTER YOUTH COMPARE WITH OTHER STUDENTS IN WASHINGTON STATE?
This section presents the results of a statistical analysis we conducted to see what associations exist between foster care and a student’s educational outcomes.
No single measure can accurately portray a student’s level of success in school. While most schools use a grade point average (GPA) to award credit and monitor progress, variations in grading policies make comparisons across schools problematic. In addition, a GPA alone may not reflect the difficulty of coursework taken by an individual student. This study examines educational outcomes of youth at several grade levels and compares results of children who have been in foster care with the entire school-age population. To measure achievement among students, assessment test scores are used as a gauge of success in school. While standardized tests are not the sole gauge of a student’s academic ability, they provide a worthwhile indicator of a student’s relative educational achievement. Since the tests are (1) uniform, (2) administered at the same time, and (3) validated against national benchmarks, an objective analysis can be conducted.
12
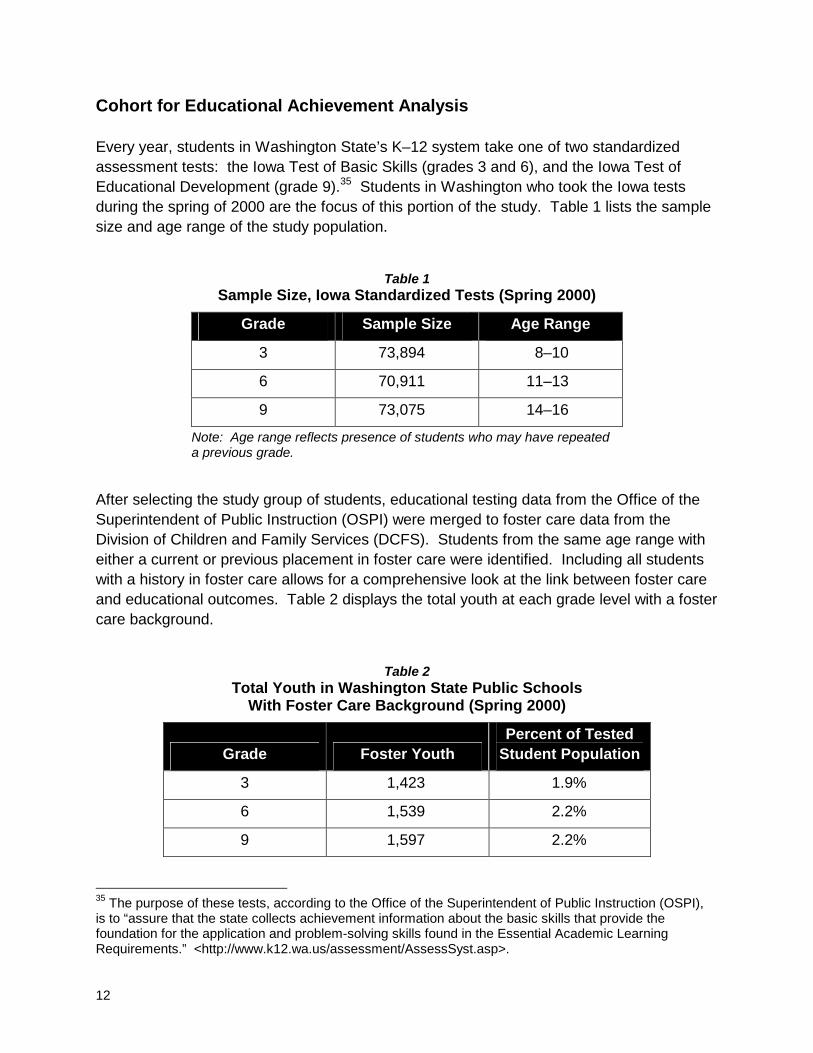
Cohort for Educational Achievement Analysis Every year, students in Washington State’s K–12 system take one of two standardized assessment tests: the Iowa Test of Basic Skills (grades 3 and 6), and the Iowa Test of Educational Development (grade 9).35 Students in Washington who took the Iowa tests during the spring of 2000 are the focus of this portion of the study. Table 1 lists the sample size and age range of the study population.
Table 1
Sample Size, Iowa Standardized Tests (Spring 2000)
Grade Sample Size Age Range
3 73,894 8–10
6 70,911 11–13
9 73,075 14–16
Note: Age range reflects presence of students who may have repeated a previous grade.
After selecting the study group of students, educational testing data from the Office of the Superintendent of Public Instruction (OSPI) were merged to foster care data from the Division of Children and Family Services (DCFS). Students from the same age range with either a current or previous placement in foster care were identified. Including all students with a history in foster care allows for a comprehensive look at the link between foster care and educational outcomes. Table 2 displays the total youth at each grade level with a foster care background.
Table 2
Total Youth in Washington State Public Schools With Foster Care Background (Spring 2000)
Grade Foster Youth Percent of Tested
Student Population
3 1,423 1.9%
6 1,539 2.2%
9 1,597 2.2%
35 The purpose of these tests, according to the Office of the Superintendent of Public Instruction (OSPI), is to “assure that the state collects achievement information about the basic skills that provide the foundation for the application and problem-solving skills found in the Essential Academic Learning Requirements.” <http://www.k12.wa.us/assessment/AssessSyst.asp>.
13
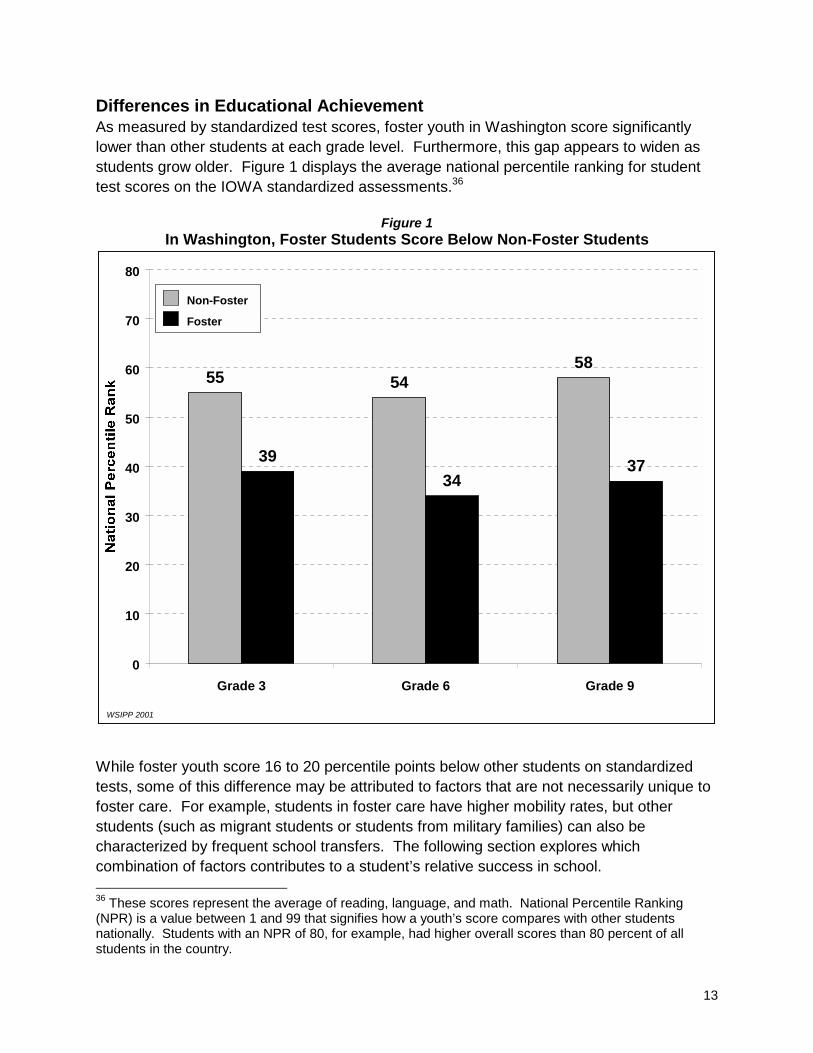
Differences in Educational Achievement As measured by standardized test scores, foster youth in Washington score significantly lower than other students at each grade level. Furthermore, this gap appears to widen as students grow older. Figure 1 displays the average national percentile ranking for student test scores on the IOWA standardized assessments.36
Figure 1 In Washington, Foster Students Score Below Non-Foster Students
55 5458
3934
37
0
10
20
30
40
50
60
70
80
Grade 3 Grade 6 Grade 9
WSIPP 2001
Non-Foster
Foster
While foster youth score 16 to 20 percentile points below other students on standardized tests, some of this difference may be attributed to factors that are not necessarily unique to foster care. For example, students in foster care have higher mobility rates, but other students (such as migrant students or students from military families) can also be characterized by frequent school transfers. The following section explores which combination of factors contributes to a student’s relative success in school. 36 These scores represent the average of reading, language, and math. National Percentile Ranking (NPR) is a value between 1 and 99 that signifies how a youth’s score compares with other students nationally. Students with an NPR of 80, for example, had higher overall scores than 80 percent of all students in the country.
14
Factors Related to Educational Achievement A valid comparison of achievement levels should include detail about those factors that contribute to a student’s success in school. By evaluating the differences among foster and non-foster youth in many different areas, we can establish a more complete picture about the nature of any disparities in achievement levels of education between the two groups. At the time students take the Iowa standardized assessment tests, they also complete a student information questionnaire. This questionnaire covers general information about a youth’s school history, family background, and views regarding school. Our analysis shows that a student’s personal background, school environment, and social network all play a large role in the level of academic success. Rather than simply highlighting overall differences in educational attainment between foster and non-foster youth, this study investigates how aspects of a youth’s life are associated with achievement. Specifically, the data address three domains, or areas of influence, among students. Approximately 20 different factors from the IOWA student information questionnaire were investigated. These domains, and some of the information examined include the following:
Individual Factors: • Gender/race • Educational aspirations • Aptitude (grade point average) • Foster care background
School Factors: • Changed school during year • Enrolled in special education or additional assistance (Title I) program • Repeated a grade • Feel safe at school
Family Factors: • Computer in household • Hours per week watching TV • English spoken in the home • Adult helps with homework
These elements, of course, represent only a few of the factors related to educational attainment. By considering these factors, however, we can determine the significance of observed differences between foster and non-foster youth. For instance, 15 to 20 percent of foster youth report having attended another school during the school year (compared with 7 to 10 percent of non-foster students). But foster youth are less likely to have other characteristics associated with lower test scores (such as living in a non-English speaking
15
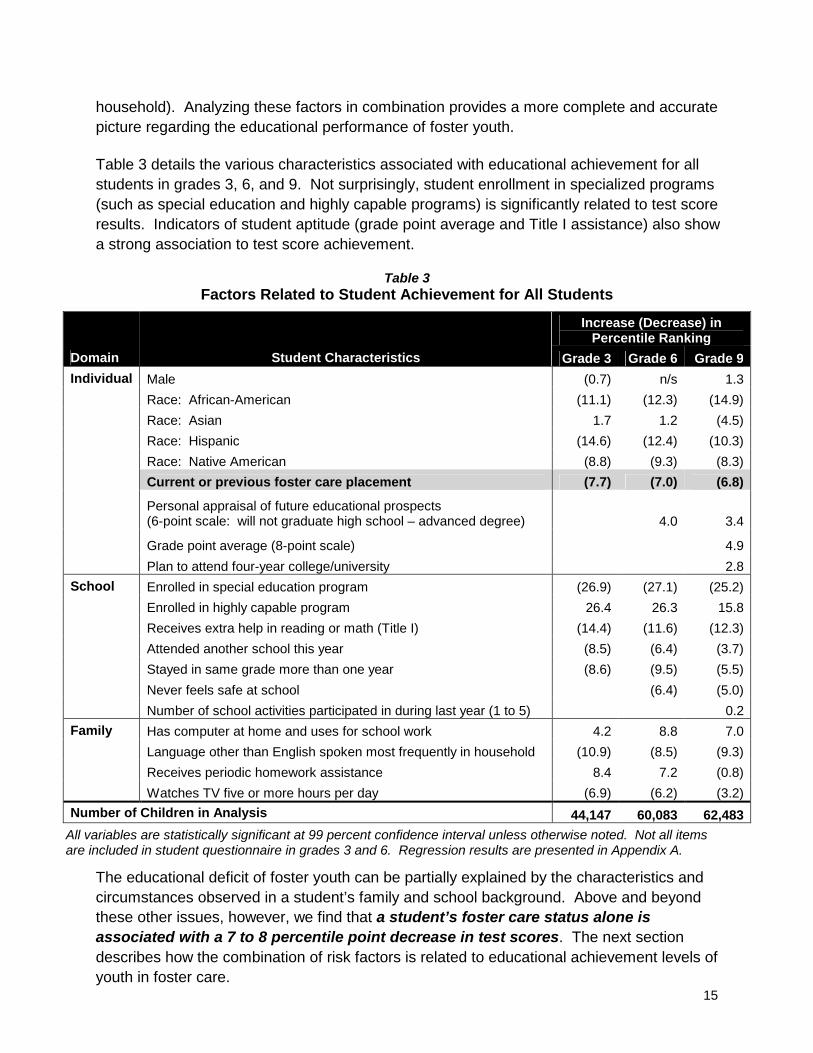
household). Analyzing these factors in combination provides a more complete and accurate picture regarding the educational performance of foster youth. Table 3 details the various characteristics associated with educational achievement for all students in grades 3, 6, and 9. Not surprisingly, student enrollment in specialized programs (such as special education and highly capable programs) is significantly related to test score results. Indicators of student aptitude (grade point average and Title I assistance) also show a strong association to test score achievement.
Table 3 Factors Related to Student Achievement for All Students
Increase (Decrease) in Percentile Ranking
Domain Student Characteristics Grade 3 Grade 6 Grade 9Male (0.7) n/s 1.3Race: African-American (11.1) (12.3) (14.9)Race: Asian 1.7 1.2 (4.5)Race: Hispanic (14.6) (12.4) (10.3)Race: Native American (8.8) (9.3) (8.3)Current or previous foster care placement (7.7) (7.0) (6.8)
Personal appraisal of future educational prospects (6-point scale: will not graduate high school – advanced degree) 4.0 3.4
Grade point average (8-point scale) 4.9
Individual
Plan to attend four-year college/university 2.8Enrolled in special education program (26.9) (27.1) (25.2)Enrolled in highly capable program 26.4 26.3 15.8Receives extra help in reading or math (Title I) (14.4) (11.6) (12.3)Attended another school this year (8.5) (6.4) (3.7)Stayed in same grade more than one year (8.6) (9.5) (5.5)Never feels safe at school (6.4) (5.0)
School
Number of school activities participated in during last year (1 to 5) 0.2Has computer at home and uses for school work 4.2 8.8 7.0Language other than English spoken most frequently in household (10.9) (8.5) (9.3)Receives periodic homework assistance 8.4 7.2 (0.8)
Family
Watches TV five or more hours per day (6.9) (6.2) (3.2)Number of Children in Analysis 44,147 60,083 62,483
All variables are statistically significant at 99 percent confidence interval unless otherwise noted. Not all items are included in student questionnaire in grades 3 and 6. Regression results are presented in Appendix A.
The educational deficit of foster youth can be partially explained by the characteristics and circumstances observed in a student’s family and school background. Above and beyond these other issues, however, we find that a student’s foster care status alone is associated with a 7 to 8 percentile point decrease in test scores. The next section describes how the combination of risk factors is related to educational achievement levels of youth in foster care.
16
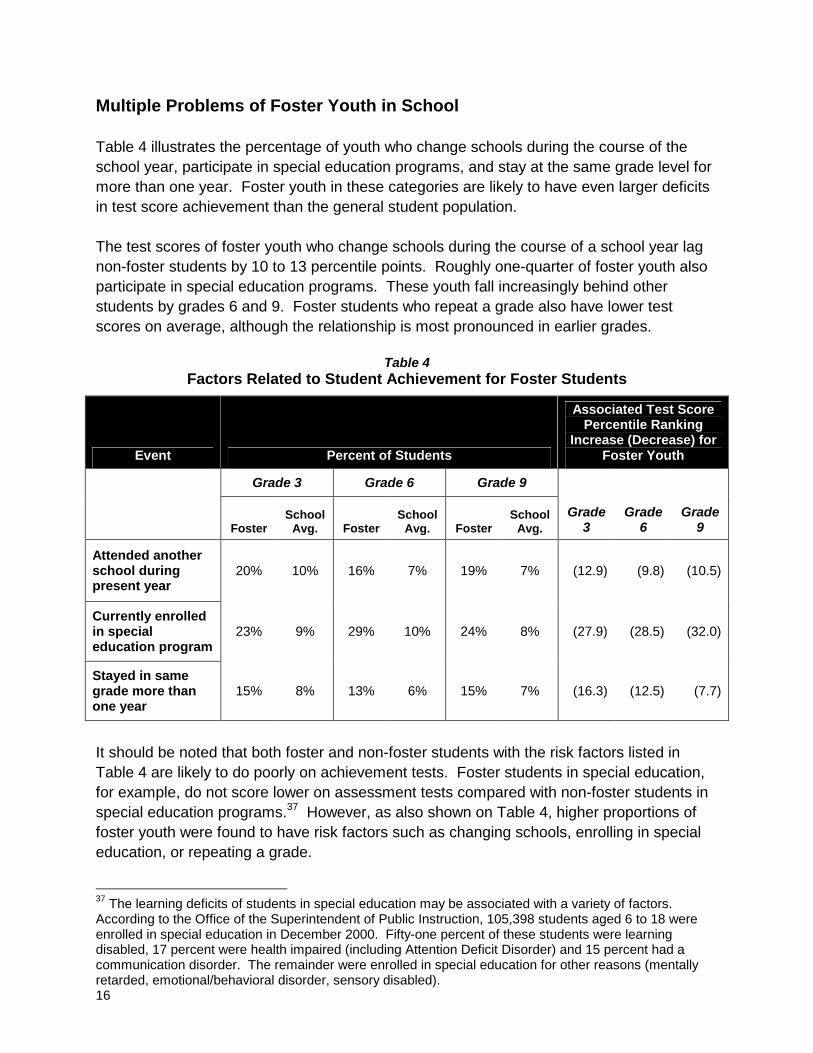
Multiple Problems of Foster Youth in School Table 4 illustrates the percentage of youth who change schools during the course of the school year, participate in special education programs, and stay at the same grade level for more than one year. Foster youth in these categories are likely to have even larger deficits in test score achievement than the general student population. The test scores of foster youth who change schools during the course of a school year lag non-foster students by 10 to 13 percentile points. Roughly one-quarter of foster youth also participate in special education programs. These youth fall increasingly behind other students by grades 6 and 9. Foster students who repeat a grade also have lower test scores on average, although the relationship is most pronounced in earlier grades.
Table 4 Factors Related to Student Achievement for Foster Students
Event Percent of Students
Associated Test Score Percentile Ranking
Increase (Decrease) for Foster Youth
Grade 3 Grade 6 Grade 9
Foster School
Avg. Foster School
Avg. Foster School
Avg. Grade
3 Grade
6 Grade
9
Attended another school during present year
20% 10% 16% 7% 19% 7% (12.9) (9.8) (10.5)
Currently enrolled in special education program
23% 9% 29% 10% 24% 8% (27.9) (28.5) (32.0)
Stayed in same grade more than one year
15% 8% 13% 6% 15% 7% (16.3) (12.5) (7.7)
It should be noted that both foster and non-foster students with the risk factors listed in Table 4 are likely to do poorly on achievement tests. Foster students in special education, for example, do not score lower on assessment tests compared with non-foster students in special education programs.37 However, as also shown on Table 4, higher proportions of foster youth were found to have risk factors such as changing schools, enrolling in special education, or repeating a grade.
37 The learning deficits of students in special education may be associated with a variety of factors. According to the Office of the Superintendent of Public Instruction, 105,398 students aged 6 to 18 were enrolled in special education in December 2000. Fifty-one percent of these students were learning disabled, 17 percent were health impaired (including Attention Deficit Disorder) and 15 percent had a communication disorder. The remainder were enrolled in special education for other reasons (mentally retarded, emotional/behavioral disorder, sensory disabled).
17
Previous Foster Care Placement History and School Outcomes In addition to aspects of a student’s school environment, a youth’s experiences in the foster care system may also be connected to educational outcomes. This section explores aspects of a youth’s background in foster care as it relates to achievement in school. To this point, we have compared foster care and non-foster care youth. Within the category of foster care youth, significant variation may occur. Using administrative records from the state child welfare system, a ten-year history of Washington State foster care involvement was constructed for all foster children in grades 3, 6, and 9. The recorded information included the following:
• Total time in foster care
• Number of placements
• Age first entered foster care
• Recently entered care (in year prior to survey)
• Average number of placements per year
• Currently in foster care (at time of survey)
• Average number of caseworkers per year
• Special services provided
After accounting for the factors described in the previous section, no relationship was found between a youth’s test scores and total length of time spent in foster care. For example, youth in foster care for 60 days or less do not have significantly different test scores than youth in long-term foster care (more than 60 days). In addition, placement history, age at entry, caseworker turnover, and special services did not have any relationship to positive (or negative) assessment scores. A closer analysis of youth in long-term foster care did reveal two trends between foster care background and educational outcomes. Among all youth with a background in foster care, younger children (grades 3 and 6) who were currently in care exhibited higher achievement levels (4 to 5 percentile points) than those that had left foster care. For older foster children (grades 6 and 9), those who had recently entered care tended to score lower on assessment tests (9 to 16 percentile points) compared with youth with previous foster care placements.38
38 These estimates also account for the individual, school, and family factors described previously. Regression results are presented in Appendix B. Youth in long-term care (more than 60 days) were chosen because they are more likely to have been declared dependent and be in state custody. After a dependency petition is granted by the court, the youth should no longer be in temporary foster placements. Approximately half of all children entering foster care stay longer than 60 days.

19
IV. WHAT ARE THE GRADUATION PROSPECTS FOR FOSTER YOUTH? School teachers and administrators monitor the progress of students throughout each grade level to ensure they obtain the skills and education necessary to complete high school. For foster youth, high school completion is viewed as particularly important. Once foster youth reach age 18, they may not have family supports that other teenagers rely upon. Recognizing the importance of supporting these youth, in 1999 the federal Chafee Foster Care Independence Act doubled the funding for Independent Living Services, from $70 million to $140 million per year. Independent Living Services provide education assistance, life-skills training, medical access, and housing aid to foster youth or former foster youth age 16 or older. In federal fiscal year 2000, 636 youth were referred to Independent Living Services in Washington State. In examining high school completion rates, certain methodological challenges are present. Determining a foster youth’s likelihood of completing high school can be somewhat difficult. National estimates of the number of foster care youth who leave care with a high school diploma range between 37 and 60 percent.39 These estimates vary depending on the size of the population studied, the point at which researchers begin following students, and the upper age limit measured for high school completion. The following limitations to our analysis should be noted.
• This study only includes a one-year follow-up to determine the probability of high school completion. We begin with students in the third year of high school and find out how many of these students graduate on time. While this presents the most common scenario of high school graduation, a follow-up period of two years or more may yield different information about completion rates.
• The study cohort is limited to students who take the standardized test in 11th grade and enroll in the 12th grade in Washington State. The status of students who appear in the 11th grade but do not enroll in 12th grade is unknown. Some of these students may drop out and fail to graduate on time. Others may transfer to a private school or schools outside the state. Since we cannot determine outcomes for these students, they are excluded from the analysis.40
39 Blome, 1997; Westat, 1991. 40 A smaller percentage of foster students were found to be enrolled in grade 12 (50 percent) compared with other students (59 percent). This disparity may be due to matching procedures, data entry anomalies, and student mobility. However, if the assumption that missing students did not have better graduation outcomes than found students is correct, results presented in this study may over-estimate the percentage of foster youth who are likely to complete high school on time.
20
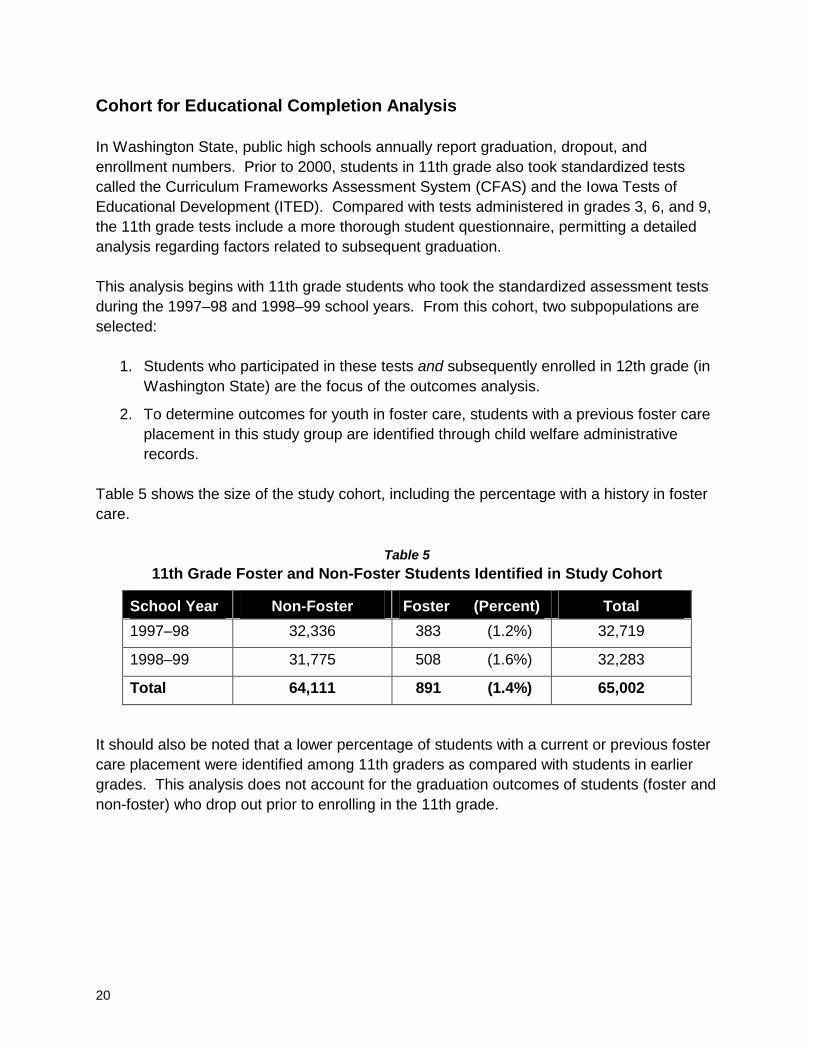
Cohort for Educational Completion Analysis In Washington State, public high schools annually report graduation, dropout, and enrollment numbers. Prior to 2000, students in 11th grade also took standardized tests called the Curriculum Frameworks Assessment System (CFAS) and the Iowa Tests of Educational Development (ITED). Compared with tests administered in grades 3, 6, and 9, the 11th grade tests include a more thorough student questionnaire, permitting a detailed analysis regarding factors related to subsequent graduation. This analysis begins with 11th grade students who took the standardized assessment tests during the 1997–98 and 1998–99 school years. From this cohort, two subpopulations are selected:
1. Students who participated in these tests and subsequently enrolled in 12th grade (in Washington State) are the focus of the outcomes analysis.
2. To determine outcomes for youth in foster care, students with a previous foster care placement in this study group are identified through child welfare administrative records.
Table 5 shows the size of the study cohort, including the percentage with a history in foster care.
Table 5 11th Grade Foster and Non-Foster Students Identified in Study Cohort
School Year Non-Foster Foster (Percent) Total 1997–98 32,336 383 (1.2%) 32,719
1998–99 31,775 508 (1.6%) 32,283
Total 64,111 891 (1.4%) 65,002
It should also be noted that a lower percentage of students with a current or previous foster care placement were identified among 11th graders as compared with students in earlier grades. This analysis does not account for the graduation outcomes of students (foster and non-foster) who drop out prior to enrolling in the 11th grade.
21
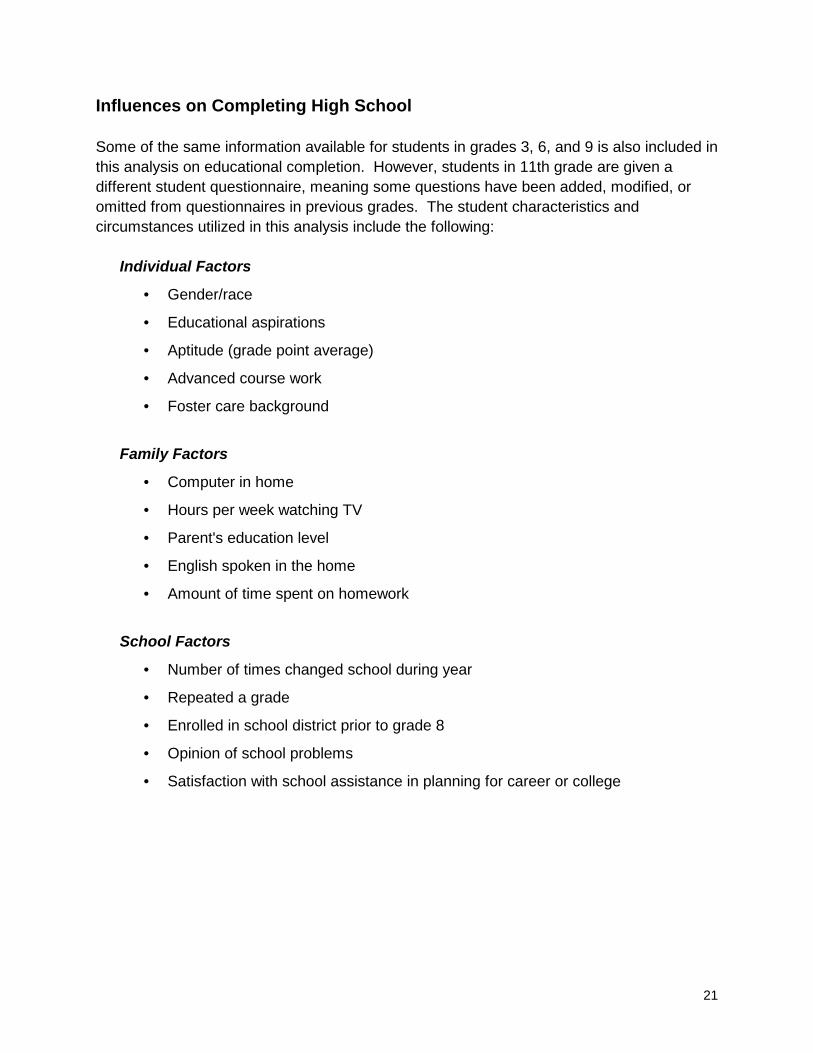
Influences on Completing High School Some of the same information available for students in grades 3, 6, and 9 is also included in this analysis on educational completion. However, students in 11th grade are given a different student questionnaire, meaning some questions have been added, modified, or omitted from questionnaires in previous grades. The student characteristics and circumstances utilized in this analysis include the following:
Individual Factors
• Gender/race
• Educational aspirations
• Aptitude (grade point average)
• Advanced course work
• Foster care background
Family Factors
• Computer in home
• Hours per week watching TV
• Parent's education level
• English spoken in the home
• Amount of time spent on homework
School Factors
• Number of times changed school during year
• Repeated a grade
• Enrolled in school district prior to grade 8
• Opinion of school problems
• Satisfaction with school assistance in planning for career or college
22
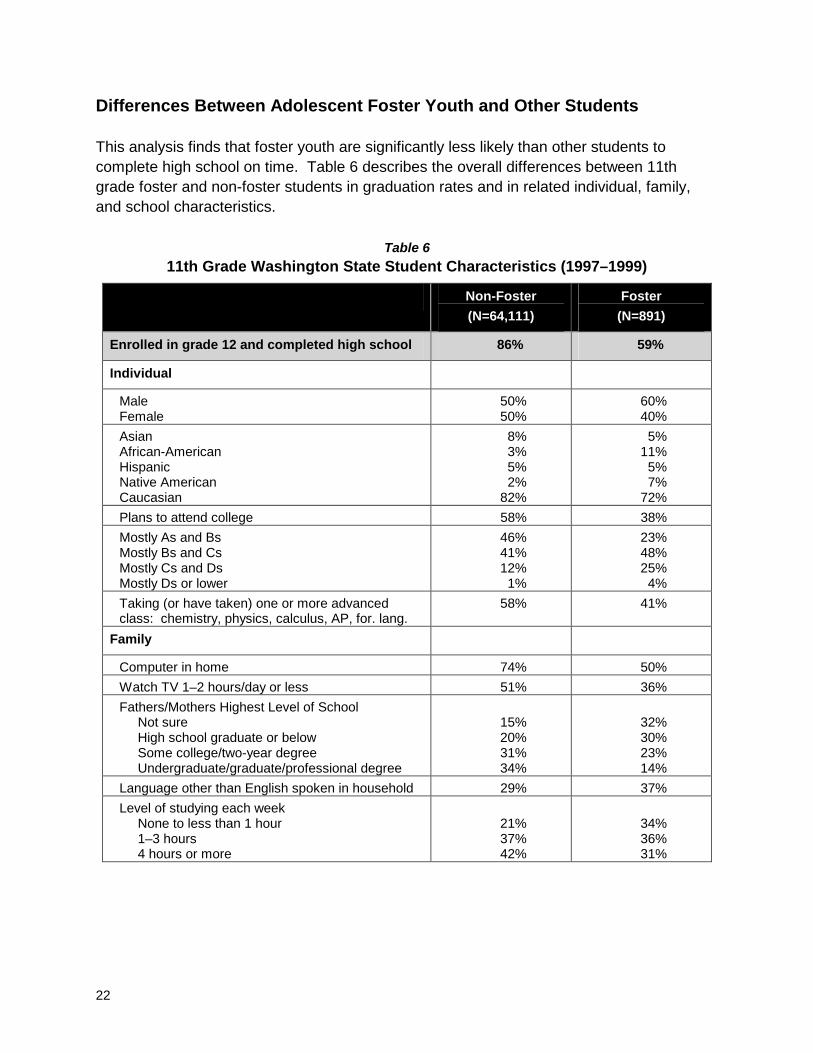
Differences Between Adolescent Foster Youth and Other Students This analysis finds that foster youth are significantly less likely than other students to complete high school on time. Table 6 describes the overall differences between 11th grade foster and non-foster students in graduation rates and in related individual, family, and school characteristics.
Table 6 11th Grade Washington State Student Characteristics (1997–1999)
Non-Foster (N=64,111)
Foster (N=891)
Enrolled in grade 12 and completed high school 86% 59%
Individual
Male Female
50% 50%
60% 40%
Asian African-American Hispanic Native American Caucasian
8% 3% 5% 2%
82%
5% 11% 5% 7%
72% Plans to attend college 58% 38% Mostly As and Bs Mostly Bs and Cs Mostly Cs and Ds Mostly Ds or lower
46% 41% 12% 1%
23% 48% 25% 4%
Taking (or have taken) one or more advanced class: chemistry, physics, calculus, AP, for. lang.
58% 41%
Family
Computer in home 74% 50% Watch TV 1–2 hours/day or less 51% 36% Fathers/Mothers Highest Level of School Not sure High school graduate or below Some college/two-year degree Undergraduate/graduate/professional degree
15% 20% 31% 34%
32% 30% 23% 14%
Language other than English spoken in household 29% 37% Level of studying each week None to less than 1 hour 1–3 hours 4 hours or more
21% 37% 42%
34% 36% 31%
23
Table 6 (continued) 11th Grade Washington State Student Characteristics (1997–1999)
Non-Foster (n=64,111)
Foster (n=891)
School
Most times changed school during same year (since grade 9) None Once Twice Three or more times
87% 9% 3% 1%
65% 20% 9% 7%
Enrolled in school district before grade 8 68% 46% Repeated a grade 8% 15% Considers most of following issues as serious problems in school: absenteeism, alcohol, drugs, school spirit, student behavior, cutting class
10%
12%
Overall satisfaction with college/career guidance, classroom instruction, and school policies Satisfied Somewhat satisfied Not satisfied No opinion
14% 53% 29% 4%
15% 45% 32% 8%
Foster students answered all questions at a lower rate than other students. Reported percentage totals exclude skipped questions. Percents may not add to 100 due to rounding. Regression results are presented in Appendix C.
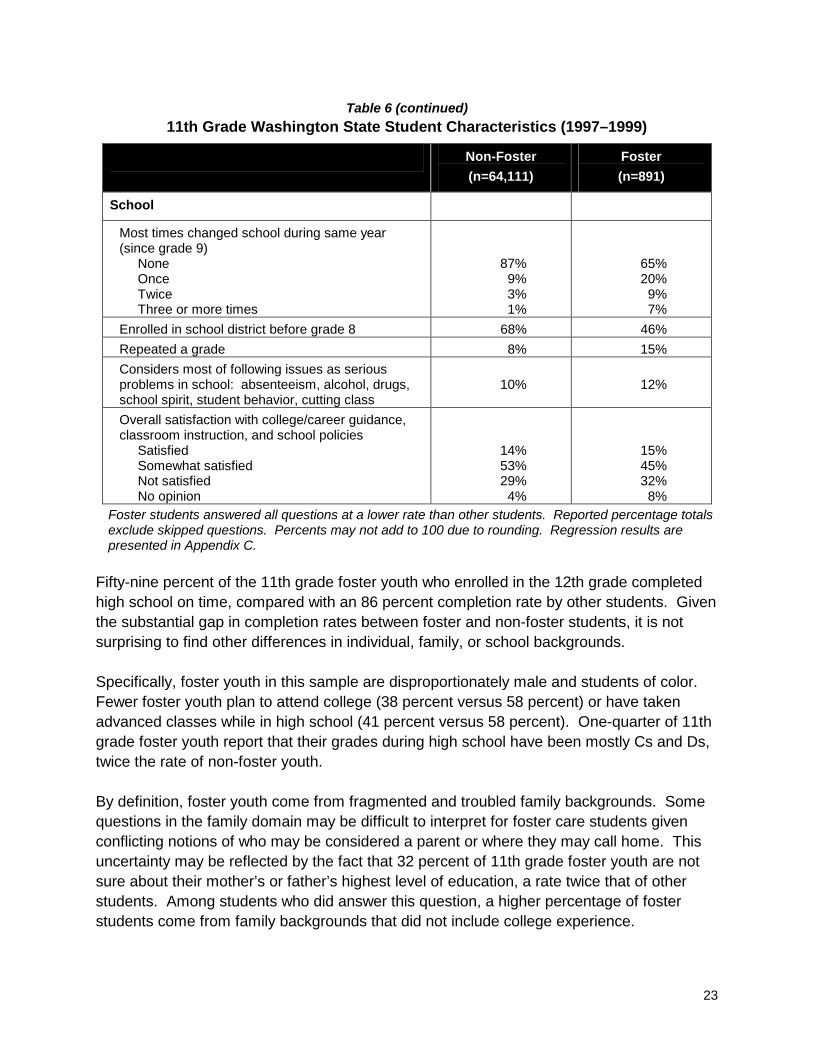
Fifty-nine percent of the 11th grade foster youth who enrolled in the 12th grade completed high school on time, compared with an 86 percent completion rate by other students. Given the substantial gap in completion rates between foster and non-foster students, it is not surprising to find other differences in individual, family, or school backgrounds. Specifically, foster youth in this sample are disproportionately male and students of color. Fewer foster youth plan to attend college (38 percent versus 58 percent) or have taken advanced classes while in high school (41 percent versus 58 percent). One-quarter of 11th grade foster youth report that their grades during high school have been mostly Cs and Ds, twice the rate of non-foster youth. By definition, foster youth come from fragmented and troubled family backgrounds. Some questions in the family domain may be difficult to interpret for foster care students given conflicting notions of who may be considered a parent or where they may call home. This uncertainty may be reflected by the fact that 32 percent of 11th grade foster youth are not sure about their mother’s or father’s highest level of education, a rate twice that of other students. Among students who did answer this question, a higher percentage of foster students come from family backgrounds that did not include college experience.
24
The most pronounced differences between foster and non-foster youth appear in the school-related areas of mobility, stability, and promotion. In terms of mobility, 11th grade students were asked how many times they have changed schools during the same school year since the 9th grade. Compared with all other students, twice as many foster youth changed schools once (20 percent versus 9 percent) and three times as many changed schools twice (9 percent versus 3 percent). Seven percent of 11th grade foster students changed schools three or more times since grade 9. Foster students, on average, do not have a stable, lasting relationship in their current school district. While 46 percent of foster students were enrolled in their current school district before grade 8, this number is significantly lower than the nearly 70 percent of other students who have been in the district prior to high school. Finally, 15 percent of foster youth in 11th grade stated that they had previously stayed in the same grade for more than one year compared with 8 percent of non-foster students. Graduation Results: Explaining Differences Given the consistent differences between foster and non-foster students across the individual, family, and school domains, questions arise about the nature of the relationship between foster care and a youth’s chances of completing high school. That is, does the fact that a youth is in foster care indicate that he or she is less likely to complete high school, or is the lower educational completion rate of foster youth more closely tied to other factors (such as academic ability or level of assistance in school)? To address this question, we conducted a multivariate statistical analysis that accounts for the influence of various student, family, and school attributes. We found that both characteristics unique to foster youth and other factors shared by all students are associated with educational completion. The following top five factors independently predict on-time high school completion (in order of importance):
1. Grade point average
2. School mobility (number of times change school during year)
3. Post-high school plans (college-bound)
4. School continuity (enrolled in district prior to high school)
5. Current or previous foster care placement
! Foster youth are 57 percent less likely to complete high school compared with other 11th graders.

25
This analysis confirms that there is reason to be concerned about the educational prospects of youth in foster care. Children who have been placed out of home in a foster care setting are distinctly at risk of not finishing high school. These foster children also have a higher rate of additional risk factors that are linked to lower completion levels. The combination of lower grades, more frequent school mobility, fewer post-high school aspirations, and less stability or history with the same school means that foster students are at a high risk of not completing high school on time compared with the general school population.

27
V. FOSTER CARE AND EDUCATION: OPTIONS FOR INFORMATION SHARING
In 1997, the Washington State Legislature created the Foster Care Passport Program (passport).41 The passport (also referred to as the Health and Education Passport) is a record of a foster child’s dental, medical, behavioral, psychological, and educational status. The passport was created in accordance with the Federal Omnibus Budget Reconciliation Act (OBRA) of 1989 (P.L. 101-239) which “requires that the written case plan developed for each foster care child include specified health and education records which are to be reviewed and updated when the child is placed in foster care and to be supplied to the foster care parent or provider.”42
Since the program began in July 1997, children who are in foster care for more than 90 consecutive days receive first priority for passports. From the implementation of the program through February 2001, approximately 9,000 passports have been completed. Approximately 59 percent of long-term foster children have a passport. The 2001–03 state budget includes an appropriation of $1.5 million to fund passports for an additional 1,300 children.43 Who Uses Passports? The passport is created primarily to serve foster parents, caseworkers, and health care providers. Foster parents receive important information to assist in caregiving responsibilities. Caseworkers can use the passport to make informed recommendations for the child’s case plan. Foster parents or caseworkers are responsible for communicating important educational information to the child’s school. The medical and health information assists health care providers in giving the most appropriate care.
41 RCW 74.13.285 (2000 c 88 §2; 1997 c 272 §5). 42 Suzanne Lindsay, David Chadwick, John Landsverk, and Edward Pierce, “A Computerized Health and Education Passport for Children in Out-of-Home Care: The San Diego Model,” Child Welfare 72 (November/December 1993): 583. 43 Senate Ways and Means Committee, “2001-03 Omnibus Operating Budget, Department of Social and Health Services, Children and Family Services,” Washington State 57th Legislature, Special Session, June 20, 2001; Department of Social and Health Services, “Sustaining Social and Health Services: Implementing the 2001-03 DSHS Budget,” July 31, 2001.
28
What Do Passports Include? Health Information. A public health nurse has the primary responsibility for creating the initial passport and incorporating health-related information. The nurse contacts the child’s caseworker, foster parents, and birth parents (if possible), reviews the child’s Division of Children and Family Services (DCFS) file, and queries all medical records. The nurse uses this information to write a health recommendation letter to accompany the passport. The actual passport contains only the information that is needed to provide day-to-day care for the child and includes a record of vaccinations, allergies, current medications and dosages, upcoming appointments, current health care providers, medical problems, information regarding last doctor visit, historically significant findings, and psychiatric/psychological diagnoses. In addition, significant behavioral issues are identified, as is the child’s daily routine (which includes hobbies and specific needs). Educational Information. As soon as a public health nurse receives a referral to create a passport, the child’s caseworker is notified. The caseworker is responsible for incorporating the child’s educational information into the health and education database. Public health nurses can also enter educational data if they have the necessary information. The passport includes the child’s current and past schools, grade level, start and end date of the child’s Individual Education Plan (IEP) at each school attended (if applicable), and a school contact person. The majority of passports include little, if any, educational information. A requested data extract from the Department of Social and Health Services (DSHS) revealed that of all active foster care placements in August 2001, 5,552 children had a completed passport. Only 793 (14 percent) of these passports included any information related to the foster child’s education. According to DSHS, high caseloads and difficulty in obtaining records from schools have prevented many caseworkers from consistently updating passports with educational information.44 Without procedures to update and maintain the educational portion of the passport, existing data can become outdated and unreliable.
44 Personal interview with Julie Stachowiak, Statewide Foster Care Passport Program Coordinator, August 3, 2001.
29
Suggested Improvements to the Foster Care Passport Program Given the high mobility of students in foster care, requiring caseworkers or public health nurses to update educational records would be extremely time consuming. In addition, procedures have not been established at the school level to efficiently send student data to caseworkers. Given these difficulties, an automated transfer of information through statewide administrative databases may provide a practical solution. Currently, DSHS receives computerized immunization records from the Department of Health. Through a regular data transfer, immunization records in a foster child’s passport are automatically added and updated. This model could also be employed to update education data in the foster care passport. Two potential issues would have to be addressed before considering the sharing of records between child welfare and education agencies. First, educational data should be current and uniform for all students. Second, methods of transfer must preserve and protect student confidentiality and privacy. The Office of the Superintendent of Public Instruction (OSPI) has implemented several initiatives to improve the consistency and reliability of student information systems in Washington State. OSPI is currently piloting a new database called the Core Student Record System in up to ten school districts throughout the state. The Core Student Record System includes the following information on students:
• School district (including enrollment changes)
• Grade level
• Expected year of graduation (indicating age-appropriate grade)
• Disability status
• Enrollment status
• Cumulative grade point average
• Program participation (vocational education, bilingual, special assistance) Additional data, such as assessment test scores, from OSPI could be electronically appended to records in the Core Student Record System.45 The system will be fully implemented across the state in July 2003.
45 Office of the Superintendent of Public Instruction, “Initial Set of Elements Used to Define the Core Student Record System,” handout provided to author by OSPI Information Resources Management; Ed Strozyk, Office of the Superintendent of Public Instruction, telephone conversation with author, August 3, 2001.
30
The use of a new Uniform Student Identifier Code (USIC) within the Core Student Record System will facilitate the secure transfer of education data and permit an accurate reporting of outcomes as students move among school districts. The USIC will provide each student in Washington State with a confidential individual identification number that can be associated with educational records without violating student privacy.46 Access to student records is strictly governed by state and federal guidelines. With regard to educational records of foster children, state law already specifies:
… education records shall be released upon request to the department of social and health services provided that the department of social and health services certifies that it will not disclose to any other party the education records without prior written consent of the parent or student unless authorized to disclose the records under state law. The department of social and health services is authorized to disclose education records it obtains pursuant to this section to a foster parent, guardian, or other entity authorized by the department of social and health services to provide residential care to the student. (RCW 28A.150.510)
An annual transfer of education data from OSPI to DSHS could help the Children’s Administration maintain current and reliable education information for youth in foster care. Existing research, including this study, shows that repeated changes in schools and disruptions in the educational process are associated with a lack of academic success. Improving the reliability of information shared among foster parents, schools, court officers, and caseworkers could help prevent the fragmentation of educational support for foster youth. Like the health portion of the passport, education data should highlight the “symptoms” associated with a lack of educational success. While this study does not evaluate particular interventions or remedies to improve the educational attainment of foster youth, it does set an important direction for future research. By measuring the magnitude of the educational gap between foster and non-foster youth and pointing to the important warning signs of problems in school, this study can guide efforts to help improve the educational outcomes for children in state care.
46 Office of the Superintendent of Public Instruction, “Implementing a Unique Student Identifier Code for Students in Washington State,” handout provided to author by OSPI Information Resources Management.

APPENDICES

33
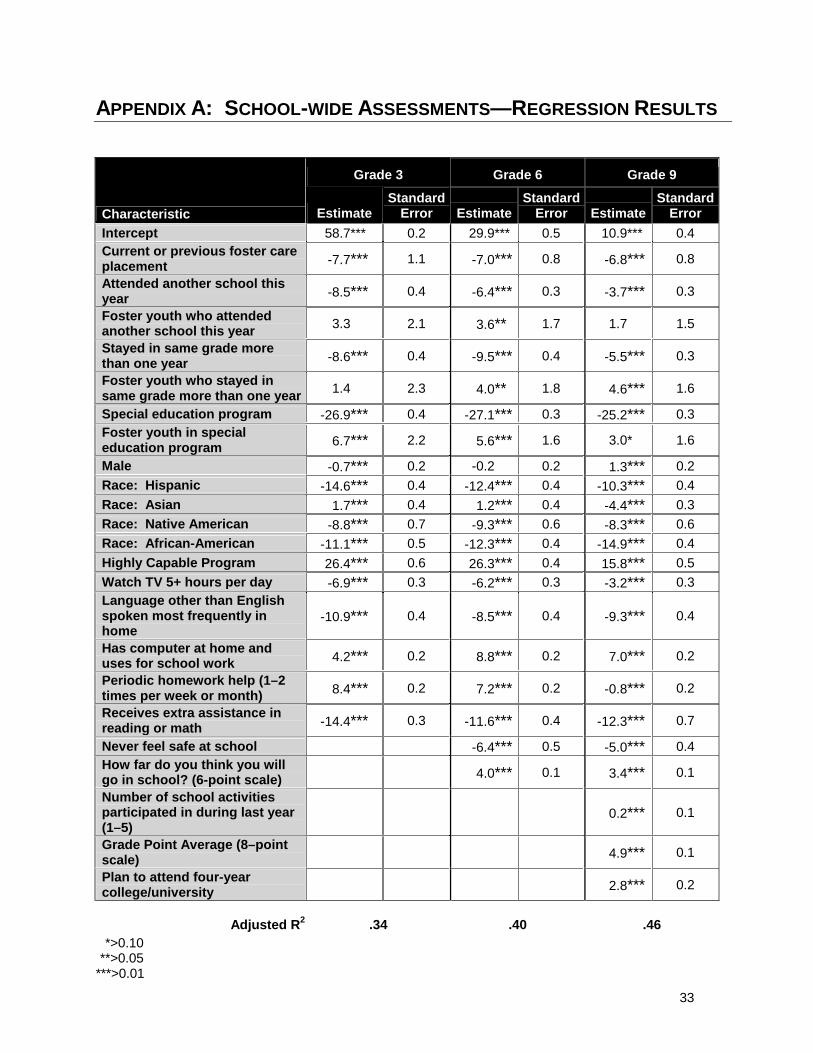
APPENDIX A: SCHOOL-WIDE ASSESSMENTS—REGRESSION RESULTS
Grade 3 Grade 6 Grade 9
Characteristic Estimate Standard
Error EstimateStandard
Error Estimate Standard
Error Intercept 58.7*** 0.2 29.9*** 0.5 10.9*** 0.4 Current or previous foster care placement -7.7*** 1.1 -7.0*** 0.8 -6.8*** 0.8
Attended another school this year -8.5*** 0.4 -6.4*** 0.3 -3.7*** 0.3
Foster youth who attended another school this year 3.3 2.1 3.6** 1.7 1.7 1.5
Stayed in same grade more than one year -8.6*** 0.4 -9.5*** 0.4 -5.5*** 0.3
Foster youth who stayed in same grade more than one year 1.4 2.3 4.0** 1.8 4.6*** 1.6
Special education program -26.9*** 0.4 -27.1*** 0.3 -25.2*** 0.3 Foster youth in special education program 6.7*** 2.2 5.6*** 1.6 3.0* 1.6
Male -0.7*** 0.2 -0.2 0.2 1.3*** 0.2 Race: Hispanic -14.6*** 0.4 -12.4*** 0.4 -10.3*** 0.4 Race: Asian 1.7*** 0.4 1.2*** 0.4 -4.4*** 0.3 Race: Native American -8.8*** 0.7 -9.3*** 0.6 -8.3*** 0.6 Race: African-American -11.1*** 0.5 -12.3*** 0.4 -14.9*** 0.4 Highly Capable Program 26.4*** 0.6 26.3*** 0.4 15.8*** 0.5 Watch TV 5+ hours per day -6.9*** 0.3 -6.2*** 0.3 -3.2*** 0.3 Language other than English spoken most frequently in home
-10.9*** 0.4 -8.5*** 0.4 -9.3*** 0.4
Has computer at home and uses for school work 4.2*** 0.2 8.8*** 0.2 7.0*** 0.2
Periodic homework help (1–2 times per week or month) 8.4*** 0.2 7.2*** 0.2 -0.8*** 0.2
Receives extra assistance in reading or math -14.4*** 0.3 -11.6*** 0.4 -12.3*** 0.7
Never feel safe at school -6.4*** 0.5 -5.0*** 0.4 How far do you think you will go in school? (6-point scale) 4.0*** 0.1 3.4*** 0.1
Number of school activities participated in during last year (1–5)
0.2*** 0.1
Grade Point Average (8–point scale) 4.9*** 0.1
Plan to attend four-year college/university 2.8*** 0.2
Adjusted R2 .34 .40 .46
*>0.10 **>0.05 ***>0.01

35
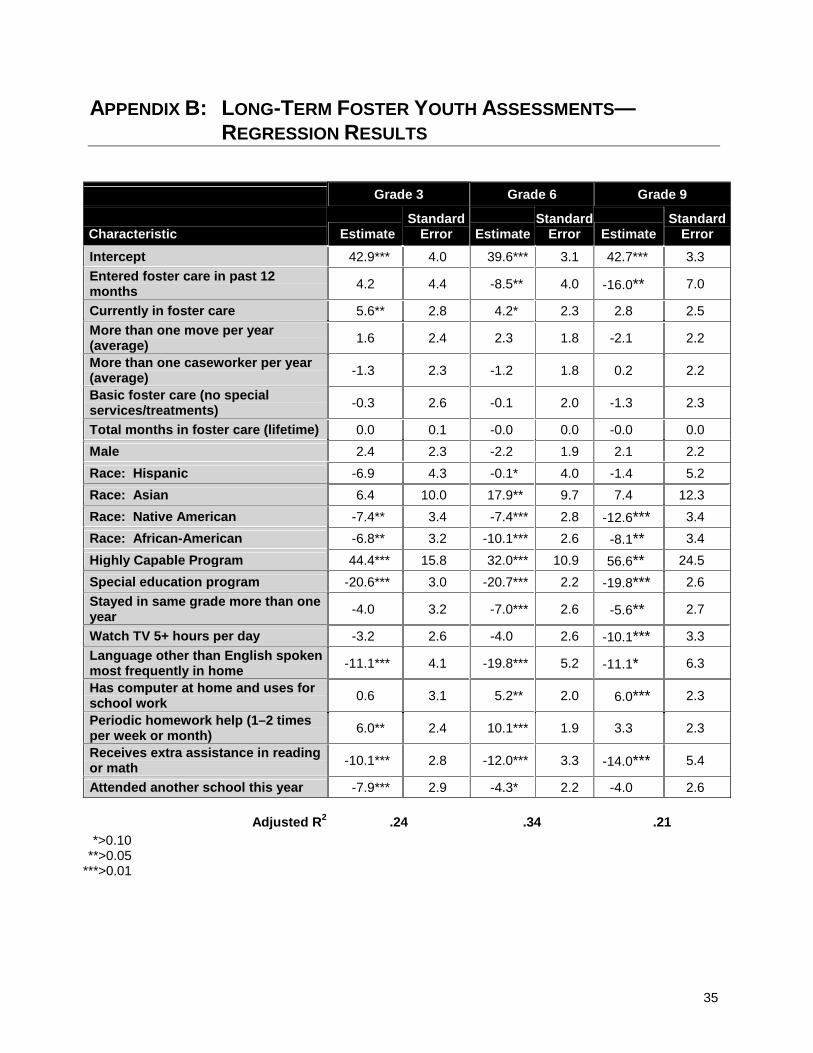
APPENDIX B: LONG-TERM FOSTER YOUTH ASSESSMENTS—REGRESSION RESULTS
Grade 3 Grade 6 Grade 9
Characteristic EstimateStandard
Error EstimateStandard
Error EstimateStandard
Error Intercept 42.9*** 4.0 39.6*** 3.1 42.7*** 3.3 Entered foster care in past 12 months 4.2 4.4 -8.5** 4.0 -16.0** 7.0
Currently in foster care 5.6** 2.8 4.2* 2.3 2.8 2.5 More than one move per year (average) 1.6 2.4 2.3 1.8 -2.1 2.2
More than one caseworker per year (average) -1.3 2.3 -1.2 1.8 0.2 2.2
Basic foster care (no special services/treatments) -0.3 2.6 -0.1 2.0 -1.3 2.3
Total months in foster care (lifetime) 0.0 0.1 -0.0 0.0 -0.0 0.0 Male 2.4 2.3 -2.2 1.9 2.1 2.2 Race: Hispanic -6.9 4.3 -0.1* 4.0 -1.4 5.2 Race: Asian 6.4 10.0 17.9** 9.7 7.4 12.3 Race: Native American -7.4** 3.4 -7.4*** 2.8 -12.6*** 3.4 Race: African-American -6.8** 3.2 -10.1*** 2.6 -8.1** 3.4 Highly Capable Program 44.4*** 15.8 32.0*** 10.9 56.6** 24.5 Special education program -20.6*** 3.0 -20.7*** 2.2 -19.8*** 2.6 Stayed in same grade more than one year -4.0 3.2 -7.0*** 2.6 -5.6** 2.7
Watch TV 5+ hours per day -3.2 2.6 -4.0 2.6 -10.1*** 3.3 Language other than English spoken most frequently in home -11.1*** 4.1 -19.8*** 5.2 -11.1* 6.3
Has computer at home and uses for school work 0.6 3.1 5.2** 2.0 6.0*** 2.3
Periodic homework help (1–2 times per week or month) 6.0** 2.4 10.1*** 1.9 3.3 2.3
Receives extra assistance in reading or math -10.1*** 2.8 -12.0*** 3.3 -14.0*** 5.4
Attended another school this year -7.9*** 2.9 -4.3* 2.2 -4.0 2.6
Adjusted R2 .24 .34 .21 *>0.10 **>0.05 ***>0.01

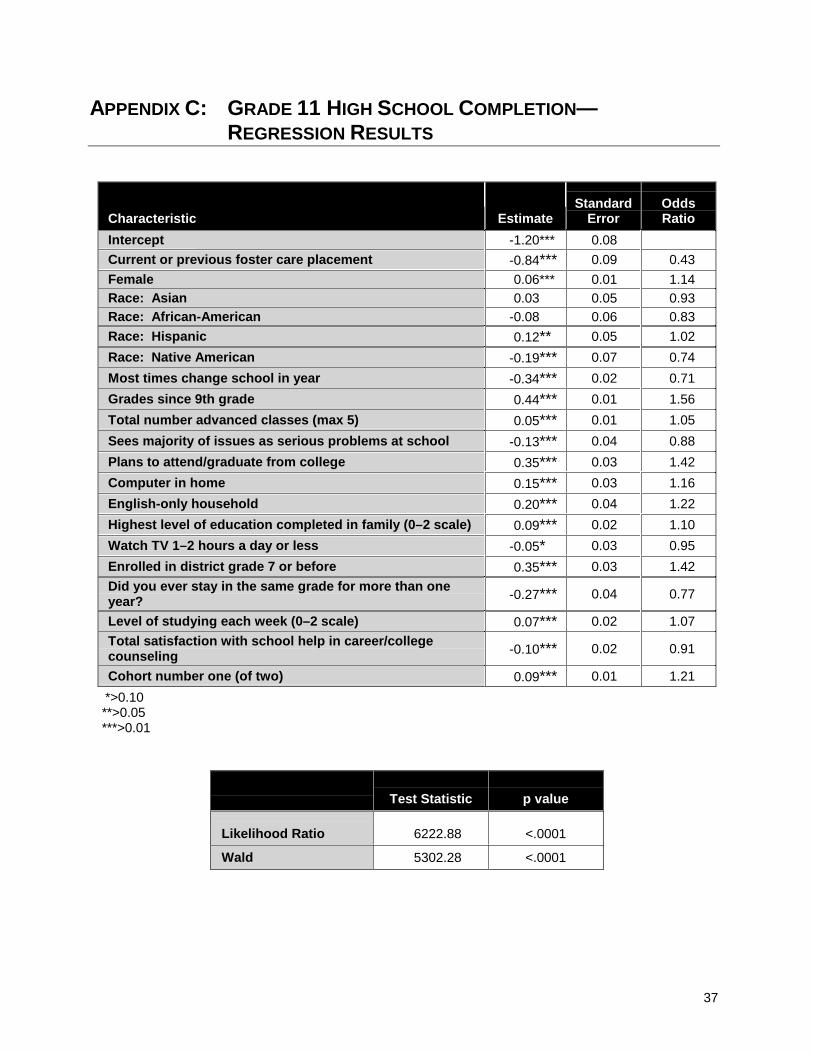
37
APPENDIX C: GRADE 11 HIGH SCHOOL COMPLETION— REGRESSION RESULTS
Characteristic Estimate Standard
Error Odds Ratio
Intercept -1.20*** 0.08 Current or previous foster care placement -0.84*** 0.09 0.43 Female 0.06*** 0.01 1.14 Race: Asian 0.03 0.05 0.93 Race: African-American -0.08 0.06 0.83 Race: Hispanic 0.12** 0.05 1.02 Race: Native American -0.19*** 0.07 0.74 Most times change school in year -0.34*** 0.02 0.71 Grades since 9th grade 0.44*** 0.01 1.56 Total number advanced classes (max 5) 0.05*** 0.01 1.05 Sees majority of issues as serious problems at school -0.13*** 0.04 0.88 Plans to attend/graduate from college 0.35*** 0.03 1.42 Computer in home 0.15*** 0.03 1.16 English-only household 0.20*** 0.04 1.22 Highest level of education completed in family (0–2 scale) 0.09*** 0.02 1.10 Watch TV 1–2 hours a day or less -0.05* 0.03 0.95 Enrolled in district grade 7 or before 0.35*** 0.03 1.42 Did you ever stay in the same grade for more than one year? -0.27*** 0.04 0.77
Level of studying each week (0–2 scale) 0.07*** 0.02 1.07 Total satisfaction with school help in career/college counseling -0.10*** 0.02 0.91
Cohort number one (of two) 0.09*** 0.01 1.21 *>0.10 **>0.05 ***>0.01
Test Statistic p value
Likelihood Ratio 6222.88 <.0001
Wald 5302.28 <.0001


![Welcome [commonthreadgroup.com]€¦ · We aim to make our young people’s experience with us a really positive time, encouraging growth in confidence achievement and attainment](https://img.pdfslide.us/doc/110x75/5fe71b533cf28a3e25333bdb/welcome-we-aim-to-make-our-young-peopleas-experience-with-us-a-really-positive.jpg)