Embed Size (px)
Citation preview

Investigations into Probability
Salmon Fishing
Part of the series Math in a Cultural Context: Lessons Learned from Yup’ik Eskimo Elders
GRADE LEVEL
K 1 2 3 4 5 6 7
EDUCATION MATHEMATICS ELEMENTARY
Salm
on F
ishin
g
Part of the series Math in a Cultural Context: Lessons Learned from Yup’ik Eskimo Elders
6/7
MCC
Aishath Shehenaz AdamJerry LipkaBarbara L. AdamsAnthony RickardKay GillilandJoan Parker Webster
1.20
1.00
0.80
0.60
0.40
0.20
0.00
0 2 4 6 8 10 12 14 16 18 20Number of Flips
Prob
abili
ty A
fter
Eac
h Fl
ip
The Supplemental Math Modules curriculum was developed at the Universityof Alaska Fairbanks.MCC
Also in this series:
UNITED STATESof A
MERICA
O
NE
CENT
1998
LIBERTY
1998LIBERTY
2 spins1 spin 3 spins
K
R
K
RK
R
2 Flips
King
Red
1 Flip
K
R
KRKR
K
R
K
R
KRKR
3 Flips
15%
5%
55% 25%
Investigation
s into P
robab
ility
UN
IT
EDSTATES of AMERIC
A
O
NE CENT
UN
IT
EDSTATES of AMERIC
A
O
NE CENT
1998LIBERTY
1998
LIBERTY
Forthcoming in this series:
Picking Berries: Connections Between DataCollection, Graphing, and Measuring (2nd grade)Students engage in a series of hands-on activitiesthat help them explore measuring, data, and graphicrepresentation. The complete package includes aCD-ROM, posters, two story books: Big John andLittle Henry, about using traditional Yup’ik bodymeasurements to build kayaks; and Berry Picking,about a Yup’ik family’s berry picking trip, whichincorporates a traditional story about mosquitoes.
Building a Fish Rack: Investigations into Proof,Properties, Perimeter, and Area (6th Grade)Students will explore what happens when the perimeter isheld constant and area changes, and what happenswhen area is held constant and perimeter changes.Through model building, students explore properties ofvarious quadrilaterals, including measurements of perimeterand area. The complete package includes posters and a CD-ROM.
Math in a Cultural Context: Lessons Learned from Yup’ikEskimo Elders is the result of a long-term collaboration.These supplemental math modules for grades 1-6 bridgethe unique knowledge of Yup’ik elders with school-basedmathematics. This series challenges students to commun-icate and think mathematically as they solve problems.Problems are inquiry-oriented and the problems are con-structed so that the possibilities are constrained and thestudents can understand mathematical relationships, prop-erties of geometrical shapes, develop place value under-standing, and state conjectures and provide proofs. Curr-iculum taps into students’ creative, practical, andanalytical thinking. Our classroom-based research stronglysuggests that students engaged in this curriculum candevelop deeper mathematical understandings than studentswho engage with the more procedure-oriented paper andpencil curriculum. MCC’s research has shown that thesemodules have been effective in enhancing students’ mathe-matical learning.
Going to Egg Island: Adventures in Grouping and PlaceValues (2nd Grade)Students learn to group objects in a variety of ways. In particular,they learn the Yup’ik system of counting and grouping (base20 and sub-base 5). Students compose and decomposenumbers. This hands-on and evidence-based approach toteaching numeration has produced good results. The completepackage includes an accompanying story book called Egg Island,posters, two CD-ROMs, and a coloring book.
Patterns and Parkas (tentative title)The traditional repeating geometric border patternsewn on Yup’ik fur parkas provide the basis for aseries of activities on patterns and shapes.
Rhombi Patterns: Investigations into Properties,Geometrical Relationships, and Area (tentativetitle, 3rd-5th grade)Students learn how to cut a rhombus from a foldedrectangle, learning the properties of rhombus and arectangle and the lines of symmetry of the rec-tangle, the cut out rhombus, and the four congruenttriangles. They explore part-to-whole and part-to-part relationships, construct a rhombus patternpuzzle, and create a linear pattern of their own.

Developed at University of Alaska Fairbanks, Fairbanks, Alaska
Grade 6 & 7Aishath Shehenaz Adam
Jerry Lipka
Barbara Adams
Anthony Rickard
Kay Gilliland
Joan Parker Webster
Salmon FishingInvestigations into Probability
MATH IN A CULTURAL CONTEXT©
Part of the Series
Math in a Cultural Context: Lessons Learned from Yup’ik Eskimo Elders

Library and Archives Canada Cataloguing in Publication
Salmon fishing : investigations into probability / Aishath ShehenazAdam . . . [et al.].
(Math in a cultural context: lessons learned from Yup’ik Eskimo elders)Includes bibliographical references.ISBN 1-55059-305-6
1. Mathematics—Study and teaching (Elementary).2. Probabilities—Study and teaching (Elementary). 3. Salmon fishing.4. Yupik Eskimos—Alaska. I. Adam, Aishath Shehenaz II. Series.
QA135.6.S24 2005 372.7’044 C2005-904881-6
Salmon Fishing: Investigations into Probability
© 2005 University of Alaska Fairbanks
Any opinions, findings, conclusions, or recommendations in this material are those of the author(s) and do not necessarily reflect the views of the National Science Foundation (NSF) or the U.S. Department of Education.
This project was also sponsored, in part, by the University of Alaska Fairbanks, Alaska Schools Research Fund and the Bristol Bay Curriculum Project.
ISBN: 1-55059-305-6
SAN: 113-0234
Printed in Canada.
Math in a Cultural Context: Lessons Learned from Yup’ik Eskimo Elders© was developed at the University of Alaska Fairbanks. This material is based upon work supported by the National Science Foundation under grant #9618099, Adapting Yup’ik Elders’ Knowledge: Pre-K-to-6th Math and Instructional Materials Development, and U.S. Department of Education grant #S356A030033, Developing and Implementing Culturally Based Curriculum and Teacher Preparation.
University of Alaska Fairbanks, 2019
© 2019 University of Alaska Fairbanks. Salmon Fishing: Investigations into Probability is licensed under the Creative Commons Attribution-NonCommercial 4.0 International License. This material may be shared and adapted, provided that appropriate credit is given, a link to the license is provided, and any changes made are indicated. Commercial use is prohibited. To view a copy of this license, visit http://creativecommons.org/licenses/by-nc/4.0/.

Principal Investigator, Writer, and Series Editor: Jerry Lipka
Project Mathematician: Barbara Adams
Project Manager:Flor Banks
Project Illustrator: Putt (Elizabeth) Clark
Project Layout: Sue Mitchell
Folklorist:Ben Orr
Literacy Specialist:Joan Parker-Webster
Yup’ik Consultants:Dora Andrew-IhrkeMary BeansSassa PetersonFerdinand SharpMike and Anecia ToyukakEvelyn Yanez
Teacher Piloting the Module: Tom Dolan
Teachers Piloting the Test: Tom DolanThad KeenerTerry McCarthyKathleen MeckelGretchen Murphy
Editing:Shane DaytonLoretto JonesSue Mitchell
Yup’ik Elders: Mary ActiveHenry AlakayakJulia ApalayaqMary E. BavillaAnnie BlueFrederick GeorgeMary GeorgeSamuel IvanAnuska Nanalook
Yup’ik Translators:Dora Andrew-IhrkeEliza OrrFerdinand SharpEvelyn Yanez
iii
MCCMCCMATH IN A CULTURAL CONTEXT©


�
Table of Contents
Introduction: Math in a Cultural Context. . . . . . . . . . . . . . . . . . . . . . . . . . . . . . . . . . . . . . . . . . . . . ix
Introduction to Salmon Fishing: Investigations into Probability . . . . . . . . . . . . . . . . . . . . . . . . . 1
Section 1—Deciding on the Fishing Gear: Experimental and Theoretical Probability
Activity.1:.Preparing.to.Fish:.Experimental.and.Theoretical.Probability. . . . . . . . . . . . . . . . . . . . 33
Activity.2:.What.Type.of.Gear.to.Bring:.The.Law.of.Large.Numbers . . . . . . . . . . . . . . . . . . . . . . 45
Activity.3:.Chances.of.Being.Trapped:.A.Literacy.Activity . . . . . . . . . . . . . . . . . . . . . . . . . . . . . . 55
Section 2—Catching Multiple Salmon in a Row: Sample Space
Activity.4:.Catching.Multiple.Salmon.in.a.Row:.Creating.Sample.Spaces . . . . . . . . . . . . . . . . . . . . . 67
Activity.5:.Catching.Multiple.Salmon.in.a.Row:.Finding.the.Probabilities .. .. .. .. .. .. .. .. .. .. .. .. .. .. .. .. .. . 77
Activity.6:.Falling.Sticks.Game:.Reviewing.Sample.Space,.Experimental... and.Theoretical.Probability . . . . . . . . . . . . . . . . . . . . . . . . . . . . . . . . . . . . . . . . . . . . . . . . . . 85
Section 3—Integrating Knowledge and Skills: Additional Probability Concepts
Activity.7:.Sampling.the.River:.Equally.Likely.and.Unequally.Likely.Events . . . . . . . . . . . . . . . . . . 95
Activity.8:.Knowledge.and.Skills.Changes.the.Probability. . . . . . . . . . . . . . . . . . . . . . . . . . . . . 107
Section 4—Project
Activity.9:.Creating.a.Game.of.Chance. . . . . . . . . . . . . . . . . . . . . . . . . . . . . . . . . . . . . . . . . . . 117
Appendix: Games of Chance. . . . . . . . . . . . . . . . . . . . . . . . . . . . . . . . . . . . . . . . . . . . . . . . . . . . 121


�ii
Acknowledgements
From Jerry Lipka, Series Editor
The supplemental math series Math in a Cultural Context: Lessons Learned from Yup’ik Eskimo Elders is based on traditional and present-day wisdom and is dedicated to the late Mary George of Akiachak, Alaska, and her late father George Moses of Akiachak, and to the late Lilly Gamechuk Pauk of Manokotak, Alaska. Mary con-tributed to every aspect of this long-term project, from her warm acceptance of people from all walks of life to her unique ideas and ways of putting together traditional Yup’ik knowledge with modern Western knowledge. Mary’s contribution permeates this work. Without the dedication and perseverance of Mary and her husband, Frederick George, who tirelessly continues to work with this project, this work would not be possible. George Moses was always eager and willing to teach and share his knowledge of the land and river. He was particularly concerned with the well-being of the next generation and hoped that this project would help connect community knowledge to schooling. Lilly cheerfully worked with this project even when she was ill. She would make sure that she first told her story to the group before she attended to other personal concerns. Her dedication, laughter, and spirit of giving formed a foundation for this project.
For more years than we care to remember, I have had the pleasure to work with and learn from Evelyn Yanez of Togiak, Alaska; Nancy and Ferdinand Sharp of Manokotak, Alaska; Sassa Peterson of Manokotak, Alaska; and Dora Andrew Irhke of Aleknagik and Anchorage, Alaska. Their contributions are immeasurable, as is their friendship. Our long-term relationship with elders who embraced this work wholeheartedly has made this difficult endeavor pleasurable as we learn from each other. In particular, I would like to acknowledge Henry Alakayak of Manokotak and Annie Blue of Togiak, whose dedication and commitment to cultural continuity has much inspired our project. They have set examples for our own perseverance creating culturally relevant school cur-ricula. Mary Active and Mary E. Bavilla from Togiak and Anuska Nanalook from Manokotak also contributed unselfishly. They came with stories that enriched us. Also, Sam Ivan of Akiak and Joshua Phillip and Anecia and Mike Toyukak of Manokotak provided knowledge about many aspects of traditional life, from Anecia’s gifted storytelling and storyknifing, to how kayaks were made and used and other traditional Yup’ik crafts, to countless stories on how to survive. All of this valuable information contributed to this and other modules.
We would like to thank our dedicated staff, especially Flor Banks, with her highly refined organization skills, determination to get the job done, and motivation to move this project forward from reading and editing manu-scripts to holding the various pieces of this project together; she has been a pleasure to work with, and she has done it all with a smile. To Putt Clark, graphic artist extraordinaire, who kept up with every demand and pro-duced more and better artwork than anyone could have hoped for and who has worked with this project from its inception—thank you. To Barbara Adams for her clear-headed thinking and her mathematical insights that contributed so much depth to these modules and for her perseverance and dedication to completing a mathemati-cally and culturally integrated math curriculum. We wish to acknowledge Kay Gilliland and Barbara Adams, who wrote earlier drafts that laid the foundation for this module. To Eliza and Ben Orr for all their hard work and for producing the Yup’ik Glossary, an outstanding piece of work that continues to evolve and that accom-panies this project. To Sue Mitchell for her editing and layout work, which has ensured that these modules are user-friendly and accessible. To Joan Parker-Webster for her literacy and pedagogical insights. Particularly, her work has opened up new aspects of this project—connecting indigenous literacy to the modules and connecting the mathematical and literacy pedagogy. We thank you, Joan. Anthony Rickard, who has recently joined the project, has brought a wealth of experience in reform-oriented math. Being no stranger to Alaska, he has made
�iii
connections between math and the Alaska context. He has added math problems, and his tight readings of the text strengthened this product. Also thanks to Kristy Nichols and Jessica Potrikus for their continued support behind the scenes, which enables products like to this to come to fruition.
A special thanks to Tom Dolan who went out of his way to teach this module, critique, and share his concerns and enthusiasm with us and for the wonderful ideas he contributed to this project, in particular this module. We would also like to thank Thad Keener, Terry McCarthy, Kathleen Meckel, and Gretchen Murphy for allowing us into their classrooms to pilot the tests. Thanks to the Fairbanks North Star Borough School District, the Lower Yukon School District, the Yupiit School District, the St. Mary’s School District, the Anchorage School District, the Yukon Flats School District, and to the Southwest Region Schools for their cooperation in piloting modules. And thanks to all other math writers, project and pilot teachers, and elders who have assisted this project.
A special thanks to the Yup’ik consultants—Dora Andrew-Ihrke, Mary Beans, Sassa Peterson, Ferdinand Sharp, and Evelyn Yanez—for their friendship, dedication, and valuable insights, without which this module would not have been possible.
To Eric Madsen, dean of School of Education, University of Alaska, Fairbanks, who supports this work gener-ously—thank you.
From Aishath Shehenaz Adam, first author
I would like to give a special thanks to Jerry Lipka for accepting me into the project and for his valuable insights, encouragement, and support. Because of his guidance and support, this has been a very good learning experi-ence for me. Thank you, Jerry.
Thanks to the project staff—especially Ann, Barbara, Flor, Jessica, Joan, Kristy, Melissa, Sue, and the Yup’ik consultants (Dora, Evelyn, Ferdinand, Mary, and Sassa)—for providing a supportive and encouraging environ-ment for research, friendship, patience, and for always being there for me whenever I needed their help. Thank you all.
Thanks to all my friends in Fairbanks, especially the Lipka family, for their friendship and for making me feel welcome in a foreign country. I deeply appreciate it.
Finally, thank you to my loving family for always providing me love, support, encouragement, motivation, and enthusiasm throughout my life to pursue endeavors such as this.

ix
IntroductionMath in a Cultural Context:
Lessons Learned from Yup'ik Eskimo Elders


xi
Introduction to the Series
Math in a Cultural Context: Lessons Learned from Yup’ik Eskimo Elders is a supplemental math curriculum based on the traditional wisdom and practices of the Yup’ik Eskimo people of southwest Alaska. The kindergarten to seventh-grade math modules that you are about to teach are the result of more than a decade of collabora-tion between math educators, teachers, Yup’ik Eskimo elders, and educators to connect cultural knowledge to school mathematics. To understand the rich environment from which this curriculum came, imagine traveling on a snowmachine over the frozen tundra and finding your way based on the position of the stars in the night sky. Or in summer, paddling a sleek kayak across open waters shrouded in fog, yet knowing which way to travel toward land by the pattern of the waves. Or imagine building a kayak or making clothing and accurately sizing them by visualizing or using body measures. This is a small sample of the activities that modern Yup’ik people engage in. The mathematics embedded in these activities formed the basis for this series of supplemental math modules. Each module is independent and lasts from three to eight weeks.
From 2000 through spring 2005, with the exception of one urban trial, students who used these modules consis-tently outperformed at statistically significant levels over students who only used their regular math textbooks. This was true for urban as well as rural students, both Caucasian and Alaska Native. We believe that this supple-mental curriculum will motivate your students and strengthen their mathematical understanding because of the engaging content, hands-on approach to problem solving, and the emphasis on mathematical communication. Further, these modules build on students’ everyday experience and intuitive understandings, particularly in geometry, which is underrepresented in school.
A design principle used in the development of these modules is that the activities allow students to explore mathematical concepts semiautonomously. Though use of hands-on materials, students can “physically” prove conjectures, solve problems, and find patterns, properties, short cuts, or generalize. The activities incorporate multiple modalities and can challenge students with diverse intellectual needs. Hence, the curriculum is designed for heterogeneous groups with the realization that different students will tap into different cognitive strengths. According to Sternberg and his colleagues (1997, 1998), by engaging students creatively, analystically, and practi-cally, students will have a more robust understanding of the concept. This allows for shifting roles and expertise among students and not only privileging those students with analytic knowledge.
The modules explore the everyday application of mathematical skills such as grouping, approximating, mea-suring, proportional thinking, informal geometry, and counting in base twenty and then the modules present these in terms of formal mathematics. Students move from the concrete and applied to more formal and abstract math. The activities are designed to meet the following goals:
• Students learn to solve mathematical problems that support an in-depth understanding of mathematical concepts.
• Students derive mathematical formulas and rules from concrete and practical applications.• Students become flexible thinkers because they learn that there is more than one method of solving a math-
ematical problem.• Students learn to communicate and think mathematically while they demonstrate their understanding to
peers. • Students learn content across the curriculum, since the lessons comprise Yup’ik Eskimo culture, literacy,
geography, and science.

xii Salmon Fishing
Beyond meeting some of the content (mathematics) and process standards of the National Council of Teachers of Mathematics (2000), the curriculum design and its activities respond to the needs of diverse learners. Many activities are designed for group work. One of the strategies for using group work is to provide leadership op-portunities to students who may not typically be placed in that role. Also, the modules tap into a wide array of intellectual abilities—practical, creative, and analytic. We assessed modules that were tested in rural Alaska, urban Alaska, and suburban California and found that students who were only peripherally involved in math became more active participants.
Students learn to reason mathematically by constructing models and analyzing practical tasks for their embed-ded mathematics. This enables them to generate and discover mathematical rules and formulas. In this way, we offer students a variety of ways to engage the math material through practical activity, spatial/visual learning, analytic thinking, and creative thinking. They are constantly encouraged to communicate mathematically by presenting their understandings while other students are encouraged to provide alternate solutions, strategies, and counter arguments. This process also strengthens their deductive reasoning.
Pedagogical Approach Used in the ModulesThe concept of third space is embedded within each module. Third space relates to a dynamic and creative place between school-based knowledge and everyday knowledge and knowledge related to other non-mainstream cul-tural groups. Third space also includes local knowledge such as ways of measuring and counting that are distinct from school-based notions, and it is about bringing these elements together in a creative, respectful, and artful manner. Within this creative and evolving space, pedagogical forms can develop creatively from both Western schooling and local ways. In particular, this module pays close attention to expert-apprentice modeling becuase of its prevalent use among Yup’ik elders and other Alaska Native groups.
Design
The curriculum design includes strategies that engage students:
• cognitively, so that students use a variety of thinking strategies (analytic, creative, and practical);• socially, so that students with different social, cognitive, and mathematical skills use those strengths to lead
and help solve mathematical problems;• pedagogically, so that students explore mathematical concepts and communicate and learn to reason math-
ematically by demonstrating their understanding of the concepts; and• practically, as students apply or investigate mathematics to solve problems from their daily lives.
The organization of the modules follows five distinct approaches to teaching and learning that converge into one system.
Expert-Apprentice Modeling
The first approach, expert-apprentice modeling, comes from Yup’ik elders and teachers and is supported by re-search in anthropology and education. Many lessons begin with the teacher (the expert) demonstrating a concept to the students (the apprentices). Following the theoretical position of the Russian psychologist Vygotsky (cited in Moll, 1990) and expert Yup’ik teachers (Lipka and Yanez, 1998) and elders, students begin to appropriate the knowledge of the teacher (who functions in the role of expert), as the teacher and the more adept apprentices help other students learn. This establishes a collaborative classroom setting in which student-to-student and student-to-teacher dialogues are part of the classroom fabric.

xiiiIntroduction to the Series
More recently, we have observed experienced teachers use joint productive activity—the teacher works in parallel with students, modeling an activity, a concept, or a skill. When effectively implemented, joint productive activity appears to increase student ownership of the task and increases their responsibility and motivation. The typical authority structure surrounding classrooms changes as students take on more of the responsibility for learning. Social relations in the classroom become more level. In the case of this module the connections between out-of-school learning and in-school learning are strengthened through pedagogical approaches such as expert-apprentice modeling and joint productive activity when those are approaches of the community.
Reform-oriented Approach
The second pedagogical approach emphasizes student collaboration in solving “deeper” problems (Ma, 1999). This approach is supported by research in math classrooms and particularly by recent international studies (Stevenson et al., 1990; Stigler and Hiebert, 1998) strongly suggesting that math problems should be more in-depth and challenging and that students should understand the underlying principles, not merely use procedures competently. The modules present complex problems (two-step, open-ended problems) that require students to think more deeply about mathematics.
Multiple Intelligences
Further, the modules tap into students’ multiple intelligences. While some students may learn best from hands-on, real-world related problems, others may learn best when abstracting and deducing. This module provides opportunities to guide both modalities. Robert Sternberg’s work (1997, 1998) influenced the development of these modules. He has consistently found that students who are taught so that they use their analytic, creative, and practical intelligences will outperform students who are taught using one modality, most often analytic. Thus, we have shaped our activities to engage students in this manner.
Mathematical Argumentation and Deriving Rules
The purpose of math communication, argumentation, and conceptual understanding is to foster students’ natural ability. These modules support a math classroom environment in which students explore the underlying math-ematical rules as they solve problems. Through structured classroom communication, students will learn to work collaboratively in a problem-solving environment in which they learn both to appreciate alternative solutions and strategies and to evaluate these strategies and solutions. They will present their mathematical solutions to their peers. Through discrepancies in strategies and solutions, students will communicate with and help each other to understand their reasoning and mathematical decisions. Mathematical discussions are encouraged to strengthen students’ mathematical and logical thinking as they share their findings. This requires classroom norms that support student communication, learning from errors, and viewing errors as an opportunity to learn rather than to criticize. The materials in the modules (see Materials section) constrain the possibilities, guide students in a particular direction, and increase their chances of understanding mathematical concepts. Students are given the opportunity to support their conceptual understanding by practicing it in the context of a particular problem.
Familiar and Unfamiliar Contexts Challenge Students’ Thinking
By working in unfamiliar settings and facing new and challenging problems, students learn to think creatively. They gain confidence in their ability to solve both everyday problems and abstract mathematical questions, and their entire realm of knowledge and experience expands. Further, by making the familiar unfamiliar and by working on novel problems, students are encouraged to connect what they learn from one setting (everyday problems) with mathematics in another setting. For example, most sixth-grade students know about rectangles

xi� Salmon Fishing
and how to calculate the area of a rectangle, but if you ask students to go outside and find the four corners of an eight-foot-by-twelve-foot rectangle without using rulers or similar instruments, they are faced with a challenging problem. As they work through this everyday application (which is needed to build any rectangular structure) and as they “prove” to their classmates that they do, in fact, have a rectangular base, they expand their knowl-edge of rectangles. In effect they must shift their thinking from considering rectangles as physical entities or as prototypical examples to understanding the salient properties of a rectangle. Similarly, everyday language, conceptions, and intuition may, in fact, be in the way of mathematical understanding and the precise meaning of mathematical terms. By treating familiar knowledge in unfamiliar ways, students explore and confront their own mathematical understandings and begin to understand the world of mathematics.
These major principles guide the overall pedagogical approach to the modules.
The Organization of the ModulesThe curriculum includes modules for kindergarten through seventh grade. Modules are divided into sections: activities, explorations, and exercises, with some variation between each module. Supplementary information is included in Cultural Notes, Teacher Notes, and Math Notes. Each module follows a particular cultural story line, and the mathematics connect directly to it. Some modules are designed around a children’s story, and an illustrated text is included for the teacher to read to the class.
The module is a teacher’s manual. It begins with a general overview of the activities ahead, an explanation of the math and pedagogy of the module, teaching suggestions, and a historical and cultural overview of the curriculum in general and of the specific module. Each activity includes a brief introductory statement, an estimated duration, goals, materials, any pre-class preparatory instructions for the teacher, and the procedures for the class to carry out the activity. Assessments are placed at various stages, both intermittently and at the end of activities.
Illustrations help to enliven the text. Yup’ik stories and games are interspersed and enrich the mathematics. Transparency masters, worksheet masters, assessments, and suggestions for additional materials are attached at the end of each activity. An overhead projector is necessary. Blackline masters that can be made into over-head transparencies are an important visual enhancement of the activities, stories, and games. Supplemental aids—colored posters, coloring books, and CD-ROMs—are attached separately or may be purchased elsewhere. Such visual aids also help to further classroom discussion and understanding.
Resources and Materials Required to Teach the Modules
Materials
The materials and tools limit the range of mathematical possibilities, guiding students’ explorations so that they focus upon the intended purpose of the lesson. For example, in one module, latex sheets are used to explore concepts of topology. Students can manipulate the latex to the degree necessary to discover the mathematics of the various activities and apply the rules of topology.
For materials and learning tools that are more difficult to find or that are directly related to unique aspects of this curriculum, we provide detailed instructions for the teacher and students on how to make those tools. For example, in Going to Egg Island: Adventures in Grouping and Place Values, students use a base twenty abacus. Although the project has produced and makes available a few varieties of wooden abaci, detailed instructions

x�Introduction to the Series
are provided for the teacher and students on how to make a simple, inexpensive, and usable abacus with beads and pipe cleaners.
Each module and each activity lists all of the materials and learning tools necessary to carry it out. Some of the tools are expressly mathematical, such as interlocking centimeter cubes, abaci, and compasses. Others are par-ticular to the given context of the problem, such as latex and black-and-white geometric pattern pieces. Many of the materials are items a teacher will probably have on hand, such as paper, markers, scissors, and rulers. Students learn to apply and manipulate the materials. The value of caring for the materials is underscored by the precepts of subsistence, which is based on processing raw materials and foods with maximum use and minimum waste. Periodically, we use food as part of an activity. In these instances, we encourage minimal waste.
Videos
To convey the knowledge of the elders underlying the entire curriculum more vividly, we have produced a few DVDs to accompany some of the modules. For example, the Going to Egg Island: Adventures in Grouping and Place Values module includes videos of Yup’ik elders demonstrating some traditional Yup’ik games. We also have footage and recordings of the ancient chants that accompanied these games. The videos are available on CD-ROM and are readily accessible for classroom use.
Yup’ik Language Glossary and Math Terms Glossary
To help teachers and students get a better feel for the Yup’ik language, its sounds, and the Yup’ik words used to describe mathematical concepts in this curriculum, we have developed a Yup’ik glossary on CD-ROM. Each word is recorded in digital form and can be played back in Yup’ik. The context of the word is provided, giving teachers and students a better sense of the Yup’ik concept, not just its Western “equivalent.” Pictures and illus-trations often accompany the word for additional clarification.
Yup’ik Values
There are many important Yup’ik values associated with each module. The elders counsel against waste. They value listening, learning, working hard, being cooperative, and passing knowledge on to others. These values are expressed in the contents of the Yup’ik stories that accompany the modules, in the cultural notes, and in various activities. Similarly, Yup’ik people as well as other traditional people continue to produce, build, and make crafts from raw materials. Students who engage in these modules also learn how to make simple mathematical tools fashioned around such themes as Yup’ik border patterns and building model kayaks, fish racks, and smokehouses. Students learn to appreciate and value other cultures.
Cultural Notes
Most of the mathematics used in the curriculum comes from our direct association and long-term collaboration with Yup’ik Eskimo elders and teachers. We have included many cultural notes to describe and explain more fully the purposes, origins, and variations associated with a particular traditional activity. Each module is based on a cultural activity and follows a Yup’ik cultural story line, along which the activities and lessons unfold.
x�i Salmon Fishing
Math Notes
We want to ensure that teachers who may want to teach these modules but feel unsure of some of the mathemati-cal concepts will feel supported by the Math Notes. These provide background material to help teachers better understand the mathematical concepts presented in the activities and exercises of each module. For example, in the Perimeter and Area module, the Math Notes give a detailed description of a rectangle and describe the geo-metric proofs one would apply to ascertain whether or not a shape is a rectangle. One module explores rectangular prisms and the geometry of three-dimensional objects; the Math Notes include information on the geometry of rectangular prisms, including proofs, to facilitate the instructional process. In every module, connections are made between the “formal math,” its practical application, and the classroom strategies for teaching the math.
Teacher Notes
The main function of the Teacher Notes is to focus on the key pedagogical aspects of the lesson. For example, they provide suggestions on how to facilitate students’ mathematical understanding through classroom organiza-tion strategies, classroom communication, and ways of structuring lessons. Teacher Notes also make suggestions for ways of connecting out-of-school knowledge with schooling.
AssessmentAssessment and instruction are interrelated throughout the modules. Assessments are embedded within instruc-tional activities, and teachers are encouraged to carefully observe, listen, and challenge their students’ think-ing. We call this active assessment, which allows teachers to assess how well students have learned to solve the mathematical and cultural problems introduced in a module.
Careful attention has been given to developing assessment techniques and tools that evaluate both the conceptual and procedural knowledge of students. We agree with Ma (1999) that having one type of knowledge without the other, or not understanding the link between the two, will produce only partial understanding. The goal here is to produce relational understanding in mathematics. Instruction and assessment have been developed and aligned to ensure that both types of knowledge are acquired; this has been accomplished using both traditional and alternative techniques.
The specific details and techniques for assessment (when applicable) are included within activities. The three main tools for collecting and using assessment data follow.
Journals
Each student can keep a journal for daily entries, consisting primarily of responses to specific activities. Student journals serve as a current record of their work and a long-term record of their increasing mathematical knowl-edge and ability to communicate this knowledge. Many of the modules and their activities require students to predict, sketch, define, explain, calculate, design, and solve problems. Often, students will be asked to revisit their responses after a series of activities so that they can appreciate and review what they have learned. Student journals also provide teachers with insight into students’ thinking, making it an active tool in the assessment and instructional process.

x�iiIntroduction to the Series
Observation
Observing and listening to students lets teachers learn about the strategies that they use to analyze and solve various problems. Listening to informal conversations between students as they work cooperatively on problems provides further insight into their strategies. Through observation, teachers also learn about their students’ at-titudes toward mathematics and their skills in cooperating with others. Observation is an excellent way to link assessment with instruction.
Adaptive Instruction
The goal of the summary assessment in this curriculum is to adapt instruction to the skills and knowledge needed by a group of students. From reviewing journal notes to simply observing, teachers learn which mathematical processes their students are able to effectively use and which ones they need to practice more. Adaptive assess-ment and instruction complete the link between assessment and instruction.
An Introduction to the Land and
Its People, Geography, and ClimateFlying over the largely uninhabited expanse of southwest Alaska on a dark winter morning, one looks down at a white landscape interspersed with trees, winding rivers, rolling hills, and mountains. One sees a handful of lights sprinkled here, a handful there. Half of Alaska’s 600,000-plus population lives in Anchorage. The other half is dispersed among smaller cities such as Fairbanks and Juneau and among the over 200 rural villages that are scattered across the state. Landing on the village airstrip, which is usually gravel and, in the winter, covered with smooth, hard-packed snow, one is taken to the village by either car or snowmachine. Hardly any villages or regional centers are connected to a road system. The major means of transportation between these communities is by small plane, boat, and snowmachine, depending on the season.
It is common for the school to be centrally located. Village roads are usually unpaved, and people drive cars, four-wheelers, and snowmachines. Houses are typically made from modern materials and have electricity and running water. Over the past 20 years, Alaska villages have undergone major changes, both technologically and culturally. Most now have television, a full phone system, modern water and sewage treatment facilities, an airport, and a small store. Some also have a restaurant, and a few even have a small hotel and taxicab service. Access to medical care and public safety are still sporadic, with the former usually provided by a local health care worker and a community health clinic, or by health care workers from larger cities or regional centers who visit on a regular basis. Serious medical emergencies require air evacuation to either Anchorage or Fairbanks.
The Schools
Years of work have gone into making education as accessible as possible to rural communities. Almost every village has an elementary school, and most have a high school. Some also have a higher education satellite facil-ity, computer access to higher education courses, or options that enable students to earn college credits while in their respective home communities. Vocational education is taught in some of the high schools, and there are also special vocational education facilities in some villages. While English has become the dominant language throughout Alaska, many Yup’ik children in the villages of this region still learn Yup’ik at home.

x�iii Salmon Fishing
Yup’ik Village Life Today
Most villagers continue to participate in the seasonal rounds of hunting, fishing, and gathering. Although many modern conveniences are located within the village, when one steps outside of its narrow bounds, one is im-mediately aware of one’s vulnerability in this immense and unforgiving land, where one misstep can lead to disaster. Depending upon their location (coastal community, riverine, or interior), villagers hunt and gather the surrounding resources. These include sea mammals, fish, caribou, and many types of berries. The seasonal subsistence calendar illustrates which activities take place during the year (see Figure 1). Knowledgeable elders know how to cross rivers and find their way through ice fields, navigating the seemingly featureless tundra by using directional indicators such as frozen grass and the constellations in the night sky. All of this can mean the difference between life and death. In the summer, when this largely treeless, moss- and grass-covered plain thaws into a large swamp dotted with small lakes, the consequences of ignorance, carelessness, and inexperience can be just as devastating. Underwater hazards in the river, such as submerged logs, can capsize a boat, dumping the occupants into the cold, swift current. Overland travel is much more difficult during the warm months due to the marshy ground and many waterways, and one can easily become disoriented and get lost. The sea is also integral to life in this region and requires its own set of skills and specialized knowledge to be safely navigated.
The Importance of the Land: Hunting and Gathering
Basic subsistence skills include knowing how to read the sky to determine the weather and make appropriate travel plans, being able to read the land to find one’s way, knowing how to build an emergency shelter and, in the greater scheme, how to hunt and gather food and properly process and store it. In addition, the byproducts of subsistence activities, such as carved walrus tusks, pelts, and skins, are made into clothing or decorative items and a variety of other utilitarian arts and crafts products and provide an important source of cash for many rural residents.
Hunting and gathering are still of great importance in modern Yup’ik society. A young man’s first seal hunt is celebrated; family members who normally live and work in one of the larger cities will often fly home to help when the salmon are running, and whole families still gather to go berry picking. The importance of hunting and gathering in daily life is further reflected in the legislative priorities expressed by rural residents in Alaska. These focus on such things as subsistence hunting regulations, fishing quotas, resource development, and envi-ronmental issues that affect the well-being of game animals and subsistence vegetation.
ConclusionWe developed this curriculum in a Yup’ik context. The traditional subsistence and other skills of the Yup’ik people incorporate spatial, geometrical, and proportional reasoning and other mathematical reasoning. We have attempted to offer you and your students a new way to approach and apply mathematics while also learning about Yup’ik culture. Our goal has been to present math as practical information that is inherent in everything we do. We hope your students will adopt and incorporate some of this knowledge and add it to the learning base.
We hope you and your students will benefit from the mathematics, culture, geography, and literature embedded in the Math in a Cultural Context: Lessons Learned from Yup’ik Eskimo Elders series. The elders who guided this work emphasized that the next generation of children should be flexible thinkers and leaders. In a small way, we hope that this curriculum guides you and your students along this path.
Tua-ii ingrutuq [This is not the end].
xixIntroduction to the Series
ReferencesLipka, Jerry, and Evelyn Yanez. (1998). Identifying and Understanding Cultural Differences: Toward Culturally
Based Pedagogy. In J. Lipka with G. Mohatt and the Ciulistet, Transforming the Culture of Schools (pp. 111–137). Mahwah, NJ: Lawrence Erlbaum.
Ma, L. (1999). Knowing and Teaching Elementary Mathematics. Mahwah, NJ: Lawrence Erlbaum.Moll, L. (1990). Vygotsky and Education: Instructional Implications and Applications of Sociohistorical Psy-
chology. Cambridge: Cambridge University Press. National Council of Teachers of Mathematics. (2000). Principles and Standards for School Mathematics. Reston,
VA: National Council of Teachers of Mathematics. Sternberg, R. (1997). Successful Intelligence. New York: Plume.Sternberg, R. (1998). Principles of Teaching for Successful Intelligence. Educational Psychologist 33, 65–72.Stevenson, H., M. Lummis, S.-Y. Lee, and J. Stigler. (1990). Making the Grade in Mathematics. Arlington, VA:
National Council of Teachers of Mathematics. Stigler, J., and J. Hiebert. (1998). Teaching is a Cultural Activity. American Educator 22 (4), 4–11.

xx
Fig. 1: Yearly subsistence calendar
Salmon Fishing

�
Introduction Salmon Fishing: Investigations into Probability
Students exploring the sample space for all possible outcomes

�
Introduction to the Module
Salmon Fishing: Investigations into Probability is designed for use in the sixth and seventh grades. The module engages students in exploring a variety of topics within probability, using activities that are based on salmon fishing in southwest Alaska. This module uses subsistence and commercial fishing as a contextual background. In southwest Alaska, the Alaska Department of Fish and Game (ADF&G) typically samples for salmon in rivers such as the Nushagak River, the Kuskokwim River, and the Yukon River. The ADF&G measures and records its data by sampling the fish in the river. “Sampling” means that a subset of the population is counted for a certain period of time and used to estimate the number in the whole population. There are several techniques used to sample salmon. Sampling data are produced by counting fish while standing on a tower and looking down at the river, sonar devices, test catches on ADF&G boats, counting fish from a plane, and by counting fish by inspecting the catches of commercial fishermen who work for profit and catch large numbers of fish.
The module also includes the perspectives of a Yup’ik subsistence fisherman, Frederick George and his family, who know the summer cycle of salmon entering the river and when it is a good time to catch different species of salmon. Knowledge of when to fish, how to fish, and where to fish changes the probability of catching a fish. Although concepts of probability are not used explicitly in the Yup’ik culture, the module taps into the everyday experiences of the Yup’ik people, including the embedded cultural values and Yup’ik games of chance where concepts of probability such as fairness are explored. These everyday experiences are used in the module as background knowledge and as a motivating factor for students to actively participate and enjoy learning the underlying mathematical concepts.
The module allows students to explore probability concepts such as theoretical and experimental probabilities, the Law of Large Numbers, sample space, and equally and not equally likely events. The module is adapted specifically to events that occur in everyday life, that is, in the context of salmon fishing in Alaska. Formal mathematics is developed within this context through hands-on, inquiry-oriented activities that are intellectually stimulating and enjoyable to students. As research evidence shows, mathematics derived from students’ everyday life experiences is typically more accessible and enjoyable to them, enhancing their ability to make meaningful connections and deepening their understanding of mathematics (Zaslavsky, 1991). Further, empirical evidence from the project’s implementation of other modules in the series shows that students who are taught using these modules perform statistically significantly better on conventional mathematics tests than students who are taught using other elementary curricula (Lipka, 2002; Lipka and Adams, 2004).
Why teach this module? Probability is often neglected in elementary curricula, even though it is a subject that students come across frequently in their everyday lives. Teaching probability for conceptual understanding ap-pears to be difficult (Soen, 1997). One reason could be that in most elementary curricula, probability concepts are not easily accessible to students. Thus, the goal of this module is to make probability concepts more accessible through hands-on, exploratory activities that allow students to investigate problems and generalize the results. Further accessibility is encouraged by using probability games and everyday experiences.
Through piloting of this module, we found that students enjoy learning mathematics when taught this way. In fact, students have requested that other mathematics topics be taught in a similar way. Furthermore, eight sixth-grade classes were tested. Two were treatment classes and six were control group classes, all in Fairbanks, Alaska. The results of this preliminary study strongly suggest that the treatment students averaged 30 percent better scores

� Salmon Fishing
than control group students. This translates into treatment students getting five more questions correct than the control group. The module was piloted for three weeks, thus providing a substantial gain in a short time.
During the post-interview, all students interviewed said that they enjoyed learning the probability module and that they felt they have learned different probability concepts that were not clear initially. They also said that through studying of the probability module, they have started relating probability to real-life instances, which they did not do before. In addition, the teacher who piloted this module, Tom Dolan, commented that the students were “very engaged during the implementation of the module and are not happy to be back with what we are doing now [in math].” He also remarked that the context of fishing helped the students because fishing is some-thing that they can relate to. Further, he commented that “Activity 9 [project where students created a game of chance] was the best math lesson all year.” Students confirmed this during interviews, that the lesson that they most enjoyed was the project (Activity 9).
The module is organized to provide students with practice for learning probability. The main pedagogical method is experimentation, where through experience students learn concepts such as the Law of Large Numbers and learn to derive a variety of sample spaces. This inductive way of learning is supported by three other pedagogi-cal approaches. One of these approaches has students present what they are learning to second or third grade students and this builds on the successes reported in the research associated with tutor/tutee. One major reason that peer and cross-age tutoring is effective is that tutors and their students often speak a more similar language than do teachers and students (Cazden, 1986; Hedin, 1987). Peer tutoring usually resulted in significant cognitive gains for both the tutor and the tutee (Britz, Dixon, and McLaughlin, 1989). The second approach incorporates the work of Sternberg (1997, 1998) in which he emphasized students learn more thoroughly when they use their analytic, creative, and practical intelligences. For example, in this case students use their creativity and develop games and comic-book-like presentations as a way to both demonstrate their knowledge and to teach second and third graders. Finally, the third pedagogical technique is the more typical approach of providing guided practice for students. These pedagogical approaches are embedded in all the activities. In particular in five of the activi-ties, the students are provided with a set of further explorations or problems in which both the concept and the procedures are emphasized. These further explorations can be used as homework or as additional activities for the classroom.
The module consists of nine activities. Each activity includes an introduction, goals, materials used, preparation needed before class, vocabulary, and instructions for the activity. Suggestions for assessment or homework and additional review problems are given in selected activities, and selected games of chance that you may wish to explore in your classroom are given in the appendix. Note that Activity 9 is a culminating activity that pulls to-gether what students have learned throughout the module and involves students creating a game of chance. Also, note that probability vocabulary cycles throughout the module. Students may not be able to grasp the vocabulary initially and may be able to comprehend better as they become familiar with different probability concepts. Therefore, it is important that the first time the vocabulary is introduced, that it is done by engaging students in talking about the concepts and then reinforced throughout the module. Further, literacy and vocabulary activities have been included in the module.
Culminating Project: A Probability Game
Throughout the module, students in your class have opportunities to work with younger students. As they try to teach students probability concepts, they have to refine their own thinking. A device used in this module is to have the students develop a probability game that incorporates what they are learning about sample space and probability and applying that to the game. This game can be played with students in the class or it could be

�Introduction to the Module
played with the second and third graders your students are tutoring. Having students teach concepts to others and apply probability concepts in a game format will keep students motivated and interested in learning the difficult probability concepts.
Math Context
How Did the Study of Probability Begin? It is not known when or where the notion of probability first arose. Nevertheless, there is evidence from ar-chaeological digs linking early humans with devices for generating random events. Hence, people started to use principles of probability many years ago, and some of the elements of probability were applied for the census of population in ancient Egypt, China, and India. [Source: http://www.gamblecraft.com/tutorial/history.htm].
In the early sixteenth century, Geralmo Cardano from Italy, who was formally trained in medicine, was interested in probability due to his intense interest in gambling. He began looking for a mathematical model that would describe, in an abstract way, the outcome of a random event. What he eventually formalized is now called the classical definition of probability: If the total number of possible outcomes, associated with an event is n, and m is the number of desired or favorable outcomes, then the probability of the desired outcome is m ⁄n. His was also the first recorded instance of anyone computing a theoretical, as opposed to an empirical, probability. Still, the actual impact of Cardano’s work was minimal. He wrote a book in 1525, but it was not published until 1663. [Source: http://www.2ndmoment.org/articles/probability.php].
Although a few special problems on games of chance and probability had been solved by Cardano and some other Italian mathematicians in the sixteenth century, no general theory was developed before the famous cor-respondence between Pascal and Fermat in 1654.
Many historians cite 1654 as the beginning of the probability theory. A gambler’s dispute in 1654 led to the creation of a mathematical theory of probability by two famous French mathematicians, Blaise Pascal and Pierre de Fermat. Antoine Gombaud, Chevalier de Méré, a French nobleman with an interest in gaming and gambling questions, called Pascal’s attention to an apparent contradiction concerning a popular dice game. The game consisted in throwing a pair of dice 24 times; the problem was to decide whether or not to bet even money on the occurrence of at least one “double six” during the 24 throws. A seemingly well-established gambling rule led de Méré to believe that betting on a double six in 24 throws would be profitable, but his own calculations indicated just the opposite. This problem and others posed by de Méré led to an exchange of letters between Pascal and Fermat in which the fundamental principles of probability theory were formulated for the first time. [Source:http://www.cc.gatech.edu/classes/cs6751_97_winter/Topics/stat-meas/probHist.html].
American Indian games of chance typically fall into two categories:
1. The games in which dice or similar objects are thrown at random to determine one or more numbers, and the sum of the counts is kept by means of sticks, pebbles, etc.
2. Games in which one or more players guess in which of two or more places an odd or particularly marked lot is concealed, success or failure resulting in the gain or loss of counters. (Culin, 1907, p. 33).
Tegurpiit and Kakaanaq are Yup’ik games of chance included in this module. In Tegurpiit the probability is more random whereas in Kakaanaq probability is influenced by the skills and experience of the player.

� Salmon Fishing
Probability, Combinatorics, and StatisticsProbability, combinatorics, and statistics are three interrelated but distinct fields of mathematics that are often confused. Put simply, probability is the study of chance, combinatorics is the study of counting, and statistics is the study of summarizing data and making predictions from it.
Probability is a way of measuring the likelihood that something will happen. It can be thought of as measuring how likely an event is. For example, if a coin was flipped and heads were called, the probability of that event happening is 1⁄ 2 since there is 1 head and there are 2 possible outcomes that are both equally likely: heads or tails. In the most basic sense, the probability of an event occurring is calculated by dividing the number of favor-able outcomes by the number of all possible outcomes that could occur. Usually one can think of it as number of successes divided by the number of total.
Combinatorics is the study of the ways of choosing and arranging objects from given collections. It also includes other kinds of problems dealing with counting the number of ways to do something. For example, if you were to flip the same coin three times, combinatorics would say that since two outcomes are possible for each flip then 2 x 2 x 2 total outcomes are possible for all three flips. Listing out all the possible outcomes would show a total of 2 x 2 x 2 = 8: HHH, HHT, HTH, HTT, THH, THT, TTH, and TTT.
Statistics is the study of how data can be summarized and analyzed using measures of spread, central tendency, and how data is distributed. It is the science of classifying and interpreting numerically collected information and systematically collected facts. This includes the study of how such numbers can be chosen and how statis-tics can be used to make reasonable predictions and inferences about the data. Since statistics uses information to make predictions, it often relies on probability to aid in the measuring of likely events, which in turn uses combinatorics to help in the counting process.
Although this module focuses on probability, there are activities that involve counting or making predictions. This is inevitable because of how the topics are intertwined. Keeping students focused on the purpose of each should help in clarifying the topics.
Probability in This ModuleThis section outlines the probability concepts focused in the module. In order to effectively teach this module, you need to know and be familiar with these concepts.
In this module we focus on applying the definitions of probability, understanding sample space, and analyzing probability with equally likely events as well as not equally likely events. We also briefly investigate sampling as we tie the ideas of probability to what the ADF&G does when estimating population sizes of each fishery. Probability can become much more complex as the conditions change, and advanced probability concepts are beyond the scope of this module. For example, probability can be calculated with and without replacement, conditional events, and complex outcomes. For example, the question what is the probability that a card is a heart when only one is selected from a deck (13 hearts out of 52 cards provide a 1 ⁄ 4 probability) can become much more complex when you ask what is the probability of obtaining a flush on a five-card stud (no drawing or changing cards) poker hand (a flush is when all five cards are the same suit). Part of the curriculum design of this module allows for students of different abilities and skills to access the probability concepts with varying degrees of difficulty.
�Introduction to the Module
At the beginning of the module students perform the experiment of flipping a coin. This allows them to think about possible outcomes and connects to their prior knowledge of chance. As students are introduced to prob-ability versus chance they are also introduced to experimental probability as compared to theoretical probability. Continuing with the experiment by flipping the coin over and over, students see that experimental probability and theoretical probability are close (or nearly equal) for a large number of trials. This is formally summarized as the Law of Large Numbers.
Next, students investigate the concept of sample space. Sample space is the set of all possible outcomes and is necessary for understanding theoretical probability. Sample space also leads into discussion of equally likely events. Note that in the beginning activities, it is assumed that all the events are equally likely. The concept of not equally likely events is introduced in Activity 7.
The subsequent activities help students to use probability in real-world situations and to investigate games of chance to understand fairness and why scoring rules are developed. They also simulate how the ADF&G esti-mates the number of salmon in a fishery. Finally, using the George family catch as an example, students explore how skills and experience can influence the probability that an event will (or will not) occur.
Probability Concepts
Probability
Probability is a measure of the likelihood of an event happening (refer to page 8 for an explanation of event). There are many instances where probability is used, such as in population studies and estimating the number of salmon running in Alaska rivers.
Chance is the everyday language used for probability and it is generally expressed as a percentage. However, since the basic definition of probability is the number of favorable outcomes divided by the number of total possible outcomes, probability is typically expressed as a fraction or a decimal between 0 and 1. If an event will never happen, then the probability is 0 or impossible, and if it will always happen then the probability is 1 or certain.
For example, if there are 5 green marbles in a bag, what is the probability of taking a green marble from the bag? Since there are all green marbles in the bag, we are certain that the marble that we take out would be green. Looking at the basic definition of probability, number of favorable outcomes equals 5 and the number of pos-sible outcomes equals 5, and therefore, probability of a green is 5 ⁄ 5 = 1. However, the probability of choosing a red marble from this bag will be impossible, because the number of favorable outcomes (0) divided by the number of possible outcomes (5) equals 0. On the other hand, if there were 5 green marbles and 4 red marbles, the probability of a green would be 5 ⁄ 9, because the number of favorable outcomes equals 5 and the number of possible outcomes equals 9.
Notation
There is standard notation used for probability. For example, P(A) = 0.25, is read “the probability of event A occurring is 0.25.” P(H on 1 flip) = 1 ⁄ 2 is read, “the probability of getting a head when flipping a coin once is a half.” Therefore, using the notation, probability of any event: P(event) = number of favorable outcomes/number of possible outcomes.

� Salmon Fishing
Complementary Events
The sum of probabilities of all possible outcomes always equals 1. For example, if there are 3 green marbles, 4 red marbles, and 5 blue marbles in a bag, P(green) = 3 ⁄ 12; P(red) = 4 ⁄ 12; and P(blue)= 5 ⁄12. Sum of probabilities of all outcomes = 3 ⁄ 12 + 4 ⁄ 12 + 5 ⁄ 12 = 12 ⁄12 = 1.
Hence, the complement of any event can be found by subtracting the given probability from 1. The complement of an event A is the probability that the event A would not occur. For example, probability of not getting a green (complement of getting a green) = 1 – 3 ⁄12 = 9 ⁄12, or P(R) + P(B) = 4 ⁄12 + 5 ⁄ 12 = 9 ⁄ 12.
Experiment, Outcomes, and Events
Suppose you want to consider rolling two standard die and adding their results. The experiment consists of roll-ing the two die and adding their results. A trial would be rolling the two die and adding their results once. Note that you could choose to conduct 50 trials of the experiment in an attempt to view all the outcomes possible if you wanted to. As an example, suppose you conduct two trials with outcomes of a 1 and a 4 or a 2 and a 3 on the two die. Since the experiment consists of finding the sum of the two die, the related event (focus of the question) from both outcomes would be obtaining a sum of 5.
When the experiment is simplified, such as flipping a coin once, many of these terms become confusing because they all reduce to the same concept. For example, flipping a coin one time is an experiment. The trial would be flipping the coin one time as well. An outcome would be either heads or tails. An event would focus, for example, on just obtaining tails.
Equally Likely and Not Equally Likely
Two or more events are equally likely if all the events have the same or equal chance of happening. For example, if there are an equal number of king and red salmon running in the river, then the probability of catching a king or a red is equal.
Two or more events are not equally likely if at least one of the events does not have the same or equal likelihood of happening. For example if there are more reds than kings running in the river, then the probability of catch-ing a king or a red is not equal.
Theoretical Probability, Experimental Probability, and Law of Large Numbers
Theoretical probability is determined by analyzing the scenario or the problem mathematically and by finding all possible outcomes, called the sample space. For example, flipping a coin one time will result in either a head or a tail. This means that theoretically the probability of getting a head and the probability of getting a tail is 1 ⁄ 2.
Experimental probability is determined from the outcomes of one or more trials of an experiment. Experimental probabilities are used to predict what might happen based on conducting a number of trials. For example, flipping a coin four times may or may not result in two heads and two tails.
The Law of Large Numbers states that if you repeat an experiment a large number of times (say at least 50 times), the experimental probability of an outcome tends toward or equals the theoretical probability of that outcome.

�Introduction to the Module
For example, if a coin is flipped a number of times, the distribution of heads and tails will get closer and closer to the expected 50 ⁄ 50. Recognize that the implications of this law are frequently misinterpreted. A common misconception is that as the number of times a particular outcome occurs increases, the next outcome will not likely be the same. For example, if there are 10 heads in a row, the misconception is that the next coin is likely to come up as tails. However, because each event is separate and independent and not influenced by the previous event, this thinking is not valid.
Sample Space
The set of all possible outcomes is called the sample space. The sample space is obtained by theoretically exam-ining all the possibilities for a specific situation. How you work with the sample space depends on the question being asked. Take flipping two coins in a row as an example. Say heads represent catching a king salmon (K) and tails represent catching a red salmon (R). If we take into account the order of catching the fish, then we have four possible outcomes: KK, RR, KR, and RK, each having a probability of 1⁄ 4. However, if we do not take the order of the catch into account, then we have three possible outcomes: KK, RR, and KR or RK. Note that here we are assuming both king and red salmon are equally likely. Thus P(KK) = 1⁄ 4, P(RR) = 1⁄ 4, but P(KR) = 1⁄ 2.
Let’s us look at the example of rolling two dice. Suppose the experiment calls for rolling two dice; one is blue and the other is white. If the question focuses only on the sum of the dice, then the sample space would be:
Blue Die
1 2 3 4 5 6
1 2 3 4 5 6 7
2 3 4 5 6 7 8
3 4 5 6 7 8 9
4 5 6 7 8 9 10
5 6 7 8 9 10 11
6 7 8 9 10 11 12
Fig. 1: Sample space for rolling two dice
Questions around this situation might include:
1. What is the probability of rolling a 7? Since there are 36 possible outcomes and the sum 7 occurs six times, P(rolling a 7) = 6 ⁄ 36 =1 ⁄ 6.2. What is the probability of rolling at least a 5? (30 ⁄ 36 = 5 ⁄ 6)3. What is the probability of rolling a 2? (1 ⁄ 36)4. What is the probability of not rolling a 6? (1 – 5 ⁄ 36 or 31⁄ 36)
These questions were all answered by using the sample space provided and the basic definition of probability. Notice that in this example, the sums are not equally likely. The sums 2 and 12 occur once, 3 and 11 occur twice, 4 and 10 occur three times, 5 and 9 occur four times, 6 and 8 occur five times, and 7 occurs six times.
Definitions were modified from those provided at http://thesaurus.maths.org/mmkb, posted by the University of Cambridge.
Whi
te D
ie

�0 Salmon Fishing
A Conceptual Framework for
Students’ Understanding of ProbabilityProbability is embedded in everyday life. Hence, even without instruction, young children intuitively develop an understanding of probability concepts. However, many of these intuitions may be misconceptions (Way, 1997). Misconceptions should be challenged through concrete, hands-on activities that require problem solving, com-municating, reasoning, and making connections.
According to Piaget and Inhelder, 1975 (cited in Soen, 1997), the development of probability as a formal set of ideas occurs during the formal operational stage when children are of about 12 years of age. By this age, chil-dren can probabilistically reason out a variety of random situations. Probabilistic reasoning refers to children’s thinking and reasoning of a situation involving uncertainty (Jones et al., 1997), for example, reasoning out how to find the probability of catching a king salmon on a given day. (For a detailed explanation of probabilistic thinking/reasoning, refer to page 14).
Because of the uncertain nature of probability, difficulties appear to arise in getting students to understand this concept. Research on students’ understanding of probability suggests a number of implications (Soen, 1997, p. 4), for teaching to overcome students’ difficulties. The implications include:
• Before teaching probability, students must have an understanding of ratio and proportion.• Teachers need to recognize and confront common errors in students’ probabilistic reasoning. For instance,
during the piloting of this module we found that a number of students did not take into account the condi-tions of the problem when reasoning out the possible outcomes.
• Students must acquire adequate comprehension skills, because terms like random, certain, possible, and at least may cause confusion. Soen (1997) found that for some students 100% chance of rain is not a certain event since they believe it only means that it is very likely to rain and that you can never be certain about weather.
• Concrete classroom activities are useful in helping students understand the concept of chance.• Teachers need to create situations requiring probabilistic reasoning that correspond to the students’ views
of the world.
Jones et al. (1997) propose a framework for assessing and nurturing young children’s thinking in probability. Four key constructs of probability, namely sample space, probability of an event, probability comparisons, and conditional probability, were used in their research. Note that the concept of conditional probability is beyond the scope of this module.
The framework proposed by Jones et al. (1997, p. 103) includes four levels for each of the four constructs where young children’s thinking can be described and predicted.
Level 1—Subjective Thinking
Children tend to adopt a narrow perspective of probability situations. In stating the outcomes of a sample space, children at this level provide a complete listing, but tend to focus subjectively on what is more likely to happen rather than what is possible: for instance, listing the possible outcomes for flipping a coin as just head (H) or just tail (T), instead of H or T.

��Introduction to the Module
Level 2—Transitional Between Subjective and Naive Quantitative Thinking
Children consistently identify a complete set of outcomes for a one-stage experiment and are sometimes able to list the outcomes for a two-stage outcome. When examining probabilities there is still a tendency to overlook outcomes, to focus on one aspect rather than on sample space and probability in combination: for instance, list-ing the possible outcomes for flipping a coin twice as H or T, instead of {HH, HT, TH, and TT}.
Level 3—Informal Quantitative Thinking
Children characteristically use quantitative judgments in determining probabilities, even in noncontiguous situations. While correct probabilities are not always expressed, numbers are used to compare probabilities, for example, expressing the probability of getting at least one head (flipping a coin twice) as 1 ⁄ 2 instead of 3 ⁄4. Note that the sample space for flipping two coins is {HH, TT, HT, and TH}. There are a total of four possible outcomes and the number of favorable outcomes—getting at least one head—equals 3.
Level 4—Incorporates Numerical Reasoning
Children consistently adopt strategies that not only enable them to systematically generate the outcomes of an experiment but also to assign and use numerical probabilities in both equally and not equally likely situations. For example: correctly listing the possible outcomes for a spinner with three equally likely outcomes or correctly listing the possible outcomes for a spinner with three unequally likely outcomes.
It is expected that by the end of this module, students will have increased their understanding with respect to the probability concepts of sample space, probability of an event, and comparison of probabilities. We assume that at the beginning of the module most students will be at Level 2 and by the time they complete the module, most students will be at Level 4.
Problem SolvingSolving probability problems may present difficulties that may require specific problem solving strategies for your students. We devised the following simple strategies from the work of Polya (2004) whose work is considered foundational for teaching students to solve math problems. Sternberg (1998), a psychologist, proposes a theory of learning that simply states if a student uses his or her analytic, practical, and creative intelligence, she has a better chance of grasping concepts than if she only uses one mode of thinking. Also, we are influenced by the work of Brady (1990), who effectively studied and used how reciprocal teaching (collaborative peer groups) and semantic mapping made a difference in Yup’ik students’ literacy learning. We combine these approaches so that throughout the module students can apply some of these simple procedures and ways of thinking to help them solve probability problems associated with this module.
Procedures for Teaching Problem Solving• Establish Norms for Problem Solving—Encourage students to work in pairs or collaborative work groups.
Have students recognize that there are multiple solution strategies to solving a problem. Have them learn to collaborate with each other. Set norms to encourage cooperative behaviors. Encourage students to learn from members within their own group. Have students share across groups and learn from each other.
• Understanding the Problem—Now that students are more accustomed to working together, have each student in a group read the problem. Discuss what the problem means. Identify key words. Identify words that may have multiple meanings. Have a student be the facilitator (change roles for each problem), asking

�2 Salmon Fishing
questions such as what does the problem mean, are there any words you do not understand, are there any words that are not clear?
• Cognitive Modeling—Teach the students to problem solve by understanding the question. Have them ap-propriate as you model your strategies for understanding a problem. To model problem solving strategies, you may use the following problem as an example. What is the probability of getting a head if you flip a coin twice?
1. Read the question aloud. Identify key words. Even point out how the “a head” is critical to this problem.
2. Think aloud—how would I solve this problem? Share your thoughts.3. Show the students how you would find the sample space for flipping a coin twice. Below is a list
of all possibilities.H-HH-TT-HT-T
Here’s another way to organize this information.
COINS Head (H) Tail (T)
Head (H) HH HT
Tail (T) TH TT
Fig. 2: Sample space for flipping a coin
4. Discuss various meanings of the terminology: “a head” could be at least 1 head or it could mean only 1 head.
5. Use the probability definition – probability is the number of favorable outcomes divided by total number of possible outcomes. In this example, there are four possible outcomes. Three of the four outcomes have at least one head. Therefore, the probability is 3 ⁄4.
6. Have the students solve other probability problems using the same sample space. That is, the sample space for flipping a coin twice.
What is the probability of getting two heads in a row if you flip a coin twice?1. Read the question aloud. Identify key words. 2. Have students practice discussing the problem, identifying key words, marking any word that
is unclear to them. 3. Define roles within the group: facilitator, documenter, and problem solvers.
What is the probability of not getting a head if you flip a coin twice?1. Read the question aloud. Identify key words. How is this problem like the previous problems?
How is it different?2. Have groups identify key words. Use the vocabulary maps to refine the meaning of words (see
Fig. 5 on page 16 for an example, and page 44 for a blackline master).• Additional Strategies:
o Is the problem similar to other problems that you have solved? Recall how you solved a similar problem.
o Simplify the problem. Solve the simpler problem first.o Draw a picture or diagram.o Find a pattern.

��Introduction to the Module
o Make a list or organize by using a tree diagram [for example, in this module using tree diagrams is helpful for organizing possibilities].
o Make a table.o Experiment [this module emphasizes experimenting vs. theoretical probability—students will have
practice using this strategy].o Be creative—act out the problem, create a comic strip, think of ways of teaching the concept to a
younger student.o Pose a problem.
• Sample Space: applying additional strategies to solve sample space problems.o Cognitive modeling: what is the question we will need to answer?o Consider the experiment of rolling two four-sided dice and adding the results together to find the
sample space. What is the total number of possible outcomes? Find the probability for each of the possible outcomes in the sample space. To answer these questions, students will need to think aloud some strategies on how to solve the problem.• What is the question asking? • What information does the problem provide?• How can I organize this information to answer the question?
Have partners or small groups working together to solve the problem. Have students help each other and as students begin to understand, you can have those students assist other groups.
The question asks for the sum of each possible roll of the two dice. One way to organize systematically is to lay out all the possibilities. The table below provides a systematic view of all possibilities.
+ 1 2 3 41 2 3 4 5
2 3 4 5 6
3 4 5 6 7
4 5 6 7 8
Fig. 3: Sample space for the sum of each possible roll of two dice
We can see from the table that there are 16 (4 x 4) possible outcomes. Although there are 16 total pos-sible outcomes, the outcomes range from 2 to 8 and some of these outcomes are repeated. For example, “4” shows up three times, “5” appears four times while 2 and 8 appear once.
Since the probability is the number of favorable outcomes divided by the total number of possible outcomes, probability of getting a sum of 2 is 1 ⁄ 16. Similarly, P(3) = 2 ⁄16; P(4) = 3 ⁄ 16; P(5) = 4 ⁄ 16; P(6) = 3 ⁄ 16; P(7) = 2 ⁄ 16; and P(8) = 1 ⁄ 16.
At the beginning of the module and throughout, provide students time to learn how to become problem solvers. Create norms, model, and have students slowly appropriate your strategies and other students’ strategies into the community of problem solvers.
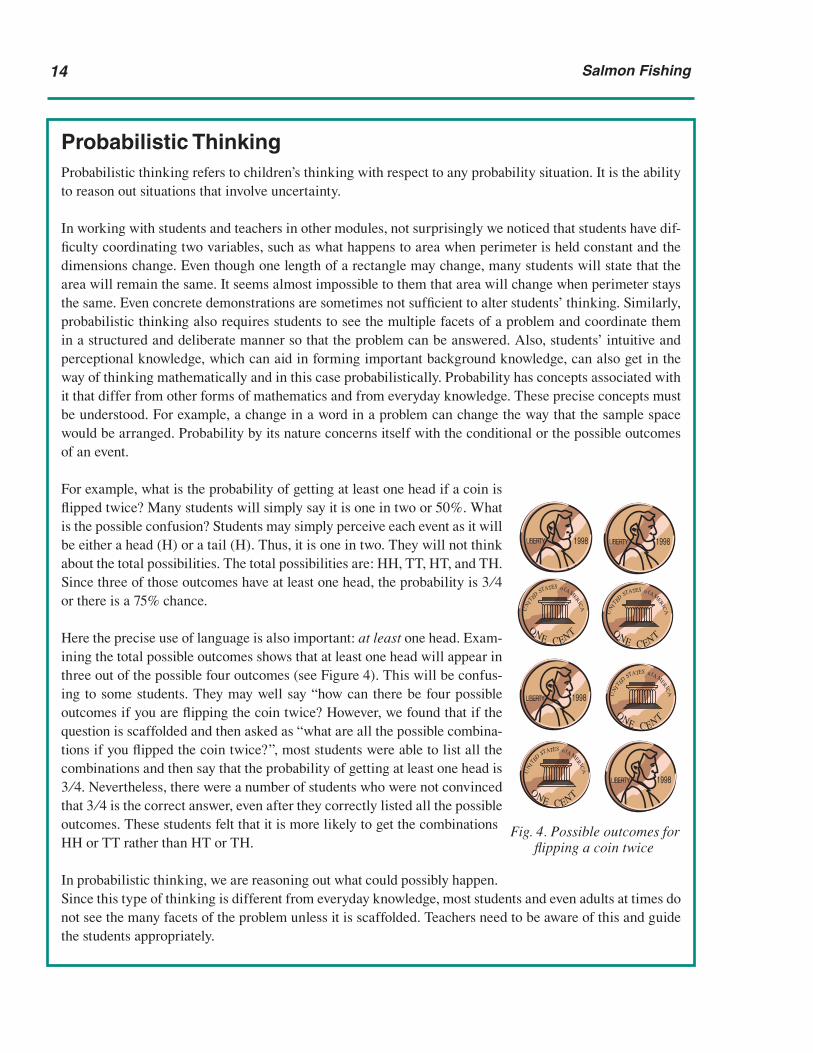
�� Salmon Fishing
1998LIBERTY
UN IT
EDSTATES o fA M
ER ICA
ONE C ENT
1998LIBERTY
1998LIBERTY
UN IT
EDSTATES o fA M
ER ICA
ONE C ENT
UN IT
EDSTATES o fA M
ER ICA
ONE C ENT
1998LIBERTY
UN IT
EDSTATES o fA M
ER ICA
ONE C ENT
Probabilistic ThinkingProbabilistic thinking refers to children’s thinking with respect to any probability situation. It is the ability to reason out situations that involve uncertainty.
In working with students and teachers in other modules, not surprisingly we noticed that students have dif-ficulty coordinating two variables, such as what happens to area when perimeter is held constant and the dimensions change. Even though one length of a rectangle may change, many students will state that the area will remain the same. It seems almost impossible to them that area will change when perimeter stays the same. Even concrete demonstrations are sometimes not sufficient to alter students’ thinking. Similarly, probabilistic thinking also requires students to see the multiple facets of a problem and coordinate them in a structured and deliberate manner so that the problem can be answered. Also, students’ intuitive and perceptional knowledge, which can aid in forming important background knowledge, can also get in the way of thinking mathematically and in this case probabilistically. Probability has concepts associated with it that differ from other forms of mathematics and from everyday knowledge. These precise concepts must be understood. For example, a change in a word in a problem can change the way that the sample space would be arranged. Probability by its nature concerns itself with the conditional or the possible outcomes of an event.
For example, what is the probability of getting at least one head if a coin is flipped twice? Many students will simply say it is one in two or 50%. What is the possible confusion? Students may simply perceive each event as it will be either a head (H) or a tail (H). Thus, it is one in two. They will not think about the total possibilities. The total possibilities are: HH, TT, HT, and TH. Since three of those outcomes have at least one head, the probability is 3 ⁄4 or there is a 75% chance.
Here the precise use of language is also important: at least one head. Exam-ining the total possible outcomes shows that at least one head will appear in three out of the possible four outcomes (see Figure 4). This will be confus-ing to some students. They may well say “how can there be four possible outcomes if you are flipping the coin twice? However, we found that if the question is scaffolded and then asked as “what are all the possible combina-tions if you flipped the coin twice?”, most students were able to list all the combinations and then say that the probability of getting at least one head is 3 ⁄4. Nevertheless, there were a number of students who were not convinced that 3 ⁄4 is the correct answer, even after they correctly listed all the possible outcomes. These students felt that it is more likely to get the combinations HH or TT rather than HT or TH.
In probabilistic thinking, we are reasoning out what could possibly happen. Since this type of thinking is different from everyday knowledge, most students and even adults at times do not see the many facets of the problem unless it is scaffolded. Teachers need to be aware of this and guide the students appropriately.
Fig. 4. Possible outcomes for flipping a coin twice

��Introduction to the Module
Literacy Context
The literacies-based activities in this module are designed from a diverse social constructivist orientation (Au, 1998). Within this perspective, learning is situated in a context where both teachers and students are actively engaged in social situations (Vygotsky, 1986), which gives particular attention to students’ prior knowledge and life experiences that are influenced by culture, ethnicity, and their primary language. Given the importance of these influences on students’ learning, the activities are centered within the framework of multiple literacies. Multiple literacies reflects a broader view that moves beyond the mainstream idea of literacy as reading and writ-ing to encompass a wide range of symbol systems (e.g., music, art, math) and diverse modalities of interpretation and expression (e.g., visual, oral, aural, kinesthetic). Thus, activities may include a variety of strategies such as discussing, drawing, writing, reading, storytelling, and presenting as ways to represent student learning.
One important goal of the literacy-based activities is to promote a better understanding of the math concepts presented in the module. An equally important goal is to improve comprehension and the cognitive and meta-cognitive processes that support and build understanding of a variety of texts (print, media, visual, music, etc.). To facilitate the development of these processes, the literacy activities reflect the concept of cognitive apprentice-ship (Collins, Brown, & Newman, 1989). Through cognitive apprenticeship, the focus shifts from physical and discrete skills to learning through guided experience on cognitive and metacognitive processes, which relies on development of inquiry, self-reflection, and self-monitoring. This approach to literacy matches MCC’s emphasis on expert-apprentice modeling and joint activity.
In addition, because vocabulary acquisition plays an integral role in the comprehending process across all disciplines, we have included a graphic organizer, the vocabulary map, which is a tool for inquiry, for you and your students to use to explore new vocabulary. This map can be used in whole-group instruction, small group discussions, and for individual inquiry.
Vocabulary MapThe vocabulary map is a cognitive organizer that helps students in a process of understanding the meaning of the math words presented in the module. Each box provides students with a different way to think about the word. In addition to writing the definition of the word in their own words, students can also provide an example of the word, either in writing or by drawing (see Figure 5).
You may also ask students to locate objects in the room or bring in objects from home that might be an example. These can be assembled in a vocabulary artifact exhibit that includes placards with the vocabulary words dis-played by the object.
Because many words have different meanings depending on the discipline and context, we have included a box titled “Common Meaning.” This is aimed at accessing prior knowledge of a word that may be known in one context as meaning one thing, but in another it may have a different meaning altogether. Learning to differenti-ate between the multiple meanings of words can aid in reading comprehension across the content areas. It is also good when learning new vocabulary words to begin with the familiar or known and then move to the new meaning of the word.

�� Salmon Fishing
The “Category” box can help students connect the word with a group of words or a larger concept. This helps to build the conceptual understanding of the word and its relationship to other words that are key to the concept.
Finally, mathematical terms typically have more precise meanings then their everyday uses such as the difference between probability (mathematical term) and chance (everyday word). Students need to build on their everyday experience but go beyond it to understand the meaning of the term in its mathematical context.
Fig. 5: An example of the vocabulary map

��Introduction to the Module
Cultural Context
Yup’ik Elders’ KnowledgeMathematical activities are exhibited in a variety of ways in every culture, and these activities are directly related to formal, conventional school mathematics in inspiration, motivation, and mode. The mathematical activities of Yup’ik people of southwest Alaska are no exception. Their knowledge of problem solving, spatial relationships, estimation, measurement, and the interpretation of physical phenomena have enabled them to live for thousands of years in southwest Alaska.
Traditionally, Yup’ik people have depended on salmon, and they continue to rely on the wealth of the fish harvest, both directly and indirectly. Salmon form a primary part of the regional diet. There are five species of salmon in Alaska: chum, pink, sockeye (red), king (chinook), and coho (silver). The summer salmon run provides an excellent and necessary food source for most Alaska coastal and river families. Not only do salmon provide food, but salmon are also a source of employment. The large seasonal influx of salmon nurtures a commercial fishing industry that brings financial resources into the community. The strength of the salmon run has a direct impact on the life of the Yup’ik people.
Because of their reliance upon salmon, Yup’ik people make every effort to protect the salmon and not to over-fish their waters. The Yup’ik people who fish for subsistence stop fishing after they catch a certain amount of salmon—the amount they need to eat during the coming year. For their own sake, as people who depend on the yearly harvest of salmon for food, Yup’ik families carefully determine how much they need until the next fishing season. Such conservation reduces waste and helps maintain a large spawning population of salmon.
Through repeated experiences of fishing from year to year, Yup’ik families know or have learned to predict how many fish will be required and what type of fish their family members prefer. Older people generally require a different amount of salmon than what is needed by teenagers or children; and while some people like the taste of king salmon, others may prefer the taste of red salmon. Through long experience, the Yup’ik people have learned how to estimate with accuracy. With the information they have gathered over time, Yup’ik people de-velop accurate predictions about the fishing conditions and how to satisfy their family’s needs and preferences.
Hence, each season the fishermen know what they need to catch and they have a sense of what they may be able to catch, given existing fishing conditions and given the preparedness of their fishing gear, fish racks, and other equipment for fishing. Yup’ik fishermen will work hard initially to ensure the year’s food supply, and then stop fishing when they have caught enough salmon to meet their needs. While fishing, people are careful to process the salmon efficiently so the fish dry quickly without spoilage by mold or infestation. It is uncommon for Yup’ik people to let any salmon rot or spoil.
This module was partially inspired by the late Mary George and her husband Frederick George of Akiachak (Figure 7). Mary George’s creativity and her ability to integrate Western and Yup’ik knowledge provided criti-cal insights into the development of a number of the modules in this series. She taught in the Akiachak school, fished, kept house, and gathered berries, greens, and “mouse food.” Mary was a friend to all in the village, cared for all the children who came her way, and helped solve problems encountered by village adults. She was a posi-tive force in her small community. Frederick is a full-time subsistence fisherman and hunter. Frederick is also an extraordinary person. He is one of the few people who travels by star navigation. He works with the younger generation, passing on his knowledge and his ability to solve a variety of problems related to everyday living.

�� Salmon Fishing
He is also a very active member of the search and rescue team, frequently helps at the school, teaches survival skills to adults, and serves on the village council.
Every summer Mary and Frederick and their entire ex-tended family would fish for salmon along the Kuskokwim River. Families such as the Georges can control what they catch to a great degree because they find ways to choose the most probable time and place for catching certain salmon. Through experience, they learn when the type of salmon they like best will come through the river in large numbers and the correct net size to use. By fishing during these time periods, they influence the chance that a particular type of salmon will land in their nets. Since the George family prefers king salmon, they manage to bring home 55% king salmon, even though the Kuskokwim predominantly has chum salmon.
The Alaska Fisheries
History of Alaska Fisheries
Since the 1880s, the commercial salmon fishery has com-prised an important part of Alaska’s economy. Bristol Bay in southwest Alaska has the largest red salmon fishery in the world and is one of the many bountiful salmon fishing areas in Alaska. It remains Alaska’s hub for both subsistence and commercial salmon fishing.
Starting in 1904, Bristol Bay’s treacherous waters could only be commercially fished using double-ender sail-boats, which were a little over 29 feet (8.8 m) long. These were owned by the canneries, and fishermen used them for free but had to maintain them. The sailboats were not as efficient or easy to use as motorboats, and no one is sure why they were the only fishing boats allowed for so many years. Perhaps it was to avoid overfishing, or because fishermen were easier and cheaper to replace than expensive outboard motors. In 1951, the law changed and the sailboats were abandoned in favor of motorboats. Photos of an early 20th-century fishery and a pres-ent-day fishery (Figs. 8 and 9) are included courtesy of the Rasmusen Library, University of Alaska Fairbanks.
With some of the highest tide fluctuations in the world, where the differences are often as much as 20 feet (6.1 m) or more, Bristol Bay challenges even the best boat navigation under ideal weather conditions. Relying exclusively on a sail required strength, courage, endurance, and experience. Many a boat was stranded on a sandbar in the ebb tide, or washed over in the incoming flow. Combined with the violent and frequent storms of the area, a 2,000 to 3,000 pound (907 to 1,361 kg) load of salmon in the boat, cold water, a tired crew, and a minimum of safety precautions and gear, the recipe for a dangerous occupation was complete. Many fishermen were swept overboard; others drowned when their boats capsized. While they tried to help each other, the wind and waves often made it impossible to rescue people from the rough water. Even for the hardiest crew with the most experi-ence, making it through another fishing season was often a matter of luck.
Fig. 6: An Alaska village
Fig. 7: Mary and Frederick George

��Introduction to the Module
Fig. 8: Nushagak salmon fishery of the early 20th century Fig. 9: Present-day fishery, Bristol Bay
Bethel
KUSKOKWIMRIVER
DillinghamManokotak Igushik
River
Togiak
Lewis Pt
NU
SHA G
AK
TOG
IAK
RI
VER
Togiak Lake
KVIC
HAKBAY
NU
SHA
GA
KB
AY
Kul
ukak
BayTo
giak
Bay
BRISTOL BAY
Akiachak
YUKON RIVER
Ualik Lake(2nd Lake)
Nuyakuk River
Amanka Lake
(1st Lake)
RIV
ER
MU
LCH
ATNA
RIVER
LAKE ILIAMNA
KAMISHAK
BAYNAKNEKLAKE
Fig. 10: Map of southwest Alaska

20 Salmon Fishing
Many Yup’iks participate in Bristol Bay’s commercial fishery, selling their salmon to local canneries and proces-sors. Others fish only to meet their subsistence needs, catching and drying enough salmon to feed their families over the long winter. Some people participate in both commercial and subsistence fisheries.
Quite a few river mouths open onto the coast of southwest Alaska. However, the salmon runs in these rivers vary considerably in strength. For instance, the red salmon run on the Nushagak River can, in several days, outpace the entire season’s run for all species of salmon on the Kuskokwim and the Yukon rivers combined. Likewise, on the Kvichak River, the run in one day alone can equal the Kuskokwim and Yukon’s total seasonal salmon run. Through a variety of techniques, the ADF&G monitors the fish population and estimates the strength of the salmon run.
The Alaska Department of Fish and Game (ADF&G) uses statistical sampling to closely monitor and control fishing in Alaska waters. Each year, ADF&G sends test boats out into Bristol Bay and samples the number and type of salmon coming into the rivers. By using these predominantly scientific methods, ADF&G tries to ensure consistent salmon runs for future generations. Overall the Bristol Bay salmon run is the largest in the world.
In southwest Alaska, the ADF&G typically samples for salmon at locations along Bristol Bay’s Nushagak River, the Kuskokwim River, and the Yukon River. In addition to the test boats, sampling methods include aerial sur-veys, sonar counting, counting from a fish tower, and reports from commercial and subsistence catches. Samples indicate the number and approximate mix of salmon: what part of the returning salmon population consists of king salmon, for instance, in comparison to other types of salmon.
On the Kuskokwim River, Yup’ik people expect that there will be as many or more chum salmon than all other species combined. They know that the salmon in the Kuskokwim River are more than half chum. Sampling records enable researchers to form a good idea of the total number of each species of salmon the ADF&G has counted. They also have a good idea of what percentage of each type of salmon was counted. Thus they have determined that, in the Kuskokwim River, about half the salmon measured by ADF&G are chum salmon. If half the salmon are chums, then about 50 percent of the time, fishers who catch a salmon should catch a chum. Researchers say the chance of catching a chum is about 50 percent in the Kuskokwim, confirming the knowledge of the Yup’ik people.
The FishSalmon have constituted a vital traditional food source for Alaska Natives for over 10,000 years. They are im-portant to bay and riverine ecology, feeding whales, bears, seals, otters, and other species of fish and providing nutrients to the streams when they decay after spawning. Other important fish include herring, halibut, black fish, bull heads, grayling, pike, smelt, trout, arctic char, and white fish.
Salmon are a migratory species of fish, meaning they travel from one feeding ground to another. The largest migration for these fish is from freshwater to saltwater, and then back to freshwater. This outmigration from freshwater to the marine environment takes place in spring and early summer. Depending on the species, salmon may travel just a few miles from their freshwater spawning grounds to the ocean, as for example some pinks do. Others travel much further. For example, a Yukon king salmon may travel 2,300 miles (3,700 km) as a smolt to reach the ocean, where it will range widely in the North Pacific and Bering Sea, sometimes as far away as Japan. After at least two years of feeding in saltwater, it will swim back up the Yukon some 2,300 miles (3,700

2�Introduction to the Module
km) into Canada, and return to its birth stream to spawn. This journey home takes place over a period of ap-proximately sixty days.
Alaska’s Salmon
Because the Alaska coast meets the Pacific Ocean, all five species of Pacific salmon are found in Alaska’s waters. Pink or humpback salmon are the most numerous. They normally weigh between 3.5 and 4 pounds (1.6 to 1.8 kg) and average some 20 to 25 inches (51 to 64 cm) in length. As adults, they are a bright, steely blue on top and their sides are a silvery color. Many large, black spots are scattered on their back and entire tail fin. Their scales are small and their flesh is pink.
During spawning, all Pacific salmon undergo a remarkable metamorpho-sis. Their color changes, and the males develop hooked jaws, often with teeth and a prominent hump on their back. Male pink salmon change to brown or black on top and have a white belly. The females turn olive green with dusky bars or patches on top and a light-colored belly (see Figs. 11 and 12).
Sockeye, also called red salmon because of the color of their meat, are the second most abundant salmon in Alaska. The adults are long and slender and weigh from 4 to 8 pounds (1.8 to 3.6 kg), with a metallic green-blue color on the back and top of the head, iridescent silver on the sides, and white or silver on the belly. Fine, black speckles might be sprinkled over the back. During spawning, males develop the characteristic humped back and hooked jaws, and sharp teeth called kype. Both males and females turn brilliant to dark red on their backs and sides, pale to olive green on their heads and upper jaws, and white on their lower jaws.
Chum or dog salmon are the third most numerous. The adults are a metal-lic greenish-blue on top with fine, black speckles and are about the same size as the red salmon. During spawning their color changes to include vertical green and purple bars. The females develop a dark, horizontal band along the lateral line and faint green and purple vertical bars.
Coho or silver salmon are the fourth most numerous. Adults weigh be-tween 8 and 12 pounds (3.6 to 5.4 kg) and are 24 to 30 inches (61 to 76 cm) long. They are a bright silver color, with small black spots on the back and on the upper lobe of the tail fin. During spawning, both males and females develop dark heads and backs and maroon to reddish sides.
Chinook or king salmon are the largest in size but the least abundant salmon in Alaska. They weigh anywhere from 4 to over 50 pounds (1.8 to 22.7 kg), depending on their age. Adults are a bluish-green color on the back, silvery on the sides and white on the belly. They have black, irregular spotting on the back and dorsal fins and on both lobes of the tail fin. They also have a black coloring along the gum line. During
Fig. 11: Pink salmon. Top, ocean stage; middle, spawning female; bottom, spawning male
Fig. 12: Coho or silver salmon. Top, ocean stage; middle, spawning female; bottom, spawning male

22 Salmon Fishing
spawning, their color ranges from red to copper to almost black, depending on the age of the fish and its location. Males have a deeper color than females.
Salmon Life Cycle
While each of the five salmon species has its own particular migratory patterns and spawning habits, there are similarities among them (Figure 13). Pacific salmon are born in freshwater lakes or streams, where they spend up to two years growing. Then they travel to the ocean, where they feed and grow for an additional one to four years, depending on the species. When they reach adulthood, they return to freshwater to spawn. The type of freshwater in which they spawn varies. For example, some pink salmon may spawn within a few miles of the coast, chum spawn in the small side channels of large rivers, and chinook spawn in relatively deep and moving river water.
Pacific salmon usually return to their place of birth to spawn the next generation of fish, but how they find their way back to this precise creek remains somewhat of a mystery. Some evidence indicates that they may be using the magnetic forces of the earth, which they perceive through the lateral markings on their body. Some scientists believe that sockeye might use the position of the sun and the moon and the Earth’s magnetic field to guide them both to the ocean and back to freshwater. Salmon are also sensitive to electrical currents in the water, particularly for hunting and perhaps also for guidance. Other evidence points to their sense of smell. King and coho salmon seem to have an especially strong homing instinct.
Spawning Process
Once the adults arrive at their stream, they begin the spawning process. The female digs a nest, or redd, in the gravel with her tail and deposits the eggs in it. The number of eggs released can vary from 1,500 to 4,500, depend-ing on the species, although only a few survive to become adults (see Fig. 14). As the eggs are released, the male swims over them and re-leases milt to fertilize them. Using her tail, the female covers the eggs with gravel. Laying the eggs and fertilizing them is called spawning, and within one or two weeks after the adults spawn, they die.
the eggs in the redd alevin
fry
smolt
adult salmon
female salmon makes her
redd
the female lays her
eggs as the male milts
Fig. 13: Life cycle of the salmon

2�Introduction to the Module
Egg to Fry
Eggs
30
3000
42
Fry to Smolt
Smolt to Adult
6081
57
Stage of Development
Numbers of Surviving Fish
Fig. 14: Red salmon survival statistics, starting with a total of 3,000 eggs
The eggs hatch within 90 to 120 days, usually in early spring. When the young emerge, the egg sac is still at-tached and provides nourishment. At this stage, the young are called alevin, and they remain in the gravel. They live here until May or June, when they leave the gravel and enter the stream as fry. Depending on the species, they will feed as fry for up to two years. At this stage they are called smolt. Then they travel to the ocean for more feeding. In Alaska, they will end up in the Pacific Ocean or the Bering Sea. They spend the next two to five years or even more living and feeding in the ocean as adult salmon.
From the time they exist as eggs, predators are a constant threat to salmon (Figure 15). This is part of the salmon’s important role in the complex ecological web of its environment. Birds and larger fish eat the eggs and the fry. In the ocean, many other species eat them: beluga whales, sea lions, seals, salmon sharks, and sea otters. Commer-cial, sport, and subsistence fishermen also depend on the salmon for their commercial and nutritional survival.
Fig. 15: Beluga whale, a major predator of salmon
The Salmon Run
The salmon migration home to produce the next generation of fish is called the salmon run. Every summer through early fall, at a fairly regular time, a new group of salmon “runs” home. Along the Kuskokwim River, the kings usually begin running by the first of June and continue until about mid-July. Around Bristol Bay, the peak of the red salmon run occurs on approximately July fourth. Once the salmon enter fresh water, they stop eating and live only off the fat reserves they have accumulated while feeding in the ocean. Depending on the

2� Salmon Fishing
species, they may travel over 2,300 miles (3,700 km). In their journey upstream, they encounter beaver dams, waterfalls, and rapids that they must jump over or swim through.
Getting ReadyFor both subsistence and commercial fishermen, getting ready for the upcoming salmon run is a necessity and often an exciting and hectic time. Commercial fishermen from as far away as Japan, Russia, San Francisco, and Seattle begin preparing for their fishing season in or near Bristol Bay. Boats must be repaired, nets checked, crews hired, supplies purchased and stored, and estimates made for the amount of fish that might be caught and the price at which they can be sold. Some commercial fishermen live in Alaska villages or cities, and many of them store their boats around Bristol Bay. They might make a trip to the area a month or so beforehand to repair their boats and see that everything is in place. During the season, the work is hard and intense. Some season openings last for only a few hours, due to the number of fish or the duration of the run. Other season openings might last a few days or longer.
Subsistence fishermen generally fish between the intense commercial fishing openings. For subsistence fisher-men, always getting ready is a way of life. If a family goes to fish camp, it will generally travel there by boat. This means that it must purchase fuel for the round trip, gather and purchase food supplies, and pack household supplies and fishing gear and even tents if it has no cabins. Some families might take a few days to prepare, others might take only a few hours. If the family does not go to fish camp, it probably has a drying rack and smokehouse at the back of the house.
Fig. 16: Boat harbor at Bristol Bay
Fish CampMany coastal people in Alaska take advantage of the sizable annual salmon run to harvest a catch in preparation for winter. The critical problem facing these Alaskans is to put away enough salmon during the summer fishing season to last them until next summer’s salmon season. To solve this annual problem, these skilled fishers need to know how to catch, clean, cut, dry, smoke, pack, distribute, and store the salmon efficiently.
Each cultural region of Alaska has its preferred way of organizing fish camps, catching salmon, and drying and smoking them. Even within the same cultural region, fish camps vary because of differences in salmon runs, personal preferences for organizing, catching, and processing salmon, and environmental factors. The types of houses and their arrangement, the construction of drying racks and smokehouses, the gear used to catch the salmon, the size of the camp, the amount and variety of salmon caught, and the methods of processing and preserving the catch all may differ.
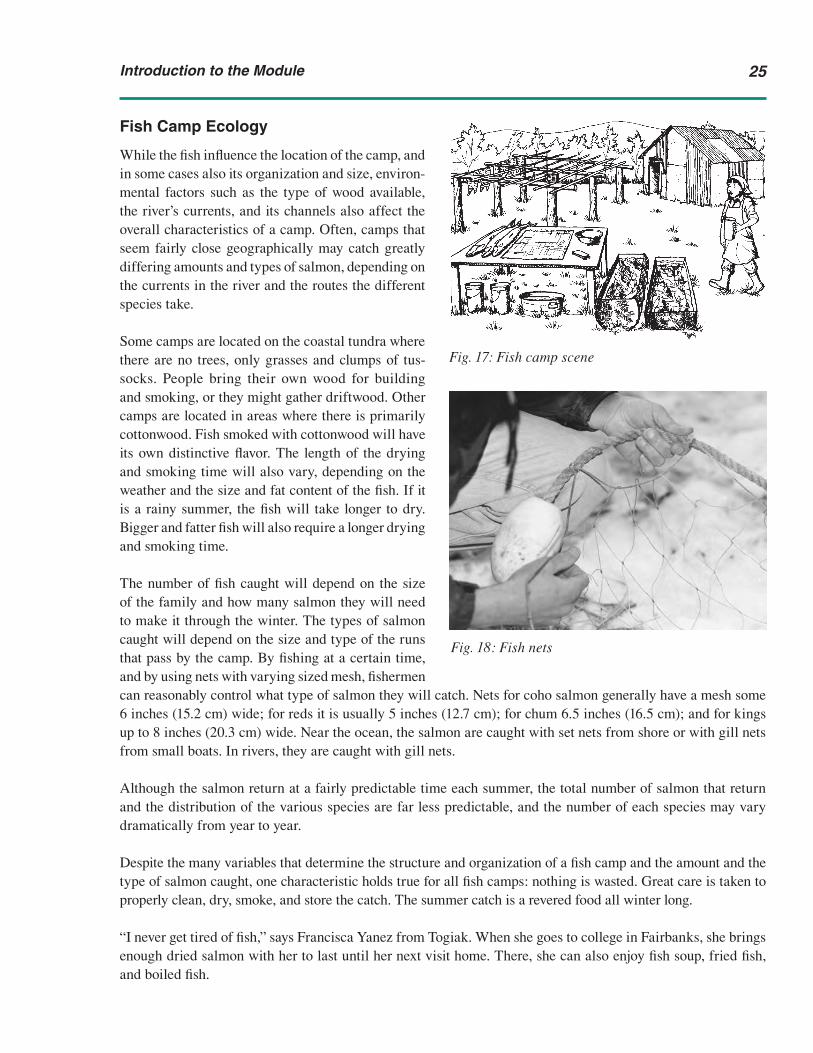
2�Introduction to the Module
Fish Camp Ecology
While the fish influence the location of the camp, and in some cases also its organization and size, environ-mental factors such as the type of wood available, the river’s currents, and its channels also affect the overall characteristics of a camp. Often, camps that seem fairly close geographically may catch greatly differing amounts and types of salmon, depending on the currents in the river and the routes the different species take.
Some camps are located on the coastal tundra where there are no trees, only grasses and clumps of tus-socks. People bring their own wood for building and smoking, or they might gather driftwood. Other camps are located in areas where there is primarily cottonwood. Fish smoked with cottonwood will have its own distinctive flavor. The length of the drying and smoking time will also vary, depending on the weather and the size and fat content of the fish. If it is a rainy summer, the fish will take longer to dry. Bigger and fatter fish will also require a longer drying and smoking time.
The number of fish caught will depend on the size of the family and how many salmon they will need to make it through the winter. The types of salmon caught will depend on the size and type of the runs that pass by the camp. By fishing at a certain time, and by using nets with varying sized mesh, fishermen can reasonably control what type of salmon they will catch. Nets for coho salmon generally have a mesh some 6 inches (15.2 cm) wide; for reds it is usually 5 inches (12.7 cm); for chum 6.5 inches (16.5 cm); and for kings up to 8 inches (20.3 cm) wide. Near the ocean, the salmon are caught with set nets from shore or with gill nets from small boats. In rivers, they are caught with gill nets.
Although the salmon return at a fairly predictable time each summer, the total number of salmon that return and the distribution of the various species are far less predictable, and the number of each species may vary dramatically from year to year.
Despite the many variables that determine the structure and organization of a fish camp and the amount and the type of salmon caught, one characteristic holds true for all fish camps: nothing is wasted. Great care is taken to properly clean, dry, smoke, and store the catch. The summer catch is a revered food all winter long.
“I never get tired of fish,” says Francisca Yanez from Togiak. When she goes to college in Fairbanks, she brings enough dried salmon with her to last until her next visit home. There, she can also enjoy fish soup, fried fish, and boiled fish.
Fig. 18: Fish nets
Fig. 17: Fish camp scene
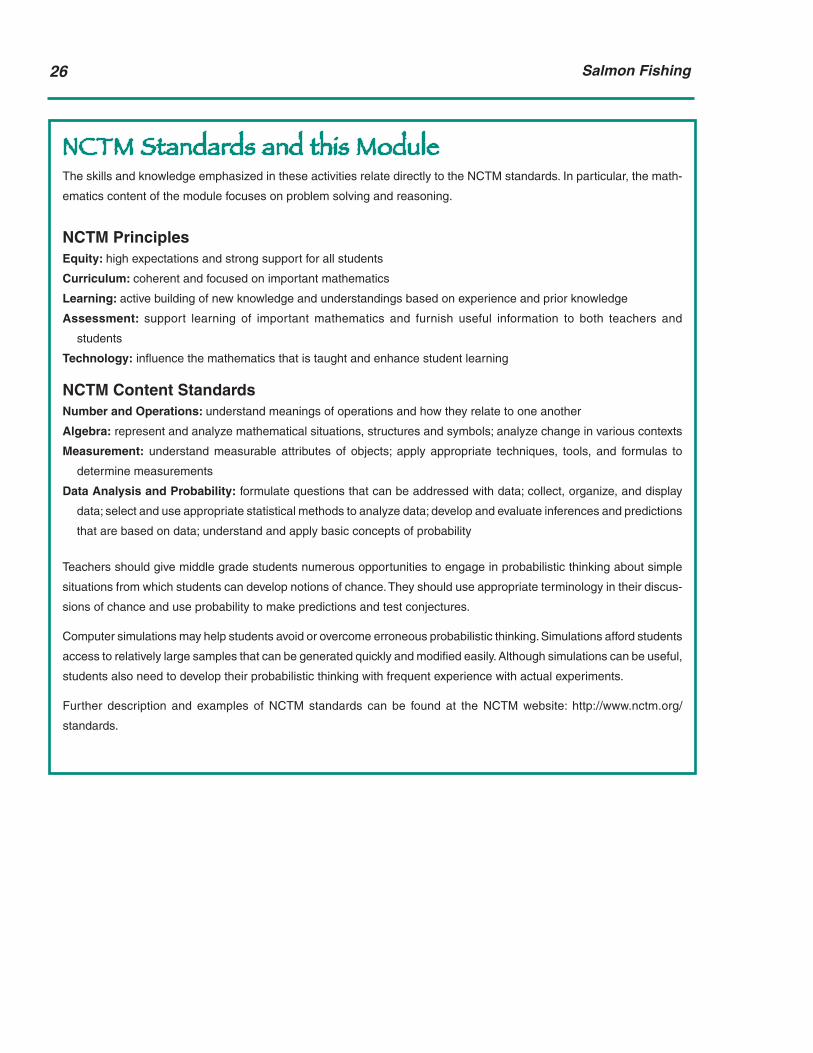
2� Salmon Fishing
NCTM Standards and this ModuleThe.skills.and.knowledge.emphasized.in.these.activities.relate.directly.to.the.NCTM.standards ..In.particular,.the.math-
ematics.content.of.the.module.focuses.on.problem.solving.and.reasoning .
NCTM PrinciplesEquity: high.expectations.and.strong.support.for.all.students
Curriculum: coherent.and.focused.on.important.mathematics
Learning: active.building.of.new.knowledge.and.understandings.based.on.experience.and.prior.knowledge
Assessment: support. learning. of. important. mathematics. and. furnish. useful. information. to. both. teachers. and.
students
Technology:.influence.the.mathematics.that.is.taught.and.enhance.student.learning
NCTM Content StandardsNumber and Operations: understand.meanings.of.operations.and.how.they.relate.to.one.another
Algebra:.represent.and.analyze.mathematical.situations,.structures.and.symbols;.analyze.change.in.various.contexts
Measurement:. understand. measurable. attributes. of. objects;. apply. appropriate. techniques,. tools,. and. formulas. to.
determine.measurements
Data Analysis and Probability:.formulate.questions.that.can.be.addressed.with.data;.collect,.organize,.and.display.
data;.select.and.use.appropriate.statistical.methods.to.analyze.data;.develop.and.evaluate.inferences.and.predictions.
that.are.based.on.data;.understand.and.apply.basic.concepts.of.probability
Teachers.should.give.middle.grade.students.numerous.opportunities.to.engage.in.probabilistic.thinking.about.simple.
situations.from.which.students.can.develop.notions.of.chance ..They.should.use.appropriate.terminology.in.their.discus-
sions.of.chance.and.use.probability.to.make.predictions.and.test.conjectures ..
Computer.simulations.may.help.students.avoid.or.overcome.erroneous.probabilistic.thinking ..Simulations.afford.students.
access.to.relatively.large.samples.that.can.be.generated.quickly.and.modified.easily ..Although.simulations.can.be.useful,.
students.also.need.to.develop.their.probabilistic.thinking.with.frequent.experience.with.actual.experiments .
Further. description. and. examples. of. NCTM. standards. can. be. found. at. the. NCTM. website:. http://www .nctm .org/
standards .
2�Introduction to the Module
Master Materials ListTeacher Provides• 3x5 cards in four colors (one set per pair)• Blank paper circles• Butcher paper• Cardboard sheets• Coins—various sizes• Color pencils• Crayons• Deck of cards• Dice• Fishing pole materials—poles, string, and
magnets • Markers• Mats or poster boards (24 inches by 24 inches)
with a circle (4 inches in diameter with an area of approximately 12.6 square inches) painted or fixed at the center.
• Paper • Paper clips • Pencils • Paper “salmon” and a bag or box to hold a “pool”
of salmon• Popsicle sticks • Rulers • Spinners• Student journals• Tally sticks (one set per pair)• Transparencies—blank• Wooden or plastic disks (3 inches in diameter)
marked with “O”• Wooden or plastic disks (3 inches in diameter)—
marked with “X”
Package Includes • CD-ROM, Yup’ik Glossary• CD-ROM, Excel template
Posters• The Five Salmon Species • The Salmon Life Cycle
Blackline Masters for Transparencies• The Five Salmon Species• George Family’s Yearly Salmon Catch • The Salmon Life Cycle• Yukon-Kuskokwim Rivers, Where the George
Family Lives
Blackline Masters for Worksheets and Scenario Cards• Class Record Chart• Guidelines for the project—Activity 9• Possible Outcomes Worksheet• Number of Salmon Caught Worksheet• Sample Fish Cutouts• Scenario Card—Activity 1• Scenario Card—Activity 4• Scenario Card—Activity 6• Scenario Card—Activity 7• Scenario Card—Activity 8• Distribution Chart • Semantic Map• Story: Ground Squirrel• Student Record Sheets—Activity 7• Vocabulary Map

2� Salmon Fishing
Master Vocabulary ListArea—the number of square units required to exactly cover a figure in the planeAt least—no less than; minimumAt most—no more than; maximumChance—unpredictable course of events; possibility; probability represented as a percentageChoice—act or power of choosing or selectingComplement—making up a whole or making completeDecimal fraction—a fraction expressed by using decimal representation, for example, 1 ⁄4 can be represented
as 0.25 as a decimal fractionDistribution—the frequency of occurrence, either experimental or theoreticalEqually likely—two or more events have the same or equal chance of happeningEvent—object of focus, determined by one or more outcomes, as defined by the experiment Exactly—accurately; definitelyExperiment—a repeatable operation that results in any one of a set of outcomesExperimental Probability—probability determined by conducting trials of an experimentFavorable outcome—an outcome you are interested in; also called a “success”Fraction—numerical quantity that can be expressed as a ⁄ b, where a and b are integersInteger—a positive or negative whole numberKakaanaq—a Yup’ik game where an object is thrown onto a targetLess than—below, lowerMore than—above, overMukluk—a tall boot made of sealskin or other animal skinNot equally likely—two or more events do not have the same or equal chance of happeningOdds—likelihood or the possibility, represented as “a to b,” where a is success and b is failure with a + b
representing the total number of optionsOutcome—one of the possible results of an experimentPercentage—proportion or rate per hundredPossible outcomes—all the possible results from a single trial of an experimentProbability—the likelihood of an event occurring; the measure of how likely an event is, represented by a
fractionQasgiq—men’s community houseRandom—uncertain; by chance without planRatio—a relationship between two quantitiesSample size—number in the sample; quantity of the sampleSample space—the set of all possible outcomesSampling—choosing a group of people or objects from a larger group to provide data to make predictions
about the larger groupStatistics—the science of classifying and interpreting numerically collected information and systematically
collected factsTegurpiit—grabbing something; name of a Yup’ik game of chanceTheoretical probability—probability determined by analysis of all possible outcomes of an experimentTrial—one round of an experiment

2�Introduction to the Module
ReferencesAu, K. (1998). Social Constructivism and the School Literacy Learning of Students of Diverse Backgrounds.
Journal of Literacy Research, 30(2), 297–319.Brady, P. L. (1990). Improving the Reading Comprehension of Middle School Students through Reciprocal Teach-
ing and Semantic Mapping Strategies. Unpublished Ph.D. Dissertation, University of Alaska Fairbanks, Fairbanks, Alaska.
Britz, M. W., Dixon, J., and McLaughlin, T. F. (1989). The Effects of Peer Tutoring on Mathematics Performance: A Recent Review. Journal of Special Education, 13(1), 17–33.
Cazden, C. B. (1986). Classroom Discourse. In M. C. Wittrock (Ed.), Handbook of Research on Teaching (pp. 450–451). New York: MacMillan.
Collins, A., Brown, J. S., and Newman, S. E. (1989). Cognitive Apprenticeship: Teaching the Craft of Reading, Writing and Mathematics. In R. Glaser and L. B. Resnick (Eds.), Knowing, Learning and Instruction: Es-says in Honor of Robert Glaser. Hillsdale, NJ: Lawrence Erlbaum.
Culin, S. (1907). Games of the North American Indians. Volume 1: Games of Chance. Nebraska: University of Nebraska Press, Lincoln and London.
Hedin, D. (1987). Students and Teachers: A Tool for Improving School. Social Policy, 17(3), 42–47.Jones, G. A., Langrall, C. W., Thornton, C. A., and Mogill, A. T. (1997). A Framework for Assessing and Nurtur-
ing Young Children’s Thinking in Probability. Educational Studies in Mathematics, 32, 101–125.Lipka, J. (2002). Connecting Yup’ik Elders Knowledge to School Mathematics. Paper presented at the Second
International Conference on Ethnomathematics (ICEM2), Ouro Preto, Brazil.Lipka, J., and B. Adams (2004). Culturally based math education as a way to improve Alaska Native students’
mathematics performance. Athens, Appalachian Center for Learning, Assessment, and Instruction in Mathematics. Working Paper No. 20.
National Council of Teachers of Mathematics. (2000). Principles and Standards for School Mathematics. Reston: National Council of Teachers of Mathematics.
Polya, G. (2004). How to Solve It: A New Aspect of Mathematical Method. Princeton: Princeton University Press.
Soen, C. W. (1997). Intuitive Thinking and Probability. REACT(1).Sternberg, R. (1997). Successful Intelligence. New York: Plume.Sternberg, R. (1998). Principles of Teaching for Successful Intelligence. Educational Psychologist, 33, 65–72.Vygotsky, L. S. (1986). Thought and Language. Cambridge, MA: MIT Press.Way, J. (1997). Laying Foundations in Chance and Data. http://www.mansw.nsw.edu.au/members/reflections/
vol22no1_97way.htm.Zaslavsky, C. (1991). World Cultures in the Mathematics Class. Learning of Mathematics, 11(2), 32–35.Zaslavsky, C. (2002). Native American Games and Activities. In J. E. Hankes and G. R. Fast (Eds.), Changing
the Faces of Mathematics: Perspectives on Indigenous People of North America (pp. 151–155). Reston, VA: National Council of Teachers of Mathematics.
Photography CreditsMary and Frederick George, page 18, courtesy of Mary George.Nushagak salmon fishery of the early 20th century and present-day fishery, Bristol Bay, page 19, courtesy of Rasmusen Library, University of Alaska Fairbanks.Boat harbor at Bristol Bay, page 24, and fish nets, page 25, courtesy of Jerry Lipka.

�0 Salmon Fishing
Internet Resourceshttp://www.cc.gatech.edu/classes/cs6751_97_winter/Topics/stat-meas/probHist.htmlwww.gamblecraft.com/tutorial/history.htmhttp://www.2ndmoment.org/articles/probability.phphttp://thesaurus.maths.org/mmkbhttp://www.adfg.state.ak.us/http://www.subsistence.adfg.state.ak.us/http://www.betweenwaters.com/probab/dice/explain.htmlhttp://www.betweenwaters.com/probab/flip/explain.htmlhttp://www.pleasanton.k12.ca.us/pleasanton/MathWeb/Grade7/Probability/PIG/PIG.htmlhttp://www.cyberbee.com/probability/mathprob.htmlhttp://www.betweenwaters.com/probab/dice/explain.htmlhttp://www.betweenwaters.com/probab/keys/explain.htmlhttp://www.betweenwaters.com/probab/monty/explain.htmlhttp://www.betweenwaters.com/probab/coingame/explain.html http://teacher.scholastic.com/lessonrepro/lessonplans/grmagam.htmhttp://www.mste.uiuc.edu/reese/birthday/intro.htmlhttp://www.wunderground.comhttp://www.noaa.gov/index.html
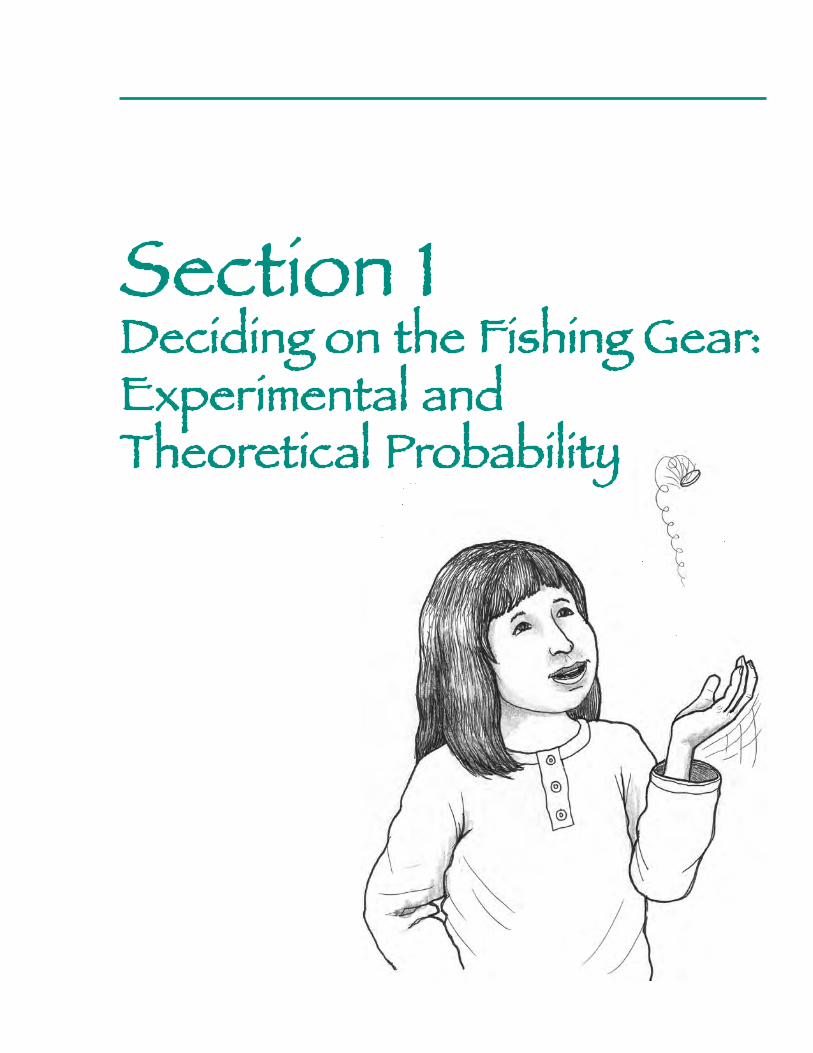
��
Section 1 Deciding on the Fishing Gear: Experimental and Theoretical Probability


��
Activity 1 Preparing to Fish: Experimental and Theoretical Probability
This introductory lesson establishes the background context and the math of the module. It is important for students to understand the relationship between salmon returning to the waters of Alaska, the role of the Alaska Department of Fish and Game (ADF&G), and fishing. To work towards that knowledge, students in today’s lesson will determine which fishing gear they will use to fish.
Word has spread throughout the village that the Smiths have caught a king salmon. A quiet excitement can be felt. Throughout Alaska, people usually relish the return of the salmon. This scenario is simulated in today’s lesson.
Students will be flipping a coin to determine if they should use king or red gear based on limited information. Limited information relates to both prob-ability and statistics. ADF&G samples the waters to determine how many fish are in the river and of what type—the strength and composition of the run. People in the village sample the run by catching fish and spreading the word throughout the village. There are times when king and red salmon mix—which type is running stronger? How do we know?
Today’s mathematical lesson involves two basic ideas—50 ⁄ 50 chance and making interpretations from a small sample. Students will be counting the number of heads and tails out of three flips. Since the outcomes of flipping a coin will either be a “head” or a “tail”; the probability of either one oc-curring on one flip is 1 ⁄ 2. The scenario is set up for students in different groups to come to different interpretations or conclusions after three flips. These differences then need to be reconciled. The reconciling of these dif-ferences brings students to the concept of the Law of Large Numbers. This, in fact, will be the follow-up activity.
Goals• Students are introduced to chance in an either/or situation.• Students interpret data and make a decision from a small-sized
sample.• Students critically analyze their decision and come up with an alterna-
tive plan.
Materials• Poster, The Salmon Life Cycle • Poster, The Five Salmon Species • Transparency, The Salmon Life Cycle• Transparency, Yukon-Kuskokwim Rivers (Where the George Family
Lives)

�� Salmon Fishing
• Transparency, The Five Salmon Species• Transparency, George Family’s Yearly Salmon Catch • Handout, Vocabulary Map (one per student)• Coins—(three coins per pair)• Paper and pencil (one per pair of students)• Butcher paper• Scenario Card (one per each pair)• Student Journals• Excel template
DurationOne or two class periods.
VocabularyChance—unpredictable course of events; possibility; probabilityProbability—the likelihood of an event occurring; the measure of how
likely an event isSample size—number in the sample; quantity of the sampleSampling—choosing a group of people or objects from a larger group to
provide data to make predictions about the larger groupStatistics—a quantity calculated from a set of observations. It is the science
of classifying and interpreting numerically collected information and systematically collected facts.
Experiment—a repeatable operation that results in any one of a set of outcomes
Outcome—one of the possible results of an experimentSample Space—the set of all possible outcomesEvent—object of focus, determined by one or more outcomes, as defined
by the experiment Trial—one round of an experiment
PreparationThe first few lessons are highly linked. Practice using the included Excel worksheet and practice generating graphs (may happen in the next lesson). Read the Alaska Department of Fish and Game mission statement on the next page for background information. Establish the context for this module.
Instructions1. Provide an overview of the module. Briefly introduce salmon fishing in
Alaska, the salmon life cycle, and the types of salmon found in Alaskan waters. Show the posters or the transparencies of The Salmon Life Cycle and The Five Salmon Species.
2. Discuss commercial fishing and the role of ADF&G. Explain that ADF&G monitors the salmon population in Alaska and estimates the amount of salmon caught for each year.
Vocabulary NoteTo.help.keep.these.terms.distinct.
and. well-organized,. think. of. the.
following.examples ..Suppose.you.
want.to.consider.rolling.two.stan-
dard.dice.and.adding.their.results ..
The. experiment. consists. of. roll-
ing.the.two.dice.and.adding.their.
results ..A.trial.would.be.rolling.the.
two.dice.and.adding. their. results.
once ..Note.that.you.could.choose.
to.conduct.50.trials.of.the.experi-
ment.in.an.attempt.to.view.all.the.
outcomes.possible.if.so.desired ..As.
an.example,.suppose.you.conduct.
two.trials.with.outcomes.of.a.1.and.
a.4.or.a.2.and.a.3.on.the.two.dice ..
Since. the.experiment. consists.of.
finding.the.sum.of.the.two.dice,.the.
related.event. (focus.of. the.ques-
tion).from.both.outcomes.would.be.
obtaining.a.sum.of.5 ..
When.the.experiment.is.simplified,.
such.as.flipping.a.coin.once,.many.
of.these.terms.become.confusing.
because. they. all. reduce. to. the.
same.concept ..For. example,. flip-
ping.a.coin.one.time.is.an.experi-
ment ..The.trial.would.be.flipping.the.
coin.one.time.as.well ..An.outcome.
would.be.either.heads.or.tails ..An.
event.would.focus,.for.example,.on.
just.obtaining.tails .

��Acti�ity �: Preparing to Fish
Alaska Department of Fish and Game Mission StatementThe.Alaska.Department.of.Fish.and.Game’s.(ADF&G).mission.is.to.protect,.maintain,.and.improve.the.fish,.game,.and.
aquatic.plant.resources.of.the.state.and.manage.their.use.and.development.for.the.maximum.benefit.of.the.people.of.the.
state,.consistent.with.the.sustained.yield.principle .
Core Services: •. Provide.opportunity.to.utilize.fish.and.wildlife.resources;•. Ensure.sustainability.and.harvestable.surplus.of.fish.and.wildlife.resources;•. Provide.information.to.all.customers;•. Involve.the.public.in.management.of.fish.and.wildlife.resources;.and•. Protect.the.state’s.sovereignty.to.manage.fish.and.wildlife.resources ..
Goals: •. Optimize.economic.benefits.from.fish.and.wildlife.resources .•. Optimize.public.participation.in.fish.and.wildlife.pursuits .•. Increase.public.knowledge.and.confidence.that.wild.populations.of.fish.and.wildlife.are.responsibly.managed ..
(Source.http://www .adfg .state .ak .us/)
Subsistence.hunting.and.fishing.are.economically.and.culturally.important.for.many.Alaska.families.and.communities ..
The.division’s.main.responsibilities.are.to.conduct.research.to.document.subsistence.uses,.estimate.subsistence.harvest.
levels,.and.evaluate.potential.impacts.to.subsistence.users.from.other.uses ..Research.findings.are.compiled.and.analyzed.
to.address.fish.and.wildlife.management.and.regulatory.issues.and.to.provide.information.for.state.and.federal.land.use.
planning.(source.http://www .subsistence .adfg .state .ak .us/) .
3. Discuss subsistence fishing and Yup’ik people. Explain to students the Yup’ik values associated with fishing. The elders say that it is important not to catch too many fish, because that may result in waste. Similarly, catching too few may result in hunger. As an example, share with the class how much salmon the George family catches in a year by show-ing the transparencies of the George Family’s Yearly Salmon Catch and Yukon-Kuskokwim Rivers. Explain that the numbers are an estimate and that it can vary from year to year.
Cultural NoteThe.George.family.has.helped.develop.this.module ..They.know.through.years.of.
fishing.for.their.extended.family.their.preferences.for.types.of.salmon ..Fishing.on.the.
Kuskokwim.River.and.near.their.home.of.Akiachak,.they.know.when.the.different.
types.of.salmon.will.be.arriving.and.the.appropriate.gear.to.catch.them ..As.in.other.
communities,.in.Yup’ik.communities.sampling.is.done.based.on.experience,.prefer-
ence,.and.word.of.mouth ..Typically,.when.someone.catches.a.fish.in.the.villages,.
the.word.is.spread.throughout.the.village.about.the.type.of.fish.caught,.where.it.
was.caught,.and.the.size.of.the.fish,.so.people.know.that.the.time.is.right.to.go.out.
fishing.and.what.type.of.fish.they.can.expect.to.catch ..There.is.anticipation.in.the.
air.of.catching.the.first.king.or.red.of.the.season .
Fig. 1.1: The Yukon, Kusko-kwim, and Nushagak rivers
Bethel
DillinghamManokotakTogiak T
OG
IAK
RIV
ER
Togiak Lake
BRISTOL BAY
NAKNEKLAKE
Akiachak
SleetmuteAniak
Yu
ko
n R
i v
e r
K u s k o k w i m R i v e r
Mu l c
h a t na R
.
Nu
shag
ak
Riv
er
Nuyakuk R.

�� Salmon Fishing
4. Ask the students, “Who knows anything about what type of gear is needed for king or red salmon?” Share information. Depending on your circumstances, you can distinguish between sport fishing (types of lures), subsistence fishing, and commercial fishing.
5. Have students work in pairs, called fishing partners, throughout this module. Each pair will need to receive one coin, paper, pencil, and a Scenario Card. Teacher Note: Alternatively, each pair can use three coins instead of one coin for multiple flips. It is better to use the same type of coins since students may think that their results might differ if they use different types of coins.
6. The Scenario: The fishing partners are preparing to go fishing. There are two types of salmon running in the Kuskokwim River today—kings and reds. We could take either king gear or red gear on the boat, but not both. We need to decide which gear to bring. The fishing teams are going to make a decision based on the results of flipping a coin.
The Rule: If you get more heads than tails, you are going to take the king gear and if you get more tails than heads, you are going to take the red salmon gear. Each team is going to flip the coin three times to decide. Your decision is based on the results (that is, more heads or more tails).
7. One student flips the coin three times (or flip all three coins at once) while the other student records their results. Let students come up with their own strategies to record the coin flips. Students should have no trouble recording the results of their flip. Note: This activity exploits the difference between theoretical and experimental probabilities. Introduce these terms in the next activity, after students have a grasp of probability and the Law of Large Numbers. See Math Note below.
Math NoteTheoretical.probability.is.determined.by.analyzing.the.scenario.or.the.problem.mathematically,.finding.all.possible.outcomes,.
and.calculating.the.probabilities.based.on.the.options ..The.theoretical.probability.of.flipping.a.coin.one.time.is.based.on.
the.possible.outcomes.of.either.a.head.or.a.tail ..This.means.that.the.probability.of.getting.a.head.(for.example).is.1 ⁄ 2.or.
0 .5 ..There.is.a.50-50.chance.of.each.event.happening ..This.is.the.expected.outcome ..Note.that.this.assumes.that.the.coin.
is.fair.and.that.heads.and.tails.are.equally.likely ..
In.this.activity.students.flip.the.coin.multiple.times.and.are.looking.for.which.side.comes.up.more.often ..The.activity.is.
designed.to.have.students.flip.an.odd.number.of.times.so.as.not.to.allow.the.expected.result.of.1 ⁄ 2.heads.or.1 ⁄ 2.tails ..
Thus,.one.group.may.decide.to.use.the.king.gear.while.others.may.decide.to.use.red.gear ..As.students.argue.about.this.
they.may.realize.that.if.we.increase.the.sample.(number.of.flips).the.results.may.become.closer.to.approximating.the.
expected.outcomes .
Establish Norms
��Acti�ity �: Preparing to Fish
8. The fishing partners decide if they are fishing for kings or reds based on the outcome. Have them explain their decisions. Share from each group and keep track on the board. Teams will have different results. Some teams will say we should bring the king gear and the others will say we should bring the red gear.
9. Lead this discussion into chance and probability. Ask the students, “How come some of you are sure that you need to bring king gear while others believe they should bring red gear?” Let students discuss to reconcile their differences. Students’ responses could be to combine all the students’ results or flip more coins. Ask students how many times? What do they think the outcome will be?
10. Ask the students, “could we have made a wrong decision? What could we have done differently? How else can we conduct the experiment?”
11. Have the students come up with an alternative “sampling” plan that could work. Write down the students’ alternative plan on the board, and the class will begin tomorrow’s lesson at that point. Do not tell the students, but in the next activity, the students will be flipping the coin more times to see whether the experimental results get closer to their expected outcome.
Homework/Assessment• Ask students to list five things related to chance or probability in ev-
eryday activities that they see. Modify this word based on the students’ discussion. That is, use the word “probability” if students come up with this word in their discussions, otherwise use the word “chance.”
• Ask the students to fill out the vocabulary map using the word “prob-ability.” These could be discussed at the beginning of Activity 2.
Teacher Note Keep.track.of.any.vocabulary.that.
comes. out. on. a. separate. piece.
of. butcher. paper .. Start. a. class.
list.of.probability.words,.phrases,.
expressions,. and. rules. and. keep.
on.adding.to.this.list.throughout.the.
module ..Use.the.Vocabulary.Map.
whenever.appropriate .
Teacher Note Keep.track.of.any.vocabulary.that.
comes. out. on. a. separate. piece.
of. butcher. paper .. Start. a. class.
list.of.probability.words,.phrases,.
expressions,. and. rules. and. keep.
on.adding.to.this.list.throughout.the.
module ..Use.the.Vocabulary.Map.
whenever.appropriate .
Math NoteWhen.you.analyze.the.probability.of.the.experiment.theoretically,.the.expected.
outcomes.or.the.possible.outcomes.of.flipping.a.coin.once.are.heads.(H).or.tails.
(T) ..The.set.of.all.possible.outcomes.is.called.the.sample.space ..When.a.coin.
is.flipped.two.times,.the.sample.space.is.{HH,.HT,.TH,.TT} ..In.this.activity,.when.
the.students.flip.the.coin.three.times,.here.are.all.the.possible.outcomes.or.the.
sample.space:.{HHH,.HHT,.HTH,.THH,.HTT,.TTH,.THT,.TTT} ..Since.we.are.just.
looking.at.more.heads.or.more.tails,.we.have.four.out.of.eight.outcomes.with.
more.heads.and.the.other.four.out.of.eight.outcomes.with.more.tails ..Students.
will.be.working.on.sample.space.in.Activity.3 ..However,.be.aware.of.this.to.guide.
the.students.and.lead.their.discussion.to.chance.and.probability .
Math NoteWhen.you.analyze.the.probability.of.the.experiment.theoretically,.the.expected.
outcomes.or.the.possible.outcomes.of.flipping.a.coin.once.are.heads.(H).or.tails.
(T) ..The.set.of.all.possible.outcomes.is.called.the.sample.space ..When.a.coin.
is.flipped.two.times,.the.sample.space.is.{HH,.HT,.TH,.TT} ..In.this.activity,.when.
the.students.flip.the.coin.three.times,.here.are.all.the.possible.outcomes.or.the.
sample.space:.{HHH,.HHT,.HTH,.THH,.HTT,.TTH,.THT,.TTT} ..Since.we.are.just.
looking.at.more.heads.or.more.tails,.we.have.four.out.of.eight.outcomes.with.
more.heads.and.the.other.four.out.of.eight.outcomes.with.more.tails ..Students.
will.be.working.on.sample.space.in.Activity.3 ..However,.be.aware.of.this.to.guide.
the.students.and.lead.their.discussion.to.chance.and.probability . Teacher NoteStudents.may.be.confused.about.
why.they.did.not.get.the.expected.
result ..They. might. come. up. with.
responses.such.as:.there.are.more.
kings.in.the.river,.more.reds.in.the.
river,.some.groups.cheated.etc .
Teacher NoteStudents.may.be.confused.about.
why.they.did.not.get.the.expected.
result ..They. might. come. up. with.
responses.such.as:.there.are.more.
kings.in.the.river,.more.reds.in.the.
river,.some.groups.cheated.etc .
Theoretical and
experimental probability

�� Salmon Fishing
Teacher Note: Vocabulary MapThe.vocabulary.map.can.be.used.to.learn.the.vocabulary.words.presented.in.the.module ..Each.box.provides.students.
with.a.different.way.to.think.about.the.word.in.order.to.build.a.deeper.understanding.of.the.word ..
In.addition.to.writing.the.definition.of.the.word.in.their.own.words,.students.can.also.provide.an.example.of.the.word,.
either.in.writing.or.drawing ..
You.may.also.ask.students.to.locate.objects.in.the.room.or.bring.in.objects.from.home.that.might.be.an.example ..These.
can.be.assembled.in.a.vocabulary.artifact.exhibit.that.includes.placards.with.the.vocabulary.words.displayed.by.the.
object ..
Because.many.words.have.different.meanings.depending.on.the.discipline.and.context,.we.have.included.a.box.titled.
“Common.Meaning .”.This.is.aimed.at.accessing.prior.knowledge.of.a.word.that.may.be.known.in.one.context.as.meaning.
one.thing,.but.in.another.it.may.have.a.different.meaning.altogether ..Learning.to.differentiate.between.the.multiple.meanings.
of.words.can.aid.in.reading.
comprehension.across.the.
content. areas .. It. is. also.
good. when. learning. new.
vocabulary.words.to.begin.
with. the. familiar.or. known.
and.then.move.to.the.new.
meaning.of.the.word ..
Finally,.the.“Category”.box.
can. help. students. to. con-
nect.the.word.with.a.group.
of. words. or. a. larger. con-
cept ..This.helps.to.build.the.
conceptual. understanding.
of.the.word.and.its.relation-
ship.to.other.words.that.are.
key.to.the.concept ..
DefinitionIn math, it means ...
A measure of the likelihoodof an event happening.
Common MeaningIt usually means ...
the chance that somethingwill happen.
CategoryIt is a type of ...
mathematical conceptconnected to sample space and equally and not equally likely outcomes.
Example
The probability of getting ahead when flipping a faircoin is 1 in 2, one-half, or 1/2.
Example
The probability of NOTrolling a 1 on a fair six-sided die is 5 in 6,five-sixths, or 5/6.
VocabularyWord
Probability
Fig. 1.2: Example of a vocabulary map

Blackline.Master
��
The Salmon Life Cycle
the eggs in the redd alevin
fry
smolt
adult salmon
female salmon makes her
redd
the female lays her eggs as the male milts

Blackline.Master
�0
NSF Grant - Adapting Yup’ik Elders’ Knowledge Pre-K - 6th Math & Instructional Materials Developmentc

Blackline.Master
��
George Family’s Yearly Salmon Catch
SalmonSpecies
NumberCaught
Approximate Weightof One Fish (lbs.)
Total ApproximateWeight (lbs.)
Chum
King
Red
Silver
55
220
22
15
7
15
5
9
385
3,300
110
135

Blackline.Master
�2
Yukon-Kuskokwim Rivers (Where the George Family Lives)
Bethel
DillinghamManokotakTogiak T
OG
IAK
RIV
ER
Togiak Lake
BRISTOL BAY
NAKNEKLAKE
Akiachak
SleetmuteAniak
Yu
ko
n R
i v
e r
K u s k o k w i m R i v e r
Mu l c
h a t na R
.
Nu
shag
ak
Riv
er
Nuyakuk R.
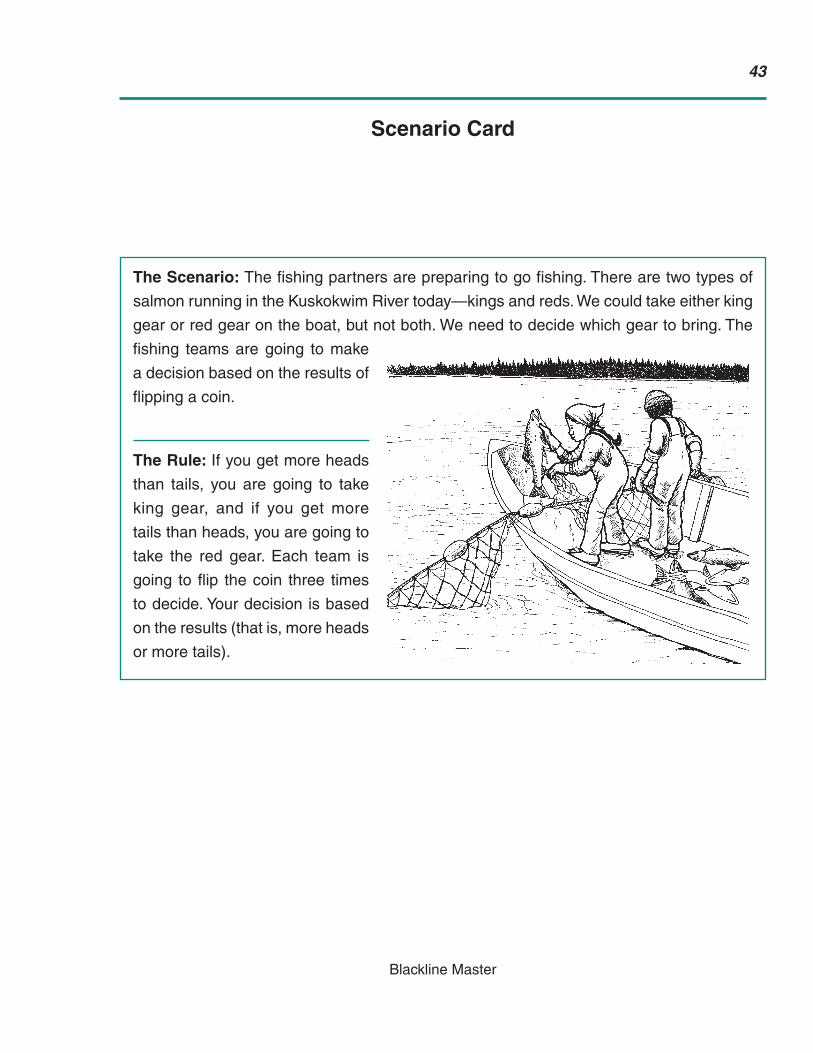
Blackline.Master
��
Scenario Card
The Scenario: The.fishing.partners.are.preparing.to.go.fishing ..There.are.two.types.of.
salmon.running.in.the.Kuskokwim.River.today—kings.and.reds ..We.could.take.either.king.
gear.or.red.gear.on.the.boat,.but.not.both ..We.need.to.decide.which.gear.to.bring ..The.
fishing. teams.are.going. to.make.
a.decision.based.on.the.results.of.
flipping.a.coin .
The Rule: If.you.get.more.heads.
than. tails,. you. are. going. to. take.
king. gear,. and. if. you. get. more.
tails.than.heads,.you.are.going.to.
take. the. red. gear .. Each. team. is.
going. to.flip. the.coin. three. times.
to.decide ..Your.decision.is.based.
on.the.results.(that.is,.more.heads.
or.more.tails) .

Blackline.Master
��
DefinitionIn math, it means ...
Common MeaningIt usually means ...
CategoryIt is a type of ...
Example
Example
VocabularyWord
Vocabulary Map

��
Activity 2 What Type of Gear to Bring: The Law of Large Numbers
In southwest Alaska, the ADF&G typically samples salmon in rivers such as the Nushagak, the Kuskokwim, and the Yukon rivers. “Sampling” means that a subset of the population is counted for a certain period of time and used to estimate the number in the whole population. ADF&G uses several techniques to sample salmon: by counting fish while standing on a tower and looking down at the river, by using sonar devices, through test catches on ADF&G boats, by counting fish from a plane, and by inspecting the catches of commercial fishermen who catch large numbers of fish.
Theoretically, good samples indicate the number and approximate mix of salmon—for example, a sample may show what part of the returning salmon population consists of king salmon in comparison to the rest of the salmon. Following Activity 1, students will decide whether to bring king or red gear based on a larger sample.
Mathematically, in this activity students should see that as the number of coin tosses increases, the experimental results come closer to the theoretical probability. The more times you toss a coin, the more likely the results will approach the theoretical probability, while in a smaller number of trials the results may be more random. This convergence of experimental outcome closely matching the theoretical probability over many trials is called the Law of Large Numbers.
After another round of flips, or as the number of flips accumulates, the experimental results will change. In calculating these results, students will use fractions, decimals, and percentages. Although these topics are not the focus of the module, you can use these opportunities to help students continue practicing with fractions, decimals, and percentages.
Goals• Students develop a bar graph based on the results of the number of
coin flips.• Students will realize that the more times they flip a coin, the closer
they will come to getting half heads and half tails. Conversely, students will realize that flipping a coin a few times will not necessarily result in getting half heads and half tails.
• Students will be able to explain the Law of Large Numbers.

�� Salmon Fishing
Materials• Coins (20 coins per pair of students) • Paper and pencil (one per pair of students)• Large butcher paper sheet displayed with two columns—heads and
tails (one per pair of students)• Class Record Chart• CD-ROM, Excel template• Scenario card from Activity 1• Student Journals
DurationTwo to three class periods.
VocabularyDecimal fraction—a fraction expressed by using decimal representation.
For example, 1 ⁄4 can be represented as 0.25 as a decimal fraction.Favorable outcome—an outcome you are interested in. This is also called
a “success.”Fractions—numerical quantity that can be expressed as a ⁄ b, where a and b
are integers. (An integer is a positive or negative whole number.)Percentages—proportion or rate per hundredPossible outcomes—all the possible results from a single trial of an
experimentRandom—uncertain; by chance, without planRatio—a relationship between two quantities
PreparationHave large butcher paper set up to record the coin flips as bar graphs as noted in instruction #5. Read the Math Note on page 49 and the Teacher Note on page 48 on the Law of Large Numbers.
Instructions1. Review homework activity.
2. Connect back to the last activity by reminding students that some said we should bring king gear while others said we should bring red gear. To come to a class decision, students should have suggested an alternate plan or flipping the coins more times. Tell the students, let’s see what happens when we do that today.
3. Have students work with their fishing partner. Each pair will need to receive 20 coins, paper, pencil, a large butcher paper sheet displaying two columns, and the Scenario Card from Activity 1.
Teacher NoteThe. number. of. coins. given. to.
each. group. could. be. as. low. as.
five,. because. once. all. groups.
have. flipped,. the. results. will. be.
combined .. Ideally,. for. purposes.
of. today’s. lesson,. to. work. with.
large.numbers.requires.a.sample.
size.of.50.or.more.flips,.with.the.
expectation.that.this.will.result.in.
approximately.equal.numbers.of.
heads. and. tails ..Therefore,. the.
number. of. coins. distributed. to.
students.will.vary.depending.on.
the.number.of.students.and.“fish-
ing.groups .”
Depending. on. your. class. size,.
adjust. the. number. of. flips. each.
group.makes.so.that.the.numbers.
are.not.too.large.or.too.small .

��Acti�ity 2: What Type of Gear to Bring: The Law of Large Numbers
Law of
Large
Numbers
4. One student flips the 20 coins while the other student records their results. Alternatively, the pair can take turns flipping (10 coins each) and recording.
5. Bar Graph. After each flip is recorded, have the groups make a bar graph by placing their coins physically on the large butcher paper dis-played in two columns (see Fig. 2.1). One column represents heads and the other column represents tails. As the students are placing their coins, periodically ask questions of the group: What seems to happen as more and more coins are placed on the bar graph? Which gear should we use? Why? Explain your decision. Is your decision the same as the one you made yesterday? Why do you think it is different? Why do you think it is the same? Did you notice any patterns or trends? Can we make a class decision based on the total number of flips that the whole class has made? Will this give us better information on which gear to bring? Teacher Note: Joint activity could occur here. Joint activity can be an effective way for students to learn from the teacher and peers and vice versa. Joint activity is when the teacher performs the same task and tries to solve the problem simultaneously with the students. Students can observe the teacher to see how he or she makes decisions, makes mistakes, and solves problems. Evidence from the project’s qualitative research shows that joint activity enhances student autonomy, respon-sibility, and learning.
1998
LIBERTYUN
IT
E D STATES of AMERIC
A
ONE CENT
1998
LIBERTYUN
IT
E D STATES of AMERIC
A
ONE CENT
1998
LIBERTYUN
IT
E D STATES of AMERIC
A
ONE CENT
1998
LIBERTYUN
IT
E D STATES of AMERIC
A
ONE CENT
1998
LIBERTYUN
IT
E D STATES of AMERIC
A
ONE CENT
1998
LIBERTYUN
IT
ED STATES of AMERIC
A
ONE CENT
1998
LIBERTYUN
IT
ED STATES of AMERIC
A
ONE CENT
1998
LIBERTY
Fig. 2.1: Butcher paper chart for coins
No of flips Outcome, after each flip Heads P(Head) after each flip Tails P(Tail) after
each flip1 H 1 1.00 (1⁄1) 0 0.00 (0⁄1)2 HH 1 1.00 (2⁄2) 0 0.00 (0⁄ 2)3 HHH 1 1.00 (3⁄3) 0 0.00 (0⁄ 3)4 HHHT 0 0.75 (¾) 1 0.25 (1⁄4)5 HHHTT 0 0.60 (3⁄5) 1 0.40 (2 ⁄5)6 HHHTTH 1 0.67 (4⁄6) 0 0.33 (2 ⁄6)7 HHHTTHT 0 0.57 (4⁄7) 1 0.43 (3⁄7)8 HHHTTHTH 1 0.63 (5⁄8) 0 0.38 (3⁄8)9 HHHTTHTHH 1 0.67 (6⁄9) 0 0.33 (3⁄9)10 HHHTTHTHHT 0 0.60 (6⁄10) 1 0.40 (4⁄10)11 HHHTTHTHHTH 1 0.64 (7⁄11) 0 0.36 (4⁄11)12 HHHTTHTHHTHH 1 0.67 (8⁄12) 0 0.33 (4⁄12)13 HHHTTHTHHTHHT 0 0.62 (8⁄13) 1 0.38 (5⁄13)14 HHHTTHTHHTHHTH 1 0.64 (9⁄14) 0 0.36 (5⁄14)15 HHHTTHTHHTHHTHT 0 0.60 (9⁄15) 1 0.40 (6⁄15)16 HHHTTHTHHTHHTHTT 0 0.56 (9⁄16) 1 0.44 (7⁄16)17 HHHTTHTHHTHHTHTTT 0 0.53 (9⁄17) 1 0.47 (8⁄17)18 HHHTTHTHHTHHTHTTTH 1 0.56 (10⁄18) 0 0.44 (8⁄18)19 HHHTTHTHHTHHTHTTTHT 0 0.53 (10⁄19) 1 0.47 (9⁄19)20 HHHTTHTHHTHHTHTTTHTT 0 0.50 (10⁄20) 1 0.50 (10⁄20)
Fig. 2.2: Table of cumulative outcomes and probabilities after each flip

�� Salmon Fishing
6. Demonstrate for the students the Law of Large Numbers using the data in Fig. 2.2 and the line graph representing the data in Fig. 2.3. Have the students interpret both the data and the line graph and describe how they are related to the Law of Large Numbers. Teacher Note: Fig. 2.3 was created to simulate one group’s flips.
7. Have the students (in pairs) generate a rule for the observations they made after flipping the coin a number of times. Ask each pair to share the rule they have generated and then ask the rest of the class whether they agree or disagree with the group and why. For example, students could state that after many trials their experimental result was close to the expected result (50 ⁄ 50). If possible, students should use a computer at this point with the template so that students could do these themselves and report on what they are seeing.
Teacher NoteThe.student.distributions.will.vary ..
Let. students. argue. and. discuss ..
Remind. them. that. small. sample.
sizes. will. vary. considerably. but.
larger. sample. sizes. give. more.
uniform.results.(i .e .,.Law.of.Large.
Numbers) .
Teacher NoteThe.student.distributions.will.vary ..
Let. students. argue. and. discuss ..
Remind. them. that. small. sample.
sizes. will. vary. considerably. but.
larger. sample. sizes. give. more.
uniform.results.(i .e .,.Law.of.Large.
Numbers) .
0.50
0.901.00
0.700.60
0.40
0.20
0.00
0.80
0.30
0.10
1 3 5 7 9 11 13 15 17 19Number of flips
Pro
bab
ility
(af
ter
each
flip
)
P(Heads)
P(Tails)
Fig. 2.3: Graph of cumulative probabilities of heads and tails after each flip
Teacher NoteThe.Excel.template.shows.the.students.a.line.graph.and.how.the.graph.changes.after.each.flip ..As.the.number.of.flips.
increases,.students.will.be.able.to.observe.the.50 ⁄ 50.distribution.from.the.table.and.the.graph ..This.will.be.a.good.place.to.
bring.in.fractions,.decimals,.and.percentages,.depending.on.the.level.of.your.class ..You.could.see.from.the.Excel.template.
that.after.4.flips,.if.the.result.is.HHHT,.then.P(H).=.(1+1+1+0) ⁄4.=.3 ⁄4,.and.similarly.P(T).=.1 ⁄4.(where.P.=.probability,.H.
=.heads,.T.=.tails,.1.represents.that.the.event.occurred,.and.0.represents.that.the.event.has.not.occurred) ..After.8.flips,.
if.the.result.is.HHHTTHTH,.then.P(H).=.5 ⁄8.and.P(T).=.3 ⁄8 ..You.could.see.that.the.sum.of.probabilities.equals.1.in.each.
case ..For.example.after.4.flips,.P(H).=.3 ⁄4.and.P(T).=.1 ⁄4.and.the.sum.(3 ⁄4.+.1 ⁄4).equals.1 ..Students.may.or.may.not.be.
able.to.see.this ..If.they.don’t,.do.not.tell.them—see.whether.they.can.come.up.with.this.in.the.next.period.when.you.use.
the.Class.Record.Chart .

��Acti�ity 2: What Type of Gear to Bring: The Law of Large Numbers
8. Discuss the idea that for each coin toss we do not know whether it will be heads or tails. However, with many trials, a regular pattern of outcomes emerges. This is referred to as the Law of Large Numbers.
Math NoteThe.Law.of.Large.Numbers.states.that.if.you.repeat.an.experiment.a.large.number.
of.times.(say.at.least.50.times),.the.experimental.probability.of.an.outcome.tends.
towards.or.equals.the.theoretical.probability.of.that.outcome ..For.example,.in.this.
activity,.as.the.number.of.flips.increases,.the.distribution.will.get.closer.and.closer.
to.50 ⁄ 50,.according.to.the.Law.of.Large.Numbers ..A.common.misconception.is.
that.as.the.number.of.a.particular.event.increases,.the.next.event.will.not.likely.be.
the.same ..For.instance,.if.there.are.ten.heads.in.a.row,.the.misconception.is.that.
the.next.coin.is.likely.to.come.up.tails ..This.is.clearly.not.the.case.because.each.
event.is.separate.and.independent.and.not.influenced.by.the.previous.event .
This may be a good stopping point for the day. If you choose to stop here, ask pairs to save their recordings for the next lesson and start the next les-son by reviewing this lesson.
9. Below is an example created to simulate a class group. Create one for your class. Have the groups record their results on the Class Record Chart. When all the findings have been recorded, tally the total number of heads and tails tossed by all the groups combined. (Optional: This depends upon your class. Calculate the probability as a fraction, and then convert to equivalent decimal and percentages.) Ask the class what their decision will be now—king or red gear?
GROUP HEADS TAILS TOTAL
1 10 10 20
2 8 12 20
3 15 5 20
4 17 3 20
5 1 19 20
TOTAL 51 49 100
Probability as a Common Fraction 51 ⁄ 100 49 ⁄ 100 100 ⁄ 100
Probability as a Decimal Fraction (rounded)
0.51 0.49 1.00
Chance as a Percentage (Rounded) 51% 49% 100%
Fig. 2.4: Example of Class Record Chart for 20 tosses
Math NoteSince. the. probability. of. an. event.
that. is.certain. is.1.and. the.prob-
ability.of.an.event.that.is.impossible.
is. 0,. the. probability. of. any. event.
varies.between.and.including.0.and.
1,.and.the.sum.of.probabilities.of.
all.possible.outcomes. in.a.single.
event.always.equals.1 .
A.probability.is.a.numerical.mea-
sure.of.the.likelihood.of.an.event ..It.
is.a.number.we.assign.to.an.event ..
For. instance,. say. the. event. that.
more. than. half. the. class. will. be.
present.tomorrow.reflects.the.likeli-
hood.that.this.number.of.students.
will.be.present ..In.other.words:
Probability.=.[success].÷.[total]
OR
Probability.=.[number.of.favorable.
outcomes].÷. [number.of.possible.
outcomes]
OR
Probability. =. [number. of. favor-
able.outcomes].÷.[size.of.sample.
space] .

�0 Salmon Fishing
Teacher NoteIf.you.decide.that.your.students.are.ready.to.work.with.fractions,.decimals,.and.
percentages,.once.they.compute.these.ask.them.whether.they.notice.any.trends.in.
their.chart ..Students.should.be.able.to.see.that.the.sum.of.probabilities.equals.1;.
that.is,.the.total.of.the.fraction.row.as.well.as.the.total.of.the.decimal.row.is.equal.
to.1 ..The.total.of.the.percentages.row.will.equal.100.(signifying.100%.chance) ..
10. Have each pair of students interpret the class record chart. Ask the students, “How would you express P(H), P(T), or the total?” Encourage students to come up with their own definition for probability. Student journal entry could occur here as they write and draw what probability means to them at this stage of the module. This could also be done as a homework activity.

��Acti�ity 2: What Type of Gear to Bring: The Law of Large Numbers
Two Views of “Sampling” the Fishery
1. Fish Sampling on the Nushagak: ADF&G. An Interview with Dana Thomas, Professor and Fish Sampler
In southwest Alaska, along the Nushagak River and other major tributaries that flow into Bristol Bay, the ADF&G has built
fish towers to count the returning salmon. Every 10 minutes of each hour, 24 hours a day during the salmon run, a count is
made on each side of the river of fish passing the tower—upstream and downstream. Dana Thomas spent some time work-
ing as a fish sampler. Below is his account of the experience.
I.would.go.to.the.cabin.on.this.side.of.the.river,.climb.up.it,.turn.on.the.light,.and.count.the.salmon ..The.fish.tend.to.hug.
the.shoreline,.10.to.20.feet,.and.most.rivers.you.can.see.approximately.halfway.across ..Towers.are.generally. located.
downstream.from.the.lakes.that.provide.the.river,.just.below.the.outlet.of.the.lake ..However,.the.Nyukak.River.is.not.like.
that ..[There].you.use.a.tally-wacker;.every.time.you.press.your.thumb,.it.counts.one ..You.literally.count.as.they.pass.by.
the.tower .
In.some.murky.rivers.we.laid.a.white.surface.on.the.bottom.of.the.riverbed.so.that.when.the.fish.crossed.it.they.were.
easier.to.spot ..There.was.a.detectability.issue—[we.were].more.likely.to.see.100%.of.the.reds.coming.up.the.river.as.they.
swim.nearer.to.the.shore.and.not.too.deep.in.the.river,.while.the.kings.prefer.to.swim.in.the.deepest.channels,.which.is.
not.easy.to.see .
On.the.Kvichak.River,.maybe.it.was.1970,.the.Kvichak.had.1.million.fish.pass.the.tower.in.a.single.day ..Estimating.rather.
than.literal.counting.was.required ..The.way.we.were.taught.to.count.[by.estimation].was.to.form.a.mental.image.of.a.rect-
angle.of.50.salmon.each ..This.would.be.a.surface.view ..Once.in.the.river,.the.reds.tend.to.be.in.a.single.layer.of.fish ..The.
Kvichak.could.be.different,.because.there.are.so.many.salmon ..Sometimes.we.would.see.as.few.as.zero.salmon.in.an.
hour,.usually.at.the.beginning.of.the.salmon.season ..Slowly.the.number.of.
salmon.entering.the.river.would.creep.up.and.we.[would].see.as.many.as.
300.in.a.10-minute.period,.on.one.side.of.the.Nushagak.River ..Given..that.
there.are.2.sides.x.6.(6.times.10.equals.60.minutes),.this.would.provide.an.
estimate.of.the.number.of.salmon.entering.the.spawning.grounds ..
In.addition.[to.quantity],.the.ADF&G.wants.to.know.the.age.of.returning.
fish;.that.is,.whether.the.fish.are.three,.four,.or.five-year-olds ..Usually.a.
beach.seine.(large.net).is.used.to.catch.and.sample.the.fish.each.day ..Scale.
samples.are.taken.from.the.fish.to.determine.their.age ..This.procedure.is.
much.like.the.multinominal.sample.in.this.module—a.sample.that.estimates.
the.whole,.and.that.also.estimates.the.number.of.each.age.group .
The.test.boats.are.authorized.to.fish.during.closed.periods.so.that.they.can.
find.out.what.fish.are.in.the.bay.and.where.they.are.located,.to.determine.
the.timing.of.the.run.and.the.age.composition.of.the.run ..Water.temperature.
and.wind.direction.affect.when.the.salmon.enter.the.rivers ..
Another.source.of.information.is.the.catch.itself,.which.is.sampled.at.the.
canneries ..ADF&G.samples.the.caught.fish,.recording.information.on.the.Fig. 2.5: Counting salmon from a fish
tower(continued on next page)

�2 Salmon Fishing
sex,.length,.and.weight.of.each.salmon,.and.collects.scale.samples ..This.procedure.helps.with.possible.sampling.errors.
such.as.smaller.fish.being.the.ones.that.escape.the.fishermen’s.nets .
ADF&G.also.flies.over.the.rivers.to.sample.fish ..For.example,.there.is.a.large.lagoon.close.to.the.mouth.of.the.Igushik.
River,.near.the.site.of.Igushik.(village),.but.before.the.fish.tower ..The.salmon.tend.to.gather,.so.it.is.a.convenient.spot.for.
ADF&G.to.fly.over.and.count.fish.from.the.air ..So,.they.will.fly.to.see.if.the.fish.are.holding.up ..Lastly,.ADF&G.uses.sonar.
counters.as.another.means.to.estimate.the.run .
2. Yup’ik Elders
A.number.of.environmental.factors.influence.the.salmon.catch.in.the.Kuskokwim.Bay.and.Bristol.Bay ..Among.these.are.
wind.direction,.water.temperature,.and.current ..Water.temperature.is.critical.to.the.salmon’s.migration.patterns,.and.to.the.
readiness.of.fish.to.enter.the.bays.and.rivers ..If.the.water.is.too.cold,.salmon.are.less.likely.to.move.into.northern.waters.
and.will.not.leave.the.ocean.for.the.rivers ..The.lower.temperature.could.hinder.their.ability.to.survive,.travel.upriver,.and.
spawn ..Similarly,.the.wind.and.current.affect.salmon’s.readiness.and.ability.to.move.into.the.bays.and.rivers.of.Alaska .
When.wind.blows.in.a.certain.direction,.it.tends.to.push.fish.into.the.bay.and.into.the.mouth.of.the.river ..When.it.blows.
in.the.opposite.direction,.it.tends.to.push.fish.away.from.shore ..According.to.a.group.of.elders.in.southwestern.Alaska,.
descriptions.of.wind.are.based.on.a.person’s.geographical.location.and.also.on.the.direction.a.person.is.facing ..Certain.
terms.convey.these.pieces.of.information,.along.with.the.description.of.the.wind ..Below.is.a.list.of.several.Yup’ik.terms.
mentioned.by.the.elders .
Pamaken.describes.when.the.wind.blows.north.from.behind.the.person .
Negeqvartuq.tells.when.the.wind.is.coming.from.the.north .
Yaknirtuq.describes.the.westerly.wind.coming.downriver .
Kiakenirtuq.is.the.easterly.wind.coming.from.upriver .
Ikaknirtuq.is.the.southerly.wind.but.the.literal.meaning.is.‘wind.coming.from.across.there .’
Kiaknirtuq.and. ikarkinirtuq.literally.define.that.the.person.was.observing.the.weather.by.facing.upriver.(east).or.facing.
across.the.river.(south).from.the.left.side.of.the.riverbank .
Negeq—north
Kiugkeniq—northeasterly
Calaraq.and.Kiugkneq—east
Calaartuq—southeasterly
Annie.Blue.also.recounted.a.story.that.was.first.told.to.her.by.her.mother.and.her.aunt;.the.story.is.about.fishing:
Men.would.go.to.Nulataq.when.fish.were.not.plentiful ..When.the.moon.was.full,.men.would.climb.to.a.high.place.
to.look.for.the.arrival.of.the.fish ..The.men.would.stand.there.at.the.spot.until.they.saw.a.silvery.flashing.on.the.
horizon ..This.was.a.sign.that.the.fish.had.come ..The.men.would.then.go.down.with.a.qayaq.and.gradually.catch.
a.few.fish ..They.then.dug.and.buried.the.fish.underground ..Using.grass.as.a.covering,.the.fish.eggs.would.be.
stored ..The.braided.grass.would.become.rich.with.the.eggs ..They.would.make.some.broth.with.the.eggs.thereafter ..
When.the.southerly.wind.blew,.those.old.men.would.say.that.the.fish.would.be.plentiful ..

��Acti�ity 2: What Type of Gear to Bring: The Law of Large Numbers
Exploration 1:
Two Equally Likely Outcomes The purpose of this exploration is to give students further practice with two equally likely outcomes. In this exploration, students will create a game of chance (a spinner) with two equally likely outcomes and will teach this game to the second-grade students.
Materials• Blank paper circles (one per pair)• Paper clips (one per pair)• Paper and pencil• Student journals
1. Tell the students that each fishing team is going to create a game of chance (a spinner) to teach the second-grade students. Hand out materi-als for making a spinner. Each pair will need to receive a blank paper circle, paper clip, paper, and pencil.
2. Demonstrate how to make a spinner by bending out one leg of the pa-perclip, holding a pencil down over the paper clip at the center of the circle, and spinning it (see Fig. 2.6).
3. Each team’s task is to:• Create a game of chance (a spinner) based on the following sce-
nario. There are an equal number of two types of salmon, king and red, running in the river today.
• Title (name) the game.• Create a scenario card for the game, explaining what the game
is about.• Have a set of rules on how the game is played and how the game
is scored.• In your own words describe how this game is related to
probability.• Teach this game to second-grade students.• Save the spinners for Activity 4.
HomeworkHave students write and draw in their journals what probability means to them.
AssessmentSave the Scenario Card, rules, and game as a way to assess students’ devel-oping understanding of probability.
Teacher NoteIf.students.are.not.familiar.with.a.
spinner,. show. them. a. spinner. or.
picture.of.a.spinner ..Alternatively,.
you.could.create.a. spinner.while.
students. are. creating. theirs .. If.
second-grade. students. are. not.
available. ask. each. pair. to. teach.
the.game.to.the.class.or.to.another.
group ..Allow.different.groups.to.try.
out.their.games ..You.could.use.the.
following.scoring.rubric.as.a.guide-
line.to.assess.students’.games:
Scoring Rubric•. Presentation:.2.points.
•. Title. related. to. theme. of. the.
game:.2.points
•. Create.a.scenario.card. for. the.
game.explaining.what.the.game.
is.about:.3.points .
•. Have.a.set.of.rules.on.how.the.
game. is. played. and. how. the.
game.is.scored:.3.points
•. In.your.own.words.describe.how.
this.game.relate.to.probability:.5.
points
•. TOTAL:.15.points .
Fig. 2.6: A spinner made with a pencil and paperclip

Blackline.Master
��
Class Record Chart
GROUP HEADS TAILS TOTAL
1
2
3
4
5
TOTAL
Probability.as.a.Common.Fraction
Probability.as.a.Decimal.Fraction.(rounded)
Chance.as.a.Percentage.(Rounded)

��
Activity 3 Chances of Being Trapped: A Literacy Activity
Today’s lesson is a literacy activity where a story about a squirrel is read to the students. In this story, the squirrel has a choice of three traps, and it decides which trap it wants to go into. Mathematically, students should be able to see that decisions may or may not be based on probability.
Goals• Students will be able to give a basic definition of probability.• Students will be able to explain the difference between making a choice
and probability.
Materials• Story, Ground Squirrel (one per student)
DurationTwo class periods.
VocabularyChoice—act or power of choosing or selectingMukluks—a tall boot made of sealskin or other animal skin
PreparationRead the story and be familiar with the cultural values embedded in it.
Instructions1. Review the basic definition of probability by asking some students to
explain what probability means to them.
2. Tell your students that they will be reading a story today about a squir-rel. Before they read the story, tell the students that in the story there are three traps to catch the squirrel.
3. Ask the students what is the probability of the squirrel getting caught in one of the traps? List students’ responses on the board.
4. Hand out a copy of the story to each student, and read the story to find out what happens.
Teacher NoteBegin.explaining.probability.as.the.
chance.that.an.event.will.happen ..
Probability. is. the. mathematical.
term. used. for. chance .. Explain.
that.one.of. the. things. that.math-
ematicians.and.scientists.do.is.to.
investigate.the.chance.or.likelihood.
that.something.will.or.will.not.hap-
pen ..This. is. called. the. theory. of.
probability .

�� Salmon Fishing
5. Elicit responses from the students. Is the story related to probability? Lead a discussion on the difference between probability and making a choice.
6. Discuss the Yup’ik values embedded in the story (see the Cultural Note on page 60). Students should see that in the story, the squirrel chooses the trap it wants to go in: it is not chance. Decisions and results may or may not be based on probability.
Literacy Activity
Choice or Chance: There is a difference
This literacy activity further differentiates the meaning of the words choice and chance. The activity is presented in two steps: first it is connected to the Squirrel story and second it connects to students experiences. It also incorporates the use of semantic maps—a cognitive organizer to help students remember a story, sequence events, and organize contrasts and comparisons.
Goals• Students will be able to further differentiate the meaning of the words
choice and chance.• Students will be able to explain the meaning of choice by relating it
to their personal experiences.
Materials• Paper and pencil • Student Journals• Semantic Map 1 (one per student or pair)• Semantic Map 2 (one per student or pair)
Duration
One class period.
Instructions
1. Begin the activity by asking the students: Is there a difference between having a choice and leaving it up to chance? How does chance differ from choice? Elicit responses from the students. If necessary, using a semantic map, model one choice and one chance taken from the responses elicited by the students.
Teacher NoteAccording.to.the.dictionary,.chance.
means,.“the.degree.of.probability.
that. something. will. happen,. or. a.
set. of. circumstances. that. makes.
it. possible. for. something. to. hap-
pen .”.The.major.difference.between.
chance.and.choice.is.active.deci-
sion.making ..Making.a.choice.usu-
ally.involves.a.decision.or.choice,.
which.is.usually.followed.by.action.
on.that.choice .

��Acti�ity �: Chances of Being Trapped
2. Hand out Semantic Map 1, paper, and pencils. Ask the student to use this map to make your argument if the squirrel was trapped by chance or made a choice. Have students make their arguments and explain the differences between the words.
Teacher NoteOur.interpretation.of.the.story.is.that.the.squirrel.chooses.the.person.that.will.take.
its.life ..It.is.not.left.up.to.chance ..The.squirrel’s.decision.is.based.on.the.animal’s.
evaluation.of.the.hunter’s.values—not.wasting,.making.use.of.the.meat.and.hide,.
and.properly.disposing.of.the.remains.to.ensure.the.animal’s.return.to.the.earth ..
See.Ben.Orr’s.interpretation.of.the.story.on.page.60 .
3. Choice, in contrast to chance, is an important point in this story. To encourage a personal response to the story and build on the idea that choice is different from chance, the teacher could model personal choice based on the following questions:
• What was an important or memorable choice that you have made in your life?
• What were your reasons for the choice? • What happened? What were the outcomes of your choice? Add
some details describing each outcome.• What did you learn from making that choice?
Have these questions and Semantic Map 2 on the board or on an over-head transparency for students to see when you are modeling this.
Reason 1:I want to makemy own clothes
I Learned:Sewing takespatience
Reason 2:I didn’t know how Reason 3:
My mom sewsand so do my sisters
Choice: Learning
How to Sew Outcome:First thing wasan apron
Outcome:I gave it to mymother for her birthday
Blue withdaisies
Sewing iscreative
She was pleased and proud
1
2
3
4
5a
5b
6b6a
7b
7a
Fig. 3.2: Semantic map 2 (example)
Reason 1: Choice
Reason 1: Chance
Reason 2: Chance
Reason 3: Chance
Reason 2: Choice
Reason 3: Choice
Squirrel Story: Choice or Chance
Fig. 3.1: Semantic map 1
�� Salmon Fishing
4. After brainstorming ideas and recording them on the semantic map, demonstrate how to link the ideas together into a short story.
Here is an example:
a. Begin by organizing the ideas for the story, giving each box a number. The first (topic) sentence should be the idea in the center of the semantic map. (1) When I was 13, I decided to learn how to sew.
b. Next, construct sentences using the three reasons.(1) One reason I wanted to learn to sew was …(2) Another reason …(3) The most important reason was …
c. Construct sentences that link the outcome statements.(1) My first project was learning how to sew an apron.(2) I chose blue fabric that had a daisy print.(3) I decided to give it to my mom for her birthday.(4) She was pleased and proud because I sewed it.
d. Finally, construct the sentences that tell what you learned from your choice.(1) I learned that …
5. After you have modeled/demonstrated the example, hand out Semantic Map 2 and ask the students to create their own maps based on their personal experiences. Remind the students to use the questions to guide them.
6. Once students create their maps, ask them to share their experiences. Once students share their experiences, ask them how they are going to organize their experiences as a story. Let students share their ideas and thoughts orally by asking questions such as does the story make sense or are there other ideas that could make the story better.
7. After this peer debriefing session, students can then construct the sen-tences for their stories. Then have students share their stories with the class.
8. End the activity by asking students to record in their journals “I learned that the difference between chance and choice is …”

��Acti�ity �: Chances of Being Trapped
Exploration 2:
Three Equally Likely OutcomesThis exploration focuses on providing students practice on three equally likely outcomes. They will be creating a game of chance (a spinner) with three equally likely outcomes to teach the second-grade students.
Materials• Blank paper circles (one per pair)• Paper clips (one per pair)• Paper and pencil• Student journals
Tell the students that each fishing team is going to create a game of chance (a spinner) to teach the second-grade students. Hand out materials for mak-ing a spinner. Each pair will need to receive a blank paper circle, paper clip, paper, and pencil.
Each team’s task is to:• Create a game of chance (a spinner) based on the following scenario.
There are an equal number of three types of salmon – king, red, and pink – running in the river today.
• Title (name) the game.• Create a scenario card for the game explaining what the game is
about.• Have a set of rules on how the game is played and how the game is
scored.• In your own words describe how this game is related to probability.• In your own words explain how this game is same or different from
the game/spinner that you created in further explorations 1.• Is the game you created similar or not similar to the ‘ground squirrel’
story? Explain your answer.• Teach this game to second-grade students.• Save the spinners for Activity 4.
Homework/Assessment Have students write in their journals the difference between probability and making a choice.
Teacher NoteCreate.a.spinner.with.three.equally.
likely.outcomes.while.students.are.
creating. theirs,. so. that. students.
can.observe.if.necessary ..
You.could.use.the.following.scor-
ing.rubric.as.a.guideline.to.assess.
students’.games:
Scoring Rubric
•. Presentation:.3.points
•. Title. related. to. theme. of. the.
game:.1.point
•. Create.a.scenario.card. for. the.
game.explaining.what.the.game.
is.about:.3.points
•. Have.a.set.of.rules.on.how.the.
game. is. played. and. how. the.
game.is.scored:.3.points
•. In.your.own.words.describe.how.
this.game.relate.to.probability:.5.
points
•. Explanation.of.how.the.spinner.
is. the. same. or. different. from.
the.one.they.created.in.Further.
Exploration:.1.to.5.points
•. Explanation.of.how.the.spinner.
is.same/different.to.the.‘ground.
squirrel’.story:.5.points
•. TOTAL:.25.points

�0 Salmon Fishing
Cultural Note: Ground Squirrel StoryContributed by Ben Orr, Folklorist
There.is.a.type.of.Yup’ik.story.that.follows.a.motif.that.can.be.described.thus:.a.common.game.animal.selects.the.hunter-
gatherer.that.will.kill.and.process.its.flesh.and.byproducts.on.the.basis.of.the.fitness.of.the.hunter-gatherer.and.his.or.
her.willingness.to.show.respect.and.to.“recycle”.the.animal ..I.have.heard.similar.variants.of.this.story.involving.game.
animals.like.seals,.needlefish,.and.now.ground.squirrels .
The.squirrel,.who.is.the.intended.prey.of.spring.trapping,.surveys.the.various.women.who.seek.to.trap.it ..One.is.squared-
away,.properly.attired,.and.maintains.her.traps.in.good.order,.promising.by.her.appearance.and.equipment.that.she.will.
properly.use.its.meat.and.byproducts.and.not.waste.anything ..The.implication.is.that.the.other.women.will.prove.to.be.
lazy.and.careless.of.its.remains ..It.is.into.her.trap.that.he.enters ..True.to.appearances,.she.takes.the.flesh.(to.eat).and.
the.hide.(for.clothing).and.returns.the.remains.(the.guts,.etc .).to.the.river.instead.of.simply.throwing.them.on.the.ground.
or.allowing.them.to.rot ..In.Yup’ik.cosmology.returning.animal.remains.(bladders,.bones,.etc .).to.the.sea,.a.designated.
pond,.or.the.river.is.tantamount.to.proper.and.respectful.burial.or.disposal.and.it.necessary.for.recycling .
Therefore,.the.animal.is.pleased.with.his.treatment.by.the.woman,.and.the.suggestion.is.that.it.will.return.again.to.her.
in.its.recycled.(reincarnated).form.(“Come.quickly.back.to.me.again!”) .
The.cultural.values.and.morals.that.are.reflected.here.are:
•. Reincarnation/recycling:.animals.“choose”.to.be.taken.and.the.same.animal.may.be.taken.again.and.again ..Thus.it.
is.essential.to.treat.animals.with.respect.and.to.properly.use.its.flesh.and.byproducts ..Lazy.and.careless.people.who.
allow.food.to.rot.end.up.not.ever.catching.anything .
•. Animals.mirror.humans:.they.have.intelligence.and.volition ..They.are.not.inert.resources.to.be.exploited,.but.willing.
beings.who.collaborate.with.deserving.humans.in.hunting.and.gathering.activities ..The.universe,.or.ella,.is.largely.
sentient .
•. Successful.hunters.and.gatherers.must.be.energetic,.skilled,.hard-working,.and.squared-away:.Animals.don’t.give.
themselves.to.lazy,.sloppy.people.who.lack.the.requisite.skills.for.hunting.and.gathering.and.fail.to.show.respect .
•. The.importance.of.respect.in.social.and.animal.relations:.Yupiit.believe.that.the.human.thought.is.very.potent.and.the.
way.we.treat.and.relate.to.others.(both.humans.and.animals,.even.the.nonsentient.universe),.determines.in.large.
part.the.quality.and.success.of.our.life.and.endeavors .
Julia.Apalayaq’,.an.elder.from.Manokotak,.talked.about.the.knowledge.that.animals.have.about.a.person’s.loss.of.a.
kin.or.future.loss.of.a.kin ..She.said.that.“no.matter.how.a.person.is.a.successful.hunter.or.gatherer,.an.animal.knows.
that.you.have.a.deceased.kin.or.somebody.in.your.close.family.is.going.to.pass.on;.the.squirrel.would.cover.the.trap.
or.move.it.and.prevents.you.from.catching.any .”.She.also.says.that.it.is.not.just.squirrels,.but.beavers.and.belugas.also.
have.the.same.kind.of.knowledge ..The.elders.know.this.from.experience.and.from.the.knowledge.passed.down.from.
generations .

Blackline.Master
��
Semantic Map 1
Reason 1: Choice
Reason 1: Chance
Reason 2: Chance
Reason 3: Chance
Reason 2: Choice
Reason 3: Choice
Squirrel Story: Choice or Chance

Blackline.Master
�2
Reason 1:
I Learned:
Reason 2:
Reason 2:
Choice:
Outcome:
Outcome:
Semantic Map 2
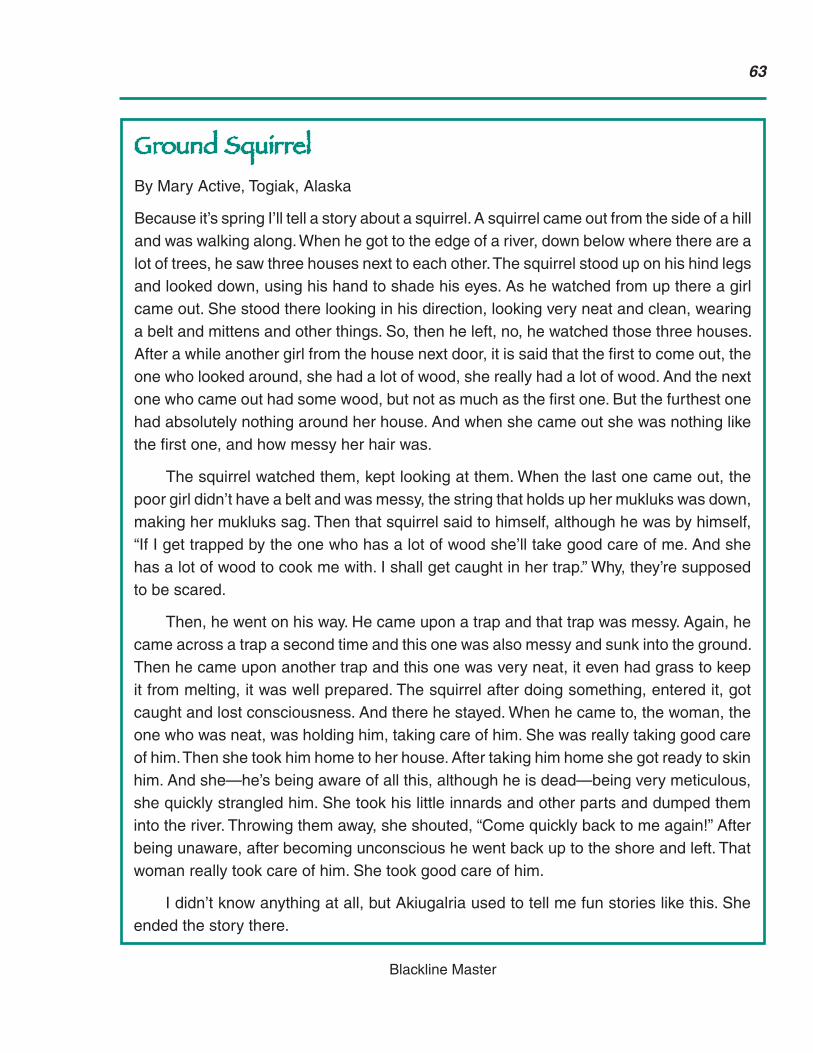
Blackline.Master
��
Ground SquirrelBy.Mary.Active,.Togiak,.Alaska
Because.it’s.spring.I’ll.tell.a.story.about.a.squirrel ..A.squirrel.came.out.from.the.side.of.a.hill.and.was.walking.along ..When.he.got.to.the.edge.of.a.river,.down.below.where.there.are.a.lot.of.trees,.he.saw.three.houses.next.to.each.other ..The.squirrel.stood.up.on.his.hind.legs.and.looked.down,.using.his.hand.to.shade.his.eyes ..As.he.watched.from.up.there.a.girl.came.out ..She.stood.there.looking.in.his.direction,.looking.very.neat.and.clean,.wearing.a.belt.and.mittens.and.other.things ..So,.then.he.left,.no,.he.watched.those.three.houses ..After.a.while.another.girl.from.the.house.next.door,.it.is.said.that.the.first.to.come.out,.the.one.who.looked.around,.she.had.a.lot.of.wood,.she.really.had.a.lot.of.wood ..And.the.next.one.who.came.out.had.some.wood,.but.not.as.much.as.the.first.one ..But.the.furthest.one.had.absolutely.nothing.around.her.house ..And.when.she.came.out.she.was.nothing.like.the.first.one,.and.how.messy.her.hair.was .
. The.squirrel.watched.them,.kept.looking.at.them ..When.the.last.one.came.out,.the.poor.girl.didn’t.have.a.belt.and.was.messy,.the.string.that.holds.up.her.mukluks.was.down,.making.her.mukluks.sag ..Then.that.squirrel.said.to.himself,.although.he.was.by.himself,.“If.I.get.trapped.by.the.one.who.has.a.lot.of.wood.she’ll.take.good.care.of.me ..And.she.has.a.lot.of.wood.to.cook.me.with ..I.shall.get.caught.in.her.trap .”.Why,.they’re.supposed.to.be.scared .
. Then,.he.went.on.his.way ..He.came.upon.a.trap.and.that.trap.was.messy ..Again,.he.came.across.a.trap.a.second.time.and.this.one.was.also.messy.and.sunk.into.the.ground ..Then.he.came.upon.another.trap.and.this.one.was.very.neat,.it.even.had.grass.to.keep.it.from.melting,.it.was.well.prepared ..The.squirrel.after.doing.something,.entered.it,.got.caught.and.lost.consciousness ..And.there.he.stayed ..When.he.came.to,.the.woman,.the.one.who.was.neat,.was.holding.him,.taking.care.of.him ..She.was.really.taking.good.care.of.him ..Then.she.took.him.home.to.her.house ..After.taking.him.home.she.got.ready.to.skin.him ..And.she—he’s.being.aware.of.all.this,.although.he.is.dead—being.very.meticulous,.she.quickly.strangled.him ..She.took.his.little.innards.and.other.parts.and.dumped.them.into.the.river ..Throwing.them.away,.she.shouted,.“Come.quickly.back.to.me.again!”.After.being.unaware,.after.becoming.unconscious.he.went.back.up.to.the.shore.and.left ..That.woman.really.took.care.of.him ..She.took.good.care.of.him .
. I.didn’t.know.anything.at.all,.but.Akiugalria.used.to.tell.me.fun.stories.like.this ..She.ended.the.story.there .


��
Section 2 Catching Multiple Salmon in a Row: Sample Space


��
Activity 4 Catching Multiple Salmon in a Row: Creating Sample Spaces
Over the course of the fishing season, the odds of catching a particular species of salmon vary from catch to catch and from day to day, depending on the number of each type of salmon in the river. In comparison, the odds of getting a head when flipping a coin remain fairly constant over time. A coin always has two sides, thus there is theoretically a 50 ⁄ 50 chance of a head. However, while the number of sides to a coin remains constant, the number of salmon available varies throughout the season.
In this activity, each toss of the coin is taken to represent the event of catching a particular type of salmon. Continuing with the scenario from Activities 1 and 2, let us assume that a head represents a king salmon and a tail represents a red salmon. We also assume that the fisherman catches one salmon per toss, and the toss represents only the species of salmon caught. The actual catch of a fisherman—novice or expert—fishing on a given day, and at a particular location, could be quite different, both in number and in species.
This activity will allow students to figure out the likelihood of catching two or three of the same kind of salmon in a row. Mathematically, the idea behind today’s activity is to theoretically analyze the set of possible outcomes in a given situation. The set of all possible outcomes of an experiment is called the sample space. By simulating two or three coin flips, students should be able to explain the possible outcomes of catching two or three salmon in a row, given a specific situation that two types of salmon—king and red—are running in the river. Note that simulating the situation this way assumes that all salmon are equally likely to be caught and there are an equal number of each of the salmon types.
Goals• Students gain a basic understanding of sample space for two or three
equally likely events.• Students will be able to explain the difference between experimental
probability and theoretical probability.
Materials• Coins (eight coins per pair of students)• Deck of cards• Paper and pencil (one per pair of students)

�� Salmon Fishing
• Dice (two per pair of students)• Worksheet, Possible Outcomes• Scenario Card (one per each pair)• Spinners from Exploration 2
DurationTwo or three class periods.
VocabularyExperimental Probability—probability determined by conducting trials of
an experimentOdds—likelihood or the possibility of an event occurringSample Space—the set of all possible outcomes from a single trial of an
experimentTheoretical Probability—probability determined by analysis of all possible
outcomes of an experiment
PreparationRead the Math Notes and Teacher Notes. Practice generating sample spaces for different situations, such as a spinner with two and three equally likely outcomes.
Instructions1. In Activities 1 and 2, we flipped coins, heads for king gear and tails for
red gear. Remind the students that the more times they flipped coins, the closer to approximately the same number of heads (kings) and tails (reds). Ask the students what are the possibilities when we flip a coin once? Demonstrate this by flipping a coin. There are two possibilities or possible outcomes—heads or tails.
2. Have the students get into pairs (fishing teams). Hand out four sets of two coins for a total of eight coins for each pair of students. Ask the students to arrange the coins to show all the combinations of fish if they caught two fish in a row. One student writes down or draws each possibility. The other student reports back to the class. Ask the class if they agree that all possibilities have been shown.
3. If students are confused, demonstrate using a deck of cards. Shuffle the deck. Ask the students what are the different card colors (black and red). Ask the students what are the possible card colors if you pick two cards. Students should be able to respond “black and black, black and
Math NoteThe.set.of.all. possible.outcomes.
is. called. the. sample. space ..The.
sample.space.is.obtained.by.theo-
retically. examining. all. the. possi-
bilities.for.an.event ..The.probability.
calculated.using.the.sample.space.
(set.of.possible.outcomes).is.called.
theoretical. probability,. whereas.
the.experimental.probability.is.the.
probability. that. is. calculated. by.
conducting.trials.of.an.experiment ..
This.may.be.a.good.place.to.intro-
duce.the.vocabulary.of.theoretical.
and.experimental.probabilities ..
Sample Space

��Acti�ity �: Catching Multiple Salmon in a Row
red, red and black, and red and red.” Explain that the set of all possible outcomes is called the sample space.
4. Explain to the students that today you are going to continue to explore fishing and probability.
The Scenario: The river or bay is filled with an equal number of kings and reds (change the scenario to fit your circumstances such as the type of fish in the river). Each of you has a fishing pole and a lure. This lure is used for both kings and reds.
5. Use problem solving strategies (see pages 11 to 13).
6. To review, ask the students how many different outcomes they have when they flip the coin once. (There are two outcomes: head and tail.) Hand out dice, one per student, and ask them how many possible outcomes are there if you roll a die? (There are six possible outcomes: 1, 2, 3, 4, 5, or 6.) Have the students report their answers and make sure that the students understand possible outcomes before proceeding. Explain that the set of all possible outcomes is called the sample space.
7. Hand the Possible Outcomes Worksheet to each pair. How many dif-ferent possible outcomes will you have with three coins or what are the possibilities if you are catching three salmon in a row?
8. Have the pairs compile a list of all the options possible. At the bottom of the worksheet have the students explain how they know if they have them all and how they find out. For example, when you flip the coin once, you have two possibilities, heads (H) or tails (T). See the table below for sample spaces for one, two, and three coins.
NUMBER OF COINS SAMPLE SPACE1 H
T2 HH
TTHTTH
3 HHHTTTHTTHHTTHHTTHHTHTHT
Fig. 4.1: sample space worksheet
Teacher NoteFlipping.three.coins.in.this.activity.
is.different.from.the.experiment.in.
Activities.1.and.2.to.decide.whether.
to.bring.king.or.red.gear.because.
we.are.asking.a.different.question.
now ..Before.we.asked.do.we.get.
more.heads.or.more.tails.when.we.
flip.a.coin.three.times.(or.flip.three.
coins)?.However,.now.we.are.ask-
ing.what.are.all.the.different.pos-
sibilities.when.we.flip.a.coin.three.
times.(or.flip.three.coins)?.Here.the.
order.is.important .
Teacher NoteSample.space.for.flipping.two.coins.
is.{HH,.HT,.TH,.TT} ..Even.though.
the.probability.of.HT.and.TH.are.
the.same,.since.the.order.matters.
we.consider.the.outcomes.as.dif-
ferent ..For.example,.when.catching.
two.salmon.in.a.row,.it.is.possible.
to.catch.a.king.first.and.a.red.next.
and.vice.versa .
Problem-solving
Strategies

�0 Salmon Fishing
For.three.coins.or.three.flips:
Coin 1 Coin 2 Coin 3
H H H
H T H
T H H
T T H
H H T
H T T
T H T
T T T
Coin 1 Coin 2 Coin 3
H
H T
H
T H
T
H H
T T
T H
T
Teacher NoteHere.are.some.possible.ways.that.students.may.think.about.this.problem .
For.two.coins.or.two.flips
Coin 1 Coin 2
H H
T T
Coin 1 Coin 2
H H
H T
T H
T T
Coin1 Coin 2
H
H
T
H
T
T
9. Have the students share both their results and how they determined the total number of possible outcomes. Emphasize that the list of all possible outcomes is called the sample space.
10. Have the students take out the spinners with two equally likely outcomes that they made in Exploration 1, Activity 2. Ask the students, what is the sample space for the spinner if you spin it once, spin it two times, and spin it three times? List students’ responses on the board and ask the class whether they agree or disagree and to explain their responses.
Math NoteNotice.from.the.Possible.Outcomes.Worksheet.that.mathematically.it.could.be.explained.that.when.two.coins.are.flipped.
the.number.of.possible.outcomes.are.22,.where.2.in.the.base.represents.two.possibilities.and.the.exponent.2.represents.
two.coins ..Similarly,.when.three.coins.are.flipped.the.number.of.possible.outcomes.equals.23.where.2.represents.two.
possibilities.and.3.represents.the.number.of.coins ..In.summary,.for.n.number.of.coins,.the.number.of.possible.outcomes.
in.the.sample.space.would.be.2n .
Fig. 4.2: Possible ways to think about sample space

��Acti�ity �: Catching Multiple Salmon in a Row
11. Ask the students to include the information they learned about sample space as they revise their game to make it more interesting for second graders.
12. Have the students share their strategies when appropriate and have them try out their new game with second graders. Have students do the challenge below if you feel it is appropriate.
This may be a good place to stop for the day.
13. Challenge: Finding the sample space for a spinner with three equally likely outcomes. Have students take out the spinners with three equally likely outcomes that they made in Exploration 2, Activity 3. Ask the students to find the sample space for this spinner if they spin it once, two times, and three times. List the students’ responses on the board and ask different groups to explain how they determined the total pos-sible outcomes.
13. Save the Possible Outcomes Worksheet for the next activity.
Fig. 4.3: Exploring the sample space for rolling out two dice
Math NoteThe.spinners.created.by.the.students.have.two.equally.likely.outcomes,.the.same.as.the.coin.flips,.therefore.the.sample.
space.is.the.same ..Similarly,.we.could.see.that.for.one.spin,.the.number.of.outcomes.in.the.sample.space.is.21,.and.for.
two.spins.22,.and.for.three.spins.23 .
Students.may.not.be.able.to.see.the.mathematical.relation ..However,.students.should.be.familiar.with.listing.the.possible.
outcomes.or.the.sample.space.for.two.equally.likely.outcomes ..

�2 Salmon Fishing
No. of spins Sample space
1 R,.K,.C
2 RR,.RK,.RC,.KR,.KK,.KC,.CR,.CK,.CC
3 RRR,.RRK,.RRC,.RKR,.RKK,.RKC,.RCR,.RCK,.RCC,.KRR,.KRK,.KRC,.KKR,.KKK,.KKC,.
KCR,.KCK,.KCC,.KCR,.KCK,.KCC,.CRR,.CRK,.CRC,.CKR,.CKK,.CKC,.CCR,.CCK,.CCC
Fig. 4.6. A sample space for the spinner with three equally likely outcomes—red (R), king (K), or chum (C) salmon
Mathematically,. when. a. spinner. with. three. equally.
likely.outcomes.is.spun.once,.the.number.of.possible.
outcomes.are.31,.where.3.in.the.base.represents.three.
possibilities.and. the.exponent.1. represents.one.spin ..
Similarly.when.it.is.spun.twice,.the.number.of.possible.
outcomes.equals.32,.where.3.represents.two.possibilities.
and.2.represents.the.number.of.spins ..In.summary,.for.n.
number.of.spins,.the.sample.space.would.be.3n .
R
C
1.spin
K
3.spins
R
C
K
R
CK K
R
C
KR
C
KR
C
KR
C
KR
C
KR
C
R
CK
KR
C
KR
C
KR
C
R
CK
2.spins
R
C
K
R
CK
R
CK
R
CK
Fig. 4.7: Tree diagrams representing the sample spaces in Fig. 4.6
Math NoteNumber of
spinsSample Space
1 K or R
2 KK, KR, RK, RR
3 KKK, KKR, KRK, KRR, RKK, RKR, RRK, RRR
Fig. 4.4: Sample space for a spinner with two equally likely outcomes: king (K) and red (R) salmon
K
R
K
RK
R
2.spins
K
R
1.spin
K
R
KRKR
K
R
K
R
KRKR
3.spins
Fig. 4.5: Tree diagrams representing the sample spaces in Fig. 4.4

��Acti�ity �: Catching Multiple Salmon in a Row
14. Practice: Hand out two dice per pair of students. Have the pairs list the possible outcomes or find the sample space for the sum of the numbers from rolling two dice.
15. Have the pairs share their results and procedures. Ask the class how do they know that they have all the possible outcomes. If students have not done so, you may want to model how to set up the sample space in a systematic way.
Homework/Assessment Have the students try out the following problem. Encourage students to use problem-solving strategies when they are answering the question. For the solution, see Teacher Note on the next page.
Suppose you have a four-sided die and an eight-sided die. The result of rolling the four-sided die is a 1, 2, 3, or 4. The result of rolling the eight-sided die is a 1, 2, 3, 4, 5, 6, 7, or 8. Consider the experiment of rolling the two dice and adding the results together to answer the following questions:
1. What is the sample space for the experiment? Explain what strategy you used to find your answer.
2. What are all the possible ways you could roll each of the outcomes in the sample space? Make a systematic list or develop a chart to find your answers.
3. Using your list or chart of all the possible rolls, find the probability for rolling each of the possible outcomes in the sample space. Are your probabilities theoretical or experimental probabilities? Explain your reasoning.
4. Are the outcomes in the sample space equally likely or not equally likely? Explain your reasoning.

�� Salmon Fishing
Teacher NoteHere.is.the.solution.to.this.problem.for.your.reference ..
1 .. The.sample.space.is.{2,.3,.4,.5,.6,.7,.8,.9,.10,.11,.12} ..One.strategy.for.finding.the.sample.space.is.to.note.that.if.the.
smallest.outcome.from.each.die.is.added,.the.result.is.1.+.1.=.2,.which.is.the.smallest.number.in.the.sample.space,.
and.the.largest.would.be.4.+.8.=.12 ..The.other.outcomes.in.the.sample.space.are.between.these ..Note.that.the.sample.
space.for.rolling.and.adding.the.four-sided.and.eight-sided.dice.is.the.same.as.the.sample.space.for.rolling.and.adding.
two.six-sided.dice .
2 .. Here.are.all.the.possible.rolls:
+ 1 2 3 4 5 6 7 8
1 2 3 4 5 6 7 8 9
2 3 4 5 6 7 8 9 10
3 4 5 6 7 8 9 10 11
4 5 6 7 8 9 10 11 12
Fig. 4.8: Sample space for rolling a four-sided and an eight-sided die and adding the results
Some.students.may.develop.a.systematic.list ..For.example,.students.might.reason.that.you.could.roll.a.1.on.the.four-
sided.die.and.then.any.of.the.eight.outcomes.on.the.eight-sided.die,.thereby.rolling.1.+.1.=.2,.1.+.2.=.3,.1.+.3.=.4,.etc ..
Then.students.could.list.the.different.possibilities.for.rolling.a.2.on.the.four-sided.die.and.then.any.of.the.eight.outcomes.
on.the.eight-sided.die,.thereby.rolling.2.+.1.=.3,.2.+.2.=.4,.2.+.3.=.5,.etc ..
3 .. P(2).=.1 ⁄ 32,.because.out.of.the.32.possible.outcomes.of.the.dice.(see.chart.above),.one.outcome.is.a.2 ..Similarly,.P(3).
=.2 ⁄ 32,.P(4).=.3 ⁄ 32,.P(5).=.P(6).=.P(7).=.P(8).=.P(9).=.4 ⁄ 32,.P(10).=.3.⁄.32,.P(11).=.2.⁄.32,.and.P(12).=.1.⁄.32 ..Note.that.
if.the.probabilities.are.added.together,.they.equal.32.⁄.32.=.1 ..The.probabilities.are.theoretical.since.they.are.determined.
by.analysis.of.all.possible.outcomes.of.the.experiment.of.rolling.the.four-sided.and.eight-sided.dice.and.not.on.data.
from.an.actual.experiment.(e .g .,.rolling.the.dice.50.times.and.noting.the.sum.for.each.roll) .
4 .. The.outcomes.in.the.sample.space.are.NOT.equally.likely.because,.for.example,.P(2).=.1.⁄.32.but.P(5).=.4.⁄.32.(i .e .,.the.
probabilities.are.not.equal) ..Note,.however,.that.some.of.the.outcomes.in.the.sample.space.do.have.the.same.probability.
of.occurring.(see.part.3.above),.but.in.general,.the.outcomes.in.the.sample.space.are.not.equally.likely .

Blackline.Master
��
Possible Outcomes Worksheet
Number of Coins Sample Space
1
2
3

Blackline.Master
��
The Scenario: The.river.or.bay.is.filled.with.an.equal.number.of.
kings.and.reds ..Each.of.you.has.a.fishing.pole.and.a.lure ..This.
lure.is.used.for.both.kings.and.reds ..
Scenario Card

��
Activity 5 Catching Multiple Salmon in a Row: Finding the Probabilities
How can someone know the odds of catching a king salmon in the Kuskokwim River? How can the class figure out what the chances are? One way people learn is through experience. The Yup’ik people draw upon what they have learned from thousands of years of fishing.
Another way to learn is through statistical methods. The ADF&G has con-ducted a great deal of research to estimate the number of salmon that swim through the river each season. The ADF&G estimates the total number of salmon and the number of each type of salmon—king, silver, red, pink, chum—that pass through the river.
There are five types of salmon that travel through Alaska rivers, but on a given river as few as two or three types of salmon may be measured in significant numbers. Some rivers have predominantly one species only. Sampling is used to help estimate the size of the run at a certain time or the approximate number of salmon in the river at a certain hour or day. In this way, it can be used to provide a “sample” of information about the fish population in the area as a whole during the fishing season.
So far we have explored the likelihood of two types of salmon returning to the river. This is important for purposes of managing a fishery. Salmon fishing is a major commercial industry in Alaska’s coastal communities, and both ADF&G and villagers catching the salmon are interested in the likelihood of different types of salmon reaching the spawning grounds and being caught in the net. Probability is a mathematical tool that ADF&G uses to determine the likelihood of the “right” number of salmon reaching the spawning grounds.
Mathematically, in this activity students will be calculating the probability for different situations that they have explored in Activity 4 when they cre-ated various sample spaces.
Goals• Students will be able to calculate the probability for a given situation
using the sample space.• Students will be able to calculate the probability for the complement
of an event.

�� Salmon Fishing
Materials • Transparency, Possible Outcomes Worksheet (from Activity 4)• Dice• Spinners• Student journals
DurationTwo class periods.
VocabularyAt least—no less thanAt most—no more than; maximumComplement—making up a whole or making completeExactly—accurately; definitelyLess than—below, lowerMore than—above, over
PreparationPractice generating probability questions for various sample spaces that students created in Activity 4. For example, the possible outcomes for flip-ping two coins in a row are HH, TH, TH, and TT. However, calculating the probability depends on the question being asked. Generate extra questions in addition to the questions outlined in the activity.
Instructions1. Connect to last activity (Activity 4) on sample space by asking students
to explain sample space (all possible outcomes) in general. Review the homework activity (four- and eight-sided dice) by asking the class what is the sample space when you roll two dice. Have the students explain how they know if they have all the possible outcomes and how they found out. Note: Two additional questions on sample space are given at the end of this activity (page 80). If you feel your students need extra practice generating sample questions, you may want them to try these problems before you move on to today’s activity.
2. Have students break into pairs (fishing partners). Take out the Possible Outcomes Worksheet from Activity 4. Before posing the questions, ask students to remind you what probability means to them. Ask the fol-lowing questions (or put them on an overhead transparency): When we flipped the coin twice, or when catching two salmon in a row, what was the probability that two heads (kings) appeared? (1 ⁄4). What was the probability that we caught at least one king? (3 ⁄4). What was the prob-
Cognitive Modeling

��Acti�ity �: Finding the Probabilities
ability that we caught exactly one king? (2 ⁄4). What was the probabil-ity that we caught zero kings? (1 ⁄4), etc.
3. Have each pair discuss their answers and their procedures.
4. Literacy Connection: Understanding the meaning of the question. Ask the following questions for flipping the coin three times or catching three salmon in a row. What is the probability that exactly three heads (kings) appeared in the three tosses? (1 ⁄ 8). What is the probability of getting exactly (only) one tail (red) out of the three tosses? (3 ⁄ 8).What is the probability of finding at least one tail (red) out of the three tosses? (7 ⁄ 8). What is the probability of getting more heads? (4 ⁄ 8). What is the probability of getting more tails? (4 ⁄ 8). Teacher Note: Give students opportunities to pose questions and find the answers to their questions.
5. Have students share their answers and procedures. Have students explain the difference between exactly and at least one tail.
6. Have students take out their spinners with two equally likely outcomes from the previous activity.
7. Pose the following questions (or put them on an overhead transparency). If we spin the spinner twice, what is the probability of getting at least one king? (3 ⁄4) What is the probability of getting no king? (1 ⁄4).
8. Have students explain their answers, periodically asking can you see any relationship between the two answers? List students’ responses on the board and ask the class whether they agree or disagree. Discuss their ideas. Teacher Note: Students’ responses could be: the sum of the answers equals one; 1 – 3 ⁄4 = 1 ⁄4; or 1 – 1 ⁄4 = 3 ⁄4.
9. If students are confused, ask them whether they remember one of the probability rules they discovered in Activity 2. (The sum of probabili-ties in a single event equals one. That is, 3 ⁄4 + 1 ⁄4 = 1.)
10. Introduce the correct notation for the probability of a complementary event: P(–K) = 1 – P(K).
11. Have students explain to each other a complementary event and then have them report to the class.
12. Have the pairs come up with a probability question and answer for the spinner if it is spun twice. Then have them determine the complementary outcome and calculate the probability of its complement.
13. Have students share their questions and procedures.
Teacher NoteEmphasize. the. key. words—at.
least,.exactly—when.students.are.
discussing. their. procedures. and.
introduce. the.mathematical.nota-
tion .. For. example,. probability. of.
a. head. can. be. denoted. as. P(H).
or.P(Head) ..Remind.the.students.
that. the. probability. of. an. event.
P(E).=.no ..of.favorable.outcomes.. no ..of.possible.outcomes
Teacher NoteSince.the.sum.of.the.probabilities.
of.complementary.events.equals.1,.
1.–.3 ⁄4.=.1 ⁄4,.and.1.–.1 ⁄4.=.3 ⁄4 ..
This.means.that.the.probability.of.
at.least.one.king.could.also.be.cal-
culated.as.1.minus.the.probability.
of.no.king.and.vice.versa ..Do.not.
point.this.out.to.students.directly;.
rather.encourage.them.to.discover.
this.themselves .
Math NoteGiven.the.probability.of.an.event,.
for. example. in. this. case. prob-
ability. of. at. least. one. king. (K),.
the. probability. of. its. complement.
(not.getting.a.head).–K.(read.as.“K.
bar”),.can.be.found.by.subtracting.
the.given.probability.from.1 ..P(–K).
=.1.–.P(K) ..Not.all.complementary..
events.are.easily. interpreted ..For.
example,. if. the. event. is. catching.
exactly.one.kind,.then.its.comple-
ment.is.catching.either.zero.kings.
or.two.kings .

�0 Salmon Fishing
Problem Solving 1: Generating Sample Space1. Suppose you have two six-sided dice. One of the dice is numbered 1,
1, 1, 2, 2, 3. The other is numbered 1, 2, 3, 4, 5, 6. Consider the ex-periment of rolling the two dice and multiplying the results together to find the product to answer the following questions:(a) What is the sample space for the experiment? Explain what
strategy you used to find your answer.(b) What are all the possible ways you could roll each of the outcomes
in the sample space? Make a systematic list or develop a chart to find your answers.
(c) Using your list or chart of all the possible rolls, find the probability for rolling each of the possible outcomes in the sample space. Are your probabilities theoretical or experimental probabilities? Explain your reasoning.
(d) Are the outcomes in the sample space equally likely or not equally likely? Explain your reasoning.
2. Suppose you have three six-sided dice, each numbered 1, 2, 3, 4, 5, 6. Consider the experiment of rolling the three dice and adding the results together to answer the following questions:(a) What is the sample space for this experiment? Explain how you
found your answer.(b) Roll the three dice 50 times, recording the result of each roll.
Find the probability of rolling each outcome from your sample space, using your data from the 50 rolls.
(c) Are the probabilities you found theoretical or experimental prob-abilities? Explain your answer.
(d) Compare your probabilities for each outcome in the sample space with classmates. How do your probabilities compare? Why might they be different?
Answers1. (a) The sample space is {1, 2, 3, 4, 5, 6, 8, 9, 10, 12, 15, 18}. A strat-
egy to use in finding the sample space is similar to the strategy described in l(a) above. In particular, systematically note that for the outcome of 1 on the first die, the possible outcomes are 1, 2, 3, 4, 5, 6 (i.e., multiply the outcome of 1 by each of the outcomes 1, 2, 3, 4, 5, 6 on the other die). If the outcome on the first die is a 2, then the possible outcomes are: 2, 4, 6, 8, 10, 12. If a three is rolled on the first die, then the possible outcomes are 3, 6, 9, 12, 15, 18. Listing the outcomes in the three lists, and eliminating the repeats because an outcome is only listed once in the sample space, yields the sample space {1, 2, 3,4, 5, 6, 8, 9, 10, 12, 15, 18}.
Use Problem-Solving
Strategies

��Acti�ity �: Finding the Probabilities
(b) Here are all the possible rolls:
x 1 2 3 4 5 6
1 1 2 3 4 5 6
1 1 2 3 4 5 6
1 1 2 3 4 5 6
2 2 4 6 8 10 12
2 2 4 6 8 10 12
3 3 6 9 12 15 18
Fig. 5.1: All possible rolls for two six-sided dice
(c) From the chart in part (b) above, note that there are a total of 36 possible outcomes. Therefore, the probabilities of each possible outcome from the sample space are: P(1) = 3 ⁄ 36, P(2) = 5 ⁄ 36, P(3) = 4 ⁄ 36, P(4) = 5 ⁄ 36, P(5) = 3 ⁄ 36, P(6) = 6 ⁄ 36, P(8) = 2 ⁄ 36, P(9) = 1 ⁄ 36, P(10) = 2 ⁄ 36, P(12) = 3 ⁄ 36, P(15) = 1 ⁄ 36, P(18) = 1 ⁄ 36. All of the probabilities are theoretical probabilities since they are determined by analysis of all possible outcomes of the experiment and not by actually conducting trials of the experi-ment and determining the probabilities with collected data.
(d) In general, the outcomes in the sample space are NOT equally likely because some outcomes have different probabilities of occurring (e.g., P(3) = 4 ⁄ 36 but P(8) = 2 ⁄ 36).
2. (a) The sample space is: {3, 4, 5, 6, 7, 8, 9, 10, 11, 12, 13, 14, 15, 16, 17, 18}. One way to determine the sample space is to note that the lowest outcome would be rolling a 1 on each of the three dice, for an outcome of 1 + 1 + 1 = 3, and the highest outcome would be rolling a 6 on each of the three dice for an outcome of 6 + 6 + 6 = 18. All of the outcomes in between can be made by adding various combinations of the three dice.
(b) Students’ answers will vary. Combining results of all students should result in probabilities that gradually increase from 3 to 10 or 11 or 12, and then gradually decrease down to 17 and 18. Students may need to be reminded how to calculate the experi-mental probability as P(event) = (# times event occurs) ⁄ (total # outcomes). So, for example, if a student rolls a 5 seven times out of the 50 trials, then P(5) = 7 ⁄ 50.
(c) The probabilities are experimental since they are determined by using the data collected from an experiment of actually rolling the dice and recording the outcomes.
(d) Students should find some differences in their individual prob-abilities for the outcomes in the sample space. This is because, over 50 trials, it is likely that students will roll at least a few out-comes in the sample space a different number of times. Students may be reminded that the Law of Large Numbers suggests that if they had rolled the dice 100 times (or any significantly larger number of trials) to calculate their experimental probabilities, it is likely that they would see LESS variation in their probabilities for the outcomes in the sample space.

�2 Salmon Fishing
Continue to establish norms
for problem solving
Problem Solving 2: Finding ProbabilitiesThe following problems provide additional practice in determining prob-abilities, especially probabilities of complementary events.
1. George and Mary are fishing. Suppose that there are three different kinds of salmon in the river: kings, reds, and silvers. There are about the same number of each of the three salmon species in the river, so catching any of the three is equally likely. You go fishing for salmon in the river with your fishing rod and catch two fish. (a) What is the sample space for catching two fish? Explain your
reasoning. Use the Sample Space generated in Part A for the following problems.
(b) What is the probability of catching two king salmon? Explain how you found your answer.
(c) What is the probability of catching at least one silver? What is the probability of not catching any silvers? Explain how your answers for catching at least one silver and not catching any silvers are related.
(d) What is the probability of catching two salmon of the same species?
(e) What is the probability of catching exactly one red? (f) What is the probability of not catching a red and a king? Explain
your reasoning.2. George and Mary are fishing in a different river than the one in Prob-
lem 1 above. They each catch 5 fish for a total of 10 fish caught. Their combined catch consists of 6 silvers, 3 kings, and 1 red. Based on the sample of fish that George and Mary caught, answer the following questions: (a) What is the probability of catching a silver? (b) What is the probability of not catching a red? Explain your rea-
soning. (c) What is the probability of catching a king or a red? (d) What is the probability of not catching a silver? Explain your
reasoning. (e) If you and your friends were to fish in the same river as George
and Mary and caught 20 fish altogether, about how many silvers, reds, and kings would you expect in your combined catch? Ex-plain your reasoning.
3. Reflecting on your work in problems 1 and 2 above, answer these questions: (a) Are the probabilities you found in Problem 1 experimental or
theoretical probabilities? Explain your reasoning. (b) Are the probabilities you found in Problem 2 experimental or
theoretical probabilities? Explain your reasoning.

��Acti�ity �: Finding the Probabilities
Answers1. (a) The sample space is {KR, KS, KK, RK RR, RS, SK, SR, SS}.
One way of reasoning to find the sample space is that any one of the three kinds of fish can be caught first, followed by any of the three caught second.
(b) P(catching two kings) = 1 ⁄ 9 because there is only one of the nine outcomes in the sample space that results in KK, or two kings.
(c) Catching AT LEAST one silver means that 1 or 2 could be caught, so the possibilities from the sample space are KS, RS, SK, SR, or SS. Therefore, five of the nine possible outcomes result in catching at least one silver: P(catching at least one silver) = 5 ⁄ 9. The probability of not catching any silvers would be the same as asking what is the probability of not catching any, which would be 4 ⁄ 9. In other words, 4 of the 9 possible outcomes in the sample space do not include a silver. Another way of reasoning about the probability of not catching any silvers is to note that catching at least one silver and not catching any are complementary events. Therefore, P(not catching any silvers) = 1 – P(catching at least one silver) = 1 – 5 ⁄ 9 = 4 ⁄ 9.
(d) Catching two salmon of the same species means catching KK, RR, or SS, which are three of the nine possible outcomes. There-fore P(catching two salmon of the same species) = 3 ⁄ 9 = 1 ⁄ 3 (re-ducing the fraction 3 ⁄ 9 to 1 ⁄ 3 is optional and not necessary).
(e) P(catching exactly one red) = 4 ⁄ 9. (f) Finding the probability of not catching a red and a king means
finding the probability of not getting the outcomes KR and RK. This means finding the probability of the complementary event, so P(not catching a R and K) = 1 – 2 ⁄ 9 = 7 ⁄ 9. Another way to think about this problem is to note that 7 of the 9 outcomes in the sample space don’t include a red and king together (i.e., KR and RK). So, the probability of getting one of the 7 desired outcomes would be 7 ⁄ 9.
2. (a) P(catching a silver) = 6 ⁄ 10 because out of the sample of 10 fish caught, 6 were silvers.
(b) P(not catching a red) = 9 ⁄ 10 because 9 of the sample of 10 fish caught are not reds (i.e., they are silvers and kings).
(c) P(catching a king or a red) = 4 ⁄ 10 because out of the sample of 10 fish caught, 3 were kings and 1 was a red, for a total of 4 fish that were kings or reds.
(d) P(not catching a silver) = 4 ⁄ 10 since 4 of the sample of 10 fish caught were not silvers, but were kings or reds. Note that the prob-ability of not catching a silver is the same as catching a king or a red because these are different ways of stating the same event.
(e) 20 is twice as many fish as the 10 that George and Mary caught, so it is reasonable to expect that they would catch about twice as many of each kind of fish in their sample, i.e., 12 silvers, 6

�� Salmon Fishing
kings, and 2 reds. This makes sense because the number of each kind of fish caught for the sample of 20 is in the same ratio as the kinds of fish caught in the sample of 10, i.e., 12 ⁄ 20 = 6 ⁄ 10 for the silvers, 6 ⁄ 20 = 3 ⁄ 10 for the kings, and 2 ⁄ 20 = 1 ⁄ 10 for the reds.
3. (a) The probabilities in problem 1 above are theoretical probabilities because the probabilities are determined by analysis of all the possible outcomes from catching two fish of the three kinds in the river. Note that in problem 1 catching a silver, king, or red are all equally likely outcomes.
(b) The probabilities in problem 2 above are experimental probabili-ties because the probabilities are determined by using the data of the different kinds of salmon that George and Mary caught. Note that in problem 2 catching a silver, king, or red are not equally likely outcomes (i.e., they each have different probabilities of occurring.
Homework/Assessment Have the students write and draw in their journals what complementary events and their probability mean to them. Have the students fill out the vocabulary map from Activity 1 using the word “sample space.” You may want to discuss this before beginning the next activity.

��
Activity 6 Falling Sticks Game: Reviewing Sample Space and Experimental and Theoretical Probability
In this activity, students will be playing a game of chance that has been adapted from the Yup’ik falling sticks game, Tegurpiit, and another Native American stick game (Zaslavsky, 2002). In this game, four sticks are used. Each stick has one side colored or marked. Four sticks are tossed and scored depending on whether they fall on the blank or colored side (Fig. 6.1).
Through this game of chance, students will be exploring the chances of catching different types of salmon if equal numbers of four types—king, red, silver, and pink—are running in the Kuskowim River. Students will be finding the sample space and calculating the probabilities for all the different outcomes.
Goals• Review sample space• Review theoretical and experimental probabilities• Apply probability knowledge to a different situation or setup
Materials• Scenario card (one for each pair of students)• Popsicle sticks (four for each pair of students)• Distribution worksheet (one for each pair of students)• Number of Salmon Caught worksheet (one for each pair of students)• Paper and pencil (one for each pair of students)• Student journals
DurationOne class period.
VocabularyTegurpiit—grabbing somethingDistribution—the frequency of occurrence, either experimental or
theoreticalFig. 6.1: Falling sticks game
pieces
S PRK

�� Salmon Fishing
PreparationHave the sets of popsicle sticks (one per group) colored (use the color of the salmon) and marked (the type of salmon species) on one side. Prepare a large class distribution chart to record each group’s distribution (see page 90). This could be done on butcher paper or just reproduced on the board.
Instructions1. Tell the class that they are going to play a game of chance today. The
game is played using sticks. Ask the class whether they know any games of chance that are played using sticks. Share information. Share with the class that Yup’ik and other Native American people play a number of stick games with different rules. Tell the class that they will use this “stick” game of chance to model catching a type of salmon if four types of salmon are running in the river. From this model they will be determining probabilities.
2. Have students work with their fishing partner. Each pair will need to receive a Scenario Card, four popsicle sticks, a Distribution Chart (Fig. 6.2), paper, and pencil.
3. The Scenario: There are equal numbers of four different types of salmon species—king, red, silver, and pink—running in the Kuskokwim River today. Each stick represents a type of salmon species. You are going to toss the sticks to find out the chances of catching different species in any order.
The Rule: Hold the sticks in one hand and let them fall to the table. If the colored side is up, then you have caught that type of salmon. You are going to toss the sticks 15 times and keep the score.
Scoring:All four colored sides up—5 pointsThree colored sides up—4 pointsTwo colored sides up—3 pointsOne colored side up—2 pointsNo colored sides up—1 point
Count the total number of points. The fishing team with the greatest number of points is the winner.
4. One student tosses the sticks while the other student records their results, or the pair can take turns tossing and recording.
5. Have the pairs share their results and find which team got the most points.
Teacher NoteAt.this.point.there.are.several.paths.
you. may. want. your. class. to. fol-
low ..Students.may.still.need.more.
work.on.understanding.probability.
and. sample. space;. this. activity.
lends.itself.to.another.situation.for.
practice ..You. may. want. to. focus.
on.the.fairness.of.the.scoring;.the.
teacher.note.provided.on.page.88.
supports. this. discussion .. Lastly,.
you.may.want.students.to.practice.
interpreting.probability.and.asking.
questions. of. the. results .. In. this.
case,.following.steps.8-11.should.
aid.you.in.facilitating.that.path .
Fig. 6.2: Distribution Chart
Number of tosses 0 1 2 3 4
1
2
3
4
5
6
7
8
9
10
11
12
13
14
15
TOTALS
POINTS x.1 x.2 x.3 x.4 x.5
TOTAL POINTS

��Acti�ity �: Falling Sticks Game
6. Have each group report or record their distribution on the class distri-bution chart (see Preparation). Have them put a check mark or other notation in the appropriate cell. Total how many of each stick was fac-ing up, multiply the total by the number of points, and record the total points. Note that this will show the distribution of the experimental probability of catching zero to four types of salmon.
7. Ask the class whether this is a fair way to score the game. Why and why not, using what they have learned about probability? Hand out the Number of Salmon Caught worksheet (Fig. 6.3) and have the pairs list all possible ways the sticks can fall. Have the students explain their reasoning.
Number of salmon types caught
Possible ways
4
3
2
1
0
Fig. 6.3: Number of Salmon Caught worksheet
8. How would you score this game so that it is fair, using probability?
9. Review Activity 4 on catching multiple salmon in a row. Ask the students what is the difference between the various sample spaces that they cre-ated in Activity 4 and the sample space they created in this game.
Teacher NoteIn.Activity.4.the.order.of.the.catch.was.important,.whereas.in.this.activity.it.is.not.
considered ..It.is.important.for.students.to.realize.that.the.sample.space.would.
differ.depending.on.the.probability.question.that.is.being.asked ..In.this.problem.
the.question.focuses.on.how.many.of.each.fish.you.catch.and.so.the.order.in.
which.they.are.caught.is.not.important .
Teacher NoteIn.this.game.the.order.of.catching.
fish.does.not.matter,.just.like.when.
you. are. catching. fish. with. a. net ..
There.are.16.ways.the.sticks.can.
fall.or.the.four.types.of.salmon.can.
be.caught ..
All.four.salmon.types.caught—one.
possibility. King. (K). Red. (R).
Silver.(S).Pink.(P)—KRSP
Three.salmon.types.caught—four.
possibilities. (KRS,. KRP,. KSP,.
RSP)
Two. salmon. types. caught—six.
possibilities. (KR,. KS,. KP,. RS,.
RP,.SP)
One. salmon. type. caught—four.
possibilities.(K,.R,.S,.P)
No. salmon. type. caught—one.
possibility. (that. is,. no. colored.
sides.are.up) .
From.this.list.of.options,.the.sample.
space. can. be. generated .. Since.
the.question.asks.how.many.fish.
were. caught,. the. sample. space.
becomes. 4,. 3,. 2,. 1,. and. 0. (as.
shown.on.the.Possible.Outcomes.
Worksheet) .. Some. of. these. out-
comes. have. the. same. probabil-
ity,. calculated. by. adding. up. the.
number. of. options. for. each .. For.
example,. catching. all. four. types.
of. salmon. and. not. catching. any.
have.the.same.probability.(this.is,.
the.same.number.of.possible.out-
comes.of.1.out.of.16).and.likewise,.
catching. three.salmon. types.and.
one. salmon. type. have. the. same.
probability.of.4.out.of.16 ..The.final.
option. of. catching. two. salmon.
types.has.a.distinct.probability.of.
6.out.of.16 ..

�� Salmon Fishing
Teacher NoteDiscussing.the.idea.of.fairness.in.the.scoring.of.the.game.may.lead.your.class.in.many.different.directions ..Some.students.
may.realize.that.it’s.just.as.easy.to.catch.three.salmon.types.as.it.is.to.catch.one.salmon.type.in.this.game ..Thus.they.may.
suggest.scoring.these.catches.equally ..They.may.also.see.that.since.it.is.just.as.hard.to.catch.four.salmon.types.as.it.is.to.
catch.nothing,.that.not.only.should.they.be.scored.the.same,.but.they.should.receive.more.points.since.it’s.harder ..
Fair.scoring.of.the.game.would.be.to.have.your.students.investigate.how.they.would.assign.points ..For.example,.you.may.
want.to.assign.points.in.the.following.way:
Number of salmon types caught Probability Points
4 1/16 123 4/16 32 6/16 21 4/16 30 1/16 12
Fig. 6.4: One way to assign pointsThis.method.attempts.to.score.the.harder.results.with.proportionally.higher.points ..A.common.denominator.of.1,.4,.and.6.
was.used.to.determine.12.points ..Notice.that.the.16.is.proportionally.irrelevant.and.not.used.in.determining.points ..Since.
the.probability.of.catching.four.or.zero.salmon.types.is.six.times.as.hard.as.catching.two.salmon.types,.the.points.of.2.and.
12.were.given ..Further,.the.3.points.were.determined.similarly ..
Number of salmon types caught Probability Points
4 1/16 3
3 4/16 2
2 6/16 1
1 4/16 2
0 1/16 3
Fig. 6.5: Another way to assign points.This.method.provides.more.points.for.the.harder.results.but.not.necessarily.proportional.to.the.probabilities ..Here.the.
hardest.options.are.no.longer.worth.six.times.as.much.as.the.easiest ..
You.may.want.to.have.a.discussion.of.probability.and.fairness.versus.being.fair.in.the.sense.of.rewarding.the.fishing.skills ..Dis-
cussing.the.purpose.of.the.game.and.the.focus.of.the.scoring.should.help.students.relate.probability.to.real-life.situations ..

Blackline.Master
��
The Scenario: There.are.an.equal.number.of.four.different.types.of.salmon.species—king,.
red,.silver,.and.pink—running.in.the.Kuskokwim.River.today ..Each.stick.represents.a.type.
of.salmon.species ..You.are.going.to.toss.the.sticks.to.find.out.the.chances.of.catching.
different.species.in.any.order .
The Rule: Hold. the.sticks. in.one.hand.and. let.
them. fall. to. the. table .. If. the.colored.side. is.up,.
then.you.have.caught. that. type.of.salmon ..You.
are.going. to. toss. the.sticks.15. times.and.keep.
the.score ..
Scoring:
All.four.colored.sides.up—5.points
Three.colored.sides.up—4.points
Two.colored.sides.up—3.points
One.colored.side.up—2.points
No.colored.sides.up—1.point
Count.the.total.number.of.points ..The.fishing.team.
with.the.greatest.number.of.points.is.the.winner .
Scenario Card
S PRK

Blackline.Master
�0
Number of tosses 0 1 2 3 4
1
2
3
4
5
6
7
8
9
10
11
12
13
14
15
TOTALS
POINTS x.1 x.2 x.3 x.4 x.5
TOTAL POINTS
Distribution Chart
Distribution: Number Up

Blackline.Master
��
Number of Salmon Caught Worksheet
Number of Salmon Types
CaughtPossible Ways
4
3
2
1
0

��
Section 3 Integrating Knowledge and Skills:
Additional Probability Concepts


��
Activity 7 Sampling the River: Equally Likely and Not Equally Likely Events
Sampling of the salmon in the rivers provides an estimate of the salmon in a river at a particular time. This information can be helpful to ADF&G and to commercial and subsistence fishermen in predicting the overall strength and the composition of the run for the season. In this activity, the students will be fishing when kings, reds, and chums are running in the river. Each group will be assigned a pool of fish with 30 pretend salmon. The groups will fish and record the data, until the whole pool is depleted.
Mathematically, the idea behind this activity is that when the events are not equally likely, the chances or the probability of the events happening will not be the same. In addition, this activity shows a nice connection be-tween probability and statistics, since students will predict the population distribution based on their samples, which are determined by the laws of probability.
Goals• Students will gain a basic understanding of the difference between
equally likely and not equally likely events.• Students will be able to find the probabilities for not equally likely
events.
Materials• Pools of salmon—each pool in a bag or a box (30 fish per pair of
students; see Preparation)• Sample Fish Cutouts• Paper clips• Fishing pole materials—pole, string, and magnet (one set per pair of
students)• Large butcher paper sheet (one per pair of students)• Pencils (one per pair of students)• Spinners with three equally likely outcomes and three not equally
likely outcomes• Student Record Sheet (one per pair of students)• Scenario Card (one per pair of students)• Student journals
DurationTwo class periods.

�� Salmon Fishing
VocabularyEqually likely—all the events have the same or equal chance of happeningNot equally likely—all the events do not have the same or equal chance
of happening
PreparationPrepare pools of salmon with unequal distributions of kings, reds, and chums: 30 fish altogether in each “pool,” and one set (“pool”) per pair of students. The salmon can be constructed in a variety of ways. One sug-gestion is to attach paper clips to fish cutouts. Another suggestion is to use three different sized paperclips or nails and a magnet.
Sample outlines for fish cutouts are appended to this activity. Use different colored papers for different types of salmon or mark what type of salmon it is. Place each pool in a bag or a box. Here are examples of some distribu-tions that you may want to use for each pool (Fig. 7.1).
Group Kings Reds Chums1 13 12 52 3 15 123 3 6 214 5 8 175 19 9 26 15 2 137 7 21 28 21 5 49 10 8 1210 19 3 8
Fig. 7.1: Examples of distribution of fish cutouts
Depending on the number of students in your class, you may want to in-crease the number of students in each group so that you will have to create fewer pools.
Have two spinners prepared, one with three equally likely outcomes and the other with three not equally likely outcomes. (See Fig. 7.2.)
Instructions1. Tell the class that we are going to go pretend fishing today to continue
practicing with probability.
2. Have students work with their fishing partner or in small groups. Each pair or group will need to receive a pool of salmon, fishing pole ma-
Fig. 7.2: Spinners representing (top) equally likely outcomes and (bottom) not equally likely outcomes.
18 Kings60%
9 Silvers30%
3 Reds10%
10 Reds33.33%
10 Kings33.33%
10 Silvers33.33%

��Acti�ity �: Sampling the Ri�er
terials (pole, string, and magnet), Student Record Sheet, pencil, large butcher paper sheet, and a Scenario Card.
3. The Scenario: You are going to help ADGF&G sample the river today by determining the types of salmon in the river and their estimated number, that is, the composition and the strength of the run.
After you catch a fish, you are going to record it and release it, and then continue fishing until your group has caught 10 fish. Teacher Note: make sure the students don’t catch the same fish over and over by shak-ing the “pool” after each release.
4. Have the students attach the string and magnet to the pole. The string should be approximately the length of the student’s outstretched arm to the middle of his or her chest. Let the fishing begin. One student fishes and the other student records. Students can take turns fishing and re-cording. If fishing with a pole and magnet proves difficult, students can simply reach into the bag or box and pull out the fish one at a time.
5. Once each group catches and releases 10 fish, have each group estimate the total number of fish in the river (pool) and the types of fish in the river at this time. Keep records on the board. Ask each group to explain the method they used to make the estimate. Encourage students to help each other use mathematical methods.
6. Have students prove or disprove their estimate by asking each pair to fish until the whole pool is depleted.
7. Bar Graph. After pulling out each fish, have the groups make a bar graph by placing the fish physically on the large butcher paper (Fig. 7.3). Once all the fish are depleted and displayed on the bar graph, have students record their data on the board next to the estimate that they have made.
8. Ask the pairs whether their results were close to what they have esti-mated. Have a discussion about how the pairs estimated and why they think their estimate was close/not close to their experimental data.
Math NoteThis.is.sampling.with.replacement ..
Sampling. without. replacement.
changes. the. sample. and. conse-
quently.the.probability.of.catching.
a. fish ..The. concepts. “with. and.
without. replacement”. are. beyond.
the. scope. of. this. module. and.
hence.will.not.be.introduced.to.the.
students .
Teacher NoteStudents.may.respond.by.saying.that.there.is.a.33 .33.percent.chance.or.that.
the.probability.of.catching.a.king.salmon.is.1 ⁄ 3.because.there.are.three.types.of.
salmon.running.in.the.river.today .
Teacher NoteStudents.may.respond.by.saying.that.there.is.a.33 .33.percent.chance.or.that.
the.probability.of.catching.a.king.salmon.is.1 ⁄ 3.because.there.are.three.types.of.
salmon.running.in.the.river.today .
Fig. 7.3: Butcher paper bar graph with salmon cutouts.

�� Salmon Fishing
9. Have each pair calculate the probabilities for their data as a common fraction and as a decimal fraction. Then have them calculate the chance as a percentage. For example, see below.
King Red Chum Total
Number of Fish 13 12 5 30
Probability as a Common Fraction 13 ⁄ 30 12 ⁄ 30 5 ⁄ 30 30 ⁄ 30
Probability as a Decimal Fraction (Rounded)
0.43 0.40 0.17 1.00
Chance as a Percentage 43% 40% 17% 100%
Fig. 7.4: Calculating the probability
10. Have each pair report their results, periodically asking the following questions: Did you get the results that you expected? What went wrong? How come we didn’t get 33.33% chance of catching each type of salmon in today’s activity? We did get the 50 ⁄ 50 chance we expected when there were two types of salmon running in equal numbers in the river. What do you think happened in today’s activity? How is this like managing a fishery?
Teacher NoteStudents.should.be.able.to.see.that.in.the.initial.activities,.they.got.the.50 ⁄ 50.
chance.because.there.were.equal.number.of.reds.and.kings ..However,. in.this.
activity,.the.number.of.kings,.reds,.and.chums.is.not.equal .
11. Lead the discussion to equally likely and not equally likely events and introduce the vocabulary as appropriate. Teacher Note: If necessary, demonstrate using two spinners, one with two equally likely events and the other one with two not equally likely events.
Problem Solving 3:
Equally and Not Equally Likely EventsThe following problems provide additional practice with equally likely and not equally likely events. These problems could serve as a guide for your probability game. Pay attention to how you could use this information for your game.
1. Ginger uses stickers to put new numbers on the faces of a six-sided die. The faces of the die are now numbered 1, 1, 1, 2, 2, 3. (a) What is the probability of rolling a 1 on Ginger’s die? What is the probability of rolling a 2? What is the probability of rolling a 3? (b) Are rolling a 1, 2, or 3 equally likely events on Ginger’s
Math NoteTwo. or. more. events. are. equally
likely. if. all. the. events. have. the.
same.or.equal.chance.of.happen-
ing .. For. example,. in. a. coin. flip,.
heads.and. tails.are.equally. likely.
because.both.have.equal.chance.
of.occurring .
Two.or.more.events.are.not equally
likely.if.all.the.events.do.not.have.
the.same.or.equal.chance.of.hap-
pening ..For.example,.if.more.kings.
than.reds.are.running.in.the.river.
today,.then.the.chances.of.catching.
a.king.or.red.are.not.equal,.since.
chances.are. that.we.might.catch.
more.kings .
What does the problem ask? Do
we understand this? What do we do first?

��Acti�ity �: Sampling the Ri�er
die? Explain your answer. (c) On a regular six-sided die (that is, with faces numbered 1, 2, 3, 4, 5, 6) are rolling a 1, 2, or 3 equally likely events? Explain your reasoning. (d) Are rolling a 1, 2, or 3 on Ginger’s die and on a regular six-sided die both equally likely, both not equally likely, or different? Explain why they are the same or different.
2. The rectangular game board shown below is used in a game. Students are blindfolded and toss a counter chip onto the game board and the player gets the number in the rectangle on which the chip lands as her or his points. Use the game board to answer the following questions:
1 2 2 12 1 1 32 4 1 3
Fig. 7.5: Game board
(a) What is the sample space for this game? Explain your reasoning.
(b) Are all the outcomes in the sample space equally likely? Explain why or why not.
(c) What is the probability of scoring each outcome in the sample space? Explain how you found your answer.
(d) Suppose a player tosses a chip onto the game board four times, records each result, and then adds the numbers together. Which do you think is more likely: that the player’s score will be 12 or more or that the player’s score will be 8 or less? Explain your reasoning.
(e) What is the probability of scoring a total of at least 4 on four tosses? Explain your reasoning.
3. The Alaska Department of Fish and Game catches a sample of fish from the river. ADF&G reports that of a sample of 60 fish, one-half were silvers, one-third were kings, and the rest were reds. Use this information to answer these questions: (a) How many of the fish that ADF&G sampled were silvers? How
many were kings? How many were reds? Explain how you found your answers.
(b) Using the ADF&G sample, if you caught a fish in the river, what is the probability of the fish being a silver? What is the probability of the fish being a king? What is the probability of the fish being a red? Explain how you found your answers. (c) If you caught a fish in the river, what is the probability that the fish is not a king (that is, a silver or a red)? Explain your reasoning.
(d) If you and your family were to catch a total of 10 fish from the river, how many silvers, kings, and reds would you expect to catch? Explain your reasoning.
(e) Are the probabilities you are using in this problem experimental or theoretical probabilities? Explain your reasoning.

�00 Salmon Fishing
Answers1. (a) P(1) = 3 ⁄ 6, P(2) = 2 ⁄ 6, P(3) = 1 ⁄ 6.
(b) Rolling a 1, 2, or 3 on Ginger’s die are not equally likely events because they have different probabilities of occurring.
(c) On a regular six-sided die, rolling a 1, 2, or 3 are equally likely events because each has a probability of 1 ⁄ 6 of occurring.
(d) Rolling a 1, 2, or 3 on Ginger’s die is certain, i.e., P(1, 2, or 3) = 1 on Ginger’s die because, from part (a), the probabilities for the three events add up to 1 (i.e., 3 ⁄ 6 + 2 ⁄ 6 + 1 ⁄ 6 = 6 ⁄ 6 = 1). In other words, you must roll a 1, 2, or 3 on Ginger’s die because there are no other possible outcomes. On a regular 6-sided die there is a 3 ⁄ 6 = 1 ⁄ 2 chance of rolling a 1, 2, or 3, i.e., P(1, 2, or 3) = 1 ⁄ 6 + 1 ⁄ 6 + 1 ⁄ 6 = 3 ⁄ 6 =1 ⁄ 2 on a regular six-sided die. Therefore, rolling a 1, 2, or 3 on Ginger’s die and on a regular six-sided die are not equally likely events.
2. (a) The sample space is {1, 2, 3, 4} because all of the outcomes on the game board are 1, 2, 3, or 4.
(b) The outcomes in the sample space are not equally likely because there are different numbers of 1s, 2s, 3s, and 4s on the game board. For example, there are more ways to get a 1 than a 4, so the outcomes of 1 and 4 cannot be equally likely.
(c) P(1) = 5 ⁄ 12, P(2) = 4 ⁄ 12, P(3) = 2 ⁄ 12, P(4) = 1 ⁄ 12. Each prob-ability is determined by taking the number of times the desired outcome appears on the game board divided by the total number of outcomes on the game board. For example, P(1) = 5 ⁄ 12 be-cause there are 5 different ways to score a 1 out of the 12 possible outcomes on the board.
(d) It is more likely that the player’s score will be 8 or less because scoring 8 or less requires landing on smaller numbers (e.g., 1 or 2) and there are more small numbers on the game board than large numbers (e.g., 3 or 4).
(e) The probability of scoring at least 4 on four tosses is 1, or certain, because, assuming each chip tossed lands on the game board, each will score at least 1, which will result in a total score of at least 4.
3. (a) If half of the 60 fish sampled by ADF&G were silvers, than 30 silvers (i.e., one-half of 60) were sampled. Similarly, one-third of 60, or 20, were kings, leaving the remaining 10 sampled having to be reds.
(b) Think of the sample of 60 total fish as the total number of out-comes, and the number of each species of salmon as the number of desired outcomes. Then the probabilities for catching each species of salmon in the river would be: P(S) = 30 ⁄ 60, P(K) = 20 ⁄ 60, P(R) = 10 ⁄ 60.

�0�Acti�ity �: Sampling the Ri�er
(c) The probability of catching a king is 20 ⁄ 60, so the probability of not catching a king (i.e., the complementary event) would be 1 – 20 ⁄ 60 = 40 ⁄ 60. Note that not catching a king is the same as catching a silver or a red, which has probability of 30 ⁄ 60 + 10 ⁄60 = 40 ⁄ 60.
(d) If a sample of 10 fish were caught, it is reasonable to expect that the number of each kind of salmon caught would be about one-sixth of each kind of salmon in the ADF&G sample since 10 is one-sixth of 60. Therefore, it would be reasonable to expect that you would catch 5 silvers, 3 or 4 kings, and 1 or 2 reds. Note that 5 silvers is half of 10, 3 or 4 kings is about one-third of 10, and 1 or 2 reds would be the rest of sample of 10 fish being reds.
(e) All the probabilities in this problem are experimental probabilities because they are each determined from data collected from an experiment, i.e., the ADF&G sampling from the river.
Exploration 3:
Equally and Not Equally Likely EventsIn this exploration, students will be creating comic strips explaining the concepts of equally likely and not equally likely events.
Materials Needed• Worksheet, Comic Strip (two per student or per pair)• Pencil, crayons, etc.
Challenge
Tell the students that they are going to create comic strips for second grad-ers that explain to them the concept of equally likely in one strip and not equally likely outcomes in the other strip.
Hand out the Comic Strip worksheet, pencils, crayons, etc. Ask the students to create their comics in the strips provided. Remind them to make this fun for the second graders, be creative, and provide the second graders with enough information so that they can learn these concepts.
Scoring Rubric• Creativity (10 points)• Equally likely:
Appropriately explained for a second grader (5 points)Partially explained (3 points)Not explained (0 points)

�02 Salmon Fishing
• Not equally likely:Appropriately explained for a second grader (5 points)Partially explained (3 points)Not explained (0 points)
• Working with the second grader (5 points)TOTAL POSSIBLE: 25 points
Homework/Assessment 1. Have students give two examples of equally likely events and explain
in their journals.
2. Have students give two examples of not equally likely events and explain in their journals.

Blackline.Master
�0�
Sample Fish Cutouts
King
Red
Chum Salmon
Blackline.Master
�0�
Student Record Sheet
King Red Chum Total
Number.of.Fish
Probability.as.a.Common.Fraction
Probability.as.a.Decimal.Fraction.(Rounded)
Chance.as.a.Percentage

Blackline.Master
�0�
Scenario Card
The Scenario: You. are. going. to.
help. ADGF&G. sample. the. river.
today. by. determining. the. types.
of. salmon. in. the. river. and. their.
estimated. number:. that. is,. the.
composition. and. the. strength. of.
the.run ..After.you.catch.a.fish,.you.
are.going.to.record.it.and.release.
it,.and.then.continue.fishing.until.
your.group.has.caught.10.fish .

Blackline.Master
�0�
Comic Strip Worksheet

�0�
Activity 8 Knowledge and Skills Changes the Probability
In this activity, students will be playing a game of chance that has been adapted from the game Kakaanaq, which was introduced by Yup’ik elder Henry Alakayak. Mathematically, in this game, students will be calculating the areas of the mat and the target, to explore the probability of their disk landing on the target. Through this game, students will also realize that hitting the target not only involves chance or probability but also the skills and experience of the person/player.
Students will be looking at some of the factors that influence probability, especially in the case of fishing. They will also learn that even though prob-ability tells us the measure or likelihood of the catch, there are also other factors that need to be considered by a fisherman. Fishing success is subject to the weather, the water temperature, the fisherman’s location on the river, the net mesh, the advance preparation, and a person’s past experience. Be-ing prepared helps fishermen like the Georges, discussed in Activity 1, to influence their chances. The process of selecting and readying nets provides an example of the many decisions and preparations that the Georges make to influence their catch and to successfully pull in the species and number of salmon that they need for the coming winter. Through many seasons of subsistence fishing and much experience and skills, the George family has learned how to set up the most effective net and how to read the wind, river, and terrain. Because of repeated practice, the George family has gained the knowledge and skills necessary to influence the content of their catch.
The purpose of this activity is for students to realize that skills and expe-rience of a person can influence the probability of, for example, catching certain types of fish and of scoring in the Kakaanaq game. However, when we calculate the probabilities, it is based on all other factors being equal or they are not considered.
Goals• Students will be able to find the probabilities by calculating the
area.• Students will be able to realize and learn about other influences on
the catch in addition to chance or probability.

�0� Salmon Fishing
Materials• Scenario Card (one for each pair of students)• One mat or poster board (24 inches by 24 inches) with a circle (4
inches in diameter with an area of approximately 12.6 square inches) painted or fixed at the center (one for each pair of students)
• 10 (3 inches in diameter) wooden or plastic disks—5 disks marked with “X” and 5 disks marked with “O” (one set per pair of students)
• 10 tally sticks (one set per pair)• Transparency, George Family’s Yearly Salmon Catch (from Activity 1)• Large butcher paper sheet• 3x5 cards in four colors (one set per pair of students)• Paper and pencil (one per pair of students)• Student journals
DurationTwo class periods.
VocabularyArea—the number of square units required to exactly cover a figure in the
planeQasgiq—men’s community houseKakaanaq—a Yup’ik game where an object is thrown onto a target
PreparationHave the mats or posters and circular disks prepared as per materials list.
Have the 3x5 cards in four colors or marked so that four sets can be differentiated.
Instructions1. Tell the class that in this activity they are going to play a Yup’ik game
of skill called Kakaanaq. Ask the class whether they know any Alaska Native games of chance. Share information. If appropriate, let them show their games and play later. Explain briefly the game of Kakaanaq and how it is played.
2. Have students work with their fishing partner. Each pair will need to receive a scenario card, a mat or poster board, 10 wooden disks, 10 tally sticks, paper, and pencil.
3. As in Henry’s game (see Cultural Note, page 110, for some variations on the game), before they start playing, have each pair decide what

�0�Acti�ity �: Chance and Other Influences
chore the loser has to do. Teacher Note: Guide students to come up with chores that are possible to do during the class period.
4. The Scenario: The Yup’ik people used this game to develop the nec-essary skills for hunting and to learn the skills necessary for judging distances. The objective of the game is to land the disks on the target, which is the circle with an area of 12.6 square inches painted on the mat, which is 24 inches by 24 inches.
The Rule: Players should stand three feet from the edge of the mat to toss their disks. Pick up the disks after each round. Players alternate tossing until each player has played all five disks.
Scoring:If the whole disk lands on the target, the player picks 3 tally sticks.If half the disk lands on the target, the player picks 2 tally sticks.If the disk only touches the target, the player picks 1 stick.If the disk does not land on the target, the player does not pick a
stick.
Once all the tally sticks have been picked up, the player whose disk gets closest to the target takes a stick from their opponent’s pile.
The player with the most number of sticks is the winner.
5. The game begins. Once the pairs finish playing, have them share their results. Have the loser perform the chore that was decided in Step 4.
6. Ask the class whether this is a fair way to score the game. Why and why not? Pose the following questions: In this game, what is the prob-ability of scoring 3 and what is the probability of not scoring? Have the pairs answer these questions. Teacher Note: If students are having
Math NoteTo.find.the.probability,.the.students.need.to.calculate.the.area.of.the.mat.which.is.the.total,.the.circle.(target),.and.the.
area.of.the.mat.minus.the.circle ..In.this.game,.the.area.of.the.mat.is.24.x.24.=.576.square.inches;.the.area.of.the.circle.
is.12 .6.square.inches.(given);.and.therefore.the.area.of.mat.minus.the.circle.
=.576.–.12 .6.=.563 .4.square.inches ..
Hence,.the.probability.of.scoring.three.(whole.disk.landing.on.the.target):.
P(a.score.of.three).=.area.of.target.⁄.area.of.the.total.=.12 .6 ⁄ 576
Similarly,.the.probability.of.scoring.0.(disk.not.landing.on.the.target.at.all):
P(score. of. zero). =. area. of. mat. minus. target. ⁄. area. of. mat. (total). =.
563 .4 ⁄ 576] .Fig. 8.1: Area of mat minus the
target (shaded)
Teacher NoteOther.games.of.skill.such.as.shuffle.
board.or.skeeball.also.award.points.
based.on.area.calculations .

��0 Salmon Fishing
Cultural NoteAccording.to.Henry.Alakayak,.part.of.the.purpose.of.the.game.Kakaanaq.was.for.developing.accuracy.in.harpoon.throw-
ing.or.aiming.with.the.bow.and.arrow.and.learning.how.to.judge.distances ..Henry’s.game.was.played.with.boys.in.the.
men’s.house.(qasgiq) ..Traditionally,.this.is.a.boys’.and.men’s.game ..However,.today.both.boys.and.girls.may.play.this.
game ..This.is.a.target.game.where.an.object.is.thrown.or.tossed.onto.a.target ..Two.players.are.involved.in.this.game ..
Each.player.gets.five.disks ..The.disks.are.about.3.inches.in.diameter.and.charcoal.is.used.to.mark.the.disks.with.an.“X”.
or.an.“O”.(five.of.each) ..The.target.is.a.piece.of.wood.sitting.on.top.of.the.animal.skin.mat.or.the.old.kayak.skin.mat ..The.
target.is.slightly.larger.(about.4.inches.in.diameter).than.the.discs.that.are.thrown ..It.is.a.thin.piece.of.wood.that.has.to.
be.staked.down.so.that.it.does.not.move ..
Fig. 8.1: Materials used in the game of Kaakaanaq
Players.should.stand.three.feet.from.the.edge.of.the.mat.to.play.their.disks ..There.are.10.tally.sticks.to.keep.the.score ..
If.a.disk.only.touches.the.target,.the.player.gets.one.stick;.if.the.disk.overlaps.the.target,.the.player.gets.two.sticks;.and.
if.the.disk.lands.right.on.top.of.the.target,.the.player.gets.three.sticks ..Once.the.10.sticks.are.gone,.the.player.whose.
disk.gets.closest.to.the.target.takes.one.stick.from.their.opponent’s.pile ..The.object.of.the.game.is.to.end.up.with.all.
10.sticks.or.most.of.the.sticks ..Before.they.start.the.game,.the.players.will.agree.on.what.the.loser.will.do ..Usually,.the.
loser.has.to.do.some.chores .
X O
XX
XX
OO
OO
Target Disks Tally Sticks

���Acti�ity �: Chance and Other Influences
difficulty, give them a hint. Ask them to consider the area of the mat and the painted circle.
7. Have the pairs share their answers and procedures. Ask the class whether they agree or disagree with the group and why.
8. Ask the students, now do you think the scoring in this game is fair? Why or why not? In addition to probability, what other things influ-ence the score? Teacher Note: Again students may say that the game involves the skills of the player. If not, lead the discussion to the skills of the player and the experiences the player has in throwing.
This may be a good stopping point for the day.
9. Have the George Family’s Yearly Salmon Catch on an overhead trans-parency. Ask the students what things may have influenced George family catch (chance versus skill). Make a chart with a list of all their suggestions.
10. Some of these conditions can be controlled by the person fishing and some cannot. Others can be thought of either way and the decision can be guided by class discussion (see Teacher Note on next page).
11. Have the students working in pairs. Distribute the 3x5 cards to the pairs. Ask students to rewrite the list of things that might influence the catch on the cards. They are to use one color card for the bad conditions that can be controlled by the person fishing, and a different color card for the bad conditions that cannot be controlled by the person fishing. They are to use a third color card for the favorable conditions that can be controlled by the person fishing and a fourth color card for the favorable conditions that cannot be controlled by the person fishing.
12. Have each pair create a list for the four different conditions in Step 11. Have a discussion about what these conditions have to do with the likelihood of catching a fish.
13. Tell the students that the next activity is a project where each pair comes up with a game of chance related to fishing.
Homework/Assessment Have students write in their journals how they think skills and experience influence probability, using two examples.
Teacher NoteWhen.students.are.considering.the.
fairnes.of.this.game,.they.may.try.
to.consider.all.cases.similar.to.the.
game. in. Activity. 6 .. In. this. game,.
it. will. be. difficult. to. determine.
the. area. relating. to. “if. the. disk.
only.touches.the.target”.scenario ..
Mathematically,. it. relates. to. the.
circumference.of.the.circle,.which.
is.only.a. length.and.not.an.area ..
Depending.on.the.level.of.your.stu-
dents,.you.may.choose.to.discuss.
this.issue.or.not .

��2 Salmon Fishing
Teacher NoteBecause.the.fish.come.upriver,.the.wind.directions.were.crucial.when.Frederick.George.was.out.fishing ..According.to.
him,.south.and.north.wind.would.bring.lots.of.fish ..East.and.west.winds.don’t.bring.in.fish ..For.example,.these.two.winds.
cause.lack.of.fish:.qiugkanaq,.wind.coming.from.up.inland,.easterly;.and.calaraq,.east ..Frederick.also.mentioned.a.circle.
of.directions.that.help.to.describe.the.wind ..The.list.of.things.that.may.have.influenced.the.George.family.catch.might.look.
like.this:
•. fishing.gear.prepared
•. fishing.gear.not.prepared
•. prevailing.winds.favorable
•. prevailing.winds.not.favorable
•. water.temperature.right
•. water.temperature.not.right
•. tide.right.to.allow.salmon.to.enter.river
•. tide.not.right.for.salmon.to.enter.river
•. large.numbers.of.salmon.caught.by.commercial.factory.ships.in.open.waters,.therefore.fewer.salmon.entering.river
•. smaller.numbers.of.salmon.caught.by.commercial.factory.ships.in.open.waters,.therefore.more.salmon.entering.river
•. person.fishing.is.very.experienced.
•. person.fishing.is.not.very.experienced
•. person.fishing.knows.the.river.well
•. person.fishing.does.not.know.the.river.well
•. person.fishing.uses.an.appropriate.net.mesh
•. person.fishing.does.not.use.an.appropriate.net.mesh
•. nets.mended
•. nets.not.mended
•. ADF&G.closes.the.fishery.in.order.to.protect.the.next.generation.of.salmon
•. ADF&G.does.not.close.the.fishery.in.order.to.protect.the.next.generation.of.salmon
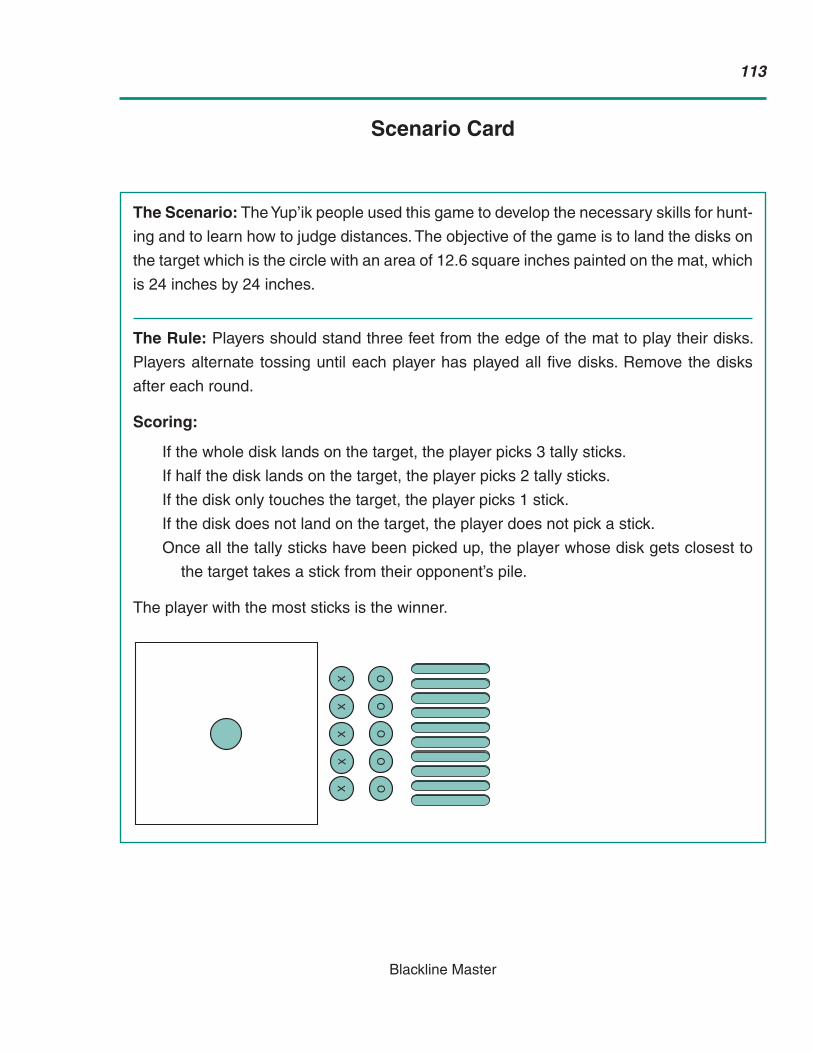
Blackline.Master
���
The Scenario: The.Yup’ik.people.used.this.game.to.develop.the.necessary.skills.for.hunt-
ing.and.to.learn.how.to.judge.distances ..The.objective.of.the.game.is.to.land.the.disks.on.
the.target.which.is.the.circle.with.an.area.of.12 .6.square.inches.painted.on.the.mat,.which.
is.24.inches.by.24.inches .
The Rule:.Players.should.stand.three.feet.from.the.edge.of.the.mat.to.play.their.disks ..
Players.alternate. tossing.until.each.player.has.played.all.five.disks ..Remove.the.disks.
after.each.round .
Scoring:
If.the.whole.disk.lands.on.the.target,.the.player.picks.3.tally.sticks .
If.half.the.disk.lands.on.the.target,.the.player.picks.2.tally.sticks .
If.the.disk.only.touches.the.target,.the.player.picks.1.stick .
If.the.disk.does.not.land.on.the.target,.the.player.does.not.pick.a.stick .
Once.all.the.tally.sticks.have.been.picked.up,.the.player.whose.disk.gets.closest.to.
the.target.takes.a.stick.from.their.opponent’s.pile .
The.player.with.the.most.sticks.is.the.winner .
Scenario Card
X O
XX
XX
OO
OO


���
Section 4 Project


���
Activity 9 Creating a Game of Chance
In this activity, the fishing partners will create a game of chance related to fishing, using a set of guidelines given to them. This activity provides the opportunity to assess students’ understanding of the probability concepts. It also affords students the opportunity to invite their parents and students from other classes to share what they have learned in this module.
Goals• Assessing students’ understanding of the probability concepts that
they have learned in the module.
Materials• Cardboard sheet, color pencils, crayons, markers, rulers (one set per
pair of students)• Guidelines for the Project (one per pair of students)• Paper and pencil (one per pair of students)• Materials from other activities: coins, dice, cards, spinner materials,
fishing pole materials, salmon pools, popsicle sticks, tally sticks, wooden disks
• Student journals
DurationThree or four class periods.
PreparationHave materials used in other activities ready for students since they may want to use some of those for their game. The materials include coins, cards, dice, materials for making a spinner, fishing pole materials, salmon pools, popsicle sticks, tally sticks, and wooden disks.
Instructions1. Tell the class that this activity is a project where each pair of students
comes up with a game of chance related to fishing. They can create the game using any of the manipulatives. However, all the games should follow the guidelines that will be given to them. The games will be exhibited in the class, and parents and students from other classes will be invited so that they can share what they have learned.

��� Salmon Fishing
2. Have students work in pairs. Distribute cardboard sheet, color pencils, crayons, markers, rulers, and guidelines for the project. Have other materials students may wish to use readily available. Have students create the game.
3. Have another pair of students play the game. Note any problems they have. Make corrections.
4. If possible, play the game with second-grade partners.
5. Exhibit students’ games in the class. Invite parents and other students.
6. Have students explain their game and the rules for playing the game. Invite visitors to play the games.
7. Have students explain what they have learned in the probability module.
Homework/Assessment Have students record their project in their journals and write what they have learned in the probability module.
Teacher NoteHere.is.a.scoring.rubric.that.you.could.use.as.a.guideline.to.grade.students’.projects:
•. Each.pair.creates.a.game.of.chance.related.to.fishing .
. Presentation.and.theme:.10.points
•. Title.(name).the.game ..
. Title.related.to.theme.of.the.game:.2.points
•. Create.a.scenario.card.for.the.game.explaining.what.the.game.is.about:.5.points
•. Have.a.set.of.rules.on.how.the.game.is.played.and.how.the.game.is.scored:.5.points
•. In.your.own.words.describe.how.this.game.relates.to.probability:.5.points
•. What.is.the.sample.space.for.your.game?.5.points
•. Choose.three.outcomes.in.your.sample.space.and.find.the.probability:.12.points.(2.points.each.for.three.outcomes.
and.2.points.for.finding.each.of.the.related.probability)
•. Are.the.outcomes.in.the.sample.space.of.your.game.equally.likely.or.not.equally.likely?.Explain.your.answer:
. 6.points.(2.points.for.correct.answer.and.4.points.for.the.correct.explanation) .
TOTAL:.50.points

Blackline.Master
���
•. Create.a.game.of.chance.related.to.fishing .
•. Title.(name).the.game .
•. Create.a.scenario.card.for.the.game,.explaining.what.the.game.is.about .
•. Have.a.set.of.rules.on.how.the.game.is.played.and.how.it.is.scored .
•.. In.your.own.words,.describe.how.this.game.relates.to.probability .
•. What.is.the.sample.space.for.your.game?
•. Choose.three.outcomes.in.your.sample.space.and.find.the.probability .
•. Are.the.outcomes.in.the.sample.space.of.your.game.equally.likely.or.not.equally.likely?..
. Explain.your.answer .
Guidelines for the Project


�2�
Appendix Games of Chance
These.are.selected.games.of.chance.from.different.sources.that.the.teacher.may.wish.to.explore.in.the.classroom .

�2�Appendix: Games of Chance
The seven games of chance included in this appendix provide students with additional opportunities to refine and apply their understandings of probability. The games are engaging for students, are easy to play, and each incorporates one or more key concepts developed in Salmon Fishing: Investigations into Probability. All of the seven games of chance include detailed directions for play and highlight special features of the game that should be pointed out to students. Several of the games include an analysis for the teacher about how probability concepts are embedded in the game; some games also reference Internet sites that support playing the game or provide additional explorations. Before using any game with students, the teacher should review the game direc-tions and any required materials carefully, and then go over it with students to make sure students understand the game before they try to play.
While students should enjoy playing the games of chance, it is also important that the teacher help students to unpack the underlying probability concepts. Without guidance from the teacher, students may enjoy playing the games but not explicitly make connections to what they have leaned in the Salmon Fishing: Investigations into Probability module. The intent of playing the games of chance is that students will apply what they have learned about probability to understand the mechanics of a particular game, use this understanding to analyze the game and develop a strategy for playing it, and through this process enhance their understanding of prob-ability and their problem-solving skills. To help accomplish these goals, a set of guiding questions is provided for the teacher to ask students to help promote their thinking about the games. The guiding questions target specific concepts addressed in the module and are intended to support the teacher in using the games of chance to help develop students’ probabilistic reasoning. Any or all of the guiding questions may be used with any of the games of chance.
Guiding Questions
QuestionTargeted Probability Concept(s)
Teaching Suggestion
Before students play the game, ask, “What are all the possible outcomes in this game?” After playing the game, ask, “Did any outcomes occur that you didn’t expect?” and “Do you have a complete list of all possible outcomes now? What is this list called?”
NOTE: The teacher may also ask stu-dents if an outcome they listed before playing the game did not occur. Discuss with student if the outcome cannot oc-cur (and, therefore, should not be in the sample space) or whether it just hap-pened to not occur in one trial of the game (this is a connection to the Law of Large Numbers if it occurs).
Sample Space After explaining the game to students, ask them to list what they think is the sample space (before playing the game) and ask them how they deter-mined the outcomes. Then direct your students to play the game once; if any outcomes occur that were not on their initial list, students should add them to the sample space. After playing the game and adding any outcomes, ask students if they think they have a com-plete sample space and how they know.

�2� Salmon Fishing
QuestionTargeted Probability Concept(s)
Teaching Suggestion
“Record the outcome of each trial of the game as you play it. Which out-come is the most likely? Which is the least likely? Explain your reasoning.”
Experimental Prob-ability
Students should record the outcome of each of their individual turns in play-ing the game. When the game is over, have each student determine the ex-perimental probability of each outcome and then compare. Students may find that they have different experimental probabilities for the same outcome (e.g., one may have flipped heads more or less than the other).
“Without playing the game, find the likelihood of each outcome. How did you find your answer?”
Theoretical Probability Have students determine all the pos-sible ways each outcome in the sample space can occur, and then use the re-sults to determine the theoretical prob-ability. For example, as discussed in the module, there are six possible ways of rolling a sum of seven on two six-sided dice out of a total of 36 possible ways (6 ⁄ 36) to get all the sums in the sample space; therefore, the theoretical probability of rolling a seven on two six-sided dice is 6 ⁄ 36 = 1 ⁄ 6.
“How do the experimental and theo-retical probabilities you have found for the outcomes of the game compare? Explain any difference.”
Law of Large Numbers Students will likely find differences in their experimental and theoretical probabilities. Ask students to play the game one or two more times and com-bine their results; they will typically find that the experimental probability is closer to the theoretical probabil-ity, which tend to converge over large numbers of trials.

�2�Appendix: Games of Chance
QuestionTargeted Probability Concept(s)
Teaching Suggestion
“Are all the outcomes of the game equally likely or not equally likely? Explain how you know.” Also ask, “Is it better to use experimental or theoreti-cal probability to decide whether out-comes are equally likely or not equally likely?”
Equally Likely and Not Equally Likely Out-comes
Some of the games have outcomes that are all equally likely (e.g., Coin Flip game). Some of the games, however, have outcomes that are not equally likely (e.g., The Monty Hall Puzzle). Ask students to explain if they were surprised by how the likelihood of the outcomes compares. Also, note that theoretical probability can provide a good long-term measure of the likeli-hood of outcomes without conducting many trials, but some games are very complicated, so experimental probabil-ity might be a better strategy to deter-mine likelihood of different outcomes.
“What have you learned about this game? How would you play the game differ-ently now that you have analyzed it using probability?”
Probabilistic Reasoning and Problem Solving
Ask your students to develop a strategy for playing the game and write it down. Have students compare strategies for playing a game and try their strategies out by playing against a classmate. Have students explain the game to a family member, try their strategy out playing against the family member, and report to the class how it worked. Note that for some games (e.g., The Monty Hall Puzzle), a very clear strategy can be determined, while with other games strategies may vary. Make sure students have reasonable arguments to support their strategies based on likelihood of outcomes.

�2� Salmon Fishing
Game 1: Coin Flip
Source: http://www.betweenwaters.com/probab/flip/explain.html
The Problem
A coin has two sides: heads and tails. When you flip it, what are the chances it will come up heads? What are the chances it will come up tails?
The Analysis
Assuming the coin is fair, it has an equal chance of coming up on either side. Therefore, it should come up heads one of every two times or 50%. It should also come up tails one of every two times or 50%.
Playing the Game
An image of a coin appears near the top left corner of the window. To flip the coin, click on the image. To flip it again, click on it again. The actual and expected results are shown in the bottom half of the window. You can choose to see just results for the current session or to see historical results (since about June 1, 2003). The results are updated after each flip.
To automatically flip the coin multiple times, enter a number in the field to the right of the coin and then click the Auto Flip button. The program automatically performs the number of flips you specified and updates the displayed results. If you enter an especially high number, you might experi-ence some delay as the flips are processed.

�2�Appendix: Games of Chance
Game 2: Coin Game
Source: http://www.betweenwaters.com/probab/coingame/explain.html
The Problem
You and your opponent each have a coin. In each round you each choose to show either the heads or tails side of the coin. If both coins show heads, your opponent pays you $3. If both show tails, she pays you $1. If they don’t match, you pay her $2. Is this a fair game?
Note: This is only a demonstration. Students are not playing for real money.
The Analysis
If you each play randomly, then the game is even. Out of four random rounds you can expect one case of Heads-Heads (+$3), one case of Tails-Tails (+$1), one case of Heads-Tails (–$2) and one case of Tails-Heads (–$2). This nets out to $0. However, your opponent can skew the results by playing heads or tails more often. In the following chart, the horizontal axis shows the percent that your opponent plays tails. The green line shows your winnings per round when you play heads; the black line shows your winnings per round when you play tails.
Playing the Game
Your coin and your opponents’ coin are shown in the window. For each round of play, click either the Heads button or the Tails button to indicate which side you want to show to your opponent. (You can also use the Alt-H key for heads and Alt-T for tails.) Your opponent will make an independent choice for her coin.
You can automatically play multiple rounds. Enter the number of rounds in the field to the right of the coins and click the Auto Play button. The pro-gram automatically plays the number of rounds you specify. It will alternate between heads and tails for your coin.
The bottom of the screen shows the results of the most recent round and a summary of the play so far. You can choose to see just results for the current session or to see historical results (since about June 1, 2003).

�2� Salmon Fishing
If your opponent plays tails less than 60% of the time, you have the advan-tage when you play heads (red line above the axis). If your opponent plays tails greater than two-thirds (66.6%) of the time, you have the advantage when you play tails (blue line above the axis). Note specifically that if your opponent plays tails more than 60% and less than 66.6% of the time, your opponent has the advantage whether you play heads or tails (both lines below the axis).
In this computer version of the game, your opponent plays 62.5% tails. Over time, you should lose an average of about $1 every 8 rounds. However, because your opponent’s advantage is very small, you might find you come out ahead even after dozens of rounds.
$3.00
$2.50
$2.00
$1.50
$1.00
$0.50
$0.00
–$0.50
–$1.00
–$1.50
–$2.00
0% 5% 10% 15% 20% 25% 30% 35% 40% 45% 50% 55% 60% 65% 70% 75% 80% 85% 90% 95% 100%
Tails Heads

�2�Appendix: Games of Chance
Game 3: Dice Roll
Source: http://www.betweenwaters.com/probab/dice/explain.html
The Problem
A die has six sides, numbered one through six. When you roll the die, each side has an equal chance of coming up. When you roll two die, the total shown can be anywhere from two to twelve. What are the chances of each total occurring?
The Analysis
Assuming the die is not tainted, it has an equal chance of coming up on any side. Therefore, a single die should display a given number one of every six times or about 16.67%. For two dice, there are 36 (6 x 6) different ways they can come up. Here are just four examples:
Die A Die B
1 1
1 2
2 1
2 2
The only way to get a total of 2 is for both dice to display 1. Similarly, the only way to get a total of 12 is for both dice to display 6. Therefore, each of these has just one chance in 36 (about 2.78%) of coming up in a roll. How-ever, other totals can be formed in multiple ways. For example, as shown in the above table, 3 can be formed in two ways (1 + 2, or 2 + 1). Therefore, the chance of two dice totaling 3 is 2 in 36, or about 5.56%. There are six different ways to form the total 7 (1 + 6, 2 + 5, etc.). Therefore the chance of 7 coming up from two dice is 6 in 36 or about 16.67%.
See the “Expected” column within the game for the odds on each total.
Playing the Game
You can choose to roll two dice or only one. An image of one or two dice appears near the top left corner of the window. To roll the dice, click on the image. To roll again, click on it again. The actual and expected results are shown in the bottom half of the window. You can choose to see just results for the current session or to see historical results (since about June 1, 2003). The results are updated after each roll.

��0 Salmon Fishing
To automatically roll the dice multiple times, enter a number in the field to the right of the dice and then click the Auto Roll button. The program automatically performs the number of rolls you specified and updates the displayed results. If you enter an especially high number, you might experi-ence some delay as the rolls are processed.
After you’ve collected the data, discuss with the class why it seems that some sums “win” more than others. Young children may not be able to explain it, but older students often figure out that there is only one way to get the sums of 2 and 12, and six ways to get a sum of 7.

���Appendix: Games of Chance
Game 4: Cree Dice Game
(North.American.Indian.Game.of.Chance)
Set of dice consisting of four small bone diamonds and four hook-shaped objects of bone, and a wooden bowl or a plate shaped like a pie pan, 8.5 inches in diameter. The dice are two-faced, one white and the other black, and are accompanied by a small bag of red flannel.
This game is played by any number of persons, either singly or in partner-ship. The dice are placed in the bowl, which is then given a sharp downward movement with both hands. The count is determined by combinations of the upper faces of the dice and is as follows:
• All white sides up, counts 100.• All dark sides up, counts 80.• 7 white and 1 dark side up, counts 30.• White sides of all hook-shaped dice and of 1 diamond-shaped die up,
counts 10.• Dark sides of all hook-shaped dice and of 1 diamond-shaped die up,
counts 8.• White sides of 4 diamond-shaped dice and of 1 hook-shaped die up,
counts 6.• Dark sides of 4 diamond-shaped dice and of 1 hook-shaped die up,
counts 4.• Each hook-shaped piece on edge, counts 2.
One hundred points constitute the game (Culin, 1907, p. 69).

��2 Salmon Fishing
Game 5: The Key Problem
Source: http://www.betweenwaters.com/probab/keys/explain.html
The Problem
In an imaginary contest, seven people have the chance to win a car. Out of seven keys, one will start the car. The players take turns, each selecting a key and trying it in the car. When a player chooses the correct key, he or she wins the car and the contest is over.
Does each player have an equal chance of winning? Isn’t it unfair that some players might not even get to choose?
The Analysis
Each player has an equal chance (one in seven) of winning. One way to look at this is to consider two types of risk each player faces:
• Performance risk: the risk of choosing a wrong key. • Opportunity risk: the risk of not getting the chance to choose a key.
These risks balance each other. Early players have high performance risk and low opportunity risk. Later players have high opportunity risk and low performance risk because some keys have been eliminated before they choose.
For example, the first player has a 100% chance of getting to choose, but only one chance in seven (about 14.29%) of choosing the correct key. The second player has six chances in seven (about 86.71%) of getting to choose, but then has one chance in six (about 16.67%) of choosing the correct key. The seventh player has only one chance in seven (about 14.29%) of getting to choose, but then has a 100% chance of choosing the right key. (There will be only one key left at that point.)
When you play the game, the specific opportunity risk and performance risk for each player are displayed in the expected results.
Playing the Game
You get to play the parts of all seven players. Seven keys are initially dis-played across the top of the window. To choose a key, click on it. If it is the wrong key, it disappears and the next player gets a turn. Continue choosing from the remaining keys. When you select the winning key, a message is displayed. When you acknowledge the message, the updated results are dis-played in the lower part of the window. You can choose to see just results for the current session or to see historical results (since about June 1, 2003).

���Appendix: Games of Chance
To automatically play the game multiple times, enter a number in the field to the right of the keys and then click the Auto Play button. The program automatically plays the number of iterations you specified and updates the displayed results. If you enter an especially high number, you might experi-ence some delay as the games are processed.

��� Salmon Fishing
Game 6: The Monty Hall Puzzle
Source: http://www.cyberbee.com/probability/mathprob.html http://www.betweenwaters.com/probab/monty/explain.html
The well-known Monty Hall probability problem is based on a television show of the 1960s and 1970s called Let’s Make a Deal. Show host Monty Hall would ask a contestant to pick one of three doors. Behind one of the three doors was a large prize. Behind the other two doors were lesser prizes, sometimes a group of goats grazing on fresh hay. Once the contestant picked a door, Monty would open one of the remaining two doors that did not have a prize. Then he would offer the contestant a chance to switch doors.
The Problem
A game show presents a contestant with a choice of three doors. Behind one door is a new car. Behind the others are goats. The host knows where the car is and has scripted the scenario in advance:
• The contestant chooses a door. • The host opens one of the other doors and shows the contestant a goat.
(Remember that behind at least one of the unchosen doors must be a goat and that the host knows where the car is.) Two doors remain unopened.
• The host offers the contestant a choice: Keep the door you originally chose or switch to the other unopened door.
Question: Should the contestant switch? Does it matter?
The Analysis
The contestant should switch; this doubles the chances of winning.
The chance that the car is behind the originally chosen door is one in three (about 33.33%). This chance never changes. When the host shows a goat behind one of the other doors, it merely increases the chance that the car is behind the remaining door to two in three (about 66.67%).
The key is that the host is not randomly opening one of the doors. The host knows what’s behind each door and is purposely opening a door that will reveal a goat.
Imagine the order of events were slightly different. After the contestant initially chooses a door, what if the host offered the option of trading that one door for both of the others. Clearly this doubles the chance of winning the car to two in three—it also gives the contestant a 100% chance of getting

���Appendix: Games of Chance
at least one goat. If the host then proved that a goat was behind at least one of the two doors, this would not alter the chance of winning the car.
Still don’t get it? You are not alone. Try playing the game.
Playing the Game
You play the role of the contestant. You choose from three doors, numbered 1 through 3. One of the remaining doors is then opened to show a goat. You are then given the option of staying with your original choice or switching to the other unopened door. After you make this final choice, your door is opened to reveal a car or a goat. Statistics in the bottom part of the window are updated with the latest results. You can choose to see just results for the current session or to see historical results (since about June 1, 2003).
To automatically play the game multiple times, enter a number in the field to the right of the doors and then click the Auto Play button. The program automatically plays the number of games you specified and updates the displayed results. During auto play, the contestant chooses a door randomly and then chooses to switch about half the time.
If you enter an especially high number, you might experience some delay as the games are processed.

��� Salmon Fishing
Game 7: The Birthday Problem: A Short Lesson in Probability
Source: http://www.mste.uiuc.edu/reese/birthday/intro.html
Happy Birthday! There’s a birthday in your class today! Or will there be two? How likely is it that two people in your class have the same birthday? Say your class has 28 students.
There are a number of ways to approach this problem. The most common is to take a survey and see if it happens that two birthdays fall on the same day. But if it happens in the surveyed class, will it occur in another class with different students? The question of how likely it is for any given class is still unanswered.
Another way is to survey more and more classes to get an idea of how often the match would occur. This can be time consuming and may require a lot of work. But a computer can help out. Below is a simulation of the birthday problem. It will generate a random list of birthdays time after time. Simply type the number of people in your virtual class into the textbox and hit <ENTER> to run the experiment.
Choose a number for your class size and do 10 trials with that size.
Questions for the Birthday Problem
• How do you explain so high a probability of a match? Can you come up with a picture that illustrates why it is so likely?
• How likely is it that a group of six students will have at least two birth-days in the same month? How could you simulate the problem to find the experimental probability of two birthdays in the same month?
An Explanation for the Birthday Problem
Let’s look at the probabilities a step at a time.
• For one person, there are 365 distinct birthdays. • For two people, there are 364 different ways that the second could
have a birthday without matching the first. • If there is no match after two people, the third person has 363 differ-
ent birthdays that do not match the other two. So, the probability of a match is 1 – (365)(364)(363) ⁄ (365)(365)(365).
• This leads to the following formula for calculating the probability of a match with N birthdays: 1 – (365)(364)(363) . . . (365 – N + 1) ⁄ (365)^N.

���Appendix: Games of Chance
Running this through a computer gives the chart below. Notice that a prob-ability of over .5 is obtained after 23 dates!
Notice that the probability is above .9 before the sample size reaches even 45.
Number of Birthdays
Pro
babi
lity
of a
Mat
ch
1
0.9
0.8
0.7
0.6
0.5
0.4
0.3
0.2
0.1
0
1 4 7 10 13 16 19 22 25 28 31 34 37 40 43 46 49 52 55 58
Birthdays on the Same Day

���
Additional Resources
for Teacher Reference
Burns, M. (1995). MATH By All Means: Probability Grades 3–4. New York: Math Solutions Publications.
Cuomo, C. (1993). In All Probability: Investigations in Probability and Statistics. Teacher’s Guide, Grades 3–6. Berkeley, California: LHS Gems.
Kopp, J. (1992). Frog Math: Predict, Ponder, Play—Teacher’s Guide. Berkeley, CA: Lawrence Hall of Science, University of California at Berkeley.
Lappan, G., Fey, J. T., Fitzgerald, W. M., Friel, S. N., & Phillips, E. D. (2004). How Likely Is It? Probability. Teacher’s Guide, Grade 6. Needham, Mass.: Pearson, Prentice Hall.
NCTM Addenda Series. Dealing With Data and Chance, for Grades 5–8. Reston, Virginia: National Council for Teachers of Mathematics.
Newman, C. M., Obremski, T. E., & Scheaffer, R. L. (1987). Exploring Probability. Palo Alto, CA: Dale Seymour Publications.
Shulte, A. P., & Choate, S. A. (1991). What Are My Chances, Book A (Grades 4–6). Mountain View, California: Creative Publications.
Wagner, S. F. (2005). Chances Are: A Primer on Probability. Upper Saddle River, NJ: Pearson, Prentice Hall.