Embed Size (px)
Citation preview
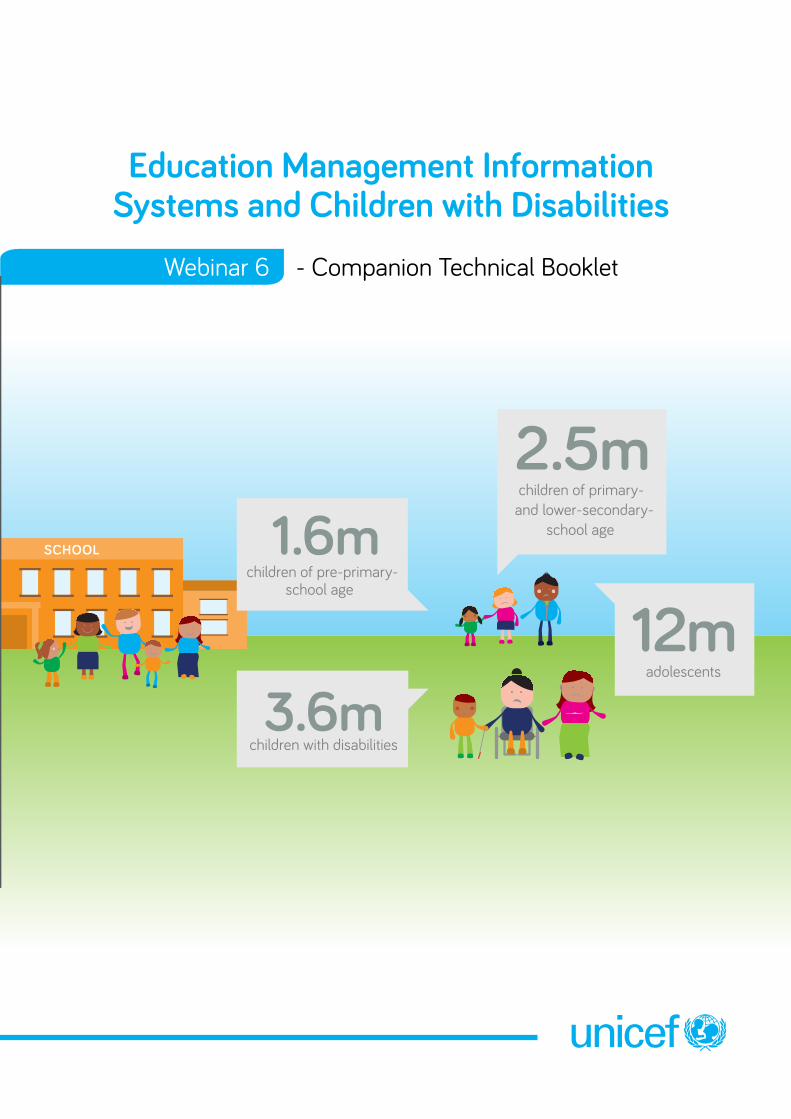
Education Management Information Systems and Children with Disabilities
- Companion Technical BookletWebinar 6
2.5mchildren of primary-
and lower-secondary-school age
12madolescents
3.6mchildren with disabilities
1.6mchildren of pre-primary-
school age
SCHOOL

© United Nations Children’s Fund (UNICEF) 2014
About the author: Daniel Mont is an international expert on disability data collection and inclusive development. He is currently a Senior Research Associate at the Disability and Inclusive Development Center at University College London and consults with many international agencies. Previously he was with The World Bank and was the chair of the UN Washington Group on Disability Statistics Analytical Working Group. He's published widely on disability measurement and on the socio-economic impact of disability in developing countries.
Permission is required to reproduce any part of this publication. Permission will be freely granted to educational or non-profit organizations. Others will be requested to pay a small fee.
Coordination: Paula Frederica HuntEditing: Stephen BoyleLayout: Camilla Thuve Etnan
Please contact: Division of Communication, UNICEF, Attn: Permissions, 3 United Nations Plaza, New York, NY 10017, USA, Tel: 1-212-326-7434; e-mail: [email protected]
With major thanks to Australian Aid for its strong support to UNICEF and its counterparts and partners, who are committed to realizing the rights of children and persons with disabilities. The Rights, Education and Protection partnership (REAP) is contributing to putting into action UNICEF’s mandate to advocate for the protection of all children’s rights and expand opportunities to reach their full potential.

Education Management Information Systems and Children with Disabilities Webinar Booklet
What this booklet can do for you 4
Acronyms and Abbreviations 5
I. The Need for Disability Indicators in Education Management Information Systems 6
The Need for Data . . . . . . . . . . . . . . . . . . . . . . . . . . . . . . . . . . . . . . . . . . . . . . . . . . . . . . . . . . . . . . . . . . . . . . . . . . . . . . . . . . . . . . . . . . . . . . . . 6
The Role of Educational Management Information Systems . . . . . . . . . . . . . . . . . . . . . . . . . . . . . . . . . . . . . . . . . . . . 7
II. An Overview of Education Management Information Systems and Disability 8What is an Education Management Information System? . . . . . . . . . . . . . . . . . . . . . . . . . . . . . . . . . . . . . . . . . . . . . . . 8
What Data on Disability Should be in an EMIS? . . . . . . . . . . . . . . . . . . . . . . . . . . . . . . . . . . . . . . . . . . . . . . . . . . . . . . . . . . . . 9
What Data on Disability are Typically Found in EMISs? . . . . . . . . . . . . . . . . . . . . . . . . . . . . . . . . . . . . . . . . . . . . . . . . . 10
III. Guide to Including Disability Data in an EMIS 15Recommended Questions for Childhood Disability . . . . . . . . . . . . . . . . . . . . . . . . . . . . . . . . . . . . . . . . . . . . . . . . . . . . . . 17
Recommended Questions on Physical and Material Barriers to Learning . . . . . . . . . . . . . . . . . . . . . . . . . . 22
Recommended Questions on Data on Human Resources and Services . . . . . . . . . . . . . . . . . . . . . . . . . . . 27
IV. Guide to Including Disability in EMIS Reports 31Children with Disabilities . . . . . . . . . . . . . . . . . . . . . . . . . . . . . . . . . . . . . . . . . . . . . . . . . . . . . . . . . . . . . . . . . . . . . . . . . . . . . . . . . . . . . . . 31
Physical Structures and Materials . . . . . . . . . . . . . . . . . . . . . . . . . . . . . . . . . . . . . . . . . . . . . . . . . . . . . . . . . . . . . . . . . . . . . . . . . . . 34
School Personnel . . . . . . . . . . . . . . . . . . . . . . . . . . . . . . . . . . . . . . . . . . . . . . . . . . . . . . . . . . . . . . . . . . . . . . . . . . . . . . . . . . . . . . . . . . . . . . . 36
Services Received . . . . . . . . . . . . . . . . . . . . . . . . . . . . . . . . . . . . . . . . . . . . . . . . . . . . . . . . . . . . . . . . . . . . . . . . . . . . . . . . . . . . . . . . . . . . . . 37
V. Summary 39
VI. Glossary of Terms 40
Endnotes 41
3
Webinar 6 - Companion Technical Booklet
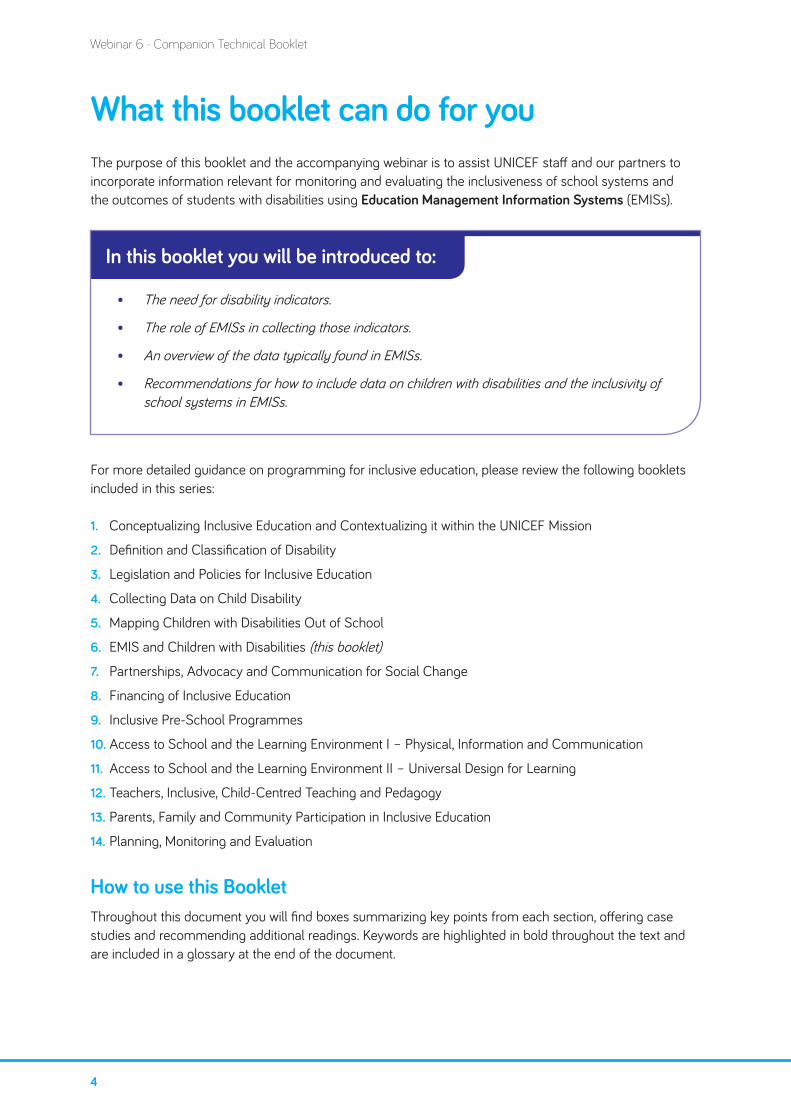
What this booklet can do for youThe purpose of this booklet and the accompanying webinar is to assist UNICEF staff and our partners to incorporate information relevant for monitoring and evaluating the inclusiveness of school systems and the outcomes of students with disabilities using Education Management Information Systems (EMISs).
In this booklet you will be introduced to:
• The need for disability indicators.
• The role of EMISs in collecting those indicators.
• An overview of the data typically found in EMISs.
• Recommendations for how to include data on children with disabilities and the inclusivity of school systems in EMISs.
For more detailed guidance on programming for inclusive education, please review the following booklets included in this series:
1. Conceptualizing Inclusive Education and Contextualizing it within the UNICEF Mission
2. Definition and Classification of Disability
3. Legislation and Policies for Inclusive Education
4. Collecting Data on Child Disability
5. Mapping Children with Disabilities Out of School
6. EMIS and Children with Disabilities (this booklet)
7. Partnerships, Advocacy and Communication for Social Change
8. Financing of Inclusive Education
9. Inclusive Pre-School Programmes
10. Access to School and the Learning Environment I – Physical, Information and Communication
11. Access to School and the Learning Environment II – Universal Design for Learning
12. Teachers, Inclusive, Child-Centred Teaching and Pedagogy
13. Parents, Family and Community Participation in Inclusive Education
14. Planning, Monitoring and Evaluation
How to use this BookletThroughout this document you will find boxes summarizing key points from each section, offering case studies and recommending additional readings. Keywords are highlighted in bold throughout the text and are included in a glossary at the end of the document.
4
Webinar 6 - Companion Technical Booklet

If, at any time, you would like to go back to the beginning of this booklet, simply click on the sentence "Webinar 6 - Companion Technical Booklet" at the top of each page, and you will be directed to the Table of Contents.
To access the companion webinar, just scan the QR code.
5
Webinar 6 - Companion Technical Booklet

Acronyms and Abbreviations
CRPD Convention on the Rights of Persons with Disabilities
EMIS Education Management Information Systems
MICS Multiple Indicator Cluster Survey
OOSCI Out-of-School Children Initiative
UN United Nations
UNESCO United Nations Education, Scientific and Cultural Organization
UNICEF United Nations Children’s Fund
WASH Water, Sanitation and Hygiene
WG Washington Group on Disability Statistics
6
Webinar 6 - Companion Technical Booklet

I. The Need for Disability Indicators in Education Management Information SystemsEducation is the gateway to full participation in society: to being able to secure a livelihood, and to avail oneself of all the opportunities that society has to offer. As such, education is a human right. But it is more than that: it also serves as a fundamental building block of economic and social development. For these reasons, universal primary education is at the heart of both human rights declarations and economic development frameworks.
Ensuring education for all children is important for children with disabilities, who are often stigmatized or excluded. In fact, school attendance is an important way for children with disabilities to break down the misconceptions that serve as barriers to inclusion elsewhere. To develop and implement policies to promote this, and to monitor their effectiveness, data are needed. Education management information systems are fundamental to securing that data in a timely and reliable way.
The Need for Data
A country cannot act efficiently and effectively to enhance the education of children with disabilities unless it has relevant, high-quality data. Evidence-based planning for service provision is hampered by not knowing how many children with disabilities are in the education system, and what type and severity level of disability they have. Prevalence patterns may differ geographically. So, too, may the nature and extent of barriers that are preventing children with disabilities from attending school, or succeeding in school once they do attend. There are three main purposes for data collection: policy design, monitoring implementation and evaluating outcomes.
Policy Design. In order to design effective policies, policy-makers must know the scale of the issue they are facing. How many children with disabilities, or other special needs, are in the education system? What are those needs? What are the barriers preventing educational success? Do these things vary according to age, gender, or geographical location? What should the priorities be for educational reform, and where can money be spent most effectively to obtain the desired outcomes? These questions cannot be answered without data.
Monitoring. Once policies are decided upon, they must be implemented. Data can help keep track of the extent to which these policies are actually put into action. How many teachers have received training? How many accessible schools have been built? How many children are receiving special services, like speech therapy? Are the intended reforms taking place uniformly across the country, or is implementation being hindered or facilitated by factors associated with geographical regions or other school attributes? Monitoring data can help determine bottlenecks and barriers in implementation in a timely manner, which can help policy-makers take corrective or supplemental actions to make sure policies are not going off track.
Evaluation. Policies are undertaken to achieve desired outcomes. In the case of education, this means increased enrollment and also increased educational attainment for children of all backgrounds and characteristics. Are children attending class? Are they advancing to the appropriate grade level? Are they graduating? Are their test scores improving? Data are needed to track these outcomes to determine the
7
Webinar 6 - Companion Technical Booklet

effectiveness of policies. To have a proper evaluation, baseline data are needed. To evaluate the long-term effects of policies, sustainable, ongoing time-series data are needed. A solid Education Management Information System can supply this.
The Role of Educational Management Information Systems
Education Management Information Systems are used for monitoring the education system. They will therefore lie at the heart of any data system that can meet the objectives of developing policies to increase the participation of children with disabilities in education, monitoring their implementation, and evaluating their success. Other data instruments, for example household surveys such as the UNICEF-supported Multiple Indicator Cluster Survey (MICS), also can play an important role. In fact, since an EMIS tracks only children in school, additional data sources are definitely needed to examine the issue of out-of-school children.
OpenEMIS
UNESCO has developed a tool, known as OpenEMIS, which is an open source system to support the components of a generic EMIS. OpenEMIS Education provides tools for the collection and reporting of data designed to monitor and evaluate education systems. It can be accessed at http://www.openemis.org. However, it does not address the issues of collecting data on children with disabilities.
Nevertheless, the EMIS is a fundamental source of information for advancing inclusive education. The goal of this document is not to provide general information on improving the overall quality of an EMIS, but rather to provide guidance on how an EMIS and other sources of administrative data can better address the issue of disability. Booklet 4 of this series discusses the role of household surveys in monitoring the education of all children with disabilities, including those not in school.
The first step in revising an EMIS to capture data necessary for promoting the education of children with disabilities is to clarify exactly what is meant by disability, and what definition should be used for crafting quantitative indicators. Booklet four in this series on disability data collection provides information on this, and makes the case that a functional approach that records the difficulties children have doing various activities — rather than the self-identification of disability or the presence of various diagnoses — is the best practice. This is the approach followed in this booklet.
Notes
8
Webinar 6 - Companion Technical Booklet
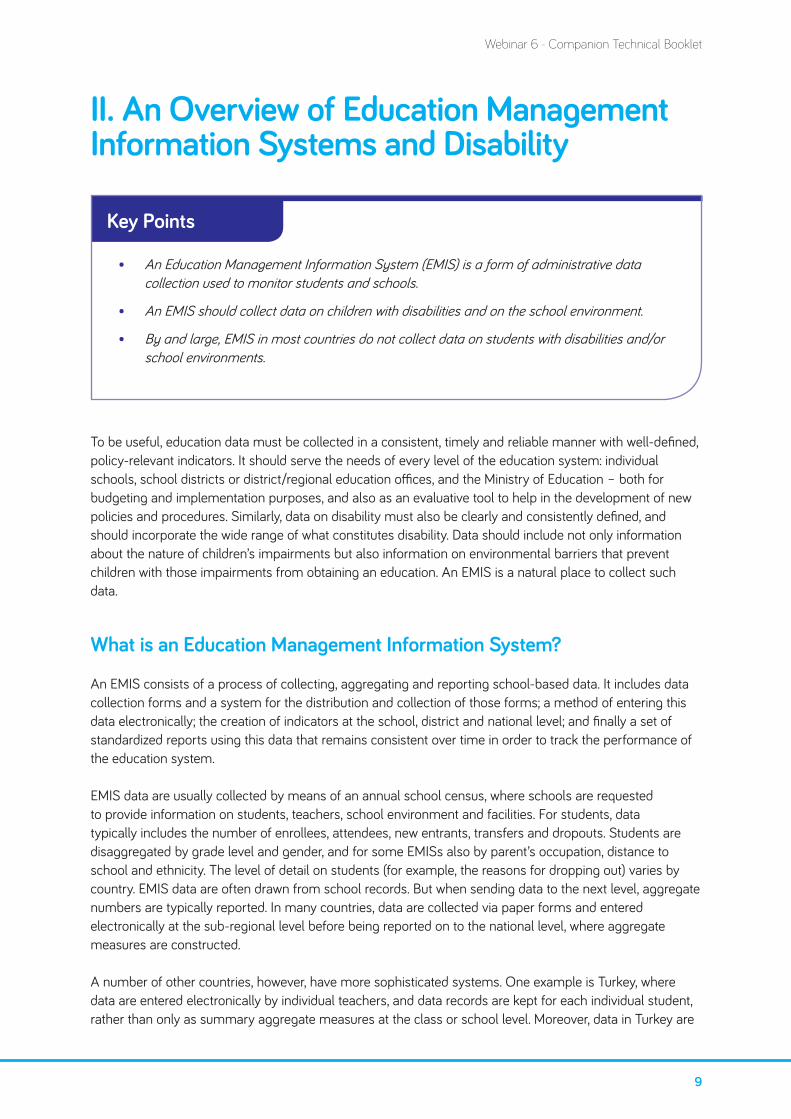
II. An Overview of Education Management Information Systems and Disability
Key Points
• An Education Management Information System (EMIS) is a form of administrative data collection used to monitor students and schools.
• An EMIS should collect data on children with disabilities and on the school environment.
• By and large, EMIS in most countries do not collect data on students with disabilities and/or school environments.
To be useful, education data must be collected in a consistent, timely and reliable manner with well-defined, policy-relevant indicators. It should serve the needs of every level of the education system: individual schools, school districts or district/regional education offices, and the Ministry of Education – both for budgeting and implementation purposes, and also as an evaluative tool to help in the development of new policies and procedures. Similarly, data on disability must also be clearly and consistently defined, and should incorporate the wide range of what constitutes disability. Data should include not only information about the nature of children’s impairments but also information on environmental barriers that prevent children with those impairments from obtaining an education. An EMIS is a natural place to collect such data.
What is an Education Management Information System?
An EMIS consists of a process of collecting, aggregating and reporting school-based data. It includes data collection forms and a system for the distribution and collection of those forms; a method of entering this data electronically; the creation of indicators at the school, district and national level; and finally a set of standardized reports using this data that remains consistent over time in order to track the performance of the education system.
EMIS data are usually collected by means of an annual school census, where schools are requested to provide information on students, teachers, school environment and facilities. For students, data typically includes the number of enrollees, attendees, new entrants, transfers and dropouts. Students are disaggregated by grade level and gender, and for some EMISs also by parent’s occupation, distance to school and ethnicity. The level of detail on students (for example, the reasons for dropping out) varies by country. EMIS data are often drawn from school records. But when sending data to the next level, aggregate numbers are typically reported. In many countries, data are collected via paper forms and entered electronically at the sub-regional level before being reported on to the national level, where aggregate measures are constructed.
A number of other countries, however, have more sophisticated systems. One example is Turkey, where data are entered electronically by individual teachers, and data records are kept for each individual student, rather than only as summary aggregate measures at the class or school level. Moreover, data in Turkey are
9
Webinar 6 - Companion Technical Booklet

updated throughout the year, and include additional information such as family characteristics, the services each child receives and students’ grades.
The quality of EMISs varies and they are often plagued by a variety of problems. These include:
• Lack of compliance by schools in filling out the forms in a correct and timely manner.
• Lack of consistent historical data for monitoring trends.
• Weak procedures for cleaning and validating data.
• Low capacity of staff and infrastructure for maintaining EMIS and generating reports.
• Insufficient procedures for wide and timely dissemination of data for generating analysis.
This booklet addresses how well EMIS data collection incorporates information necessary for monitoring and evaluating how the education system meets the needs of children with disabilities. It makes no specific recommendations for improving the underlying EMIS system, except to the extent that it addresses how the school records used to generate the EMIS data should be structured to allow for the collection of appropriate data on children with disabilities.
It is important to keep in mind that an EMIS only collects data on children who are interacting with the education system. To the extent that children with disabilities do not enroll in school, they will not be captured in an EMIS. So, while an EMIS can be a useful tool for monitoring the participation and success of children in school, and also the accessibility of the school environment, it cannot address the question of the enrollment rate of children with disabilities or the reasons for non-enrollment. A household-based survey that includes a module on disability – such as the Multiple Indicator Cluster Survey – is necessary for those purposes. The UNICEF/UIS operational manual on conducting a study for the Out of School Children Initiative (OOSCI) provides guidance on how to examine this, as does Booklet 5 in this series.1
What Data on Disability Should be in an EMIS?
Successful implementation of Article 24 of the CRPD (Convention on the Rights of Persons with Disabilities) requires high-quality data useful for developing policies and then monitoring and evaluating their implementation. These data fall into several categories:
1. Identification of Children with Disabilities. According to Article 1 of the CRPD, these include “those who have long-term physical, mental, intellectual, or sensory impairments which in interaction with various barriers may hinder their full and effective participation in society on an equal basis with others”.
2. Physical and Material Barriers to Learning. These include physical access to school buildings, but also to the use of furniture, equipment, learning materials and communication supports (e.g., Braille and audio books, signage, etc.) for delivering information. For more information, please see Booklets 10 and 11 of this series.
3. Human Resources and Services. These include the training of teachers, their access to support services to assist their teaching, and also support services designed to assist students. Those services could include things such as speech, physical and occupational therapy, or the presence of classroom aids. For more information, please see Booklets 11 and 12 of this series.
4. Measures of Student Success. These include standard educational outcome measures that are used
10
Webinar 6 - Companion Technical Booklet

for all students, such as enrollment, attendance, repeating, dropping out, transition, test scores and graduation.
What Data on Disability are Typically Found in EMISs?
EMIS data forms from 40 countries were reviewed in a recent UNICEF guidance note on including disability into EMISs. While not a random sample of countries, they provide a fairly broad range of approaches to measuring these concepts.
Data on Children with Disabilities
Nineteen of the 40 countries reviewed contained no data on children with disabilities, which did not allow for any monitoring whatsoever of their educational experience. Most likely, this is not unusual for EMISs from developing countries around the world. Of the 21 countries with some recording of children with disabilities, all but three attempted to classify them by type of disability. Belize simply records whether children are in a special-needs class, which gives no information on the type or severity of disability, and may also exclude children with disabilities who are not in special classes. Grenada records the number of children receiving itinerant or special-needs services. This has the same limitations as data from Belize, with the added complication that some children receiving itinerant services may not have disabilities. Senegal simply lists the number of children with disabilities, with no guidance as to what constitutes a disability.
Some other countries do categorize children with disabilities, which can be done both by type of disability and by severity. Type of disability refers to the functional domain in which a child has an impairment – for instance, seeing or moving around. For example, some countries’ EMIS questionnaires refer to blind and deaf children. However, this only identifies children with the most severe impairments. Some countries attempt to identify children with a broader range of disabilities. For example, in Nigeria children are listed as having a vision disability if they are either blind or visually impaired. This identifies more children with disabilities, but the degree of disability is not recorded, so children with mild versus severe impairments cannot be identified. In some countries, for example in Namibia and India, the EMIS does separate children by the degree of difficulties, not just in the functional domain of vision, but in the cognitive domain as well. Interestingly, no country among the 40 reviewed attempted to separate children with physical disabilities by severity.
Some countries rely on medical diagnoses. Sierra Leone collects data on children who are polio victims under the physical category, although there are many more causes of physical disabilities including, for example, violence, accidents and congenital conditions. Related to this approach, several countries combine difficulties with speech directly to hearing, asking for the number of children with hearing and speech difficulties. However, while hearing difficulties are probably a major cause of speech difficulties, there are other causes. For example, autistic children or children with significant cognitive disabilities might also have problems with speech. By tying hearing and speech together in a single question, the EMIS probably under-identifies children with speech problems.
Some countries also mention specific conditions such as albinism, epilepsy, autism and cerebral palsy. There is some rationale for doing this. For example, a condition such as albinism might be an impairment which is primarily important because of the cultural situation. That is, a child with albinism may face only social barriers to learning, and so for planning and monitoring purposes might need to be specifically identified. Any intervention for these children may be very specific. Similarly, there may be particular conditions, such as epilepsy, that require specific types of medication. It may be important for planning service delivery to know how many children need this specific intervention. However, care should be taken
11
Webinar 6 - Companion Technical Booklet

in asking about specific diagnoses. As stated earlier, a diagnosis often does not provide much information on a child’s functioning. For example, children with autism and cerebral palsy both fall under a very broad range of functioning and can have very different needs. Also, children may not be diagnosed – or be misdiagnosed – even though it is apparent that they have difficulties in school. Only Namibia had a question about behavioural disorders that could potentially identify children with psycho-social disabilities.
Timor-Leste takes a different approach, relying on the census questions developed by the UN Statistical Commission’s Washington Group (WG) on Disability Statistics. These do not ask about diagnoses but ask about difficulty undertaking six core activities: seeing, hearing, mobility, cognition, communication and self-care. The response categories also allow people to be identified by the degree of disability. However, it should be noted that these questions were designed for adults, and evidence suggests they may not be very accurate for young children. The WG and UNICEF have developed, and will soon be completing, the testing of a separate set of questions specifically designed for children, while taking the same functional approach as the WG adult questions. These are intended for use in the next round of the Multiple Indicator Cluster Survey. Material explaining the rationale and approach of these questions will be published by UNICEF in early 2015.
Data on Physical and Material Barriers to Learning
The EMIS forms reviewed for the guidance note contained very little information on the physical accessibility of schools for children with disabilities. Some data that came close was information on roads from seven countries. EMIS forms included items such as how far the nearest road was from the school and whether the road was passable during the rainy season. This pertains to access for all students, but is especially important for children with disabilities, in particular those with physical and vision difficulties.
At the same time, 24 of the 40 countries collected information about the physical infrastructure of the school, and several about materials and supplies. Some countries asked only a few basic questions, while others had an extensive list about toilets, utilities, building materials, condition of facilities, types of rooms (e.g., medical room, computer room and staff rooms), size of rooms, types of furniture, as well as equipment such as audio-visual equipment, fire extinguishers, water coolers, internet connections and musical instruments, etc. Only in Bangladesh was there any mention of provisions for children with disabilities in each of the school’s rooms.
Toilets have often been cited as a major barrier to school attendance for children with physical disabilities. But while 21 countries asked specific questions about the availability of toilets for boys, girls and staff, only one addressed the question as to whether these toilets were accessible to children with disabilities.For more information, please see Booklets 10 and 11 of this series.
Data on Human Resources and Services
Extensive information is collected on most EMIS forms when it comes to the education, experience and qualification of teachers. This includes type of training and degrees, subject certification and years teaching. Some countries also collect information on teacher transfers and the reasons for teachers leaving their positions. As with physical facilities, however, training on inclusive education, or of supports to teachers dealing with issues that may arise with their students with disabilities, is not collected. Mention of services available for children with disabilities is also scant. The Gambia reports on whether there are assessments for various types of disability, but nothing about follow-up services. Belize, Ethiopia and Namibia record whether a child is in a special school or class. Presumably these children are getting some kind of special services, but they are not recorded in the EMIS. Ghana records slightly more detailed information, listing whether the school provides any children with hearing aids, glasses, wheel-chairs, Braille or ‘other’. The
12
Webinar 6 - Companion Technical Booklet

notable exception in the EMISs reviewed in the UNICEF EMIS disability guidance note is India, where if children are enrolled in ‘Special Training’ the form asks for the following information:
• Number of boys and girls enrolled with need of Special Training in current year.
• Number of boys and girls provided Special Training in the current year.
• Number of boys and girls enrolled in Special Training in the previous year.
• Number of boys and girls completed Special Training during the previous year.
• Who conducts the Special Training (teacher, special teacher, both, NGO, others)?
• Where is Special Training conducted (in school, off school, both)?
• Type of Special Training conducted (residential, non-residential, both).
• Number of teachers available for conducting Special Training.
• Number of teachers receiving training for conducting Special Training.
• Whether Special Training material is made available to children.
But, while this information is useful it has the following drawbacks:
First, it focuses on a model of special education, as opposed to inclusive education. That is, there is no recording of teachers trained to deal with children with disabilities as part of the general classroom, nor is there any information on aides or other class resources that can help teachers operate a more inclusive setting. This, of course, could very well be because those types of education efforts are not yet under way. However, if a system is to move towards a more inclusive model, such information will be important to collect.
Second, no specific information is collected on what type of special training is being offered. Is it one-on-one tutoring? Is it physical, speech or occupational therapy? Nor does it talk about the type of training that teachers have received. Inclusive education involves child-centered teaching and teachers must adapt each year to the particular students and situations they have in their class, as explained in Booklet 1 of this series. One-off training or only pre-service training does not suffice. Access to on-going training and expert consultations are particularly important.
For more information, please see Booklets 11 and 12 of this series.
13
Webinar 6 - Companion Technical Booklet

Measures of Student Success
EMISs track students’ experiences in the education system through enrollment, attendance, repeating a grade, dropping out and graduation. They also often collect information on transfers and new entrants in order to better track their school populations. In the EMISs reviewed for this work, there was no instance of any of these measures being disaggregated by disability. One slight exception is that in a handful of countries sickness was listed as one of the reasons for dropping out of school. In Grenada, deviant behaviour and the irrelevance of the curriculum were also listed as possible reasons for dropping out. These are probably correlated with, but definitely not limited to, the presence of a disability. Deviant behaviour may be associated at times with psycho-social disabilities, and irrelevance of the curriculum, possibly, to students with significant learning disabilities.
Activity
• Which data related to disability are collected in your EMIS?• Which data on children’s disabilities?• Which data on accessibility of buildings and materials?• Which data on services provided, or teacher training?• Which data do you think is most important to collect, and why?• Which data would help you design better policies?
14
Webinar 6 - Companion Technical Booklet

To learn more go to:
• UNESCO’s website on EMIS at http://www.unesco.org/new/en/education/themes/planning-and-managing-education/policy-and-planning/emis
• OpenEMIS at https://www.openemis.org/index.php?lang=eng
• Visit www.unicef.org/disabilities/ for new and updated information
Notes
15
Webinar 6 - Companion Technical Booklet
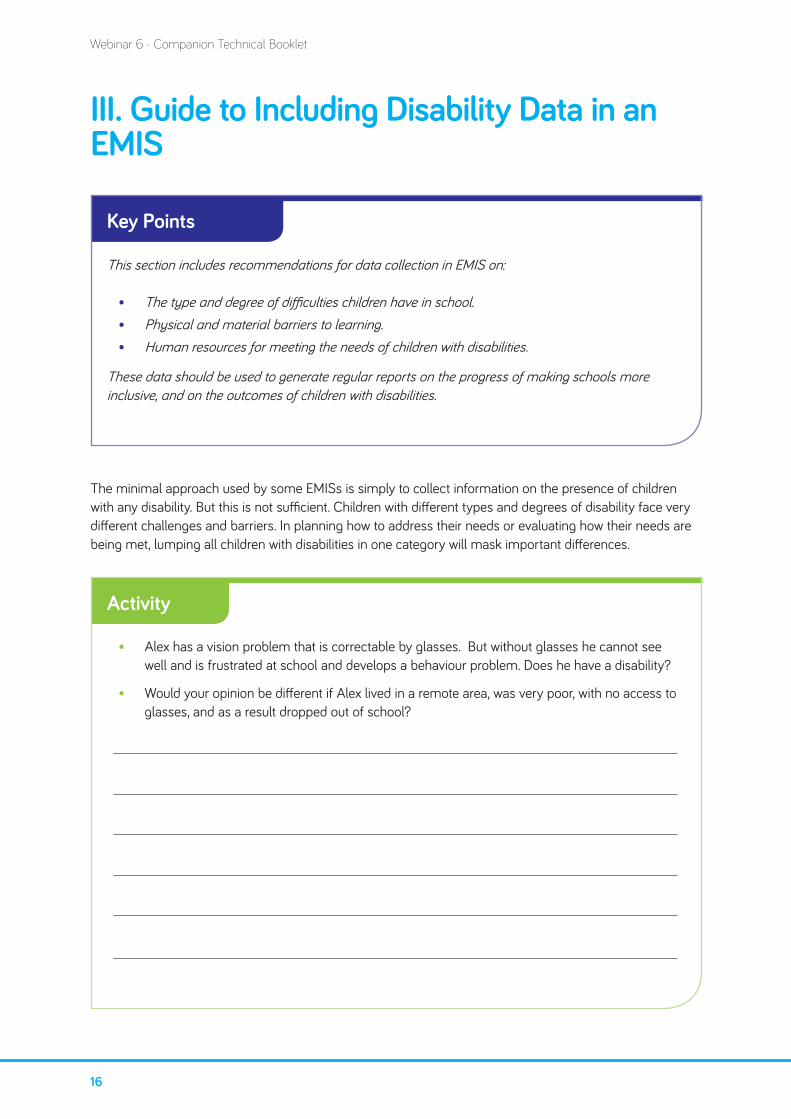
III. Guide to Including Disability Data in an EMIS
Key Points
This section includes recommendations for data collection in EMIS on:
• The type and degree of difficulties children have in school.• Physical and material barriers to learning.• Human resources for meeting the needs of children with disabilities.
These data should be used to generate regular reports on the progress of making schools more inclusive, and on the outcomes of children with disabilities.
The minimal approach used by some EMISs is simply to collect information on the presence of children with any disability. But this is not sufficient. Children with different types and degrees of disability face very different challenges and barriers. In planning how to address their needs or evaluating how their needs are being met, lumping all children with disabilities in one category will mask important differences.
Activity
• Alex has a vision problem that is correctable by glasses. But without glasses he cannot see well and is frustrated at school and develops a behaviour problem. Does he have a disability?
• Would your opinion be different if Alex lived in a remote area, was very poor, with no access to glasses, and as a result dropped out of school?
16
Webinar 6 - Companion Technical Booklet

Obtaining information on children whose disabilities cover a wide range of support needs is important. Sometimes a minor impairment can be very disabling. For example, Alex, the child in the above activity, has a minor medical impairment. But if Alex lives in an environment where glasses are not obtainable and therefore drops out of school, that minor impairment has had a major impact on his life. If Alex was identified by an EMIS and a system was put in place to address children having difficulties doing various activities, then that could prevent him from dropping out.
Countries with EMIS forms that refer to children with ‘disabilities’, as opposed to children with ‘difficulties’ risk missing children with minor impairments, even if those minor impairments can have significant impacts on education. The word ‘disability’ usually conveys the impression that the condition is medically severe, and so can miss children with mild or moderate impairments.2 This is the reason that The Tanzania National Disability Survey (2008), for example, does not ever include the word ‘disability’ in any of its questions. Rather, it asks only about difficulties in doing various activities. One advantage of the Timor-Leste questions is that children with even minor difficulties in functioning are both identified and kept distinct from those with more significant difficulties. This allows for a more nuanced evaluation of how children are faring in the school system and which interventions could help various types of children. In Cambodia, it was found that children bathing in dirty water had high incidences of ear infections which could potentially lead to permanent hearing loss. But they had been identified through screening as only having some difficulty in hearing.3
Another issue pertains to the recording of children with multiple disabilities. The way many EMIS forms classify children as having multiple disabilities hides the types of difficulties they have. A child may have vision and mobility difficulties, or she may have hearing and intellectual difficulties. If the purpose behind the data is simply to count the number of children with disabilities, then recording these details is not an issue. But if the goal is to plan for services then it is important to know how many children may need, say, Braille books. In addition, knowing the types of disabilities a child with multiple disabilities has can help the school system monitor whether different types of disabilities lead to different outcomes, or spot patterns in disability prevalence that may indicate local causes of disability (e.g., dirty bathing water). Therefore, a system which can identify both how many children have at least one disability, and how many children have each type of disability is preferred (allowing for one child to be double-counted in the second instance but not the first, as can be seen in Table 1a). However, it should be mentioned that Table 1a would not provide information on how many children had a particular set of disabilities – for example, both vision and hearing difficulties. That would require a much more extensive table.
In Table 1a, the difficulties refer to the child’s ability to do that specific task, not to the implications from having that difficulty. So in the case of Alex, above, a teacher would report him as having ‘some difficulty’ seeing, even if the implication of that level of difficulty seeing caused him great difficulties in the classroom because of the particular classroom environment.
17
Webinar 6 - Companion Technical Booklet

Table 1a: Recommended questions for EMIS form for children with disabilities
Compared with children of the same age, how many children enrolled in school have difficulties in the following areas (a child can be counted in more than one area)?:
Vision Hearing Gross Motor (e.g., walking or climbing steps)
Fine Motor(e.g., writing or fastening clothes)
Intellectual Communication (understanding and being understood by others)
Behaviour and socialization
Som
e di
fficu
lty
A lo
t of
diffi
culty
Som
e di
fficu
lty
A lo
t of
diffi
culty
Som
e di
fficu
lty
A lo
t of
diffi
culty
Som
e di
fficu
lty
A lo
t of
diffi
culty
Som
e di
fficu
lty
A lo
t of
diffi
culty
Som
e di
fficu
lty
A lo
t of
diffi
culty
Som
e di
fficu
lty
A lo
t of
diffi
culty
Boys
Girls
TOTAL
How many children enrolled in school have difficulties in the following number of areas, as recorded above?
1 area 2 areas 3 areas 4 areas 5 areas 6 areas All 7 areas TOTAL
Boys
Girls
TOTAL
Recommended Questions for Childhood Disability
Table 1a provides a template for the minimum recommended set of questions to identify children with disabilities. These questions lessen stigma by asking about difficulties, as opposed to disability, and they classify children by both type and degree of disability. Finally, the method for accounting for multiple disabilities allows the system to track not only the impact of having multiple disabilities, but also how many children have each type of disability. Data are disaggregated by gender because studies have shown that disability can have a more significant impact on girls, and so the gender dimension needs to be considered.4
This form requires no calculation on the part of the person completing the form. If, for example, a boy has both vision and hearing problems, he will be counted as one of the children having vision problems and also one of the children having hearing problems. But he will also be counted as one of the children having difficulties in two areas. That way, the school knows how many children have difficulties in each functional area, and the data analyst generating the report can combine this information to calculate the total number of children with any disability.
18
Webinar 6 - Companion Technical Booklet

If space permits, these data can be disaggregated by grade as well and put into two tables, as shown in Tables 1b and 1c.
Table 1b: Sample EMIS form for children with disabilities by grade level
Compared with children of the same age, how many children enrolled in school have difficulties in the following areas (a child can be counted in more than one area)?:
Vision Hearing Gross Motor (e.g., walking or climbing steps)
Fine Motor(e.g., writing or fastening clothes)
Intellectual Communication (understanding and being understood by others)
Behaviour and socialization
Som
e di
fficu
lty
A lo
t of
diffi
culty
Som
e di
fficu
lty
A lo
t of
diffi
culty
Som
e di
fficu
lty
A lo
t of
diffi
culty
Som
e di
fficu
lty
A lo
t of
diffi
culty
Som
e di
fficu
lty
A lo
t of
diffi
culty
Som
e di
fficu
lty
A lo
t of
diffi
culty
Som
e di
fficu
lty
A lo
t of
diffi
culty
GRADE 1
Boys
Girls
TOTAL
GRADE 2
Boys
Girls
TOTAL
Table continues for additional grade levels.
19
Webinar 6 - Companion Technical Booklet
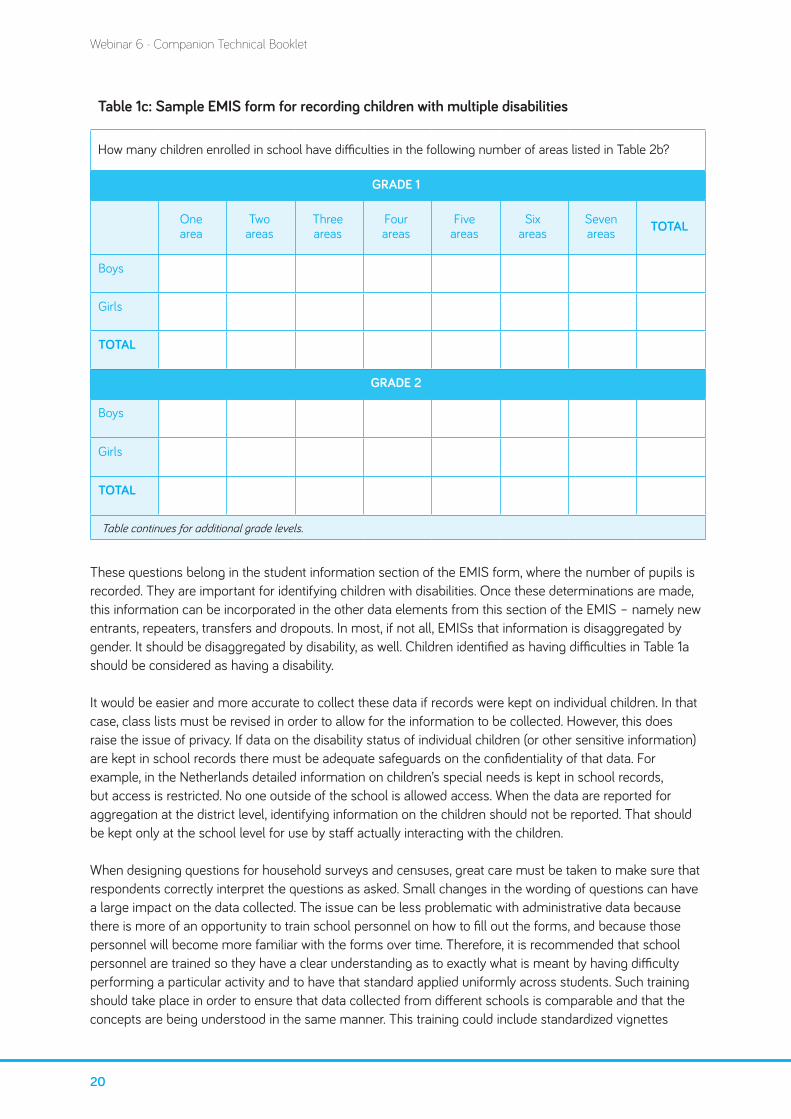
Table 1c: Sample EMIS form for recording children with multiple disabilities
How many children enrolled in school have difficulties in the following number of areas listed in Table 2b?
GRADE 1
One area
Two areas
Three areas
Four areas
Five areas
Six areas
Seven areas TOTAL
Boys
Girls
TOTAL
GRADE 2
Boys
Girls
TOTAL
Table continues for additional grade levels.
These questions belong in the student information section of the EMIS form, where the number of pupils is recorded. They are important for identifying children with disabilities. Once these determinations are made, this information can be incorporated in the other data elements from this section of the EMIS – namely new entrants, repeaters, transfers and dropouts. In most, if not all, EMISs that information is disaggregated by gender. It should be disaggregated by disability, as well. Children identified as having difficulties in Table 1a should be considered as having a disability.
It would be easier and more accurate to collect these data if records were kept on individual children. In that case, class lists must be revised in order to allow for the information to be collected. However, this does raise the issue of privacy. If data on the disability status of individual children (or other sensitive information) are kept in school records there must be adequate safeguards on the confidentiality of that data. For example, in the Netherlands detailed information on children’s special needs is kept in school records, but access is restricted. No one outside of the school is allowed access. When the data are reported for aggregation at the district level, identifying information on the children should not be reported. That should be kept only at the school level for use by staff actually interacting with the children.
When designing questions for household surveys and censuses, great care must be taken to make sure that respondents correctly interpret the questions as asked. Small changes in the wording of questions can have a large impact on the data collected. The issue can be less problematic with administrative data because there is more of an opportunity to train school personnel on how to fill out the forms, and because those personnel will become more familiar with the forms over time. Therefore, it is recommended that school personnel are trained so they have a clear understanding as to exactly what is meant by having difficulty performing a particular activity and to have that standard applied uniformly across students. Such training should take place in order to ensure that data collected from different schools is comparable and that the concepts are being understood in the same manner. This training could include standardized vignettes
20
Webinar 6 - Companion Technical Booklet

describing particular situations where a child would be considered to have ‘no difficulty’, ‘some difficulty’, or a ‘lot of difficulty’ undertaking various activities.
Teachers are very familiar with what children of a particular age are expected to be able to do within their cultures and can identify which ones are having difficulties that go beyond what is typical. For difficulties seeing, hearing and moving these can generally be pretty straightforward; problems with behaviour are more difficult. Children can have behavioural issues because of certain mental health or developmental conditions, or they can have difficulties because they are experiencing various stresses at home that are not related to a particular impairment. For the purposes of measuring disability prevalence, this might create some false positives. But for the purpose of an EMIS it is not as problematic, because these children are still having difficulties at school that require the special attention of their teachers and the school. Identifying these children, planning for them and monitoring their outcomes is still an important role for the EMIS.
Once data are collected on children with disabilities, it is then possible to disaggregate the various indicators used to assess the education system. The minimum level of disaggregation that should be done is shown in Table 2a. This table is a sample form for displaying enrollment data disaggregated by gender and disability. Similar tables should also be generated for other standard indicators, such as dropouts, new entrants, transfers, or whatever other category of students is already reported on by the EMIS. If space allows, then disaggregation by type of disability would be useful. Table 2b is an example.
Table 2a: Sample form for recording school participation of children with disabilities
ENROLEES
Grade 1 Grade 2 ... Grade 6
Boys Girls Boys Girls Boys Girls Boys Girls
Students without disabilities
Students with disabilities
TOTAL
This table is repeated for dropouts, new entrants, transfers, or whatever other category of students already collected by the existing EMIS form
21
Webinar 6 - Companion Technical Booklet

Table 2b: Sample form for recording school participation of children with disabilities at more detailed level
ENROLEES
Grade 1 Grade 2 ... Grade 6
Boys Girls Boys Girls Boys Girls Boys Girls
Students without disabilities
Students with disabilities in...
Vision
Hearing
Gross Motor
Fine Motor
Intellectual
Communication
Behaviour and Socialization
Multiple Disability
This table is repeated for dropouts, new entrants, transfers, or whatever other category of students already collected by the existing EMIS form. Also, each child can only be assigned to one type of disability. So if they have multiple disabilities they are only listed in the multiple disability category. Information from Table 2 can be used to look at what type of disabilities they are likely to have.
A final issue is the manner in which these EMIS forms are completed. Are school personnel responding with aggregate numbers, or are they basing their computations on class listings? That is, do they refer to specific class lists where individual children are flagged as having particular difficulties? In that case, they only have to sum up the information from existing lists. Or, do they only consider this question when filling out the EMIS form and are making an estimate based on their recollection? If it is the former, the data will be much more accurate. Another advantage of this method is that it identifies which children are in need of particular services within the administrative record. The exact nature of these tables may be modified to be more closely in sync with the existing school census form.
22
Webinar 6 - Companion Technical Booklet
Recommended Questions on Physical and Material Barriers to Learning
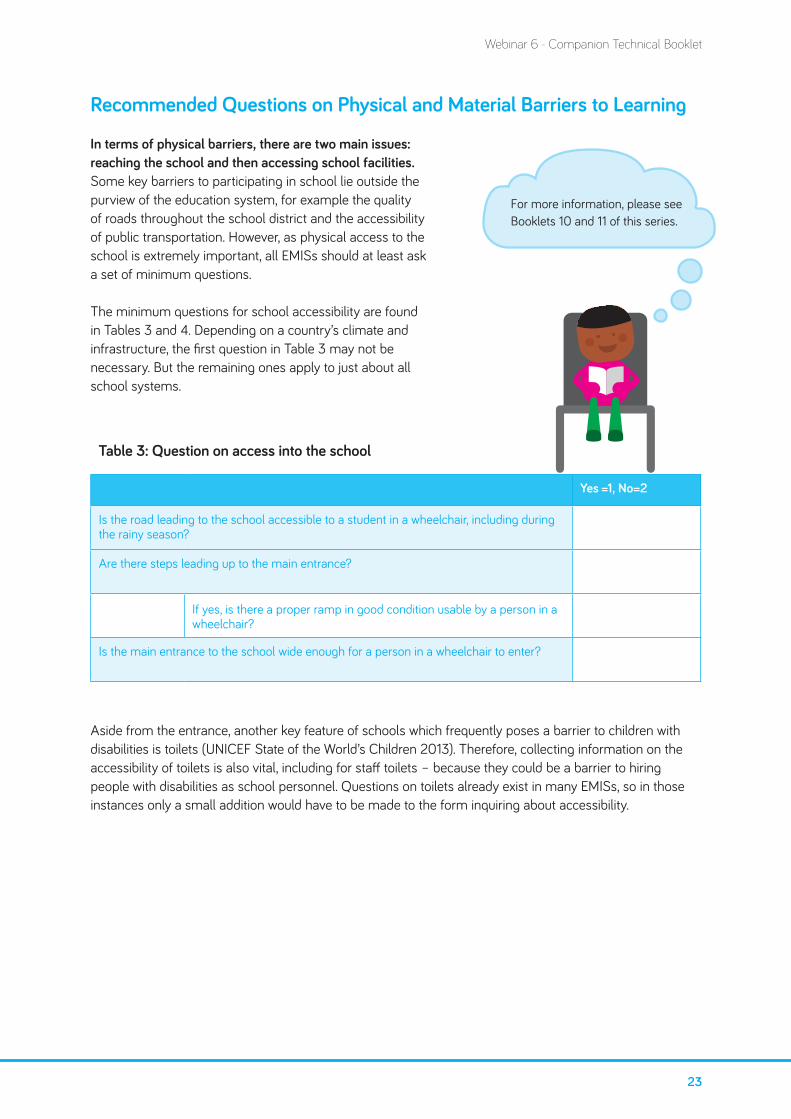
In terms of physical barriers, there are two main issues: reaching the school and then accessing school facilities. Some key barriers to participating in school lie outside the purview of the education system, for example the quality of roads throughout the school district and the accessibility of public transportation. However, as physical access to the school is extremely important, all EMISs should at least ask a set of minimum questions.
The minimum questions for school accessibility are found in Tables 3 and 4. Depending on a country’s climate and infrastructure, the first question in Table 3 may not be necessary. But the remaining ones apply to just about all school systems.
Table 3: Question on access into the school
Yes =1, No=2
Is the road leading to the school accessible to a student in a wheelchair, including during the rainy season?
Are there steps leading up to the main entrance?
If yes, is there a proper ramp in good condition usable by a person in a wheelchair?
Is the main entrance to the school wide enough for a person in a wheelchair to enter?
Aside from the entrance, another key feature of schools which frequently poses a barrier to children with disabilities is toilets (UNICEF State of the World’s Children 2013). Therefore, collecting information on the accessibility of toilets is also vital, including for staff toilets – because they could be a barrier to hiring people with disabilities as school personnel. Questions on toilets already exist in many EMISs, so in those instances only a small addition would have to be made to the form inquiring about accessibility.
For more information, please see Booklets 10 and 11 of this series.
23
Webinar 6 - Companion Technical Booklet

The questions on toilets recommended by UNICEF in its WASH in Schools Monitoring Package are shown in Table 4. These include the recommended core questions plus two of the monitoring package’s expanded questions – the one on teachers’ toilets and accessibility – and an additional question on accessibility of the teachers’ facility.
Table 4: Minimum questions on toilets for inclusion in the EMIS
Does the school have any toilet facilities? (Yes=1, No=2)
If yes...
How many toilet compartments are there in the school for children?
Functional Not Functional
Exclusively for girls
Exclusively for boys
For boys or girls (communal toilet compartments anyone can use)
Are toilets accessible to children with physical disabilities? (Yes=1, No=2)
Do teachers have their own toilet facilities separate from children? (Yes=1, No=2)
If yes, are the teacher’s facilities accessible to a person with physical disabilities? (Yes=1, No=2)
If questions already exist on the EMIS asking about additional facilities, then accessibility should be addressed. This includes not only classroom settings but all facilities, including recreational areas, health clinics or anything else on site. This could be done by adding an additional column to the form with a check-off for accessibility. Table 5 uses an example from India, with an additional column added and shaded in.
24
Webinar 6 - Companion Technical Booklet

Table 5: Adapted table from India EMIS form with additional column for accessibility
Particulars Availability (0=Not applicable, Yes=1, No=2)
Accessible to Students with Disabilities (0=Not applicable, Yes=1, No=2)
Separate room for Asst. Head Master/ Vice-Principal
Auditorium
Separate common room for girls
Staffroom for teachers
ICT lab
Computer room
Room for indoor games
Co-curricular/activity room
NCC/NSS/Scout and Guide room
First aid/sick/medical room
Staff quarters
Integrated science laboratory
Library
Beyond adding a column on accessibility to already existing questions, it is also recommended to add questions that specifically relate to aspects of the accessibility of rooms in general. These questions are displayed in Table 6, but it should be noted they reflect only physical accessibility. There are additional issues on the accessibility of information. These are addressed to some extent in the materials section below, but there are other aspects of accessibility, for example presence of sign language interpreters, that could also be included in the EMIS.
25
Webinar 6 - Companion Technical Booklet

Table 6: Additional questions on physical accessibility
How many classrooms are there?
How many classrooms are accessible to students with disabilities?
How many floor levels are in the building?
How many floor levels are accessible to students with disabilities, either through ramps or an elevator?
How many rooms have emergency exits?
How many emergency exits are accessible to students with disabilities?
Does the school have an evacuation plan for students with disabilities?
In addition to physical structure there are also materials. These include instructional materials such as books and computers, and other equipment such as sports and recreational equipment. Of course, asking about various structures and materials should be done only if they are relevant to a particular school system. For example, in some schools there may be no expectation that any computers are present.
26
Webinar 6 - Companion Technical Booklet

Table 7 lists a series of material questions. Again, although these are based on the fields found in the EMIS review they should be prioritized based on the local context. Some of these materials will be non-existent, or very scarce in some settings, and so do not warrant inclusion on the form.
It should also be noted that UNICEF recommends improved questions on a variety of facilities and materials – for example questions on water and hygiene in the WASH in Schools Monitoring Package. Where possible, these recommendations should also be adopted, including the recommended expanded questions on accessibility.
Table 7: Sample questions on materials for students with disabilities
GENERAL MATERIAL OR EQUIPMENT
Does your school have ... Yes=1, No=2 Accessible (Yes=1, No=2)
Recreational equipment
Water cooler
Computers
Blackboard
SPECIAL MATERIALS OR EQUIPMENT
Does your school have a sufficient quantity of the following materials for the students who need them? Yes=1, No=2
High quality =1Average quality=2Low quality=3
Braille books
Audio books
Hearing loop
Modified furniture
Assistive devices for gripping (e.g., for pencils)
Handrails
Computer screen readers
Large, easy-to-read signage
27
Webinar 6 - Companion Technical Booklet

Recommended Questions on Data on Human Resources and Services
Many EMIS forms ask for extensive information on staff. This includes not just aggregate numbers of staff but also the specific qualifications of each staff member. Data elements include highest educational level achieved and type of degree, personal information on age and gender, employment history, salary scale, and number and type of classes taught.
The optimal strategy for including information on teachers’ capacity regarding inclusive education would be to add additional columns to the forms that inquire about teachers’ training, certification and experience (as seen in Table 9). However, the sections for information on staff are sometimes quite extensive and adding extra columns to existing forms pertaining to specific training on special or inclusive education and experience with children with disabilities may cause difficulties in form layout. Therefore, the minimum acceptable questions on teacher capacity in the EMIS are found in Table 8. Please note, though, that this is the minimum number of questions, intended to ascertain whether any training has occurred and whether the teachers have any type of access to specialists. If the there is enough room in the EMIS, further questions could be asked about the availability, nature and quality of those supports.
For more information, please see Booklets 11 and 12 of this series.
Table 8: Minimum EMIS questions on teacher capacity
Answer
In the past year, how many teachers received in-service training on teaching children with disabilities?
Do teachers have access to specialists for teaching children with disabilities? (Yes=1, No=2)
If yes, how many are in your school?
If yes, how many are located outside your school?
Table 9 shows an example of collecting more detailed information on teacher capacity, attached directly to the already-existing staff sections of current EMISs. It uses the current EMIS questions on teacher qualifications from the Nigerian EMIS. The shaded rows and columns have been added to the current form to allow for the collection of information related to the teachers’ capacity to teach children with disabilities. The shaded option ‘7 – Special or Inclusive Education’ is added to Nigeria’s ‘subject of qualification’ response list.
The education goal in the CRPD is inclusive education. But the understanding in most countries of what inclusive education and special education are, and how they are different, is limited. Therefore, the headings of the additional columns refer to teaching children with disabilities, not special or inclusive education per se. For more advanced school systems that are building supports for more inclusive schools, the questions in Table 10 could also be included.
28
Webinar 6 - Companion Technical Booklet

Table 9: Sample questions on teacher capacity integrated into current teacher staff information collected: Example adapted from Nigeria’s form
Enter information on all teachers who: (1) are on the school payroll, whether they work at the school or are absent for a long time; (2) work at the school but are not on the school payroll
Gender M-Male F-Female
Type of Teacher 1- Principal 2- Vice Principal 3- Teacher
Source of Salary 1- Federal government
2- State government – on this school’s payroll
3- State government – on another school’s payroll
Present 1- Present or temporarily absent
2- Absent for more than 1 month (maternity leave)
3- Absent for more than 1 month (sick leave)
4- Absent for more than 1 month (training)
5- Absent more than 1 month (secondment)
6- Absent more than 1 month (unauthorized)
Academic qualification 1- Below SSCE 2- SSCE/WASC
3- OND/Diploma 4- Degree/HND/Graduate
Teaching qualification 1- NCE 2- PGDE 3- B.Ed. or equivalent
4- M.Ed. or equivalent
5- Grade II or equivalent 6- None
Subject of qualification 1- English 2- Mathematics 3- Science
4- Business 5- Humanities 6- Technology
7- Special or Inclusive Education
No.. ... ... ... ... ... ... ... ... ... ... ... ... ... ... ... ... ... ... ... ... ... ...
Name of teacher... ... ... ... ... ... ... ... ... ... . . . ... ... ... ... ... ...
Gender... ... ... ... ... ... ... ... ... ... ... ... ... ... ... ... ... ... ... ... ...
Type of teacher... ... ... ... ... ... ... ... ... ... ... ... ... ... . . ... ... ...
Source of salary.... ... ... ... ... ... ... ... ... ... ... ... ... ... ... ... . . .
Year of birth... .... ... ... ... ... ... ... ... ... ... ... ... ... ... ... ... ... ...
Year of first appointment... .. ... ... ... ... ... ... ... ... ... ... ... ... ...
Grade level. ... ... ... ... ... ... ... ... ... ... ... ... ... ... ... ... ... ... ...
Present... ... ... ... ... ... ... ... ... ... ... ... ... ... ... ... ... ... ... ... ...
29
Webinar 6 - Companion Technical Booklet

Academic qualification... .... ... ... ... ... ... ... ... ... ... ... ... ... ...
Teaching qualification... .. ... ... ... ... ... ... ... ... ... ... ... ... ... ...
Subject of qualification... .... ... ... ... ... ... ... ... ... ... ... ... ... ...
Tick box if teacher teaches subject of his/her qualification
Tick box if teacher also teaches junior secondary classes in this school
Tick box if teacher attended training workshop/seminar in last 12 months
Tick box if teacher received training on teaching children with disabilities in last 12 months
Tick box if teacher received pre-service training on children with disabilities
Table 10: Extended questions on teacher capacity for more developed school systems
Does your school have a resource room with staff trained on teaching children with disabilities? (Yes=1, No=2)
Does the school have specialists that are available to consult with teachers who have problems concerning students with disabilities? (Yes=1, No=2)
How many speech therapists work in your school?
How many physical therapists work in your school?
Are there specialists outside the school but in the school district whom your teachers can consult with on issues related to teaching children with disabilities? (Yes=1, No=2)
In addition to staff, there is the issue of services provided to the children. This can include a broad range of activities. Table 11 provides an extensive list. As always, they should be prioritized, limited or supplemented based upon the local country context. Some of the services in Table 11 will not be available in certain countries and so it would not make sense to include them.
30
Webinar 6 - Companion Technical Booklet

Table 11: Sample questions on services received from the school
BOYS GIRLS TOTAL
How many children have received ... Grade Grade
1 2 3 4 5 6 1 2 3 4 5 6
Special tutoring or assistance inside the classroom by an aide or other teacher
Tutoring or assistance outside of the classroom
Physical therapy
Speech therapy – articulation
Speech therapy – pragmatic language
Occupational therapy
Counselling
Braille instruction
Sign-language instruction
Glasses
Low-vision magnifiers
Hearing aids
Wheelchairs or tricycles
Canes, walkers, or similar devices
Prosthetics
31
Webinar 6 - Companion Technical Booklet

IV. Guide to Including Disability in EMIS ReportsReporting on disability within the EMIS report consists of three parts: first, the reporting on the presence and experience of children with disabilities; second, the accessibility of physical structures and materials, and the training of school personnel; and, finally, the types of services received by students. It should be noted that the tables in this section are not to be created by school personnel, but should be generated by the Ministry of Education based on data that it aggregates from school reports.
Children with Disabilities
Table 12a displays a basic breakdown of boys and girls enrolled in school who have any disability by grade level. The numbers for this table come from Table 1a. The percentages come from dividing those numbers by the total number of children (boys, girls or both) in the school.
Table 12a: Reporting template for children with disabilities enrolled in school
BOYS GIRLS TOTAL
Number of children with disabilities
Percentage of all children with disabilities
32
Webinar 6 - Companion Technical Booklet
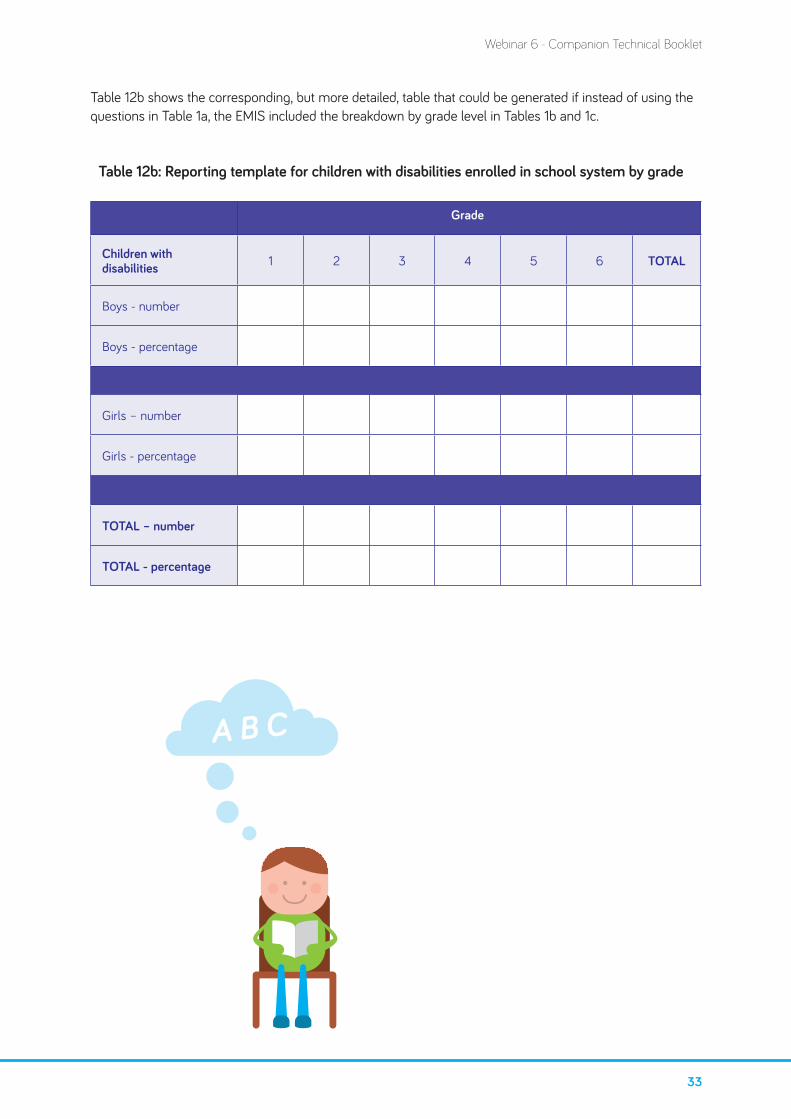
Table 12b shows the corresponding, but more detailed, table that could be generated if instead of using the questions in Table 1a, the EMIS included the breakdown by grade level in Tables 1b and 1c.
Table 12b: Reporting template for children with disabilities enrolled in school system by grade
Grade
Children with disabilities 1 2 3 4 5 6 TOTAL
Boys - number
Boys - percentage
Girls – number
Girls - percentage
TOTAL – number
TOTAL - percentage
33
Webinar 6 - Companion Technical Booklet
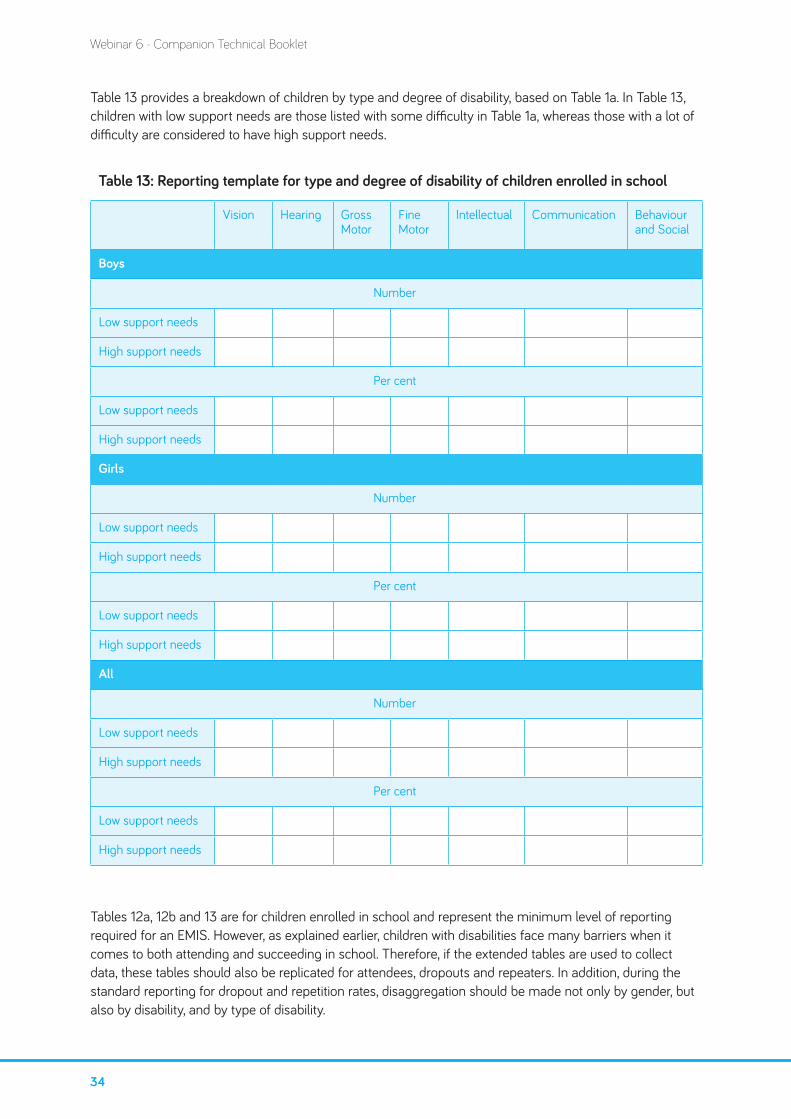
Table 13 provides a breakdown of children by type and degree of disability, based on Table 1a. In Table 13, children with low support needs are those listed with some difficulty in Table 1a, whereas those with a lot of difficulty are considered to have high support needs.
Table 13: Reporting template for type and degree of disability of children enrolled in school
Vision Hearing Gross Motor
Fine Motor
Intellectual Communication Behaviour and Social
Boys
Number
Low support needs
High support needs
Per cent
Low support needs
High support needs
Girls
Number
Low support needs
High support needs
Per cent
Low support needs
High support needs
All
Number
Low support needs
High support needs
Per cent
Low support needs
High support needs
Tables 12a, 12b and 13 are for children enrolled in school and represent the minimum level of reporting required for an EMIS. However, as explained earlier, children with disabilities face many barriers when it comes to both attending and succeeding in school. Therefore, if the extended tables are used to collect data, these tables should also be replicated for attendees, dropouts and repeaters. In addition, during the standard reporting for dropout and repetition rates, disaggregation should be made not only by gender, but also by disability, and by type of disability.
34
Webinar 6 - Companion Technical Booklet

Figure 1: Example of chart showing dropout rates by gender and disability
0
5
10
15
20
25
30
35
Children without disabilities
Children with disabilities
Boys without disabilities
Boys with disabilities
Girls without disabilities
Girls with disabilities
Per cent dropping out
An example bar chart for dropouts is shown in Figure 1, but could be replicated for new entrants, promotions, repetitions, or whatever other indicator is already being collected and analyzed by the current EMIS system.
In the hypothetical example in Figure 1, children with disabilities have a 25 per cent dropout rate compared with only 10 per cent for those without disabilities, while both boys and girls with disabilities are both more likely to drop out than their non-disabled peers. The effect is bigger for girls, consistent with the hypothesis that disability has a bigger impact on girls than boys.
Physical Structures and Materials
The two primary indicators of physical accessibility are the entranceway and the existence of accessible toilets. An example of reporting indicators for the accessibility of school entrances is shown in Figure 2. The left-most bar shows the percentage of schools having a year-round accessible road. The second bar splits schools between those without steps and those which have steps but also have ramps. In both cases, steps pose no barrier to people with mobility issues. The third bar reports on the number of schools whose entrances are wide enough to accommodate a wheelchair. The final bar reports on the percentage of schools that meet all three conditions – a year-round accessible road, no barrier due to steps, and an adequately wide entrance – thus having fully accessible entrances.
35
Webinar 6 - Companion Technical Booklet

Figure 2: Indicators for entrance accessibility
0
10
20
30
40
50
60
70
80
90
Accessible roads Ramps Wide entrance Full accessibility
Per cent
Ramps Schools having
Figure 3 displays the information about toilet accessibility for students captured in Table 5. This figure would be provided in addition to the standard reporting for average number of toilets for children. Availability of accessible toilets is broken down by gender and by students as compared with staff. The first bar shows the percentage of schools with no toilets. The second bar shows the total number of schools with gender-differentiated toilets, broken down by accessibility. The third bar is the percentage of schools with communal toilets broken down by accessibility. The fourth bar is the sum of the first three, showing what percentage of schools have toilets that children with disabilities can use and what percentage of schools have no facilities for children with disabilities. The final bar refers to toilets for staff.
Figure 3: Indicators of accessible toilets
0
20
40
60
80
100
120
No toilets Boys and girls separate
Communal Total for children Sta�
Perc
enta
ge o
f sch
ools
Not accessible Accessible
36
Webinar 6 - Companion Technical Booklet
The above represent the core indicators for physical structures. But if additional information is collected – as shown in Tables 6 and 7 – then that information should be reported, as well. If the approach taken in Table 6 is used – that is, simply adding a column for accessibility to existing tables’ measuring facilities – then that data can be displayed as currently reported, only disaggregated by whether the facilities are accessible or not. If special information on accessibility is collected, then that data should also be reported.
For example, if the questions in Table 7 are used then the EMIS report should include information on the average percentage of rooms in each school that are accessible, the average percentage of floors that are accessible, and the percentage of rooms with emergency exits accessible to children with disabilities, as well as the percentage of schools with an evacuation plan that includes provisions for children with disabilities.
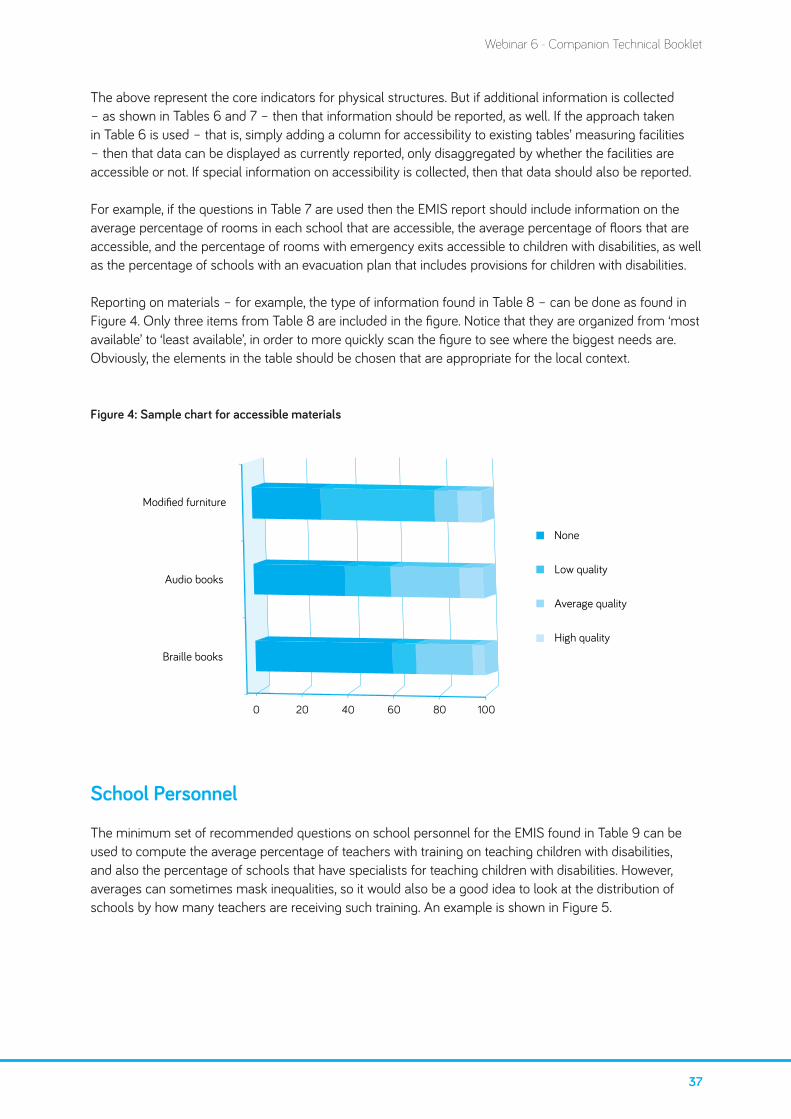
Reporting on materials – for example, the type of information found in Table 8 – can be done as found in Figure 4. Only three items from Table 8 are included in the figure. Notice that they are organized from ‘most available’ to ‘least available’, in order to more quickly scan the figure to see where the biggest needs are. Obviously, the elements in the table should be chosen that are appropriate for the local context.
Figure 4: Sample chart for accessible materials
0 20 40 60 80 100
Braille books
Audio books
Modified furniture
None
Low quality
Average quality
High quality
School Personnel
The minimum set of recommended questions on school personnel for the EMIS found in Table 9 can be used to compute the average percentage of teachers with training on teaching children with disabilities, and also the percentage of schools that have specialists for teaching children with disabilities. However, averages can sometimes mask inequalities, so it would also be a good idea to look at the distribution of schools by how many teachers are receiving such training. An example is shown in Figure 5.
37
Webinar 6 - Companion Technical Booklet

Figure 5: Schools by percentage of teachers trained in inclusion
None
Less than 25 %
Between 20 and 50%
Between 51 and 75%
More than 75%
This figure could be replicated separately for urban and rural areas, or by region, to see if there are significant differences across school districts. This type of figure can also be generated by using the data in Table 10, which can also be used to determine how many teachers are specifically trained as special-education teachers. But the true advantage of Table 10 is that by keeping a teacher-by-teacher record of training it will be easier for school administrators to track who has been trained, and manage training schedules.
For school systems collecting additional information, with questions such as those in Table 11, additional reports should be made outlining the prevalence and distribution of schools whose teachers have access to additional consultations and specialists.
Services Received
Data on services received should be disaggregated, as much as possible, in order to ascertain if there are particular barriers to receiving those services based on age and gender. It is also important to consider the type of disability. Some services – for example prosthetics, hearing aids or speech therapy – apply only to children with particular impairments. Other services could apply to all children – for example, special tutoring inside or outside the classroom – but might more often be deemed appropriate for some types of children, for example those with learning disabilities.
Therefore, a first cut of the data should look only at the percentage of children with disabilities – by grade level and gender – who receive any type of service. An example of this is shown in Figure 6.
38
Webinar 6 - Companion Technical Booklet

Figure 6: Percentage of children with disabilities receiving special services by gender and grade
0
10
20
30
40
50
60
1st 2nd 3rd 4th 5th 6th
Per cent Boys
Girls
Then, another chart could be made for the receipt of services by type of disability, as shown in Figure 7.
Figure 7: Percentage of children with disabilities receiving special services by type of disability and gender
0
10
20
30
40
50
60
70
Physical Intellectual Hearing Vision Behaviour
Per cent Boys
Girls
In the example of Figure 7, the gap in services by gender is only evident for intellectual and behavioural disabilities. Once again, disaggregating these by area – rural, urban or region – could help determine if services are reaching children in all areas. Another table should also be generated showing the number of children receiving each type of service, in order to see if service provision is reaching the children for whom it is needed.
39
Webinar 6 - Companion Technical Booklet
V. SummaryEducation Management Information Systems are important for monitoring and evaluating schools. They are administrative procedures that collect, collate and report on the experience of children in schools, as well as on the attributes of the schools, including structures, materials, services and human resources. Often, children with disabilities are left out of EMISs, which makes it impossible to evaluate their experience. Even more often, EMISs do not collect information on the accessibility of schools and school materials, or on the types of services available or the training on inclusion that teachers have obtained. Without data on the experience of children with disabilities, or on their school environments, it is not possible to identify and monitor problems and bottlenecks, plan and implement policies to address those problems and bottlenecks, or evaluate the impact of those policies once implemented.
This workbook presents recommendations on how to include data on children with disabilities and their school environments in an EMIS. It recommends using an approach to disability identification consistent with international trends in conceptualizing disability – namely, identifying children who are having difficulty with particular activities, and to record those difficulties on a scale. The type and degree of disability can have a large impact on the effect of disability on schooling and so should be recorded. The workbook also suggests a minimum set of questions that should be included in all EMISs, and also ideas for how to expand that information if more information can be collected.
Notes
40
Webinar 6 - Companion Technical Booklet
VI. Glossary of TermsConvention on the Rights of Persons with Disabilities and its Optional Protocol (A/RES/61/106) was adopted on 13 December 2006 at the United Nations Headquarters in New York, and was opened for signature on 30 March 2007. There were 82 signatories to the Convention, 44 signatories to the Optional Protocol, and one ratification of the Convention. This is the highest number of signatories in history to a UN Convention on its opening day. It is the first comprehensive human rights treaty of the 21st century and is the first human rights convention to be open for signature by regional integration organizations. The Convention entered into force on 3 May 2008. For more information visit: http://www.un.org/disabilities/
Disability. Article 1 of the CRPD describes people with a disability as “those who have long-term physical, mental, intellectual, or sensory impairments which in interaction with various barriers may hinder their full and effective participation in society on an equal basis with others”.
Education Management Information System. An EMIS consists of a process of collecting, aggregating and reporting school-based data. It includes data-collection forms and a system for the distribution and collection of those forms; a method of entering those data electronically; the creation of indicators at the school, district and national level; and finally a set of standardized reports using these data that remain consistent over time in order to track the performance of the education system.
Inclusion is where there is recognition of a need to transform the cultures, policies and practices in school to accommodate the differing needs of individual students, and an obligation to remove the barriers that impede that possibility.
Inclusive Education is “a process of addressing and responding to the diversity of needs of all learners through increasing participation in learning, cultures and communities, and reducing exclusion within and from education. It involves changes and modifications in content, approaches, structures and strategies, with a common vision which covers all children of the appropriate age range and a conviction that it is the responsibility of the state to educate all children.”5
Washington Group is a group established by the UN Statistical Commission to come up with recommendations for improved internationally comparable measures of disability for monitoring and evaluation. Its membership is open to the national statistical offices of all UN member countries. The UN Statistical Commission names its groups after the first city they meet in, hence the name Washington Group. Their website is http://www.cdc.gov/nchs/washington_group.htm.
41
Webinar 6 - Companion Technical Booklet

Endnotes1. For further information regarding the design and requirements of an EMIS system for monitoring out of school children
and children at risk of dropping out, see also: UNICEF and UIS (2014 forthcoming). Framework for Monitoring Out-of-School Children and Adolescents in the ECA Region, Geneva: UNICEF Regional Office for Central and Eastern Europe and the Commonwealth of Independent States.
2. Mont, D. ‘Measuring Disability Prevalence’, Social Protection Discussion Paper No. 0706, The World Bank (2007).
3. UNICEF, State of the World’s Children (2013).
4. Rousso, H. (2003) Education for All: a gender and disability perspective,’ Background paper* prepared for the Education for All Global Monitoring Report 2003/4: Gender and Education for All: The Leap to Equality.
5. UNESCO (2005) Guidelines for Inclusion: ensuring access to education for all, Paris.
Notes
42
Webinar 6 - Companion Technical Booklet
Notes
43
Webinar 6 - Companion Technical Booklet