Embed Size (px)
Citation preview

Education & Employability Survey Report March, 2014
Education & Employability Survey Report
March 2014

Education & Employability Survey Report March, 2014

Education & Employability Survey Report March, 2014
Introduction and Background..……………………………………………..…3
Aim and Objectives, Methodology, and Analysis……………………………..5
Summary of Main Findings…………………………………………………….7
Literature Review……………………………………………………………….11
An Overview of Education in Nigeria………………………………………………….………12
Challenges Faced by the Nigerian Education Sector…………………………………………13
Possible solutions to the Education problems……………………………………………….…21
Detailed Findings………………………………………………………………23
Recruitment of tertiary education graduates……………………………….………….……….24
The most sought after skills and capabilities in graduates…….………………………….…..28
The current levels of satisfaction with graduates’ skills………………………………….….…30
The most valued criteria in graduate recruitment ………………………..…………….……..34
The major challenges faced in filling graduate job vacancies and views
on how they can be made more employable……………………………………………..…..42
The frequency and importance of collaboration between organisations
and tertiary institutions………………………………………………………………….….…..46
Discussion and Conclusion……………………………….……………….….51
Bibliography……………………………………………………………………53
Index of Figures and Tables……………………………………………………54
TABLE OF CONTENTS
1

Education & Employability Survey Report March, 2014
‘‘This Survey by Phillips Consulting, seeks to determine the effect of the quality of tertiary education on the employability of fresh graduates in Nigeria
2
’’

Education & Employability Survey Report March, 2014
Introduction Background &
3

Education & Employability Survey Report March, 2014
4
INTRODUCTION AND BACKGROUND The National Policy on Education (2004) introduced by the Federal Government of Nigeria states that the importance of tertiary education in Nigeria is to: Contribute to national development through high level relevant, manpower training Develop and inculcate proper values for the survival of the individual and society Develop the intellectual capability of individuals to understand and appreciate their level
and external environment Acquire both physical and intellectual skills which will enable individuals be self-reliant
and useful members of the society Promote and encourage scholarship and community service Forge and cement national unity Promote national and international understanding and interaction In short, the purpose of tertiary education is to prepare young people for the job market; to have sustainable employment by enhancing technical skills and competence in a chosen field, and life skills such as problem solving and analytical skills, effective communication and literacy skills, interpersonal and team skills etc. Globally, tertiary education is believed to be the core of human resource development. However, the current education system in Nigeria does not appear to be producing graduates with these generic and essential skills; hence the continuous increase in the rate of youth unemployment – 24 million jobs needed over the next ten years to reduce the current unemployment level by half. Large numbers of graduates have continuously been found incapable of meeting up with the employment requirements of the workforce and have thus been unsuccessful in either securing or keeping a job. This employability problem has been described to be as a result of poor funding of tertiary institutions, undue interference by various external entities, outdated curricular, poor and bloated staffing, overcrowding and incompetence in the management of many of our tertiary institutions. These factors ultimately create a challenge for employers in filling their graduate vacancies, even with the high level of youth unemployment in the country. By comparing the viewpoints of employers and students, this survey by Phillips Consulting , seeks to determine the effect of the quality of tertiary education on the employability of fresh graduates in Nigeria. It will thus provide insights into the needs of employers and the opinions of students/graduates; identify gaps in the expectations of both groups; discuss challenges and recommend possible solutions. (National Policy on Education, 2004) (Ajiboye, Oyebanji, & Awoniyi, 2013) (Alao, et al., 2010) (Taiwo-Oguntuase, 2014)

Education & Employability Survey Report March, 2014
5
Aim Objectives, Methodology and Analysis
&

Education & Employability Survey Report March, 2014
6
AIM AND OBJECTIVES Aim: To determine how relevant the quality of tertiary education is in producing successful graduate employees Objectives: This survey will consider the: Trends in the recruitment of fresh graduates Importance of discipline, knowledge, workplace skills and attitude required of graduates Levels of satisfaction with the level of skills possessed by graduates Most valued skills sought by employers when recruiting graduates Major challenges faced in filling graduate job vacancies and views on how the
graduates can be made more employable Frequency and type of collaborations between employers and tertiary institutions to
produce graduates with the required skills
METHODOLOGY This survey was carried out in February 2014 using questionnaires that contained both quantitative and qualitative questions. This survey was administered electronically to employers and recent graduates and current students over a period of two weeks. A total of 4,293 responses were received.
ANALYSIS Responses to the quantitative aspect of the survey were analysed using a simple statistical analysis tool. The data received from the qualitative questions was analysed thematically using an inductive method. This involved identifying the major themes that evolved from the responses and also adequately reflecting the data content. Percentages were then calculated based on the frequency of these themes and results reported using the numerical indicators generated.

Education & Employability Survey Report March, 2014
Summary of Main Findings
7

Education & Employability Survey Report March, 2014
8
SUMMARY OF MAIN FINDINGS Recruitment of fresh graduates and characteristics of recruited
graduates
Key Findings: Although the largest proportion of employers surveyed (75%) had recruited graduates in the past and were planning to continue doing so, almost a fifth of the employers (19%) had no intention of recruiting graduates in the next five years. Employers with the largest number of graduates in their companies worked in Government, IT and Education. The largest proportion of graduates employed studied Business & Law (41%) and had a Bachelor’s degree as their highest qualification.
The most sought after skills and capabilities in graduates Key Findings: Employers and Graduates appear to be in sync with regards to the importance of effective verbal communication skills and ability to work in teams (a combined 98% - 99% of respondents think these skills are important). However, employers rated the importance of Critical and Analytical thinking higher than graduates did. Both groups ranked Business Awareness and Entrepreneurial skills as least important for fresh graduates to have when taking up their first employment positions.
The current levels of satisfaction with graduates’ skills Key Findings: The majority of the employers generally agree that recently recruited graduates had the skills to work in their organisations. Those in the Agriculture and Education sectors, especially appeared to be satisfied with the skills exhibited by their recruited graduates, particularly with graduates’ knowledge in their respective disciplines. For those employers who had the highest rate of dissatisfaction (i.e. Consulting and Oil and Gas sectors), graduates’ ability to work on their own as well as their critical and analytical thinking skills were the major source of disappointment. Again, the recruitment trends were directly proportional to satisfaction levels in that the more employers recruit and/or plan to, the more likely they are to agree that recruited graduates have the required skills.

Education & Employability Survey Report March, 2014
9
The most valued criteria in graduate recruitment Key Findings: While employers ranked employability skills such as a ‘good attitude’ and ‘effective communication’ as the most important considerations for graduate recruitment (27%), graduates believed that their ‘qualification results’ was most important to employers (22%). The largest proportion of employers (51%) had no preference for graduates from any particular tertiary institutions. However, those who preferred graduates from Federal universities in Nigeria did so because of the reputation of these institutions. Foreign university graduates were preferred by employers mostly in the Oil & Gas and Consulting sectors.
The major challenges faced in filling graduate job vacancies and views
on how they can be made more employable Key Findings: 62% of employers do not think tertiary institutions are doing a good job of producing successful graduate employees. These employers stated inadequate workplace skills, bad attitude to work, fake degrees, high cost of required training, volume of applicants, age limit and high salary expectations as the main challenges faced in recruiting graduates. The majority of employers believe improving one’s interviewing skills and including practical training in courses by tertiary institutions would improve the employability of graduates.
The frequency and type of collaboration between employers and
tertiary institutions Key Findings: Even though the majority of employers (69%) believed that collaboration with tertiary institutions is important especially through participation in internship programmes, the majority of them indicated that their organisations have never collaborated with tertiary institutions in either curriculum design or graduate recruitment – 52% and 48% respectively. Only about 15% do so frequently in both cases. Employers in the Retail industry constituted the largest proportion of those who never cooperate on curriculum design but who frequently cooperate on graduate recruitment. On the other hand employers in the Education sector are the most cooperative on curriculum design, while NGOs are the least cooperative on graduate recruitment.

Education & Employability Survey Report March, 2014
‘‘...the re-prioritisation of government spending in spite of increasing oil revenues and the disparity in the equitable distribution of wealth, has increased poverty levels.
As a result, enrolment into primary schools have decreased, consequently affecting secondary and tertiary school enrolment ’’
10

Education & Employability Survey Report March, 2014
Literature Review
11

Education & Employability Survey Report March, 2014
An Overview of Education in Nigeria The history of formal education in Nigerian is closely tied to Religion. Islam was introduced to the Northern areas of the country as early as the 11th century while Christianity was introduced in the Southern areas through the missionaries in the mid-nineteenth century, hand-in-hand with “western” education.
As obtains in many regions of the world, the economic health of the country plays a major role in the level and quality of its Education sector.
During the oil boom of the 1970s, Nigeria launched several universal education policies that resulted in an astronomical increase in the number of student enrolments into primary schools. Therefore, the increased wealth of the nation positively impacted the state of education.
However, the re-prioritisation of government spending in spite of increasing oil revenues and the disparity in the equitable distribution of wealth, has increased poverty levels. As a result, enrolment into primary schools have decreased, consequently affecting secondary and tertiary school enrollment
In recent times, Nigeria has experienced an average GDP growth of 6.8% between 2005 and 2013. However, this growth in the economy has not been sufficient to enable poverty reduction and job creation. As a result of the reduction in government investments into the education sector, a number of private institutions at all levels of education have been established over the years. These increasing numbers of private schools (especially at the tertiary level) have been set up to satisfy the demand for education, both quantitatively and qualitatively. Between 2005 and 2013, the number of private universities in Nigeria doubled, rising from 24 to 50.
14
Universal Primary Education
Universal Basic Education
Millennium Development Goals
Transformation Agenda
Initiated in 1955 in Western Nigeria. Introduced to the
Eastern region in 1957. Launched
throughout Nigeria in 1976 . The objective was to
provide free, compulsory and universal primary education to every region of the country. Resulted in a
significant increase in the number of school enrolments, especially at the primary level.
Initiated in 1999 as a result of a World Conference on Education For All (EFA) held in Thailand in 1990. The objective was to
ensure free, compulsory and uninterrupted nine-year education for every child six years old and above. Changed the
educational system from 9-3-4 to 6-3-3-4. The UBE scheme
focused on providing education to underserved groups such as girls and women, the poor, disabled, street children, etc.
Initiated in 2000 as a result of a three- day Millennium Summit on Education of the United Nations in New York. Goal 2 and 3 of 8
Millennium Development Goals were dedicated to improving education. Goal 2 is to achieve
universal primary education and goal 3 is to promote gender equality and empower women, by eliminating gender disparities in primary, secondary and tertiary school enrollment.
Initiated in 2011. The Objective is to
reform the Nigerian economy by creating millions of new jobs and promote infrastructural development. This would help to
ensure that Nigeria becomes one of the world’s top 20 economies by the year 2020 – Vision 20:2020. The education sector
would potentially reap the benefits in the form of improved physical infrastructure (new school buildings, laboratories and student accommodation) as well as quality of teachers., etc
Educational Reforms in Nigeria
12

Education & Employability Survey Report March, 2014
Inadequate Budgetary Allocations
The United Nations Educational and Scientific and Cultural Organisation (UNESCO) recommends dedicating at least 26% of a nation’s annual budget to the education sector. Many countries fail to meet this benchmark, including Nigeria (Fig. 2). In a 2012 report by the World Bank, Ghana appeared top on a list of selected countries, with 31% of its government budget being reserved for education. Other African countries such as Cote d’Ivoire, Kenya and Botswana dedicated 30%, 23% and 19% respectively to education. Nigeria appeared last on the list, contributing only 8.4% to the Education sector.
13
INADEQUATE FUNDING
The Ripple Effect Caused by Low Federal Government Budget Allocation to the Education Sector
Insufficient, Inadequate, Dilapidated Infrastructure
Inadequate Salaries for Teachers
Inadequate , Insufficient , Outdated Teaching Materials
Leaking roofsNo
laboratoriesNo libraries
No tables and chairs
Overcrowding in Classrooms
High Student-Teacher Ratio
Poor Learning
Environment
Low Learning Outcome
Increase in School Fees Staff Strikes
Closure of Schools
Teachers leave Nigeria to seek
better opportunities
abroad
Ineffective Teaching
Ineffectual Learning
No textbooksNo writing materials
Out-of-date textbooks
Student Protests &
Riots
Student Dropouts
The poor no longer have access to education
Challenges Faced by the Nigerian Education Sector
0 5
10 15 20 25 30 35
Ghan
a
Cote
d’ I
vore
U
gand
a
Mor
occo
So
uth
Afric
a Sw
azila
nd
Mex
ico
Ke
nya
U
nite
d Ar
ab …
Bo
tsw
ana
Ira
n U
SA
Tuni
sia
Leso
tho
Bu
rkin
a Fa
so
Nor
way
Co
lom
bia
N
icar
agua
In
dia
N
iger
ia
%
Country
Percentage of Government Budget Allocation to Education in 2012
Figure 2 – A comparative analysis of the education budgets for selected countries in 2012. Figures indicate the percentage of the total government budget dedicated to education. Data derived from the World Bank.
Figure 1

Education & Employability Survey Report March, 2014
Capital Vs Recurrent Expenditures
Capital expenditure in the education sector include the cost of building physical infrastructure such as schools, laboratories, libraries, hostels, lecture theatres, classrooms, etc. Recurring expenditures include the payment of staff salaries, overhead costs, pensions, etc. Before 1981, most of the education budget was spent on capital expenditure. This arrangement provided funds to build the necessary structures and facilities to enable effective teaching. High investments made on infrastructure contributed to the growth and development of the economy and in effect, the country as a whole. Over the past three decades, capital expenses have taken the back seat to recurrent expenditure. Capital budgetary allotments have been as low as 4.7% and 8.4% of the annual federal budget for education in 2001 and 2002 respectively. In 2012, N400.15 billion (8.4% of the national budget) was allotted to education. Of this amount, N345.09bn (82%) was dedicated to recurrent expenditure (N317.9bn for personnel salaries; N27.19bn for overhead costs) and N55.06bn (18%) set aside for capital expenditures (Fig. 3).
14
Figure 3 – Capital and Recurrent Education Expenditures by the Federal Government in Nigeria, between 1979 and 2007. Data derived from CBN Statistical Bulletins, 2005 and 2007.

Education & Employability Survey Report March, 2014
School Enrolment Figures The literacy rate of Nigerians is at an all-time high of 61.3% (2010 estimate). Figure 4 shows the rate of enrolments into the various levels of education in Nigeria, between 1970 and 2010. Primary school enrolment has shown an overall relatively healthy increase over the time period. However, a 2012 EFA report revealed that of the estimated 61 million out-of-school children of primary school age in the world, as many as 10.5 million of these are in Nigeria alone. There is a wide and persistent gap between primary and secondary school enrolment marked by the highest level of only 44% secondary school enrolment attained in 2010. Tertiary school enrolment is dependent on the completion of secondary school. In a 2006 statistical analysis conducted by the National Population Commission, it was revealed that 33% of the working age population of Nigerians (aged 15 – 64) had received no form of education whatsoever (Fig. 5). In addition, only 13% of this population had received some form of tertiary education.
15
Figure 4 – Enrolment information for primary, secondary and tertiary levels of Nigerian education. Data derived from the World Bank Development Indicators.
0
20
40
60
80
100
120
1970
1973
1976
1979
1982
1985
1988
1991
1994
1997
2000
2003
2006
2009
%
Year
Gross Enrolment Ratio for Primary, Secondary & Tertiary Institutions in Nigeria
Primary
Secondary
Tertiary
Figure 5 – Education Attainment of the Working Age Population of Nigerians (aged 15-64) in 2006. Total Working Age population is 77,158,732. Data derived from the National Bureau of Statistics, 2010.

Education & Employability Survey Report March, 2014
.
Gender Disparities and Regional Factors Figure 6 depicts female literacy levels in different states of Nigeria. It is observed that female literacy levels are significantly low in the Northern region.
16
.
50
100
1970 1975 1980 1985 1990 1995 2000 2005 2010
Year
Primary School Enrolment: Ratio of Females to Males
Nigeria Low Income Countries High Income Countries
Figure 7 – Ratio of females to males for primary school enrolment.
This is the percentage of girls to boys enrolled at primary level in both public and private schools.
Data derived from the World Bank Development
Indicators
Figure 8 – The numeracy
and reading skills displayed
by children aged 5-16 in different
regions of the country, 2010. Extracted from Onwuameze,
2013.
Figure 6 – Map of Nigeria showing the female literacy levels in different states in 2008. Extracted from the BBC, 2012

Education & Employability Survey Report March, 2014
Challenges with Tertiary Education in Nigeria
17
Tertiary Institution Number
Universities 128
Federal
State
Private
40
38
50
Polytechnics 81
Monotechnics 27
Colleges of Education >60
Colleges of Agriculture 36
Colleges of Health Technology 50
Technical Colleges 132
Innovative and Vocational
Enterprise Institutions (IEIs & VEIs)
108
TOTAL >622
World
Rank
Africa
Ranking University Country
1 - Harvard University United States
2 - Massachusetts Institute of Technology (MIT) United States
3 - Stanford University United States
299 1 Cairo University Egypt
391 2 University of Cape Town South Africa
504 3 Stellenbosch University South Africa
1926 21 Obafemi Awolowo University Nigeria
2183 24 University of Ibadan, Oyo Nigeria
2933 35 University of Lagos Nigeria
3539 52 University of Nigeria, Nsukka Nigeria
4088 59 University of Ilorin, Kwara Nigeria
4125 61 University of Agriculture Abeokuta Nigeria
4624 78 Ahmadu Bello University, Zaria Nigeria
4699 79 University of Benin, Edo Nigeria
5776 97 Federal University of Technology Akure Nigeria
From having only one University College in 1948, Nigeria now has 128 universities. Below is a breakdown of the number of tertiary institutions in the country:
Table 1 - Number and Distribution of Higher Education Institutions in Nigeria. Derived from the NUC and NBTE.
Table 2 – The 2014 World Webometric Ranking of Nigerian Universities. The webometric ranking is an international higher education ranking system that positions universities according to their online presence (using the theory that web popularity is directly proportional to the quality of the education delivered).

Education & Employability Survey Report March, 2014
18
Figure 9 – The number of students who left Nigeria for higher education between 2007 and 2012. Data derived from World Education News & Reviews, 2013.
0
2000
4000
6000
8000
10000
12000
14000
16000
18000
20000
2007 2008 2009 2010 2011 2012
Num
ber o
f Stu
dent
s
Year
Destinations for Nigerian Students
UK USA Malaysia Ghana Canada
Unfortunately, the standard of education at this level in the country has fallen quite badly in recent times. The system is characterised by low teaching standards, overcrowding, deteriorating infrastructure, amongst others. According to a 2014 webometric ranking of universities (Table 2), the highest ranked Nigerian institution, Obafemi Awolowo University in lle-Ife, has a low African ranking of 21 and an even lower worldwide ranking of 1,926.. This has caused a growing number of students (mostly from wealthy background) to go abroad in search of quality education. See Figure 9:

Education & Employability Survey Report March, 2014
Overcrowded Institutions
Overcrowded educational institutions result in high student-teacher ratios which in turn affect effective teaching. Overcrowded classrooms have a detrimental effect on the learning potential of students, and wears down both the teaching staff and the educational facilities. In a 2005 study by the National Universities Commission (NUC), it was discovered that the carrying capacity of Nigerian universities was being overstretched by over 36% (Fig. 10). Limited Student Places in Tertiary Institutions
The majority of students who apply to study at tertiary institutions are not granted entry into these schools. The government has established a significant number of institutions over the past several years to meet increased demands (between 2005 and today, the number of universities has grown from 51 to 128), however, the number of failed student applications to these institutions significantly exceeds the number of successful candidates. Only 19% of the over 1,000,000 candidates who applied to Nigerian universities in the 2008/2009 academic session, were accepted – leaving 854,060 applicants without university places.
19
Figure 10 – The carrying capacity of Federal, State and Private Universities in Nigeria vs. the actual number of students admitted in 2005. The carrying capacity was being overstretched by over 36%. Data derived from NUC, 2005.
Figure 11 – Number of applications made into Nigerian universities compared with the number of students accepted. Data derived from the Federal Ministry of Education.
Some of the challenges of tertiary education in Nigeria are discussed in more detail here:

Education & Employability Survey Report March, 2014
Increase & Prioritize Budgetary Allowance for Education Increasing the amount of money allocated to the education sector will not solve all its current problems. However, high quality education is not achievable without sufficient funding. The government must strive to meet the UNESCO recommendation and increase the annual budgetary allowance to 26% of the total federal budget. In addition, capital, rather than recurrent expenditures should be the priority for Nigerian educational institutions, in order to build the needed physical infrastructure and other support structures to facilitate learning.
Make Teaching More Attractive as a Profession Teaching facilities and materials must be installed, upgraded and updated where necessary. Once the physical infrastructure and the teaching aids are in place, more individuals will naturally see teaching as a desirable profession to pursue. Job satisfaction is an important driving force for any employee, and teachers naturally wish to witness the positive impact of their efforts in their students. In addition, the welfare of the academic and non-academic staff should be improved, by not only increasing salaries, but more importantly, ensuring the timely and consistent disbursement of these salaries. This would eliminate the strike actions by teachers’ unions, such as ASUU (Academic Staff Union of Universities). Effective and Continuous Training for Teachers A strategy must be developed for the effective training and development of teachers at all levels of education. This strategy should involve steps for the recruitment, training and retention of these academic staff. Training must be a continuous process, and the performance of the students taught by these teachers must be tracked and recorded frequently. There should also be a determined and nationwide effort to upgrade all teachers to a minimum of National Certificate of Education (NCE) holder status. Curriculum Reconstruction The teaching curriculum of educational institutions, especially at the tertiary level, must be realigned to make it more relevant to the needs and status of the Nigerian society. For primary and secondary schools, the curriculum should be amended to include the history of Nigeria and Africa, rather than (or in addition to) that of the Europeans. Such additions would include details on the progression of politics, agriculture, religion, education, incidences of war and conflict, etc. in the country. For higher education institutes, expanding the curriculum would considerably address the problem of graduate unemployment and underemployment, and would instill in students the necessary and relevant skills for their chosen field of work. The curriculum should also be evaluated frequently, and updates made, as and when necessary.
20
Education reform is not unattainable.
The Lagos Eko Secondary Education Project is a $90 million (N14.9 billion) collaboration between the World Bank and the Lagos State Government. It was initiated in 2009, with the aim of improving education quality and in effect, learning outcomes in Lagos junior and senior secondary schools. Impressive results have already been recorded for the majority of the 639 schools involved. Over 38% of the students who sat for the West African Secondary School Certificate Examination (WASSCE) in 2012 obtained five credits and above including English language and Mathematics, compared with 10.4% in 2008. In addition, the English and Mathematics pass rates improved from 46% to 88.3% and 45% to 81.5% respectively between those years.
The combination of a public-private partnership, political will, sufficient funds, accountability, commitment and transparency can create a large positive difference in the state of the sector within a relatively short time. If a similar approach for the Lagos Eko Education Project was adopted in all Nigerian states, there would be an almost guaranteed turnaround in the education sector and the economy of the country.
Some Solutions to the Education Problems Ongoing Success Story

Education & Employability Survey Report March, 2014
Make Provisions for the Less Privileged The Universal Basic Education scheme set up by the government, that ensures free and universal basic education for children above the age of six, was a positive and productive move for Nigeria. However, despite this, due to the maintenance expenses involved with schooling a child – such as the costs of school uniform, learning materials, transport and food – many parents still cannot afford the monetary costs of educating their children. There is therefore a need for the government (and the private sector) to intervene at the lower levels of education, in order to reduce these hidden costs and relieve the financial pressures on low-income earners. Enforce Quality Assurance for Education A wide range of Quality Assurance bodies and services at all levels of the education system are currently in place to provide school monitoring and inspection services, and to maintain Minimum Academic Standards (MAS). At the tertiary level, the National Universities Commission (NUC), the National Board for Technical Education (NBTE) and the National Commission for Colleges of Education (NCCE) are responsible for universities, polytechnics and colleges of education respectively. However, the current mechanisms are weak, and many students fail to meet the MAS. These bodies, including those for the lower levels of education, must ensure that academic achievements are constantly monitored, tracked and analysed, in order for the necessary corrective steps to be taken. Strengthen Alternative Education In order to address the issues of lack of learning space, reduce the incidence of overcrowded classrooms and to make education more accessible for all, alternative ways of delivering education should be applied. The use of technology would be instrumental here, to enable online learning for tertiary students especially. In addition, strategies must be developed to incorporate Islamic education into the relevant curricula, so as to make the education system more applicable to those in regions such as the North.
21
Conclusion
This report has focused primarily on education and employability. Problems in the Nigerian education system are one of national significance, and should be treated as such. The development of the sector is hindered by a number of issues and obstacles that prevent the country from attaining healthy economic and societal development. Infrastructure must be built and maintained, teaching facilities must be provided, unnecessary overhead must be drastically reduced, teachers must undergo constant training, more vocational institutions need to be built, and strategies must be devised to make education more accessible to all. Tertiary education is the final stage in the education process, and precedes the stage of employment. It is the level at which students derive the necessary skills and knowledge to enable them function effectively in the work environment. Hence, it is imperative that these higher education institutions ensure that their graduates are “employable” and make them productive contributors to the labour market. The results of the ‘Employability survey’ are presented in the following section. This survey aims to assess the effectiveness of Nigerian tertiary educations at producing employable graduates, and determine the reasons why this may not be the case.
Possible Solutions to the Education Problems (contd.)

Education & Employability Survey Report March, 2014
‘‘Even though the majority of employers believed that collaboration with tertiary institutions is important… the majority of them indicated that their organisations have never collaborated with tertiary institutions in either curriculum design or graduate recruitment ’’
22

Education & Employability Survey Report March, 2014
Detailed Findings
23

Education & Employability Survey Report March, 2014
DETAILED FINDINGS FROM THE SURVEY Part 1 - Recruitment of tertiary education graduates 75% of employers who participated in this study had recruited fresh graduates in the past five years and were planning to recruit more in the next five years. 15% had recruited graduates but were not planning to recruit more, 6% did not recruit but were planning to recruit while 4% did not recruit and were not planning to recruit graduates in the next five years (Figure 12).
24
Figure 12: Recruitment history and future trends (employers) Also, nearly half of the employers surveyed (45%) estimated that fresh graduates recruited in their company made up less than 20% of their company’s workforce. 23% felt it was between 20% and 39% and about 3 in 10 employers (32%) estimated that more than 40% of hires were recent graduates (Figure 13).
Figure 13: Proportion of recent graduates in employers’ company
Did not recruit and not planning
to recruit
Did not recruit but planning to recruit
Have recruited but not planning to
recruit more
Have recruited and plan to recruit
more
4% 6% 15%
75%
23%
32%
45%
Companies with less than 20% of graduates in their workforce
Companies with more than 40% of graduates in their workforce
Companies with 20 – 39% of graduates in their workforce

Education & Employability Survey Report March, 2014
Employers were further asked about the academic background of the graduates they have recruited in the past. The largest proportion of recruits (41%) were Business and Law graduates (which includes Marketing and Sales, Management, Accounting and Finance, and Property sales). 27% of recruited graduates studied Engineering and 11% were from the Social Sciences. This distribution is shown below (Figure 14): Figure 14: Academic disciplines of recruited graduates The largest proportion of recruits (83%) held Bachelor’s degrees. There were more HND holders (8%) than those with Master’s degrees (5%). Only 4% of recruited graduates were OND holders (Figure 15). Figure 15: Highest level of degree held by recruited graduates
25
41%
27%
11%
5%
5%
3%
3%
2%
1%
1%
Business & Law (Marketing & Sales, …
Engineering
Social sciences (Psychology, …
Computing (Software Engineering)
Science & Mathematics (Food …
Health & Welfare (Nursing, Medical, …
Humanities & Arts (Teacher …
Construction
Services (Hospitality, Tourism, Travel, …
Agriculture & Veterinary
83% 8% 5% 4%
Bachelor’s degree
HND Master’s degree
OND

Education & Employability Survey Report March, 2014
Company Characteristics As expected, all of the employers surveyed had recruited fresh graduates over the last five years and are planning to continue doing so in the immediate future. The Banking and Finance, Communications, Oil and Gas, NGOs and Healthcare sectors provide the most opportunities for graduates looking for employment – these are the top five sectors willing to continue recruiting fresh graduates. The benefits of ongoing reforms, growth and interest in the Agriculture, Retail and Power sectors can also be seen in the willingness of employers here – who had not hired graduates in the recent past – to do so now (40%, 33% and 19%) respectively (Figure 16). Figure 16: Recruitment of recent graduates by sector
26
50%
87%
83%
59%
66%
77%
64%
79%
67%
77%
75%
80%
80%
53%
42%
63%
11%
12%
23%
16%
16%
26%
16%
25%
8%
17%
13%
15%
22%
8%
18%
40%
1%
2%
11%
13%
5%
7%
3%
4%
11%
5%
5%
3%
19%
33%
10%
10%
7%
5%
3%
4%
4%
6%
17%
10%
Agriculture
Banking/Finance
Communications (telecoms, media …
Construction
Consulting
Education
Government
Healthcare
Hospitality
IT
Manufacturing
NGOs
Oil and Gas
Power
Retail
Transportation
Have recruited and plan to recruit more
Have recruited but not planning to recruit more
Did not recruit but planning to recruit
Did not recruit and not planning to recruit
Education & Employability Survey Report March, 2014
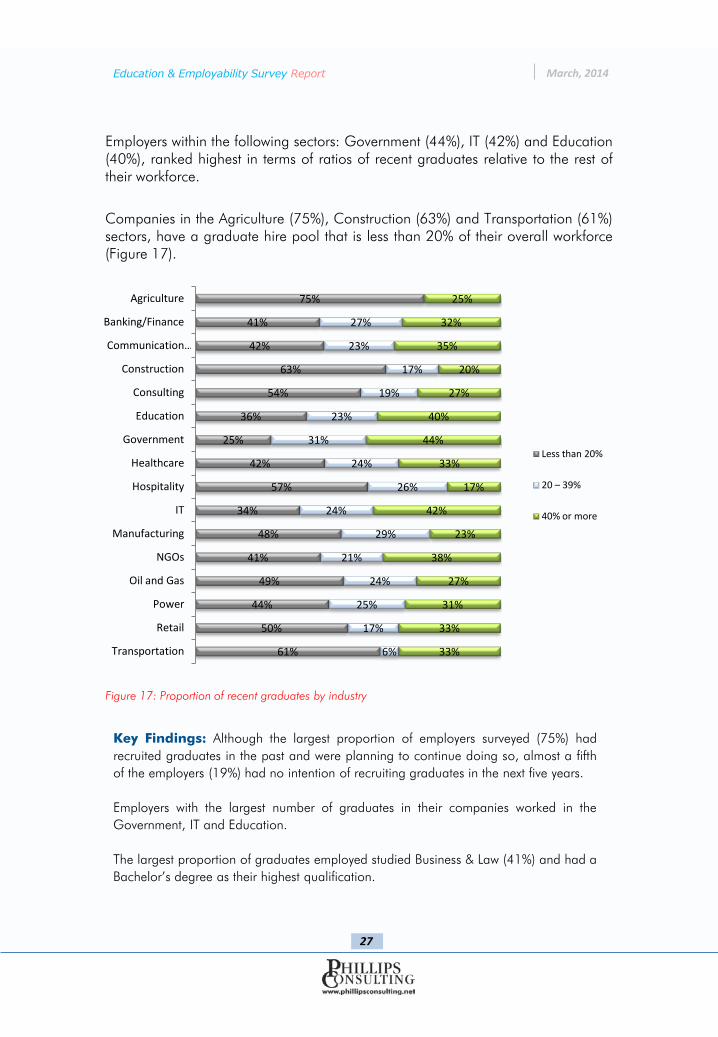
Employers within the following sectors: Government (44%), IT (42%) and Education (40%), ranked highest in terms of ratios of recent graduates relative to the rest of their workforce. Companies in the Agriculture (75%), Construction (63%) and Transportation (61%) sectors, have a graduate hire pool that is less than 20% of their overall workforce (Figure 17).
Figure 17: Proportion of recent graduates by industry
27
Key Findings: Although the largest proportion of employers surveyed (75%) had recruited graduates in the past and were planning to continue doing so, almost a fifth of the employers (19%) had no intention of recruiting graduates in the next five years. Employers with the largest number of graduates in their companies worked in the Government, IT and Education. The largest proportion of graduates employed studied Business & Law (41%) and had a Bachelor’s degree as their highest qualification.
75%
41%
42%
63%
54%
36%
25%
42%
57%
34%
48%
41%
49%
44%
50%
61%
27%
23%
17%
19%
23%
31%
24%
26%
24%
29%
21%
24%
25%
17%
6%
25%
32%
35%
20%
27%
40%
44%
33%
17%
42%
23%
38%
27%
31%
33%
33%
Agriculture
Banking/Finance
Communication…
Construction
Consulting
Education
Government
Healthcare
Hospitality
IT
Manufacturing
NGOs
Oil and Gas
Power
Retail
Transportation
Less than 20%
20 – 39%
40% or more

Education & Employability Survey Report March, 2014
Part 2 – The most sought after skills and capabilities in graduates – Employer and Graduate views Employers Almost all the skills listed in the survey – such as computer skills, subject/discipline knowledge etc – were considered to be very important or important when recruiting graduates (between 76% and 98% of employers ranked these skills as “very important” or “important”). Employers rated Teamwork and Interpersonal skills (69%), Effective verbal communication (67%) and the Ability to think critically and analytically (65%) as their top three “very important” skills. More than a fifth of the employers (23%) indicated that the least important skill required by graduates to work in their company was business awareness and entrepreneurial skills (Figure 18). Figure 18: Importance of desired skills in fresh graduates – Employers views
Graduates Graduate respondents also considered almost all the skills to be very important or important to have in the work place (between 87% and 98% of graduates rated these skills as “very important” or “important”).
Sum of “very important” and “important” in Figure 7
28
50%
58%
37%
56%
67%
69%
43%
26%
65%
50%
41%
38%
56%
42%
31%
29%
50%
51%
32%
47%
8%
3%
6%
2%
1%
1%
5%
20%
2%
1%
Subject/discipline Knowledge
Computer skills
Numeracy skills
Good reading/writing skills
Effective verbal communication skills
Teamwork and Interpersonal skills
Planning and Organisation skills
Business awareness and …
Critical and analytical thinking
Capacity to be flexible and …
Very Important
Important
Unimportant
Very unimportant

Education & Employability Survey Report March, 2014
Effective Verbal communication (80%), Team work (78%) and Good reading/writing skills (68%) were rated as their top three “very important” skills. Also, graduates indicated business awareness and entrepreneurial skills (13%) as the least important. Critical and analytical thinking, was not considered as important to graduates as it was to employers – 12% of graduates considered this skill unimportant as opposed to only 3% of employers who considered this skill unimportant (Figure 19). Figure 19: Importance of desired skills in fresh graduates – Graduates views
Key Findings: Employers and Graduates appear to be in sync with regards to the importance of effective Verbal Communication skills and ability to work in teams (a combined 98% - 99% of respondents think these skills are important). However, employers rated the importance of Critical and Analytical thinking higher than graduates did. Both groups ranked Business Awareness and Entrepreneurial skills as least important for fresh graduates to have when taking up their first employment positions.
Sum of “unimportant” and “very unimportant” in Figure 19
29
51%
66%
38%
68%
80%
78%
49%
33%
65%
57%
42%
32%
56%
30%
18%
20%
45%
54%
23%
35%
5%
5%
1%
1%
1%
5%
13%
11%
5%
1%
Subject/discipline Knowledge
Computer skills
Numeracy skills
Good reading/writing skills
Effective verbal communication skills
Teamwork and Interpersonal skills
Planning and Organisation skills
Business awareness and entrepreneurial skills
Critical and analytical thinking
Capacity to be flexible and adaptable
Very Important
Important
Unimportant
Very Unimportant

Education & Employability Survey Report March, 2014
Part 3 – The current levels of satisfaction with graduates’ skills While the majority of employers ‘agree’ that Nigerian graduates leave tertiary institutions with the skills required to work in their organisations, only 11% of them ‘Strongly agree’ with this position. This is not exactly a ringing endorsement of the quality of fresh graduate hires (Figure 20). Figure 20: Employers’ overall satisfaction with graduate skills
30
Strongly disagree Agree Strongly agree Disagree
4% 11% 25% 60%

Education & Employability Survey Report March, 2014
Figure 21: Satisfaction with recruited graduates’ skills and capabilities
31
20%
20%
17%
19%
19%
24%
15%
16%
17%
18%
63%
62%
66%
61%
56%
58%
53%
54%
51%
62%
16%
16%
16%
18%
22%
16%
30%
25%
28%
19%
1%
2%
1%
2%
2%
2%
3%
5%
4%
2%
Subject/discipline Knowledge
Computer skills
Numeracy skills
Good reading/writing skills
Effective verbal communication skills
Teamwork and Interpersonal skills
Planning and Organisation skills
Business awareness and entrepreneurial
skills
Critical and analytical thinking
Capacity to be flexible and adaptable
Very Satisfied
Satisfied
Dissatisfied
Very Dissatisfied
Indeed, less than 25% of all employers indicated that they were “Very satisfied” with any skill, of which Teamwork and interpersonal skills (24%), Subject/discipline knowledge (20%) and Computer skills (20%) were the top three (Figure 21). Dissatisfaction levels appeared to be highest in Planning and Organisational skills (30%), Critical and Analytical thinking (28%) and Business awareness and Entrepreneurial skills (25%).

Education & Employability Survey Report March, 2014
Figure 22: Overall satisfaction level with graduate’s skills by industry 32
13%
10%
18%
10%
11%
11%
11%
10%
9%
10%
13%
14%
10%
17%
18%
13%
88%
64%
55%
59%
52%
74%
62%
73%
59%
62%
53%
57%
56%
60%
53%
67%
0%
23%
23%
29%
27%
14%
25%
10%
27%
23%
31%
29%
30%
20%
29%
20%
3%
5%
2%
10%
1%
3%
7%
5%
5%
3%
3%
3%
Agriculture
Banking/Finance
Communications (telecoms, media etc)
Construction
Consulting
Education
Government
Healthcare
Hospitality
IT
Manufacturing
NGOs
Oil and Gas
Power
Retail
Transportation
Strongly agree
Agree
Disagree
Strongly disagree
Company Characteristics A very small proportion of employers “Strongly agreed” that graduates were well equipped to work in their company. The top three in this category include employers from familiar sectors: Communications (18%), Retail (18%) and Power sectors (17%). The Manufacturing (31%), Oil and Gas sector (30%) and NGOs (29%) had the highest number of employers who did not agree that graduates had the right skills to work. Of those who “strongly disagreed,” the majority were from the Consulting sector (10%). The Agriculture sector appeared, overall, to be the most satisfied with the level of skills possessed by their graduates (Figure 22).

Education & Employability Survey Report March, 2014
Figure 23: Overall satisfaction with graduate’s skills by employer’s recruitment plan Key Findings: The majority of the employers generally agree that recently recruited graduates had the skills to work in their organisations. Those in the Agriculture and Education sectors, especially appeared to be satisfied with the skills exhibited by their recruited graduates, particularly with graduates’ knowledge in their respective disciplines. For those employers who had the highest rate of dissatisfaction (i.e. Consulting and Oil and Gas sectors), graduates’ ability to work on their own as well as their critical and analytical thinking skills were the major source of disappointment. Again, the recruitment trends were directly proportional to satisfaction levels in that the more employers recruit and/or plan to, the more likely they are to agree that recruited graduates have the required skills.
33
84%
84%
82%
76%
16%
16%
18%
24%
Strongly agree
Agree
Disagree
Strongly disagree
Have recruited and plan to recruit more
Have recruited but not planning to recruit more
A correlation between recruitment history/trends and overall satisfaction level was discovered. The highest proportion of employers who do not plan to recruit any more graduates in the near future, had the lowest overall satisfaction level – 24% “strongly disagreed” that graduates possessed the right skills to work in their company (Figure 23).

Education & Employability Survey Report March, 2014
Part 4 – The most valued criteria in graduate recruitment – Employer and Graduate Views Employers Most of the employers (27%) ranked criteria such as ‘attitude’ and ‘communication skills’, as the most important factors they looked for in graduates. This was followed by ‘relevant work experience post-qualification’ (17%) and ‘interview performance ‘(17%). Employers do not seem to place great importance on participation in internships or study abroad programmes, volunteering and extracurricular activities, when recruiting graduates (Figure 24). Figure 24: Preferred qualities of graduates by employers
34
0%
0%
0%
0%
0%
1%
2%
3%
4%
12%
16%
17%
17%
27%
Extracurricular activities (e.g. student societies, sports etc)
Internship or placement as part of course
Volunteering
Participated in study abroad programmes
Research topics or areas of interest
Internship or placement in our organisation specifically
Recommendations
Relevant work experience pre-qualification (i.e. working while in school, holidays etc)
Institution attended
Discipline or subject choice
Qualification result
Interview performance
Relevant work experience post-qualification
Employability skills (e.g. attitude, communication skills etc)

Education & Employability Survey Report March, 2014
Figure 25: Preferred institutions in graduate recruitment Some of the top ranked local institutions included the Federal Universities in Ibadan, Lagos, Ile-Ife, Nsukka, as well as the Federal University of Technology in Owerri, and Private Universities like Covenant, Babcock and Redeemer’s Universities.
35
No preference
Federal Universities in Nigeria
Foreign Universities
Polytechnic
Private Universities in Nigeria
State Universities in Nigeria
51%
31%
6%
5%
4%
3%
When asked if they had any preference for graduates from specific tertiary institutions in Nigeria, approximately half of the employers (51%) had no preference, while 31% preferred to recruit graduates from Federal universities in the country. State universities, gathered the least number of votes (Figure 25).

Education & Employability Survey Report March, 2014
Figure 26: Qualities of preferred tertiary institutions
36
20%
12%
18%
16%
17%
1%
13%
1%
0%
1%
1%
7%
12%
21%
27%
20%
2%
10%
1%
2%
7%
18%
21%
20%
8%
1%
9%
2%
6%
1%
12%
12%
17%
22%
19%
1%
14%
4%
13%
20%
11%
13%
16%
2%
16%
2%
1%
4%
1%
The institution has a great reputation
The institution offers relevant subject or discipline knowledge
Quality of subject or discipline knowledge
Quality of employability skills and attributes
The institution produces high quality graduates
My organisation has strong links with institution
Successful past experience of recruiting from this institution
Geographical location of the institution
My organisation is often consulted on course design
Students participate in organisation work placement programmes
My organisation and the institution collaborate on joint research projects
Federal Universities in Nigeria
Foreign Universities/Colleges
Polytechnic
Private Universities in Nigeria
State Universities in Nigeria
Graduates from Federal universities were recruited mainly because of the great reputation of their institution (20%). Foreign universities were also believed to produce the highest quality graduates compared to tertiary institutions (Figure 26).

Education & Employability Survey Report March, 2014
Figure 27: Reasons for preferred institution by employers
37
1%
1%
1%
1%
2%
12%
14%
15%
15%
18%
21%
My organisation is often consulted on course design
My organisation and the institution collaborate on joint research projects
My organisation has strong links with institution
Geographical location of the institution
Students participate in organisation work placement programmes
Successful past experience of recruiting from this institution
The institution offers relevant subject or discipline knowledge
The institution has a great reputation
The institution produces high quality graduates
Quality of subject or discipline knowledge
Quality of employability skills and attributes
Employers preferred graduates from the selected tertiary institutions because the graduates from these schools are believed to possess the desired skills and attributes for employment. (Figure 27). These were ranked to be highest in graduates of foreign universities (27%; Refer to figure 26).

Education & Employability Survey Report March, 2014
Figure 28: Desired qualities in graduates by employers’ industry
38
6%
6%
2%
3%
4%
4%
2%
4%
6%
4%
2%
3%
3%
2%
0%
1%
19%
6%
10%
17%
11%
19%
20%
19%
12%
12%
10%
12%
15%
24%
18%
7%
6%
22%
15%
11%
13%
18%
20%
14%
10%
9%
14%
8%
18%
13%
5%
7%
31%
28%
29%
22%
30%
20%
20%
25%
29%
28%
31%
27%
22%
25%
40%
30%
2%
2%
4%
4%
2%
3%
1%
1%
2%
2%
3%
4%
3%
4%
5%
3%
6%
14%
17%
22%
18%
13%
16%
18%
20%
21%
16%
20%
20%
19%
10%
24%
2%
1%
3%
25%
18%
18%
12%
17%
16%
17%
18%
16%
18%
20%
14%
16%
8%
15%
26%
3%
3%
Agriculture
Banking/Finance
Communications (telecoms, media etc)
Construction
Consulting
Education
Government
Healthcare
Hospitality
IT
Manufacturing
NGOs
Oil and Gas
Power
Retail
Transportation
Institution attended
Discipline or subject choice
Qualification result
Employability skills (e.g. attitude, communication skills etc)
Extracurricular activities (e.g. student societies, sports etc)
Relevant work experience pre-qualification (i.e. working while in school, holidays etc) Relevant work experience post-qualification
Internship or placement as part of course
Internship or placement in our organisation specifically
Participated in study abroad programmes
Interview performance
Research topics or areas of interest
Recommendations
Volunteering
Company Characteristics An analysis by sector revealed that the highest demand for personal qualities such as attitude and communication was in the Retail industry (40%). A premium is placed on ‘qualification result’ by employers in the Banking industry (22%). Employers in the Transportation and Construction sectors value ‘work experience post-qualification’ (24% and 22% respectively). Expectedly, extracurricular activities, internship placements and volunteering, were considered more important to employers in NGOs than any other sector (Figure 28).

Education & Employability Survey Report March, 2014
Figure 29: Preferred institutions by industry
39
100%
61%
70%
60%
66%
80%
81%
90%
38%
85%
70%
54%
49%
48%
29%
30%
9%
10%
12%
21%
2%
5%
10%
4%
15%
10%
28%
14%
9%
11%
20%
9%
4%
25%
13%
8%
6%
19%
29%
8%
11%
10%
8%
2%
0%
13%
4%
8%
9%
14%
14%
4%
8%
7%
0%
6%
8%
25%
8%
7%
5%
29%
Agriculture
Banking/Finance
Communications (telecoms, media etc)
Construction
Consulting
Education
Government
Healthcare
Hospitality
IT
Manufacturing
NGOs
Oil and Gas
Power
Retail
Transportation
Federal Universities in Nigeria
Foreign Universities/Colleges
Polytechnic
Private Universities in Nigeria
State Universities in Nigeria
Employers in the Agriculture and Healthcare sectors constituted the majority of respondents who preferred graduates of Federal universities (Figure 29). The largest proportion of employers who preferred graduates of foreign universities, worked in the Oil and Gas (29%) and Consulting sectors (21%).

Education & Employability Survey Report March, 2014
Figure 30: What graduates think employers want from them during recruitment
40
0%
0%
0%
0%
1%
1%
4%
4%
4%
9%
15%
19%
20%
22%
Volunteering
Internship or placement in their organisation specifically
Internship or placement as part of course
Research topics or areas of interest
Extracurricular activities (e.g. student societies, sports etc)
Participated in study abroad
Institution attended
Recommendations
Relevant work experience pre-qualification (i.e. working while in school, holidays etc)
Discipline or subject choice
Interview performance
Relevant work experience post-qualification
Employability skills (e.g. attitude, communication skills etc)
Qualification result
Graduates The students and fresh graduates who took part in this survey were also asked to indicate what graduate qualities and criteria they felt was most important to employers. More than a fifth (and the largest proportion) of graduates surveyed (22%) believed that qualification results was the most valued consideration for employers (Figure 30). However, this factor was indicated as being the fourth most important to employers, hence the existence of a gap between employers and graduates views.

Education & Employability Survey Report March, 2014
Key Findings: While employers ranked employability skills such as a ‘good attitude’ and ‘effective communication’ as the most important considerations for graduate recruitment (27%), graduates believed that their ‘qualification results’ was most important to employers (22%). The largest proportion of employers (51%) had no preference for graduates from any particular tertiary institutions. However, those who preferred graduates from Federal universities in Nigeria did so because of the reputation of these institutions. Foreign university graduates were preferred by employers mostly in the Oil & Gas and Consulting sectors.
41
6%
94%
No Yes
Figure 31: Graduates who believe that being educated improves their chances of finding employed
Figure 32: Readiness to work after graduation
1% 6%
38% 55%
Not at all prepared Unprepared
Prepared Very well prepared
Despite this gap, graduates generally felt confident about the quality of their education and their readiness to work. Approximately 94% of graduates believed that their education improved their chances of finding a job (Figure 31). Likewise, the bulk of graduates surveyed (93%) indicated that they felt prepared to work immediately after graduation. Only (7%) did not feel prepared (Figure 32).

Education & Employability Survey Report March, 2014
Part 5 – The major challenges faced in filling graduate job vacancies and views on how they can be made more employable 1 in 2 of employers surveyed feels that tertiary institutions in Nigeria are not doing a good job of producing successful graduate employees. In fact 12% rates it as “poor” (Figure 33). This means that the graduates’ skills which employers seem to be satisfied with (as previously described) were probably obtained outside of their tertiary education. Figure 33: Employers views on the effect of tertiary education on graduate employability Employers were asked to state the most important challenges faced in filling their graduate vacancies. The challenges mentioned included the following: 1. Lack of relevant workplace skills: Poor communication skills (especially verbal and
written communication) in graduates appeared to be one of the greatest challenges. Employers used terms such as ‘deplorable’, ‘sad’ and ‘shameful’ to describe the state of this skill in graduates.
2. Inability to defend qualification/degree: Employers pointed out that graduates obtain fake certificates and are dishonest about the information on their CVs, hence making it difficult to get the most suitable candidate for a job.
3. Too many applications: The overwhelming numbers of graduate applications for limited vacancies tend to discourage employers from sifting through them all. Hence, they depend on external assistance and sometimes end up recruiting unsuitable candidates.
4. Cost of training requirement: Due to the excessive theoretical knowledge acquired in school, many graduates have been found to lack experience or practical exposure. This forces employers to provide basic training for them which incurs high costs for the firm.
5. High salary expectation: Employers believe that there is a mismatch between the skills and salary expectations of graduates.
42
Excellent Good
Fair Poor
4%
35%
50%
12%
Excellent
Good
Fair
Poor

Education & Employability Survey Report March, 2014
Bad attitude: Many graduates’ are accused of being dishonest and often show a lack of commitment, patience and willingness to work. This creates a challenge for employers as it causes them to lose money and become hesitant in recruiting fresh graduates in the future. Age limit: Most suitable and experienced graduates/new job seekers are older than the maximum age required by companies. The distribution of these challenges is shown in figure 34 below: Figure 34: Challenges in recruiting graduates
43
8% High salary expectation
24%
19%
17%
15%
9%
8% Age Limit
Too many applications
Cost of training requirement
Inability to defend degree
Bad attitude
Lack of relevant workplace skills

Education & Employability Survey Report March, 2014
Figure 35: Ways through which graduates could improve how they apply for jobs Figure 36: Ways through which tertiary institutions could improve employability of their graduates 44
Have better interviewing skills
Getting relevant certifications
Research the organisation more thoroughly Research the industry more thoroughly Prepare a better resume
Write a better cover letter
31%
22%
19%
9%
3%
24%
23%
10%
17%
32%
41%
Provide better post-graduation support (facilitate relations between graduates and companies)
Include sector-specific work placements as an integral part of the study programme
Make courses more relevant to the needs of employers
Include practical experience in courses
In order to identify how these challenges can be rectified, employers were required to select and/or suggest ways through which students could improve their application process and what tertiary institutions can do to improve their employability. Improving their interviewing skills (24%) and getting relevant certifications (23%) were ways through which employers felt graduates could do better in the job application process (Figure 35). Also the largest fraction of employers (41%) suggested that tertiary institutions include practical experiences in their courses to improve graduates’ employability (Figure 36).

Education & Employability Survey Report March, 2014
However, it is also a source of concern that 15% to 38% (sum of “not very confident” and “not confident at all”)of employers are not confident about this (Figure 37). Employers express this doubt especially in the following skills: Business awareness (38%), Critical and analytical thinking (35%), Planning and organisational skills (34%), Good reading and writing skills (32%) and Subject/discipline knowledge (32%). Figure 37: Employer’s confidence in the future supply of graduates with required skills Key Findings: 62% of employers do not think tertiary institutions are doing a good job of producing successful graduate employees. These employers stated inadequate workplace skills, bad attitude to work, fake degrees, high cost of required training, volume of applicants, age limit and high salary expectations as the main challenges faced in recruiting graduates. The majority of employers believe improving one’s interviewing skills and including practical training in courses by tertiary institutions would improve the employability of graduates
45
20%
32%
18%
19%
21%
20%
16%
15%
18%
18%
48%
54%
53%
49%
49%
57%
49%
47%
47%
55%
30%
14%
28%
30%
28%
23%
32%
34%
32%
26%
2%
1%
2%
2%
2%
1%
2%
4%
3%
1%
Subject/discipline Knowledge
Computer skills
Numeracy skills
Good reading/writing skills
Effective verbal communication skills
Teamwork and Interpersonal skills
Planning and Organisation skills
Business awareness and entrepreneurial
skills
Critical and analytical thinking
Capacity to be flexible and adaptable
Very Confident
Confident
Not very confident
Not confident at all

Education & Employability Survey Report March, 2014
Part 6 – The frequency and importance of collaboration between companies and tertiary institutions The collaboration between graduate employers and tertiary institutions in curriculum design and graduate recruitment processes appeared to be inadequate. Over half of the employers (52%) said they never collaborate with tertiary institutions in designing the curriculum and/or study programmes of these local schools. Only 16% do it frequently (Figure 38). Similarly, the majority of employers (48%) said they never collaborate with tertiary institutions in the graduate recruitment process. Figure 38: Frequency of collaboration with tertiary institutions on curriculum design and graduate recruitment
46
52%
32%
13%
3%
Never
Sometimes
Frequently
Very Frequently
48%
37%
8%
7%
Curriculum Design Graduate Recruitment

Education & Employability Survey Report March, 2014
Figure 39: Importance of collaboration with tertiary institutions Employers who thought collaboration with tertiary institutions was important indicated that the best way to do so is through student participation in internship programmes (55%). See Figure 40 for other csuggested ollaborative methods. Figure 40: Ways for employers to collaborate better with with tertiary institutions for graduate recruitment
47
22%
47%
26%
5%
Very Important
Important
Unimportant
Very Unimportant
55%
18%
15%
13%
Participation in internship programmes with higher education institutions Cooperation with career centres Direct recruitment from schools Personal discussions with study programme dircetors or teachers
Although, the collaboration between companies and tertiary institutions is insufficient, most of the employers (69%) consider such a collaboration to be important to their organisation. The remaining 31% believe it’s unimportant (Figure 39).
Education & Employability Survey Report March, 2014
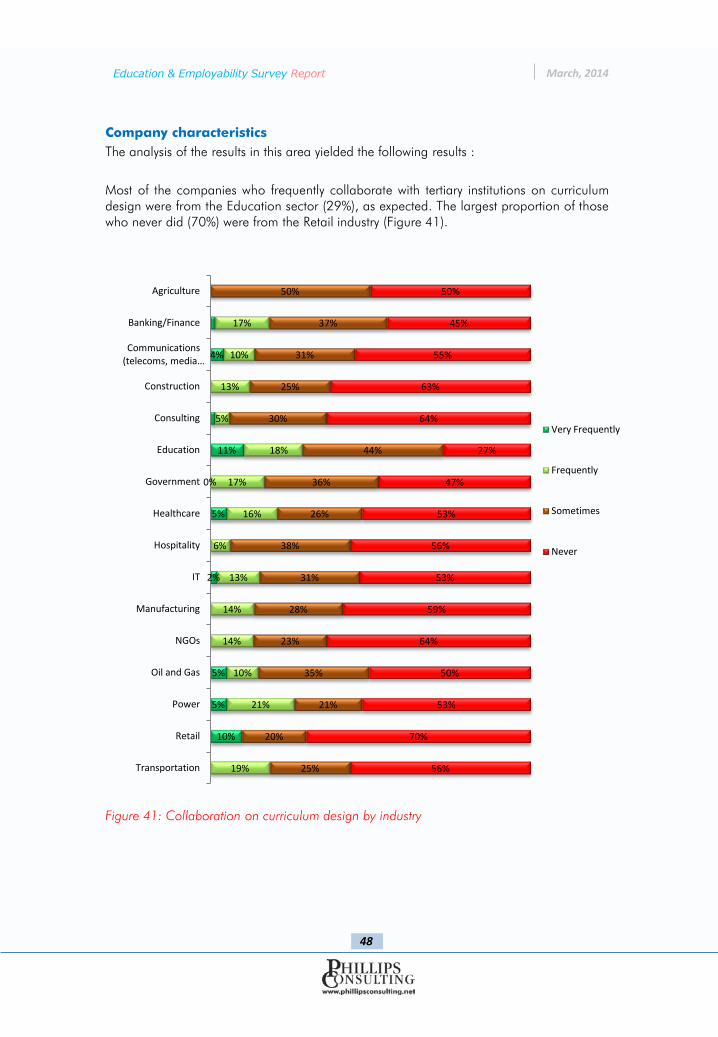
Company characteristics The analysis of the results in this area yielded the following results : Most of the companies who frequently collaborate with tertiary institutions on curriculum design were from the Education sector (29%), as expected. The largest proportion of those who never did (70%) were from the Retail industry (Figure 41). Figure 41: Collaboration on curriculum design by industry
48
4%
11%
0%
5%
2%
5%
5%
10%
17%
10%
13%
5%
18%
17%
16%
6%
13%
14%
14%
10%
21%
19%
50%
37%
31%
25%
30%
44%
36%
26%
38%
31%
28%
23%
35%
21%
20%
25%
50%
45%
55%
63%
64%
27%
47%
53%
56%
53%
59%
64%
50%
53%
70%
56%
Agriculture
Banking/Finance
Communications (telecoms, media …
Construction
Consulting
Education
Government
Healthcare
Hospitality
IT
Manufacturing
NGOs
Oil and Gas
Power
Retail
Transportation
Very Frequently
Frequently
Sometimes
Never

Education & Employability Survey Report March, 2014
49
Figure 42: Collaboration on graduate recruitment by industry
11%
5%
5%
19%
8%
5%
8%
21%
22%
33%
9%
8%
12%
3%
14%
9%
22%
6%
7%
8%
7%
22%
6%
33%
42%
42%
34%
34%
37%
36%
22%
44%
29%
39%
25%
47%
26%
38%
33%
39%
45%
54%
60%
44%
53%
56%
50%
45%
45%
70%
38%
53%
56%
56%
Agriculture
Banking/Finance
Communications (telecoms, media etc)
Construction
Consulting
Education
Government
Healthcare
Hospitality
IT
Manufacturing
NGOs
Oil and Gas
Power
Retail
Transportation
Very Frequently
Frequently
Sometimes
Never
Although employers in the Retail industry constituted the majority of those who never collaborated with tertiary institutions on curriculum design, they appeared to be the largest proportion of employers (44%) who frequently cooperated with institutions on graduate recruitment. Employers who never collaborated with tertiary institutions on graduate recruitment worked mostly in NGOs (70%). Figure 42.

Education & Employability Survey Report March, 2014
Figure 43: Importance of collaboration by industry
Key Findings: Even though the majority of employers (69%) believed that collaboration with tertiary institutions is important especially through participation in internship programmes, the majority of them indicated that their organisations have never collaborated with tertiary institutions in either curriculum design or graduate recruitment – 52% and 48% respectively. Only about 15% do so frequently in both cases. Employers in the Retail industry constituted the largest proportion of those who never cooperate on curriculum design but who frequently cooperate on graduate recruitment. On the other hand employers in the Education sector are the most cooperative on curriculum design, while NGOs are the least cooperative on graduate recruitment.
50
33%
23%
23%
11%
30%
31%
28%
14%
21%
28%
21%
11%
22%
30%
18%
18%
67%
44%
45%
49%
40%
51%
47%
59%
47%
53%
52%
44%
52%
59%
45%
32%
0%
30%
26%
34%
28%
17%
22%
14%
21%
14%
23%
33%
20%
7%
36%
41%
0%
3%
5%
6%
3%
1%
3%
14%
11%
5%
3%
11%
6%
4%
0%
9%
Very Important
Important
Unimportant
Very Unimportant
The importance of collaborations with tertiary institutions also varied with industry. Employers from the Agriculture and Power sectors considered the collaboration to be most important compared to the other industries, while those who found this collaboration to be the least important were mostly from the Transportation sector (Figure 43).

Education & Employability Survey Report March, 2014
Discussion Conclusion
&
51

Education & Employability Survey Report March, 2014
DISCUSSION AND CONCLUSION
The aim of this survey was to explore the opinions of employers and fresh graduates on the role of tertiary education in producing successful graduate employees. Only a small proportion of employers (less than 40%) thought tertiary institutions were doing a good job of this. On the other hand, more than 90% of students/fresh graduates believed that their education improves their chances of finding a job and prepares them for the labour market. This discrepancy could be caused by a number of factors revealed in this study:
1. The difference in what is thought to be the most important quality looked for during graduate recruitment. Employers are most interested in the employability skills of graduates which include life skills as well as technical competence. However, graduates believe that as long as their qualification result is good, the transition to employment from education will be smooth.
2. Graduates underestimate the importance of the ability to think critically and analytically. This skill is among the top three most important proficiencies an employer searches for. Yet it was the second most rated unimportant skill by graduates. Thus, explaining why employers expressed a high level of dissatisfaction with this skill along with graduates’ inability to work effectively on their own.
These disconnects in some of the views of employers and students can be resolved through collaboration between tertiary institutions and organisations in curriculum design and graduate recruitment. Most of the employers believed that such a partnership was important but only about 15% of them frequently engaged in the act. This may be as a result of the presence of an unsuitable platform to kick start the process. Therefore, the Government , through better funding, tougher regulations and standards and creation of industrial policies, needs to ensure a form of collaboration that targets the following:
The inclusion of formal training for life skills in tertiary education curricula
Provision of technical and vocational education system
The use of more life case analysis in teaching to improve practicality
Development of compulsory entrepreneurial studies for students
Improving employability content in curricula and developing employability performance indices of graduates to enable self-tracking or performance
This will enable the high demand for employability skills in fresh graduates to be more easily adopted by students while in school; thus reducing the challenges experienced by employers in filling their graduate vacancies. It will also allow employers gain more trust in local university systems and not have to rely on foreign graduates to meet this demand.
52

Education & Employability Survey Report March, 2014
53
Ajiboye, S. K., Oyebanji, T. O., & Awoniyi, S. A. (2013). Influence of Higher Education on Employability as Perceived by Lecturers of University of Ilorin, Nigeria. European Scientific Journal, 229 - 236. Alao, A., Finlay, J. E., Humair, S., Mason, A., Olaniyan, O., Reed, H., . . . Weston, M. (2010). Nigeria: The Next Generation Report. Program on the Global Demography of Aging. Nigeria, F. R. (2004). National Policy on Education. Onitsha: Federal Ministry of Information. Taiwo-Oguntuase. (2014). Un-employability of Nigerian graduates': Myth or reality? Daily Independent Newspaper.
BIBLIOGRAPHY

Education & Employability Survey Report March, 2014
Figure 1 - Ripple Effects of Low Federal Government Budget allocation to the Education sector
Figure 2 - A comparative analysis of the education budgets for selected countries in 2012
Figure 3 - Capital and Recurrent Education Expenditures by the Federal Government in Nigeria,
between 1979 and 2007
Figure 4 - Enrolment information for primary, secondary and tertiary levels of Nigerian education
Figure 5 - Education Attainment of the Working Age Population of Nigerians (aged 15-64) in 2006
Figure 6 - Map of Nigeria showing the female literacy levels in different states in 2008
Figure 7 - Ratio of females to males for primary school enrolment
Figure 8 - The numeracy and reading skills displayed by children aged 5-16 in different regions of the
country, 2010
Figure 9 - The number of students who left Nigeria for higher education between 2007 and 2012
Figure 10 - The carrying capacity of Federal, State and Private Universities in Nigeria vs. the actual
number of students admitted in 2005
Figure 11 - Number of applications made into Nigerian universities compared with the number of
students accepted
Figure 12 - Recruitment history and future trends (employers)
Figure 13 - Proportion of recent graduates in employers’ company
Figure 14 - Academic disciplines of recruited graduates
Figure 15 - Highest level of degree held by recruited graduates
Figure 16 - Recruitment of recent graduates by sector
Figure 17 - Proportion of recent graduates by industry
Figure 18 - Importance of desired skills in fresh graduates – Employers views
Figure 19 - Importance of desired skills in fresh graduates – Graduates views
Figure 20 - Employers’ overall satisfaction with graduate skills
Figure 21 - Satisfaction with recruited graduates’ skills and capabilities
Figure 22 - Overall satisfaction level with graduate’s skills by industry
54
Index of Figures and Tables

Education & Employability Survey Report March, 2014
55
Index of Figures and Tables
Figure 23 - Overall satisfaction with graduate’s skills by employer’s recruitment plan
Figure 24 - Preferred qualities of graduates by employers
Figure 25 - Preferred institutions in graduate recruitment
Figure 26 - Qualities of preferred tertiary institutions
Figure 27 - Reasons for preferred institution by employers
Figure 28 - Desired qualities in graduates by employers’ industry
Figure 29 - Preferred institutions by industry
Figure 30 - What graduates think employers want from them during recruitment
Figure 31 - Graduates who believe that being educated improves their chances of finding employed
Figure 32 - Readiness to work after graduation
Figure 33 - Employers views on the effect of tertiary education on graduate employability
Figure 34 - Challenges in recruiting graduates
Figure 35 - Ways through which graduates could improve how they apply for jobs
Figure 36 - Ways through which tertiary institutions could improve employability of their graduates
Figure 37 - Employer’s confidence in the future supply of graduates with required skills
Figure 38 - Frequency of collaboration with tertiary institutions on curriculum design and graduate
recruitment
Figure 40 - Ways for employers to collaborate better with tertiary institutions for graduate recruitment
Figure 41 - Collaboration on curriculum design by industry
Figure 42 - Collaboration on graduate recruitment by industry
Figure 43 - Importance of collaboration by industry
Table 1 - Number and Distribution of Higher Education Institutions in Nigeria
Table 2 – The 2014 World Webometric Ranking of Nigerian Universities

Education & Employability Survey Report March, 2014
56

Education & Employability Survey Report March, 2014
OUR QUARTERLY SURVEYS
“The use of surveys is an effective way of gaining valid and quantifiable information”. The Business Advisory Services Division conducts quarterly surveys into topical economic and business issues in the country. Since 2013, these have included the reforms and ongoing developments in the Power, Telecommunications, and Financial Services and Health, sectors.
For surveys, contact: [email protected] or [email protected]
For surveys, contact: [email protected] or
For detailed reports visit http://www.phillipsconsulting.net/images/files
Power Sector reforms, Mobile Number Portability, Mobile Money

Education & Employability Survey Report March, 2014
Disclaimer The information contained in this survey is for general information purposes only and represents only the views and opinions of respondents and not essentially that of Phillips Consulting Limited. In no event will Phillips Consulting Limited be liable for any loss or damage including without limitation, indirect or consequential loss or damage, or any loss or damage whatsoever arising from loss of data or profits arising out of or in connection with the use of the information contained in the survey. © 2013 PCL Business Advisory Services Division is focused on assisting investors in start-ups and project management, conducting diagnostic studies, applying scenario based planning, facilitating board retreats and business policy alignment, driving performance improvement initiatives, supervising business turnarounds and sustaining total quality management. Our work is practical, with a strong emphasis on implementation. The division's engagements are with major public and private organizations across various sectors of the economy.