Embed Size (px)
Citation preview
2
Reproduction of material
Material in this report may be reproduced and published, provided that it does not purport to be published under government authority and that acknowledgement is made of this source.
Citation
Statistics New Zealand and Ministry of Pacific Island Affairs (2010). Education and Pacific peoples in New Zealand.
Wellington: Author.
Published in June 2010 by
Statistics New Zealand Ministry of Pacific Island Affairs Tatauranga Aotearoa Wellington, New Zealand Wellington, New Zealand
ISBN 978-0-478-35345-7 (online)
Education and Pacific Peoples in New Zealand
3
Standards and further information
Percentage changes Percentage movements are, in a number of cases, calculated using data of greater precision than published. This could result in slight variations.
Rounding procedures On occasion, figures are rounded to the nearest thousand or some other convenient unit. This may result in a total disagreeing slightly with the total of the individual items as shown in tables. Where figures are rounded the unit is in general expressed in words below the table headings, but where space does not allow this the unit may be shown as (000) for thousands, etc.
All counts in this report have been randomly rounded to base 3 to protect the confidentiality of respondents. For this reason not all figures will sum to stated totals.
Ethnicity data The ethnicity data used in this report has been sourced from Statistics New Zealand and from administrative data and survey data from government agencies. Statistics New Zealand’s data is grouped using a total count method where individuals are counted in each ethnic group they identify with. Ethnicity is self-perceived and people can belong to more than one ethnic group (with up to six ethnic responses counted in official collections).
Administrative data from agencies and some survey data may not use a total count method. Instead individuals are grouped according to a prioritised system. Prioritised ethnic groups involve each person being allocated to a single ethnic group, based on the ethnicities they have identified with, in the prioritised order of Mäori, Pacific, Asian and European/Other. For example, if someone identifies as being Chinese and Mäori, under the prioritised ethnic group method, they are classified as Mäori for the purpose of analysis.
The way that the ethnicity data is prioritised means that the group of prioritised European/Other effectively refers to non-Mäori, Non-Pacific, non-Asian people. The aim of prioritisation is to ensure that where some need exists to assign people to a single ethnic group, ethnic groups of policy importance, or of small size, are not swamped by the New Zealand European ethnic group.
Source: http://www.moh.govt.nz
Changes of base Where consecutive figures have been compiled on different bases and are not strictly comparable, a footnote is added indicating the nature of the difference.
Source All data is compiled by Statistics New Zealand, except where otherwise stated. Both administrative and survey data has been used in this report.
4
Liability While all care and diligence has been used in processing, analysing and extracting data and information in this report, Statistics New Zealand gives no warranty it is error free and will not be liable for any loss or damage suffered as a result of the use, directly or indirectly, of information in this report.
Statistics NZ has provided official statistics to inform analysis. MPIA authors have provided commentary and liaised with other government agencies to produce the series.
Ministry of Pacific Island Affairs For further information or analysis on Pacific peoples in New Zealand contact the Ministry of Pacific Island Affairs:
Email: [email protected] Phone Wellington: +64 4 474 4498 Phone Auckland: +64 9 262 1513 Phone Christchurch: +64 3 363 8015 Website: www.mpia.govt.nz
Statistics New Zealand Information Centre For further information on the statistics in this report, and for help finding and using statistical information available on our website, including Infoshare and Table Builder, contact the Information Centre:
Email: [email protected] Phone toll-free: 0508 525 525 Phone international: +64 4 931 4600 Fax: +64 4 931 4610 Post: P O Box 2922, Wellington 6140, New Zealand Website: www.stats.govt.nz
Acknowledgements This report was prepared by Melissa Brewerton of Te Whiti Consulting. We would also like to acknowledge the following contributors: Ministry of Education: Dean Alexander, Lesiele Tongati’o, David Lambie and Ezra Schuster. Education Review Office: Jan Adams and Diane Anderson. New Zealand Qualifications Authority: Leilani Buchan and Karen Chalmers. Tertiary Education Commission: Debbie Ryan.
Education and Pacific Peoples in New Zealand
5
Contents
Foreword ................................................................................................................ 7
1 Introduction ................................................................................................... 8
2 Executive summary .................................................................................. 10
Early childhood education .................................................................................................................... 10 Schooling ..................................................................................................................................................... 11 Tertiary education .................................................................................................................................... 11
3 Early childhood education ..................................................................... 13
At home ....................................................................................................................................................... 13 Impact of early childhood education ............................................................................................... 14 What Pacific parents want of ECE ..................................................................................................... 16 What is important for early learning ................................................................................................. 18 What is important for success in the education system .......................................................... 19 What would make the most difference? ........................................................................................ 20
4 Schooling ..................................................................................................... 21
Parent involvement ................................................................................................................................. 21 Cultural differences ................................................................................................................................. 24 What is necessary for successful learning? .................................................................................... 25 Foundations for learning ....................................................................................................................... 30 Bilingualism ................................................................................................................................................ 34 Special education needs ....................................................................................................................... 35 Quality teaching ........................................................................................................................................ 36 School leadership .................................................................................................................................... 42 Education pathways ................................................................................................................................ 43 What would make the most difference? ........................................................................................ 45
5 Tertiary education ..................................................................................... 47
Benefits of tertiary education .............................................................................................................. 47 Literacy and numeracy of Pacific adults ......................................................................................... 48 Pacific participation in tertiary education ........................................................................................ 50 Work-based tertiary education ............................................................................................................ 52 Higher-level tertiary education: diplomas and degrees ............................................................ 53 Success in tertiary education ............................................................................................................... 55 Community links ...................................................................................................................................... 58 Student loans ............................................................................................................................................ 59 What would make the most difference? ........................................................................................ 60
6 Conclusion .................................................................................................. 61
References .......................................................................................................... 62
Education and Pacific Peoples in New Zealand
6
List of tables and figures
Tables Table 1 Participation in Pacific medium education (immersion or bilingual services) ..... 18
Table 2 School leavers with NCEA level 1 .......................................................................................... 29
Table 3 School leavers who fulfilled the requirements to enter university ........................... 29
Table 4 Percentage of population aged 16 years and over enrolled in tertiary education .............................................................................................................................................. 51
Table 5 Modern Apprenticeship completion rates .......................................................................... 53
Table 6 Percentage of students studying for NCEA who achieved scholarship results . 554
Figures Figure 1 Pacific peoples with no qualifications .................................................................................... 9
Figure 2 Qualification levels of primary caregivers of children aged under five years ...... 14
Figure 3 Participation in early primary childhood education services of year 1 entrants . 15
Figure 4 Age-standardised rates per 1,000 students of stand-downs, suspensions, expulsions, and exclusions ............................................................................................................. 26
Figure 5 Students achieving NCEA literacy and numeracy requirements .............................. 32
Figure 6 Students who undertook NCEA study and achieved level 1 by end of year 11 .................................................................................................................................................. 37
Figure 7 Students who undertook NCEA study and achieved level 3 by end of year 13 .................................................................................................................................................. 38
Figure 8 Teacher trainee enrolees .......................................................................................................... 41
Figure 9 Teacher training graduates ...................................................................................................... 42
Figure 10 Students who achieved university entrance requirements through NCEA study at year 13 ............................................................................................................................................. 44
Figure 11 People with no qualifications ............................................................................................... 48
Figure 12 Students in modern apprenticeships ............................................................................... 52
Figure 13 Pacific peoples with a degree-level qualification ......................................................... 54
Education and Pacific Peoples in New Zealand
7
Foreword
Pacific Progress 2010 is a series of reports which examine the place of New Zealand’s Pacific peoples in a number of sectors. It is a collaborative project in which Statistics NZ has provided much of the data, analytical support, and resources for the Ministry of Pacific Island Affairs to lead the analysis and commentary. The objective is to inform understanding of how best to improve outcomes for Pacific peoples, a fast-growing population. The series takes a broader approach than the Annual Aggregate Report, which it replaces. Based on Census 2006 data, it will underpin the Ministry of Pacific Island Affairs’ future monitoring of the public sector’s contribution to Pacific peoples’ advancement. Publishing electronically gives the flexibility to refresh regularly. Pacific Progress 2010 will be updated following each Census. In intervening years the indicators in the Ministry of Social Development’s Social Report will enable us to track progress. While it is intended, in part, to enable the Ministry of Pacific Island Affairs to fulfil its monitoring role, we hope Pacific Progress 2010 will prove to be of wider value. We believe its analysis will make a positive contribution to the work of many agencies which already have in place programmes and policies to enhance outcomes for Pacific peoples. For those not already doing so, we hope it may serve as a prompt. Enhancing outcomes for New Zealand’s Pacific peoples is critical: a productive and prosperous New Zealand will be increasingly contingent on productive and prosperous Pacific New Zealanders.
Colin Tukuitonga Geoff Bascand Chief Executive Government Statistician Ministry of Pacific Island Affairs Statistics New Zealand
Education and Pacific Peoples in New Zealand
8
1 Introduction
Success in education is fundamental to the well-being of people, their families and communities, and New Zealand as a whole. At the national level, a more highly-educated workforce boosts productivity and economic well-being (Foley, 2005). At the community level, people’s physical, mental, and emotional well-being, as well as their income, are all better at higher education levels. In addition, children's longer-term educational outcomes are influenced more by their parents’ education and income levels than by their gender or ethnicity.
There are many factors involved in educational success. To achieve well in higher education, people need to do well at school. To do well at school, students need strong literacy and numeracy skills, as well as the ability to use these well. Children need to enter school with the skills, knowledge, and attitudes necessary for successful learning. Parents, families, communities, and teachers all have a critical role in ensuring children’s educational success.
The Pacific population living in New Zealand is young, particularly those born in New Zealand (Callister & Didham, 2008). By 2051, New Zealand’s student population will rise from the current one in ten Pacific learners, to one in five of the total school population (Ferguson et al., 2008). Those learners will represent a wide variety of Pacific nations and communities. The implications for education services are huge.
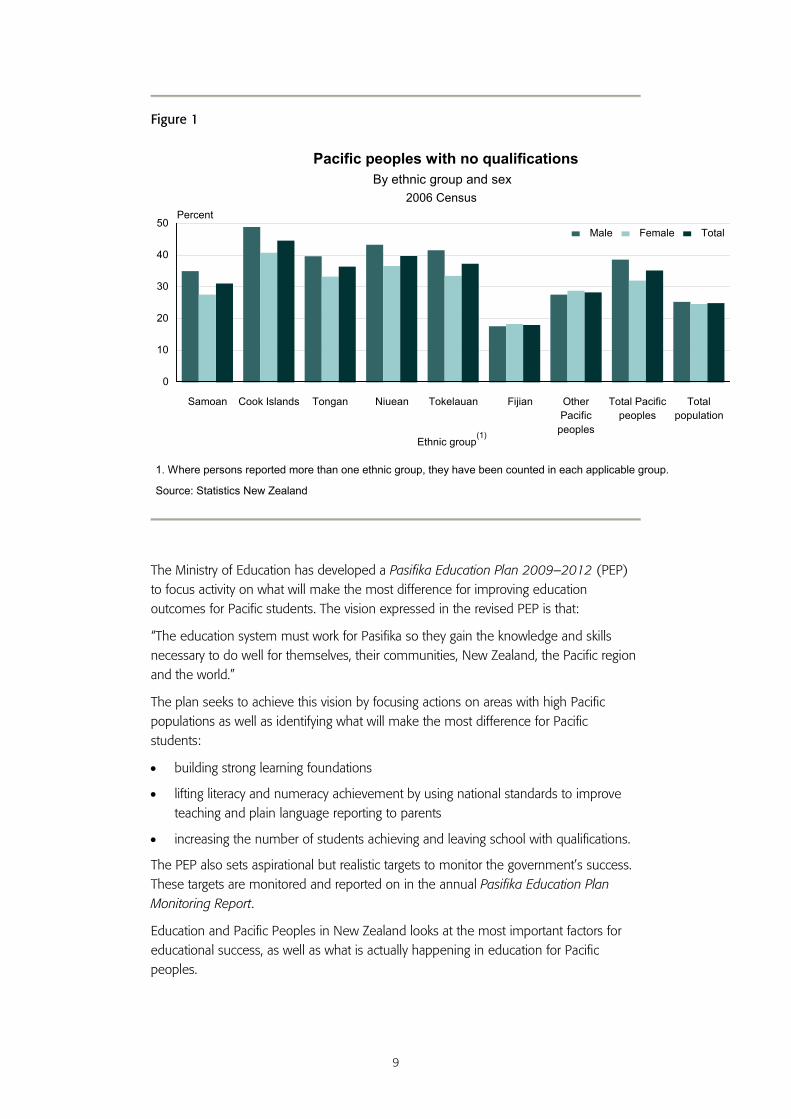
Despite some improvements in educational outcomes, Pacific communities still have the highest proportion of people with no qualifications. It is generally accepted that this puts them at a serious disadvantage. Figure 1 shows the percentage of Pacific peoples with no qualifications, using data from the 2006 Census. Interestingly, Pacific females in general are less likely to have ‘no qualification’ compared with Pacific males. Fijians were more likely to have qualifications than the total New Zealand population.
9
Figure 1
The Ministry of Education has developed a Pasifika Education Plan 2009–2012 (PEP) to focus activity on what will make the most difference for improving education outcomes for Pacific students. The vision expressed in the revised PEP is that:
“The education system must work for Pasifika so they gain the knowledge and skills necessary to do well for themselves, their communities, New Zealand, the Pacific region and the world.”
The plan seeks to achieve this vision by focusing actions on areas with high Pacific populations as well as identifying what will make the most difference for Pacific students:
• building strong learning foundations
• lifting literacy and numeracy achievement by using national standards to improve teaching and plain language reporting to parents
• increasing the number of students achieving and leaving school with qualifications.
The PEP also sets aspirational but realistic targets to monitor the government’s success. These targets are monitored and reported on in the annual Pasifika Education Plan Monitoring Report.
Education and Pacific Peoples in New Zealand looks at the most important factors for educational success, as well as what is actually happening in education for Pacific peoples.
Samoan Cook Islands Tongan Niuean Tokelauan Fijian Other Pacific
peoples
Total Pacificpeoples
Totalpopulation
0
10
20
30
40
50Percent
Ethnic group(1)
Male Female Total
Pacific peoples with no qualifications
2006 CensusBy ethnic group and sex
1. Where persons reported more than one ethnic group, they have been counted in each applicable group.
Source: Statistics New Zealand
Education and Pacific Peoples in New Zealand
10
2 Executive summary
Early childhood education Early learning experiences and relationships have a lasting effect on children’s achievement.
In general, the higher the education of the mother, the better the learning opportunities children may have at home. Pacific mothers have lower levels of qualification than most other groups, although this is improving.
Attending quality early childhood education (ECE) regularly from an early age has significant benefits for all children, and particularly for children from poorer communities. Children get into a pattern of learning progress when they can engage well with school activities and teachers from the start. Quality ECE provides opportunities to develop the foundations needed for success at school, including:
• attitudes such as such as perseverance, curiosity, critical thinking, questioning, and confidence
• strong oral skills in the children’s first language, which is then used as a basis for developing written literacy skills
• literacy and numeracy knowledge and skills.
Pacific children are much less likely than other groups to attend ECE before school. Key barriers include poor access to appropriate services and low demand from families.
Like all parents, Pacific parents think educational outcomes are the most important outcomes from participating in ECE, especially parents in poorer communities. Cultural appropriateness and cultural connections in ECE are also very important for Pacific families. In 2007, 55 percent of Pacific children in ECE either attended Pacific ECE services (where teaching is in a Pacific language and cultural context) or services with more than 25 percent Pacific children.
While many Pacific ECE services provide programmes that are culturally enriching, many do not adequately extend children’s thinking or support questioning. The Education Review Office (2007) states "In 14 services cultural entity was expressed through skilful modelling of language structures, extending children's vocabulary and the expectation that children would respond in the Pacific language."* However, around a quarter of services may be using formal literacy and numeracy exercises that are not appropriate for young children.
Many Pacific children start school without some of the prior learning needed for success in a school environment. This does not necessarily mean that they have had poor family or ECE learning experiences. What it can mean is that their experiences do not match school expectations. Having English as an additional language can make it more difficult for children if teachers or schools do not understand the different learning process this entails. Moving from ECE to school requires significant adjustments for children, particularly when a child’s early experiences are not the same as school expectations. Teachers have a key role in supporting the shift for Pacific children and their families. * Sentence revised by the Ministry of Pacific Island Affairs on 23 March 2012
11
However, teachers do not necessarily recognise opportunities to build on Pacific children’s previous learning or experiences. This lack of connection makes it harder for many Pacific children to engage effectively with learning at school right from the start.
Schooling The greatest influences on success at school are the relationship between children and their parents, and in schools, effective teaching and leadership. Partnerships focused on learning between parents and teachers can also greatly enhance children’s achievement. While Pacific parents want to help their children at school, they sometimes don’t know how. Similarly, many teachers and schools do not know how to engage effectively with Pacific parents.
Cultural factors can be significant barriers to Pacific families’ effective engagement with schools. These can include lack of English fluency and the ‘respect for authority’ that prevents parents questioning the school, or children questioning their teachers. If teachers do not understand these differences in beliefs, school expectations can be an early barrier to effective learning for many Pacific students, and to effective engagement with parents.
A 2006 Education Review Office report found that only 14 percent of schools were fully effective for Pacific students. Most schools need to be more culturally responsive and more focused on the achievement of Pacific students. Many Pacific students begin school with lower achievement, and this tends to increase over time. Low achievement in literacy and numeracy leads to many Pacific students leaving school with no qualifications, and a lower number enrolled in tertiary education.
Pacific student attendance is not a concern, with a continuing increase in student presence. However, this aspect of engagement with school is not reflected in achievement. Teachers may fail to understand that when Pacific students seem to be ‘on task’ in class, they are not necessarily learning. More is required from these teachers.
Students with a higher self-concept and belief in their ability have significantly higher achievement. However, Pacific students often have low confidence in their ability and attribute success or failure more to luck, peers or family than their own ability and effort.
At higher levels, secondary schools are not ensuring that Pacific students make subject choices that open up future opportunities. Of the students who study for the National Certificate of Educational Achievement (NCEA), Pacific students are least likely to gain the requirements to enter university. Pacific students are more likely than most to choose or be directed by teachers into NCEA courses that do not ultimately meet the requirements to enter university. This then prevents them from moving into higher education. Pacific students tend to move on to lower level tertiary education or straight into the labour market.
Tertiary education Strong literacy and numeracy skills are a prerequisite for participation in tertiary education, most employment, and wider society. However, in 2006, the overall literacy and numeracy of the adult Pacific population was lower than that of other ethnic groups. This not only reduces their education and work options, but also affects their families and children. The wider effects are not only from lower family income, but can also
12
contribute to intergenerational disadvantage in terms of education, health and employment outcomes.
Higher-level tertiary qualifications bring people the most benefits, including better income and employment opportunities. Of all groups, Pacific people have the smallest proportion with degrees or higher qualifications.
How well a student does at school is the strongest influence on their choice of tertiary education and their first-year pass rate in degree-level study. Poor school achievement means that fewer Pacific students than others go on to tertiary education, and when they do, they are much more likely to study for low-level certificates. This is also partly due to Pacific students tending to study NCEA subjects that do not open up higher learning opportunities. In addition, Pacific students do not tend to choose to enter trade-related pathways such as Modern Apprenticeships.
The benefits of tertiary education are higher for those who start earlier and gain higher-level qualifications before they are 25. Pacific people are about half as likely as the total population to achieve a higher-level qualification by the age of 25. They are only a third as likely to achieve a bachelor’s degree by this age.
Enrolments by under-25-year-olds at diploma level or above have risen more strongly for Pacific students than for all students, an increase of 7.4 percent between 2002 and 2007 compared with 3.2 percent for other students. However, 18 to 19-year-old Pacific students are less likely to complete a diploma or degree qualification than other students. Poor completion and progression levels mean that the increase in Pacific student participation may not actually lead to improved levels of education overall, especially at the higher levels.
Pacific students who do complete their qualifications are more likely than others to progress to further study, and generally earn a higher income than non-Pacific people with the same qualification. Pacific people who do not complete degrees on average earn a lower income than non-Pacific people who do not complete degrees.
Key factors that affect Pacific students’ learning outcomes in tertiary education include home factors such as competing family demands, and institutional factors, such as the place of Pacific knowledge and experience within courses.
Tertiary education organisations have a key role in their communities’ education and development aspirations. In 2006, only half of tertiary education organisations reported that they were developing relationships with Pacific communities. Most of these were focused on attracting more Pacific students and few on understanding and addressing the needs and aspirations of the community. There is significant room for improvement.
Education and Pacific Peoples in New Zealand
13
3 Early childhood education
It is not a question of whether children are learning, as what they are learning. Children learn from their experiences whatever they are. Roberts (2006).
Early childhood is a critical time to build the foundations for future success. Effective parenting and quality ECE have positive effects that last to age 16 and beyond.
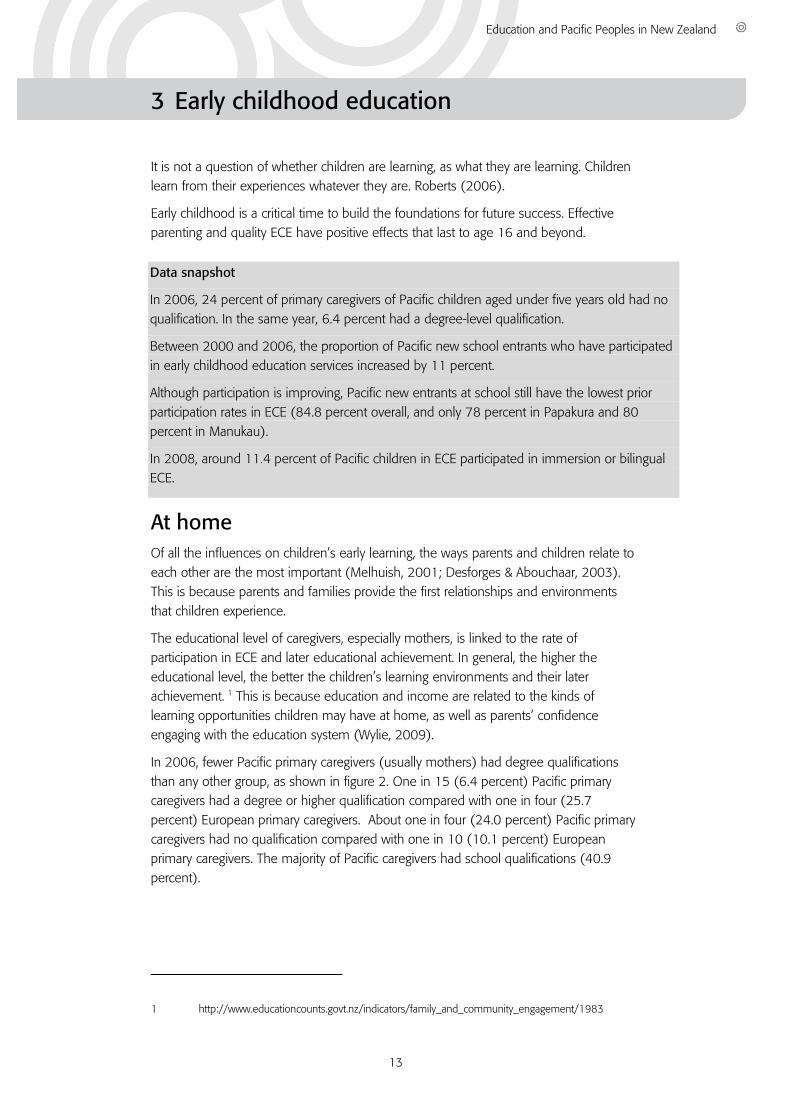
At home Of all the influences on children’s early learning, the ways parents and children relate to each other are the most important (Melhuish, 2001; Desforges & Abouchaar, 2003). This is because parents and families provide the first relationships and environments that children experience.
The educational level of caregivers, especially mothers, is linked to the rate of participation in ECE and later educational achievement. In general, the higher the educational level, the better the children’s learning environments and their later achievement. 1 This is because education and income are related to the kinds of learning opportunities children may have at home, as well as parents’ confidence engaging with the education system (Wylie, 2009).
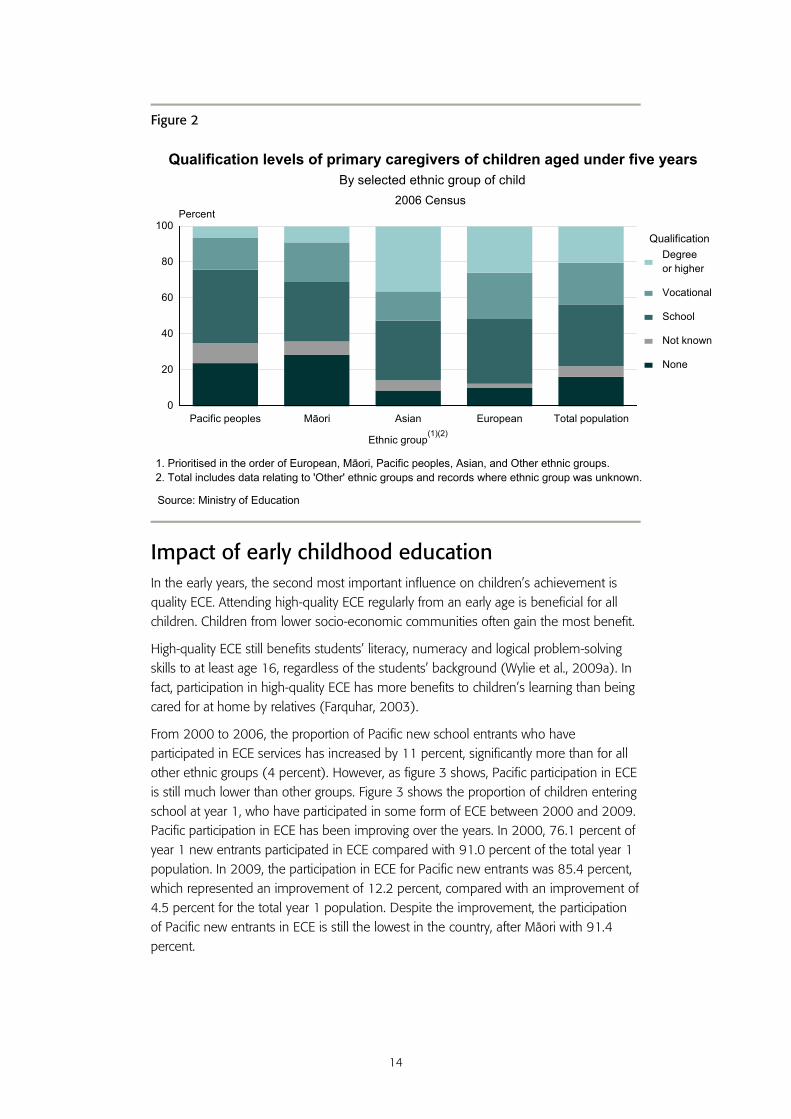
In 2006, fewer Pacific primary caregivers (usually mothers) had degree qualifications than any other group, as shown in figure 2. One in 15 (6.4 percent) Pacific primary caregivers had a degree or higher qualification compared with one in four (25.7 percent) European primary caregivers. About one in four (24.0 percent) Pacific primary caregivers had no qualification compared with one in 10 (10.1 percent) European primary caregivers. The majority of Pacific caregivers had school qualifications (40.9 percent).
1 http://www.educationcounts.govt.nz/indicators/family_and_community_engagement/1983
Data snapshot
In 2006, 24 percent of primary caregivers of Pacific children aged under five years old had no qualification. In the same year, 6.4 percent had a degree-level qualification.
Between 2000 and 2006, the proportion of Pacific new school entrants who have participated in early childhood education services increased by 11 percent.
Although participation is improving, Pacific new entrants at school still have the lowest prior participation rates in ECE (84.8 percent overall, and only 78 percent in Papakura and 80 percent in Manukau).
In 2008, around 11.4 percent of Pacific children in ECE participated in immersion or bilingual ECE.
14
Figure 2
Impact of early childhood education In the early years, the second most important influence on children’s achievement is quality ECE. Attending high-quality ECE regularly from an early age is beneficial for all children. Children from lower socio-economic communities often gain the most benefit.
High-quality ECE still benefits students’ literacy, numeracy and logical problem-solving skills to at least age 16, regardless of the students’ background (Wylie et al., 2009a). In fact, participation in high-quality ECE has more benefits to children’s learning than being cared for at home by relatives (Farquhar, 2003).
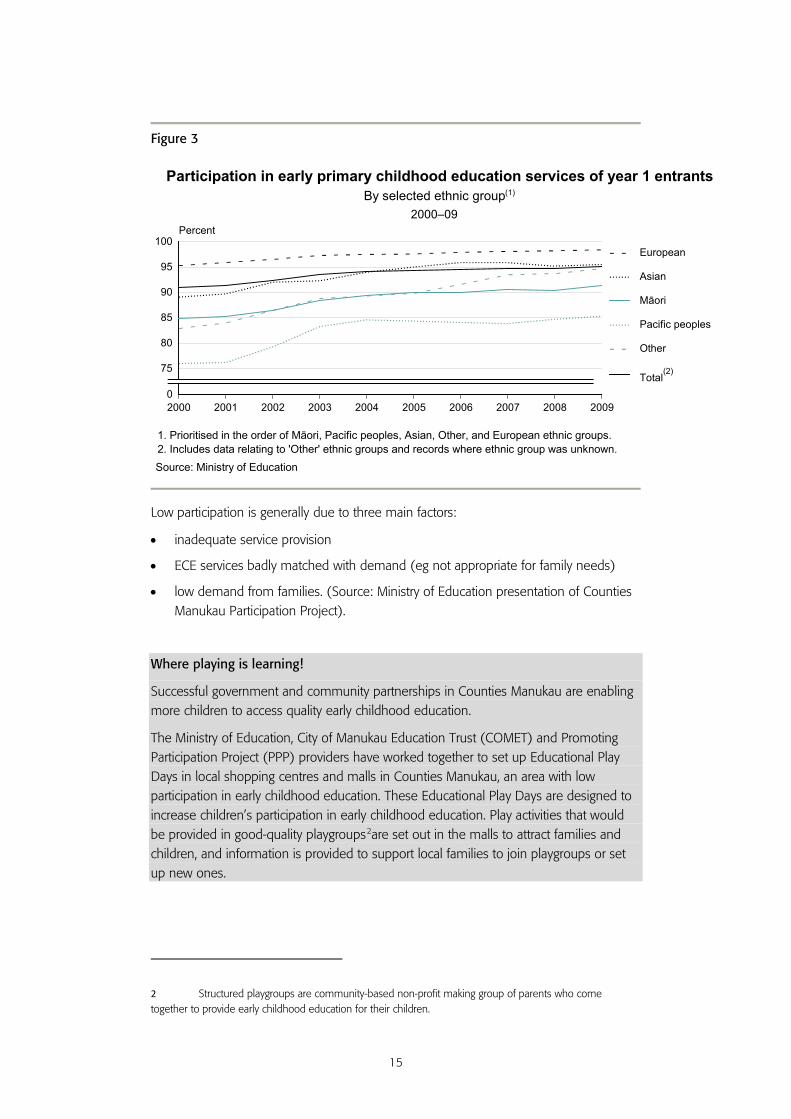
From 2000 to 2006, the proportion of Pacific new school entrants who have participated in ECE services has increased by 11 percent, significantly more than for all other ethnic groups (4 percent). However, as figure 3 shows, Pacific participation in ECE is still much lower than other groups. Figure 3 shows the proportion of children entering school at year 1, who have participated in some form of ECE between 2000 and 2009. Pacific participation in ECE has been improving over the years. In 2000, 76.1 percent of year 1 new entrants participated in ECE compared with 91.0 percent of the total year 1 population. In 2009, the participation in ECE for Pacific new entrants was 85.4 percent, which represented an improvement of 12.2 percent, compared with an improvement of 4.5 percent for the total year 1 population. Despite the improvement, the participation of Pacific new entrants in ECE is still the lowest in the country, after Mäori with 91.4 percent.
Pacific peoples Mäori Asian European Total population0
20
40
60
80
100Percent
Ethnic group(1)(2)
None
Not known
School
Vocational
Degreeor higher
Qualification
Qualification levels of primary caregivers of children aged under five years
2006 Census
By selected ethnic group of child
Source: Ministry of Education
1. Prioritised in the order of European, Mäori, Pacific peoples, Asian, and Other ethnic groups.2. Total includes data relating to 'Other' ethnic groups and records where ethnic group was unknown.
15
Figure 3
Low participation is generally due to three main factors:
• inadequate service provision
• ECE services badly matched with demand (eg not appropriate for family needs)
• low demand from families. (Source: Ministry of Education presentation of Counties Manukau Participation Project).
Where playing is learning!
Successful government and community partnerships in Counties Manukau are enabling more children to access quality early childhood education.
The Ministry of Education, City of Manukau Education Trust (COMET) and Promoting Participation Project (PPP) providers have worked together to set up Educational Play Days in local shopping centres and malls in Counties Manukau, an area with low participation in early childhood education. These Educational Play Days are designed to increase children’s participation in early childhood education. Play activities that would be provided in good-quality playgroups2are set out in the malls to attract families and children, and information is provided to support local families to join playgroups or set up new ones.
2 Structured playgroups are community-based non-profit making group of parents who come together to provide early childhood education for their children.
2000 2001 2002 2003 2004 2005 2006 2007 2008 20090
75
80
85
90
95
100Percent
European
Asian
Mäori
Pacific peoples
Other
Total(2)
Participation in early primary childhood education services of year 1 entrantsBy selected ethnic group
2000–09
Source: Ministry of Education
1. Prioritised in the order of Mäori, Pacific peoples, Asian, Other, and European ethnic groups.2. Includes data relating to 'Other' ethnic groups and records where ethnic group was unknown.
(1)
16
Educational Play Days have been held in Southmall Manurewa, Mangere Town Centre, Otara Shopping Centre, Papatoetoe Hunters Plaza, Papakura Shopping Centre, and Clendon Mall.
Educational Play Days have helped to identify 146 children who are not currently participating in early childhood education. The next step is to engage these children in playgroups or early childhood services and to work with interested families, communities, and parents to establish new playgroups.
Activities like Educational Play Days support community collaboration in early childhood education and will increase Pacific children’s opportunities to develop a strong learning foundation for their future.
With the help of initiatives such as the Promoting Participation Project, the Ministry of Education has forecast considerable improvement to Pacific participation in ECE, to 88.5 percent by 2010.
What Pacific parents want of ECE In a survey of parents’ views about ECE, all parents thought educational outcomes were the most important from ECE, especially parents in poorer communities (Robertson et al., 2007). Cultural appropriateness and cultural connections in ECE are also very important for Pacific families (Robertson). Parents frequently choose a Pacific service because they are connected with the community that established the service through, for example, church, family, or language (Robertson). There has also been a high take-up of the 20 hours ECE policy for three- and four-year-olds by Pacific services, which makes them more affordable for parents. In addition, Pacific families who have not participated in ECE tend to participate when the ECE is connected with their culture (Dixon et al., 2007).
While culturally connected education does not necessarily mean that the teachers must be Pacific peoples, this can help. In July 2008, the second intake of students into the Diploma of Teaching (Early Childhood Education) Pasifika Specialisation programme graduated from Auckland University of Technology. The same year also produced the second round of graduates with the same qualification from Te Tari Puna o Aotearoa, the New Zealand Childcare Association. This included 27 Pacific graduates in total.3 These current and prospective graduates are expected to increase the number of Pacific registered and qualified teachers in Pacific ECE services.
In 2008 there were 115 Pacific ECE services. Most Pacific ECE services are managed and run by Pacific communities.4 Each service educates children in at least one Pacific language and culture. The first Pacific language ECE centre opened in Auckland in 1985. Since then, many new Pacific services have been licensed.
The growth of A’oga Amata, bilingual ECE Pacific services, in the 1990s shows the commitment of Pacific communities and their churches to support early learning and children’s own languages and cultures:
3 Draft Pasifika Education Plan Monitoring Report, Ministry of Education.
4 These include, but are not limited to Pacific Early Childhood Centres (PECCs).
17
I strongly argue that without the church, many Pacific Island people, especially Samoans .... would have no access to early childhood education done in their own language and culture (Ete, 1993 cited in Coxon et al., 2002).
In 2009, Pacific languages were used in ECE teaching for at least 12 percent of the time in 113 licensed and/or chartered services. Well over half (70) of these services are located in the Auckland region. Of the 113 Pacific ECE services in 2009:
• Fifty-two were immersion (81–100 percent of teaching contact time) involving 1709 children. Thirty-two immersion services used Samoan as the language of communication, 16 Tongan, two Cook Island Mäori, two Niuean.
• The remaining 65 services were bilingual (12–80 percent of teaching contact time) involving 2008 children. Thirty-eight bilingual services used Samoan as the language of communication, 13 Cook Island Mäori, six Tongan, two Niuean, four Tokelauan, one Tuvaluan and one Fijian.
• There were 108 education and care services (crèche).
For more information, see: http://www.educationcounts.govt.nz/statistics/ece/55413/66553.
Of the 18,397 total teachers in licensed teacher-led early childhood services at 1 July 2009, 72.3 percent were Päkehä, 8.4 percent were Pacific, 8.4 percent were Mäori, 8.5 percent were Asian, and 2.4 percent were of other ethnicity.5 There was a total of 1,539 Pacific teachers, of which 60.3 percent were qualified, compared with 64.0 percent of all teachers. This was a huge improvement for Pacific teachers, from 35.4 percent back in 2001.
The Ministry of Education supports the establishment of Pacific ECE services and provides targeted assistance for their ongoing development. In 2007/08 the Ministry of Education allocated planning and capital grants to community-based groups for eight Pacific services to support new buildings or upgrades and extensions of existing ECE services. This funded 235 new places for children.
In 2009, 11,060 Pacific children enrolled in licensed early childhood services. This represented a 10.7 percent increase in enrolment from 2007 figures, compared with a 5.7 percent increase in enrolment in the total population over the same period. There were 3,717 children enrolled in Pacific immersion or bilingual ECE services in 2009. This represents approximately 11.4 percent of Pacific children.
For more information, see: http://www.educationcounts.govt.nz/statistics/ece/55413/55414
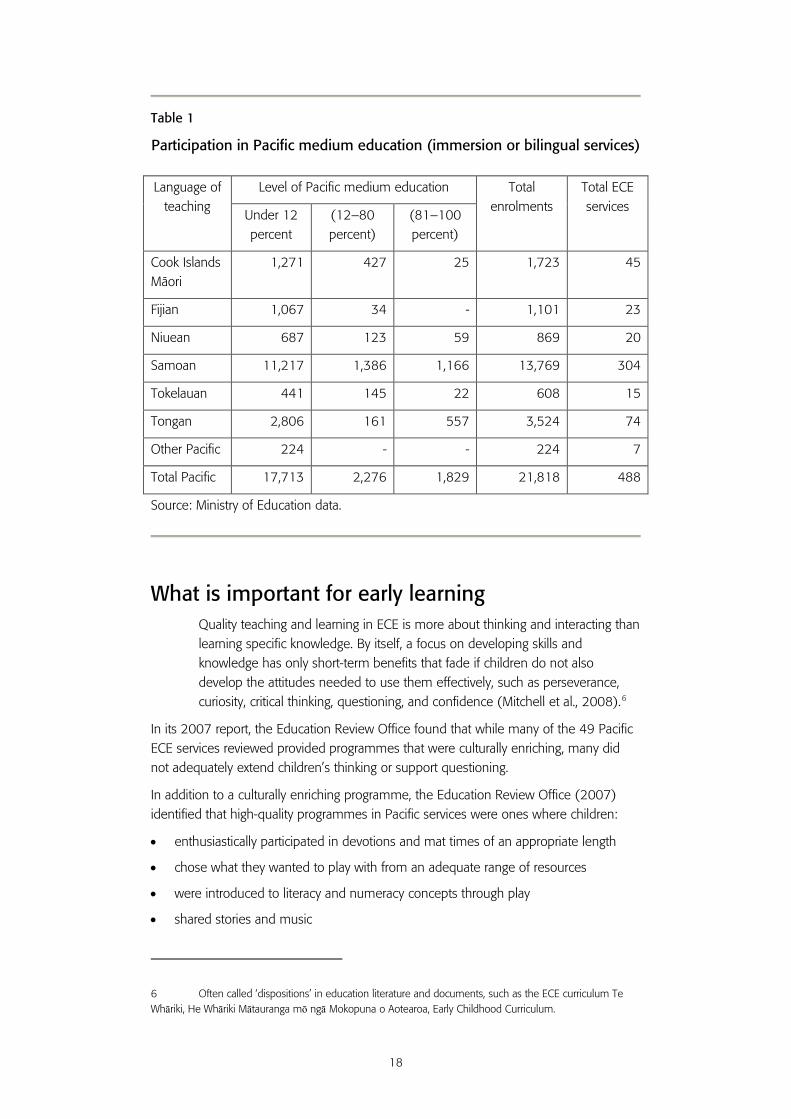
Table 1 shows the numbers of Pacific children in the different types of immersion or bilingual services.
5 http://www.educationcounts.govt.nz/statistics/ece/55413/55104
18
Table 1
Participation in Pacific medium education (immersion or bilingual services)
Language of teaching
Level of Pacific medium education Total enrolments
Total ECE services Under 12
percent (12–80 percent)
(81–100 percent)
Cook Islands Mäori
1,271 427 25 1,723 45
Fijian 1,067 34 - 1,101 23
Niuean 687 123 59 869 20
Samoan 11,217 1,386 1,166 13,769 304
Tokelauan 441 145 22 608 15
Tongan 2,806 161 557 3,524 74
Other Pacific 224 - - 224 7
Total Pacific 17,713 2,276 1,829 21,818 488
Source: Ministry of Education data.
What is important for early learning Quality teaching and learning in ECE is more about thinking and interacting than learning specific knowledge. By itself, a focus on developing skills and knowledge has only short-term benefits that fade if children do not also develop the attitudes needed to use them effectively, such as perseverance, curiosity, critical thinking, questioning, and confidence (Mitchell et al., 2008).6
In its 2007 report, the Education Review Office found that while many of the 49 Pacific ECE services reviewed provided programmes that were culturally enriching, many did not adequately extend children’s thinking or support questioning.
In addition to a culturally enriching programme, the Education Review Office (2007) identified that high-quality programmes in Pacific services were ones where children:
• enthusiastically participated in devotions and mat times of an appropriate length
• chose what they wanted to play with from an adequate range of resources
• were introduced to literacy and numeracy concepts through play
• shared stories and music
6 Often called ‘dispositions’ in education literature and documents, such as the ECE curriculum Te Whāriki, He Whāriki Mātauranga mō ngā Mokopuna o Aotearoa, Early Childhood Curriculum.
19
• gained skills in self-care and independence, and older children helped guide and teach the younger ones.
In the sample of Pacific ECE services, the relationships between adults and children were warm, caring and respectful. Less effective practices included adults strictly controlling what children could play with and when (ERO, 2007). While the Education Review Office (2007) identified many areas of improvement between 2004 and 2007, in most cases the teaching and learning practices and environments in Pacific services did not adequately support sustained, complex play and learning, or the critical and creative thinking that are essential for success at school.
Teaching qualifications are an important indicator of the likely quality of teaching and learning interactions. Half the Pacific services had more than 50 percent unqualified teachers in June 2007, which is considerably greater than the figure of 33.8 percent for non-Pacific services. Some of these services risk closure if they do not increase this proportion (Ministry of Education data). However, between 2002 and 2007, the proportion of qualified staff in Pacific services increased from 31.4 percent to 52.9 percent. In Pacific services, 68.4 percent of staff are now either qualified or in training. The increase in qualified staff for Pacific services is greater than for other services over the last two years.
What is important for success in the education system The transition to school, and the first years there, have a significant influence on children’s achievement well into secondary school. This is particularly so for learners from poorer backgrounds (Bishop et al., 2003; Learning Media, 2006; Rubie-Davies et al., 2006; Tunmer et al., 2003; Wylie & Hipkins, 2006).
The time from four-and-a-half to six years of age is critical for getting children underway in their school learning (Phillips et al., 2002). For success at school, children need strong oral language in their first language as a basis for developing thinking and literacy skills (Ministry of Education, 2003b). The Education Review Office (2007) states "In 14 services cultural entity was expressed through skilful modelling of language structures, extending children's vocabulary and the expectation that children would respond in the Pacific language."* In 10 of the 49 services, adults did not use the Pacific language often or well enough for children to develop fluency.
On starting school, children also benefit from knowledge:
• of how written language works
• that the spoken language is made up of sounds and words
• of the alphabet (spoken and written)
• that the alphabet relates to the sounds of spoken language
• of the visual features of print. (Ministry of Education, 2003b).
* Sentence revised by the Ministry of Pacific Island Affairs on 23 March 2012
20
The Education Review Office (2007) found that in 11 of the 49 Pacific ECE services it reviewed, teachers used play and group times appropriately to introduce literacy and numeracy. However, in nine services, teachers used formal worksheets and copy exercises that were not appropriate for young children and did not support a longer-term interest in literacy and numeracy.
The transition from ECE to school requires significant adjustments for children and their families, particularly when a child’s experiences are not the same as school expectations. Teachers have a critical role in supporting this transition by linking the new school expectations with children’s prior experiences (Peters, 2004; Turoa et al., 2002). The Education Review Office (2009) found that over 20 percent of primary schools in its study did not know about the ECE experiences of their children, and several studies have shown that many new entrant teachers do not build on children’s prior experiences (eg, Davies, 2009).
What would make the most difference? • Improved interactions between children and adults that build on learning and
extend thinking in the home and ECE.
• Increased understanding by parents and ECE teachers of how to support strong oral language in the first language with knowledge of many words, how language works, and different ways of expressing ideas.
• Longer-term participation in quality ECE.
• Increasing the quality of ECE services in communities with a large number of Pacific children.
• Relationships between ECE, communities and parents focused on how to help children learn.
• ECE teachers understanding, valuing and building on the experiences and knowledge of children and their families.
Education and Pacific Peoples in New Zealand
21
4 Schooling
Parents and teachers working together is like a bird needing two strong wings to fly. (Pacific parent in Education Review Office 2008b).
Pacific parents want their children to have a good education and have high expectations for them (Education Review Office 2008b, Ferguson et al., 2008). The challenge, then, is to explore why schools are failing to deliver successful educational outcomes for this group of students. There is no simple answer to this.
Parent involvement Pacific parents often see themselves as their children’s first teachers, providing their child with a strong foundation that includes their first language, religion, and values (Education Review Office 2008b; Coxon et al., 2002).
Families support children’s success when they encourage positive relationships and provide a range of quality experiences and activities within and beyond the home (Biddulph et al., 2003). Parents who have difficulties with literacy are more likely to be able to support their children’s achievement when they have the opportunity to increase their own skills.7
As with ECE, the qualification of the primary caregiver (usually the mother) is an important factor in school success. An increasing proportion of primary caregivers of
7 http://www.educationcounts.govt.nz/indicators/indicator_page/all_indicators/1987
Data snapshot
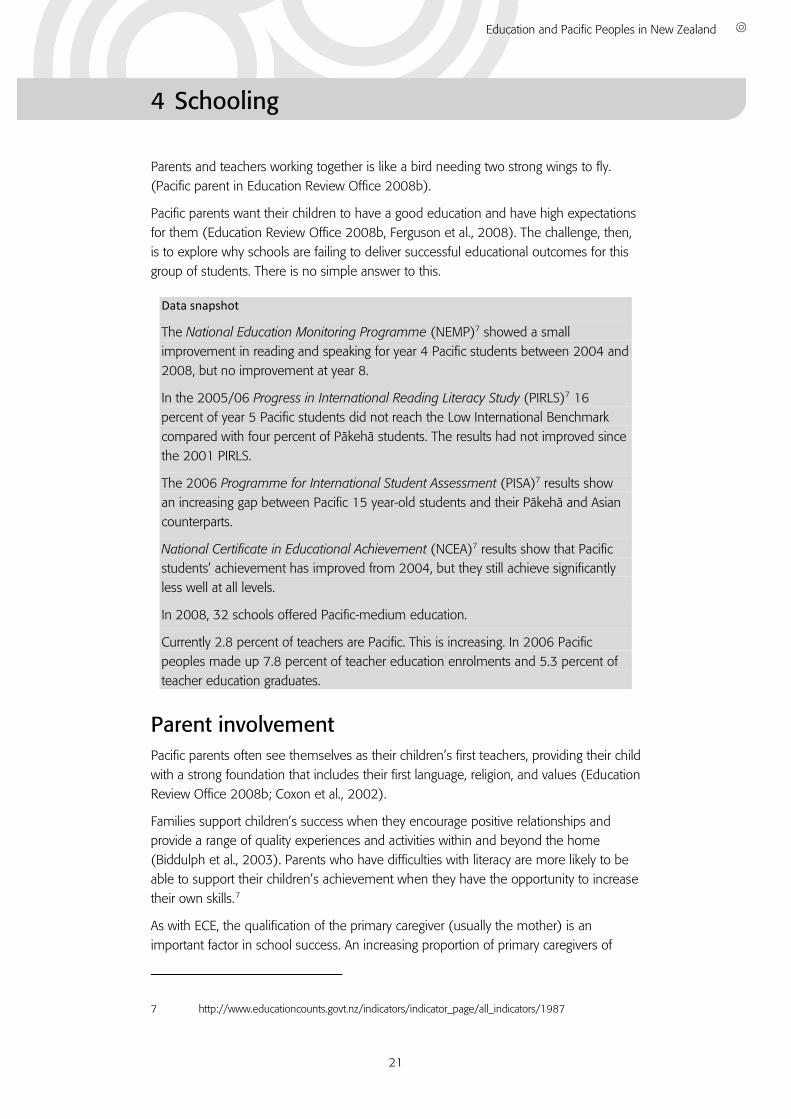
The National Education Monitoring Programme (NEMP)7 showed a small improvement in reading and speaking for year 4 Pacific students between 2004 and 2008, but no improvement at year 8.
In the 2005/06 Progress in International Reading Literacy Study (PIRLS)7 16 percent of year 5 Pacific students did not reach the Low International Benchmark compared with four percent of Päkehä students. The results had not improved since the 2001 PIRLS.
The 2006 Programme for International Student Assessment (PISA)7 results show an increasing gap between Pacific 15 year-old students and their Päkehä and Asian counterparts.
National Certificate in Educational Achievement (NCEA)7 results show that Pacific students’ achievement has improved from 2004, but they still achieve significantly less well at all levels.
In 2008, 32 schools offered Pacific-medium education.
Currently 2.8 percent of teachers are Pacific. This is increasing. In 2006 Pacific peoples made up 7.8 percent of teacher education enrolments and 5.3 percent of teacher education graduates.
22
school-aged children have at least a degree-level qualification, with Pacific primary caregivers showing the greatest increase since 2001 from 2.8 percent in 2001 to 5.3 percent in 2006. In 2006, 18 percent of Päkehä primary caregivers, 7.5 percent of Mäori caregivers and 30 percent of Asian caregivers had degrees.8
While Pacific parents want to help their children and their schools, they sometimes don’t know how to (McDowall et al., 2005; Madjar et al., 2009). Similarly, many teachers and schools do not know how to engage effectively with Pacific parents (ERO, 2008 a & b).
Pacific parents want to know how well their children are doing at school and what they can do to help their child.
My youngest daughter brought home a report that included a sample of how she did her maths. I really appreciated the sample because I saw how her maths is done differently and I can see where I can help her at home. Cook Islands parent
In the recent consultation on the National Standards in literacy and mathematics, Pacific parents were the group most interested in having timely information about their children’s progress, and ideas or resources they could use at home. Pacific parents were also the most likely to say that it was very important to help their child learn, and that they were very involved in helping their child learn (Wylie et al., 2009b).
Effective partnerships between parents and schools can improve the well-being, behaviour and achievement of children right into adulthood (Biddulph et al., 2003). Many schools are now introducing such partnerships (ERO, 2009). Joint interventions involving parents and teachers together have the biggest impact on outcomes.9 The best homework practices also have a large effect, but the least effective homework practices, that is, parent ‘surveillance’ and checking, actually have negative effects (Robinson et al., 2009).10 For example, at St Josephs School in Otahuhu, students made huge gains in reading through the Reading Together programme which included parents and teachers as partners in children’s learning.11 A key shift for the parents was sharing, talking and reading together rather than ‘correcting’ the child (Tuck et al., 200x12).
Many schools only make contact with Pacific parents when something bad has happened (Education Review Office, 2008b). In addition, information given to parents about their children’s achievement at school can make it hard to tell if there is a problem or not. For example, Pacific people consulted about the New Zealand Qualification Authority’s (NZQA) Pacific Strategy considered that the information given to parents and communities about achievement in NCEA is poor. They also thought the analysis of achievement data needed to be simplified so that Pacific communities can understand it in order to address low achievement (NZQA, 2008).
8 http://www.educationcounts.govt.nz/indicators/indicator_page/all_indicators/1987
9 A huge effect size of 1.81.
10 http://www.educationcounts.govt.nz/publications/series/2515/60169/60170
11 St Joseph’s School Otahuhu is a state integrated Catholic primary school, with a roll of 314, classified for funding purposes as decile one, and nearly 90 percent of the children identify themselves as either Samoan, Tongan, Cook Islands, Tokelauan or Niuean.
12 No date given.
23
Parent involvement in schools that is focused on learning activities improves children’s achievement more than other types of involvement. Some key barriers for Pacific families engaging with schools include:
• lack of English fluency
• respect for authority that prevents parents questioning the school
• lack of Pacific parent involvement in school administration and governance. (Coxon et al., 2002)
The case study below provides one example of effective school and community collaboration.
Excellent Kelston Schools
Collaboration can be the key to improved education opportunities for Pacific students. In Kelston, West Auckland, a group of primary, intermediate, and secondary schools have joined together to raise student achievement, with a particular focus on Pacific students.
The Excellent Kelston Schools cluster includes Fruitvale School, Kelston Primary, Kelston Intermediate, Kelston Boys High School, Kelston Girls College, Kelston Deaf Education Centre, and St. Leonards Road School.
Within the Excellent Kelston Schools cluster there are more than 1,620 Pacific students. Together with the Ministry of Education’s Northern Region Pasifika team, the cluster has created opportunities to improve teaching and leadership practices, community engagement and strategies to raise Pacific student achievement.
Led by the cluster’s seven principals, Excellent Kelston Schools aims to support better teaching and smooth transitions for learners between schools through effective information sharing and communication. Excellent Kelston Schools coordinates and plans shared events within the cluster and the wider community, and collaborates to make property and resources available across the cluster.
The Excellent Kelston Schools cluster has successfully laid the foundation for effective school and community partnerships that will increase learning opportunities for all students in Kelston and looks forward to reporting further on progress in 2010.13
Active participation by Pacific parents, families and communities in other school activities will help to ensure that those schools are appropriate and effective for Pacific students (ERO, 2008a). Ideally, governance of schools should match the communities they serve and the number of Pacific school trustees is increasing. Schools that have a relatively high number and proportion of Pacific students have higher Pacific representation. In December 2008, 19.7 percent of the boards of trustees members in schools were of Pacific ethnicity. This represents a 16 percent increase from the proportion of Pacific school trustees in 1998 (17.0 percent), but a slight reduction from 2004 (19.9
13 For further information, please contact the EKS chair – Principal Linda Fox (Kelston Girls College): [email protected] or (09) 827- 6063.
24
percent). In 2008, 56.7 percent of Pacific trustees were female compared with 52.6 of non-Pacific trustees.14
Cultural differences One part of the explanation for the failure of the education system to perform well for Pacific students relates to cultural differences. All children find that the culture of home is not the same as the culture of school, but for some children this difference is large and can make it difficult for them to understand what is expected and how to respond at school (eg, Meade et al., 2003).
The cultural expectations of many Pacific parents may differ significantly from the practices and thinking in most New Zealand schools. For example, the traditional Pacific expectation of unquestioning obedience and respect for authority figures can mean that parents encourage their children to ‘sit and listen to the teacher’ (Ferguson, 2008; Coxon, 2002). However, the expectation in New Zealand education is that students learn best through questioning, discussing different viewpoints, and increasing their independence. If teachers do not understand these differences in beliefs, school expectations can be an early barrier to learning for many Pacific students (eg, Tiatia cited in Ferguson, 2008; Cahill cited in Coxon, 2002).
Many Pacific learners enjoy school as a place where they can mix freely with their peers and have fun (Ferguson et al., 2008). However, almost a third of 16-year-old Pacific students in one study said they had been hassled about their culture in the previous year, compared with just 13 percent of European and Asian students (Wylie et al., 2009a). Students can learn quickly to hide ‘cultural’ behaviours in the classroom, including use of their own language (Franken et al., 2005).
Identity is a critical issue for Pacific learners:
Identity can mean the difference to continued academic failure and educational success based on the realities of future Pacific Islands generations. (Pasikale cited in Coxon et al., 2002).
One writer suggests that few opportunities are given to Pacific students to create their own identities. Instead they either tend to conform to or rebel against the identities that have been constructed for them. Some suggest that this may lead Pacific learners to either sit passively in classrooms or rebel strongly (Ferguson et al., 2008).
Schools, teachers, and other students need to support Pacific learners to ‘be themselves’ and to ‘see themselves and their culture reflected’ in the classroom (Ferguson et al., 2008). For example, the new school curriculum provides significant scope for teachers to use local content and contexts in their teaching.
14 http://www.educationcounts.govt.nz/indicators/indicator_page/schooling/2019
25
What is necessary for successful learning? Attendance and engagement In general, good engagement in school is necessary for good achievement (Wylie, 2009; ERO, 2008a). Although Pacific students generally report good engagement with school, this is not reflected in their achievement. 15
In its pilot evaluation of a sample of Auckland schools, the Education Review Office (2009) identifies a need for teachers to understand that students being ‘on task’ in the classroom does not necessarily mean that they are actually engaged effectively in learning.
Student attendance during year 11 is one of the most significant factors influencing student achievement in senior secondary school (Ferguson et al., 2003). Pacific students have better retention in year 11 than non-Pacific students, with only 5.4 percent of students leaving between years 9 and 11 compared with 6.9 percent of non-Pacific students.
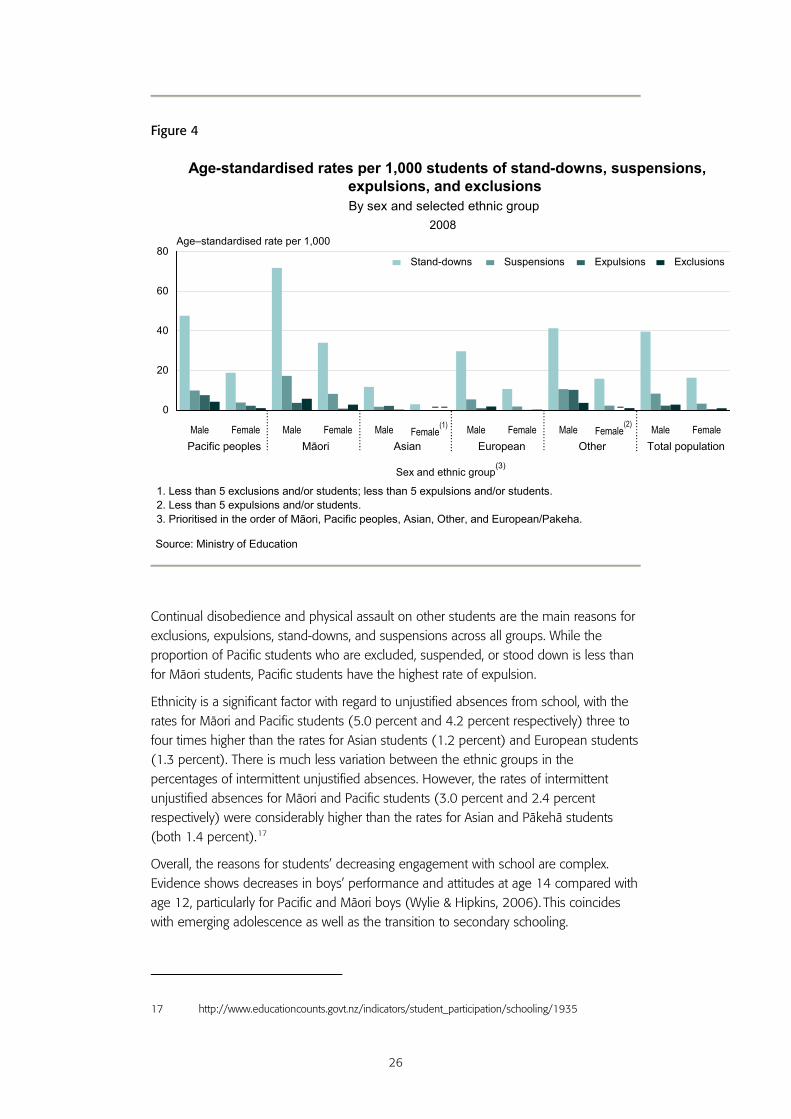
Some Pacific students become disengaged with schooling quite early. In many cases, this is strongly linked to poor achievement. Figure 4 shows the age-standardised rates per 1,000 of Pacific student expulsions, exclusions, suspensions, and stand-downs16 in 2008. Stand-downs had the highest rate, where Pacific students had a total rate of 33.7 per 1,000 which was second overall to Mäori at 53.6, but higher than the total population of 28.5. Females overall had lower rates for all four indicators.
15 For example, NEMP http://nemp.otago.ac.nz/science/2007/index.htm, or Ministry of Education, 2004.
16 Stand-down: A student cannot attend school for up to five school days in any term, or 10 days in a school year. Students return automatically to school following a stand-down.
Suspension: A student cannot attend school until the school board of trustees decides on the consequence for the student. The board may decide to lift the suspension with or without conditions, to extend the suspension, or in the most serious cases, to either exclude or expel the student.
Exclusion: If the student is aged under 16, the board can exclude him or her from the school, with the requirement that the student enrols elsewhere.
Expulsion: If the student is aged 16 or over, the board may decide to expel him or her from the school, and the student may enrol at another school.
26
Figure 4
Continual disobedience and physical assault on other students are the main reasons for exclusions, expulsions, stand-downs, and suspensions across all groups. While the proportion of Pacific students who are excluded, suspended, or stood down is less than for Mäori students, Pacific students have the highest rate of expulsion.
Ethnicity is a significant factor with regard to unjustified absences from school, with the rates for Mäori and Pacific students (5.0 percent and 4.2 percent respectively) three to four times higher than the rates for Asian students (1.2 percent) and European students (1.3 percent). There is much less variation between the ethnic groups in the percentages of intermittent unjustified absences. However, the rates of intermittent unjustified absences for Mäori and Pacific students (3.0 percent and 2.4 percent respectively) were considerably higher than the rates for Asian and Päkehä students (both 1.4 percent).17
Overall, the reasons for students’ decreasing engagement with school are complex. Evidence shows decreases in boys’ performance and attitudes at age 14 compared with age 12, particularly for Pacific and Mäori boys (Wylie & Hipkins, 2006). This coincides with emerging adolescence as well as the transition to secondary schooling.
17 http://www.educationcounts.govt.nz/indicators/student_participation/schooling/1935
Male Female Male Female Male Female(1) Male Female Male Female
(2) Male Female
0
20
40
60
80Age–standardised rate per 1,000
Sex and ethnic group(3)
Stand-downs Suspensions Expulsions Exclusions
Age-standardised rates per 1,000 students of stand-downs, suspensions,expulsions, and exclusions
2008By sex and selected ethnic group
1. Less than 5 exclusions and/or students; less than 5 expulsions and/or students.2. Less than 5 expulsions and/or students.3. Prioritised in the order of Mäori, Pacific peoples, Asian, Other, and European/Pakeha.
Pacific peoples Mäori Asian OtherEuropean Total population
– – –
Source: Ministry of Education
27
Pacific students can find changing teachers and getting to know teachers’ names the most difficult thing to get used to during their transition to secondary school. The Competent Children research showed that nearly twice as many Pacific and Mäori students as European and Asian students in their study found this difficult (Wylie et al., 2006). Likewise, around twice as many Pacific and Mäori learners as European and Asian learners had difficulties accommodating the new mix of students in the transition to secondary school (Wylie et al).
Schools with high Pacific suspension rates have been working with the Ministry of Education on the Student Engagement Initiative (SEI)18 since July 2006 to reduce their rates. This approach has been very successful. The suspension rate19 for Pacific students in these schools was reduced by 29 percent between 2006 and 2007. This contributed to a 17 percent decrease for all Pacific students nationwide. The strategy also led to a 16 percent reduction in the stand-down rate for all Pacific students from 2006 to 2007, and a reduction in exclusions of 29 percent from 2006 to 2008.20 The evidence suggests that this approach has so far been very successful, with the suspension rate for Pacific students in SEI Schools having declined by 45 percent from 2006 to 2008, compared to a 25 percent decrease for Pacific students in other schools. The Education Review Office’s pilot evaluation found that transience is an issue for Pacific students in some schools, with attendance dropping during term four and some students returning to their home island over winter (ERO, 2009).
Lack of learning continuity can have negative effects on achievement. In a 2006 study, over half (56 percent) of early school leavers said they had fallen behind in their school work because of truancy, sickness, or moving around (both houses and schools) and found it hard to catch up (Ministry of Education 2006). Poverty increases the likelihood of housing transience.21
Staying at school is important for overall success, with a strong positive effect on later income (5 to10 percent).22 Generally, the longer a student stays at secondary school the more likely they are to transition into tertiary education once they leave school (Ussher, 2008). In addition, one of the important success factors for boys is simply staying at school until the end of the seventh form. This is because it takes boys longer than girls to achieve a high level of maturity and self-management (Lashlie, 2005).
Drawing on its pilot evaluation of a sample of Auckland schools, the Education Review Office (2009) concluded that overall, Pacific student attendance is not a concern, with a continuing increase in student presence. In 2007, an estimated 81.1 percent of Pacific students stayed at school until their 17th birthday. This is much higher than Europeans at 76.6 percent and 57.5 percent of Mäori students.
18 Student Engagement Initiative (SEI), a programme designed to reduce truancy and early leaving exemptions, as well as suspensions.
19 Data about suspensions and exclusions is ‘age-standardised’.
20 http://www.educationcounts.govt.nz/indicators/indicator_page/schooling/1947
21 http://www.educationcounts.govt.nz/indicators/indicator_page/all_indicators/1991
22 http://www.educationcounts.govt.nz/indicators/indicator_page/schooling/1891
28
For the vast majority of Pacific students who stay at school, achievement is increasing. The percentage of Pacific school leavers able to go straight into degree-level tertiary education (20.2 percent in 2007) has more than doubled since 2002. This compares with 39 percent of all school leavers.23
A significant proportion of Pacific parents choose to send their children to integrated (usually Catholic) or private schools. 24 Since 2000, the proportion of Pacific students in private/integrated schools has been steady at around 16.8 percent of all Pacific students. In 2008 it dropped to 16.4 percent. This compares with around 15.2 percent of non-Pacific students in 2008, which has slowly increased from 13.2 percent in 2000. Retention is much higher for both Pacific and non-Pacific students in private/integrated schools and has remained stable since 2000 with around 80 percent of Pacific students staying to age 17.5 (compared with 65.4 percent of non-Pacific students). However, retention is increasing significantly in state schools. In 2000, only 43.8 percent of Pacific students stayed until age 17.5. In 2008 it was 67.4 percent (compared with 59 percent non-Pacific students).
Achievement data show that Pacific students in private/integrated schools do much better than those in state schools. However it is hard to conclude that it is the school that makes the difference, as it could be a number of other factors such as family background.
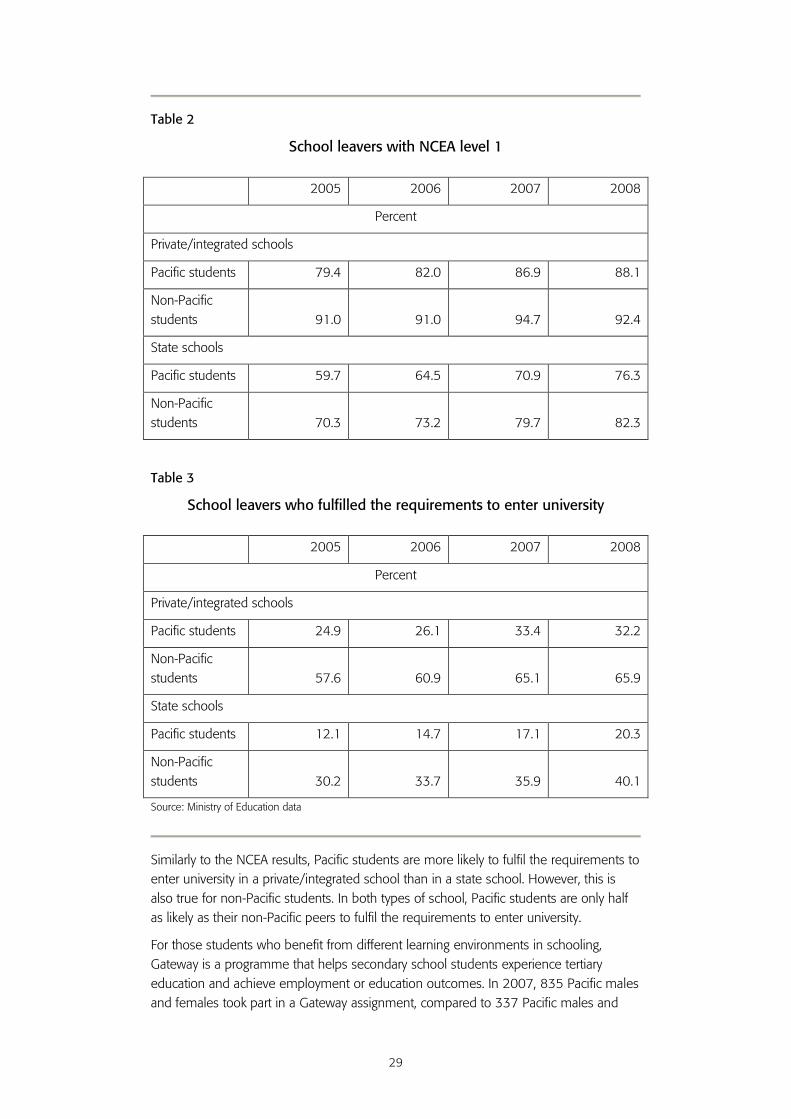
Table 2 shows that attending a private/integrated school seems to make more difference for Pacific school leavers in achieving NCEA level 1 than for non-Pacific students. This could be due to the greater Pacific student retention rate in private/integrated schools which means they stay on until they have completed level 1. At NCEA level 2 the differences in achievement between students at state and private/integrated schools are similar for Pacific and non-Pacific students. The difference is also the same in relation to meeting the requirements for entering university (table 3).25
23 http://www.educationcounts.govt.nz/indicators/indicator_page/schooling/1891
24 Private schools are privately owned and charge fees. Integrated schools are privately owned but comply with Ministry of Education requirements for public schools and are funded by the Ministry (eg Catholic schools). They charge some level of fees.
25 To meet the requirements to enter university, students must achieve NCEA subjects from an approved list.
29
Table 2
School leavers with NCEA level 1
2005 2006 2007 2008
Percent
Private/integrated schools
Pacific students 79.4 82.0 86.9 88.1
Non-Pacific students 91.0 91.0 94.7 92.4
State schools
Pacific students 59.7 64.5 70.9 76.3
Non-Pacific students 70.3 73.2 79.7 82.3
Table 3
School leavers who fulfilled the requirements to enter university
2005 2006 2007 2008
Percent
Private/integrated schools
Pacific students 24.9 26.1 33.4 32.2
Non-Pacific students 57.6 60.9 65.1 65.9
State schools
Pacific students 12.1 14.7 17.1 20.3
Non-Pacific students 30.2 33.7 35.9 40.1
Source: Ministry of Education data
Similarly to the NCEA results, Pacific students are more likely to fulfil the requirements to enter university in a private/integrated school than in a state school. However, this is also true for non-Pacific students. In both types of school, Pacific students are only half as likely as their non-Pacific peers to fulfil the requirements to enter university.
For those students who benefit from different learning environments in schooling, Gateway is a programme that helps secondary school students experience tertiary education and achieve employment or education outcomes. In 2007, 835 Pacific males and females took part in a Gateway assignment, compared to 337 Pacific males and
30
females in 2003. In 2007, 632 Pacific Gateway learners achieved a positive outcome (95.5 percent): 23 percent started full-time employment; 1.5 percent started part-time employment; and 71 percent continued with further training.26
Foundations for learning Reading, writing, and maths Literacy is the key for accessing all other learning at school. Children who achieve essential reading and writing skills early in their schooling go on to learn well through secondary school (eg, Ministry of Education, 2008d; Wylie, 2009). Low levels of achievement in early literacy skills lead to large numbers of Pacific students leaving secondary school with no formal qualifications, and a disproportionately low percentage enrolled in higher-level tertiary education (Nakhid, 2003 cited in Ferguson et al., 2008).
A child’s first language is the foundation on which to build their knowledge of English. It is critical that the child’s first language is supported at home and at school. This will allow a child to still develop literacy and thinking skills while their English language continues to develop. It will also support the child’s identity and self-concept, which are critical for effective learning (Ministry of Education, 2003).
Right from the start of schooling, there are overall differences in reading and writing knowledge and skills between Mäori and Pacific children and other children (McNaughton et al., 2000). Such differences tend to increase if teachers do not respond to them quickly and appropriately (eg, Tunmer et al., 2003). After four years at school, substantial differences in achievement are apparent between both Mäori and Pacific children and other children (Auckland Uniservices Ltd, 2002). In 2009, the Education Review Office found that only three of the 32 schools studied showed higher Pacific student achievement in English literacy than in their previous review.
Some teachers may wait until a child has developed a strong English oral language base before they begin to teach them reading and writing skills. This delay in formal teaching means that children miss out on rich learning experiences, which then limits their development of literacy and thinking skills (Ministry of Education, 2003). There is little evidence that children whose reading and writing learning has been delayed ever catch up (eg, Phillips et al., 2002 & 2004).
The 2008 National Educational Monitoring Project (NEMP)27 results for reading and speaking show that over the last eight years, the significant disparities between European and Pacific students have reduced a little for year 4 students but the gap has stayed the same or increased for year 8 students.
Students for whom English is not the main language at home had lower results than those for whom English is the main language. In an international assessment of reading
26 http://www.educationcounts.govt.nz/publications/series/36769/36777
27 The National Educational Monitoring Project (NEMP) assesses two areas of learning every year with a national sample of year 4 and year 8 students.
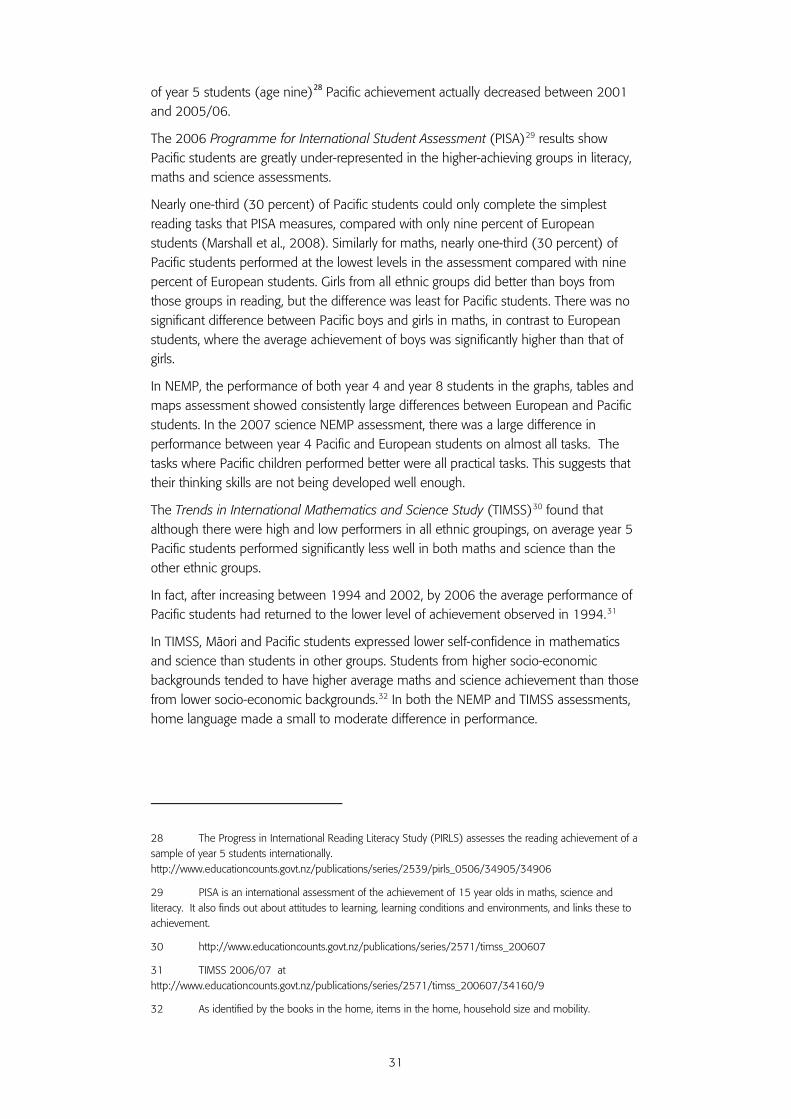
31
of year 5 students (age nine)28 Pacific achievement actually decreased between 2001 and 2005/06.
The 2006 Programme for International Student Assessment (PISA)29 results show Pacific students are greatly under-represented in the higher-achieving groups in literacy, maths and science assessments.
Nearly one-third (30 percent) of Pacific students could only complete the simplest reading tasks that PISA measures, compared with only nine percent of European students (Marshall et al., 2008). Similarly for maths, nearly one-third (30 percent) of Pacific students performed at the lowest levels in the assessment compared with nine percent of European students. Girls from all ethnic groups did better than boys from those groups in reading, but the difference was least for Pacific students. There was no significant difference between Pacific boys and girls in maths, in contrast to European students, where the average achievement of boys was significantly higher than that of girls.
In NEMP, the performance of both year 4 and year 8 students in the graphs, tables and maps assessment showed consistently large differences between European and Pacific students. In the 2007 science NEMP assessment, there was a large difference in performance between year 4 Pacific and European students on almost all tasks. The tasks where Pacific children performed better were all practical tasks. This suggests that their thinking skills are not being developed well enough.
The Trends in International Mathematics and Science Study (TIMSS)30 found that although there were high and low performers in all ethnic groupings, on average year 5 Pacific students performed significantly less well in both maths and science than the other ethnic groups.
In fact, after increasing between 1994 and 2002, by 2006 the average performance of Pacific students had returned to the lower level of achievement observed in 1994.31
In TIMSS, Mäori and Pacific students expressed lower self-confidence in mathematics and science than students in other groups. Students from higher socio-economic backgrounds tended to have higher average maths and science achievement than those from lower socio-economic backgrounds.32 In both the NEMP and TIMSS assessments, home language made a small to moderate difference in performance.
28 The Progress in International Reading Literacy Study (PIRLS) assesses the reading achievement of a sample of year 5 students internationally. http://www.educationcounts.govt.nz/publications/series/2539/pirls_0506/34905/34906
29 PISA is an international assessment of the achievement of 15 year olds in maths, science and literacy. It also finds out about attitudes to learning, learning conditions and environments, and links these to achievement.
30 http://www.educationcounts.govt.nz/publications/series/2571/timss_200607
31 TIMSS 2006/07 at http://www.educationcounts.govt.nz/publications/series/2571/timss_200607/34160/9
32 As identified by the books in the home, items in the home, household size and mobility.
32
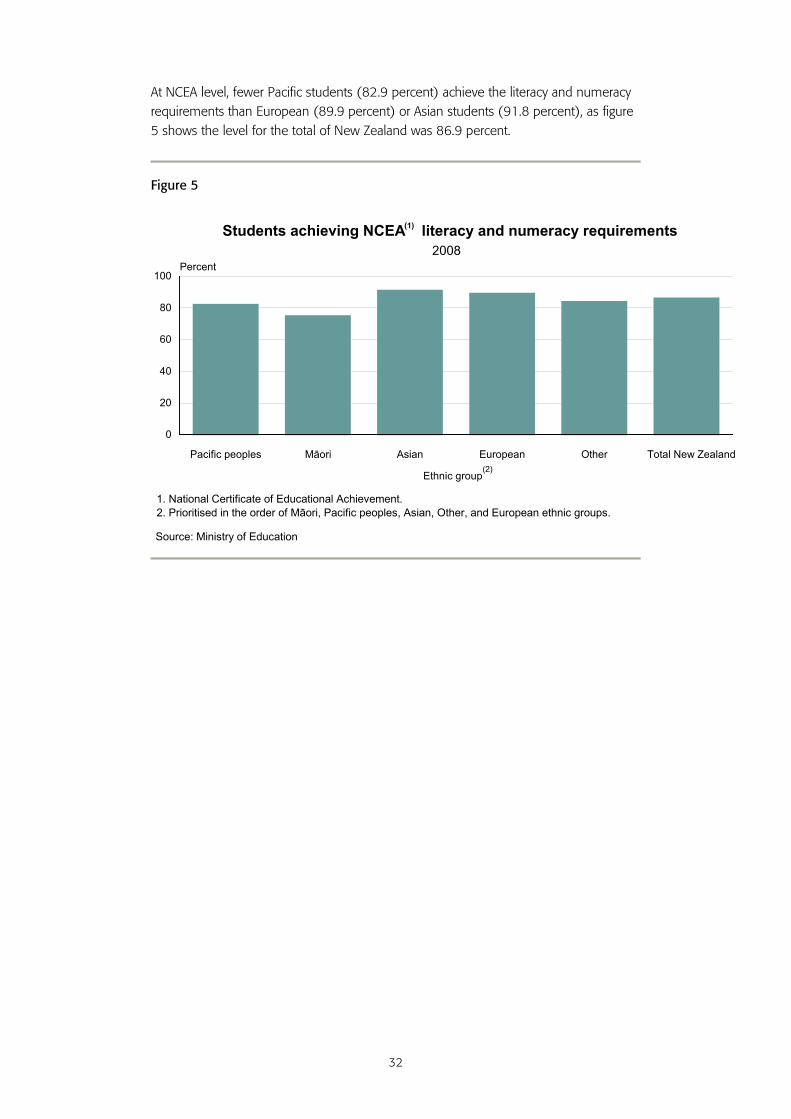
At NCEA level, fewer Pacific students (82.9 percent) achieve the literacy and numeracy requirements than European (89.9 percent) or Asian students (91.8 percent), as figure 5 shows the level for the total of New Zealand was 86.9 percent.
Figure 5
Pacific peoples Mäori Asian European Other Total New Zealand
0
20
40
60
80
100Percent
Ethnic group(2)
Students achieving NCEA literacy and numeracy requirements2008
Source: Ministry of Education
1. National Certificate of Educational Achievement.2. Prioritised in the order of Mäori, Pacific peoples, Asian, Other, and European ethnic groups.
(1)
33
Attitudes to learning Children get into a pattern of learning progress when they can engage actively with school activities and teachers from the start of school (Phillips et al., 2002 & 2004). Children engage better with school activities and teachers when they have had prior experience of such activities and relationships.
As well as developing key knowledge and skills, students need to develop the abilities to use and develop them independently. Such abilities, or ‘dispositions’, include an inquiring and critical mind, and an ability to question and ‘speak out’ (eg, Comparative Research Unit, Ministry of Education 2004 a & b).
A study of the transition from year 6 (primary) to year 7 (intermediate) schools found that while the transition process was not a problem for most of the students, some Mäori and Pacific students found it hard to adjust to larger class settings (Bicknell & Hunter, 2009).
While they described the importance to their mathematics learning of talking with friends in small groups, the larger mathematics classroom situation posed many risks compared with their year 6 experiences. These findings illustrate the importance of teachers managing classroom culture and explicitly affirming what the students bring to the classroom in what Macfarlane (2004) describes as ‘culturally responsive’ (p. 27) ways to improve learning.
Students who are more independent in their learning are likely to manage the transition to secondary school better, remain more engaged in education, and achieve better than more dependent learners (Wylie et al., 2005; Artelt et al., 2003; Larose et al., 2005). Once students leave secondary school, they have to manage most of their own learning. Students will learn more effectively if they understand that knowledge is not fixed and does not exist in the mind of the teacher to be handed down, rather it develops through questioning, reasoning, collaboration, and effort.33
While performance in NCEA is related to a student’s levels of literacy and numeracy, positive attitudes and work habits are also important (Wylie, 2009). In NCEA, Pacific students considered that luck was more important for their marks than effort and ability. This lack of emphasis on effort and ability is important since an attitude of ‘doing my best’ is associated with higher achievement (Meyer et al., 2009). Similarly, Pacific students rated both family and friend influences as more important to both their best and worst marks than did other students (Meyer et al., 2009). This could suggest that Mäori and Pacific students felt less control over their results than European and Asian students (Meyer et al., 2009).
2008 NCEA results showed that Pacific students performed less well than other groups. Pacific boys performed less well than Pacific girls, which is typical across the ethnic groups. However, there have been some improvements in level 1 and 2 achievement since 2004 (see ‘quality teaching’, p36).
The PISA assessment found that learners’ self-belief is the strongest single predictor of whether they will adopt strategies that make learning effective (Artelt et al., 2003). PISA
33 Language Enhancing the Achievement of Pasifika at http://leap.tki.org.nz/being_bilingual/bilingualism_and_successful_learning
34
2006 results showed that for science, students with a higher self-concept and belief in their ability to overcome difficulties had significantly higher achievement. Pacific students, along with Mäori students, were the least likely to report they would be able to perform a selection of scientific literacy tasks and both groups performed less well (Caygill, 2008).
In another study, Pacific girls explained their lack of success almost entirely by a lack of ‘brains’, rather than an understanding that effort plays a large role in successful learning outcomes (Jones cited in Franken et al., 2005). This suggests many Pacific students have a low self-concept as learners and feel a lack of control over their learning outcomes. This works against successful learning and achievement.
Teachers have a significant role in fostering better learning self-concepts and approaches with students from the start of their schooling. For example, almost a quarter of the schools in the 2009 Education Review Office study focused on encouraging Pacific students to be involved in decision-making and leadership (Education Review Office, 2009).
Bilingualism International research shows clear advantages for bilingual students over speakers of only one language (Franken et al., 2005). Where one of these languages is an ancestral language, learners also gain a stronger sense of self and cultural identity (Franken). While Pacific communities have expressed their desire to retain and foster their languages in New Zealand, Pacific languages are sometimes seen as obstacles to learning rather than a resource for learning (Franken).
There is a lack of research on Pacific bilingualism and its links with schooling. PISA 2006 results indicated that 49 percent of students who generally spoke a language other than English at home were low achievers in reading literacy compared with only 20 percent from English-speaking homes. However, unlike the 2000 and 2003 PISA results, speaking English at home made no difference in the 2006 PISA maths test (Caygill et al., 2008). Maths achievement was also not significantly different for those born in New Zealand and those born outside New Zealand (ibid). In reading achievement, there was no significant difference between those born in New Zealand with parents also born in New Zealand and those born in New Zealand with parents born outside New Zealand. However, students who were born outside New Zealand performed less well than the others.
In the 2006/07 TIMSS study, year 5 students who always or almost always spoke English at home had higher maths results, on average, than those who sometimes or never spoke English at home. Students who were born in New Zealand had higher mathematics achievement, on average, than those who were not.
The Ministry of Education’s project – Strengthening Education in Mangere and Otara – clearly shows that bilingual Pacific children can all develop the language and skills required for successful school learning if they are in schools where teachers are responsive to the learners’ backgrounds and focus consistently on student achievements (Robinson & Timperley, 2004).
35
The best educational outcomes for students come about when they are able to use both their home language and English in their schooling, in a context where they are both valued. This reduces identity conflicts for Pacific students and motivates them to learn both languages and succeed at school (Pasikale 1999, cited in Coxon, 2002).
Pacific-medium education is where a Pacific language is the medium of instruction for more than three hours per week. In 2009, there were 1,465 students involved in Pacific-medium education. This is a decrease of 176 students (10.7 percent) since July 2008 and a significant drop from 1,737 students in 2003.34
In 2009, 34 schools offered Pacific-medium education; 23 primary schools, nine secondary schools, and two composite schools. This is two fewer than in July 2008 but 12 more than in 2003 (22 schools).
There were 1,641 students involved in Pacific-medium education in 2007. This is an increase of 143 students (5.2 percent) since July 2006.
At secondary level, there were 33 schools offering a Pacific language in 2008. This is one more than in 2007. In 2009, there were 3,064 enrolments in a Pacific language at secondary level. This is an increase of 9.1 percent from 2008. Samoan was the most popular Pacific language in 2009 with 70.5 percent of enrolments in a Pacific language. This compares with 82.3 percent of enrolments in 2008. There were more enrolments in other Pacific languages in 2009.35
The Ministry of Education has launched several resources to support Pacific languages in schools. In 2007, it launched Vagahau Niue in the New Zealand Curriculum and Tongan in the New Zealand Curriculum. Gagana Tokelau: The Tokelau Language Guidelines was launched in May 2009 and the revised Ta'iala mo le Gagana Sämoa: The Gagana Sämoa Guidelines was relaunched 18 September 2009.
The multi-media Learning Language Series (LLS) resources I-E-Ko-Ko! An Introduction to Cook Islands Mäori and Mua Ō! An Introduction to Gagana Sämoa have been completed and are available to schools to support levels 1 and 2 of the language guidelines. Haia! An Introduction to Vagahau Niue and Faufaua! An Introduction to Tongan will be completed and available to schools at the beginning of 2010.
Special education needs There is some evidence that Pacific children are not receiving special education assistance or other forms of assistance as readily as other groups. Early support for disabilities is important to increase the benefits longer term. The uptake of special needs allowances and services by Pacific peoples is low compared with other groups. In 2006, the proportion of Pacific children and young people aged under 18 years who received the Independence Allowance or a lump-sum payment to support physical disabilities was around half that of the rest of the population. In addition, Pacific children
34 http://www.educationcounts.govt.nz/publications/series/2259/july_school_roll_returns/57515
35 Source: http://www.educationcounts.govt.nz/statistics/schooling/ july_school_roll_returns/6044/32363
36
and young people were under-represented in those receiving ACC funding, as is the case generally for Pacific peoples receiving ACC services (Clark et al., 2007).
Similarly, data suggest that a disproportionate number of Pacific students with physical disabilities may be missing out on applying for Ministry of Education Ongoing and Reviewable Resourcing Schemes (ORSS) funding.36 The ORRS application process itself may be a stumbling block for certain groups, particularly when language is a barrier (Rivers, 2005; Clark et al., 2007).
Other barriers for Pacific parents seeking help for their children with disabilities may include a lack of awareness of developmental disabilities within Pacific cultures. This can mean that Pacific families think a child’s behaviour is just naughtiness (Rivers, 2005).
…for example they could just think that their child is being naughty, and so that is sometimes where the harsh discipline might come in. They don’t realise that there is something wrong with the child, especially in autism because they look so normal. Pacific interviewee in Rivers (2005).
The cultural norm of respecting the ‘expert’ may also affect diagnosis.
… and lack of education, and just that authority thing … like they are too scared to ask people that they see are in authority, and also with diagnosis it’s not like for them to just like pick up something. They wait for a doctor or a teacher to say that perhaps something is wrong. So I reckon that a lot of kids probably are picked up when they get to school … especially the less severe cases. Pacific interviewee in Rivers (2005)
There is also some evidence that Pacific ECE services do not refer children to the Special Education Service as much as other ECE services. Fa’amausili-Banse (cited in Coxon, 2002) considers that teachers are not well prepared for special needs assessment, and providers may not communicate their services well to Pacific parents and communities. She concludes that the way in which disability is seen in New Zealand comes from a Western paradigm, making Pacific parents hesitant about referring their children to any outside agency. It is essential that this is addressed by education and special needs providers so children’s special needs are identified early on. Recent initiatives by the Ministry of Education have resulted in an increase in Pacific referrals to early intervention services of 32 percent between 2007/08 and 2008/09 (Ministry of Education, 2009b).
Quality teaching Despite some truancy issues in early secondary school, the Education Review Office has concluded that Pacific student attendance at school is not a major problem for most Pacific students. It is therefore critical that teachers and school leaders engage students more effectively in learning while they are there (ERO, 2009).
Within schools, teaching is the most important factor in student achievement. Good teaching can ensure Pacific students’ achievement is at the same level as that of other
36 Children and young people with a significant physical disability, learning problems, communication disorders and vision or hearing impairments may be eligible to receive extra resourcing and assistance from the Ministry of Education’s ORRS funding.
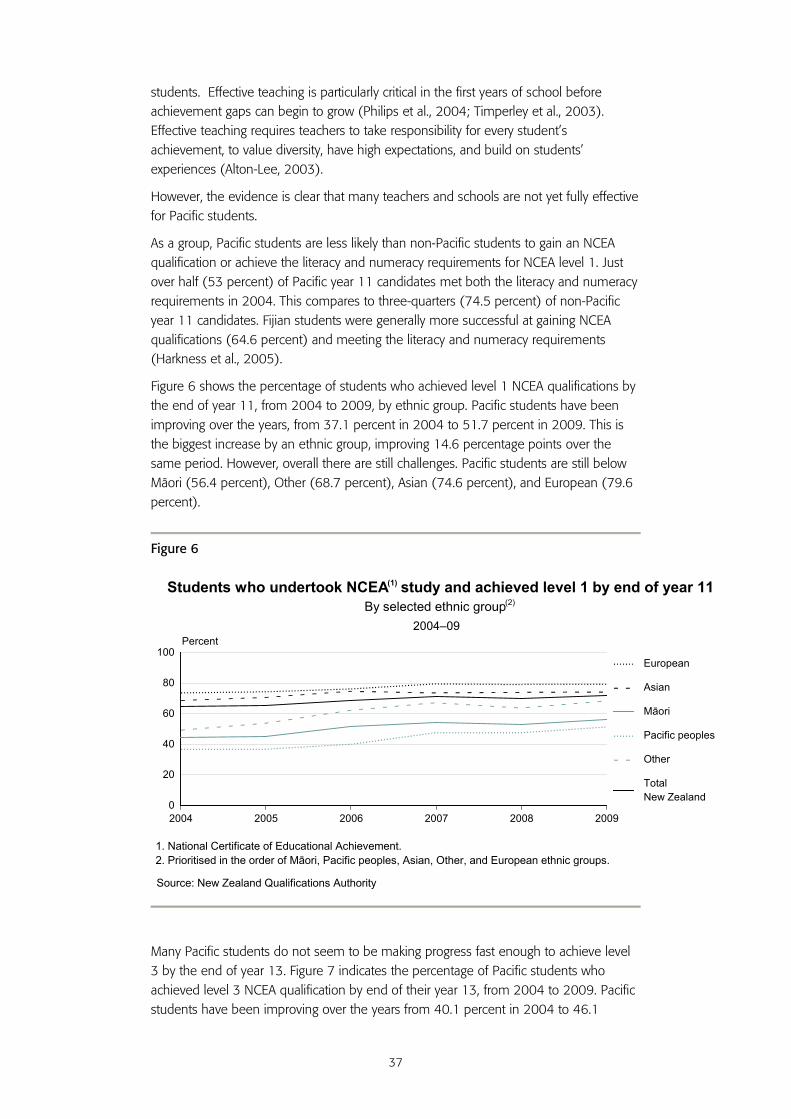
37
students. Effective teaching is particularly critical in the first years of school before achievement gaps can begin to grow (Philips et al., 2004; Timperley et al., 2003). Effective teaching requires teachers to take responsibility for every student’s achievement, to value diversity, have high expectations, and build on students’ experiences (Alton-Lee, 2003).
However, the evidence is clear that many teachers and schools are not yet fully effective for Pacific students.
As a group, Pacific students are less likely than non-Pacific students to gain an NCEA qualification or achieve the literacy and numeracy requirements for NCEA level 1. Just over half (53 percent) of Pacific year 11 candidates met both the literacy and numeracy requirements in 2004. This compares to three-quarters (74.5 percent) of non-Pacific year 11 candidates. Fijian students were generally more successful at gaining NCEA qualifications (64.6 percent) and meeting the literacy and numeracy requirements (Harkness et al., 2005).
Figure 6 shows the percentage of students who achieved level 1 NCEA qualifications by the end of year 11, from 2004 to 2009, by ethnic group. Pacific students have been improving over the years, from 37.1 percent in 2004 to 51.7 percent in 2009. This is the biggest increase by an ethnic group, improving 14.6 percentage points over the same period. However, overall there are still challenges. Pacific students are still below Mäori (56.4 percent), Other (68.7 percent), Asian (74.6 percent), and European (79.6 percent).
Figure 6
Many Pacific students do not seem to be making progress fast enough to achieve level 3 by the end of year 13. Figure 7 indicates the percentage of Pacific students who achieved level 3 NCEA qualification by end of their year 13, from 2004 to 2009. Pacific students have been improving over the years from 40.1 percent in 2004 to 46.1
2004 2005 2006 2007 2008 20090
20
40
60
80
100Percent
European
Asian
Mäori
Pacific peoples
Other
TotalNew Zealand
Students who undertook NCEA study and achieved level 1 by end of year 11
2004–09
Source: New Zealand Qualifications Authority
By selected ethnic group
1. National Certificate of Educational Achievement.2. Prioritised in the order of Mäori, Pacific peoples, Asian, Other, and European ethnic groups.
(1)
(2)
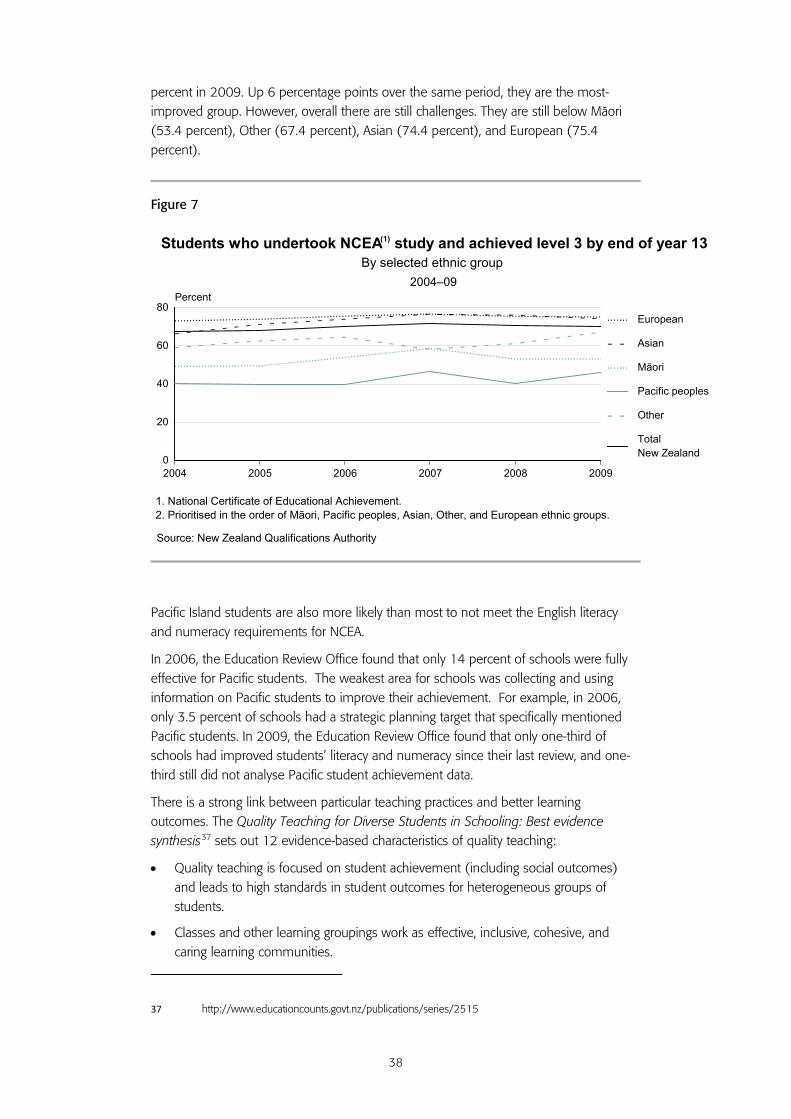
38
percent in 2009. Up 6 percentage points over the same period, they are the most-improved group. However, overall there are still challenges. They are still below Mäori (53.4 percent), Other (67.4 percent), Asian (74.4 percent), and European (75.4 percent).
Figure 7
Pacific Island students are also more likely than most to not meet the English literacy and numeracy requirements for NCEA.
In 2006, the Education Review Office found that only 14 percent of schools were fully effective for Pacific students. The weakest area for schools was collecting and using information on Pacific students to improve their achievement. For example, in 2006, only 3.5 percent of schools had a strategic planning target that specifically mentioned Pacific students. In 2009, the Education Review Office found that only one-third of schools had improved students’ literacy and numeracy since their last review, and one-third still did not analyse Pacific student achievement data.
There is a strong link between particular teaching practices and better learning outcomes. The Quality Teaching for Diverse Students in Schooling: Best evidence synthesis37 sets out 12 evidence-based characteristics of quality teaching:
• Quality teaching is focused on student achievement (including social outcomes) and leads to high standards in student outcomes for heterogeneous groups of students.
• Classes and other learning groupings work as effective, inclusive, cohesive, and caring learning communities.
37 http://www.educationcounts.govt.nz/publications/series/2515
2004 2005 2006 2007 2008 20090
20
40
60
80Percent
European
Asian
Mäori
Pacific peoples
Other
TotalNew Zealand
Source: New Zealand Qualifications Authority
2004–09
Students who undertook NCEA study and achieved level 3 by end of year 13By selected ethnic group
(1)
1. National Certificate of Educational Achievement.2. Prioritised in the order of Mäori, Pacific peoples, Asian, Other, and European ethnic groups.
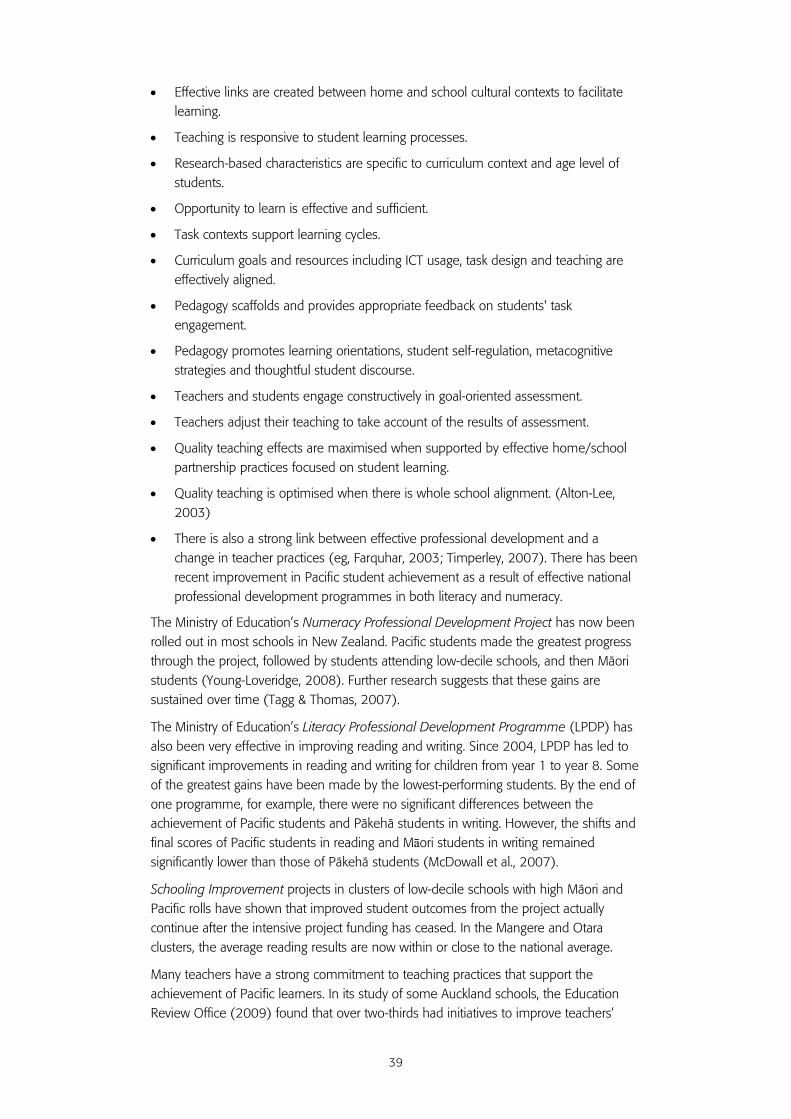
39
• Effective links are created between home and school cultural contexts to facilitate learning.
• Teaching is responsive to student learning processes.
• Research-based characteristics are specific to curriculum context and age level of students.
• Opportunity to learn is effective and sufficient.
• Task contexts support learning cycles.
• Curriculum goals and resources including ICT usage, task design and teaching are effectively aligned.
• Pedagogy scaffolds and provides appropriate feedback on students' task engagement.
• Pedagogy promotes learning orientations, student self-regulation, metacognitive strategies and thoughtful student discourse.
• Teachers and students engage constructively in goal-oriented assessment.
• Teachers adjust their teaching to take account of the results of assessment.
• Quality teaching effects are maximised when supported by effective home/school partnership practices focused on student learning.
• Quality teaching is optimised when there is whole school alignment. (Alton-Lee, 2003)
• There is also a strong link between effective professional development and a change in teacher practices (eg, Farquhar, 2003; Timperley, 2007). There has been recent improvement in Pacific student achievement as a result of effective national professional development programmes in both literacy and numeracy.
The Ministry of Education’s Numeracy Professional Development Project has now been rolled out in most schools in New Zealand. Pacific students made the greatest progress through the project, followed by students attending low-decile schools, and then Mäori students (Young-Loveridge, 2008). Further research suggests that these gains are sustained over time (Tagg & Thomas, 2007).
The Ministry of Education’s Literacy Professional Development Programme (LPDP) has also been very effective in improving reading and writing. Since 2004, LPDP has led to significant improvements in reading and writing for children from year 1 to year 8. Some of the greatest gains have been made by the lowest-performing students. By the end of one programme, for example, there were no significant differences between the achievement of Pacific students and Päkehä students in writing. However, the shifts and final scores of Pacific students in reading and Māori students in writing remained significantly lower than those of Päkehä students (McDowall et al., 2007).
Schooling Improvement projects in clusters of low-decile schools with high Mäori and Pacific rolls have shown that improved student outcomes from the project actually continue after the intensive project funding has ceased. In the Mangere and Otara clusters, the average reading results are now within or close to the national average.
Many teachers have a strong commitment to teaching practices that support the achievement of Pacific learners. In its study of some Auckland schools, the Education Review Office (2009) found that over two-thirds had initiatives to improve teachers’
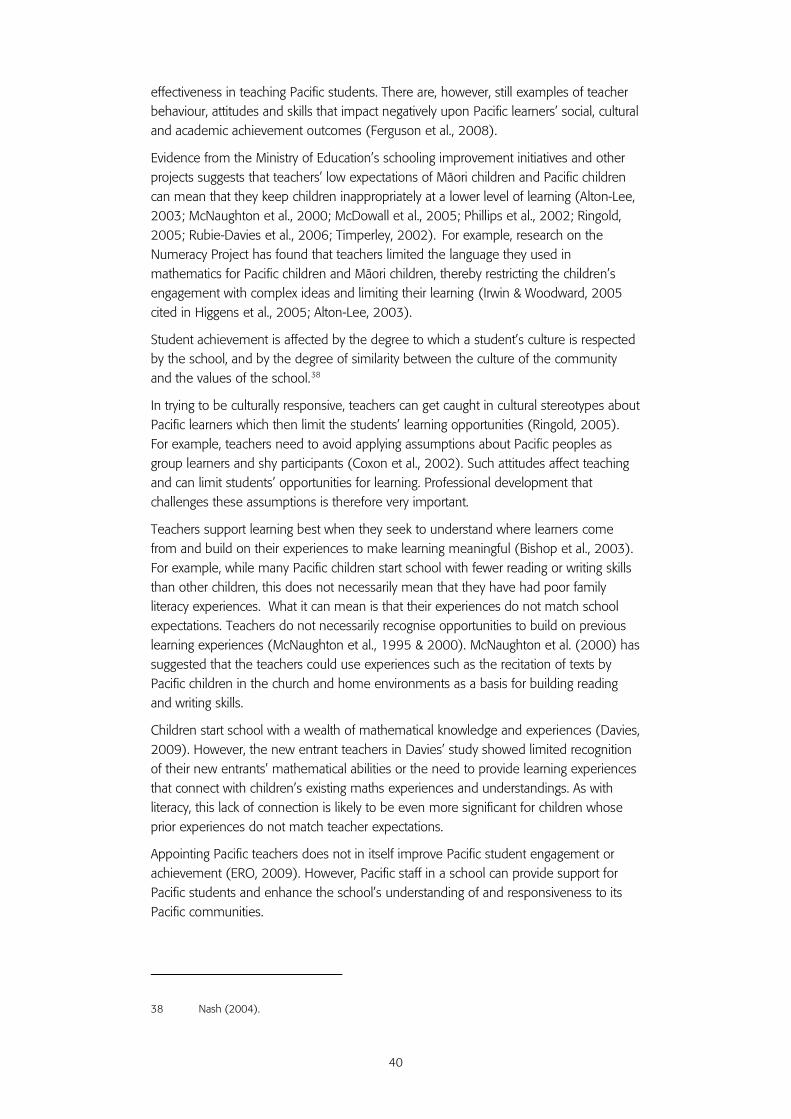
40
effectiveness in teaching Pacific students. There are, however, still examples of teacher behaviour, attitudes and skills that impact negatively upon Pacific learners’ social, cultural and academic achievement outcomes (Ferguson et al., 2008).
Evidence from the Ministry of Education’s schooling improvement initiatives and other projects suggests that teachers’ low expectations of Mäori children and Pacific children can mean that they keep children inappropriately at a lower level of learning (Alton-Lee, 2003; McNaughton et al., 2000; McDowall et al., 2005; Phillips et al., 2002; Ringold, 2005; Rubie-Davies et al., 2006; Timperley, 2002). For example, research on the Numeracy Project has found that teachers limited the language they used in mathematics for Pacific children and Mäori children, thereby restricting the children’s engagement with complex ideas and limiting their learning (Irwin & Woodward, 2005 cited in Higgens et al., 2005; Alton-Lee, 2003).
Student achievement is affected by the degree to which a student’s culture is respected by the school, and by the degree of similarity between the culture of the community and the values of the school.38
In trying to be culturally responsive, teachers can get caught in cultural stereotypes about Pacific learners which then limit the students’ learning opportunities (Ringold, 2005). For example, teachers need to avoid applying assumptions about Pacific peoples as group learners and shy participants (Coxon et al., 2002). Such attitudes affect teaching and can limit students’ opportunities for learning. Professional development that challenges these assumptions is therefore very important.
Teachers support learning best when they seek to understand where learners come from and build on their experiences to make learning meaningful (Bishop et al., 2003). For example, while many Pacific children start school with fewer reading or writing skills than other children, this does not necessarily mean that they have had poor family literacy experiences. What it can mean is that their experiences do not match school expectations. Teachers do not necessarily recognise opportunities to build on previous learning experiences (McNaughton et al., 1995 & 2000). McNaughton et al. (2000) has suggested that the teachers could use experiences such as the recitation of texts by Pacific children in the church and home environments as a basis for building reading and writing skills.
Children start school with a wealth of mathematical knowledge and experiences (Davies, 2009). However, the new entrant teachers in Davies’ study showed limited recognition of their new entrants’ mathematical abilities or the need to provide learning experiences that connect with children’s existing maths experiences and understandings. As with literacy, this lack of connection is likely to be even more significant for children whose prior experiences do not match teacher expectations.
Appointing Pacific teachers does not in itself improve Pacific student engagement or achievement (ERO, 2009). However, Pacific staff in a school can provide support for Pacific students and enhance the school’s understanding of and responsiveness to its Pacific communities.
38 Nash (2004).
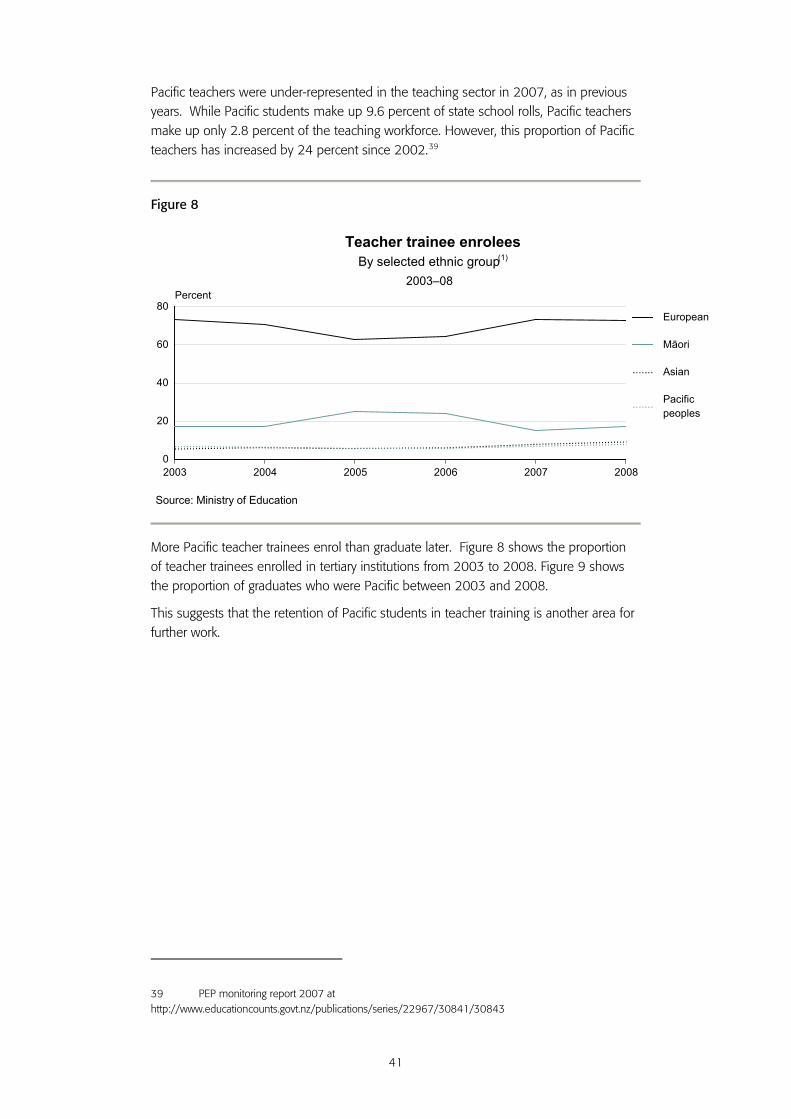
41
Pacific teachers were under-represented in the teaching sector in 2007, as in previous years. While Pacific students make up 9.6 percent of state school rolls, Pacific teachers make up only 2.8 percent of the teaching workforce. However, this proportion of Pacific teachers has increased by 24 percent since 2002.39
Figure 8
More Pacific teacher trainees enrol than graduate later. Figure 8 shows the proportion of teacher trainees enrolled in tertiary institutions from 2003 to 2008. Figure 9 shows the proportion of graduates who were Pacific between 2003 and 2008.
This suggests that the retention of Pacific students in teacher training is another area for further work.
39 PEP monitoring report 2007 at http://www.educationcounts.govt.nz/publications/series/22967/30841/30843
2003 2004 2005 2006 2007 20080
20
40
60
80Percent
European
Mäori
Asian
Pacific peoples
Source: Ministry of Education
2003–08
Teacher trainee enroleesBy selected ethnic group(1)
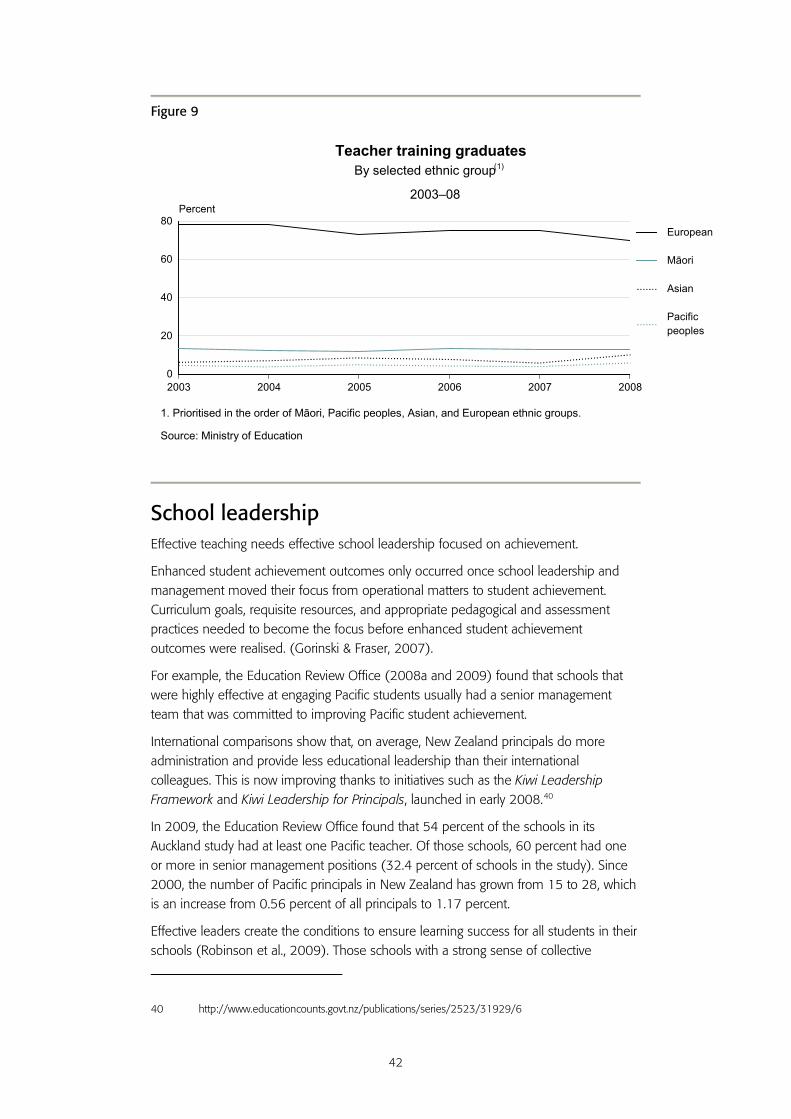
42
Figure 9
School leadership Effective teaching needs effective school leadership focused on achievement.
Enhanced student achievement outcomes only occurred once school leadership and management moved their focus from operational matters to student achievement. Curriculum goals, requisite resources, and appropriate pedagogical and assessment practices needed to become the focus before enhanced student achievement outcomes were realised. (Gorinski & Fraser, 2007).
For example, the Education Review Office (2008a and 2009) found that schools that were highly effective at engaging Pacific students usually had a senior management team that was committed to improving Pacific student achievement.
International comparisons show that, on average, New Zealand principals do more administration and provide less educational leadership than their international colleagues. This is now improving thanks to initiatives such as the Kiwi Leadership Framework and Kiwi Leadership for Principals, launched in early 2008.40
In 2009, the Education Review Office found that 54 percent of the schools in its Auckland study had at least one Pacific teacher. Of those schools, 60 percent had one or more in senior management positions (32.4 percent of schools in the study). Since 2000, the number of Pacific principals in New Zealand has grown from 15 to 28, which is an increase from 0.56 percent of all principals to 1.17 percent.
Effective leaders create the conditions to ensure learning success for all students in their schools (Robinson et al., 2009). Those schools with a strong sense of collective
40 http://www.educationcounts.govt.nz/publications/series/2523/31929/6
2003 2004 2005 2006 2007 20080
20
40
60
80Percent
European
Mäori
Asian
Pacific peoples
Source: Ministry of Education
2003–08
Teacher training graduatesBy selected ethnic group
1. Prioritised in the order of Mäori, Pacific peoples, Asian, and European ethnic groups.
(1)
43
responsibility for learners had better achievement (ibid). However, in New Zealand, principals generally spend less time than principals from other countries on the things that make the most difference to effective learning: instructional leadership and supervising and mentoring teachers. In New Zealand, principals spend much more time on administration (ibid).
In addition, strong communities of professional practice are very important in promoting and sustaining effective classroom practice (Timperley & Wiseman, 2003). This research found that higher student achievement is linked with the existence of an effective community of professional practice within a school that focused consistently on student outcomes, analysed student achievement data and worked collaboratively to improve teaching practice (ibid).
Education pathways The choice of subjects at secondary school can open up or close off future opportunities. To enter higher-level tertiary education, students need to achieve NCEA level 3 with subjects that meet the requirements to enter university.41 Pacific students tend to choose less academic subjects for NCEA and fewer from the list of courses approved for university (Madjar et al., 2009).
Pacific students also have a pattern of achieving NCEA level 2 in Year 13, which again limits their further study options (NZQA data).
Of the students who studied for NCEA, Pacific students were least likely to gain the requirements to enter university through that study, as figure 10 below demonstrates. And unlike achievement of NCEA qualifications, this has not improved since 2004.
41 To get NCEA level 1, students must gain 80 credits, including 8 from numeracy standards and 8 from literacy standards. NCEA level 2 requires a minimum of 60 credits at level 2 or above and 20 other credits; for NCEA level 3 students need 80 credits, of which 60 must be at level 3 or above, and 20 at level 2 or above.
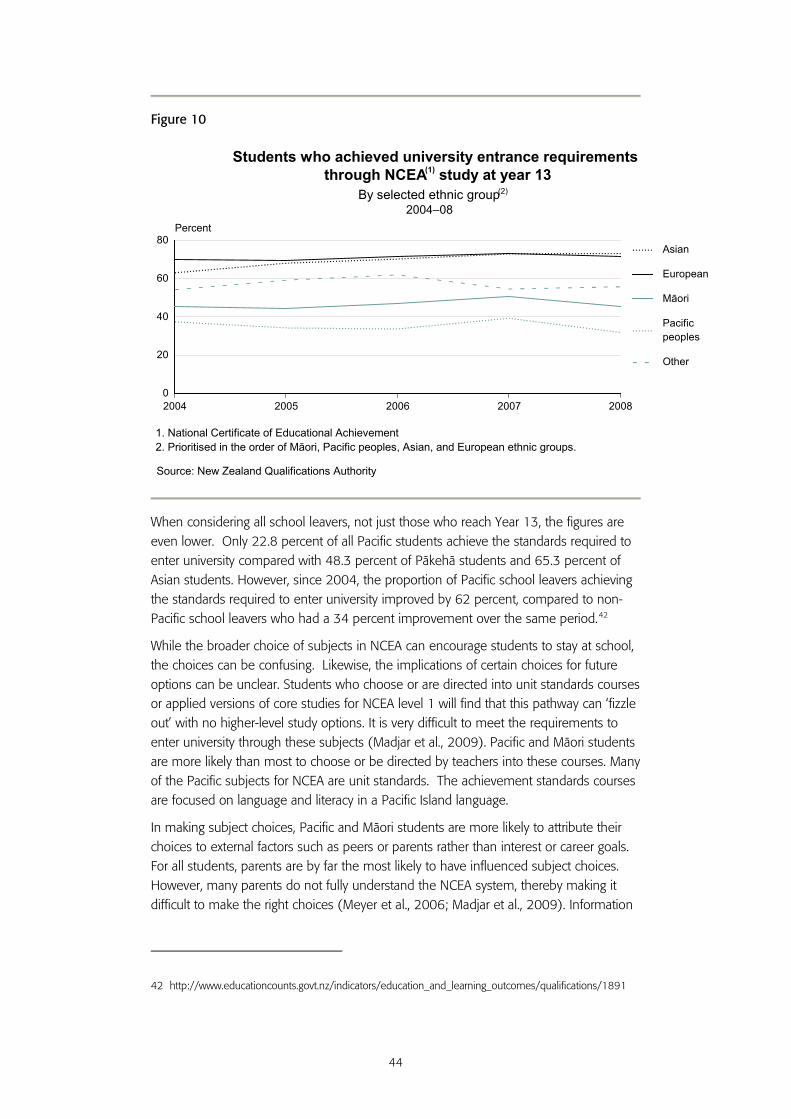
44
Figure 10
When considering all school leavers, not just those who reach Year 13, the figures are even lower. Only 22.8 percent of all Pacific students achieve the standards required to enter university compared with 48.3 percent of Päkehä students and 65.3 percent of Asian students. However, since 2004, the proportion of Pacific school leavers achieving the standards required to enter university improved by 62 percent, compared to non-Pacific school leavers who had a 34 percent improvement over the same period.42
While the broader choice of subjects in NCEA can encourage students to stay at school, the choices can be confusing. Likewise, the implications of certain choices for future options can be unclear. Students who choose or are directed into unit standards courses or applied versions of core studies for NCEA level 1 will find that this pathway can ‘fizzle out’ with no higher-level study options. It is very difficult to meet the requirements to enter university through these subjects (Madjar et al., 2009). Pacific and Mäori students are more likely than most to choose or be directed by teachers into these courses. Many of the Pacific subjects for NCEA are unit standards. The achievement standards courses are focused on language and literacy in a Pacific Island language.
In making subject choices, Pacific and Mäori students are more likely to attribute their choices to external factors such as peers or parents rather than interest or career goals. For all students, parents are by far the most likely to have influenced subject choices. However, many parents do not fully understand the NCEA system, thereby making it difficult to make the right choices (Meyer et al., 2006; Madjar et al., 2009). Information
42 http://www.educationcounts.govt.nz/indicators/education_and_learning_outcomes/qualifications/1891
2004 2005 2006 2007 20080
20
40
60
80Percent
Asian
European
Mäori
Pacificpeoples
Other
Source: New Zealand Qualifications Authority
2004–08
Students who achieved university entrance requirementsthrough NCEA study at year 13
By selected ethnic group
(1)
1. National Certificate of Educational Achievement2. Prioritised in the order of Mäori, Pacific peoples, Asian, and European ethnic groups.
(2)
45
from schools is often very confusing and insufficient to enable parents to feel confident about making informed decisions (Madjar et al., 2009).
Many Pacific parents think it is enough for their children to be going to school and working hard, and do not understand the significance of subject choices (Madjar et al., 2009). Ultimately, subject choices are decided by school management and deans. Much of the advice from deans strongly guides certain types of students to certain types of subjects (Hipkins et al., 2005). Although appropriate in some cases, these decisions may also close off learning opportunities.
“When I was year 10... I wanted to go to university but I didn’t have the right qualifications coz of the subjects I took and other things, getting put in the wrong classes cause of what the deans had to say and all that. Cause that year, year 10, year 11, when I was doing ... unit standards for maths, I’d fly through the class. It was ... real easy for me.... and they (teachers) still didn’t do anything about it [put him into a more academic class].”
NZ born Kiribati student quoted in Madjar et al., 2009
A large proportion of parents (30 percent) and students want more guidance in making decisions about subjects in years 9 and 10 before it is too late (Wylie & Hipkins, 2006). Over the last five years, more Pacific people participated in Gateway – a programme designed to help secondary school students experience tertiary education and achieve outcomes such as gaining employment or achieving credits on the National Qualifications Framework. In 2007, 835 males and females took part in a Gateway assignment, compared to 337 males and females in 2003. In 2007, 434 men and 401 women participated. In 2007, 632 Pacific Gateway learners achieved a positive outcome. Twenty-three percent started full-time employment, 1.5 percent started part-time employment, 71 percent continued with further training and the remaining Gateway learners had ‘other’ outcomes.43
What would make the most difference? • Parents understanding how to help children learn.
• Teachers understanding, valuing and building on the experiences and knowledge children come to school with.
• Schools reaching out to engage with parents so they feel valued as partners in their child’s education.
• Teachers of year 1 and 2 children focusing on establishing literacy foundations.
• Schools focusing on the achievement of Pacific children in their monitoring and planning.
• Teachers understanding that a student being ‘on task’ does not necessarily mean the student is learning.
• Schools focusing on the well-being of new Pacific students and supporting the shift to a new school.
43 http://www.educationcounts.govt.nz/publications/series/36769/36777
46
• Students and parents making informed choices about school subjects that open up further pathways.
Education and Pacific Peoples in New Zealand
47
5 Tertiary education
Ongoing participation and success in tertiary education contributes positively to the well-being of people, their families and communities and New Zealand as a whole. Tertiary education ranges from foundation education and training, which provides a bridge into further education and training or work, through to doctoral studies. It includes formal learning that happens at work as well as at tertiary education organisations.44 Data snapshot
The 2006 ALLS study showed that the overall literacy and numeracy of the adult Pacific population was lower than that of other ethnic groups.
In April 2009, both domestic and international Pacific students’ participation in tertiary education increased more than any other ethnic group from the previous year.
Pacific peoples are 7 percent of all industry trainees compared with 4 percent of the workforce.
Between 2002 and 2008, the number of under-25-year-old Pacific students studying at diploma level or above increased by 11 percent.
At both diploma and degree-level, 18–19-year-old Pacific students are less likely to complete a qualification than students from other ethnic groups.
At masters level, the number of Pacific students increased by 4.0 percent between 2006 and 2007, and again by 4 percent to 2008.
Benefits of tertiary education Higher education is closely linked to income and general well-being, as well as labour productivity (Earle, 2009; Callister & Didham, 2008). At an individual level, people with higher-level tertiary qualifications show a significant earnings advantage over those with a lower-level qualification or no qualification.45 Having a tertiary qualification increases average incomes and also increases the range of income that it is possible to earn (Earle, 2009).
The gap between the average income for people with no educational qualifications and those with either a secondary school qualification or a post-secondary qualification has increased over the last 25 or so years (Cotterell et al., 2008).
People with English as an additional language face barriers to employment and higher incomes, over and above those related to English-based literacy and numeracy and qualifications (Earle, 2009a).
44 Tertiary education organisations include universities, wānānga, Institutes of Technology and Polytechnics, adult and community providers, and Private Training Establishments.
45 Profile and Trends 2007.
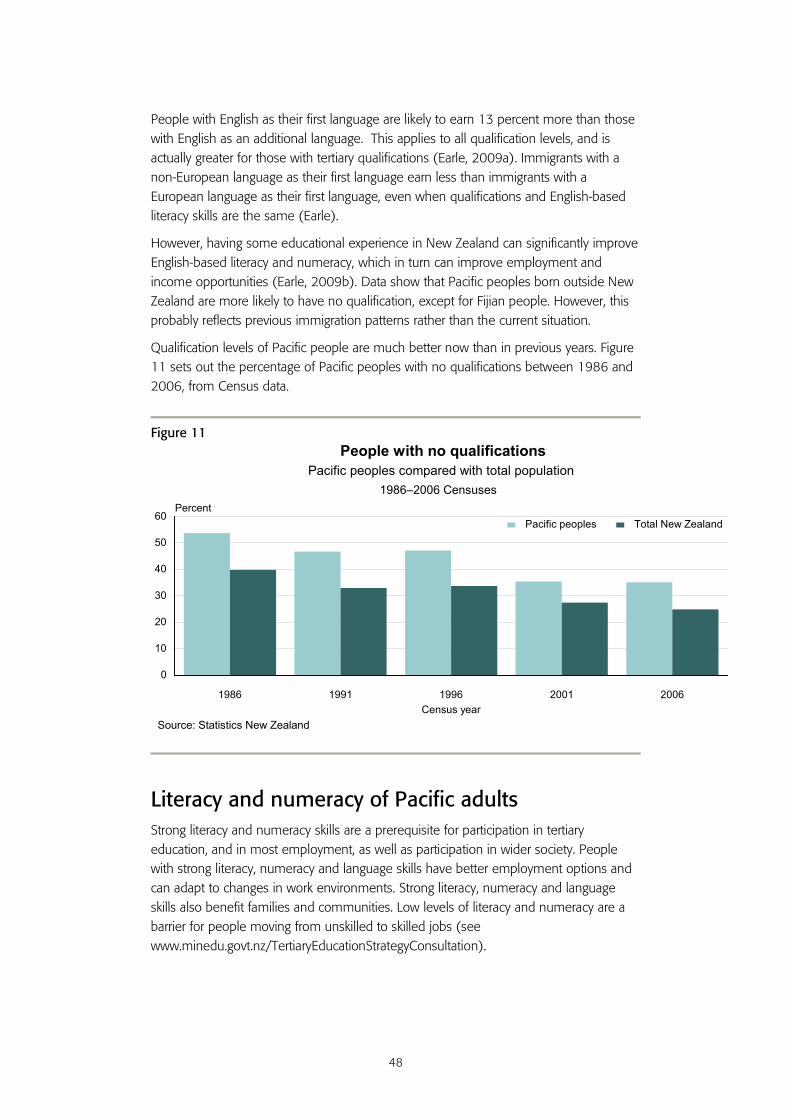
48
People with English as their first language are likely to earn 13 percent more than those with English as an additional language. This applies to all qualification levels, and is actually greater for those with tertiary qualifications (Earle, 2009a). Immigrants with a non-European language as their first language earn less than immigrants with a European language as their first language, even when qualifications and English-based literacy skills are the same (Earle).
However, having some educational experience in New Zealand can significantly improve English-based literacy and numeracy, which in turn can improve employment and income opportunities (Earle, 2009b). Data show that Pacific peoples born outside New Zealand are more likely to have no qualification, except for Fijian people. However, this probably reflects previous immigration patterns rather than the current situation.
Qualification levels of Pacific people are much better now than in previous years. Figure 11 sets out the percentage of Pacific peoples with no qualifications between 1986 and 2006, from Census data.
Figure 11
Literacy and numeracy of Pacific adults Strong literacy and numeracy skills are a prerequisite for participation in tertiary education, and in most employment, as well as participation in wider society. People with strong literacy, numeracy and language skills have better employment options and can adapt to changes in work environments. Strong literacy, numeracy and language skills also benefit families and communities. Low levels of literacy and numeracy are a barrier for people moving from unskilled to skilled jobs (see www.minedu.govt.nz/TertiaryEducationStrategyConsultation).
1986 1991 1996 2001 2006
0
10
20
30
40
50
60Percent
Census year
Pacific peoples Total New Zealand
People with no qualifications
1986–2006 Censuses
Source: Statistics New Zealand
Pacific peoples compared with total population
49
In the international Adult Literacy and Life Skills Survey 2006 (ALLS), the overall literacy and numeracy of the adult Pacific population was lower than that of other ethnic groups. 46 Within the Pacific population, those who had English as an additional language had lower literacy and numeracy in English.47 These differences occur at all educational levels and are greater for people who have a non-European language as their first language and/or immigrated to New Zealand as an adult (Earle, 2009). (See http://www.educationcounts.govt.nz/publications/tertiary_education/4226).
Since 1996, the overall literacy skills of European, Mäori and Asian adults rose or remained relatively stable. However, those of Pacific peoples decreased or were unchanged. The 2006 ALLS showed that:
• in all four skill domains (prose literacy, document literacy, numeracy, and problem solving skills) for all the age groups, between 62 and 95 percent of Pacific adults had the lowest levels of skills (level 1 or 2)48
• in all four skill domains, Pacific adults aged 25 to 34 in 2006 had substantially higher skills than both younger and older Pacific adults
• prose literacy skill for Pacific 16–24-year-olds appeared to decrease from 1996 to 2006. However, assessment of the significance of the decline is difficult as the number of Pacific respondents in the IALS survey was relatively small.49
There are some significant differences between Pacific men and women. Across all areas of the ALLS study, Pacific women had slightly higher skills than Pacific men. The percentage of Pacific men and women with average or higher-level prose literacy (levels 3–5) appeared to decrease substantially from 1996 to 2006.
The percentage of Pacific men with average or higher-level document literacy appeared to decrease substantially from 1996 to 2006, but for Pacific women, there appears to have been an increase.50
In terms of the main language spoken at home, the average literacy score for those who usually spoke English at home was higher than that for those who spoke another language. This difference was most marked for Cook Island and Samoan adults.51
Overall, Pacific adults who had spent more time in formal education tended to have higher literacy skills.52
Pacific people identified literacy, numeracy, and language as critical in NZQA’s consultation on its Pacific Strategy. People wanted:
• more qualifications for Pacific languages
46 Adult Literacy and Life Skills Survey assessed the literacy and numeracy of adults across participating countries. See http://www.educationcounts.govt.nz/publications/assessment/29875/6
47 http://www.educationcounts.govt.nz/publications/series/tes/51475/4
48 Skill levels are from level 1 (very low) to level 5(very high)
49 http://www.educationcounts.govt.nz/publications/series/ALL/54836/3
50 http://www.educationcounts.govt.nz/publications/series/ALL/54836/4
51 http://www.educationcounts.govt.nz/publications/series/ALL/54836/11
52 http://www.educationcounts.govt.nz/publications/series/ALL/54837/1
50
• barriers to learning removed through flexible learning in Pacific languages
• more focus on literacy and numeracy, with English and maths compulsory at higher levels so learners do not limit their options by having the option to drop those subjects
• more literacy and numeracy embedded in other subjects
• unit and achievement standards based on cultural values (NZQA, 2008).
People who have not achieved essential literacy and numeracy skills at school can access support for these skills through government-supported literacy programmes in the workplace and through industry training, and also directly from some tertiary education organisations. There is significant demand for industry-specific and work-based literacy and English language learning opportunities (TEC, 2008). (See http://www.tec.govt.nz/upload/downloads/esol-national-gaps-priorities.pdf).
In 2008, 6.6 percent of Pacific students were participating in foundation level courses (levels 1–3) compared with 4.9 percent of all students.53
Pacific participation in tertiary education In April 2009, both domestic and international Pacific students’ participation in tertiary education increased from the previous year more than that of any other ethnic group. The increase in the number of domestic enrolments by Pacific men was 14 percent and by Pacific women 12 percent (Wensvoort, 2009). In 2008, there were 1,687 international Pacific enrolments, up from the previous year. From 2005 to 2006, international Pacific enrolments increased by 19 percent, but before this they had declined for three consecutive years.54
Pacific peoples represent 12.1 percent of the population between 18 and 24 years. A higher proportion of Pacific people are participating in tertiary education than the general population, with the exception of Mäori.
53 http://www.educationcounts.govt.nz/publications/series/36769?a=973
54 http://www.educationcounts.govt.nz/publications/series/36769/36777
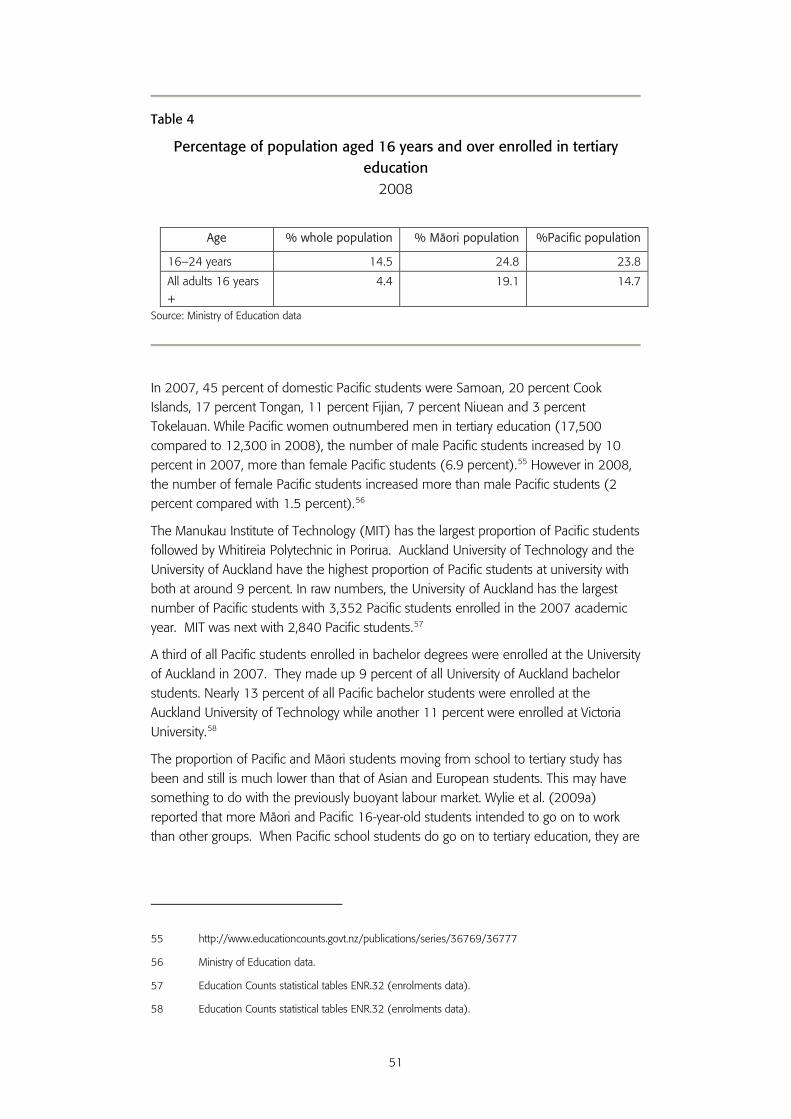
51
Table 4
Percentage of population aged 16 years and over enrolled in tertiary education
2008
Age % whole population % Mäori population %Pacific population
16–24 years 14.5 24.8 23.8 All adults 16 years +
4.4 19.1 14.7
Source: Ministry of Education data
In 2007, 45 percent of domestic Pacific students were Samoan, 20 percent Cook Islands, 17 percent Tongan, 11 percent Fijian, 7 percent Niuean and 3 percent Tokelauan. While Pacific women outnumbered men in tertiary education (17,500 compared to 12,300 in 2008), the number of male Pacific students increased by 10 percent in 2007, more than female Pacific students (6.9 percent).55 However in 2008, the number of female Pacific students increased more than male Pacific students (2 percent compared with 1.5 percent).56
The Manukau Institute of Technology (MIT) has the largest proportion of Pacific students followed by Whitireia Polytechnic in Porirua. Auckland University of Technology and the University of Auckland have the highest proportion of Pacific students at university with both at around 9 percent. In raw numbers, the University of Auckland has the largest number of Pacific students with 3,352 Pacific students enrolled in the 2007 academic year. MIT was next with 2,840 Pacific students.57
A third of all Pacific students enrolled in bachelor degrees were enrolled at the University of Auckland in 2007. They made up 9 percent of all University of Auckland bachelor students. Nearly 13 percent of all Pacific bachelor students were enrolled at the Auckland University of Technology while another 11 percent were enrolled at Victoria University.58
The proportion of Pacific and Mäori students moving from school to tertiary study has been and still is much lower than that of Asian and European students. This may have something to do with the previously buoyant labour market. Wylie et al. (2009a) reported that more Mäori and Pacific 16-year-old students intended to go on to work than other groups. When Pacific school students do go on to tertiary education, they are
55 http://www.educationcounts.govt.nz/publications/series/36769/36777
56 Ministry of Education data.
57 Education Counts statistical tables ENR.32 (enrolments data).
58 Education Counts statistical tables ENR.32 (enrolments data).
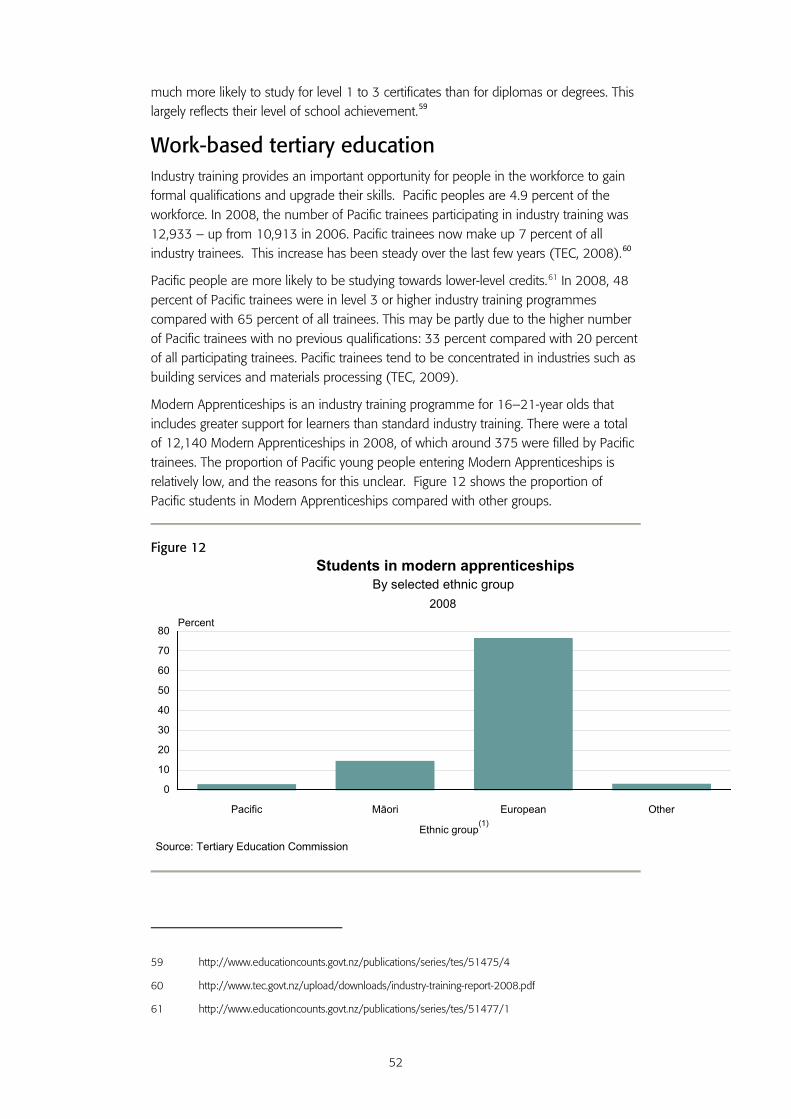
52
much more likely to study for level 1 to 3 certificates than for diplomas or degrees. This largely reflects their level of school achievement.59
Work-based tertiary education Industry training provides an important opportunity for people in the workforce to gain formal qualifications and upgrade their skills. Pacific peoples are 4.9 percent of the workforce. In 2008, the number of Pacific trainees participating in industry training was 12,933 – up from 10,913 in 2006. Pacific trainees now make up 7 percent of all industry trainees. This increase has been steady over the last few years (TEC, 2008).60
Pacific people are more likely to be studying towards lower-level credits.61 In 2008, 48 percent of Pacific trainees were in level 3 or higher industry training programmes compared with 65 percent of all trainees. This may be partly due to the higher number of Pacific trainees with no previous qualifications: 33 percent compared with 20 percent of all participating trainees. Pacific trainees tend to be concentrated in industries such as building services and materials processing (TEC, 2009).
Modern Apprenticeships is an industry training programme for 16–21-year olds that includes greater support for learners than standard industry training. There were a total of 12,140 Modern Apprenticeships in 2008, of which around 375 were filled by Pacific trainees. The proportion of Pacific young people entering Modern Apprenticeships is relatively low, and the reasons for this unclear. Figure 12 shows the proportion of Pacific students in Modern Apprenticeships compared with other groups.
Figure 12
59 http://www.educationcounts.govt.nz/publications/series/tes/51475/4
60 http://www.tec.govt.nz/upload/downloads/industry-training-report-2008.pdf
61 http://www.educationcounts.govt.nz/publications/series/tes/51477/1
Pacific Mäori European Other
0
10
20
30
40
50
60
70
80Percent
Ethnic group(1)
Students in modern apprenticeshipsBy selected ethnic group
Source: Tertiary Education Commission
2008
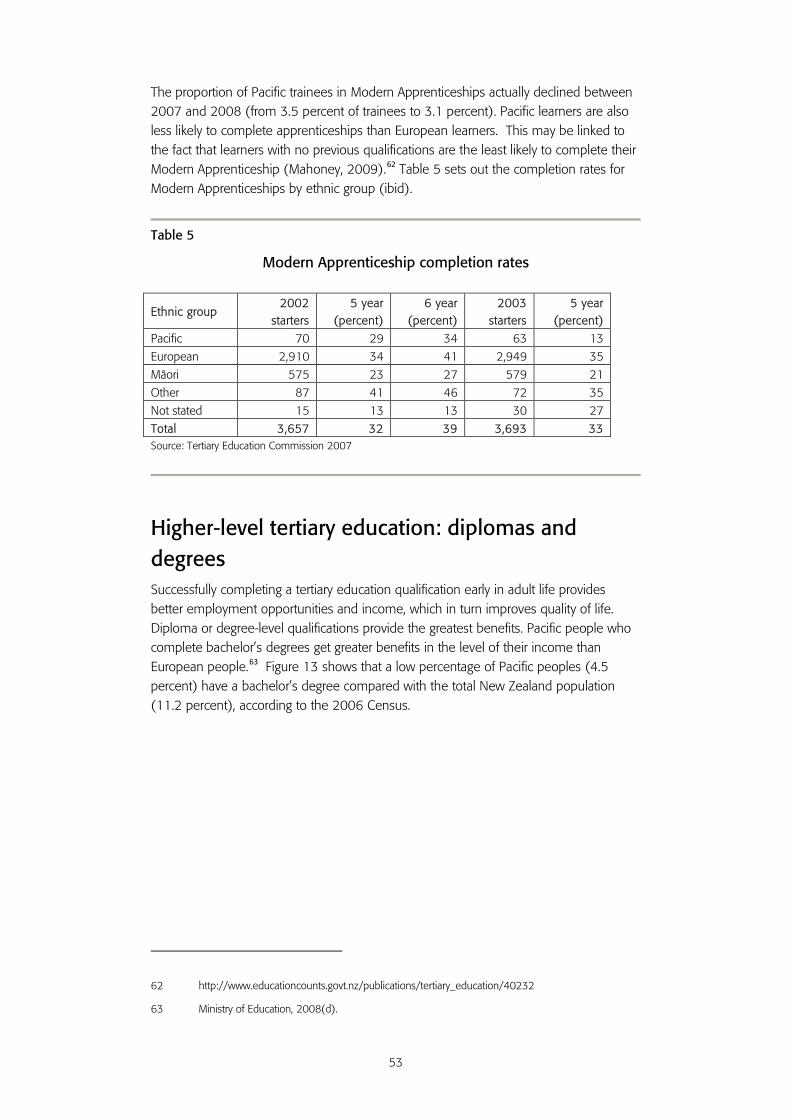
53
The proportion of Pacific trainees in Modern Apprenticeships actually declined between 2007 and 2008 (from 3.5 percent of trainees to 3.1 percent). Pacific learners are also less likely to complete apprenticeships than European learners. This may be linked to the fact that learners with no previous qualifications are the least likely to complete their Modern Apprenticeship (Mahoney, 2009).62 Table 5 sets out the completion rates for Modern Apprenticeships by ethnic group (ibid).
Table 5
Modern Apprenticeship completion rates
Ethnic group 2002
starters 5 year
(percent) 6 year
(percent) 2003
starters 5 year
(percent) Pacific 70 29 34 63 13 European 2,910 34 41 2,949 35 Mäori 575 23 27 579 21 Other 87 41 46 72 35 Not stated 15 13 13 30 27 Total 3,657 32 39 3,693 33 Source: Tertiary Education Commission 2007
Higher-level tertiary education: diplomas and degrees Successfully completing a tertiary education qualification early in adult life provides better employment opportunities and income, which in turn improves quality of life. Diploma or degree-level qualifications provide the greatest benefits. Pacific people who complete bachelor’s degrees get greater benefits in the level of their income than European people.63 Figure 13 shows that a low percentage of Pacific peoples (4.5 percent) have a bachelor’s degree compared with the total New Zealand population (11.2 percent), according to the 2006 Census.
62 http://www.educationcounts.govt.nz/publications/tertiary_education/40232
63 Ministry of Education, 2008(d).
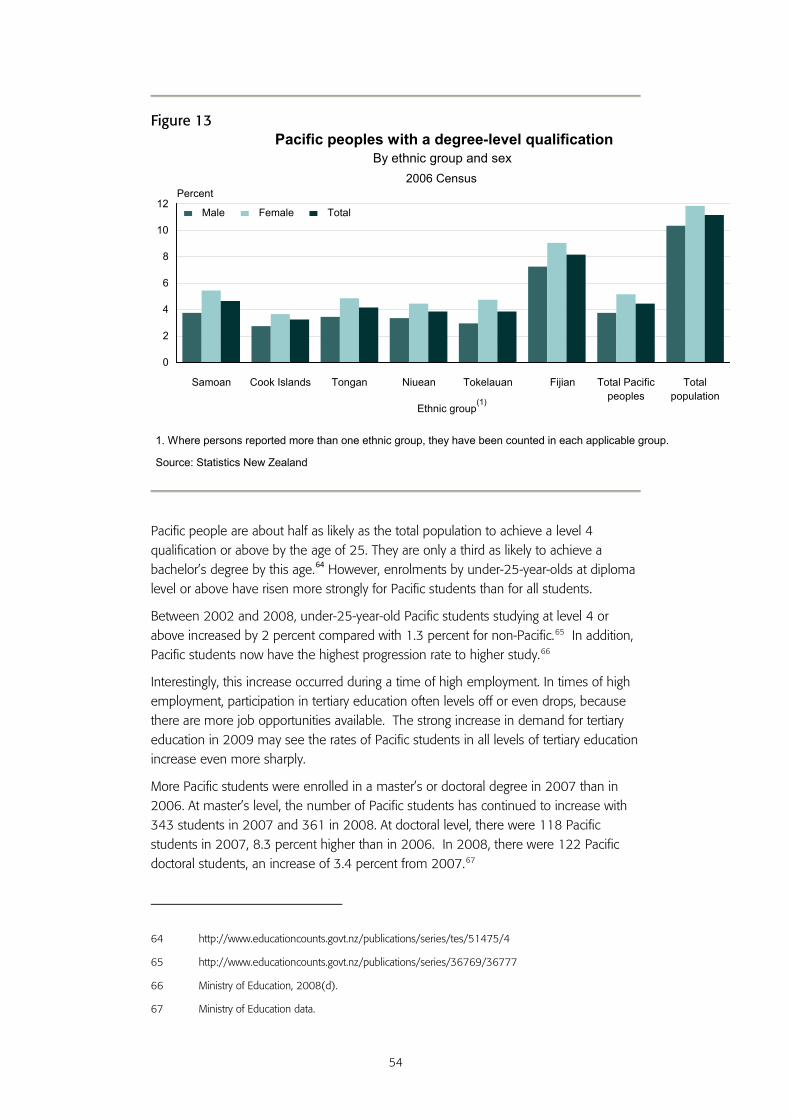
54
Figure 13
Pacific people are about half as likely as the total population to achieve a level 4 qualification or above by the age of 25. They are only a third as likely to achieve a bachelor’s degree by this age.64 However, enrolments by under-25-year-olds at diploma level or above have risen more strongly for Pacific students than for all students.
Between 2002 and 2008, under-25-year-old Pacific students studying at level 4 or above increased by 2 percent compared with 1.3 percent for non-Pacific.65 In addition, Pacific students now have the highest progression rate to higher study.66
Interestingly, this increase occurred during a time of high employment. In times of high employment, participation in tertiary education often levels off or even drops, because there are more job opportunities available. The strong increase in demand for tertiary education in 2009 may see the rates of Pacific students in all levels of tertiary education increase even more sharply.
More Pacific students were enrolled in a master’s or doctoral degree in 2007 than in 2006. At master’s level, the number of Pacific students has continued to increase with 343 students in 2007 and 361 in 2008. At doctoral level, there were 118 Pacific students in 2007, 8.3 percent higher than in 2006. In 2008, there were 122 Pacific doctoral students, an increase of 3.4 percent from 2007.67
64 http://www.educationcounts.govt.nz/publications/series/tes/51475/4
65 http://www.educationcounts.govt.nz/publications/series/36769/36777
66 Ministry of Education, 2008(d).
67 Ministry of Education data.
Samoan Cook Islands Tongan Niuean Tokelauan Fijian Total Pacific peoples
Total population
0
2
4
6
8
10
12Percent
Ethnic group(1)
Male Female Total
Pacific peoples with a degree-level qualification
2006 Census
By ethnic group and sex
1. Where persons reported more than one ethnic group, they have been counted in each applicable group.
Source: Statistics New Zealand
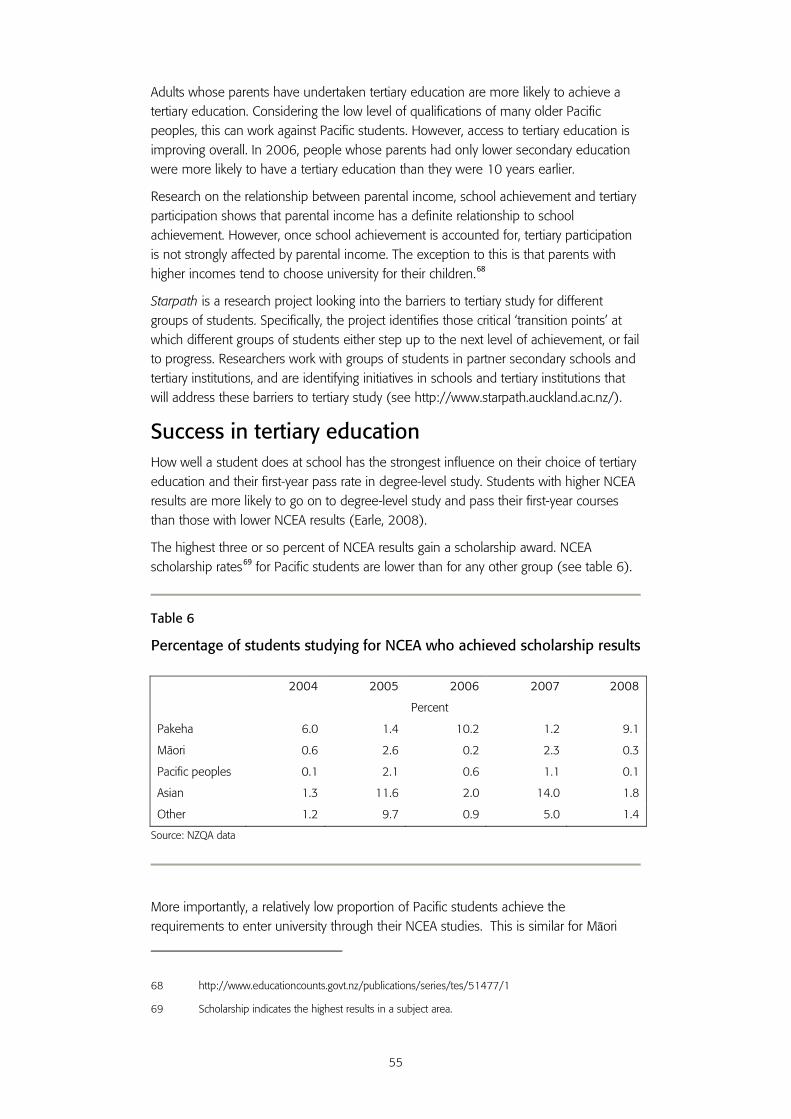
55
Adults whose parents have undertaken tertiary education are more likely to achieve a tertiary education. Considering the low level of qualifications of many older Pacific peoples, this can work against Pacific students. However, access to tertiary education is improving overall. In 2006, people whose parents had only lower secondary education were more likely to have a tertiary education than they were 10 years earlier.
Research on the relationship between parental income, school achievement and tertiary participation shows that parental income has a definite relationship to school achievement. However, once school achievement is accounted for, tertiary participation is not strongly affected by parental income. The exception to this is that parents with higher incomes tend to choose university for their children.68
Starpath is a research project looking into the barriers to tertiary study for different groups of students. Specifically, the project identifies those critical ‘transition points’ at which different groups of students either step up to the next level of achievement, or fail to progress. Researchers work with groups of students in partner secondary schools and tertiary institutions, and are identifying initiatives in schools and tertiary institutions that will address these barriers to tertiary study (see http://www.starpath.auckland.ac.nz/).
Success in tertiary education How well a student does at school has the strongest influence on their choice of tertiary education and their first-year pass rate in degree-level study. Students with higher NCEA results are more likely to go on to degree-level study and pass their first-year courses than those with lower NCEA results (Earle, 2008).
The highest three or so percent of NCEA results gain a scholarship award. NCEA scholarship rates69 for Pacific students are lower than for any other group (see table 6).
Table 6
Percentage of students studying for NCEA who achieved scholarship results
2004 2005 2006 2007 2008
Percent
Pakeha 6.0 1.4 10.2 1.2 9.1
Mäori 0.6 2.6 0.2 2.3 0.3
Pacific peoples 0.1 2.1 0.6 1.1 0.1
Asian 1.3 11.6 2.0 14.0 1.8
Other 1.2 9.7 0.9 5.0 1.4 Source: NZQA data
More importantly, a relatively low proportion of Pacific students achieve the requirements to enter university through their NCEA studies. This is similar for Māori
68 http://www.educationcounts.govt.nz/publications/series/tes/51477/1
69 Scholarship indicates the highest results in a subject area.
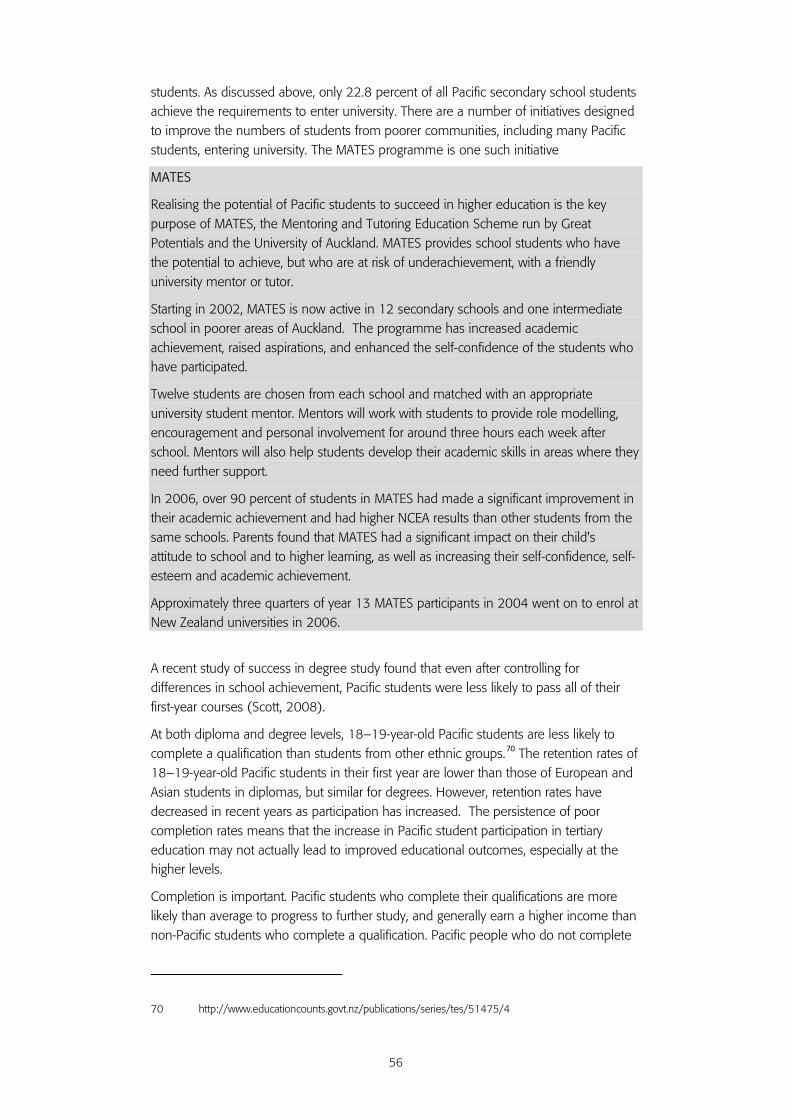
56
students. As discussed above, only 22.8 percent of all Pacific secondary school students achieve the requirements to enter university. There are a number of initiatives designed to improve the numbers of students from poorer communities, including many Pacific students, entering university. The MATES programme is one such initiative
MATES
Realising the potential of Pacific students to succeed in higher education is the key purpose of MATES, the Mentoring and Tutoring Education Scheme run by Great Potentials and the University of Auckland. MATES provides school students who have the potential to achieve, but who are at risk of underachievement, with a friendly university mentor or tutor.
Starting in 2002, MATES is now active in 12 secondary schools and one intermediate school in poorer areas of Auckland. The programme has increased academic achievement, raised aspirations, and enhanced the self-confidence of the students who have participated.
Twelve students are chosen from each school and matched with an appropriate university student mentor. Mentors will work with students to provide role modelling, encouragement and personal involvement for around three hours each week after school. Mentors will also help students develop their academic skills in areas where they need further support.
In 2006, over 90 percent of students in MATES had made a significant improvement in their academic achievement and had higher NCEA results than other students from the same schools. Parents found that MATES had a significant impact on their child's attitude to school and to higher learning, as well as increasing their self-confidence, self-esteem and academic achievement.
Approximately three quarters of year 13 MATES participants in 2004 went on to enrol at New Zealand universities in 2006.
A recent study of success in degree study found that even after controlling for differences in school achievement, Pacific students were less likely to pass all of their first-year courses (Scott, 2008).
At both diploma and degree levels, 18–19-year-old Pacific students are less likely to complete a qualification than students from other ethnic groups.70 The retention rates of 18–19-year-old Pacific students in their first year are lower than those of European and Asian students in diplomas, but similar for degrees. However, retention rates have decreased in recent years as participation has increased. The persistence of poor completion rates means that the increase in Pacific student participation in tertiary education may not actually lead to improved educational outcomes, especially at the higher levels.
Completion is important. Pacific students who complete their qualifications are more likely than average to progress to further study, and generally earn a higher income than non-Pacific students who complete a qualification. Pacific people who do not complete
70 http://www.educationcounts.govt.nz/publications/series/tes/51475/4
57
degrees on average earn a lower income than non-Pacific people who do not complete them.71
It is, therefore, important to understand the reasons why Pacific students are more likely not to complete qualifications. Key factors that affect learning outcomes in tertiary education can be grouped into:
• home or community factors: such as competing demands from family, church, or work
• institution factors: such as the availability of learning support services; teaching practices and relationships; and the place of Pacific knowledge and experience within courses. (Coxon et al., 2002)
The need for more flexible study options, for example, to fit better with family responsibilities, was a key theme emerging from the discussions at the Pacific Jobs Fono in February 2009. Wider policy settings also influence outcomes, for example financial support. Pacific students have lower-than-average student loans, potentially related to the higher propensity to drop out.
A literature search found that the key barriers to retention ranged from personal attitudes and a lack of motivation, to financial pressures and the learning environment. Overall, ‘integration’ was the most common barrier discussed (Ministry of Pacific Island Affairs, draft 2009). Integration includes:
• feelings of social and academic isolation
• no feeling of belonging
• a lack of involvement in the academic and social spheres of campus
• no ‘critical mass’ of students from similar backgrounds (ethnic and/or socio-economic)
• a lack of diversity (ethnic and/or socio-economic)
• a lack of student networks, both with other students and with campus staff.
The literature search also identified that the quality of teaching was the most frequently discussed way of improving retention. This was closely followed by a supportive learning environment, assisted transitions to tertiary education, and student support services. Quality teaching includes:
• teachers that are dynamic, innovative and interactive, have high expectations and use a variety of teaching methods to cater for different learning styles
• culturally inclusive classes that link the cultures and backgrounds of students to the topic of discussion
• smaller groups to make learning and asking questions easier, with a closer teacher-student relationship
• professional development for teachers to improve their teaching skills and ability to work effectively with diverse students. (Ministry of Pacific Island Affairs, draft 2009).
71 Current Trends & Economic Status of Pacific Peoples, Ministry of Pacific Island Affairs .
58
A significant number of Pacific students choose to attend private Pacific tertiary education providers72 which provide a smaller, more supportive learning environment. Of the students attending private training establishments (PTEs) in 2008, 12.5 percent were Pacific students (compared with 5.9 percent in universities or polytechnics). European students were 53 percent of the students attending PTEs, and around 70 percent of those in universities and polytechnics.73
Looking at five-year completion rates, 49 percent of Pacific students complete their qualifications in PTEs compared with an average completion rate of 34 percent for Pacific students across the rest of the sector. Completion rates for Pacific students five years after enrolling are far higher for PTEs than for other providers (44 percent compared with 30–33 percent for other providers) (Tertiary Education Commission, 2009).
A New Zealand study of tertiary education in PTEs has found that some things are particularly important for supporting the success of Pacific students (Marshall et al., 2008). These include:
• the use of an holistic approach
• meeting learners at a location that suits them
• the use of celebration, fun, and humour
• a family atmosphere that encourages and accepts Pacific learners. (Marshall et al., 2008).
Having Pacific staff as lecturers and support staff can affect the learning outcomes of Pacific students in tertiary education (eg, Coxon et al., 2002). Auckland University has 2.3 percent Pacific staff and Auckland University of Technology has 3.1 percent.
In 2006, there were more Pacific academic staff (46 percent) than other staff in the third-highest income group for academic staff ($50,001 to $70,000 per year). While there were no Pacific academics in the highest income group in higher education, Pacific academics were also the smallest proportion in the lowest income group (Tertiary Sector Performance Analysis and Reporting, 2008a).
Community links The tertiary education system also needs to be responsive to the development aspirations of Pacific peoples (see http://www.minedu.govt.nz/theMinistry/ PolicyAndStrategy/TertiaryEducationStrategy.aspx). Building strong connections between tertiary education organisations and communities is one way of achieving improved outcomes.
By 2006, about half of tertiary education organisations reported that they were developing relationships with Pacific communities. However, most of these were focused on attracting more Pacific students and few on understanding and addressing the needs and aspirations of the community. The main Pacific focus for tertiary
72 Private Training Establishments (PTEs).
73 Ministry of Education data.
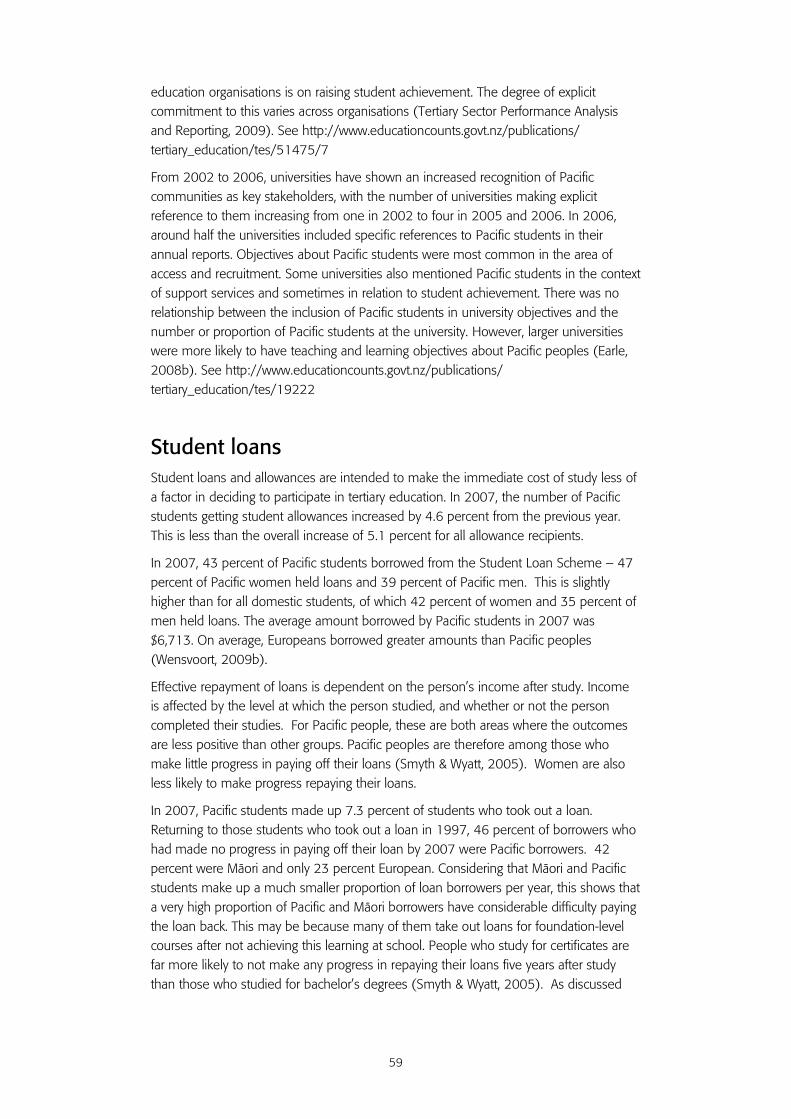
59
education organisations is on raising student achievement. The degree of explicit commitment to this varies across organisations (Tertiary Sector Performance Analysis and Reporting, 2009). See http://www.educationcounts.govt.nz/publications/ tertiary_education/tes/51475/7
From 2002 to 2006, universities have shown an increased recognition of Pacific communities as key stakeholders, with the number of universities making explicit reference to them increasing from one in 2002 to four in 2005 and 2006. In 2006, around half the universities included specific references to Pacific students in their annual reports. Objectives about Pacific students were most common in the area of access and recruitment. Some universities also mentioned Pacific students in the context of support services and sometimes in relation to student achievement. There was no relationship between the inclusion of Pacific students in university objectives and the number or proportion of Pacific students at the university. However, larger universities were more likely to have teaching and learning objectives about Pacific peoples (Earle, 2008b). See http://www.educationcounts.govt.nz/publications/ tertiary_education/tes/19222
Student loans Student loans and allowances are intended to make the immediate cost of study less of a factor in deciding to participate in tertiary education. In 2007, the number of Pacific students getting student allowances increased by 4.6 percent from the previous year. This is less than the overall increase of 5.1 percent for all allowance recipients.
In 2007, 43 percent of Pacific students borrowed from the Student Loan Scheme – 47 percent of Pacific women held loans and 39 percent of Pacific men. This is slightly higher than for all domestic students, of which 42 percent of women and 35 percent of men held loans. The average amount borrowed by Pacific students in 2007 was $6,713. On average, Europeans borrowed greater amounts than Pacific peoples (Wensvoort, 2009b).
Effective repayment of loans is dependent on the person’s income after study. Income is affected by the level at which the person studied, and whether or not the person completed their studies. For Pacific people, these are both areas where the outcomes are less positive than other groups. Pacific peoples are therefore among those who make little progress in paying off their loans (Smyth & Wyatt, 2005). Women are also less likely to make progress repaying their loans.
In 2007, Pacific students made up 7.3 percent of students who took out a loan. Returning to those students who took out a loan in 1997, 46 percent of borrowers who had made no progress in paying off their loan by 2007 were Pacific borrowers. 42 percent were Mäori and only 23 percent European. Considering that Mäori and Pacific students make up a much smaller proportion of loan borrowers per year, this shows that a very high proportion of Pacific and Mäori borrowers have considerable difficulty paying the loan back. This may be because many of them take out loans for foundation-level courses after not achieving this learning at school. People who study for certificates are far more likely to not make any progress in repaying their loans five years after study than those who studied for bachelor’s degrees (Smyth & Wyatt, 2005). As discussed
60
above, lower-level courses have far lower wage benefits than higher-level tertiary education.
The impact on student loans of lower-level study and incomplete study makes it even more critical that the education system supports Pacific people to study and successfully complete degree-level qualifications rather than remain at the certificate level.
What would make the most difference?
• Support for parents and students to make informed choices about subjects at school that open up pathways.
• Schools ensuring that Pacific students’ learning pathways do not stop them from gaining the requirements to enter university.
• Effective teaching that secures literacy foundations before level 1 NCEA.
• Effective teaching that ensures Pacific students achieve NCEA level 3 and university entrance at school.
• Schools and tertiary education organisations working together to support Pacific students to adapt to the tertiary education environment, including providing information and peer support networks.
• TEOs providing learning environments that support Pacific students.
Education and Pacific Peoples in New Zealand
61
6 Conclusion
While education outcomes for Pacific peoples are mostly improving steadily, the education system is still failing to deliver equitable outcomes for Pacific peoples. Lower levels of literacy and numeracy for many Pacific children are not addressed effectively by teachers early on. These lead to poor learning outcomes in secondary school and low levels of qualifications for Pacific young people. Cultural differences are not well understood or supported by many teachers, making their teaching less effective for Pacific students.
For those Pacific students who do succeed at school and go on to achieve degree-level qualifications, the benefits to their income are greater than for non-Pacific people. These benefits extend also to improved well-being of Pacific families and communities, and better educational outcomes for their children and future generations.
Education and Pacific Peoples in New Zealand
62
References
Alton-Lee, A. (2003). Quality Teaching for Diverse Students in Schooling: Best evidence synthesis. Wellington, Ministry of Education.
Artelt, C., Baumert, J., Julius-McElvany, N. & Peschar, J. (2003). Learners for life: Student approaches to learning: Results from PISA 2000. Paris: OECD. Downloaded from http://www.pisa.oecd.org
Auckland UniServices Ltd. (2002). Pathways over the Transition to Schools: Studies in family literacy practices and effective classroom contexts for Mäori and Pacific children. Report to the Ministry of Education. Wellington: Ministry of Education.
Bedford, R. (2008). ‘Pacific Mobility: Pathways, circuits, and challenges in the 21st century’. Bisley, A. (ed). (2008). Pacific Interactions: Pacific in New Zealand: New Zealand in Pacific. Institute of Policy Studies. Victoria University of Wellington.
Bicknell, B. & Hunter, R. (2009). Explorations of Year 6 to Year 7 Transition in Numeracy. Massey University. Downloaded from http://www.nzmaths.co.nz/sites/default/files/Numeracy/References/Comp08/comp08_bicknell_hunter.pdf
Biddulph, F., Biddulph, J., & Biddulph, C. (2003). The Complexity of Community and Family Influences on Children's Achievement in New Zealand: Best evidence synthesis. Wellington: Ministry of Education.
Bishop, R., & Glynn, T. (1999). Culture Counts: Changing power relations in education. Palmerston North: Dunmore Press Ltd.
Bishop, R., Berryman, M., Tiakiwai, S., & Richardson, C. (2003). Te Kotahitanga phase one: the experiences of year nine and 10 Mäori students in mainstream classrooms. Report to the Ministry of Education. Wellington: Ministry of Education.
Brooking, K. & Roberts, J. (2007). Evaluation of the Home-School Partnership: Literacy Programme. Report prepared for Ministry of Education by the New Zealand Council for Educational Research. Wellington: Ministry of Education. Downloaded from http://www.educationcounts.govt.nz/publications/schooling/evaluation_homeschool
Bull, A., Brooking, K. & Campbell, R. (2008). Successful Home-School Partnerships. Report to the Ministry of Education by the New Zealand Council for Educational Research. Wellington: Ministry of Education.
Callister, P. & Didham, R. (2008). ‘Emerging demographics and socioeconomic features of the Pacific population in New Zealand’. In Bisley, A. (ed). (2008). Pacific Interactions: Pacific in New Zealand: New Zealand in Pacific. Institute of Policy Studies. Victoria University of Wellington.
Caygill, R. & Sok, S. (2008). PISA 2006: School context of science achievement: How ready are our 15-year-olds for tomorrow's world? Wellington: Ministry of Education. Downloaded from http://www.educationcounts.govt.nz/publications/series/2543/pisa_2006/31278/8
Caygill, R. (2008). PISA 2006: Student attitudes to and engagement with science: How ready are our 15-year-olds for tomorrow's world? Wellington: Ministry of Education.
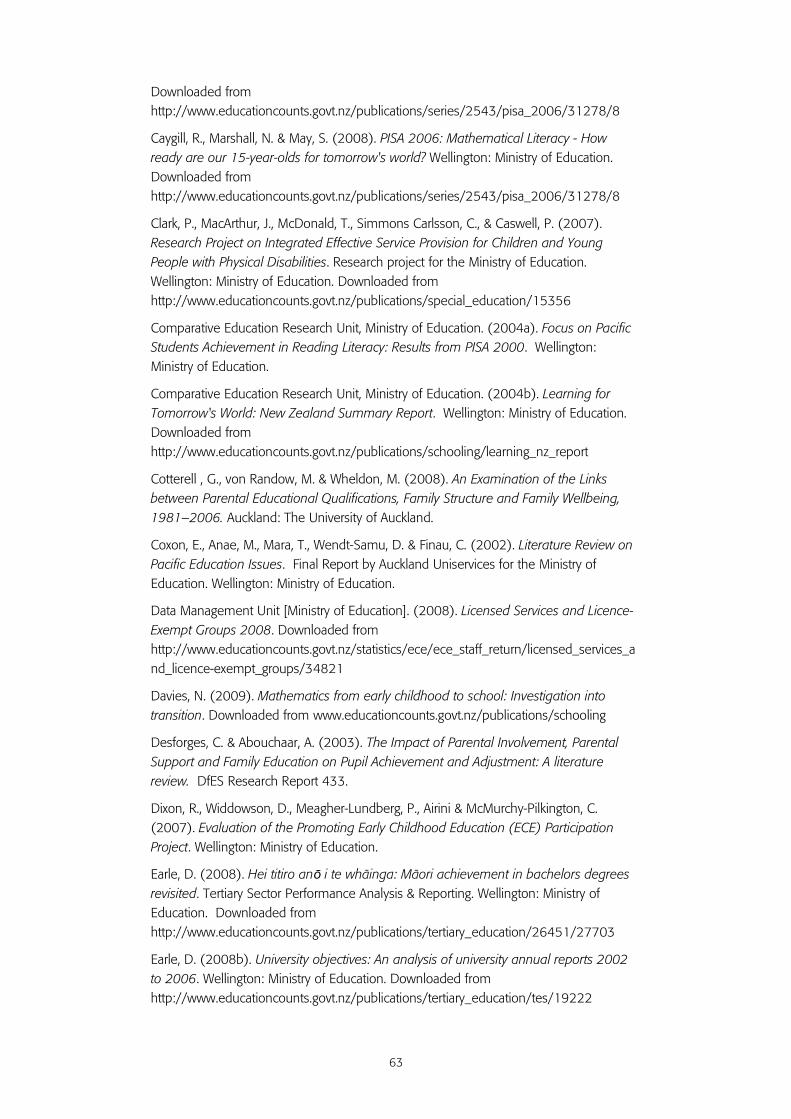
63
Downloaded from http://www.educationcounts.govt.nz/publications/series/2543/pisa_2006/31278/8
Caygill, R., Marshall, N. & May, S. (2008). PISA 2006: Mathematical Literacy - How ready are our 15-year-olds for tomorrow's world? Wellington: Ministry of Education. Downloaded from http://www.educationcounts.govt.nz/publications/series/2543/pisa_2006/31278/8
Clark, P., MacArthur, J., McDonald, T., Simmons Carlsson, C., & Caswell, P. (2007). Research Project on Integrated Effective Service Provision for Children and Young People with Physical Disabilities. Research project for the Ministry of Education. Wellington: Ministry of Education. Downloaded from http://www.educationcounts.govt.nz/publications/special_education/15356
Comparative Education Research Unit, Ministry of Education. (2004a). Focus on Pacific Students Achievement in Reading Literacy: Results from PISA 2000. Wellington: Ministry of Education.
Comparative Education Research Unit, Ministry of Education. (2004b). Learning for Tomorrow's World: New Zealand Summary Report. Wellington: Ministry of Education. Downloaded from http://www.educationcounts.govt.nz/publications/schooling/learning_nz_report
Cotterell , G., von Randow, M. & Wheldon, M. (2008). An Examination of the Links between Parental Educational Qualifications, Family Structure and Family Wellbeing, 1981–2006. Auckland: The University of Auckland.
Coxon, E., Anae, M., Mara, T., Wendt-Samu, D. & Finau, C. (2002). Literature Review on Pacific Education Issues. Final Report by Auckland Uniservices for the Ministry of Education. Wellington: Ministry of Education.
Data Management Unit [Ministry of Education]. (2008). Licensed Services and Licence-Exempt Groups 2008. Downloaded from http://www.educationcounts.govt.nz/statistics/ece/ece_staff_return/licensed_services_and_licence-exempt_groups/34821
Davies, N. (2009). Mathematics from early childhood to school: Investigation into transition. Downloaded from www.educationcounts.govt.nz/publications/schooling
Desforges, C. & Abouchaar, A. (2003). The Impact of Parental Involvement, Parental Support and Family Education on Pupil Achievement and Adjustment: A literature review. DfES Research Report 433.
Dixon, R., Widdowson, D., Meagher-Lundberg, P., Airini & McMurchy-Pilkington, C. (2007). Evaluation of the Promoting Early Childhood Education (ECE) Participation Project. Wellington: Ministry of Education.
Earle, D. (2008). Hei titiro anō i te whäinga: Mäori achievement in bachelors degrees revisited. Tertiary Sector Performance Analysis & Reporting. Wellington: Ministry of Education. Downloaded from http://www.educationcounts.govt.nz/publications/tertiary_education/26451/27703
Earle, D. (2008b). University objectives: An analysis of university annual reports 2002 to 2006. Wellington: Ministry of Education. Downloaded from http://www.educationcounts.govt.nz/publications/tertiary_education/tes/19222
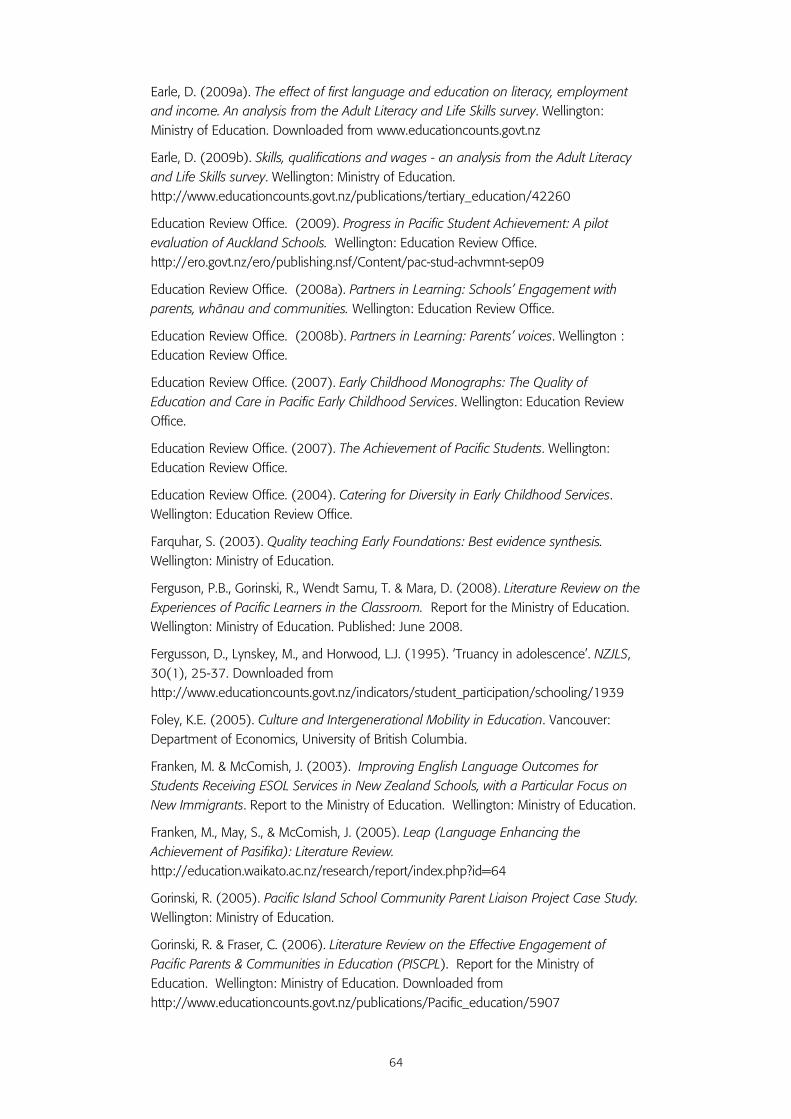
64
Earle, D. (2009a). The effect of first language and education on literacy, employment and income. An analysis from the Adult Literacy and Life Skills survey. Wellington: Ministry of Education. Downloaded from www.educationcounts.govt.nz
Earle, D. (2009b). Skills, qualifications and wages - an analysis from the Adult Literacy and Life Skills survey. Wellington: Ministry of Education. http://www.educationcounts.govt.nz/publications/tertiary_education/42260
Education Review Office. (2009). Progress in Pacific Student Achievement: A pilot evaluation of Auckland Schools. Wellington: Education Review Office. http://ero.govt.nz/ero/publishing.nsf/Content/pac-stud-achvmnt-sep09
Education Review Office. (2008a). Partners in Learning: Schools’ Engagement with parents, whänau and communities. Wellington: Education Review Office.
Education Review Office. (2008b). Partners in Learning: Parents’ voices. Wellington : Education Review Office.
Education Review Office. (2007). Early Childhood Monographs: The Quality of Education and Care in Pacific Early Childhood Services. Wellington: Education Review Office.
Education Review Office. (2007). The Achievement of Pacific Students. Wellington: Education Review Office.
Education Review Office. (2004). Catering for Diversity in Early Childhood Services. Wellington: Education Review Office.
Farquhar, S. (2003). Quality teaching Early Foundations: Best evidence synthesis. Wellington: Ministry of Education.
Ferguson, P.B., Gorinski, R., Wendt Samu, T. & Mara, D. (2008). Literature Review on the Experiences of Pacific Learners in the Classroom. Report for the Ministry of Education. Wellington: Ministry of Education. Published: June 2008.
Fergusson, D., Lynskey, M., and Horwood, L.J. (1995). ‘Truancy in adolescence’. NZJLS, 30(1), 25-37. Downloaded from http://www.educationcounts.govt.nz/indicators/student_participation/schooling/1939
Foley, K.E. (2005). Culture and Intergenerational Mobility in Education. Vancouver: Department of Economics, University of British Columbia.
Franken, M. & McComish, J. (2003). Improving English Language Outcomes for Students Receiving ESOL Services in New Zealand Schools, with a Particular Focus on New Immigrants. Report to the Ministry of Education. Wellington: Ministry of Education.
Franken, M., May, S., & McComish, J. (2005). Leap (Language Enhancing the Achievement of Pasifika): Literature Review. http://education.waikato.ac.nz/research/report/index.php?id=64
Gorinski, R. (2005). Pacific Island School Community Parent Liaison Project Case Study. Wellington: Ministry of Education.
Gorinski, R. & Fraser, C. (2006). Literature Review on the Effective Engagement of Pacific Parents & Communities in Education (PISCPL). Report for the Ministry of Education. Wellington: Ministry of Education. Downloaded from http://www.educationcounts.govt.nz/publications/Pacific_education/5907
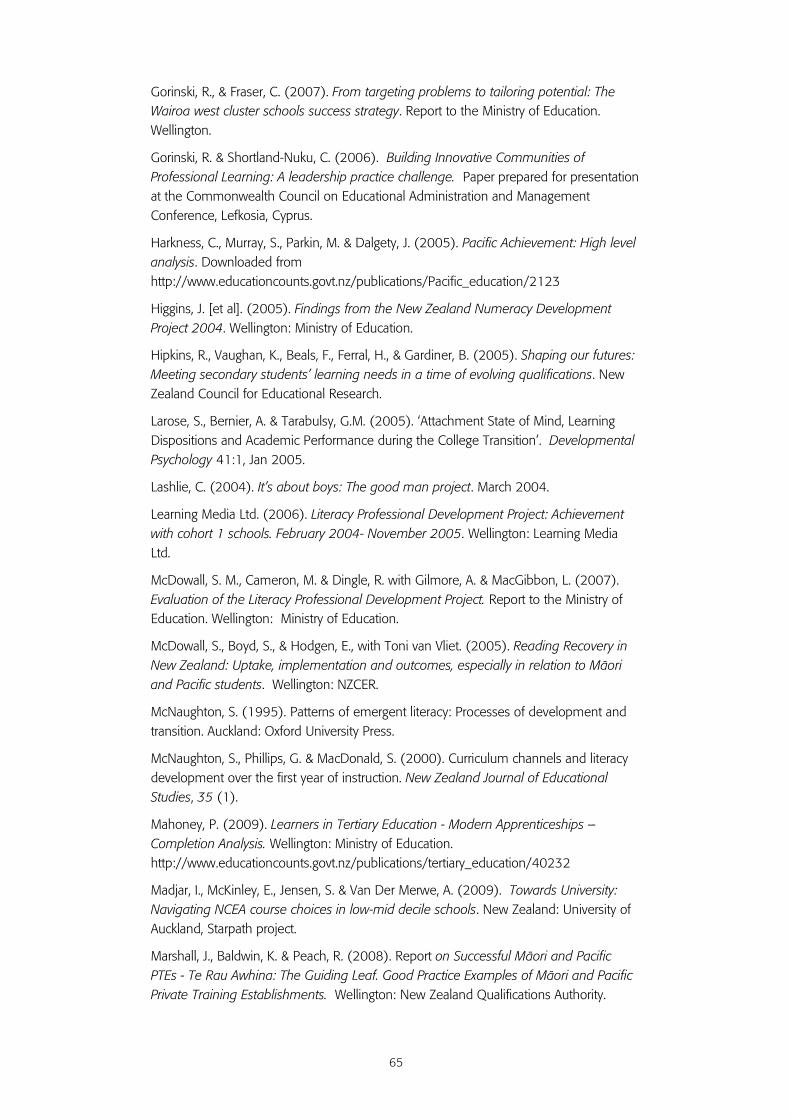
65
Gorinski, R., & Fraser, C. (2007). From targeting problems to tailoring potential: The Wairoa west cluster schools success strategy. Report to the Ministry of Education. Wellington.
Gorinski, R. & Shortland-Nuku, C. (2006). Building Innovative Communities of Professional Learning: A leadership practice challenge. Paper prepared for presentation at the Commonwealth Council on Educational Administration and Management Conference, Lefkosia, Cyprus.
Harkness, C., Murray, S., Parkin, M. & Dalgety, J. (2005). Pacific Achievement: High level analysis. Downloaded from http://www.educationcounts.govt.nz/publications/Pacific_education/2123
Higgins, J. [et al]. (2005). Findings from the New Zealand Numeracy Development Project 2004. Wellington: Ministry of Education.
Hipkins, R., Vaughan, K., Beals, F., Ferral, H., & Gardiner, B. (2005). Shaping our futures: Meeting secondary students’ learning needs in a time of evolving qualifications. New Zealand Council for Educational Research.
Larose, S., Bernier, A. & Tarabulsy, G.M. (2005). ‘Attachment State of Mind, Learning Dispositions and Academic Performance during the College Transition’. Developmental Psychology 41:1, Jan 2005.
Lashlie, C. (2004). It’s about boys: The good man project. March 2004.
Learning Media Ltd. (2006). Literacy Professional Development Project: Achievement with cohort 1 schools. February 2004- November 2005. Wellington: Learning Media Ltd.
McDowall, S. M., Cameron, M. & Dingle, R. with Gilmore, A. & MacGibbon, L. (2007). Evaluation of the Literacy Professional Development Project. Report to the Ministry of Education. Wellington: Ministry of Education.
McDowall, S., Boyd, S., & Hodgen, E., with Toni van Vliet. (2005). Reading Recovery in New Zealand: Uptake, implementation and outcomes, especially in relation to Mäori and Pacific students. Wellington: NZCER.
McNaughton, S. (1995). Patterns of emergent literacy: Processes of development and transition. Auckland: Oxford University Press.
McNaughton, S., Phillips, G. & MacDonald, S. (2000). Curriculum channels and literacy development over the first year of instruction. New Zealand Journal of Educational Studies, 35 (1).
Mahoney, P. (2009). Learners in Tertiary Education - Modern Apprenticeships – Completion Analysis. Wellington: Ministry of Education. http://www.educationcounts.govt.nz/publications/tertiary_education/40232
Madjar, I., McKinley, E., Jensen, S. & Van Der Merwe, A. (2009). Towards University: Navigating NCEA course choices in low-mid decile schools. New Zealand: University of Auckland, Starpath project.
Marshall, J., Baldwin, K. & Peach, R. (2008). Report on Successful Mäori and Pacific PTEs - Te Rau Awhina: The Guiding Leaf. Good Practice Examples of Mäori and Pacific Private Training Establishments. Wellington: New Zealand Qualifications Authority.
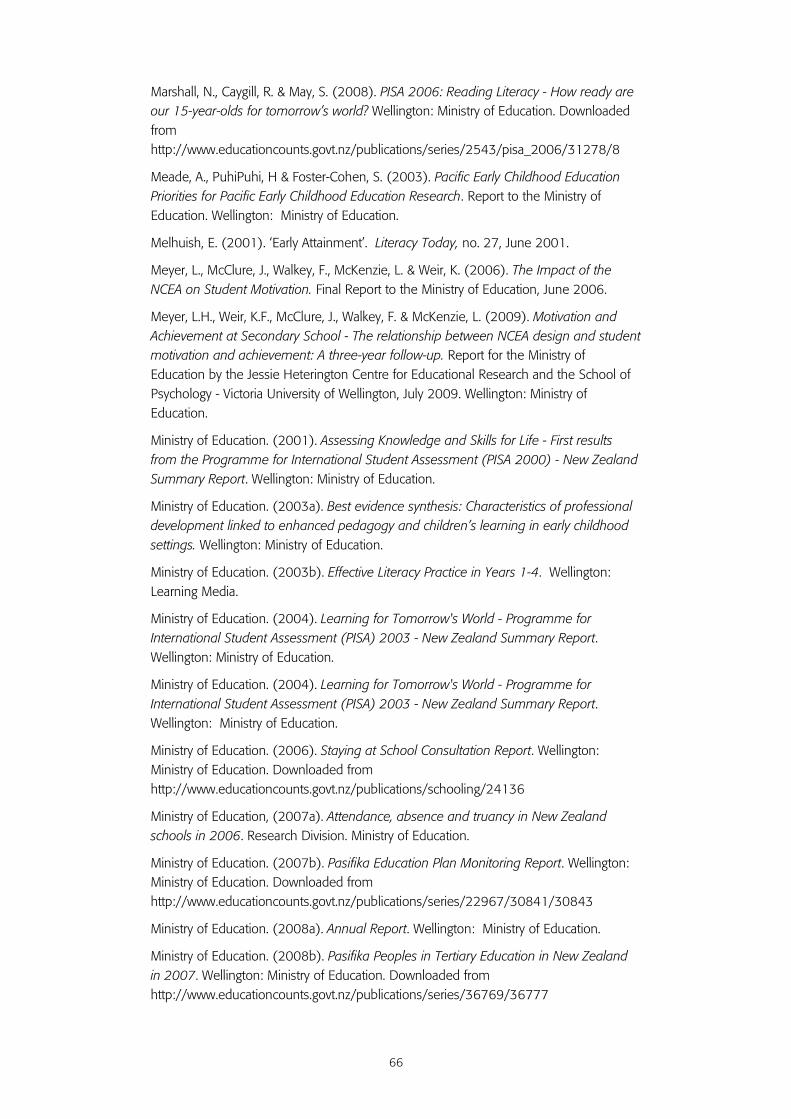
66
Marshall, N., Caygill, R. & May, S. (2008). PISA 2006: Reading Literacy - How ready are our 15-year-olds for tomorrow’s world? Wellington: Ministry of Education. Downloaded from http://www.educationcounts.govt.nz/publications/series/2543/pisa_2006/31278/8
Meade, A., PuhiPuhi, H & Foster-Cohen, S. (2003). Pacific Early Childhood Education Priorities for Pacific Early Childhood Education Research. Report to the Ministry of Education. Wellington: Ministry of Education.
Melhuish, E. (2001). ‘Early Attainment’. Literacy Today, no. 27, June 2001.
Meyer, L., McClure, J., Walkey, F., McKenzie, L. & Weir, K. (2006). The Impact of the NCEA on Student Motivation. Final Report to the Ministry of Education, June 2006.
Meyer, L.H., Weir, K.F., McClure, J., Walkey, F. & McKenzie, L. (2009). Motivation and Achievement at Secondary School - The relationship between NCEA design and student motivation and achievement: A three-year follow-up. Report for the Ministry of Education by the Jessie Heterington Centre for Educational Research and the School of Psychology - Victoria University of Wellington, July 2009. Wellington: Ministry of Education.
Ministry of Education. (2001). Assessing Knowledge and Skills for Life - First results from the Programme for International Student Assessment (PISA 2000) - New Zealand Summary Report. Wellington: Ministry of Education.
Ministry of Education. (2003a). Best evidence synthesis: Characteristics of professional development linked to enhanced pedagogy and children’s learning in early childhood settings. Wellington: Ministry of Education.
Ministry of Education. (2003b). Effective Literacy Practice in Years 1-4. Wellington: Learning Media.
Ministry of Education. (2004). Learning for Tomorrow's World - Programme for International Student Assessment (PISA) 2003 - New Zealand Summary Report. Wellington: Ministry of Education.
Ministry of Education. (2004). Learning for Tomorrow's World - Programme for International Student Assessment (PISA) 2003 - New Zealand Summary Report. Wellington: Ministry of Education.
Ministry of Education. (2006). Staying at School Consultation Report. Wellington: Ministry of Education. Downloaded from http://www.educationcounts.govt.nz/publications/schooling/24136
Ministry of Education, (2007a). Attendance, absence and truancy in New Zealand schools in 2006. Research Division. Ministry of Education.
Ministry of Education. (2007b). Pasifika Education Plan Monitoring Report. Wellington: Ministry of Education. Downloaded from http://www.educationcounts.govt.nz/publications/series/22967/30841/30843
Ministry of Education. (2008a). Annual Report. Wellington: Ministry of Education.
Ministry of Education. (2008b). Pasifika Peoples in Tertiary Education in New Zealand in 2007. Wellington: Ministry of Education. Downloaded from http://www.educationcounts.govt.nz/publications/series/36769/36777
67
Ministry of Education. (2008c). School Roll Summary Report: July 2003 and July 2008. Wellington: Ministry of Education. Downloaded from http://www.educationcounts.govt.nz/statistics/schooling/july_school_roll_returns/6044/32363
Ministry of Education. (2008d). State of Education in New Zealand: 2008. Wellington: Ministry of Education.
Ministry of Education. (2009a). School Trustees who are Pasifika: 2009. Wellington: Ministry of Education. Downloaded from http://www.educationcounts.govt.nz/indicators/indicator_page/schooling/2019
Ministry of Education. (2009b). Annual Report for Year ended 30 June 2009. Wellington: Ministry of Education.
Ministry of Pacific Island Affairs. (2009, draft). Retention of Pacific Students in Tertiary Education - Annotated Bibliography. Wellington: Ministry of Pacific Island Affairs.
Mitchell, L. Wylie, C. & Carr, M. (2008). Outcomes of early childhood education: Literature review. A report by the New Zealand Council for Educational Research for the Ministry of Education. Wellington: Ministry of Education.
National Educational Monitoring Project. (2007). Graphs, tables and maps. Downloaded from http://nemp.otago.ac.nz/graphs_tables/2007/index.htm
National Educational Monitoring Project. (2007). Science. Downloaded from http://nemp.otago.ac.nz/science/2007/index.htm
National Educational Monitoring Project. (2008). Reading and Speaking. Downloaded from http://nemp.otago.ac.nz/read_speak/2008/index.htm
New Zealand Qualifications Authority. (2008). Towards a Pacific Strategy for the New Zealand Qualifications Authority. Summary of consultation feedback. October 2008. Wellington: New Zealand Qualifications Authority.
Ng, L. (2007). A Report on New Zealand Student Engagement, 2006.
Nicholls, H. (2003). Teaching Literacy-Teaching ESOL: Dimensions of difference. Unpublished paper.
Peters, S. (2004). Multiple Perspectives on Continuity in Early Learning and the Transition to School. Paper held by the Ministry of Education. Department of Education Studies, University of Waikato.
Phillips, G., & Smith, P. (1997). A Third Chance to Learn: The development and evaluation of specialised interventions for young children experiencing the greatest difficulty in learning to read. Wellington: NZCER.
Phillips, G., McNaughton, S., & MacDonald, S. (2002). Picking Up the Pace. Report for the Ministry of Education. Wellington: Ministry of Education.
Phillips, G., McNaughton, S., & MacDonald, S. (2004). ‘Managing the mismatch: Enhancing early literacy progress for children with diverse language and cultural identities in mainstream urban schools in New Zealand’. Journal of Educational Psychology, 96 (2), 309-323.
Pressley, M. (2006). Reading Instruction That Works: The case for balanced teaching. Third edition. New York: Guildford Press.
68
Rivers, J. (2005). The Effectiveness of Earlybird. Unpublished paper for the Special Education Services, Ministry of Education. Downloaded from http://www.educationcounts.govt.nz/publications/special_education/4979
Roberts, R. (2006). Self Esteem and Early Learning: Key people from birth to school. Third Edition. London: Paul Chapman Publishing.
Robertson, J. with Gunn, T.R., Lanumata, T., & Pryor, J. (2007). Parent Decision-making in Relation to the Use of Early Childhood Education Services. Report to the Ministry of Education. Wellington: Ministry of Education.
Robinson, V. & Timperley, H. in association with Ward, L., Tuioti, L., Tu'uga Stevenson, V., & Mitchell, S. (2004). Strengthening Education in Mangere and Otara (SEMO). Wellington: Ministry of Education. Downloaded from http://www.educationcounts.govt.nz/publications/schooling/5351
Robinson, V., Hohepa, M. & Lloyd, C. (2009). School Leadership and Student Outcomes: Identifying what works and why. Best Evidence Synthesis Iteration. Wellington: Ministry of Education.
Ringold, D. (2005). Accounting for Diversity: Policy design and Mäori development in Aotearoa New Zealand. Paper from Ian Axford Fellowship in Public Policy downloaded 19 April 2006 from http://www.fulbright.org.nz/voices/axford/ringoldd.html.
Rubie-Davies, C., Hattie, J., & Hamilton, R. (2006). Expecting the best for students: teacher expectations and academic outcomes. British Journal of Educational Psychology, 76, 429-444.
Satherley, P., Lawes, E. & Sok, S. (2008). (Revised version April 2009). The Adult Literacy and Life Skills (ALL) Survey: Education, work and literacy. Wellington: Ministry of Education. Downloaded from http://www.educationcounts.govt.nz/publications/series/ALL/33225/1
Scott, D. (2008). How Does Achievement at School Affect Achievement in Tertiary Education? Wellington: Ministry of Education.
Smyth, R. & Hyatt, J. (2005). Who Doesn’t Pay Back? The characteristics of borrowers who make no progress in reducing their student loans. Wellington: Ministry of Education. Downloaded from http://www.educationcounts.govt.nz/publications/tertiary_education/5699
Snow, C. E., Burns, S. M., & Griffin, P. (Eds.). (1998). Preventing Reading Difficulties in Young Children. Washington, USA: National Academy Press.
Sturrock, F. and May, S. (2002). PISA 2000: The New Zealand Context. Wellington: Ministry of Education.
Tagg, A.; & Thomas, G. (2007). ‘Do they continue to improve? Tracking the progress of a cohort of longitudinal students’. Findings from the New Zealand Numeracy Development Projects 2006. Downloaded from www.educationcounts.govt.nz/publications/schooling.
Telford, M. and Caygill, R. (2007). PISA 2006: How Ready Are Our 15-Year-Olds for Tomorrow’s World? Wellington: Ministry of Education.
Tertiary Education Commission. (2009). Improving Student Results, Tertiary Education Sector Performance, 2008. Wellington: Tertiary Education Commission.
69
Tertiary Education Commission. (2008). Industry Training 2007. Downloaded from http://www.tec.govt.nz/upload/downloads/industry-training-report-2007.pdf
Tertiary Sector Performance Analysis and Reporting, Ministry of Education. (2008a). Profile & Trends 2007: New Zealand's Tertiary Education Sector. Wellington: Ministry of Education. Downloaded from http://www.educationcounts.govt.nz/publications/series/2531/32250/32251/12
Tertiary Sector Performance Analysis and Reporting, Ministry of Education. (2008b). ‘The tertiary education workforce: a census income analysis by gender and ethnic group’. Profile & Trends 2007: New Zealand's Tertiary Education Sector. Wellington: Ministry of Education. Downloaded from http://www.educationcounts.govt.nz/publications/series/2531/32250/32251/12
Tertiary Sector Performance Analysis and Reporting, Ministry of Education. (2009). Tertiary Education Strategy Monitoring. Wellington: Ministry of Education. Downloaded from http://www.educationcounts.govt.nz/publications/tertiary_education/tes/51475/7
Thomas, G. & Tagg, A. (2009). The Numeracy Development Projects’ Longitudinal Study: How did the students perform in Year 7? Wellington: Ministry of Education. Downloaded from www.educationcounts.govt.nz/publications/schooling
Timperley, H., Phillips, G. and Wiseman, J. (2003). The Sustainability of Professional Development in Literacy (parts 1 and 2). Wellington: Ministry of Education.
Timperley, H., & Wiseman, J. (2003). The Sustainability of Professional Development in Literacy: Part 2: School-based factors associated with high student achievement. Wellington: Ministry of Education.
Timperley, H., Wilson, A., Barrar, H. & Fung, I. (2007). Teacher Professional Development and Learning Best Evidence Synthesis. Wellington: Ministry of Education.
Tuck, B., Horgan, L., Franich, C. & Wards, M. (200x)74. School leadership in a school-home partnership: Reading together at St Joseph’s School Otahuhu. Paper by St Joseph’s School Otahuhu with the support of the Iterative Best Evidence Synthesis Programme and the Pacific Schooling Improvement Division of the New Zealand Ministry of Education. Wellington: Ministry of Education. Downloaded from http://www.educationcounts.govt.nz/themes/BES#readingtogether
Tunmer, W.E., Prochnow, J.E., Greaney, K.T., & Chapman, J.W. (2006). What’s Wrong with New Zealand’s National Literacy Strategy? Palmerston North: Massey University.
Tunmer, W.E., Chapman, J., & Prochnow, J.E. (2002). Preventing Negative Matthew Effects in At-Risk Readers: A retrospective study. Final Report - Phase IV June 2002 to the Ministry of Education. Wellington: Ministry of Education.
Tunmer, W.E., Chapman, J., & Prochnow, J.E. (2003). The Structure of Relationships Between Language-Related Factors, Achievement-Related Beliefs, Gender and Beginning Reading Achievement. Final Report – Phase II. Report to the Ministry of Education, Wellington.
74 No date given.
70
Turoa, L., Wolfgramm, E., Tanielu, L., & McNaughton, S. (2004). Pathways over the transition to school: Studies in family literacy practices and effective classroom contexts for Mäori and Pasifika children. Final report to the Ministry of Education.
Ussher, S. (2008). Post-school Choices: How well does academic achievement predict the education choices of school leavers? Wellington: Ministry of Education.
Wensvoort, M. (2009). April 2009 tertiary education enrolments snapshot. Wellington: Ministry of Education. http://www.educationcounts.govt.nz/__data/assets/pdf_file/0019/47440/09-tertiary-enrolmentsv3.pdf
Wensvoort, M. (2009b). Pasifika peoples in tertiary education. Wellington: Ministry of Education. Downloaded from http://www.educationcounts.govt.nz/publications/series/36769
Wylie, C., & Hipkins, R. (2006). Growing independence: Competent students @ 14. Wellington: Research Division, Ministry of Education.
Wylie, C., Thompson, J. & Lythe, C. (2001). Competent Children at 10: Families, Early Education and Schools. Wellington: Ministry of Education and New Zealand Centre for Education Research.
Wylie, C., Thompson, J., Hodgen, E., Ferral, H., Lythe, C. & Fijn, T. (2004). Competent children at 12. Wellington: Ministry of Education and New Zealand Centre for Education Research.
Wylie, C., Ferral, H., Hodgen, E., & Thompson, J. (2006). Competencies at age 14 and competency development for the Competent Children, Competent Learners study sample. Wellington: Ministry of Education and New Zealand Centre for Education Research.
Wylie, C., Hodgen, E., Hipkins, R. & Vaughan, K. (2009a). Competent Learners on the Edge of Adulthood: A summary of key findings from the Competent Learners @ 16 project. Wellington: NZCER.
Wylie, C., Hodgen, E., & Darr, C. (2009b). National Standards Consultation Analysis. Report for the Ministry of Education. Wellington: Ministry of Education.
Young-Loveridge, J. (2007). Patterns of performance and progress on the numeracy development projects: Findings from 2006 for Years 5–9 students. Findings from the New Zealand Numeracy Development Projects 2006. Wellington: Ministry of Education. Downloaded from www.educationcounts.govt.nz/publications/schooling.
Young-Loveridge, J. (2009). Patterns of performance and progress of numeracy development project students: Findings from 2008. Wellington: Ministry of Education. Downloaded from www.educationcounts.govt.nz/publications/schooling