Embed Size (px)
Citation preview
EDUCATION AND LEARNING
Women in NSW Report Series 2016
NSW MINISTRY OF HEALTH
73 Miller Street
NORTH SYDNEY NSW 2060
Tel. (02) 9391 9000
Fax. (02) 9391 9101
TTY. (02) 9391 9900
www.health.nsw.gov.au
Produced by:
Women’s Analytics and Evaluation Team, Centre for Epidemiology and Evidence
This work is copyright. It may be reproduced in whole or in part for study or
training purposes subject to the inclusion of an acknowledgement of the source.
It may not be reproduced for commercial usage or sale. Reproduction for
purposes other than those indicated above requires written permission from
the NSW Ministry of Health.
© NSW Ministry of Health 2016
SHPN (WNSW) 160389
ISSN 2200-6737 (print)
ISSN 2204-3950 (online)
Further copies of this document can be downloaded from
www.women.nsw.gov.au
October 2016
Education and Learning | Women in NSW Report Series 2016 1
The Women in NSW Education and Learning Report 2016 is the first of a series of four themed reports that will be released annually. Moving away from the production of a single annual report, this new approach allows a greater focus on specific topic areas that play an important role in the lives of NSW women.
We are commencing our report series with a focus on Education and Learning, presenting a range of indicators relating to girls’ and women’s experiences with education and learning as they progress through their lives and careers. Education plays a vital role in providing individuals the opportunity to develop and contribute towards a society that values gender equity. This report brings data together from various sources across Government and provides a gender-based approach to highlighting where inequalities exist, and where advancements are being made.
The report commences with a snapshot of early childhood and primary school education. From a young age we see variances between boys and girls in NAPLAN results, with girls consistently outperforming boys in reading, and boys consistently stronger in numeracy. A similar theme is evident as we look at students’ secondary school course enrolments, with girls tending towards English and humanities, in contrast to boys' preferences for maths and sciences. This highlights the ongoing challenge with encouraging women’s participation in science, technology, engineering and mathematics (STEM) subjects, and the long-term impact this has upon their career choices.
More women than men continue to complete secondary school and progress to tertiary education. However, consistent with previous years, we observe more boys entering into apprenticeships and traineeships. The NSW Government continues to support the involvement of women in trades, aiming to improve gender equity and diversity in male-dominated fields of work.
To complete the journey through education, and transition into the workforce, the report presents graduate starting salaries. Women on average continue to earn less than men after completing their degree, however the gender gap in graduate salaries is decreasing. We recognise that education plays a vital role in enabling individuals to establish a pathway into the workforce, a topic which will be explored later in the series in our Work, Financial Security and Leadership Report.
Our report series aims to provide reliable empirical data relating to NSW girls and women that informs our efforts to improve gender equity in NSW. I hope that this report, in its new accessible format, is useful for both policy and action.
Pru Goward MPMinister for Women
MINISTER'S FOREWORD
Education and Learning | Women in NSW Report Series 20162
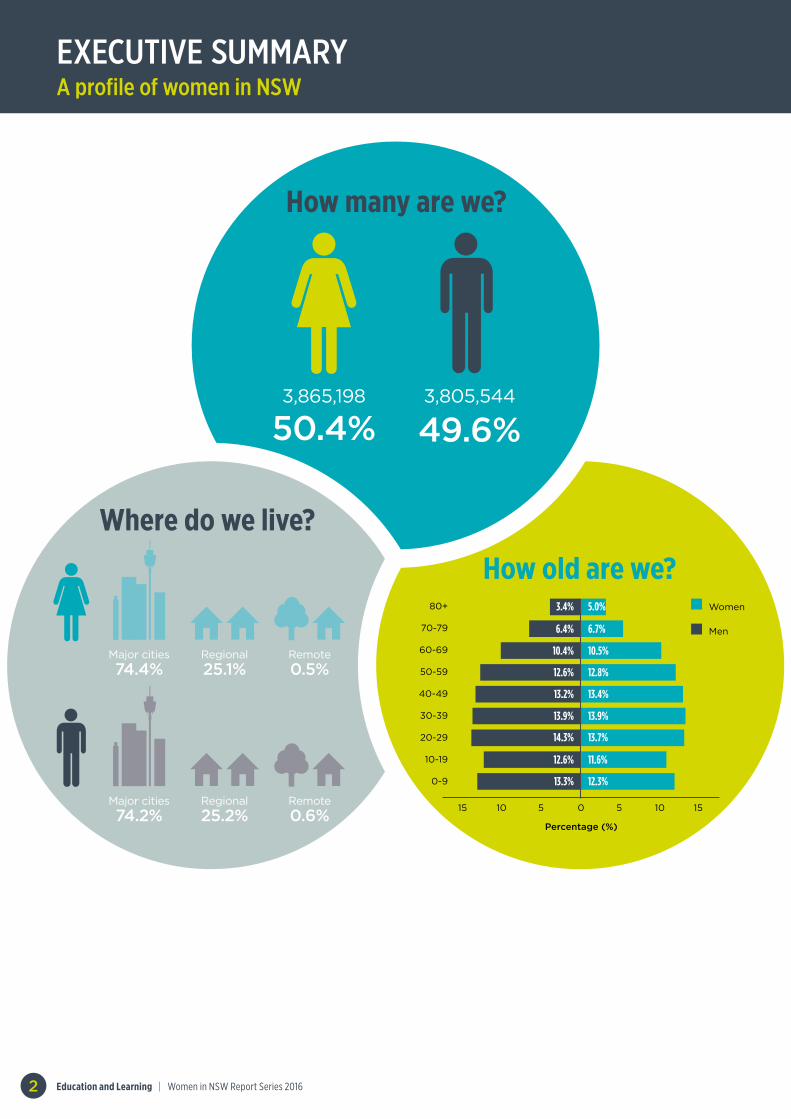
How many are we?
Where do we live?
How old are we?
3,865,198
50.4%3,805,544
49.6%
Major cities 74.4%
Regional 25.1%
Remote 0.5%
Major cities 74.2%
Regional 25.2%
Remote 0.6% 0 5 10 15
0-9
20-29
10-19
60-69
70-79
80+
50-59
40-49
30-39
15 10
3.4% 5.0%
13.3% 12.3%
6.4% 6.7%
10.4% 10.5%
12.6% 12.8%
13.2% 13.4%
13.9% 13.9%
14.3% 13.7%
12.6% 11.6%
5
Percentage (%)
Women
Men
EXECUTIVE SUMMARY A profile of women in NSW
Education and Learning | Women in NSW Report Series 2016 3
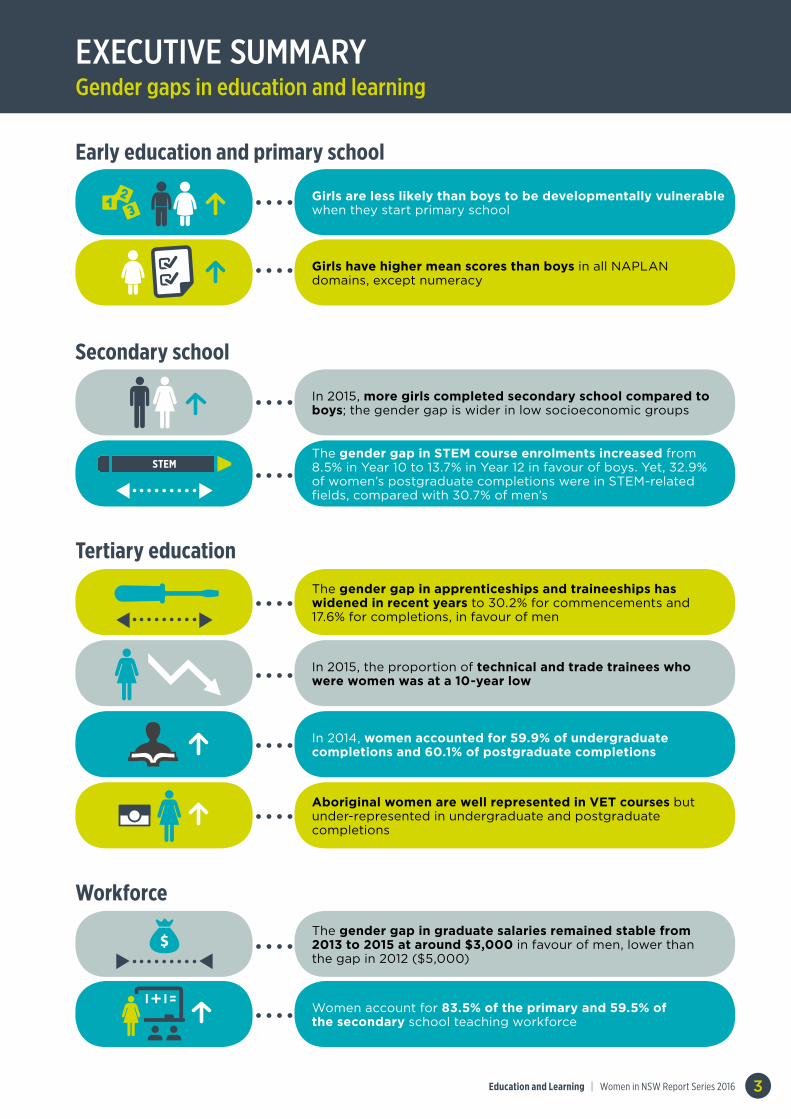
In 2015, more girls completed secondary school compared to boys; the gender gap is wider in low socioeconomic groups
The gender gap in STEM course enrolments increased from 8.5% in Year 10 to 13.7% in Year 12 in favour of boys. Yet, 32.9% of women’s postgraduate completions were in STEM-related fields, compared with 30.7% of men’s
Secondary school
Girls are less likely than boys to be developmentally vulnerable when they start primary school
Girls have higher mean scores than boys in all NAPLAN domains, except numeracy
Early education and primary school
The gender gap in graduate salaries remained stable from 2013 to 2015 at around $3,000 in favour of men, lower than the gap in 2012 ($5,000)
Women account for 83.5% of the primary and 59.5% of the secondary school teaching workforce
Workforce
The gender gap in apprenticeships and traineeships has widened in recent years to 30.2% for commencements and 17.6% for completions, in favour of men
In 2015, the proportion of technical and trade trainees who were women was at a 10-year low
In 2014, women accounted for 59.9% of undergraduate completions and 60.1% of postgraduate completions
Aboriginal women are well represented in VET courses but under-represented in undergraduate and postgraduate completions
Tertiary education
EXECUTIVE SUMMARY Gender gaps in education and learningSW
STEM
Education and Learning | Women in NSW Report Series 20164
1 Australian Children’s Education and Care Quality Authority (2016). Explaining the National Quality Framework. http://www.acecqa.gov.au/national-quality-framework/explaining-the-national-quality-framework Accessed 27/06/2016
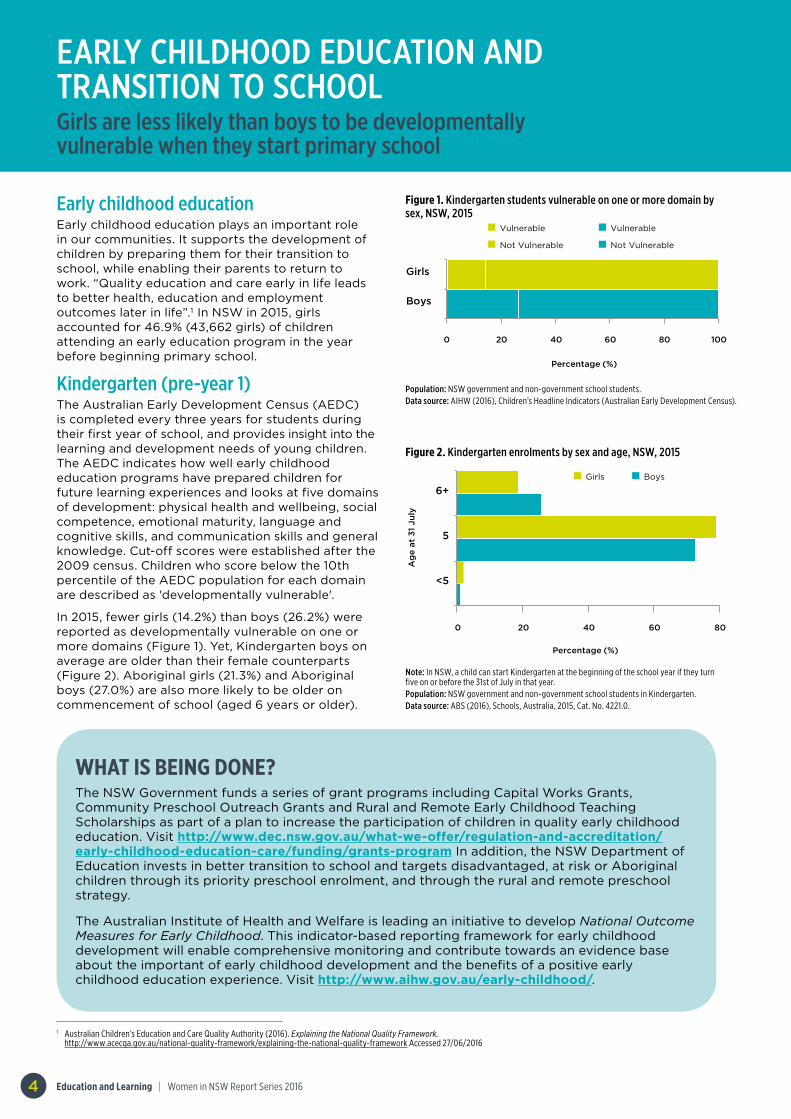
Early childhood educationEarly childhood education plays an important role in our communities. It supports the development of children by preparing them for their transition to school, while enabling their parents to return to work. “Quality education and care early in life leads to better health, education and employment outcomes later in life”.1 In NSW in 2015, girls accounted for 46.9% (43,662 girls) of children attending an early education program in the year before beginning primary school.
Kindergarten (pre-year 1) The Australian Early Development Census (AEDC) is completed every three years for students during their first year of school, and provides insight into the learning and development needs of young children. The AEDC indicates how well early childhood education programs have prepared children for future learning experiences and looks at five domains of development: physical health and wellbeing, social competence, emotional maturity, language and cognitive skills, and communication skills and general knowledge. Cut-off scores were established after the 2009 census. Children who score below the 10th percentile of the AEDC population for each domain are described as 'developmentally vulnerable'.
In 2015, fewer girls (14.2%) than boys (26.2%) were reported as developmentally vulnerable on one or more domains (Figure 1). Yet, Kindergarten boys on average are older than their female counterparts (Figure 2). Aboriginal girls (21.3%) and Aboriginal boys (27.0%) are also more likely to be older on commencement of school (aged 6 years or older).
Figure 2. Kindergarten enrolments by sex and age, NSW, 2015
EARLY CHILDHOOD EDUCATION AND TRANSITION TO SCHOOL Girls are less likely than boys to be developmentally vulnerable when they start primary school
WHAT IS BEING DONE? The NSW Government funds a series of grant programs including Capital Works Grants, Community Preschool Outreach Grants and Rural and Remote Early Childhood Teaching Scholarships as part of a plan to increase the participation of children in quality early childhood education. Visit http://www.dec.nsw.gov.au/what-we-offer/regulation-and-accreditation/early-childhood-education-care/funding/grants-program In addition, the NSW Department of Education invests in better transition to school and targets disadvantaged, at risk or Aboriginal children through its priority preschool enrolment, and through the rural and remote preschool strategy.
The Australian Institute of Health and Welfare is leading an initiative to develop National Outcome Measures for Early Childhood. This indicator-based reporting framework for early childhood development will enable comprehensive monitoring and contribute towards an evidence base about the important of early childhood development and the benefits of a positive early childhood education experience. Visit http://www.aihw.gov.au/early-childhood/.
Figure 1. Kindergarten students vulnerable on one or more domain by sex, NSW, 2015
5
1
2
60
70
80
90
2010 2011 2012 2013 2014 2015
Per
cent
age
(%)
Year
Girls Boys
0
20
40
60
80
100
Girls Boys Girls Boys Girls Boys
Year 10 Year 11 Year 12
Per
cent
age
of
enro
lmen
ts (
%)
Non-STEM
Technology and Applied Studies
Science
Mathematics
7
0 20 40 60 80 100
*Textiles and Design
*Food Technology
Biology
*Agriculture
Mathematics
Chemistry
Senior Science
Financial Services
Earth and Environmental Science
*Design and Technology
*Primary Industries
*Technology and Applied Studies
Physics
*Information Processes and Technology
*Information & Digital Technology
*Industrial Technology
*Automotive
*Software Design and Development
*Engineering Studies
*Metal & Engineering
*Electrotechnology
*Construction
Percentage (%)
6
0 20 40 60 80
<5
5
6+
Ag
e at
31
July
0 20 40 60 80 100
Boys
Girls
Percentage (%)
Percentage (%)
Vulnerable
Not Vulnerable
Vulnerable
BoysGirls
Not Vulnerable
not used
BoysGirls
Population: NSW government and non-government school students.Data source: AIHW (2016), Children’s Headline Indicators (Australian Early Development Census).
Note: In NSW, a child can start Kindergarten at the beginning of the school year if they turn five on or before the 31st of July in that year.Population: NSW government and non-government school students in Kindergarten.Data source: ABS (2016), Schools, Australia, 2015, Cat. No. 4221.0.
5
1
2
60
70
80
90
2010 2011 2012 2013 2014 2015
Per
cent
age
(%)
Year
Girls Boys
0
20
40
60
80
100
Girls Boys Girls Boys Girls Boys
Year 10 Year 11 Year 12
Per
cent
age
of
enro
lmen
ts (
%)
Non-STEM
Technology and Applied Studies
Science
Mathematics
7
0 20 40 60 80 100
*Textiles and Design
*Food Technology
Biology
*Agriculture
Mathematics
Chemistry
Senior Science
Financial Services
Earth and Environmental Science
*Design and Technology
*Primary Industries
*Technology and Applied Studies
Physics
*Information Processes and Technology
*Information & Digital Technology
*Industrial Technology
*Automotive
*Software Design and Development
*Engineering Studies
*Metal & Engineering
*Electrotechnology
*Construction
Percentage (%)
6
0 20 40 60 80
<5
5
6+
Ag
e at
31
July
0 20 40 60 80 100
Boys
Girls
Percentage (%)
Percentage (%)
Vulnerable
Not Vulnerable
Vulnerable
BoysGirls
Not Vulnerable
not used
BoysGirls
Education and Learning | Women in NSW Report Series 2016 5
Strong educational outcomes result in better work and life opportunities for individuals and our community as a whole. NSW schools are committed to the provision of equitable high quality educational opportunities for all children. This supports consistent improvement in student outcomes and the narrowing of achievement gaps between students.2
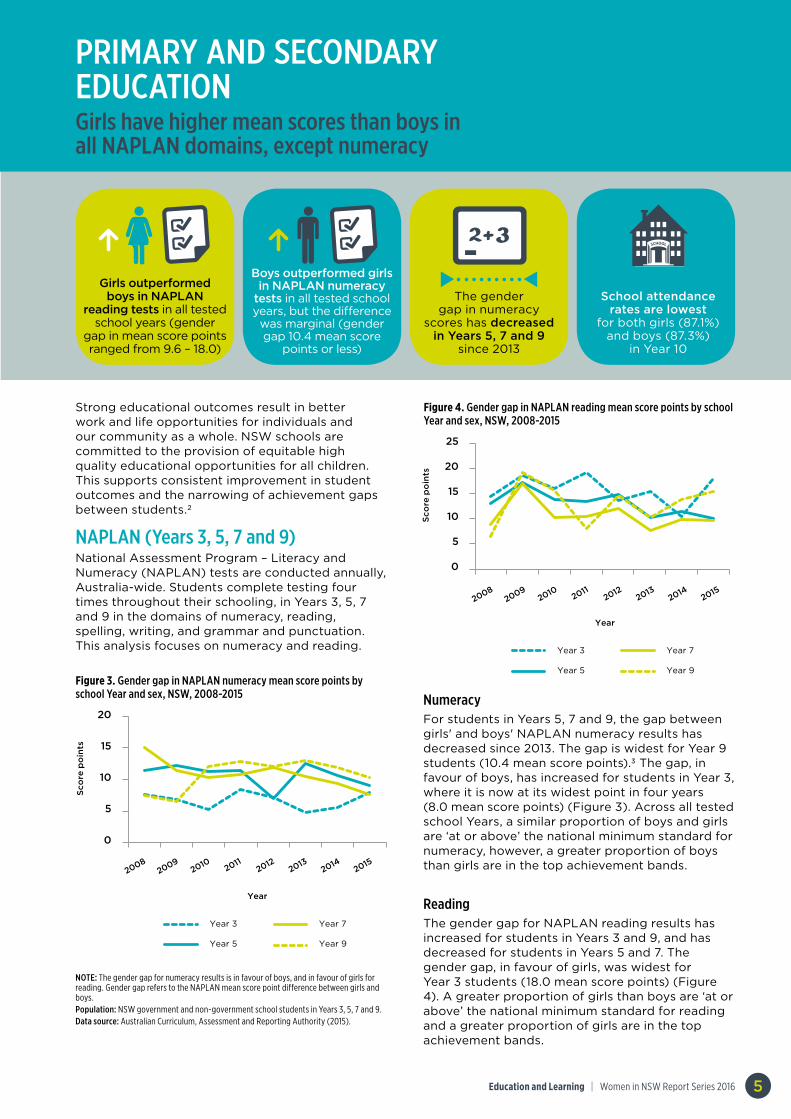
NAPLAN (Years 3, 5, 7 and 9)National Assessment Program – Literacy and Numeracy (NAPLAN) tests are conducted annually, Australia-wide. Students complete testing four times throughout their schooling, in Years 3, 5, 7 and 9 in the domains of numeracy, reading, spelling, writing, and grammar and punctuation. This analysis focuses on numeracy and reading.
NumeracyFor students in Years 5, 7 and 9, the gap between girls' and boys' NAPLAN numeracy results has decreased since 2013. The gap is widest for Year 9 students (10.4 mean score points).3 The gap, in favour of boys, has increased for students in Year 3, where it is now at its widest point in four years (8.0 mean score points) (Figure 3). Across all tested school Years, a similar proportion of boys and girls are ‘at or above’ the national minimum standard for numeracy, however, a greater proportion of boys than girls are in the top achievement bands.
ReadingThe gender gap for NAPLAN reading results has increased for students in Years 3 and 9, and has decreased for students in Years 5 and 7. The gender gap, in favour of girls, was widest for Year 3 students (18.0 mean score points) (Figure 4). A greater proportion of girls than boys are ‘at or above’ the national minimum standard for reading and a greater proportion of girls are in the top achievement bands.
PRIMARY AND SECONDARY EDUCATION Girls have higher mean scores than boys in all NAPLAN domains, except numeracy
Boys outperformed girls in NAPLAN numeracy
tests in all tested school years, but the difference was marginal (gender gap 10.4 mean score
points or less)
Girls outperformed boys in NAPLAN
reading tests in all tested school years (gender
gap in mean score points ranged from 9.6 – 18.0)
The gender gap in numeracy
scores has decreased in Years 5, 7 and 9
since 2013
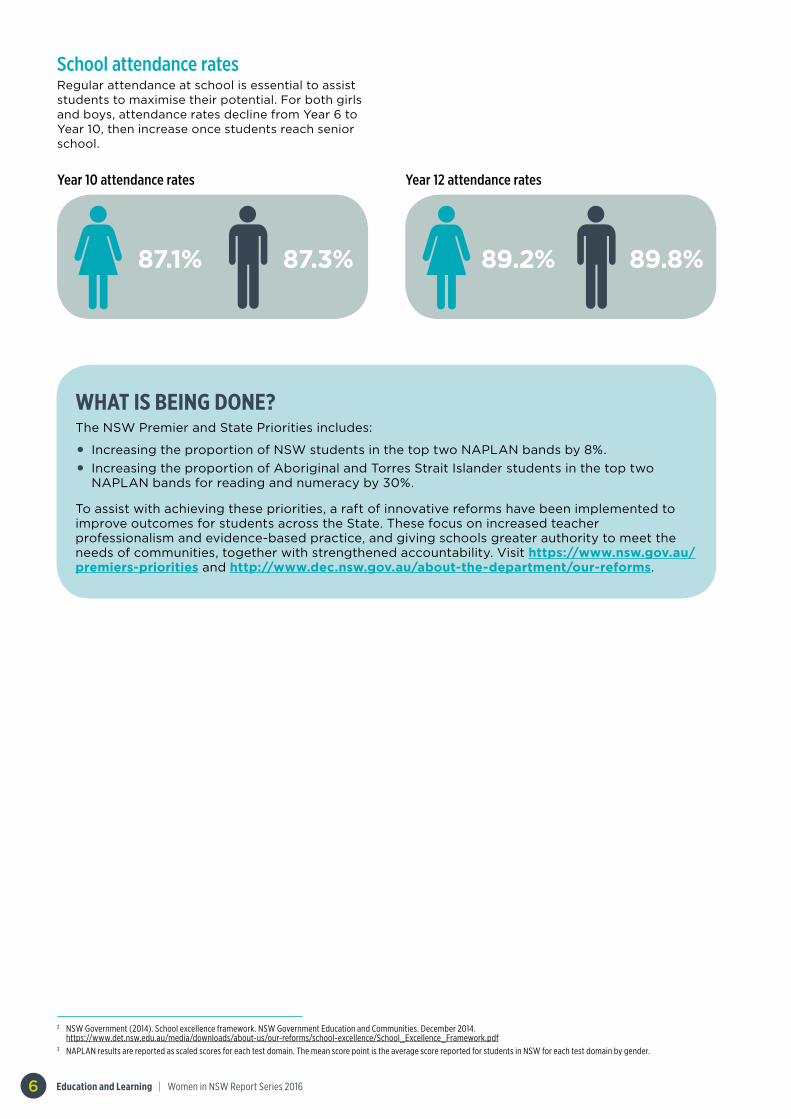
School attendance rates are lowest
for both girls (87.1%) and boys (87.3%)
in Year 10
Figure 3. Gender gap in NAPLAN numeracy mean score points by school Year and sex, NSW, 2008-2015
3
0
5
10
15
20
201520142013
201220112010
20092008
43
0
5
10
15
20
25
Sco
re p
oin
ts
Sco
re p
oin
ts
Year 3
Year 5
Year 7
Year 9
Year
Year 3
Year 5
Year 7
Year 9
Year
201520142013
201220112010
20092008
Figure 4. Gender gap in NAPLAN reading mean score points by school Year and sex, NSW, 2008-2015
3
0
5
10
15
20
201520142013
201220112010
20092008
43
0
5
10
15
20
25
Sco
re p
oin
ts
Sco
re p
oin
ts
Year 3
Year 5
Year 7
Year 9
Year
Year 3
Year 5
Year 7
Year 9
Year
201520142013
201220112010
20092008
NOTE: The gender gap for numeracy results is in favour of boys, and in favour of girls for reading. Gender gap refers to the NAPLAN mean score point difference between girls and boys. Population: NSW government and non-government school students in Years 3, 5, 7 and 9.Data source: Australian Curriculum, Assessment and Reporting Authority (2015).
Education and Learning | Women in NSW Report Series 20166
2 NSW Government (2014). School excellence framework. NSW Government Education and Communities. December 2014. https://www.det.nsw.edu.au/media/downloads/about-us/our-reforms/school-excellence/School_Excellence_Framework.pdf
3 NAPLAN results are reported as scaled scores for each test domain. The mean score point is the average score reported for students in NSW for each test domain by gender.
WHAT IS BEING DONE? The NSW Premier and State Priorities includes:
• Increasing the proportion of NSW students in the top two NAPLAN bands by 8%.
• Increasing the proportion of Aboriginal and Torres Strait Islander students in the top two NAPLAN bands for reading and numeracy by 30%.
To assist with achieving these priorities, a raft of innovative reforms have been implemented to improve outcomes for students across the State. These focus on increased teacher professionalism and evidence-based practice, and giving schools greater authority to meet the needs of communities, together with strengthened accountability. Visit https://www.nsw.gov.au/premiers-priorities and http://www.dec.nsw.gov.au/about-the-department/our-reforms.
School attendance ratesRegular attendance at school is essential to assist students to maximise their potential. For both girls and boys, attendance rates decline from Year 6 to Year 10, then increase once students reach senior school.
87.1% 87.3%
Year 10 attendance rates
89.2% 89.8%
Year 12 attendance rates
Education and Learning | Women in NSW Report Series 2016 7
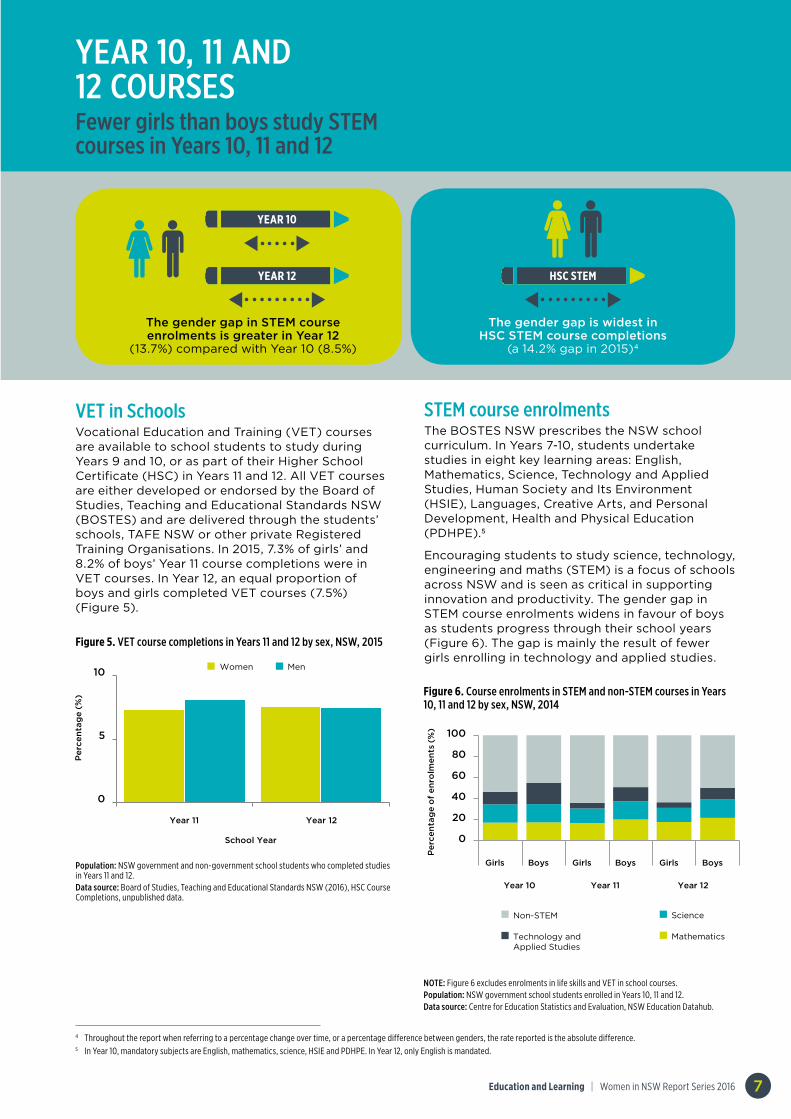
YEAR 10, 11 AND 12 COURSES Fewer girls than boys study STEM courses in Years 10, 11 and 12
The gender gap in STEM course enrolments is greater in Year 12
(13.7%) compared with Year 10 (8.5%)
The gender gap is widest in HSC STEM course completions
(a 14.2% gap in 2015)4
HSC STEM
4 Throughout the report when referring to a percentage change over time, or a percentage difference between genders, the rate reported is the absolute difference. 5 In Year 10, mandatory subjects are English, mathematics, science, HSIE and PDHPE. In Year 12, only English is mandated.
VET in SchoolsVocational Education and Training (VET) courses are available to school students to study during Years 9 and 10, or as part of their Higher School Certificate (HSC) in Years 11 and 12. All VET courses are either developed or endorsed by the Board of Studies, Teaching and Educational Standards NSW (BOSTES) and are delivered through the students’ schools, TAFE NSW or other private Registered Training Organisations. In 2015, 7.3% of girls’ and 8.2% of boys’ Year 11 course completions were in VET courses. In Year 12, an equal proportion of boys and girls completed VET courses (7.5%) (Figure 5).
Figure 5. VET course completions in Years 11 and 12 by sex, NSW, 20155
Per
cent
age
(%)
0
5
10
Year 11 Year 12
School Year
Women Men
Population: NSW government and non-government school students who completed studies in Years 11 and 12. Data source: Board of Studies, Teaching and Educational Standards NSW (2016), HSC Course Completions, unpublished data.
Figure 6. Course enrolments in STEM and non-STEM courses in Years 10, 11 and 12 by sex, NSW, 2014
5
1
2
60
70
80
90
2010 2011 2012 2013 2014 2015
Per
cent
age
(%)
Year
Girls Boys
0
20
40
60
80
100
Girls Boys Girls Boys Girls Boys
Year 10 Year 11 Year 12
Per
cent
age
of
enro
lmen
ts (
%)
Non-STEM
Technology and Applied Studies
Science
Mathematics
7
0 20 40 60 80 100
*Textiles and Design
*Food Technology
Biology
*Agriculture
Mathematics
Chemistry
Senior Science
Financial Services
Earth and Environmental Science
*Design and Technology
*Primary Industries
*Technology and Applied Studies
Physics
*Information Processes and Technology
*Information & Digital Technology
*Industrial Technology
*Automotive
*Software Design and Development
*Engineering Studies
*Metal & Engineering
*Electrotechnology
*Construction
Percentage (%)
6
0 20 40 60 80
<5
5
6+
Ag
e at
31
July
0 20 40 60 80 100
Boys
Girls
Percentage (%)
Percentage (%)
Vulnerable
Not Vulnerable
Vulnerable
BoysGirls
Not Vulnerable
not used
BoysGirls
NOTE: Figure 6 excludes enrolments in life skills and VET in school courses. Population: NSW government school students enrolled in Years 10, 11 and 12. Data source: Centre for Education Statistics and Evaluation, NSW Education Datahub.
STEM course enrolments The BOSTES NSW prescribes the NSW school curriculum. In Years 7-10, students undertake studies in eight key learning areas: English, Mathematics, Science, Technology and Applied Studies, Human Society and Its Environment (HSIE), Languages, Creative Arts, and Personal Development, Health and Physical Education (PDHPE).5
Encouraging students to study science, technology, engineering and maths (STEM) is a focus of schools across NSW and is seen as critical in supporting innovation and productivity. The gender gap in STEM course enrolments widens in favour of boys as students progress through their school years (Figure 6). The gap is mainly the result of fewer girls enrolling in technology and applied studies.
YEAR 12
YEAR 10
Education and Learning | Women in NSW Report Series 20168
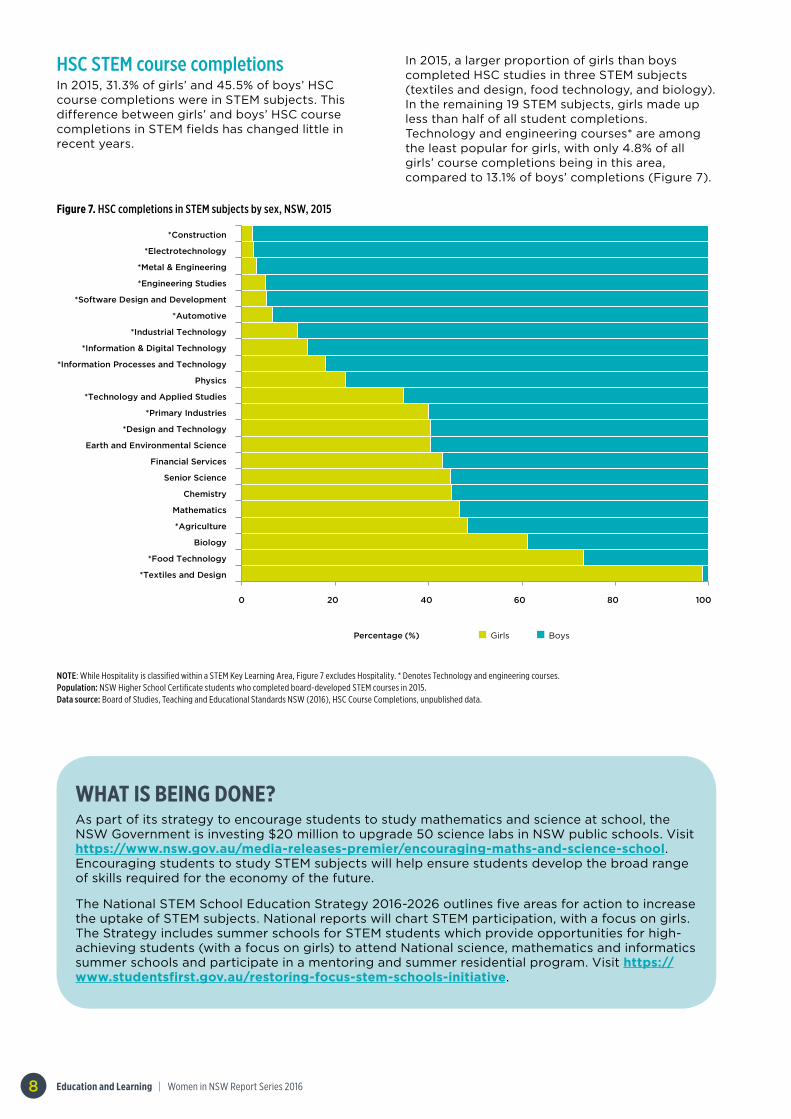
HSC STEM course completionsIn 2015, 31.3% of girls’ and 45.5% of boys’ HSC course completions were in STEM subjects. This difference between girls’ and boys’ HSC course completions in STEM fields has changed little in recent years.
Figure 7. HSC completions in STEM subjects by sex, NSW, 2015
5
1
2
60
70
80
90
2010 2011 2012 2013 2014 2015
Per
cent
age
(%)
Year
Girls Boys
0
20
40
60
80
100
Girls Boys Girls Boys Girls Boys
Year 10 Year 11 Year 12
Per
cent
age
of
enro
lmen
ts (
%)
Non-STEM
Technology and Applied Studies
Science
Mathematics
7
0 20 40 60 80 100
*Textiles and Design
*Food Technology
Biology
*Agriculture
Mathematics
Chemistry
Senior Science
Financial Services
Earth and Environmental Science
*Design and Technology
*Primary Industries
*Technology and Applied Studies
Physics
*Information Processes and Technology
*Information & Digital Technology
*Industrial Technology
*Automotive
*Software Design and Development
*Engineering Studies
*Metal & Engineering
*Electrotechnology
*Construction
Percentage (%)
6
0 20 40 60 80
<5
5
6+
Ag
e at
31
July
0 20 40 60 80 100
Boys
Girls
Percentage (%)
Percentage (%)
Vulnerable
Not Vulnerable
Vulnerable
BoysGirls
Not Vulnerable
not used
BoysGirls
NOTE: While Hospitality is classified within a STEM Key Learning Area, Figure 7 excludes Hospitality. * Denotes Technology and engineering courses.Population: NSW Higher School Certificate students who completed board-developed STEM courses in 2015.Data source: Board of Studies, Teaching and Educational Standards NSW (2016), HSC Course Completions, unpublished data.
In 2015, a larger proportion of girls than boys completed HSC studies in three STEM subjects (textiles and design, food technology, and biology). In the remaining 19 STEM subjects, girls made up less than half of all student completions. Technology and engineering courses* are among the least popular for girls, with only 4.8% of all girls’ course completions being in this area, compared to 13.1% of boys’ completions (Figure 7).
WHAT IS BEING DONE? As part of its strategy to encourage students to study mathematics and science at school, the NSW Government is investing $20 million to upgrade 50 science labs in NSW public schools. Visit https://www.nsw.gov.au/media-releases-premier/encouraging-maths-and-science-school. Encouraging students to study STEM subjects will help ensure students develop the broad range of skills required for the economy of the future.
The National STEM School Education Strategy 2016-2026 outlines five areas for action to increase the uptake of STEM subjects. National reports will chart STEM participation, with a focus on girls. The Strategy includes summer schools for STEM students which provide opportunities for high-achieving students (with a focus on girls) to attend National science, mathematics and informatics summer schools and participate in a mentoring and summer residential program. Visit https://www.studentsfirst.gov.au/restoring-focus-stem-schools-initiative.
Education and Learning | Women in NSW Report Series 2016 9
The gender gap in retention rates from Years 10 to 12 is narrowing (7.0% in 2015)
The gap between girls and boys for secondary school completion is wider in low
socioeconomic groups (13.0%) than in high socioeconomic
groups (4.0%)
Girls who left school early were most likely to commence a
VET certificate (33.3%), whereas boys were most likely to
start an apprenticeship or traineeship (43.0%)
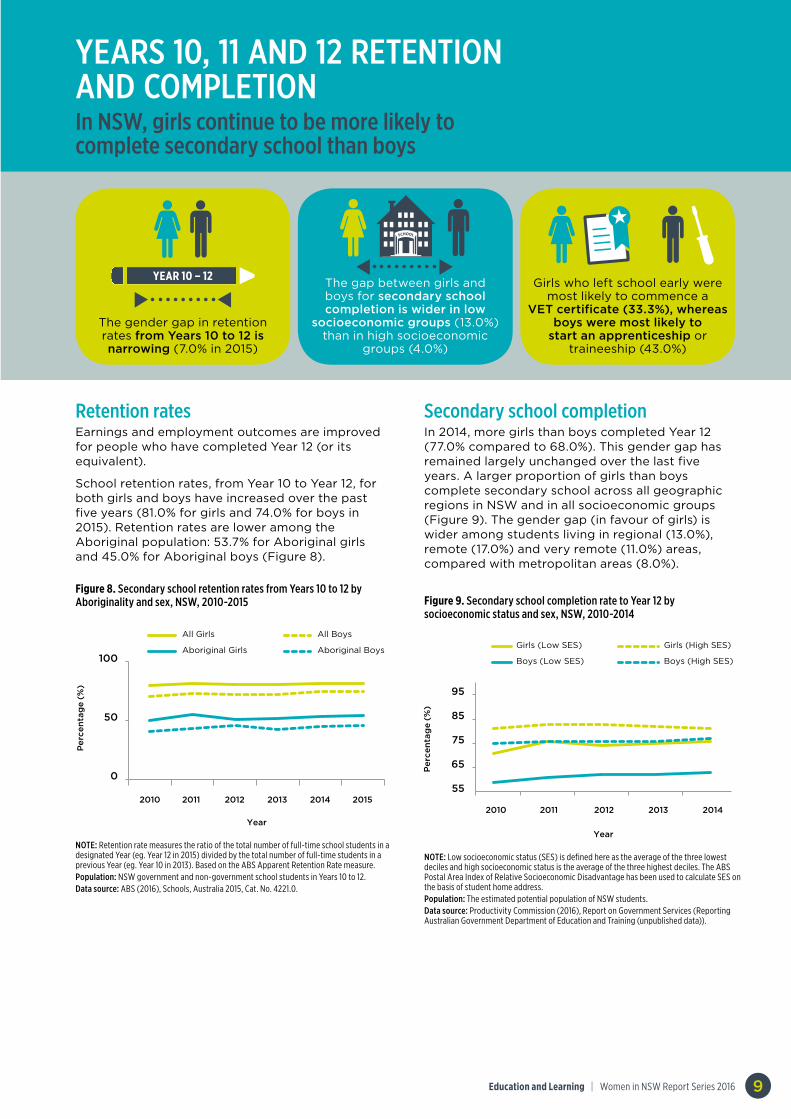
YEARS 10, 11 AND 12 RETENTION AND COMPLETION In NSW, girls continue to be more likely to complete secondary school than boys
Retention rates Earnings and employment outcomes are improved for people who have completed Year 12 (or its equivalent).
School retention rates, from Year 10 to Year 12, for both girls and boys have increased over the past five years (81.0% for girls and 74.0% for boys in 2015). Retention rates are lower among the Aboriginal population: 53.7% for Aboriginal girls and 45.0% for Aboriginal boys (Figure 8).
Secondary school completionIn 2014, more girls than boys completed Year 12 (77.0% compared to 68.0%). This gender gap has remained largely unchanged over the last five years. A larger proportion of girls than boys complete secondary school across all geographic regions in NSW and in all socioeconomic groups (Figure 9). The gender gap (in favour of girls) is wider among students living in regional (13.0%), remote (17.0%) and very remote (11.0%) areas, compared with metropolitan areas (8.0%).
Figure 8. Secondary school retention rates from Years 10 to 12 by Aboriginality and sex, NSW, 2010-2015 Figure 9. Secondary school completion rate to Year 12 by
socioeconomic status and sex, NSW, 2010-2014
10
11
0 10 20 30 40
Other/No reason/Don't know/Refused
I was bullied
Other external factors
Disillusioned
Work reasons
Looking for other educational opportunities
Academic or behavioural diculties
Percentage (%)
0
25
50
75
100
Female Male Female Male
Early school leavers Year 12 completers
Per
cent
age
(%)
Looking for work, not employedand/or not studying
Employed full-time or part-time
Apprenticeship or traineeship
VET certificate
Bachelor degree
Girls Boys
55
65
75
85
95
2010 2011 2012 2013 2014
Per
cent
age
(%)
Per
cent
age
(%)
Year
Year
Girls (Low SES) Girls (High SES)
Boys (Low SES) Boys (High SES)
9
8
0
50
100
2010 2011 2012 2013 2014 2015
All Girls
Aboriginal Girls
All Boys
Aboriginal Boys
NOTE: Retention rate measures the ratio of the total number of full-time school students in a designated Year (eg. Year 12 in 2015) divided by the total number of full-time students in a previous Year (eg. Year 10 in 2013). Based on the ABS Apparent Retention Rate measure. Population: NSW government and non-government school students in Years 10 to 12. Data source: ABS (2016), Schools, Australia 2015, Cat. No. 4221.0.
NOTE: Low socioeconomic status (SES) is defined here as the average of the three lowest deciles and high socioeconomic status is the average of the three highest deciles. The ABS Postal Area Index of Relative Socioeconomic Disadvantage has been used to calculate SES on the basis of student home address.Population: The estimated potential population of NSW students.Data source: Productivity Commission (2016), Report on Government Services (Reporting Australian Government Department of Education and Training (unpublished data)).
YEAR 10 – 12
Education and Learning | Women in NSW Report Series 201610
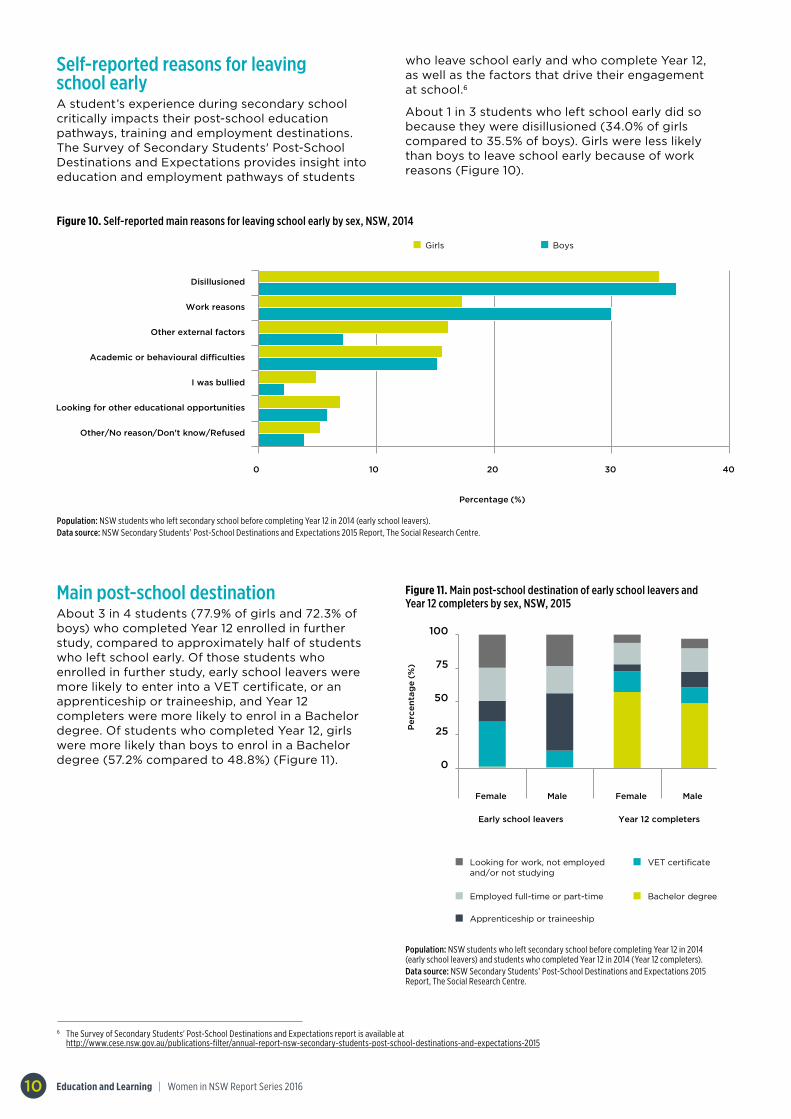
Self-reported reasons for leaving school earlyA student’s experience during secondary school critically impacts their post-school education pathways, training and employment destinations. The Survey of Secondary Students' Post-School Destinations and Expectations provides insight into education and employment pathways of students
Main post-school destinationAbout 3 in 4 students (77.9% of girls and 72.3% of boys) who completed Year 12 enrolled in further study, compared to approximately half of students who left school early. Of those students who enrolled in further study, early school leavers were more likely to enter into a VET certificate, or an apprenticeship or traineeship, and Year 12 completers were more likely to enrol in a Bachelor degree. Of students who completed Year 12, girls were more likely than boys to enrol in a Bachelor degree (57.2% compared to 48.8%) (Figure 11).
Figure 10. Self-reported main reasons for leaving school early by sex, NSW, 201410
11
0 10 20 30 40
Other/No reason/Don't know/Refused
I was bullied
Other external factors
Disillusioned
Work reasons
Looking for other educational opportunities
Academic or behavioural diculties
Percentage (%)
0
25
50
75
100
Female Male Female Male
Early school leavers Year 12 completers
Per
cent
age
(%)
Looking for work, not employedand/or not studying
Employed full-time or part-time
Apprenticeship or traineeship
VET certificate
Bachelor degree
Girls Boys
55
65
75
85
95
2010 2011 2012 2013 2014P
erce
ntag
e (%
)P
erce
ntag
e (%
)
Year
Year
Girls (Low SES) Girls (High SES)
Boys (Low SES) Boys (High SES)
9
8
0
50
100
2010 2011 2012 2013 2014 2015
All Girls
Aboriginal Girls
All Boys
Aboriginal Boys
Population: NSW students who left secondary school before completing Year 12 in 2014 (early school leavers).Data source: NSW Secondary Students’ Post-School Destinations and Expectations 2015 Report, The Social Research Centre.
who leave school early and who complete Year 12, as well as the factors that drive their engagement at school.6
About 1 in 3 students who left school early did so because they were disillusioned (34.0% of girls compared to 35.5% of boys). Girls were less likely than boys to leave school early because of work reasons (Figure 10).
Figure 11. Main post-school destination of early school leavers and Year 12 completers by sex, NSW, 2015
10
11
0 10 20 30 40
Other/No reason/Don't know/Refused
I was bullied
Other external factors
Disillusioned
Work reasons
Looking for other educational opportunities
Academic or behavioural diculties
Percentage (%)
0
25
50
75
100
Female Male Female Male
Early school leavers Year 12 completers
Per
cent
age
(%)
Looking for work, not employedand/or not studying
Employed full-time or part-time
Apprenticeship or traineeship
VET certificate
Bachelor degree
Girls Boys
55
65
75
85
95
2010 2011 2012 2013 2014
Per
cent
age
(%)
Per
cent
age
(%)
Year
Year
Girls (Low SES) Girls (High SES)
Boys (Low SES) Boys (High SES)
9
8
0
50
100
2010 2011 2012 2013 2014 2015
All Girls
Aboriginal Girls
All Boys
Aboriginal Boys
Population: NSW students who left secondary school before completing Year 12 in 2014 (early school leavers) and students who completed Year 12 in 2014 (Year 12 completers).Data source: NSW Secondary Students’ Post-School Destinations and Expectations 2015 Report, The Social Research Centre.
6 The Survey of Secondary Students' Post-School Destinations and Expectations report is available at http://www.cese.nsw.gov.au/publications-filter/annual-report-nsw-secondary-students-post-school-destinations-and-expectations-2015
Education and Learning | Women in NSW Report Series 2016 11
Women in major cities are more likely to hold qualifications
(60.9%) (at Certificate III and above) than women in regional
or remote locations (53.8%)
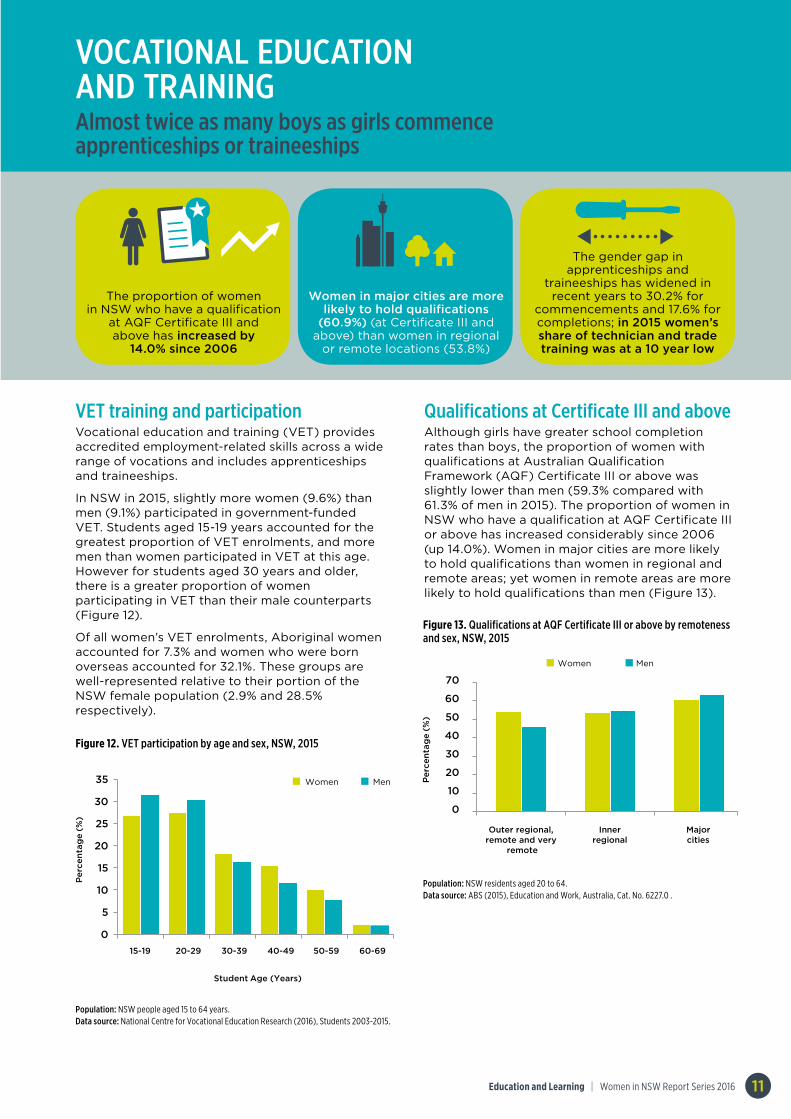
VOCATIONAL EDUCATION AND TRAINING Almost twice as many boys as girls commence apprenticeships or traineeships
VET training and participationVocational education and training (VET) provides accredited employment-related skills across a wide range of vocations and includes apprenticeships and traineeships.
In NSW in 2015, slightly more women (9.6%) than men (9.1%) participated in government-funded VET. Students aged 15-19 years accounted for the greatest proportion of VET enrolments, and more men than women participated in VET at this age. However for students aged 30 years and older, there is a greater proportion of women participating in VET than their male counterparts (Figure 12).
Of all women’s VET enrolments, Aboriginal women accounted for 7.3% and women who were born overseas accounted for 32.1%. These groups are well-represented relative to their portion of the NSW female population (2.9% and 28.5% respectively).
Qualifications at Certificate III and aboveAlthough girls have greater school completion rates than boys, the proportion of women with qualifications at Australian Qualification Framework (AQF) Certificate III or above was slightly lower than men (59.3% compared with 61.3% of men in 2015). The proportion of women in NSW who have a qualification at AQF Certificate III or above has increased considerably since 2006 (up 14.0%). Women in major cities are more likely to hold qualifications than women in regional and remote areas; yet women in remote areas are more likely to hold qualifications than men (Figure 13).
Figure 12. VET participation by age and sex, NSW, 2015
12
Per
cent
age
(%)
Student Age (Years)
0
5
10
15
20
25
30
35
15-19 20-29 30-39 40-49 50-59 60-69
Women Men
Population: NSW people aged 15 to 64 years.Data source: National Centre for Vocational Education Research (2016), Students 2003-2015.
The gender gap in apprenticeships and
traineeships has widened in recent years to 30.2% for
commencements and 17.6% for completions; in 2015 women’s share of technician and trade training was at a 10 year low
The proportion of women in NSW who have a qualification
at AQF Certificate III and above has increased by
14.0% since 2006
Figure 13. Qualifications at AQF Certificate III or above by remoteness and sex, NSW, 2015
Women Men
20062015
2014201320122011
20102009
20082007
Year
13
14
0102030405060708090
100
Per
cent
age
(%)
All completions (women)
All completions (men)
Technician and Tradecompletions (women)
Technician and Tradecompletions (men)
0
10
20
30
40
50
60
70
Outer regional, remote and very
remote
Inner regional
Major cities
Per
cent
age
(%)
Women Men12
Per
cent
age
(%)
0
10
20
30
40
15-19 20-24 25-29 30-39 40-49 50-59 60-64
Student Age (Years)
Population: NSW residents aged 20 to 64.Data source: ABS (2015), Education and Work, Australia, Cat. No. 6227.0 .
Education and Learning | Women in NSW Report Series 201612
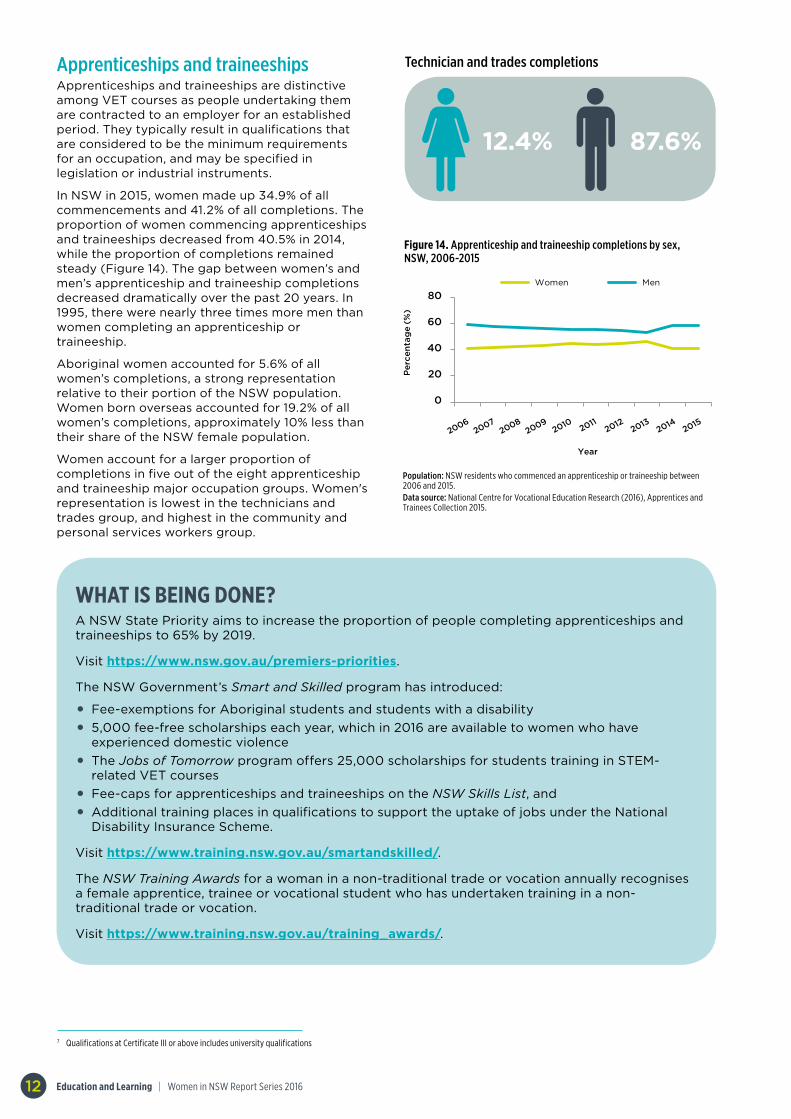
Apprenticeships and traineeshipsApprenticeships and traineeships are distinctive among VET courses as people undertaking them are contracted to an employer for an established period. They typically result in qualifications that are considered to be the minimum requirements for an occupation, and may be specified in legislation or industrial instruments.
In NSW in 2015, women made up 34.9% of all commencements and 41.2% of all completions. The proportion of women commencing apprenticeships and traineeships decreased from 40.5% in 2014, while the proportion of completions remained steady (Figure 14). The gap between women’s and men’s apprenticeship and traineeship completions decreased dramatically over the past 20 years. In 1995, there were nearly three times more men than women completing an apprenticeship or traineeship.
Aboriginal women accounted for 5.6% of all women’s completions, a strong representation relative to their portion of the NSW population. Women born overseas accounted for 19.2% of all women’s completions, approximately 10% less than their share of the NSW female population.
Women account for a larger proportion of completions in five out of the eight apprenticeship and traineeship major occupation groups. Women's representation is lowest in the technicians and trades group, and highest in the community and personal services workers group.
WHAT IS BEING DONE? A NSW State Priority aims to increase the proportion of people completing apprenticeships and traineeships to 65% by 2019.
Visit https://www.nsw.gov.au/premiers-priorities.
The NSW Government’s Smart and Skilled program has introduced:
• Fee-exemptions for Aboriginal students and students with a disability
• 5,000 fee-free scholarships each year, which in 2016 are available to women who have experienced domestic violence
• The Jobs of Tomorrow program offers 25,000 scholarships for students training in STEM-related VET courses
• Fee-caps for apprenticeships and traineeships on the NSW Skills List, and
• Additional training places in qualifications to support the uptake of jobs under the National Disability Insurance Scheme.
Visit https://www.training.nsw.gov.au/smartandskilled/.
The NSW Training Awards for a woman in a non-traditional trade or vocation annually recognises a female apprentice, trainee or vocational student who has undertaken training in a non-traditional trade or vocation.
Visit https://www.training.nsw.gov.au/training_awards/.
7 Qualifications at Certificate III or above includes university qualifications
Figure 14. Apprenticeship and traineeship completions by sex, NSW, 2006-2015
13
0
20
40
60
80
Per
cent
age
(%)
Women Men
Year
20062015
20142013201220112010
20092008
2007
Population: NSW residents who commenced an apprenticeship or traineeship between 2006 and 2015.Data source: National Centre for Vocational Education Research (2016), Apprentices and Trainees Collection 2015.
12.4% 87.6%
Technician and trades completions
Education and Learning | Women in NSW Report Series 2016 13
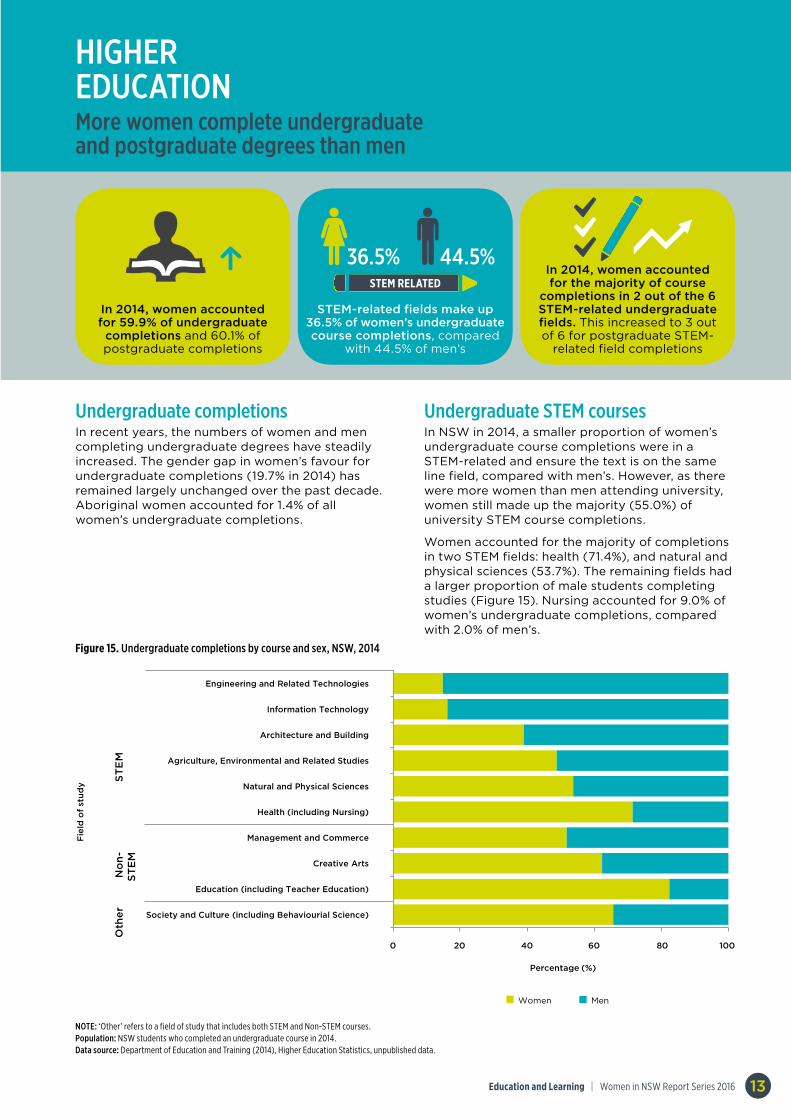
HIGHER EDUCATION More women complete undergraduate and postgraduate degrees than men
In 2014, women accounted for 59.9% of undergraduate completions and 60.1% of postgraduate completions
STEM-related fields make up 36.5% of women’s undergraduate course completions, compared
with 44.5% of men’s
In 2014, women accounted for the majority of course
completions in 2 out of the 6 STEM-related undergraduate fields. This increased to 3 out of 6 for postgraduate STEM-
related field completions
36.5% 44.5%STEM RELATED
Undergraduate completionsIn recent years, the numbers of women and men completing undergraduate degrees have steadily increased. The gender gap in women’s favour for undergraduate completions (19.7% in 2014) has remained largely unchanged over the past decade. Aboriginal women accounted for 1.4% of all women’s undergraduate completions.
Undergraduate STEM coursesIn NSW in 2014, a smaller proportion of women’s undergraduate course completions were in a STEM-related and ensure the text is on the same line field, compared with men’s. However, as there were more women than men attending university, women still made up the majority (55.0%) of university STEM course completions.
Women accounted for the majority of completions in two STEM fields: health (71.4%), and natural and physical sciences (53.7%). The remaining fields had a larger proportion of male students completing studies (Figure 15). Nursing accounted for 9.0% of women’s undergraduate completions, compared with 2.0% of men’s.
Figure 15. Undergraduate completions by course and sex, NSW, 2014
MenWomen
MenWomen
not usedWomen Men
010203040506070
Per
cent
age
(%)
Year
200520142013
201220112010
20092008
20072006
16
Percentage (%)
Oth
erN
on-
STE
MS
TEM
Fie
ld o
f st
udy
0 20 40 60 80 100
Society and Culture
Education
Creative Arts
Management and Commerce
Food, Hospitality and Personal Services
Health
Natural and Physical Sciences
Agriculture, Environmental and Related Studies
Architecture and Building
Information Technology
Engineering and Related Technologies
15
0 20 40 60 80 100
Society and Culture (including Behaviourial Science)
Education (including Teacher Education)
Creative Arts
Management and Commerce
Health (including Nursing)
Natural and Physical Sciences
Agriculture, Environmental and Related Studies
Architecture and Building
Information Technology
Engineering and Related Technologies
Oth
erN
on-
STE
MS
TEM
Percentage (%)
Fie
ld o
f st
udy
17
0
10
20
30
40
Major city Inner regional Outer regional Remote and very remote
Per
cent
age
(%)
Remoteness
Women Men
NOTE: ‘Other’ refers to a field of study that includes both STEM and Non-STEM courses.Population: NSW students who completed an undergraduate course in 2014.Data source: Department of Education and Training (2014), Higher Education Statistics, unpublished data.
Education and Learning | Women in NSW Report Series 201614
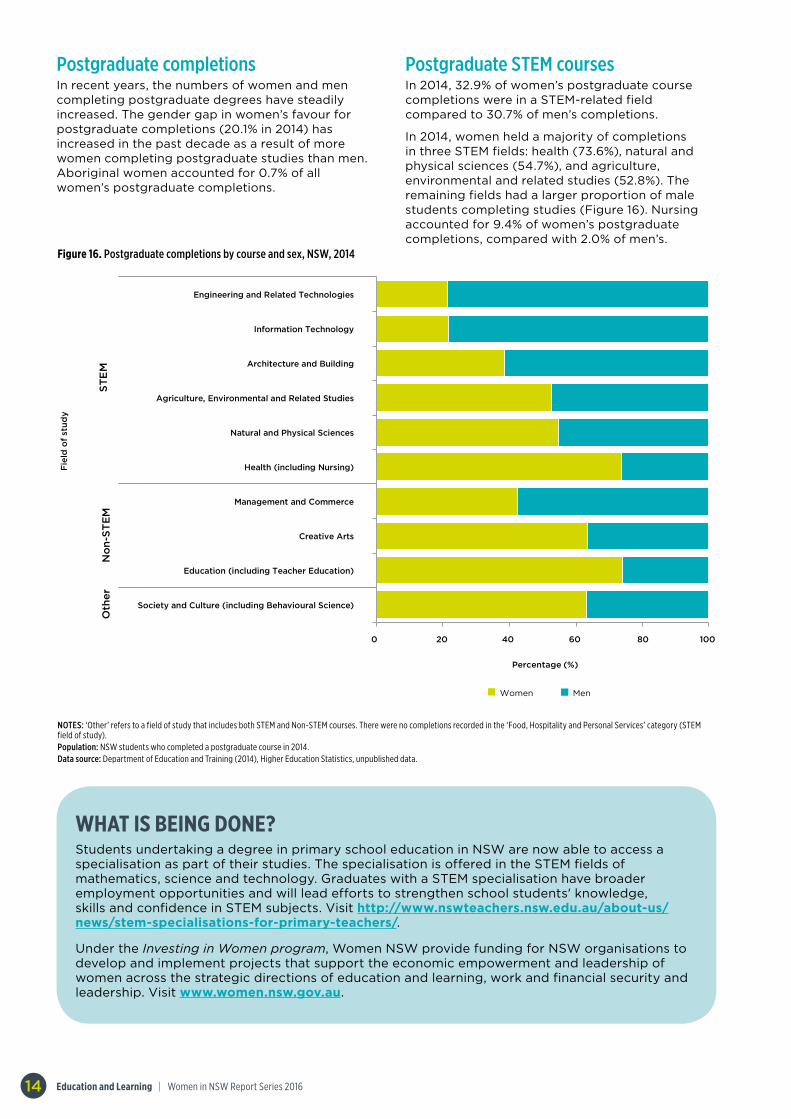
Postgraduate completionsIn recent years, the numbers of women and men completing postgraduate degrees have steadily increased. The gender gap in women’s favour for postgraduate completions (20.1% in 2014) has increased in the past decade as a result of more women completing postgraduate studies than men. Aboriginal women accounted for 0.7% of all women’s postgraduate completions.
Postgraduate STEM coursesIn 2014, 32.9% of women’s postgraduate course completions were in a STEM-related field compared to 30.7% of men’s completions.
In 2014, women held a majority of completions in three STEM fields: health (73.6%), natural and physical sciences (54.7%), and agriculture, environmental and related studies (52.8%). The remaining fields had a larger proportion of male students completing studies (Figure 16). Nursing accounted for 9.4% of women’s postgraduate completions, compared with 2.0% of men’s.
Figure 16. Postgraduate completions by course and sex, NSW, 2014
MenWomen
16
16
Percentage (%)
Oth
erN
on-
STE
MS
TEM
Fie
ld o
f st
udy
Fie
ld o
f st
udy
0 20 40 60 80 100
MenWomen
Percentage (%)
0 20 40 60 80 100
Society and Culture
Education
Creative Arts
Management and Commerce
Food, Hospitality and Personal Services
Health
Natural and Physical Sciences
Agriculture, Environmental and Related Studies
Architecture and Building
Information Technology
Engineering and Related Technologies
Society and Culture (including Behavioural Science)
Education (including Teacher Education)
Creative Arts
Management and Commerce
Health (including Nursing)
Natural and Physical Sciences
Agriculture, Environmental and Related Studies
Architecture and Building
Information Technology
Engineering and Related Technologies
Oth
erN
on-
STE
MST
EM
NOTES: ‘Other’ refers to a field of study that includes both STEM and Non-STEM courses. There were no completions recorded in the ‘Food, Hospitality and Personal Services’ category (STEM field of study). Population: NSW students who completed a postgraduate course in 2014.Data source: Department of Education and Training (2014), Higher Education Statistics, unpublished data.
WHAT IS BEING DONE? Students undertaking a degree in primary school education in NSW are now able to access a specialisation as part of their studies. The specialisation is offered in the STEM fields of mathematics, science and technology. Graduates with a STEM specialisation have broader employment opportunities and will lead efforts to strengthen school students' knowledge, skills and confidence in STEM subjects. Visit http://www.nswteachers.nsw.edu.au/about-us/news/stem-specialisations-for-primary-teachers/.
Under the Investing in Women program, Women NSW provide funding for NSW organisations to develop and implement projects that support the economic empowerment and leadership of women across the strategic directions of education and learning, work and financial security and leadership. Visit www.women.nsw.gov.au.
Education and Learning | Women in NSW Report Series 2016 15
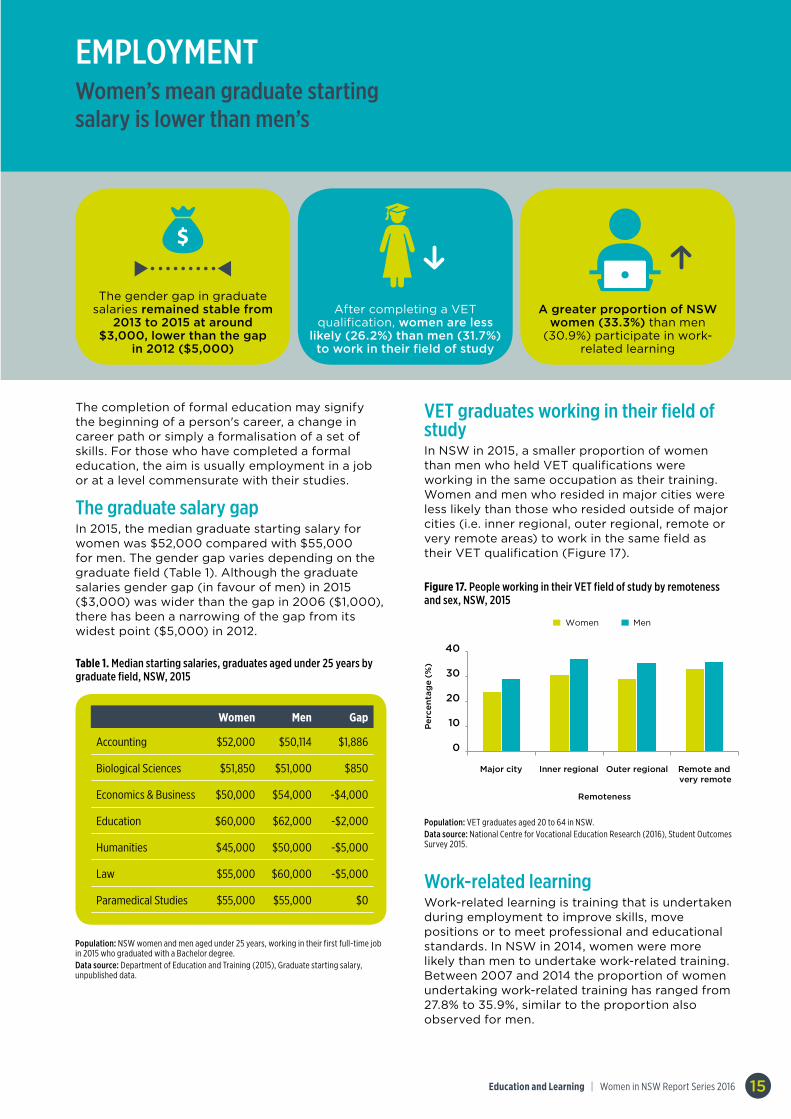
EMPLOYMENT Women’s mean graduate starting salary is lower than men’s
The gender gap in graduate salaries remained stable from
2013 to 2015 at around $3,000, lower than the gap
in 2012 ($5,000)
After completing a VET qualification, women are less
likely (26.2%) than men (31.7%) to work in their field of study
A greater proportion of NSW women (33.3%) than men
(30.9%) participate in work-related learning
Table 1. Median starting salaries, graduates aged under 25 years by graduate field, NSW, 2015
Population: NSW women and men aged under 25 years, working in their first full-time job in 2015 who graduated with a Bachelor degree. Data source: Department of Education and Training (2015), Graduate starting salary, unpublished data.
The completion of formal education may signify the beginning of a person's career, a change in career path or simply a formalisation of a set of skills. For those who have completed a formal education, the aim is usually employment in a job or at a level commensurate with their studies.
The graduate salary gapIn 2015, the median graduate starting salary for women was $52,000 compared with $55,000 for men. The gender gap varies depending on the graduate field (Table 1). Although the graduate salaries gender gap (in favour of men) in 2015 ($3,000) was wider than the gap in 2006 ($1,000), there has been a narrowing of the gap from its widest point ($5,000) in 2012.
VET graduates working in their field of studyIn NSW in 2015, a smaller proportion of women than men who held VET qualifications were working in the same occupation as their training. Women and men who resided in major cities were less likely than those who resided outside of major cities (i.e. inner regional, outer regional, remote or very remote areas) to work in the same field as their VET qualification (Figure 17).
Work-related learningWork-related learning is training that is undertaken during employment to improve skills, move positions or to meet professional and educational standards. In NSW in 2014, women were more likely than men to undertake work-related training. Between 2007 and 2014 the proportion of women undertaking work-related training has ranged from 27.8% to 35.9%, similar to the proportion also observed for men.
Women Men Gap
Accounting $52,000 $50,114 $1,886
Biological Sciences $51,850 $51,000 $850
Economics & Business $50,000 $54,000 -$4,000
Education $60,000 $62,000 -$2,000
Humanities $45,000 $50,000 -$5,000
Law $55,000 $60,000 -$5,000
Paramedical Studies $55,000 $55,000 $0
Figure 17. People working in their VET field of study by remoteness and sex, NSW, 2015
MenWomen
MenWomen
not usedWomen Men
010203040506070
Per
cent
age
(%)
Year
200520142013
201220112010
20092008
20072006
16
Percentage (%)
Oth
erN
on-
STE
MS
TEM
Fie
ld o
f st
udy
0 20 40 60 80 100
Society and Culture
Education
Creative Arts
Management and Commerce
Food, Hospitality and Personal Services
Health
Natural and Physical Sciences
Agriculture, Environmental and Related Studies
Architecture and Building
Information Technology
Engineering and Related Technologies
15
0 20 40 60 80 100
Society and Culture (including Behaviourial Science)
Education (including Teacher Education)
Creative Arts
Management and Commerce
Health (including Nursing)
Natural and Physical Sciences
Agriculture, Environmental and Related Studies
Architecture and Building
Information Technology
Engineering and Related Technologies
Oth
erN
on-
STE
MS
TEM
Percentage (%)
Fie
ld o
f st
udy
17
0
10
20
30
40
Major city Inner regional Outer regional Remote and very remote
Per
cent
age
(%)
Remoteness
Women Men
Population: VET graduates aged 20 to 64 in NSW.Data source: National Centre for Vocational Education Research (2016), Student Outcomes Survey 2015.
Education and Learning | Women in NSW Report Series 201616
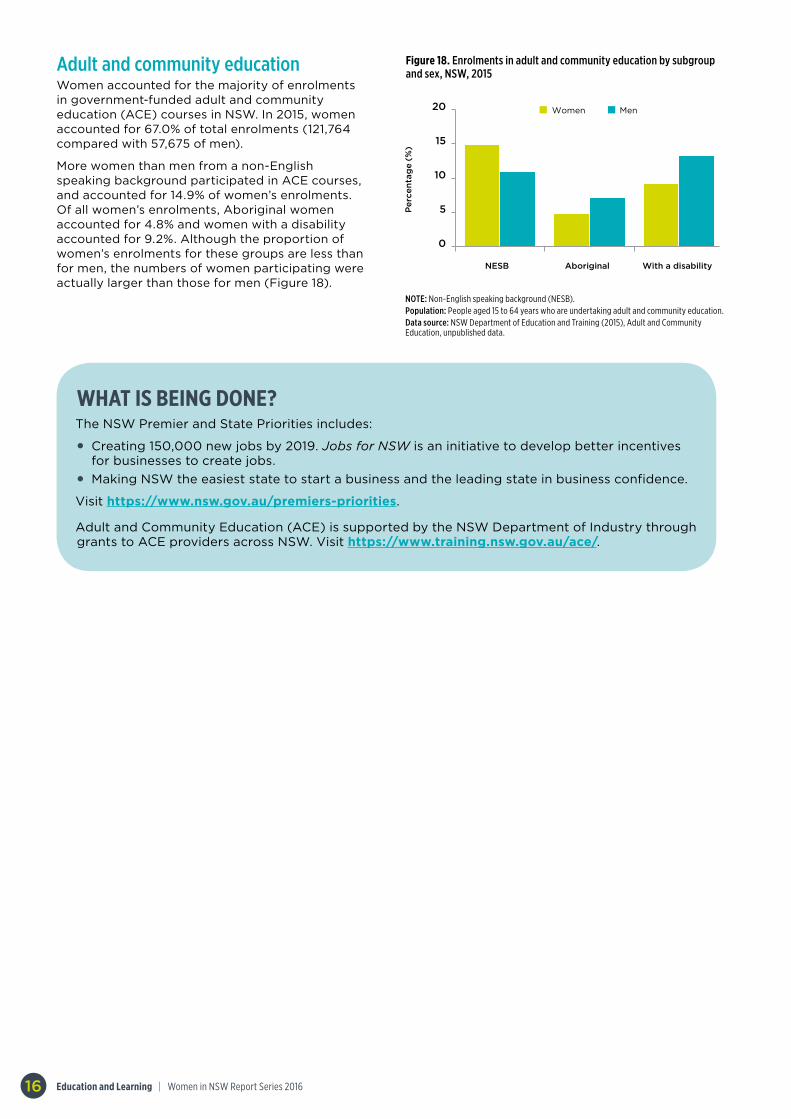
Adult and community educationWomen accounted for the majority of enrolments in government-funded adult and community education (ACE) courses in NSW. In 2015, women accounted for 67.0% of total enrolments (121,764 compared with 57,675 of men).
More women than men from a non-English speaking background participated in ACE courses, and accounted for 14.9% of women’s enrolments. Of all women’s enrolments, Aboriginal women accounted for 4.8% and women with a disability accounted for 9.2%. Although the proportion of women’s enrolments for these groups are less than for men, the numbers of women participating were actually larger than those for men (Figure 18).
Figure 18. Enrolments in adult and community education by subgroup and sex, NSW, 2015
19
20062015
2014201320122011
20102009
20082007
Year
30
40
50
60
Per
cent
age
(%)
20
200520142013
201220112010
20092008
20072006
Year
30
40
50
60
Per
cent
age
(%)
18
Per
cent
age
(%)
Women Men
Women Men
0
5
10
15
20
NESB Aboriginal With a disability
Women Men
55
65
75
85
95
2010 2011 2012 2013 2014
Per
cent
age
(%)
Year
Girls (Low SES) Girls (High SES)
Boys (Low SES) Boys (High SES)
NOTE: Non-English speaking background (NESB). Population: People aged 15 to 64 years who are undertaking adult and community education.Data source: NSW Department of Education and Training (2015), Adult and Community Education, unpublished data.
WHAT IS BEING DONE? The NSW Premier and State Priorities includes:
• Creating 150,000 new jobs by 2019. Jobs for NSW is an initiative to develop better incentives for businesses to create jobs.
• Making NSW the easiest state to start a business and the leading state in business confidence.
Visit https://www.nsw.gov.au/premiers-priorities.
Adult and Community Education (ACE) is supported by the NSW Department of Industry through grants to ACE providers across NSW. Visit https://www.training.nsw.gov.au/ace/.
Education and Learning | Women in NSW Report Series 2016 17
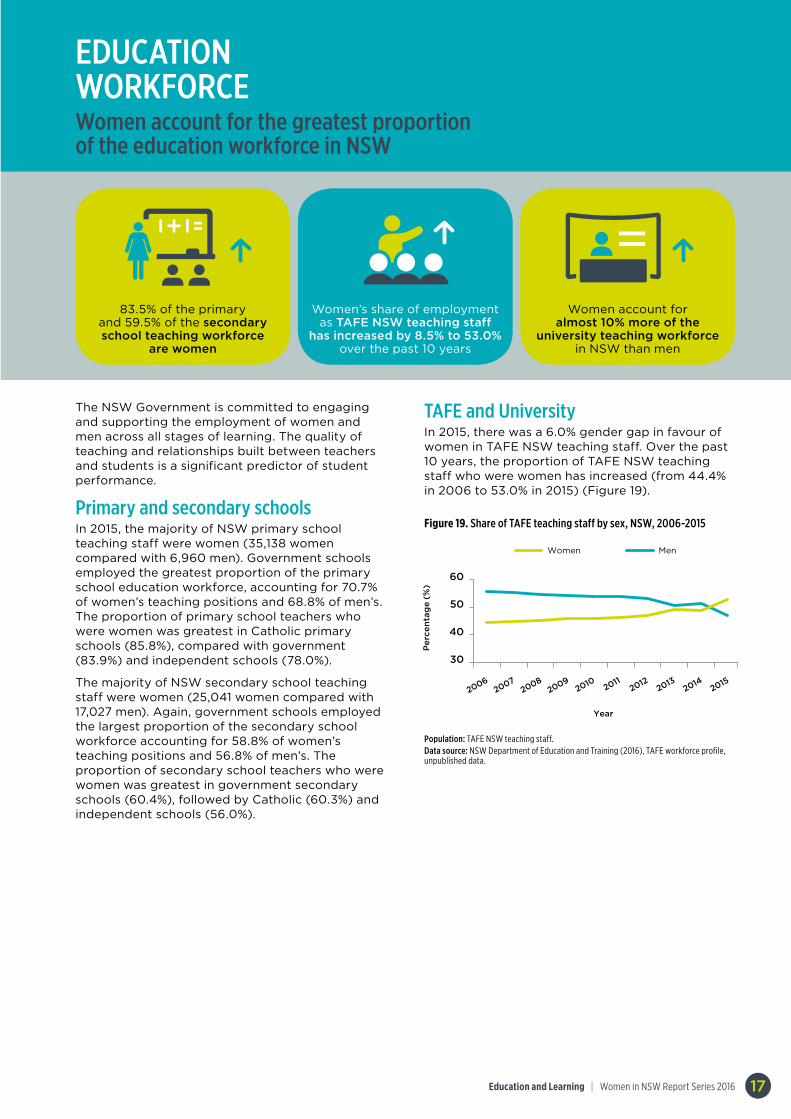
EDUCATION WORKFORCE Women account for the greatest proportion of the education workforce in NSW
83.5% of the primary and 59.5% of the secondary school teaching workforce
are women
Women’s share of employment as TAFE NSW teaching staff
has increased by 8.5% to 53.0% over the past 10 years
Women account for almost 10% more of the
university teaching workforce in NSW than men
The NSW Government is committed to engaging and supporting the employment of women and men across all stages of learning. The quality of teaching and relationships built between teachers and students is a significant predictor of student performance.
Primary and secondary schoolsIn 2015, the majority of NSW primary school teaching staff were women (35,138 women compared with 6,960 men). Government schools employed the greatest proportion of the primary school education workforce, accounting for 70.7% of women’s teaching positions and 68.8% of men’s. The proportion of primary school teachers who were women was greatest in Catholic primary schools (85.8%), compared with government (83.9%) and independent schools (78.0%).
The majority of NSW secondary school teaching staff were women (25,041 women compared with 17,027 men). Again, government schools employed the largest proportion of the secondary school workforce accounting for 58.8% of women’s teaching positions and 56.8% of men’s. The proportion of secondary school teachers who were women was greatest in government secondary schools (60.4%), followed by Catholic (60.3%) and independent schools (56.0%).
TAFE and UniversityIn 2015, there was a 6.0% gender gap in favour of women in TAFE NSW teaching staff. Over the past 10 years, the proportion of TAFE NSW teaching staff who were women has increased (from 44.4% in 2006 to 53.0% in 2015) (Figure 19).
Figure 19. Share of TAFE teaching staff by sex, NSW, 2006-2015 19
20062015
2014201320122011
20102009
20082007
Year
30
40
50
60
Per
cent
age
(%)
20
200520142013
201220112010
20092008
20072006
Year
30
40
50
60
Per
cent
age
(%)
18
Per
cent
age
(%)
Women Men
Women Men
0
5
10
15
20
NESB Aboriginal With a disability
Women Men
55
65
75
85
95
2010 2011 2012 2013 2014
Per
cent
age
(%)
Year
Girls (Low SES) Girls (High SES)
Boys (Low SES) Boys (High SES)
Population: TAFE NSW teaching staff.Data source: NSW Department of Education and Training (2016), TAFE workforce profile, unpublished data.
Education and Learning | Women in NSW Report Series 201618
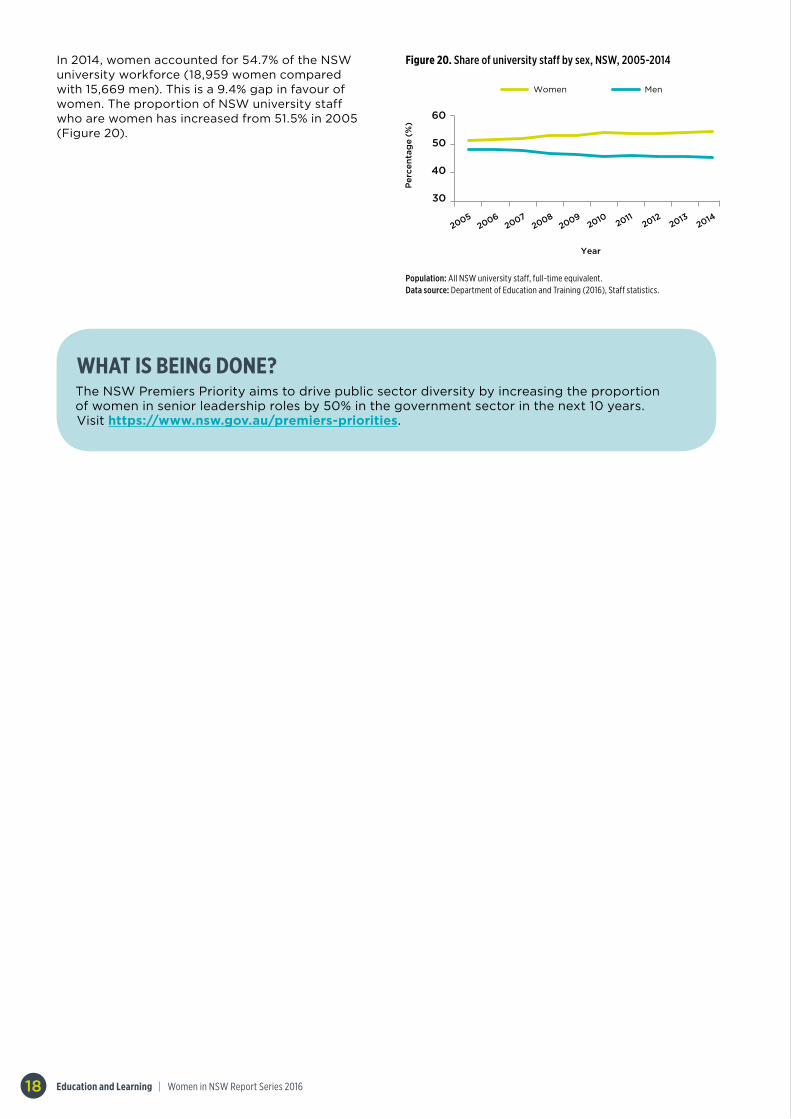
Figure 20. Share of university staff by sex, NSW, 2005-2014
19
20062015
2014201320122011
20102009
20082007
Year
30
40
50
60
Per
cent
age
(%)
20
200520142013
201220112010
20092008
20072006
Year
30
40
50
60
Per
cent
age
(%)
18
Per
cent
age
(%)
Women Men
Women Men
0
5
10
15
20
NESB Aboriginal With a disability
Women Men
55
65
75
85
95
2010 2011 2012 2013 2014
Per
cent
age
(%)
Year
Girls (Low SES) Girls (High SES)
Boys (Low SES) Boys (High SES)
Population: All NSW university staff, full-time equivalent.Data source: Department of Education and Training (2016), Staff statistics.
WHAT IS BEING DONE? The NSW Premiers Priority aims to drive public sector diversity by increasing the proportion of women in senior leadership roles by 50% in the government sector in the next 10 years. Visit https://www.nsw.gov.au/premiers-priorities.
In 2014, women accounted for 54.7% of the NSW university workforce (18,959 women compared with 15,669 men). This is a 9.4% gap in favour of women. The proportion of NSW university staff who are women has increased from 51.5% in 2005 (Figure 20).
Education and Learning | Women in NSW Report Series 2016 19
ACRONYMS AND ABBREVIATIONS
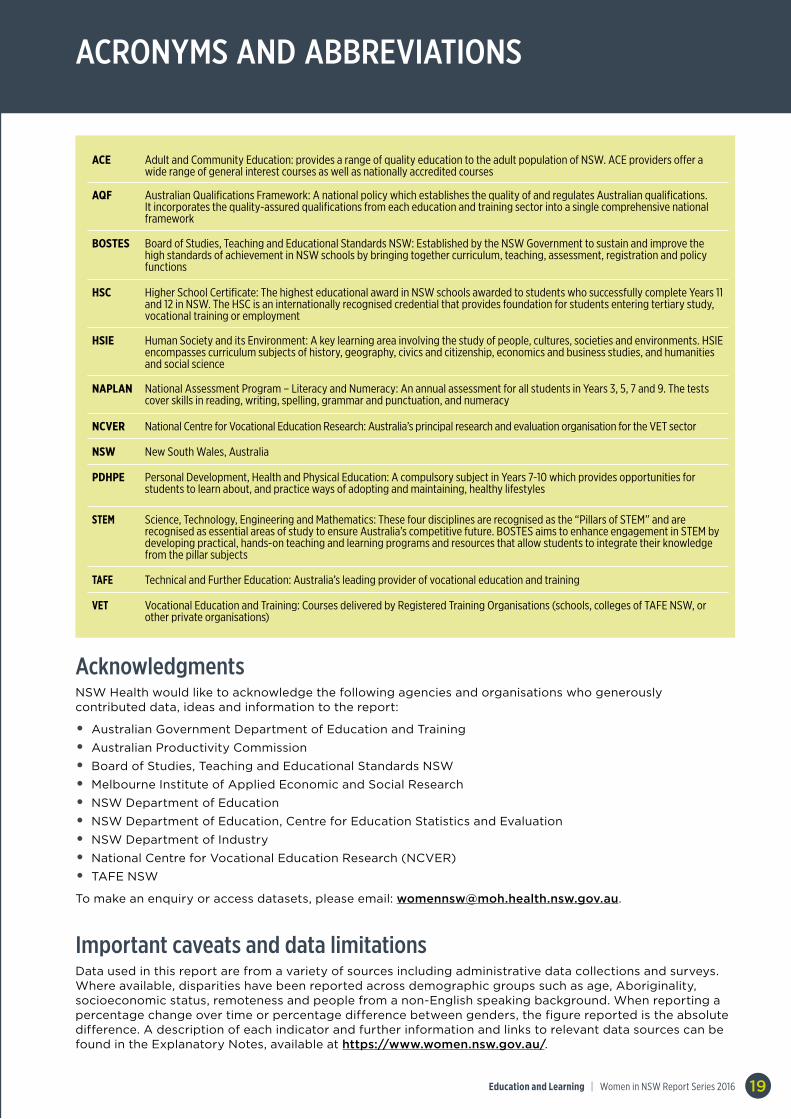
ACE Adult and Community Education: provides a range of quality education to the adult population of NSW. ACE providers offer a wide range of general interest courses as well as nationally accredited courses
AQF Australian Qualifications Framework: A national policy which establishes the quality of and regulates Australian qualifications. It incorporates the quality-assured qualifications from each education and training sector into a single comprehensive national framework
BOSTES Board of Studies, Teaching and Educational Standards NSW: Established by the NSW Government to sustain and improve the high standards of achievement in NSW schools by bringing together curriculum, teaching, assessment, registration and policy functions
HSC Higher School Certificate: The highest educational award in NSW schools awarded to students who successfully complete Years 11 and 12 in NSW. The HSC is an internationally recognised credential that provides foundation for students entering tertiary study, vocational training or employment
HSIE Human Society and its Environment: A key learning area involving the study of people, cultures, societies and environments. HSIE encompasses curriculum subjects of history, geography, civics and citizenship, economics and business studies, and humanities and social science
NAPLAN National Assessment Program – Literacy and Numeracy: An annual assessment for all students in Years 3, 5, 7 and 9. The tests cover skills in reading, writing, spelling, grammar and punctuation, and numeracy
NCVER National Centre for Vocational Education Research: Australia’s principal research and evaluation organisation for the VET sector
NSW New South Wales, Australia
PDHPE Personal Development, Health and Physical Education: A compulsory subject in Years 7-10 which provides opportunities for students to learn about, and practice ways of adopting and maintaining, healthy lifestyles
STEM Science, Technology, Engineering and Mathematics: These four disciplines are recognised as the “Pillars of STEM” and are recognised as essential areas of study to ensure Australia’s competitive future. BOSTES aims to enhance engagement in STEM by developing practical, hands-on teaching and learning programs and resources that allow students to integrate their knowledge from the pillar subjects
TAFE Technical and Further Education: Australia’s leading provider of vocational education and training
VET Vocational Education and Training: Courses delivered by Registered Training Organisations (schools, colleges of TAFE NSW, or other private organisations)
Acknowledgments NSW Health would like to acknowledge the following agencies and organisations who generously contributed data, ideas and information to the report:
• Australian Government Department of Education and Training
• Australian Productivity Commission
• Board of Studies, Teaching and Educational Standards NSW
• Melbourne Institute of Applied Economic and Social Research
• NSW Department of Education
• NSW Department of Education, Centre for Education Statistics and Evaluation
• NSW Department of Industry
• National Centre for Vocational Education Research (NCVER)
• TAFE NSW
To make an enquiry or access datasets, please email: [email protected].
Important caveats and data limitationsData used in this report are from a variety of sources including administrative data collections and surveys. Where available, disparities have been reported across demographic groups such as age, Aboriginality, socioeconomic status, remoteness and people from a non-English speaking background. When reporting a percentage change over time or percentage difference between genders, the figure reported is the absolute difference. A description of each indicator and further information and links to relevant data sources can be found in the Explanatory Notes, available at https://www.women.nsw.gov.au/.
Education and Learning | Women in NSW Report Series 201620
Australian Bureau of Statistics (2015), Education and Work, Australia, May 2015, Cat. No. 6227.0. Available at http://www.abs.gov.au/AUSSTATS/[email protected]/mf/6227.0/.
Australian Bureau of Statistics (2015), Births, Australia, 2014, Cat. No. 3301.0. Available at http://www.abs.gov.au/AUSSTATS/[email protected]/mf/3301.0.
Australian Bureau of Statistics (2016), Australian Demographic Statistics, Dec 2015, Cat. No. 3101.0. Available at http://www.abs.gov.au/ausstats/[email protected]/mf/3101.0.
Australian Bureau of Statistics (2013), Estimates of Aboriginal and Torres Strait Islander Australians, June 2011, Cat. No. 3238.0.55.001. Available at http://www.abs.gov.au/ausstats/[email protected]/mf/3238.0.
Australian Bureau of Statistics (2016), Schools, Australia, 2015, Cat. No. 4221.0. Available at http://www.abs.gov.au/ausstats/[email protected]/mf/4221.0.
Australian Curriculum, Assessment and Reporting Authority (2015), NAPLAN Achievement in Reading, Persuasive Writing, Language Conventions and Numeracy: National report for 2015, ACARA Sydney. Available at http://www.nap.edu.au/.
Australian Institute of Health and Welfare (2016), Children’s Headline Indicators. Available at www.aihw.gov.au/chi/. Accessed June 2016.
Board of Studies, Teaching and Educational Standards NSW (2016), HSC Course Completions. Unpublished data, obtained March 2016. Visit http://www.boardofstudies.nsw.edu.au/.
Centre for Education Statistics and Evaluation, NSW Education Datahub. Available at https://data.cese.nsw.gov.au/.
Centre for Education Statistics and Evaluation, Schools and Students: 2014 Statistics Bulletin Issue 4. NSW Department of Education, 2014. Available at https://www.cese.nsw.gov.au.
Centre for Education Statistics and Evaluation (2016), Attendance Rates, NSW Government Schools, 2014. NSW Department of Education. Unpublished data, obtained May 2016. Visit https://www.cese.nsw.gov.au.
Department of Education and Training (2015), Graduate starting salary. Australian Government. Unpublished data, obtained February 2016. Visit https://www.education.gov.au/.
Department of Education and Training (2014), Higher Education Statistics, Higher Education Statistics Collection (Student Collection), Australian Government. Unpublished data, obtained April 2016. Visit https://www.education.gov.au/higher-education-statistics.
Department of Education and Training (2016), Staff statistics, Australian Government, 2015. Available at https://www.education.gov.au/staff-data.
HealthStats NSW (2016), Population by remoteness from service centres and sex, NSW 2014. Available at http://www.healthstats.nsw.gov.au/Indicator/dem_pop_aria
Melbourne Institute of Applied Economic and Social Research (Melbourne Institute) (2015), Household, Income and Labour Dynamics in Australia (HILDA) survey, release 14. Available at www.melbourneinstitute.com/HILDA.
Myers, P., Vickers, N., Ward, A., Ramazanov, A., Honey, N., Challice, G., & Davis, M. (2015). NSW Secondary Students’ Post-School Destinations and Expectations: 2014 Annual Report. The Social Research Centre: Melbourne. Available at http://www.cese.nsw.gov.au/publications-filter/nsw-secondary-students-post-school-destinations-and-expectations
Myers, P., Vickers, N., Ward, A., Ramazanov, A., Honey, N., Challice, G., & Davis, M. (2015). NSW Secondary Students’ Post-School Destinations and Expectations: 2015 Annual Report. The Social Research Centre: Melbourne. Available at http://www.cese.nsw.gov.au/images/stories/PDF/Destination_and_Expectations_Report_2015.pdf
National Centre for Vocational Education Research (2016), Apprentices and Trainees, 2015. Unpublished data, obtained July 2016.Available at https://www.ncver.edu.au/data/collection/apprentices-and-trainees.
National Centre for Vocational Education Research (NCVER) (2016), Student Outcomes Survey, 2015. Available at https://www.ncver.edu.au/data/collection/student-outcomes.
National Centre for Vocational Education Research (NCVER) (2016), Students 2003-2015. Unpublished data, obtained July 2016. Accessed via https://www.ncver.edu.au.
NSW Department of Education and Training (2016), Adult and Community Education Statistics, 2015. Unpublished data, obtained August 2016. Visit www.ace.nsw.gov.au.
NSW Department of Education and Training (2016), TAFE workforce profile. Unpublished data, obtained April 2016. Visit http://www.dec.nsw.gov.au/.
Productivity Commission (2016), Report on Government Services 2016, Canberra: Productivity Commission. Available at www.pc.gov.au.
REFERENCES

front cover:
Dr Dharmica Mistry, NSW Young Woman of the Year Award Winner 2016
www.women.nsw.gov.au SHPN
(WN
SW) 1
6038
9