Embed Size (px)
Citation preview
Education and Human Capital Externalities:
Evidence from Colonial Benin⇤
Leonard Wantchekon
†
Marko Klasnja
‡
Natalija Novta
§
November 12, 2013
Abstract
We use a unique dataset on students from the first regional schools in colonial Benin toinvestigate the e↵ect of education on living standards, occupation and political participation.Because of the near-random selection of the school location and the first student cohorts, we canestimate the e↵ect of education by comparing the treated to the untreated living in the samevillage, as well as those living in villages where no schools were set up. We find a significantpositive treatment e↵ect of education for the first generation of students, as well as their de-scendants – they have higher living standards, are less likely to be farmers, and are more likelyto be politically active. We find large village-level externalities – descendants of the uneducatedin villages with schools do better than those in control villages. We also find extended familyexternalities – nephews and nieces directly benefit from their uncle’s education – and we showthat this represents a “family-tax,” as educated uncles transfer resources to the extended family.
JEL codes: N37, O15, J27
⇤We would like to thank Alberto Alesina, Marcella Alsan, Joseph Altonji, Chris Blattman, Brandon Miller de laCuesta, Janet Currie, Thomas Fujiwara, Paula Giuliano, Claudia Goldin, Ahmed Mushfiq Mobarak, Christian Moser,Nathan Nunn, Nancy Qian, Jim Robinson, Mark Rosenzweig, Cyrus Samii, Andrei Shleifer, Sotima Tchantikpo, ChrisUdry, Sarah Weltman, and Yang-Yang Zhou; seminar participants at Harvard University, LSE, Princeton University,University of Warwick, and Yale University; BREAD Conference on Development Economics and the NBER politicaleconomy group for comments and suggestions. Special thanks to the research department of the Institute for EmpiricalResearch in Political Economy (IERPE) in Benin, particularly, Roumuld Anago, Kassim Assouma, Azizou Chabi,Andre Gueguehou, Late Gregoire Kpekpede, and Clement Litchegbe for their work during the data collection process.Financial support from NYU, Princeton, and IDRC (Canada) is gratefully acknowledged. The usual caveat applies.
†
Corresponding author : Department of Politics, Princeton University. E-mail: [email protected]‡Wilf Family Department of Politics, New York University§Department of Economics, New York University
1

“An educated child is like a lantern in your house at night.” Eloi Gainsi, farmer and
religious instructor, Zagnanado (Benin)
1 Introduction
Education can have a profound, transformational e↵ect on individuals and communities: this idea
has received strong support not only from folk wisdom and anecdotal evidence, but from rigorous
academic studies as well. A wide literature shows that the social benefit of education is only
partially reflected in the advantage it gives to the individual, and that the di↵usion of knowledge and
human capital externalities may be fundamental factors in explaining di↵erences in economic growth
among developing countries. This literature thus far has focused primarily on the measurement of
human capital at the aggregate level and has had limited success establishing a causal link between
education and development outcomes. In this paper, we present direct evidence of individual-level
e↵ects of human capital on economic outcomes, as well as data on the spatial and temporal spillover
of these e↵ects
We use a unique longitudinal dataset which tracks down the first students in colonial schools
founded in central and northern Benin in the early 20th Century, those students’ direct descendants
and extended family, as well as their contemporaries who did not get education (see Wantchekon
(2012)). We use information provided by school and church archives (see Figure A.1) and face-to-
face interviews with local elders to identify students in the first two cohorts from colonial schools
at four sites: Kandi, Natitingou, Save and Zagnanado. Information about these first students was
collected through interviews of either the students themselves (if alive) or their direct descendants.
Next, the dataset contains individuals who were born at the same time and the same village but
did not attend school, as well as contemporaries from a nearby village where no school was set up.1
[Figure A.1 about here.]
Favorable geographical conditions may have determined the colonialists’ or Catholic missionar-
ies’ location choice for schools, as discussed by Nunn (2010) and Johnson (1967), inducing possibly
1In Section 5 we discuss in more detail how students were selected for school, and why we believe there was nopositive selection.
2

selection bias into estimates of the e↵ects of human capital. However, the data collection approach
of Wantchekon (2012) sidesteps the issue of potentially endogenous location choice by sampling only
nearby villages, within 25 km of each other, that were equally attractive to settlers. Given this
relatively short distance, there is hardly any variation in geographical features relevant to Catholic
missionaries and colonial settlers (see Table A.3), so the exact location of a school could plausibly
be considered near-random.
It is also important to note that only regions that had no prior exposure to European influence
at the time of the first schools were considered. In other words, we use data collected in areas where
formal colonial institutions were established after, not before, formal education opportunities were
made available to the local population. This unique feature of the data helps to isolate the e↵ects
of human capital and limits the potential for political institutions to confound the relationship
between human capital and growth.
Our results reveal enormous positive treatment e↵ect of education on a number of outcomes
– the treated individuals from the first two cohorts have higher living standards, are considerably
less likely to be farmers, and have better social networks. Also, students in that first generation
are significantly more likely to be politically active, either by campaigning for and joining political
parties, or even standing for election in a few cases. To the best of our knowledge, these results
represent the first (quasi) experimental evidence in the support of the positive e↵ect of education
on political participation in developing countries.
Second, we look at the outcomes of their descendants. Parents’ education has a large positive
e↵ect on their children’s educational attainment, living standards, and social networks, at levels
similar to the first-generation e↵ects. Third, there are large positive village-level externalities of
education in the second generation – descendants of the untreated2 in villages with schools have
substantially better outcomes than descendants in villages without. We find evidence that these
externalities run partly through higher aspirations, as parents in villages with schools enhance their
social networks. Fourth, the strength of extended families is documented as nephews and nieces
directly benefit from education of their uncles – they are almost equally educated as the students’
2The untreated are a random sample of those who did not receive education but were born at the same time asstudents of the first two cohorts in each village where a school was established.
3
children, and are more educated than descendants without any educated members in their families.
We show that these within-family externalities represent a family-tax, as educated uncles seem to
transfer resources to the extended family.
The remainder of the paper is organized as follows: Section 2 discusses the related literature,
Section 3 describes the historical context in Benin, Section 4 describes the sampling procedure,
Section 6 presents results from the first generation of students, with a discussion of identification
in Section 5. Section 7 presents results from the second generation, with an emphasis on extended
family and village-level externalities. In Section 8 we verify that our main results are not driven by
di↵erent birth patterns among the educated and the uneducated, or by non-random missing data.
Section 9 concludes.
2 Literature
Di↵usion of knowledge and human capital externalities are considered essential for explaining cross-
country di↵erences in growth rates (Klenow and Rodriguez-Clare 2005) as well as di↵erences in
regional development (Gennaioli et al. 2012). Moretti (2004), Lucas (1988), Romer (1989) and
many others show that the social benefit of human capital is only partially reflected in the private
return to education. Glaeser et al. (2004), Woodberry (2004), Huillery (2009) and Bolt and Bezemer
(2009) suggest that accumulation of human capital may be a fundamental factor in explaining
di↵erences in long-term development across former colonies.
Our paper contributes to several strands of literature in economic history, development and
labor economics. Most directly, we build on recent literature on the colonial legacy in the area
of education (e.g. Nunn 2009, Nunn 2010, Woodberry and Shah 2004, Huillery 2009), by tracking
down the first students of colonial schools and their descendants. This paper also speaks to the
literature on human capital externalities (e.g. Lucas 1988, Romer 1989, Mankiw et al. 1992) by
confirming its importance for economic development and providing micro-level evidence on the
mechanisms for spatial and temporal spillover of human capital.3
3For a more theoretical treatment of human capital externalities see Murphy et al. (1991), Acemoglu et al. (2000),Marshall (1961), Bils and Klenow (2000), Hendricks (2002), Krueger and Lindahl (2000).
4

The literature on economic and labor market e↵ects of education (e.g. Duflo 2004, Weir and
Knight 2004, Kimenyi et al. 2006) finds that wage and output premiums as well as development
are likely caused by increased human capital. The evidence from this paper supports this claim by
showing sizable e↵ects on living standards, occupational choice, and development in the African
context.
There is also a wide literature concerning the e↵ects of family size on education choice, which
examines the quantity versus quality tradeo↵. For instance, Emerson and Souza (2008) and Parish
and Willis (1993) discuss credit constraints, Cornwell et al. (2005) focuses on economies of scale,
and Jensen (2010) and Abeler et al. (2011) describe the importance of perceptions of actual returns
to education. While the importance of extended families has been questioned in the U.S. (see
Altonji et al. 1992), others find that they play a significant role in Africa and India (see Angelucci
et al. 2010, Cox and Fafchamps 2007, La Ferrara 2003, Shavit and Pierce 1991). Our contribution
stresses the role of extended family externalities, specifically how the presence of a successful uncle
can influence educational choice, not only by relaxing the credit constraints of his family, but also
by signaling the values of education through a living example.
Next, a growing theoretical literature points to the role of aspirations in education choice and
poverty reduction, and describes the existence of a cognitive window and a reference point that
may generate increasing returns to e↵ort (see Dalton et al. 2010, Mookherjee et al. 2010, Ray
2006, Chiapa et al. 2012). This paper provides additional evidence of aspirations; in particular, we
show that parents living closer to a school have higher social networks. We interpret this finding as
evidence of aspirations, because unlike family members, untreated parents did not receive reductions
in credit constraints by the educated. These enhanced social networks in turn increase the education
of parents’ children.
Our results are also consistent with recent findings on peer e↵ects. For example, Lalive and
Cattaneo (2009) and Bobonis and Finan (2009) find that ineligible students have benefited from the
Progresa program in Mexico, due to neighborhood peer e↵ects. In the United States, Borjas (1992)
and Borjas (1995) have shown that the ethnic community in which children grow up determines,
to a large extent, their later labor market outcomes, while Topa (2001) shows local spillovers are
5

particularly strong in areas with less educated workers. Looking at intergenerational transmission
of human capital among the African-American population in the U.S., Sacerdote (2005) finds that
it took about two generations for descendants of slaves to catch up with descendants of free black
people in terms of education. This estimate is very similar to the speed of convergence in education
outcomes that we find in our data, in villages where a school was established.
3 Context
Benin was known as the Kingdom of Dahomey before colonization, and the Republic of Dahomey
1960-75. The country was colonized in 1894 when French troops, led by General Alfred Dodds,
defeated the army of the kingdom after three years of war, and Behanzin, the king, surrendered
the capital city of Abomey. Prior to colonial administration and in the shadow of the slave trade,
Catholic missions were established in the coastal towns of Agoue (1874) and Porto Novo (1864),
and the interior town of Zagnanado (1895). There were two types of missions: those established
in regions with prior European presence in the form of commercial trading posts and military
settlements, such as Porto Novo and Agoue, and those with no prior European influence, such as
Zagnanado.
Vatican records indicate that the evangelization of the “Slave Coast” from the Volta River in
current-day Ghana to the Niger River in Nigeria was one of the main priorities of the Roman
Catholic Church at the end of the 19th Century. An apostolic vicariate, a form of territorial juris-
diction of the Church, was established in 1861 in Agoue at the border between Togo and Dahomey
but was limited to the littoral region (see Figure A.2). But, according to Dupuis (1961), the
Kingdom of Dahomey was “closed” and “impenetrable” and made it very di�cult for the Catholic
missionaries to expand to the hinterland (Dupuis 1961, p. 10). It was only after the Kingdom was
defeated by the French that the missionaries started expanding the boundaries of the apostolic vi-
cariate of Agoue to the central region of Zagnanado and later Ketou. The French government later
sent military explorers further north but met vigorous armed resistance in Atakora, Haut-Niger
and Borgou (French Government Report 1906). The colony was completely pacified only in 1920,
and its capital was located in Porto Novo. The French set up a new territorial administration in
6

the southern and central regions (1908) and later in the northern regions (1913 and 1936).
[Figure A.2 about here.]
Dahomey was thus under the joint administrative control of the apostolic vicariate based in
Agoue representing the Vatican and the colonial government based in Dakar (with local represen-
tation in Porto Novo). The Vatican wanted to maximize religious influence and colonial authorities
wanted to maximize fiscal revenues. The main obstacle to the penetration of the Catholic Church
was the entrenched traditional animist religious practices in the South and the strong Islamic pres-
ence in the North (Dupuis 1961, p. 70). The main constraint to the French colonial rule was the
sporadic armed resistance in the North. In addition to these di�culties, both the Vatican and the
French government had very limited knowledge of the country’s human resources capacity outside
the coastal areas. A detailed report by the French government lamented the opacity of the local
culture (p. 64-71). The report highlighted a high level of hostility towards the colonial presence, its
education system and cultural influence, and provided vivid details of the strange and sometimes
“diabolic” religious practices of the “indigenes” (French Government Report, 1906, p. 62).4
Besides the cultural distance between French settlers and the local population, the lack of
diversity in the occupation and living conditions among these local populations made it nearly
impossible for the colonial government and the missionaries to infer the local level of human capital
without extended interaction with the people.5 But again, cultural distance made such interaction
very di�cult. Given these constraints, one can understand why both the Vatican and the colonial
government made primary education a precondition for their successful “civilizing mission” (Dupuis
1961, p. 69). Indeed, in all the new territories, settlements tended to start with military exploration,
followed by the creation of a school after the region had been pacified. Then, six to ten years after
the regional school was opened, a local civilian administration called a “cercle” was set up. The
school trained religious teachers and civil servants, such as translators, nurses, accountants, and
security guards. The motivation behind this curriculum was for the training native religious teachers
4The report states the following: “Unfortunately, there is among many natives, a high degree of mistrust andresentment vis-a-vis the White settlers, which proves that there is very little contact between White settlers and theAfricans.” (p. 102)
5The vast majority of the “indigenes” were subsistence farmers (see d’Almeida Topor 1995).
7
to increase the rate of Christian conversion, while the recruitment of civil servants increased fiscal
colonial revenues. In line with this policy, a Catholic school was created in Zagnanado in 1895, and
regional public schools were set up in Save (1913), Kandi (1911) and Natitingou (1922). None of
these areas had meaningful European influence, educational or otherwise, at the time the schools
were created.
4 Sampling Procedure
We examine the first schools in four communes:6 Zagnanado, Save, Kandi and Natitingou, as shown
on the map in Figure A.3. Within each commune, we compare the village in which a school was
set up to a nearby village in which no school was established. These treatment and control villages
are within 25 kilometers of each other and are similar in terms of various observable characteristics
such as soil quality, elevation, average rainfall within each commune, as shown in Table A.3 in the
Appendix.
The first-generation data was generated from a sample of students from the four schools and
villagers of about the same age who did not attend school. Then the family of this first generation
was sampled, so that second-generation subjects are the children, nieces or nephews of the first.
The sample of treated individuals in the first generation (call this Treatment 1) is composed of
the first two cohorts of the four primary schools covered in the study, and is based on information
collected from various archives and village elders. In the first generation, Treatment 2 is a sample
of contemporaries of Treatment 1, from villages in which a school was established, but who did
not attend school. The control group is a sample of individuals from a nearby village in which
no school was set up. The Treatment 2 and control samples are composed of fathers, or in some
cases grandfathers, of randomly selected current inhabitants of the village. Selected parents in the
Treatment 2 and control samples are about the same age as the individuals in Treatment 1, and
subject characteristics were verified using several sources, including cemeteries and ID cards from
colonial archives. The total sample size for the first generation was approximately 240, or 60 per
site.6A commune is an administrative region, called a “cercle” in the Colonial period.
8

The second-generation sample was generated from a census of all the children and siblings of
individuals from the first generation. In addition to the children of the first generation, the children
of siblings of first-generation subjects were also included, so that the second generation includes
both the children of the first as well as their nieces and nephews.
5 Endogeneity of Location and Student Selection
Our identification strategy relies on two claims. First, within a given commune and a distance of
about 25 km, the location of schools was partly driven by happenstance and thus near-random.
Second, enrollment was in large part determined by chance or by negative selection. We will discuss
each of these claims in the next subsections.
5.1 School Location: Historical Evidence and Pre-treatment Variables
Our treated units – that is, those who were selected for education – are drawn from four schools,
one Catholic (Zagnanado) and three public (Save, Kandi and Natitingou). The motivations for
establishing these schools were two-fold. The Vatican representative, based in Agoue, wanted to
maximize its religious influence over the local population, while the colonial government based in
Dakar wished to expand into the hinterland after the pacification of the Kingdom of Dahomey
(Dupuis 1961, p. 70). However, both the French government and the Vatican had little knowledge
of the local population aside from regional-level military reports, and government o�cials lamented
the opacity of local culture (p. 64-71) and high level of hostility towards colonial presence, including
its educational and cultural institutions (French Government Report, 1906, p. 62).7
[Figure A.2 about here.]
To illustrate the similarity between treated and untreated villages, Table A.3 reports several
geographic and political features for both treated villages and those nearby, which were chosen as
the control groups. Small di↵erences notwithstanding, there appears to be no systematic contrast
7The kingdom of Dahomey, in fact, had little contact with European institutions of any kind prior to its conquest1894, one year before the school in Zagnanado was created (Dupuis 1961, p. 10).
9

between villages chosen for schools and those not. Northerners were, in fact, particularly resistant
to French education, which colonial o�cers attributed to Islamic influence in the region (p. 117).
Thus, while region selection may have been subject to the financial and cultural imperatives of
the Vatican and French authorities, the location of schools within those regions were quasi-random
and were made without knowledge of human capital di↵erentials or other factors that may have
produced a selection bias. Moreover, the covariate balance presented in Table A.3 demonstrates that
there appeared to be little if any di↵erence between treated and untreated villages. For instance,
the treatment and control villages were part of the same pre-colonial unit; feature nearly identical
distances to port, soil quality, and mean elevation (except for in Zagnanado, but this di↵erence
works against finding an e↵ect since the control village has better soil quality); and shared the same
number of years of resistance to colonial rule.
There were several considerations for settlement choice in Natitingou, Kandi, and Save: the
locations of armed resistance, road quality, and other geographic characteristics such as mean
elevation. Once French authorities found regions that met these considerations, they were agnostic
regarding the exact site within these regions (this study uses a 25 km radius) since there were a
number of suitable villages that were equally as likely to be chosen. The same logic applied for
Catholic missionaries in Zagnanado once they decided on the plateau region.
5.2 Student Selection: Historical Evidence and Pre-treatment Variables
On the basis of available historical evidence, the enrollment of the first generation of students
was a result of two processes: school recruiters requested the local population, often through the
tribal chiefs, to select students; or recruiters, upon first randomly coming across children, asked
permission from the local population to enroll them. For the first scenario, we provide evidence in
support of negative selection of students by families and chiefs. In the second scenario, the selection
was de facto random.
10

5.2.1 Negative Selection
Local elites were opposed to sending their own children to school, because they feared that doing so
would compromise their ability to remain independent of the colonial administration and mission-
aries (Centenaire 1995, p. 72). In Zagnanado and Natitingou, no students came from chief or guild
families. In Save and Kandi among the about sixty students of the first cohort, only two or three
were related to religious priests, traders, or chiefs. Furthermore, the local population was generally
hostile towards colonial education and cultural influence, and hence lacked incentive to send their
brightest children. The French Government report notes: ”Unfortunately, there is among many
natives, a high degree of mistrust and resentment vis--vis the white settlers....The further away you
get from the centers (e.g. the coast), the less likely you are to find people you want to send their
children to school” (French Government Report, 1906).
This phenomenon of negative selection of students for colonial education is not limited to Benin.
Anthropologists have documented similar behavior in India, Papua New Guinea, and China.8 Mead
(2001) for example, in her ethnography of the Manus people describes her first interpreter, a
schoolboy named Banyalo:
“Banyalo was a peculiar representative of historical accident, of the fruition of plans made long
ago. In the early twenties a school had been established in Rabaul and pressure had been put on
local district o�cers to find boys to send away to school. The Manus people of the South Coast,
who were just coming into real and unenthusiastic contact with Europeans, did not wish to send
their cherished small boys away to school. Only the orphaned, the very stupid, the unstable were
selected to go – either to a school where they were to become literate in English, to be trained as
clerks and schoolteachers, or to a trade school to learn carpentry, etc. We analyzed the group who
were away at school in 1928 – four of the ten had histories of instability” [p. 224].
8 Bengal authorities in 1847 reported mistrust and the dismal attendance at their schools, having to pay schoolboysto attend and only attracting the lower classes.
“A good school house has been built at Chuprah, the sudder station at the school is attended by 31 pupils,chiefly from the lower classes of society, shop-keepers and servants. The higher classes take no interest in thematter.”(Bengal 1848, p. 178-181).
From 1870 to 1880s, missionary schools in China tried to attract attendance by a) appealing to girls, whose familiesgenerally did not invest in formal education for them and b) paying both boys and girls.
“Considering the kind of (religious) instruction, it was hardly surprising that even converts were often reluctant tosend their children to the mission schools.” (Barr 1973, p. 60-61).
11

5.2.2 Random Selection
Colonial authorities not only lacked detailed information on village-level characteristics, they also
had limited knowledge of the villagers in their settlement sites. Because schools were established
during military pacification, and before colonial administration was established in the area, there
had been little prior interaction between school o�cials and the local population, and therefore
limited ability to discriminate between potential students. For instance, the school in Zagnanado
was created less than three weeks after the missionaries settled in the region and there are several
accounts of children being randomly picked up from playgrounds and later enrolled with the autho-
rization of the local chief. It is therefore unlikely that the students who were ultimately enrolled
di↵ered systematically from the local populations from which they were drawn.
The inability to discriminate between potential students may also be driven by the near homo-
geneity of the local population. Table A.4 in the Appendix indicates that treated and untreated
families are on average the same size. Furthermore, in control villages (which should be similar
to a treated village prior to treatment) 84.2% of the population are subsistence farmers, with no
means of transportation (see Table 1). Thus, communities at that time appeared to have been
largely homogenous with respect to any characteristics that would have been observable to colonial
administrators and school o�cials.
Whatever heterogeneity existed within villages, the prevailing racial ideology held by the French
colonizers may have led them to believe that inhabitants were all similarly ill equipped for schooling,
which may have limited positive selection. As shown by Bertrand and Mullainathan (2004), racial
discrimination is expressed in two ways. First, people with lighter skin are considered superior to
those with darker skin (level e↵ect). Second – and this is crucial for our identification strategy –
there is little perceived variation in ability or quality among those with dark skin (distributional
e↵ect).9 The classification of individuals by colonial administrators revolved almost exclusively
around physical traits. For example, when describing the lighter skinned Fulani from Northern
Benin, the 1906 Gouvernement de l’Afrique Occidentale Francaise report states:
9In Bertrand and Mullainathan (2004), they found that in the U.S. labor market employers are more likely torespond to a high quality resume if there is a white-sounding name than an African-American-sounding name, butamong African-American resumes, the responses are no di↵erent between high and low quality resumes.
12

“The Fulani have special physical traits: thin, tall, with ‘whitish’ skin color. Their aspect
does not present any negroid trait. Indeed, the Fulani have an aquiline nose, thin lips, straight
forehead, big eyes, silky and non crisp hair. They have a well-deserved reputation of a more
developed intelligence than their black neighbors. They have a delicate and subtle mind” (p. 164).
Thus, only the Fulani were identified as possessing any inherent intelligence, predisposing them
for education. Interestingly, the Fulani ethnic group was comprised largely of herders who were
unavailable for colonial education.10
Our evidence suggests that selection by colonizers was either near-random or based on physical
traits that were uncorrelated with the outcome of interest. In addition, local families were hostile
to colonizers and had incentives to enroll children that were the least predisposed to education.
6 First-Generation E↵ects
6.1 Summary Statistics
Table 1 summarizes the most important variables for the first-generation inhabitants of the villages
in our sample, and compare the first generation of students and their contemporaries. Looking down
the table, we see that setting up schools appears to have had a profound and apparently long-lasting
e↵ect on the children that were chosen to attend schools and their descendants. Among the children
chosen to go to school, almost all (96%) were enrolled for at least three years of primary education
and 10% of them went on to complete secondary education.11
In terms of living standards, those chosen to attend school clearly have superior outcomes to
either the uneducated from the same village, or those from untreated villages. For example, only
14% of the educated students become farmers, while farming is clearly the dominant occupation
among the uneducated (about 80%). We also observe that the educated are more likely to have
running water in their homes (26%), electricity (10%), and to have some means of transportation
(48%). The uneducated in villages with and without schools have worse living standards outcomes
10Even if the Fulani possessed characteristics that could have made them more amenable to education, there isonly one Fulani in our treatment group, specifically in Kandi.
11In the first generation, no one went on to university, which is hardly a surprise given that these children wereborn at the turn of the 20th century and no universities were available in Western Africa at the time.
13

Table 1: Summary Statistics for the First Generation
Treated parentsUntreated parentsin village w/ school
Untreated parentsin village w/o school
Number of siblings 3.370 3.059 2.964(2.366) (2.326) (2.114)[73] [153] [139]
Primary education or more 0.963 0.008 0.008(0.189) (0.092) (0.091)[82] [119] [122]
Secondary education or more 0.098 0.000 0.000(0.299) (0.000) (0.000)[82] [119] [122]
Farmer 0.143 0.784 0.842(0.352) (0.414) (0.367)[84] [111] [95]
Water 0.258 0.146 0.092(0.440) (0.355) (0.290)[89] [164] [152]
Electricity 0.101 0.024 0.007(0.303) (0.155) (0.081)[89] [164] [152]
Means of transportation 0.476 0.182 0.195(0.502) (0.387) (0.397)[84] [154] [149]
Living standards scale 0.677 -0.195 -0.188(1.159) (0.887) (0.835)[84] [151] [143]
Member of party 0.425 0.107 0.050(0.498) (0.311) (0.219)[73] [149] [139]
French language 0.955 0.085 0.013(0.208) (0.280) (0.114)[89] [164] [152]
White friends 0.457 0.084 0.035(0.502) (0.278) (0.186)[70] [143] [141]
Social networks scale 1.661 -0.350 -0.451(0.864) (0.539) (0.425)[49] [99] [103]
Note: Standard deviations are in parentheses. Due to missing values, there are di↵erent number of observationsacross variables, shown in brackets. Means of transportation includes bicycle, motorcycle or car. Mean (SD)of 0.000 (0.000) means that none of the observations had a positive value, for example, none of the untreatedindividuals had secondary education or more.
14

and do not seem to be di↵erent from each other, as we will formally show in the next section (Table
3).
We also include a measure of living standards based on factor analysis using several indicators
such as those listed in the Table 1. Other variables include house wall material, house/land/shop
ownership, household equipment, means of transportation, travel patterns and type of attire. We
see that also in terms of this composite measure of living standards, the educated have clearly
higher scores than the uneducated. Table A.6 in the Appendix gives further details about how to
interpret di↵erent values on the living standards scale.
The presence of a school in a village, however, does seem to have some indirect e↵ect on the
uneducated as well. We expect to observe that the educated are more likely to speak French, have
friends among whites and score higher on a social networks scale. The interesting observation is
that the uneducated in villages with schools seem to also score higher than those in villages without.
The social networks scale was coded based on factor analysis using information about membership
in organizations (religious, business, sports), languages spoken (national, foreign), friends among
whites and other local ethnic groups, and participation in local politics. Table A.7 in the Appendix
gives further details about how to interpret di↵erent values on the social networks scale.
6.2 First-Generation E↵ects: Living standards, Social Networks, and Political
Participation
We first evaluate the e↵ects of being treated with education at the individual or village-level among
the first generation of students and their contemporaries. As we argued in the previous Section,
children were chosen to attend the schools in a near random fashion, or through negative selection.
Given this, the estimated e↵ects of schooling at the individual level in the first generation can
be interpreted as causal e↵ects. To the extent that there might have been negative selection, our
estimates of the individual level e↵ects might be underestimated. The village-level e↵ects can also
be considered causal if the reader is convinced that the school locations were set up in a quasi-
random manner.
The simple reduced-form OLS regressions we estimate are of the following form:
15

Outcomeij = ↵+ �1Iij + �2Vj + ✏ij . (1)
Our outcome variables are education, living standards and social ties, where i identifies the
individual child, and j identifies the village in which they reside. The variables I and V are binary,
and they indicate whether the individual was chosen to attend school and whether he lived in a
village where a school was set up. For example, Iij = 1 and Vj = 1 if child i from village j was
chosen to go to school and a school was set up in village j. If a child grew up in a village where
a school was set up, but was he was not chosen to attend the school, then Iij = 0 and Vj = 1.
Finally, if a child was not selected for school and grew up in a village with no school, then Iij = 0
and Vj = 0. The key coe�cients are �1 and �2 which estimate the causal e↵ect of individual and
village-level treatment, respectively.
Table 2 presents the coe�cients on individual and village-level treatment with education as the
outcome variable. These results, thus, represent a manipulation check. As expected, the coe�cient
on individual-level treatment is positive and highly statistically significant. In the first column in
Table 2, education is measured on a scale from 0 to 3, where 0 indicates no education, 1 indicates
primary school only, 2 indicates secondary school only and 3 indicates university education. From
Table 1 we know that most of the treated children were enrolled for at least three years of primary
school, depending on when they were recruited into the labor force by the colonial administration,
and only about 10% have secondary education. Accordingly, the individual-level coe�cient in
column 2 of Table 2 is very close to 1, while the coe�cient in column 3 is about 0.1.
Looking at the e↵ect of individual and village-level treatment on living standards we see that
in the first generation only the individual-level treatment contributed to higher living standards,
as shown in Table 3. This result is very strong and intuitive – we can deduce that the students
put their knowledge of the French language, their literacy and math skill and understanding of
the colonial state and culture to good use. They were able to get better jobs, and secure better
living standards for their families.12 For example, students were as much as 65 percent less likely
12Many of the students from the first generation were hired as civil servants in the colonial administration andskeptics may argue that they would have better living standards even if they did not learn much in school. However,our results hold also for those who chose other occupations, such as commerce, suggesting that human capital obtained
16
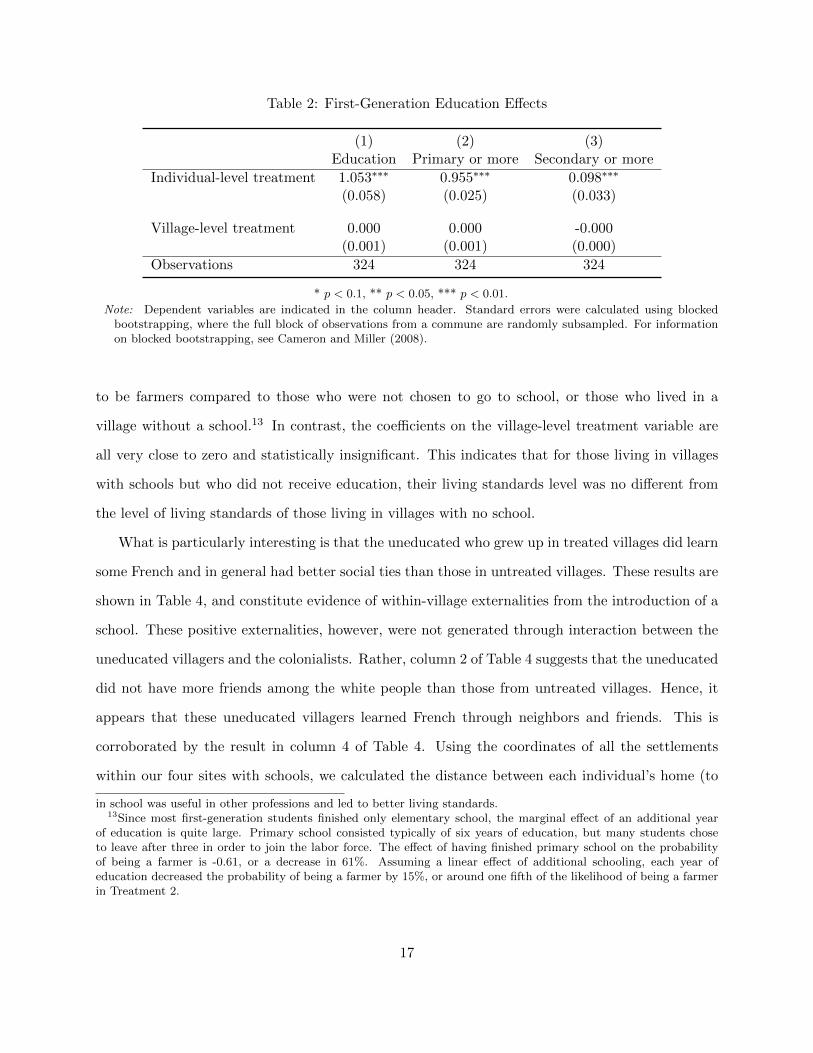
Table 2: First-Generation Education E↵ects
(1) (2) (3)Education Primary or more Secondary or more
Individual-level treatment 1.053⇤⇤⇤ 0.955⇤⇤⇤ 0.098⇤⇤⇤
(0.058) (0.025) (0.033)
Village-level treatment 0.000 0.000 -0.000(0.001) (0.001) (0.000)
Observations 324 324 324
* p < 0.1, ** p < 0.05, *** p < 0.01.
Note: Dependent variables are indicated in the column header. Standard errors were calculated using blockedbootstrapping, where the full block of observations from a commune are randomly subsampled. For informationon blocked bootstrapping, see Cameron and Miller (2008).
to be farmers compared to those who were not chosen to go to school, or those who lived in a
village without a school.13 In contrast, the coe�cients on the village-level treatment variable are
all very close to zero and statistically insignificant. This indicates that for those living in villages
with schools but who did not receive education, their living standards level was no di↵erent from
the level of living standards of those living in villages with no school.
What is particularly interesting is that the uneducated who grew up in treated villages did learn
some French and in general had better social ties than those in untreated villages. These results are
shown in Table 4, and constitute evidence of within-village externalities from the introduction of a
school. These positive externalities, however, were not generated through interaction between the
uneducated villagers and the colonialists. Rather, column 2 of Table 4 suggests that the uneducated
did not have more friends among the white people than those from untreated villages. Hence, it
appears that these uneducated villagers learned French through neighbors and friends. This is
corroborated by the result in column 4 of Table 4. Using the coordinates of all the settlements
within our four sites with schools, we calculated the distance between each individual’s home (to
in school was useful in other professions and led to better living standards.13Since most first-generation students finished only elementary school, the marginal e↵ect of an additional year
of education is quite large. Primary school consisted typically of six years of education, but many students choseto leave after three in order to join the labor force. The e↵ect of having finished primary school on the probabilityof being a farmer is -0.61, or a decrease in 61%. Assuming a linear e↵ect of additional schooling, each year ofeducation decreased the probability of being a farmer by 15%, or around one fifth of the likelihood of being a farmerin Treatment 2.
17

Table 3: First-Generation Living Standards E↵ects
(1) (2) (3) (4) (5)
Farmer Water ElectricityMeans of
transportationLiving
standardsIndividual-level treatment -0.641⇤⇤⇤ 0.112⇤⇤⇤ 0.077⇤⇤⇤ 0.294⇤⇤⇤ 0.872⇤⇤⇤
(0.095) (0.041) (0.012) (0.025) (0.171)
Village-level treatment -0.060 0.055 0.018⇤ -0.012 -0.004(0.116) (0.048) (0.010) (0.018) (0.164)
Observations 291 406 406 388 379
* p < 0.1, ** p < 0.05, *** p < 0.01.
Note: Dependent variables are indicated in the column header. Vehicle can include any means of transportationsuch as bicycle, motorcycle or car. Living standards scale is a factor score comprising a number of variables, fordetails see Table A.6 in the Appendix. Standard errors were calculated using blocked bootstrapping by commune.
the extent we could identify and verify its location during the relevant time after treatment) and
the location of the school.14 We find that those closer to a school had higher social networks, as
measured by our factor scale, suggesting that the e↵ect indeed may run through the neighbors.
The di↵erence in social networks score between the untreated in villages with and without schools
(column 3) is statistically significant at the 5% level, suggesting a development of greater social
activity and organization in the villages that had a school.
These di↵erences in social networks among the uneducated in villages with and without schools
are already suggestive evidence that the introduction of education may have long-lasting e↵ects
that go beyond those individuals who directly receive it. These positive externalities are likely
particularly important in a state of utter underdevelopment, as was the case in turn-of-the-20th-
Century Dahomey.
Part of the social network e↵ect of education may run through higher political participation.
Table 5 shows that students were significantly more likely to campaign for political parties, or
even become full-fledged members. While very few people stood for election to political o�ce in
14What we refer to as a “village” is in fact a group of interconnected smaller settlements – groups of homes. Forexample, in Zagnanado, Treatment 1 and Treatment 2 include 16 settlements: Agnangon, Assiadji, Assiangbome,Ayogo, Azehounholi, Dezonde, Doga, Dovi Dove, Gbenonkpo, Hougbodji, Kinbahoue, Kotyngon, Legbado, N’Dokpo,Sowe, and Zomon. We assign a location for each individual to a settlement, and calculate the distance from thelocation of the school. For Zagnanado, the school was closest to the settlement of Gbenonkpo and farthest from thesettlement of Ayogo.
18

Table 4: First-Generation Social Networks E↵ects
(1) (2) (3) (4)French language White friends Network scale Network scale
Individual-level treatment 0.870⇤⇤⇤ 0.373⇤⇤⇤ 2.010⇤⇤⇤ 1.999⇤⇤⇤
(0.033) (0.016) (0.217) (0.228)
Village-level treatment 0.072⇤⇤⇤ 0.049 0.100⇤⇤⇤
(0.024) (0.039) (0.038)
Distance from school -1.102⇤⇤⇤
(0.382)Observations 406 355 252 238
* p < 0.1, ** p < 0.05, *** p < 0.01.
Note: Dependent variables are indicated in the column header. Network scale is a factor score comprising a numberof variables. The last column includes only individuals under Treatment 1 and Treatment 2 condition. Standarderrors were calculated using blocked bootstrapping by commune.
the period we cover in the first generation (only 12 people in our sample, or 3.22%), they are
by and large concentrated among the treated individuals, allowing for quite a precise estimate of
the treatment e↵ect, despite the low power.15 These findings show a clear e↵ect of education on
political participation. To the best of our knowledge, this is the first (quasi) experimental evidence
in the support of the positive e↵ect of education on political participation in developing countries.16
Table 5: First-Generation Political Participation E↵ects
(1) (2) (3)Campaign for party Member of party Candidate in election
Individual-level treatment 0.339⇤⇤⇤ 0.317⇤⇤⇤ 0.117⇤⇤⇤
(0.053) (0.047) (0.036)
Village-level treatment 0.045 0.057 -0.021⇤⇤⇤
(0.046) (0.061) (0.007)Observations 365 362 373
* p < 0.1, ** p < 0.05, *** p < 0.01.
Note: Dependent variables are indicated in the column header. Standard errors are clustered by commune.
15The negative and statistically significant e↵ect for the village-level e↵ect is due to the fact that no individuals inTreatment 2 ran for election, whereas two individuals in the control group did.
16See Berinsky and Lenz (2011), Campante and Chor (2011), Dee (2004), Glaeser et al. (2007), and Kam andPalmer (2008), among others.
19

The statistically significant results in the first generation of students are hardly a surprise,
but they are important to document as a social phenomenon. Education has brought important
change to the lives of the first generation of students.17 The bigger questions are whether there
were long-lasting e↵ects of education on the descendants of the first students, and whether the
di↵erences between the descendants of the educated and the uneducated grow or diminish through
generations. Before we investigate if the first-generation e↵ects persist over time, we discuss whether
these e↵ects are causal. In the next section, we provide a wide range of evidence which indicates
that both location and student selection were plausibly exogenous.
6.3 Selection on Unobserved Variables: Rosenbaum Bounds
Our goal in this section is to determine how large the di↵erences on unobservables would need to
be between the treated and control individuals in order to eliminate the treatment e↵ect we find.
We do this by following the method proposed in Rosenbaum (2002).
We perform this sensitivity analysis only on the first generation of children in villages where
a school was opened. First we match individuals in treatment and control group based on the
number of siblings they had (our only pre-treatment variable), their commune and their decade of
birth. If all boys in the first generation had the same odds of being selected into treatment, then
the treatment was truly random. Rosenbaum (2002) proposes a framework in which we assume
that certain, say intelligent, kids have higher odds of being selected for treatment and are more
likely to have higher living standards.18
Table 6 resents the results of this exercise. We focus on three binary outcome variables – whether
the individual is a farmer and whether their living standards and measure of social networks are
17Note that in Tables 2, 3 and 4 we have no additional controls and the standard errors are clustered at thecommune level. If we include indicator variables for the decade/commune of birth the estimated coe�cients are verysimilar, but sample sizes drop by about 25% due to missing information about the year of birth. Results are alsorobust to controlling for the number of siblings.
18The details of the framework can be found in Rosenbaum (2002). Briefly, we assume that the probability of beingeducated, ⇡
i
is ⇡i
= Pr(Di
= 1|xi
) = F (�xi
+ �u
i
), where D
i
is the selection of individual i into treatment, xi
is theobservable pretreatment variable, u
i
is the unobservable variable, and we assume that F is the logistic distribution.Then the odds that i is selected are ⇡i
1�⇡i= e
�xi+�ui . When individuals i and j are matched on observables then
x
i
= x
j
, so the odds ratio for i and j is e
�(ui�uj). Clearly, when there is no selection on unobservables u
i
= u
j
andthe odds ratio of being selected for treatment is 1. But if individual i is smarter than j they may have higher oddsof being selected for school so the odds ratio is higher than 1. The method uses the Mantel-Haenszel test statistic asexplained in Becker and Caliendo (2007).
20
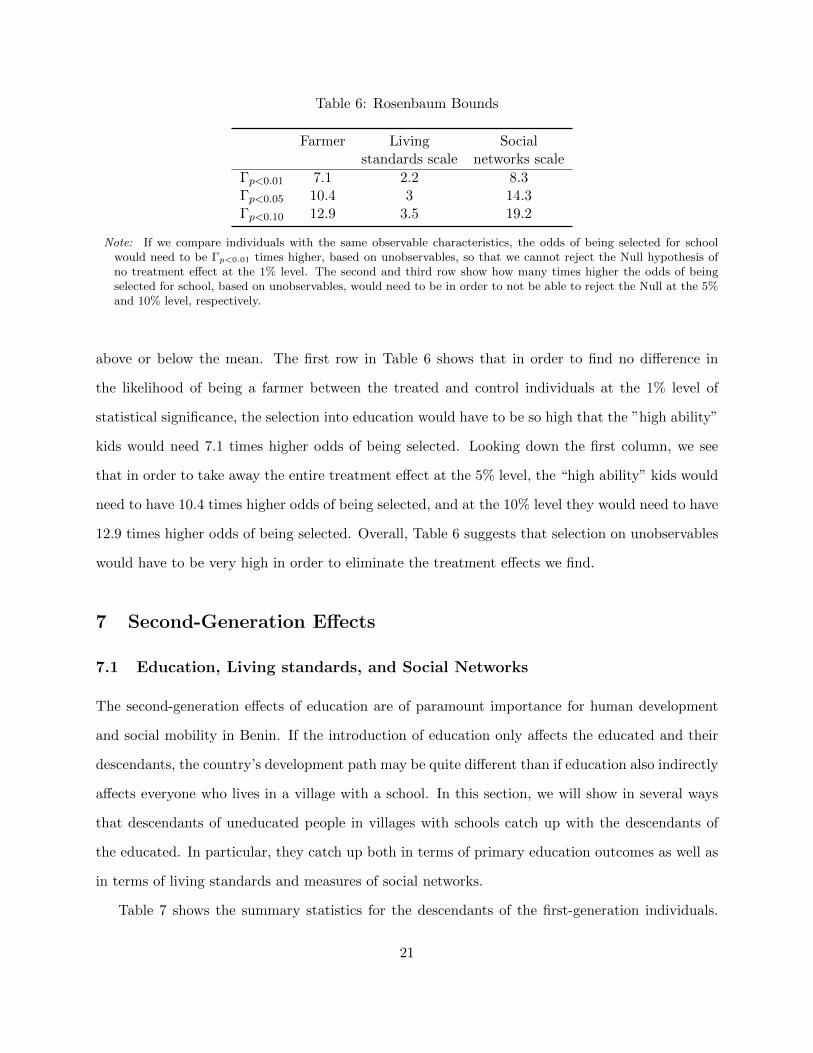
Table 6: Rosenbaum Bounds
Farmer Living Socialstandards scale networks scale
�p<0.01 7.1 2.2 8.3�p<0.05 10.4 3 14.3�p<0.10 12.9 3.5 19.2
Note: If we compare individuals with the same observable characteristics, the odds of being selected for schoolwould need to be �
p<0.01 times higher, based on unobservables, so that we cannot reject the Null hypothesis ofno treatment e↵ect at the 1% level. The second and third row show how many times higher the odds of beingselected for school, based on unobservables, would need to be in order to not be able to reject the Null at the 5%and 10% level, respectively.
above or below the mean. The first row in Table 6 shows that in order to find no di↵erence in
the likelihood of being a farmer between the treated and control individuals at the 1% level of
statistical significance, the selection into education would have to be so high that the ”high ability”
kids would need 7.1 times higher odds of being selected. Looking down the first column, we see
that in order to take away the entire treatment e↵ect at the 5% level, the “high ability” kids would
need to have 10.4 times higher odds of being selected, and at the 10% level they would need to have
12.9 times higher odds of being selected. Overall, Table 6 suggests that selection on unobservables
would have to be very high in order to eliminate the treatment e↵ects we find.
7 Second-Generation E↵ects
7.1 Education, Living standards, and Social Networks
The second-generation e↵ects of education are of paramount importance for human development
and social mobility in Benin. If the introduction of education only a↵ects the educated and their
descendants, the country’s development path may be quite di↵erent than if education also indirectly
a↵ects everyone who lives in a village with a school. In this section, we will show in several ways
that descendants of uneducated people in villages with schools catch up with the descendants of
the educated. In particular, they catch up both in terms of primary education outcomes as well as
in terms of living standards and measures of social networks.
Table 7 shows the summary statistics for the descendants of the first-generation individuals.
21

Table 7: Summary Statistics for the Second Generation
Treatedparents
Untreated parentsin village w/ school
Untreated parentsin village w/o school
Education
Primary or more 0.669 0.520 0.274(0.471) (0.500) (0.446)
Secondary or more 0.375 0.222 0.115(0.484) (0.416) (0.320)
University 0.104 0.050 0.006(0.305) (0.218) (0.075)
Income
Farmer 0.079 0.166 0.386(0.270) (0.372) (0.487)
Water 0.536 0.452 0.385(0.499) (0.498) (0.487)
Electricity 0.636 0.504 0.089(0.482) (0.500) (0.284)
Television 0.536 0.362 0.075(0.499) (0.481) (0.263)
Telephone 0.480 0.281 0.079(0.500) (0.450) (0.270)
Means of transportation 0.369 0.275 0.263(0.483) (0.447) (0.441)
Living standards scale 0.400 -0.007 -0.541(1.021) (0.940) (0.652)
Networks
Speaks French 0.655 0.494 0.248(0.476) (0.500) (0.432)
Speaks English 0.058 0.014 0.007(0.235) (0.116) (0.084)
Social networks scale 0.286 -0.066 -0.350(1.069) (0.959) (0.855)
Observations 772 1026 711
Note: Standard deviations in parentheses. Means of transportation includes bicycle, motorcycle or car.
22

Descendants of the first-generation students exhibit better outcomes across the board, suggesting
that returns to education are strongly transferred across the two generations. But what is partic-
ularly striking is that descendants of untreated parents living in villages with schools seem to be
doing markedly better than descendants of untreated parents in villages without schools. In other
words, there also appears to be a strong second-generation externality from the presence of school.
We begin to examine the di↵erences shown in Table 7 by estimating regressions of the following
type:
Outcomeij = ↵+ �1Iij + �2Vj + �3Xij + µj + ⌧i + ✏ij . (2)
As before, our outcome variables are education, living standards and social ties, where i identifies
the individual child, and j identifies the village in which they reside. The binary variables I and
V indicate individual-level and village-level treatment of the first-generation individuals, in the
same way as in equation 1. Since we have more information collected for the second generation,
we also add a matrix of controls, X, which includes gender and the number of siblings of each
child. Furthermore, because descendants of di↵erent people from the first generation were born
over a very long period of time spanning more than half a century, we also include dummy variables
for the decade of birth of the child, ⌧i, and dummy variables for the commune in which the child
resides, µj .19
Note that in the second generation, the binary variable I is equal to 1 for both children as well
as nieces and nephews of former students. This coding was chosen because extended families were
and still are a crucial social unit in African countries. Of course, there may be di↵erences in the
opportunities available to children and nieces and nephews of the original students as they grow
up. However, for the moment we disregard these di↵erences, and we return to them in depth in
Section 7.3.19Note that in the second generation we are dealing with cross-sectional data observed over a long period of time.
For this reason we include dummies that indicate the decade in which the child was born. While this was not necessaryin the first generation when students were all of similar age, it is needed in the second generation, when the studentsspan many decades because first generation male students had children (or nieces and nephews) at di↵erent pointsin life. No time subscripts are used because we do not observe individuals at multiple points in time, i.e. this is nota panel dataset. We closely follow the model setup of Duflo and Saez (2003).
23

Table 8: Second-Generation Education E↵ects
(1) (2) (3) (4)
EducationPrimaryor more
Secondaryor more
University
Individual-level treatment 0.374⇤⇤⇤ 0.144⇤⇤⇤ 0.162⇤⇤⇤ 0.067⇤⇤⇤
(0.087) (0.042) (0.038) (0.022)
Village-level treatment 0.566⇤⇤⇤ 0.345⇤⇤⇤ 0.163⇤⇤⇤ 0.058⇤⇤⇤
(0.065) (0.035) (0.029) (0.015)Observations 1898 1898 1898 1898
* p < 0.1, ** p < 0.05, *** p < 0.01.
Note: Dependent variables are indicated in the column header. Standard errors are clustered by extended family.All regressions control for gender, indicator for child or nephew/niece, number of siblings, and include communeand decade dummies.
Table 8 presents the second-generation regression results for education. The most striking
finding is that the coe�cient on village-level treatment, unlike in the first generation, is large
and statistically significant. This indicates that descendants of the uneducated from villages with
schools have significantly more education than descendants of the uneducated from villages without
schools. This di↵erence in education outcomes is substantively large, statistically significant at the
1% level, and it appears at all education levels – primary, secondary and university.
Perhaps even more striking is the finding from columns 1 and 2, that the coe�cient on village-
level treatment is greater than the coe�cient on the individual-level treatment indicator. This
means that simply growing up in village with a school has a big positive e↵ect on descendants’ edu-
cation, while the additional positive e↵ect of having an educated parent or uncle is smaller. Looking
at the individual and village-level coe�cients for secondary and university education (columns 3
and 4), both are still highly statistically significant, but now they are of comparable magnitude.
This suggests that at higher levels of education, the descendants of educated fathers or uncles are
twice as likely to go to secondary school or university as descendants of uneducated parents from
villages with schools. For example, in the case of secondary education, a descendant of uneducated
parents from a village with a school, ceteris paribus, has about a 17% chance of attending secondary
school, while the chance that a descendant of an educated parent or uncle attends secondary school
is 16 percentage points higher. These are sizable e↵ects.
24
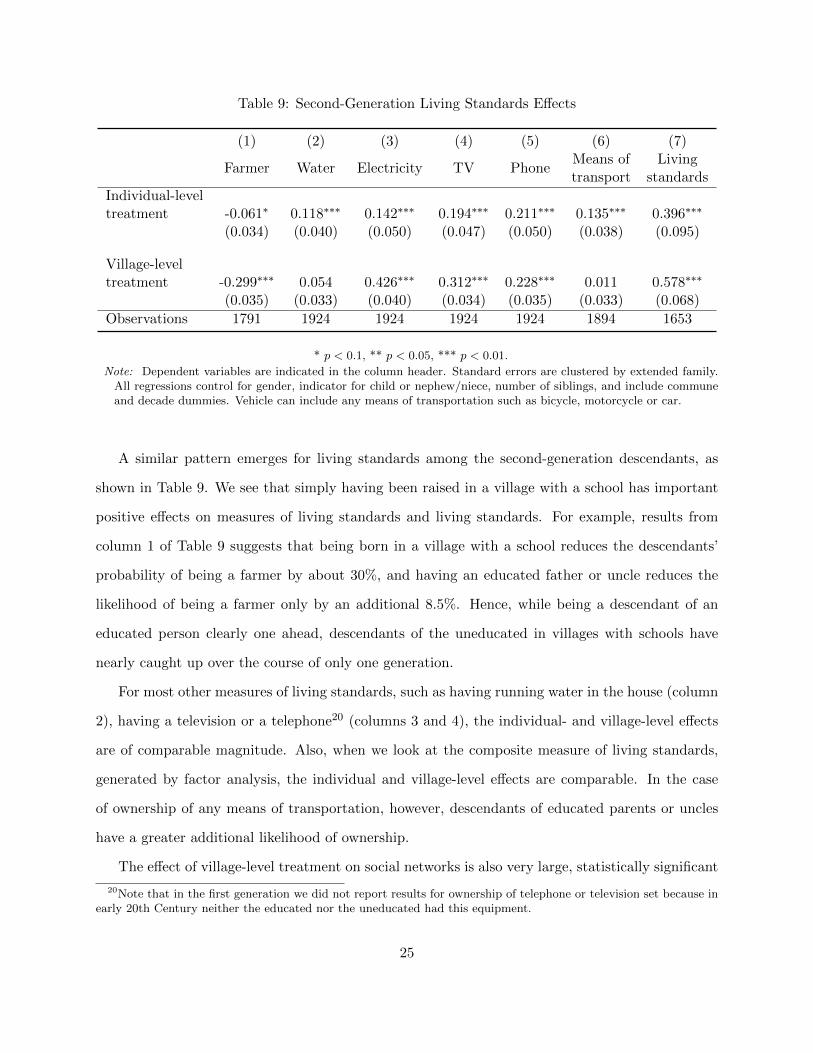
Table 9: Second-Generation Living Standards E↵ects
(1) (2) (3) (4) (5) (6) (7)
Farmer Water Electricity TV PhoneMeans oftransport
Livingstandards
Individual-leveltreatment -0.061⇤ 0.118⇤⇤⇤ 0.142⇤⇤⇤ 0.194⇤⇤⇤ 0.211⇤⇤⇤ 0.135⇤⇤⇤ 0.396⇤⇤⇤
(0.034) (0.040) (0.050) (0.047) (0.050) (0.038) (0.095)
Village-leveltreatment -0.299⇤⇤⇤ 0.054 0.426⇤⇤⇤ 0.312⇤⇤⇤ 0.228⇤⇤⇤ 0.011 0.578⇤⇤⇤
(0.035) (0.033) (0.040) (0.034) (0.035) (0.033) (0.068)Observations 1791 1924 1924 1924 1924 1894 1653
* p < 0.1, ** p < 0.05, *** p < 0.01.
Note: Dependent variables are indicated in the column header. Standard errors are clustered by extended family.All regressions control for gender, indicator for child or nephew/niece, number of siblings, and include communeand decade dummies. Vehicle can include any means of transportation such as bicycle, motorcycle or car.
A similar pattern emerges for living standards among the second-generation descendants, as
shown in Table 9. We see that simply having been raised in a village with a school has important
positive e↵ects on measures of living standards and living standards. For example, results from
column 1 of Table 9 suggests that being born in a village with a school reduces the descendants’
probability of being a farmer by about 30%, and having an educated father or uncle reduces the
likelihood of being a farmer only by an additional 8.5%. Hence, while being a descendant of an
educated person clearly one ahead, descendants of the uneducated in villages with schools have
nearly caught up over the course of only one generation.
For most other measures of living standards, such as having running water in the house (column
2), having a television or a telephone20 (columns 3 and 4), the individual- and village-level e↵ects
are of comparable magnitude. Also, when we look at the composite measure of living standards,
generated by factor analysis, the individual and village-level e↵ects are comparable. In the case
of ownership of any means of transportation, however, descendants of educated parents or uncles
have a greater additional likelihood of ownership.
The e↵ect of village-level treatment on social networks is also very large, statistically significant
20Note that in the first generation we did not report results for ownership of telephone or television set because inearly 20th Century neither the educated nor the uneducated had this equipment.
25

Table 10: Second-Generation Social Networks E↵ects
(1) (2) (3) (4)Speaks French Speaks English White friends Social networks scale
Individual-leveltreatment 0.167⇤⇤⇤ 0.052⇤⇤⇤ 0.050⇤⇤ 0.423⇤⇤⇤
(0.044) (0.017) (0.023) (0.090)
Village-leveltreatment 0.326⇤⇤⇤ 0.011 0.039⇤⇤⇤ 0.427⇤⇤⇤
(0.037) (0.008) (0.014) (0.083)Observations 1925 1925 1496 1841
* p < 0.1, ** p < 0.05, *** p < 0.01.
Note: Dependent variables are indicated in the column header. Standard errors are clustered by extended family.All regressions control for gender, indicator for child or nephew/niece, number of siblings, and include communeand decade dummies.
and consistent across measures. In particular, when looking at knowledge of French we again see
that just growing up in a village with a school increases the likelihood that the descendent speaks
French by about 33%, and the additional e↵ect of being a descendent of an educated person is a
further 16 percentage points. In the case of knowledge of English and having white friends, however,
the additional e↵ect of being a descendant of an educated person is large, which is reasonable since
it requires interaction with people outside the traditional social milieu.
Overall, there is one very big di↵erence in results across the first and second generation. In
the first generation, only those who were randomly picked to attend schools reaped the benefits
of education. In other words, only the individual-level treatment variable produces positive and
statistically significant e↵ects on our two main outcomes of interest – education and living standards.
The only discernible positive e↵ect on the contemporaries of students who did not go to school is
that they learned a bit more French and began to develop better social networks than those in
villages where no schools were set up.
In contrast, in the second generation across all outcomes we see that just having grow up in
a village with a school positively a↵ects education and living standards. That is, the village-
level treatment e↵ect is now consistently positive and statistically significant, in addition to the
individual-level treatment e↵ect. We take this as an indication that the descendants of the une-
26
ducated are catching up, and catching up fast, especially in terms of living standards and social
networks.
We argue that higher human capital is the primary reason why the descendants of the educated
and the uneducated converge in outcomes in treated villages. This convergence, especially in
living standards, may also run through greater development of the village, better employment
opportunities after the school was established, or social networks and connections developed through
the school. However, with the data that we have, we cannot and do not attempt to separate these
e↵ects.21 This challenge is left for future research.
7.2 Human Capital as Mechanism: Suggestive Evidence
In this section, we look at a subset of the second generation who were born in one village and
after schooling-age moved to another village. In this way we attempt to separate the e↵ect of
human capital and the e↵ect of other things (such as connections) that an individual also gains
through education. We assume that when a person moves to another village they only carry their
human capital with them, which they obtained in school or by interacting with educated people in
the village with a school. In contrast, we assume they cannot carry with them the networks and
connections they acquired in the village where they grew up. Hence, if we see that being treated
leads to better outcomes among migrants, we are more likely to believe a human capital story.
Table 11 presents results for the subset of migrants. Overall, the results are quite similar as
those in Tables 9 and 10, of the same sign and typically comparable magnitude. The result for
white friends is no longer statistically significant, which is likely due to the small sample size and
the fact that there are generally few individuals in our sample with white friends. The results are
broadly supportive of our claim that better economic outcomes among descendants of the treated
are due to higher human capital.
Of course, we treat these findings only as suggestive evidence in support of the human capital
mechanism. A major problem is that the migration decision is not random. Those who move are
21We can observe, however, that there are “development e↵ects” from opening a school. In Table A.5 in theAppendix we see that treated villages today typically have more schools than control villages, suggesting that theopening of a school during colonial times had a long-lasting e↵ect of “attracting” more new schools.
27

Table 11: Second-Generation Social Networks E↵ects among those who migrated
(1) (2) (3) (4)Farmer Living standards scale Social networks scale White friends
Individual-level-0.140⇤⇤⇤ 0.573⇤⇤ 0.509⇤⇤⇤ 0.079
treatment (0.049) (0.222) (0.161) (0.049)
Village-level-0.349⇤⇤⇤ 0.434⇤⇤⇤ 0.561⇤⇤⇤ 0.027
treatment (0.078) (0.148) (0.133) (0.040)Observations 472 434 490 353
* p < 0.1, ** p < 0.05, *** p < 0.01.
Note: Dependent variables are indicated in the column header. Standard errors are clustered by extended family.All regressions control for gender, indicator for child or nephew/niece, number of siblings, and include communeand decade dummies.
likely to move because they expect good earning opportunities at the new location. The same
characteristics that make an individual success at the new location might also be correlated with
the success of their parent or uncle and their education level.
7.3 Family Tax: Do Nieces and Nephews Perform as Well as Children?
So far we have shown that in the first generation the educated have better outcomes than the
uneducated, and that in the second generation the descendants of the educated have better out-
comes. Under “descendants” we included both the direct descendants (i.e. children of the original
students) as well as the indirect descendants (i.e. nieces and nephews of the students). The natural
question arises – do the children accrue higher benefits from their parent’s education than nieces
and nephews? The answer to this question is given in Table 12 where we compare the average
outcomes of children of the students, and nieces and nephews of the original students to all other
descendants.
Some readers may find it surprising that children of the students do not seem to be performing
any better than their nieces and nephews, as indicated through the F-test in the last row of Table
12. We find that this demonstrates the strength of extended family networks in Western Africa
and the pressure on successful individuals to support their kin. It is true that the children of the
28

Table 12: Outcomes for Children and Extended Family Descendants of the Students
(1) (2) (3) (4)
EducationPrimaryor more
Secondaryor more
University
Student child⇥ Ind. treatment 0.642⇤⇤⇤ 0.287⇤⇤⇤ 0.259⇤⇤⇤ 0.096⇤⇤⇤
(0.101) (0.047) (0.045) (0.029)
Student niece/nephew⇥ Ind. treatment 0.503⇤⇤⇤ 0.205⇤⇤⇤ 0.184⇤⇤⇤ 0.114⇤⇤⇤
(0.086) (0.040) (0.038) (0.029)Observations 2396 2396 2396 2396F-test p-value, child=niece/nephew 0.171 0.082 0.138 0.655
* p < 0.1, ** p < 0.05, *** p < 0.01.
Note: Dependent variables are indicated in the column header. Standard errors are clustered by extended family.All regressions control for gender, number of siblings, and include commune and decade dummies. The lastrow shows the p-value from an F-test of the di↵erence between the two coe�cients presented in the table (nullhypothesis is that of no di↵erence).
former students tend to have more primary education than nieces and nephews, but this di↵erence
is statistically significant only at the ten percent level. For all the other education levels, the
di↵erence between children and nieces and nephews is statistically insignificant.
If we acknowledge the strength of extended family networks, we would expect that nieces and
nephews of the former students, even though they were born to uneducated parents, to do signifi-
cantly better than descendants of uneducated parents who do not have any educated members in
the extended family. This is confirmed in the second row of Table 12.22
We see that across all education outcomes having just one educated person in the extended
family makes a large di↵erence to the outcomes of the nieces and nephews. These descendants have
better education at all education levels than descendants (either children on nieces and nephews)
in families where no one was educated. These e↵ects are statistically significant and substantial
– they are 20% more likely to have primary school education, 19% more likely to have secondary
school education and 11% more likely to go to university.
22We confirm that children and nieces and nephews in Treatment 2 and control do not have di↵erent outcomes – asthey should not, given that none of the parents in their extended family had formal education. Results are availableupon request.
29

What may be happening is that educated uncles tend to support their nieces and nephews
almost as much as their own children – we call this the extended family tax on education. One way
to test this mechanism is to compare educational attainment of daughters/sons and nieces/nephews
in small and large extended families. If the family tax mechanism exists, we could imagine that
as the extended family increases, the ability of the educated uncle to support all the nieces and
nephews may be stretched too thin. In order words, the di↵erence between daughters/sons and
nieces/nephews may be increasing as the size of the extended family size increases.23 Results
presented in Figure 1 seem to support this mechanism.
In Figure 1 we see that the di↵erence in education outcomes between daughters/sons and
nieces/nephews becomes negative and statistically significant if the logged extended family size
exceeds about 3 (i.e. the true extended family size exceeds about 20). Given such a large extended
family, the educated uncle must prioritize between educating his own children and educating the
extended family, and the data suggest that at around this threshold level, education of own children
becomes more important than education of the nieces and nephews.
Note that our finding of an extended family tax is in discord with findings in the developed
world that extended families are not altruistically linked (Altonji et al. 1992).24 How does the
existence of an extended family tax a↵ect the human development of West Africa, and Benin in
particular? Clearly, in the aggregate, there is a positive side of the family tax as it allows more
promising children to get high levels of education, especially university education. However, there
is also a negative side. As shown in Table 14 uneducated siblings of initial students choose to
have more children than their uneducated counterparts in the same villages with a school. Hence,
these parents choose to have more children then they could raise independently. Educated parents,
23An alternative plausible explanation might be that extended family externality runs through aspirations. Theeducated uncle may serve as a role model to both nieces and nephews and their parents. Similarly, nieces and nephewsmay increase their educational attainment through emulation and learning from the children of the educated uncle.It is possible that as the extended family grows, ties to the educated uncles of any one niece and nephew becomeweaker, thus weakening the power of aspirations and emulation. However, based on our knowledge of extended familynetworks in Benin, this is unlikely.
24Our findings are also related to the literature on sibling rivalry in developing countries. In Burkina Faso, Akreshet al. (2010) have found that if one child has higher IQ than his or her sibling, this child receives a disproportionatelylarge share of the families investment in education. In other words, a child is picked as the “hope of the family” andsupported at the expense of less-abled siblings. Other papers that have found evidence of sibling rivalry in developingcountries include Morduch (2000), Garg and Morduch (1998), Parish and Willis (1993) and Binder (1998), often inthe context of allocation of resources across male and female children.
30

Figure 1: Education and Family Tax in Extended Families
Note: All models control for gender, number of siblings, parents’ wealth, and include commune and decade dummies.Marginal e↵ects are calculated by keeping all remaining regressors at their means or medians. Gray lines representthe 95 percent confidence interval based on the standard errors clustered by extended family.
knowing that their siblings will expect support, may decide that exerting high e↵ort to earn more
may not be optimal given that they will have to give up an increasing amount to their increasing
extended family. With our analysis here, we only acknowledge the apparent existence of family
tax. Currently, we cannot discern the magnitude of the positive and negative e↵ects of family tax
and we leave these challenges for future work.
The results contribute to the growing development research on the institutions of kin system, a
“social contract of mutual assistance among members of an extended family” (Ho↵ and Sen 2005, p.
2).25 Our results documents the way in which the kin system can both be a “vehicle of progress”
25See also Platteau (2000), Comola and Fafchamps (2012), and Barr and Stein (2008).
31

or “instrument of stagnation” (Ho↵ and Sen 2005). On the one hand, it allows the benefits of
education to spill over quite rapidly to a large number of near and distant relatives and neighbors.
On the other hand, it creates a strong distributive pressure on the educated and successful member
of the extended family in the form of a family tax. Faced with harsh social sanctions if they do
not redistribute, they can choose to invest in less profitable activities, so long that they are less
observable to family members.26
7.4 Aspirations: A Determinant of Village-Level Externalities
In this section we aim to explain how the children of the uneducated in villages with schools began
to catch up with the children of the educated. We saw in section 7 that village-level treatment
is associated with higher education, living standards and social network outcomes in the second
generation. But, of course, there is variation in outcomes. In this section, we identify which
uneducated families in villages with schools are more likely to produce educated children. The
channel that we focus on is that of higher aspirations developed through greater social ties with
the educated locals and the white colonialists.
A problem in estimating the causal e↵ect of a parent’s social network on his children’s education
is possible endogeneity. Parents with extensive social networks are more likely to be more ambi-
tious and possess superior abilities, characteristics that lead to greater social networks and greater
aspirations for their children’s education, living standards, etc. One way to solve this problem is to
instrument for parents’ social networks with their distance from the location of the school where
they could interact with the better educated locals and colonialists. This is what we do in Table
13.27
The first stage in Table 13 is the same in each regression because we are using distance from
school to instrument for parents’ social networks in each regression. Next, we use the variation in
parents’ social network that can be explained by distance and find that it is associated with higher
26See Baland et al. (2011), Dupas and Robinson (2009), and Jakiela and Ozier (2012) for evidence for this type ofbehavior.
27In Table 13 we can only use information on parents and their own children, hence the number of observations isrelatively low (499). We cannot use the full set of nephews and nieces because we do not have information about thesocial networks of the parents of nephews and nieces (we only have information about their one uncle).
32

Table 13: Parents’ Social Networks as Determinants of Descendants’ Education
(1) (2) (3) (4)Education Primary or more Secondary or more University
Social networks scale 0.808⇤⇤ 0.406⇤⇤ 0.293⇤⇤ 0.109⇤
(0.349) (0.207) (0.139) (0.065)
First stage
Distance from school -3.623⇤⇤⇤ -3.623⇤⇤⇤ -3.623⇤⇤⇤ -3.623⇤⇤⇤
(1.228) (1.228) (1.228) (1.228)Observations 499 499 499 499F-statistic 8.698 8.698 8.698 8.698p-value 0.004 0.004 0.004 0.004Anderson-Rubin p-value 0.005 0.010 0.027 0.114
* p < 0.1, ** p < 0.05, *** p < 0.01.
Note: Dependent variables are indicated in the column header. Social network scale is a factor score comprising anumber of variables. Social network scale is that of the parents. It is instrumented by the distance of the parents’household from the school in the nearest village. Standard errors are clustered by extended family. All regressionscontrol for gender, number of siblings, and include commune and decade dummies.
education of their children.28 This positive relationship is statistically significant at the 5% level.
What do these findings suggest? Our interpretation is that greater interaction with the edu-
cated locals and the colonialists, simply because they set up a school in the vicinity, increases the
aspirations that parents have for their children. This then induces parents to invest more in their
children’s education and leads to better outcomes at the village-level where schools were set up.
8 Robustness Checks
8.1 Addressing Possible Bias due to Di↵erent Birth Patterns
We have found significant di↵erences among the descendants of the educated and the uneducated
from villages with and without schools as described in Section 7, yet we must be careful when
28To alleviate concern about distance to school being a weak instrument, we report the Anderson-Rubin p-valueswhich test whether all the excluded instruments are relevant. This test is satisfied in the case of primary andsecondary education, and the overall education variable. However, because the AR test also includes the second stageregressors, and there is little variation in the data when it comes to university education, the result is weaker andshould be treated with additional caution.
33

interpreting these di↵erences. For causal interpretation, we need the individual- and village-level
assignment to be random. However, in the second generation the individual-level treatment is not
entirely random because parents choose how many children to have. In particular, in Benin, more
educated parents tend to be richer and to have more children, nieces and nephews, as documented
in Table 14.
Table 14: Treatment Assignment and Family Size
Treated Untreated parents Untreated parentsparents in village w/ school in village w/o school
ChildrenAverage number 5.49 4.98 3.17Di↵erence from treated -0.51 -2.32p-value 0.20 0.00
DescendantsAverage number 5.88 4.02 2.88Di↵erence from treated -1.86 -3.00p-value 0.00 0.00
Note: Extended family descendants include all reported nieces, nephews and foster children. For very large families,our sampling design includes only a random subsample of all extended family descendants; this design should nota↵ect the accuracy of the test reported. p-values are based on the Mann-Whitney-Wilcoxen di↵erence of meanstest. Results are qualitatively equivalent if using the traditional two-groups di↵erence of means t-test or theKolmogorov-Smirnov test of the equality of distributions.
How may this bias our results? When the treatment assignment a↵ects the number of children
and nieces and nephews born to the educated, we are faced with a selection problem. A good way
to think about this problem is in terms of “principal strata” (Frangakis and Rubin 2002). Among
the descendants of the educated, there are some children who would have been born regardless of
parent’s/uncle’s treatment status (i.e. always-takers, or always born) and there are children who
were born only because their parent/uncle was treated (i.e. compliers), and hence had funds to raise
an additional child. Among the descendants of the uneducated, there are again the always-takers,
who would have been born regardless of treatment status, and possibly some defiers, i.e. those who
are born only if their parent is uneducated.
The estimator in equation 2 makes a “naive” comparison of the treated and control descendants,
assuming that the underlying populations and their potential outcomes are the same. However, we
34

infer that the two groups do not represent the same population because of the evidence shown above
– that treated parents have more kids than parents in the control group. For causal interpretation,
we may only compare the always-takers, i.e. those who would have been born regardless of treatment
status (Horowitz and Manski 2000, Lee 2009, Zhang and Rubin 2003, Zhang et al. 2009). We try
to do this in two ways.
First, conditional on having children, a family will at least have a first-born. Hence, for families
with children, it is reasonable to consider the first-born the always-born. We also need to assume
that monotonicity holds, i.e. that there are no defiers in the control group. This framework allows
us to assume that the only subpopulation in the control group is the always-born.29 Table 15
shows the main results, for education, living standards scale, and social network scale on this
subpopulation. The results are substantively very similar to those shown above.
Table 15: Outcomes for First-Born Descendants Only
(1) (2) (3)Education Living standards scale Social networks scale
Individual-level treatment 0.297⇤⇤ 0.535⇤⇤⇤ 0.374⇤⇤⇤
(0.126) (0.141) (0.128)
Village-level treatment 0.451⇤⇤⇤ 0.393⇤⇤⇤ 0.408⇤⇤⇤
(0.084) (0.102) (0.112)Observations 383 341 375
* p < 0.1, ** p < 0.05, *** p < 0.01.
Note: Dependent variables are indicated in the column header. Standard errors are clustered by extended family.All regressions control for gender, number of siblings, and include commune and decade dummies.
Another approach is to calculate bounds on the treatment e↵ect, according to Lee (2009), which
we present in Table 16. The key assumption again is that monotonicity holds. In order to calculate
the lower and upper bounds for our treatment e↵ect, we need to focus on the compliers in the
treatment group. To determine the share of compliers in the treatment group, we should take the
di↵erence between those who were born in the treatment group and those who were born in the
29Is the monotonicity assumption reasonable in our case? We believe that it is. If this assumption were violated,then there exist people who have fewer kids if they are educated then if they had been uneducated. In the aftermathof the slave trade that decimated the local population over four centuries, people in 20th Century Dahomey had asmany children as they could a↵ord (see Manning 1982).Hence, the educated would almost never have fewer childrenthen the uneducated.
35

control group (i.e. the di↵erence between the always-born and compliers in the treatment group
and the always-born in the control group), and express that as a share of the born individuals in
the treatment group. Next, since we cannot identify exactly who these compliers are, just how
many of them there are, we construct the best- and the worst-case scenarios, as in Lee (2009). In
the best case, all compliers have the lowest education level among the treated who were born. We
then “trim” the low end of the distribution of education among the treated by the share of the
compliers, and recalculate the mean education among treated and calculate the treatment e↵ect
with this mean (by subtracting the mean education of the control group). Since the low end of the
distribution is trimmed, the new mean of the treated will be higher, and the new treatment e↵ect
will be higher. This is the upper bound. In the worst case, all compliers have the highest education
level among the treated who were employed. We then trim the high end of the distribution of
education among the treated by the share of the compliers, and recalculate the treated mean and
the treatment e↵ect. Now, the treatment mean and the treatment e↵ect will be lower, which gives
the lower bound.
The calculated best and worst case bounds are presented in Table 16.30 Individual-level e↵ects
are positive and both the lower and upper bound of the ATE are statistically significant. This is
true for all outcomes – education, living standards and networks scales. For village-level e↵ects,
the worst- and best-case bounds are wider, because the di↵erence in the number of descendants
in villages with and without schools is larger (see Table 14). The estimated lower bound for the
village-level e↵ect is typically just below zero, suggesting that in the worst-case scenario, we cannot
claim the existence of a village-level e↵ect. Yet, the worst-case scenario – that compliers have
higher potential outcomes than the always-born – is pretty extreme, and most likely a positive
e↵ect remains.30Note that results in Table 16 are calculated only for children. If nieces and nephews were included, then the
ATE shown in this table would be the same as the ATE in column 1 of Table 8, column 7 of Table 9 and column 4of Table 10. We exclude nieces and nephews because we do not have precise information as to which nuclear familythey belong (i.e. how many brothers and sisters they have) which is necessary for the computations.
36

Table 16: Bounds on Treatment E↵ect for Children with Selective Birth
Treatment ATE “Worst Case” “Best Case”Bound Bound
EducationIndividual-level 0.483 (0.108)⇤⇤⇤ 0.400 (0.102)⇤⇤⇤ 0.539 (0.105)⇤⇤⇤
Village-level 0.427 (0.075)⇤⇤⇤ -0.115 (0.048)⇤⇤ 0.929 (0.076)⇤⇤⇤
Living standards scaleIndividual-level 0.502 (0.116)⇤⇤⇤ 0.416 (0.112)⇤⇤⇤ 0.568 (0.118)⇤⇤⇤
Village-level 0.569 (0.077)⇤⇤⇤ -0.069 (0.054) 1.093 (0.082)⇤⇤⇤
Networks scaleIndividual-level 0.444 (0.121)⇤⇤⇤ 0.293 (0.103)⇤⇤⇤ 0.529 (0.118)⇤⇤⇤
Village-level 0.231 (0.090)⇤⇤ -0.260 (0.075)⇤⇤⇤ 0.777 (0.087)⇤⇤⇤
* p < 0.1, ** p < 0.05, *** p < 0.01.
Note: The main entries in cells are estimates from the regression of each dependent variable, indicated in thefirst column, on individual-level and village-level treatment. The entries in the parentheses are the standarderrors, clustered by extended family. Bounds are obtained using the method of Lee (2009). No other controls areused, but the results (available upon request) are qualitatively similar when controls from the models reportedin previous tables are included. The share of unborn children in any group (the “never-born”), needed for thetrimming procedure, is not observed. It is assumed that the largest family within the wealthiest 50 percent in thetreatment group had attained an ideal family size. The unborn are obtained for every other family by subtractingtheir number of children from the family with the largest number of children. Results are qualitatively similarwhen the share of the unborn children in each control group is alternatively calculated by taking the ratio of theaverage number of children in that group and the average number of children in the treatment group.
8.2 Addressing Possible Bias due to Non-Random Missingness
A natural concern is that our dataset fails to capture the less successful and prosperous individuals
in the first generation, as well as their descendants. Since we have shown that success is correlated
with education, this may imply that we are less likely to observe individuals in control groups than
in treatment. Therefore, our comparisons may overestimate the returns to education. There are
two ways in which this bias may arise. First, we may fail to observe any data on less successful
individuals due to biased sampling. However, our design discussed above ensures against that.
Second, conditional on sampling, we may fail to observe less successful individuals if they are
more likely to have missing values for outcomes of interest. This may be a consequence of recall bias
– our respondents may be more likely to remember the outcomes of the more successful relatives.
There is some evidence of this in our data. For example, the rate of missingness on education is
significantly lower among the treated first-generation individuals (8%) than those in control 1 and
37

control 2 (27% and 20%, respectively). Since our estimates in the previous sections discard missing
values, our estimates may be biased. We therefore perform several checks of the robustness of our
findings to the potentially non-random patterns of missingness.
First, we perform a worst-case scenario exercise similar in logic to that in the previous section.
We assume that a missing value on some variable of interest is due to the value of that particular
variable, i.e. that missingness is non-ignorable (Little and Rubin 1987). As we focus on the out-
comes examined in the previous sections, we are assuming that missingness is caused by treatment
status. We further assume that all missing values in treatment contain the lowest outcome, and
all missing values in control groups contain the highest outcome. This is the worst-case scenario
for our estimates: assigning the lowest (highest) outcome in treatment (control) will down-weight
the e↵ects of education shown above in proportion to the share of missing values in each treatment
group.
Table A.1 shows the first-generation results of this exercise.31 While the results are somewhat
weaker, even under the worst-case scenario the sign and the significance of most of our earlier results
are entirely preserved. This is the case even for the outcomes for which missingness is relatively
substantial, such as the farmer indicator, where almost 30% of observations are missing.
[Tables A.1 and A.2 about here.]
Table A.2 shows the results of the same exercise for the descendants. Again, our results are
mostly identical. Note for example that the worst-case scenario assumes that all missing data on
education in the control group contain the achievement of university education, whereas all missing
data in treatment indicate individuals without education. Nevertheless, the worst-case scenario
estimates still point to significant positive e↵ects of parents’ education on descendants’ outcomes.
Recall bias may not be entirely non-ignorable, i.e. missingness on our outcome data may be
due to some other factors observable in the data. For example, our respondents may be more likely
to recall outcomes for children than for nephews and nieces, for smaller families, or for individuals
who were born later. Figure 2 examines the evidence for such possibilities. It plots the p-value
31We exclude the factor scales for living standards and networks because we show the results of many of theirindividual components. Moreover, these scales are continuous, and it is less clear what value to assign. For example,assigning the minimum in treatment and the maximum in control represents an extremely conservative test.
38
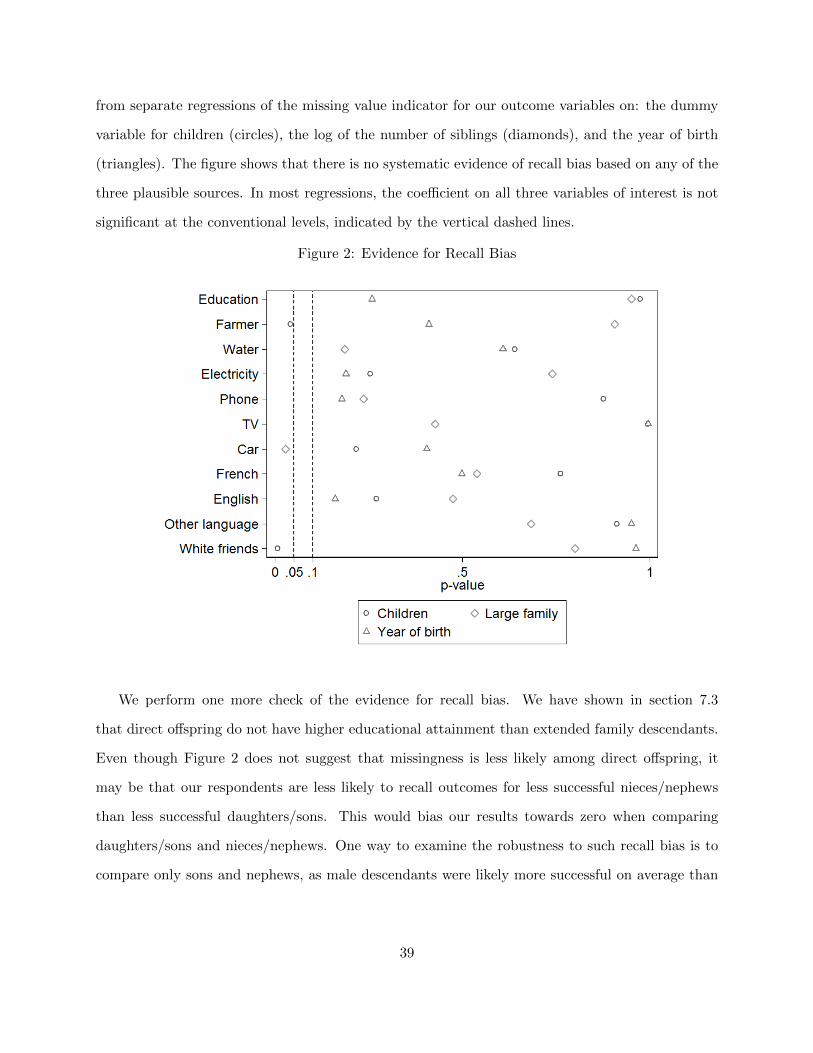
from separate regressions of the missing value indicator for our outcome variables on: the dummy
variable for children (circles), the log of the number of siblings (diamonds), and the year of birth
(triangles). The figure shows that there is no systematic evidence of recall bias based on any of the
three plausible sources. In most regressions, the coe�cient on all three variables of interest is not
significant at the conventional levels, indicated by the vertical dashed lines.
Figure 2: Evidence for Recall Bias
We perform one more check of the evidence for recall bias. We have shown in section 7.3
that direct o↵spring do not have higher educational attainment than extended family descendants.
Even though Figure 2 does not suggest that missingness is less likely among direct o↵spring, it
may be that our respondents are less likely to recall outcomes for less successful nieces/nephews
than less successful daughters/sons. This would bias our results towards zero when comparing
daughters/sons and nieces/nephews. One way to examine the robustness to such recall bias is to
compare only sons and nephews, as male descendants were likely more successful on average than
39
females.32 In this subsample, the recall bias towards zero – if it exists – should be lower. Table
17 reruns models from Table 12 on the subsample of men. Our results are unchanged, further
suggesting that recall bias is not an issue.
Table 17: Outcomes for Children and Nieces and Nephews in the Second Generation – Males only
(1) (2) (3) (4)Education Primary or more Secondary or more University
Children 0.034 0.033 0.031 -0.030(0.113) (0.048) (0.059) (0.055)
Observations 452 449 449 449
* p < 0.1, ** p < 0.05, *** p < 0.01.
Note: Dependent variables are indicated in the column header. Standard errors are clustered by extended family.All regressions control for gender, number of siblings, and include commune and decade dummies.
9 Conclusion
We use data from the first elementary schools established in areas of colonial Benin with no prior
European influence to estimate economic and social e↵ects of education. We find a large positive
impact of education on measures of living standards, professional achievements and occupational
diversity. We also find significant peer e↵ects and intergenerational living standards e↵ects, and
we argue that they are driven in large part by aspirations. Finally, the paper presents the first
empirical analysis of the o↵setting e↵ects of kin systems in Africa. We find both sizable education
spillovers across family and neighbors as well as redistributive pressures within extended families.
Our results provide rigorous estimates of human capital externalities and illustrate their im-
pact on development. However, it is unclear whether the documented impact was driven more by
knowledge spillovers or by colonial investment in local public goods. An important contribution
resides in the empirical strategy we use to investigate the comparative e↵ects on human capital
and colonial institutions for long-term development. When institutions and human capital shocks
are simultaneous, one might disentangle the e↵ects on these competing factors by comparing de-
velopment outcomes in areas where education came before formal intuitions with the outcomes in
32One reason to believe this is that we are more likely to observe nephews than nieces relative to the ratio of sonsto daughters.
40

areas where schools were created after formal institutions were established.
41
References
Abeler, Johannes, Armin Falk, Lorenz Goette, and David Hu↵man, “Reference points
and e↵ort provision,” The American Economic Review, 2011, 101 (2), 470–492.
A.C., Gelbach J.B. Cameron and D.L. Miller, “Bootstrap-based improvements for inference
with clustered errors,” Review of Economics and Statistics, 2008, 90, 414–427.
Acemoglu, Daron, Simon Johnson, and James A Robinson, “The colonial origins of com-
parative development: An empirical investigation,” 2000.
Akresh, Richard, Emilie Bagby, Damien de Walque, and Harounan Kazianga, “Child
Ability and Household Human Capital Investment Decisions in Burkina Faso,” 2010. working
paper.
Altonji, Joseph, Fumio Hayashi, and Laurence Kotliko↵, “Is the Extended Family Altru-
istically Linked? Direct Tests Using Micro Data,” American Economic Review, 1992, 82(5),
1177–1198.
Angelucci, M., G. De Giorgi, M.A. Rangel, and I. Rasul, “Family networks and school
enrolment: Evidence from a randomized social experiment,” Journal of Public Economics,
2010, 94 (3-4), 197–221.
Baland, Jean-Marie, Catherine Guirkinger, and Charlotte Mali, “Pretending to Be Poor:
Borrowing to Escape Forced Solidarity in Cameroon,” Economic Development and Cultural
Change, 2011, 60 (1), 1–16.
Barr, Abigail and Mattea Stein, “Status and Egalitarianism in Traditional Communities: An
Analysis of Funeral Attendance in Six Zimbabwean Villages,” October 2008. CSAE Working
Paper WPS/2008-26.
Barr, P., To China with Love: The Lives and Times of Protestant Missionaries in China, 1860-
1900, Doubleday Publishing, 1973.
42

Becker, S. and M. Caliendo, “Sensitivity analysis for average treatment e↵ects,” The Stata
Journal, 2007, 7(1), 71–83.
Bengal, General Report on Public Instruction, in the Lower Provinces of the Bengal Presidency,
for ..., W. Ridsdale., 1848.
Berinsky, Adam and Gabriel Lenz, “Education and Political Participation: Exploring the
Causal Link,” Political Behavior, 2011, 33, 357–373.
Bertrand, Marianne and Sendhil Mullainathan, “Are Emily and Greg More Employable
Than Lakisha and Jamal? A Field Experiment on Labor Market Discrimination,” The Amer-
ican Economic Review, 2004, 94 (4), 991–1013.
Bils, Mark and Peter J Klenow, “Does schooling cause growth?,” American economic review,
2000, pp. 1160–1183.
Binder, M., “Family background, gender and schooling in Mexico,” The Journal of Development
Studies, 1998, 35 (2), 54–71.
Bobonis, G.J. and F. Finan, “Neighborhood peer e↵ects in secondary school enrollment deci-
sions,” The Review of Economics and Statistics, 2009, 91 (4), 695–716.
Bolt, Jutta and Dirk Bezemer, “Understanding long-run African growth: colonial institutions
or colonial education?,” Journal of development studies, 2009, 45 (1), 24–54.
Borjas, George, “Ethnic Capital and Intergenerational Mobility,” Quarterly Journal of Eco-
nomics, 1992, 107(1), 123–150.
, “Ethnicity, Neighborhoods, and Human-Capital Externalities,” American Economic Review,
1995, 85(3), 365–390.
Campante, Filipe R. and Davin Chor, “Schooling, Political Participation, and the Economy,”
Review of Economics and Statistics, 2011, May 19 (Early Access).
Centenaire, Centenaire de l’arrivee des missionnaires au pays Agonlin, 1895-1995, Notre Dame,
1995.
43

Chiapa, Carlos, Jose Luis Garrido, and Silvia Prina, “The e↵ect of social programs and
exposure to professionals on the educational aspirations of the poor,” Economics of Education
Review, 2012.
Comola, Margherita and Marcel Fafchamps, “Are Gifts and Loans between Households
Voluntary?,” June 2012. Working Paper.
Cornwell, Katy, Brett Inder, Pushkar Maitra, and Anu Rammohan, Household Compo-
sition and Schooling of Rural South African Children: Sibling Synergy and Migrant E↵ects,
Monash University, 2005.
Cox, D. and M. Fafchamps, “Extended family and kinship networks: economic insights and
evolutionary directions,” Handbook of Development Economics, 2007, 4, 3711–3784.
d’Almeida Topor, Helene, Histoire Economique du Dahomey (1890-1920), Tome 1 et Tome 2,
Editions l’Harmattan, 1995.
Dalton, Patricio, Sayantan Ghosal, and Anandi Mani, “Poverty and aspirations failure: A
theoretical framework,” 2010.
Dee, Thomas S., “Are There Civic Returns to Education?,” Journal of Public Economics, 2004,
88, 1697–1720.
Duflo, Esther, “The medium run e↵ects of educational expansion: evidence from a large school
construction program in Indonesia,” Journal of Development Economics, 2004, 74 (1), 163–
197.
and Emmanuel Saez, “The Role of Information and Social Interactions in Retirement Plan
Decision: Evidence from a Randomized Experiment,” Quarterly Journal of Economics, 2003,
118(3), 815–842.
Dupas, Pascaline and Jonathan Robinson, “Savings Constraints nad Microenterpreise Devel-
opment: Evidence from a Field Experiment in Kenya,” January 2009. NBER Working Paper
No. 14693.
44

Dupuis, Paul Henry, Histoire de l’Eglise du Benin: Aube Nouvelle (Tome 2), Lyon, France:
Societes des Missions Africaines, 1961.
Emerson, Patrick M and Andre Portela Souza, “Birth order, child labor, and school atten-
dance in Brazil,” World Development, 2008, 36 (9), 1647–1664.
Ferrara, E. La, “Kin Groups and Reciprocity: A Model of Credit Transactions in Ghana,”
American economic review, 2003, 93 (5), 1730–1751.
France, Government Report, “Gouvernment General de l’Afrique Ocidentale Francaise,” 1906.
Editions Crete, Corbeil (France).
Frangakis, Constantine and Donald Rubin, “Principal Stratification in Causal Inference,”
Biometrics, 2002, 58, 21–29.
Garg, A. and J. Morduch, “Sibling rivalry and the gender gap: Evidence from child health
outcomes in Ghana,” Journal of Population Economics, 1998, 11 (4), 471–493.
Gennaioli, Nicolla, Rafael La Porta, Florencio Lopez de Silanes, and Andrei Shleifer,
“Human Capital and Regional Development,” Quarterly Journal of Economics, 2012, Forth-
coming.
Glaeser, Edward, Gicamo Ponzetto, and Andrei Shleifer, “Why Does Democracy Need
Education?,” Journal of Economic Growth, 2007, 12, 77–99.
, Rafael LaPorta, Florencio Lopes de Silanes, and Andrei Shleifer, “Do Institutions
Cause Growth?,” Journal of Economic Growth, 2004, 9 (3), 271–303.
Hendricks, Lutz, “How important is human capital for development? Evidence from immigrant
earnings,” American Economic Review, 2002, pp. 198–219.
Ho↵, Karla and Arijit Sen, “The Kin System as a Poverty Trap?,” 2005. World Bank Policy
Research Paper.
45
Horowitz, Joel L. and Charles F. Manski, “Nonparametric Analysis of Randomized Ex-
periments with Missing Covariate and Outcome Data,” Journal of the American Stastical
Association, 2000, 95, 77–84.
Huillery, Elise, “History Matters: the Long Term Impact of Colonial Public Investments In
French West Africa,” American Economic Journal - Applied Economics, 2009, 1, 176–215.
Jakiela, Pamela and Owen Ozier, “Does Africa Need a Rotten Kin Theorem?,” 2012. World
Bank Policy Research Working Paper 6085.
Jensen, Robert, “The (perceived) returns to education and the demand for schooling,” The
Quarterly Journal of Economics, 2010, 125 (2), 515–548.
Johnson, H.B., “The Location of Christian Missions in Africa,” Geographical Review, 1967,
pp. 168–202.
Kam, Cindy D. and Carl L. Palmer, “Reconsidering the E↵ects of Education on Political
Participation,” Journal of Politics, 2008, 70, 612–631.
Kimenyi, Mwangi S, Germano Mwabu, and Damiano Kulundu Manda, “Human capital
externalities and private returns to education in Kenya,” Eastern Economic Journal, 2006, 32
(3), 493–513.
Klenow, Peter J and Andres Rodriguez-Clare, “Externalities and growth,” Handbook of
economic growth, 2005, 1, 817–861.
Krueger, Alan B and Mikael Lindahl, “Education for growth: why and for whom?,” 2000.
Lalive, Rafael and Alejandra Cattaneo, “Social Interactions and Schooling Decisions,” Reveiw
of Economics and Statistics, 2009, 91(3), 457–477.
Lee, David S., “Training, Wages and Sample Selection: Estimating Sharp Bounds on Treatment
E↵ects,” The Reveiw of Economic Studies, 2009, 76, 1071–1102.
Little, Roderick JA and Donald B Rubin, Statistical analysis with missing data, Vol. 539,
Wiley New York, 1987.
46

Lucas, Robert E, “On the mechanics of economic development,” Journal of monetary economics,
1988, 22 (1), 3–42.
Mankiw, N Gregory, David Romer, and David N Weil, “A contribution to the empirics of
economic growth,” The quarterly journal of economics, 1992, 107 (2), 407–437.
Manning, Patrick, Slavery, Colonialism and Economic Growth in Dahomey, 1640-1960, Cam-
bridge University Press, 1982.
Marshall, Alfred, Principles of Economics 9th (Variorum) edition, Ed. C Guillebaud, Macmillan,
London, 1961.
Mead, M., New Lives for Old: Cultural Transformation–Manus, 1928-1953, HarperCollins, 2001.
Mookherjee, Dilip, Debraj Ray, and Stefan Napel, “Aspirations, segregation, and occupa-
tional choice,” Journal of the European Economic Association, 2010, 8 (1), 139–168.
Morduch, J., “Sibling rivalry in Africa,” The American Economic Review, 2000, 90 (2), 405–409.
Moretti, Enrico, “Human capital externalities in cities,” Handbook of regional and urban eco-
nomics, 2004, 4, 2243–2291.
Murphy, Kevin M, Andrei Shleifer, and Robert W Vishny, “The allocation of talent:
Implications for growth,” The Quarterly Journal of Economics, 1991, 106 (2), 503–530.
Nunn, Nathan, “Christians in Colonial Africa,” 2009. working paper.
, “Religious conversion in Colonial Africa,” American Economic Review: Papers & Proceedings,
2010, 100(May2010), 147–152.
Parish, W.L. and R.J. Willis, “Daughters, education, and family budgets: Taiwan experiences,”
Journal of Human Resources, 1993, 28(4), 863–898.
Platteau, Jean-Phillipe, Institutions, Social Norms, and Economic Development, Amsterdam:
Harwood Academic Publishers, 2000.
47
Ray, Debraj, What Have We Learnt About Poverty, Oxford University Press, 2006.
Romer, Paul M, “Human capital and growth: theory and evidence,” 1989.
Rosenbaum, P.R., Observational studies, Springer, 2002.
Sacerdote, Bruce, “Slavery and the Intergenerational Transmission of Human Capital,” The
Review of Economics and Statistics, 2005, pp. 217–234.
Shavit, Yossi and Jennifer Pierce, “Sibship Size and Educational Attainment in Nuclear and
Extended Families: Arabs and Jews in Israel,” American Sociolgical Review, 1991, 56(3),
321–330.
Topa, G., “Social interactions, local spillovers and unemployment,” The Review of Economic
Studies, 2001, 68 (2), 261–295.
Wantchekon, Leonard, “Mobilite Sociale des Premiers Eleves du Benin (1864-1922),” 2012. Base
de donnees, IREEP. Cotonou (Benin).
Weir, Sharada and John Knight, “Externality e↵ects of education: dynamics of the adoption
and di↵usion of an innovation in rural Ethiopia,” Economic Development and Cultural Change,
2004, 53 (1), 93–113.
Woodberry, R.D. and T.S. Shah, “The pioneering protestants,” Journal of Democracy, 2004,
15 (2), 47–61.
Woodberry, Robert D, “The shadow of empire: Christian missions, colonial policy, and democ-
racy in postcolonial societies.” PhD dissertation, University of North Carolina 2004.
Zhang, Junni L. and Donald B. Rubin, “Estimation of Causal E↵ects via Principal Stratifica-
tion When Some Outcomes are Truncated by ‘Death’,” Journal of Educational and Behavioral
Statistics, 2003, 28, 353–368.
, , and Fabrizia Mealli, “Likelihood-Based Analysis of Causal E↵ects of Job-Training
Programs Using Principal Stratification,” Journal of the American Statistical Association,
2009, 104, 166–176.
48

Appendix
Figure A.1: List of the first students in the school in Natitingou (fragment)
49

Figure A.2: Map of Benin, 1936
50

Table A.1: Robustness to Non-Ignorable Missingness – First Generation
(1) (2) (3) (4) (5) (6) (7) (8)Education Farmer Water Electricity Vehicle French language Other language White friends
Individual-level treatment 0.697⇤⇤ -0.339⇤ 0.112⇤⇤ 0.077⇤⇤ 0.218⇤⇤ 0.870⇤⇤⇤ 0.061⇤⇤ 0.158⇤
(0.170) (0.141) (0.040) (0.020) (0.057) (0.035) (0.014) (0.059)
Village-level treatment 0.050 0.004 0.054 0.018 0.021 0.072⇤ 0.006 0.096⇤⇤
(0.044) (0.222) (0.052) (0.011) (0.056) (0.027) (0.006) (0.027)Observations 405 405 405 405 405 405 405 405Missing share 0.20 0.28 0.01 0.01 0.04 0.01 0.01 0.13
* p < 0.1, ** p < 0.05, *** p < 0.01.
Note: Dependent variables are indicated in the column header. The worst-case scenario is explained in the text. Standard errors are clustered bycommune.
Table A.2: Robustness to Non-Ignorable Missingness – Second Generation
(1) (2) (3) (4) (5) (6) (7) (8) (9) (10)Education Farmer Water Electricity TV Phone Car French English White friends
Individual-level treatment 0.292⇤⇤⇤ -0.042 0.080 0.128⇤⇤ 0.169⇤⇤⇤ 0.194⇤⇤⇤ 0.061 0.158⇤⇤⇤ 0.040⇤⇤⇤ -0.209⇤⇤⇤
(0.103) (0.029) (0.067) (0.051) (0.048) (0.047) (0.039) (0.054) (0.015) (0.030)
Village-level treatment 0.412⇤⇤⇤ -0.196⇤⇤⇤ 0.070 0.418⇤⇤⇤ 0.291⇤⇤⇤ 0.207⇤⇤⇤ 0.026 0.249⇤⇤⇤ 0.011 0.169⇤⇤⇤
(0.085) (0.038) (0.067) (0.037) (0.031) (0.030) (0.034) (0.047) (0.007) (0.039)Observations 2509 2509 2509 2509 2509 2509 2509 2509 2509 2509Missing share 0.03 0.08 0.02 0.02 0.02 0.02 0.04 0.02 0.02 0.25
* p < 0.1, ** p < 0.05, *** p < 0.01.
Note: Dependent variables are indicated in the column header. The worst-case scenario is explained in the text. Standard errors are clustered byextended family. All regressions control for gender, number of siblings, and include commune and decade dummies.
51
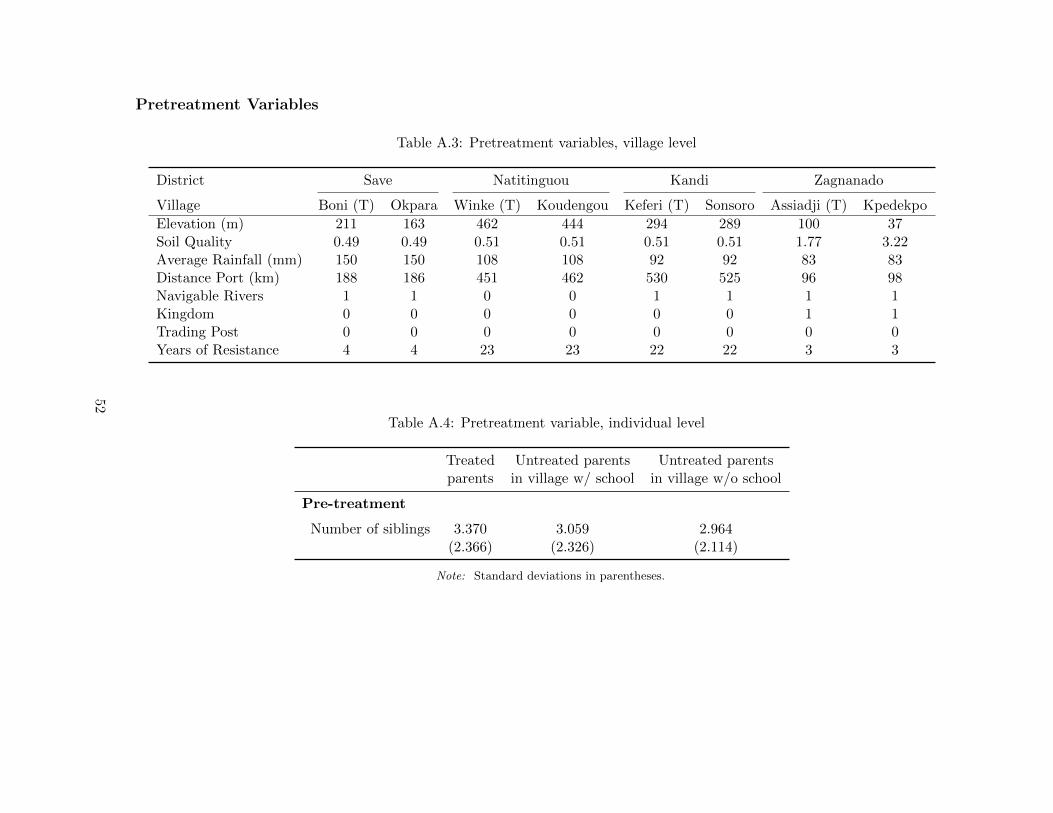
Pretreatment Variables
Table A.3: Pretreatment variables, village level
District Save Natitinguou Kandi Zagnanado
Village Boni (T) Okpara Winke (T) Koudengou Keferi (T) Sonsoro Assiadji (T) KpedekpoElevation (m) 211 163 462 444 294 289 100 37Soil Quality 0.49 0.49 0.51 0.51 0.51 0.51 1.77 3.22Average Rainfall (mm) 150 150 108 108 92 92 83 83Distance Port (km) 188 186 451 462 530 525 96 98Navigable Rivers 1 1 0 0 1 1 1 1Kingdom 0 0 0 0 0 0 1 1Trading Post 0 0 0 0 0 0 0 0Years of Resistance 4 4 23 23 22 22 3 3
Table A.4: Pretreatment variable, individual level
Treatedparents
Untreated parentsin village w/ school
Untreated parentsin village w/o school
Pre-treatment
Number of siblings 3.370 3.059 2.964(2.366) (2.326) (2.114)
Note: Standard deviations in parentheses.
52

Maps
Figure A.3: Map of Benin with the Four School Sites
DDDD
DD DDDDDDDDDD
DD
DDDDDD
D
DDD
DDD
DDDDDDDDDDDDD
D
DDDDDDDDDD
D
DDD
DDDDDDDDDDDDDDDDD
DDDD
DDDDDDDDDDDDDD
DDDDDDDDDDD
DDDDDDDDDD
DDDDDDDDDDDDDDDDDD
DDDDDDDDDD
D
D
DDD
D
DDDDDDDDD
DDD
DDDDDDDDDD
DD
DD
DDDDDDDDDDD
DDDDDDDDD
DDD
DDDDDDDDDDDDDDDDDDDDDDDDDDDDDDDDDDDDDDDDDDDD
D
D
DDDDDDDDDDDDDD
D
DDDDD DDDDDDDDDDDDDDDDDDDDDDDDDDDDDDD
DDDDDDD
DDDDDDDDDD
DDDDDDDDDDD
DDDDDDDDDDDDDDDDDDDDDDDDD
D
DDDDDDDDDDDDDDDDDDDDDD
D
D
D
j
j
j
j
SAVE
KANDI
ZAGNANADO
NATITINGOU
Note: Each of the four schools are flagged and the location of the first-generation individuals is shown with crosses.
53

Figure A.4: Map of Kandi
k)))
))))))))))))))
))))))))
)))))))))
))))
!!!!!!!!!!!!!!!!!!!!!!!!!!!!!
[[[[[[[[[[[[[[[
KANDI
UNK
Note: Locations with treated individuals are indicated by stars, those with untreated individuals within sites withschool are indicated with squares, and those with untreated individuals in sites without schools are indicated withcircles. Multiple individuals living at the same location are represented by one symbol.
54

Figure A.5: Map of Natitingou
k
)
)))))))))
)
))
))))))
))
)))))
)))))))))))))))))
)
)
!!!!!!!!!!!!!!!!!!!!!!!!!!!!!!!!!!!!!!!!!!!!
!!
[[[[[[[
[[
[[
[
[[NATITINGOU
UNK
UNK
UNK
UNK
Note: Locations with treated individuals are indicated by stars, those with untreated individuals within sites withschool are indicated with squares, and those with untreated individuals in sites without schools are indicated withcircles. Multiple individuals living at the same location are represented by one symbol.
55

Figure A.6: Map of Save
k))
)
)
)))
)))))))))))))))))))))))))))))))
)
)
!!!!!!!!!!!!!!
!!!!!!!!!!!!!!!!!!!!!!!!!!!!!!!
[[[[[[[[[[[[[[[[[[
[SAVE
UNK
OKPARA
UNK
UNK
UNK
Note: Locations with treated individuals are indicated by stars, those with untreated individuals within sites withschool are indicated with squares, and those with untreated individuals in sites without schools are indicated withcircles. Multiple individuals living at the same location are represented by one symbol.
56

Figure A.7: Map of Zagnanado
k)
)
)
)))))))))))
)
)))))))))))))))))))
))
))
!!!!!!!!!!!!!!!!!
!!!!!!!
[[
[[
[
[[[[[
[[
[
[
[
[
[
ZAGNANADO
OUEME
UN
K
UNK
UNK
UN
K
UNK
LAC AZIRI
Note: Locations with treated individuals are indicated by stars, those with untreated individuals within sites withschool are indicated with squares, and those with untreated individuals in sites without schools are indicated withcircles. Multiple individuals living at the same location are represented by one symbol.
57
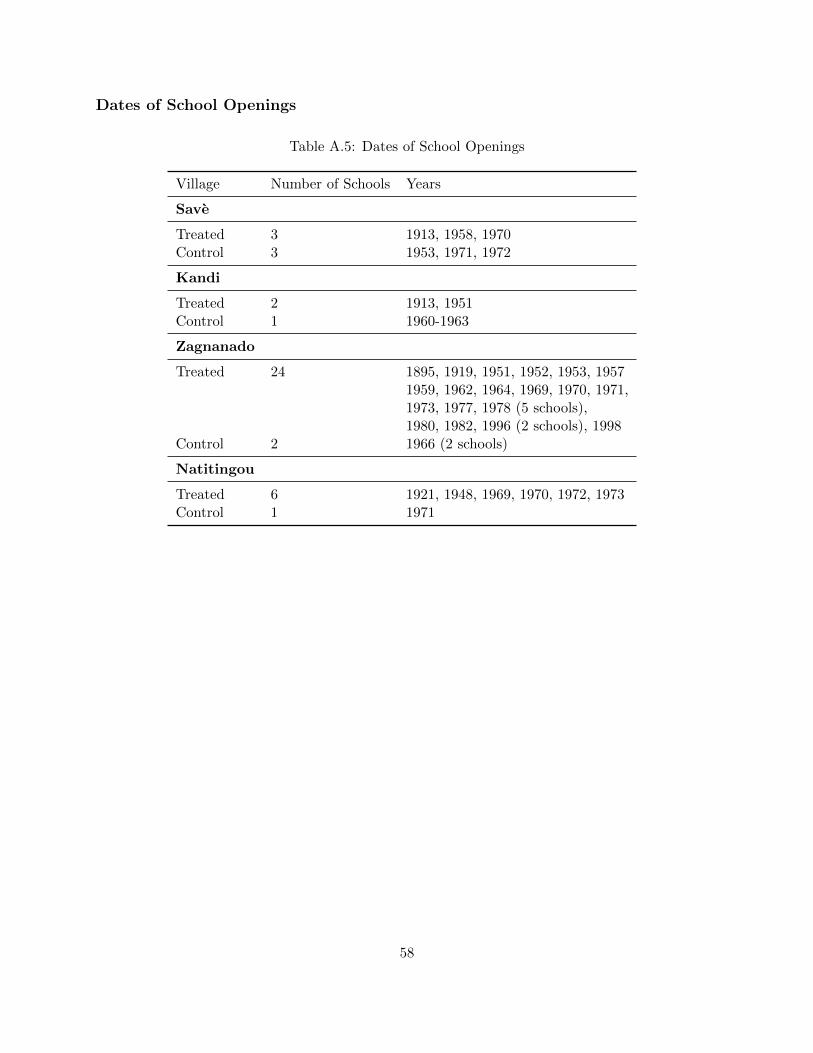
Dates of School Openings
Table A.5: Dates of School Openings
Village Number of Schools Years
Save
Treated 3 1913, 1958, 1970Control 3 1953, 1971, 1972
Kandi
Treated 2 1913, 1951Control 1 1960-1963
Zagnanado
Treated 24 1895, 1919, 1951, 1952, 1953, 19571959, 1962, 1964, 1969, 1970, 1971,1973, 1977, 1978 (5 schools),1980, 1982, 1996 (2 schools), 1998
Control 2 1966 (2 schools)
Natitingou
Treated 6 1921, 1948, 1969, 1970, 1972, 1973Control 1 1971
58

Living standards and Networks Scale
The living standards scale and networks scale were both generated using factor analysis. While we
could not directly observe the income of our subjects at di↵erent points in time, we recorded various
indicators of their standard of living and thus accumulated income. For example, if a subject had
a home with running water and/or a well, electricity and a radio, they likely had better income
over the years than someone without any of these facilities, and thus a higher living standard. The
full set of variables that we use to construct the living standards scale is given in Table A.6. For
example, almost everyone in the control villages in the first generation lived in a traditional house
with terracotta walls, while in the treatment villages, some houses were made of cement and other
more durable materials.
Table A.6 presents examples of a few individuals from our data to give a sense of what di↵erent
values on the living standards scale mean and to help interpret the results from regressions in
Section 6. We see that a low living standards score (-1.11) can be characterized by an individual
with no water, electricity, radio, or other household appliances, who lives in a traditional house,
with terracotta walls, travels on foot and wears traditional clothing. This individual is a farmer
who owns land but shares his house with extended family. Increasing living standards on our
standardized33 scale by approximately 1, from -1.11 to -0.09, can be associated with an individual
who owns a separate home and wears French-style clothing. Increasing living standards from -0.09
to 0.88, in our example, the individual’s occupation is commerce/business, he travels by bicycle
and owns some furniture and devices such as a kitchen table and a radio in the household. Finally,
at the living standards score of 1.91 the individual might own a motorbike or occasionally a car,
and enjoy electricity and running water. Of course, there are variations in exact characteristics
associated with each living standards score, but these examples are indicative.
Similarly, Table A.7 presents examples of individuals in the first generation with various scores
on the networks scale. The networks scale was also generated by factor analysis, using the variables
listed in column headings of Table A.7. A person has better social networks if they are a member
33Note that both the living standards and social networks scale are standardized to have a mean of zero andstandard deviation of one. The smallest value on the living standards scale was -1.17, the largest was 2.64 and themedian was -0.33.
59

of various associations such as, religious, sports, professional (i.e. business), if they are members
of a political party, if they speak foreign languages and have friends among whites or other ethnic
groups. For example, at the lower end, an individual with networks scale value of -1.01 is not a
member of any association, does not speak foreign languages or has friends outside his ethnic group.
Increasing the networks score by 1 to 0.005 we would expect an individual to be a member of at
least some association and speak an additional language.
60

Table A.6: Living standards scale examples in first generation
Income Water Elect- Radio Owns Owns Occup- Tradition. Terracota Owns Residence Means of Attire Travelscale ricity shop? land? ation house? walls? devices? owned? transport distance-1.113 No No No No Yes Farmer Yes Yes No Family On foot Trad. Region-0.089 No No No No Yes Farmer Yes Yes No Owner On foot French Village0.875 No No No No Yes Commerce Yes Yes Yes Owner Bicycle Trad. Region1.911 Yes Yes Yes Yes No Law Yes Yes Yes Owner Other Trad. Region
Table A.7: Social networks scale examples in the first generation
Networks Religious Political Business Sports Other Speaks Speaks Speaks Friends Friends withscale assoc. party assoc. assoc. assoc. French? other nat. other foreign with other
member? member? member? member? member? lang? lang.? Whites? ethnicities?-1.012 No No No No No No No No No No0.005 No No Yes No No No Yes No No No1.03 No No No Yes Yes Yes Yes No No Yes2.12 No Yes No Yes No Yes Yes No Yes Yes
61