Embed Size (px)
Citation preview
Education and Certification Qualifications of Departmentalized Public High School-Level Teachers of Core Subjects:Evidence From the 2007–08 Schools and Staffing Survey
Statistical Analysis Report
NCES 2011-317U.S . DEPARTMENT OF EDUCATI ON

Education and Certification Qualifications of Departmentalized Public High School-Level Teachers of Core Subjects:Evidence From the 2007–08 Schools and Staffing Survey
Statistical Analysis Report
MAY 2011
Jason G. HillEducation Statistics Services Institute – American Institutes for Research
Kerry J. GruberProject OfficerNational Center for Education Statistics
NCES 2011-317U.S. DEPARTMENT OF EDUCATION
U.S. Department of EducationArne DuncanSecretary
Institute of Education SciencesJohn Q. EastonDirector
National Center for Education StatisticsJack BuckleyCommissioner
The National Center for Education Statistics (NCES) is the primary federal entity for collecting, analyzing, and reporting data related to education in the United States and other nations. It fulfills a congressional mandate to collect, collate, analyze, and report full and complete statistics on the condition of education in the United States; conduct and publish reports and specialized analyses of the meaning and significance of such statistics; assist state and local education agencies in improving their statistical systems; and review and report on education activities in foreign countries.
NCES activities are designed to address high-priority education data needs; provide consistent, reliable, complete, and accurate indicators of education status and trends; and report timely, useful, and high-quality data to the U.S. Department of Education, the Congress, the states, other education policymakers, practitioners, data users, and the general public. Unless specifically noted, all information contained herein is in the public domain.
We strive to make our products available in a variety of formats and in language that is appropriate to a variety of audiences. You, as our customer, are the best judge of our success in communicating information effectively. If you have any comments or suggestions about this or any other NCES product or report, we would like to hear from you. Please direct your comments to
NCES, IES, U.S. Department of Education1990 K Street NWWashington, DC 20006-5651
May 2011
The NCES Home Page address is http://nces.ed.gov.The NCES Publications and Products address is http://nces.ed.gov/pubsearch.
This publication is only available online. To download, view, and print the report as a PDF file, go to the NCES Publications and Products address shown above.
This report was prepared for the National Center for Education Statistics under Contract No. ED-05-CO-0044 with the American Institutes for Research (AIR). Mention of trade names, commercial products, or organizations does not imply endorsement by the U.S. Government.
Suggested Citation
Hill, J.G. (2011). Education and Certification Qualifications of Departmentalized Public High School-Level Teachers of Core Subjects: Evidence From the 2007–08 Schools and Staffing Survey (NCES 2011-317). U.S. Department of Education. Washington, DC: National Center for Education Statistics. Retrieved [date] from http://nces.ed.gov/pubsearch.
Content Contact
Kerry Gruber (202) [email protected]
iii
Executive Summary This report examines the postsecondary majors and teaching certifications of public high school-level teachers of departmentalized classes1
in a selection of subject areas by using data from the 2007–08 Schools and Staffing Survey (SASS), a sample survey of elementary and secondary schools in the United States. SASS collects data on American public, private, and Bureau of Indian Education (BIE)-funded elementary and secondary schools and their related components (teachers, principals, libraries, and districts, where applicable). SASS provides information on a range of teacher qualifications in the United States.
Prior research in the field of education has examined the correlation between teacher education (postsecondary major) and certification and student outcomes (Ferguson 1991, 1998; Goldhaber and Brewer 1997, 1999, 2000; Mayer, Mullens, and Moore 2000; Sanders, Wright, and Horn 1997). While this report does not link teacher qualifications to student outcomes, it does examine the qualifications of high school-level teachers of departmentalized classes in three ways. First, the report examines the percentage of public high school-level teachers who earned a degree in an in-field major,2 held an in-field certification,3
in-field qualifications. Second, the report looks at the percentages of grade 9−12 classes taught by teachers with one or both in-field qualifications. Finally, the report presents findings on the percentages of students in grades 9−12 taught by a teacher with one or both in-field qualifications. While the teacher-level analyses pair qualifications against the teacher’s main assignment, the class- and student-level analyses consider classes of all subjects taught by a teacher. As a result, the class- and student-level analyses include all teachers who taught grade 9–12 classes, a slightly different group from the group of high school-level teachers included in the teacher-level analyses. Readers should be aware of these differences when making comparisons across tables in this report.
had both in-field qualifications, or had neither
At all three levels of analysis (teacher, class, and student), teachers’ qualifications are considered in relation to the 11 following broad subject areas: English, mathematics, science, social science, French, German, Latin, Spanish, art/arts and crafts, music, and dance/drama or theater. Of these 11 broad subject areas, science and social science are analyzed with more granularity through six subfields of science and social science (biology/life science, physical science, economics, geography, government/civics, and history) and three further subfields of physical science (chemistry, earth sciences, and physics). Teachers of these subjects are considered in-field majors if they hold a bachelor’s degree or higher in the subject(s) they taught. To be considered as fully certified in the analysis, teachers would need to hold a regular or standard state certification, an advanced professional certificate, or a certificate issued after satisfying all requirements except the completion of a probationary period. Certifications must apply to any of 1 High school-level teachers teach students in any of grades 10–12, or grade 9 and no grade lower. Teachers of departmentalized classrooms instruct several classes of different students all or most of the day in one or more subjects. Departmentalized teachers are included because they represent a majority (89 percent) of teachers at the high school level and allow for analyses that tie specific teachers to specific classes and students. 2 Teacher main assignment was taken from question 15 of the SASS Teacher Questionnaire, which asks, “This school year, what is your MAIN teaching assignment field at THIS school? (Your main assignment is the field in which you teach the most classes).” In-field major means a teacher’s main assignment is the same as the field in which the teacher has a bachelor’s or above degree. 3 In-field certification means a teacher is certified for his/her main assignment.
iv
grades 9−12, except for the subjects of art/arts and crafts, music, and dance/drama or theater for which an ungraded certification—a certification that does not restrict a teacher to a specific grade range—is accepted.4
The teacher sample and analytical decisions in this report are motivated by current federal education legislation—that is, the Elementary and Secondary Education Act of 1965, as amended in 2001 (ESEA)—and state teaching certification requirements. ESEA only pertains to schools in the public sector. Since the SASS sample of teachers in BIE-funded schools is too small to support stable estimates, this report only includes teachers in public schools (traditional and charter). Additionally, some selected subjects are defined as core academic subjects under ESEA. These include English, reading, or language arts; mathematics; science; foreign languages; government/civics; economics; arts; history; and geography. The broad field of social studies is included because not all states separately certify the aforementioned subfields (government/civics, economics, history, and geography). The subfields of science (biology/life science, physical science, and three further subfields of physical science—chemistry, earth sciences, and physics) are added because, while the law does not break out the subfields, some states might require teachers to be separately certified in these subfields (U.S. Department of Education, Office of the Deputy Secretary 2004, p. 23). Also, the subfields of science and social science are added because teacher supply and demand literature has reported on subfields of both science and social science (Ingersoll 1996; Murnane and Schwinden 1989). Both subjects cover multiple disciplinary fields relative to certification subject areas, and both are recognized as having a number of subfields that are used to frame teacher demand and quality. Although ESEA guides the structure of the analyses, the report is not meant to report percentages of Highly Qualified Teachers, nor be a commentary on any part of the law in general. The findings are reported at the teacher, class, and student levels to provide a complete picture of teacher qualifications. Estimates are produced from cross-tabulations of the data, and t tests are performed to test for differences between estimates. All differences cited in the text of this report are statistically significant at the p < .05 level. No corrections are made for multiple comparisons. As a result, an increase in Type I error is possible. Type I error is the observation of a statistical difference when, in fact, there is none. Readers are cautioned not to make causal inferences about the data presented here. Some of the major findings from the teacher-, class-, and student-level analyses are presented below. These represent the overall patterns found in the data.
High School-Level Teacher Qualifications
• The four most frequently reported main assignments in American high schools in 2007–08 were English (161,300), mathematics (143,600), science (119,800), and social science (119,200).
4 An examination of state requirements revealed that in a majority of states, teachers of the arts were considered fully certified if they held an ungraded certification in the arts. In the analysis, teachers of dance and theater classes were also allowed reciprocation in qualifications requirements (i.e., teachers were certified to teach dance classes if they held a theater certification and vice versa).
v
•
•
•
More than three-quarters of teachers with English, mathematics, science, or social science as their main assignments taught all of their classes in their main assignments.
In general, a majority5
of teachers of the 11 broad subject fields (English, mathematics, science, social science, French, German, Latin, Spanish, art/arts and crafts, music, and dance/drama or theater) held both a postsecondary degree and a teaching certification in their respective main assignments, except for Latin and dance/drama or theater. For example, 71 percent of English teachers, 63 percent of mathematics teachers, 74 percent of science teachers, and 74 percent of social science teachers held both a postsecondary degree and a teaching certification.
Across the subject areas of English, mathematics, science, and social science, the majority of teachers who instructed all of their classes in their main assignments held both a postsecondary degree and certification in their respective main assignments. Specifically, about 75 percent of English teachers, 66 percent of mathematics teachers, 75 percent of science teachers, and 74 percent of social science teachers held both a postsecondary degree and certification in their respective main assignments.
Qualifications of Teachers of Grade 9–12 Classes and the Students Enrolled
•
•
A majority of grade 9–12 classes were instructed by teachers with majors in the subject areas they taught across all broad subject areas with the exception of dance/drama or theater. At the subfield level, only biology/life science (73 percent) and history (61 percent) had more than 50 percent of classes taught by teachers with in-field majors.
A majority of students in grade 9–12 classes were instructed by teachers with in-field majors across all broad subject areas with the exception of dance/drama or theater. However, at the subfield level, only the subject areas of biology/life science (75 percent) and history (62 percent) had more than 50 percent of students taught by teachers with in-field majors.
Limitations
The findings presented in this report provide a comprehensive picture of majors and certifications at the teacher, class, and student levels in high school grades in public schools. Nevertheless, these findings should be interpreted with caution. Limitations include a precisely defined subpopulation of teachers, classes and students; differences in state policy toward certification; historical changes to the SASS Teacher Questionnaire; and measurement of teacher qualifications. The teacher-level analysis in this report is limited to a very specific subpopulation of teachers: namely, public high school-level teachers whose main teaching assignment is one of 20 fields or subfields in departmentalized classes. These teachers represent 64 percent of all public high school-level teachers. Similarly, the class- and student-level analyses only include, respectively,
5 Estimates were statistically significantly greater than 50 percent based on t test calculations.
vi
about 74 percent of all reported departmentalized classes and 75 percent of students in grades 9–12. Readers should be careful not to generalize beyond these populations. In addition, certification rates in the science and social science subfields might be artificially low because some states do not offer specific certifications in these subfields. Therefore, an analytical match between certification and subject taught cannot be made at the subfield level. For this reason, estimates are provided at the broad field level. Although trend analyses are beyond the scope of this report, careful attention was paid to maintain consistency with previous reports. Readers should be aware of changes to the questionnaires before making over-time or trend comparisons. Readers are cautioned against making direct comparisons between estimates in this report and previously published estimates that use SASS data from the 1999–2000 and prior administrations. Several changes were implemented in the 2003−04 SASS Teacher Questionnaire and carried over into the 2007−08 SASS. For example, questions that allowed matching between certifications and main assignments and teacher grade levels taught were changed after the 1999–2000 administration. Smaller changes were also made to the 2007–08 SASS Teacher Questionnaire, which do not undermine comparisons to 2003–04. All changes are fully documented in Appendix C: Caution Concerning Changes in Estimates Over Time. Further, teacher qualification can be measured in many ways. This report offers one way of using SASS data to measure teacher qualification. For example, variables on highest degree achieved, certification from the National Board for Professional Teaching Standards, or perceptions of job conditions can be used to measure teacher qualification.
vii
Contents
……………………………………………………………………….
………………………………………………………………..………...........
……………………………………………………………………..............
……………………………………………………………………..…………
………………………………………………………………………...………
…………………………………………………………………..…….
…………………………………………………………………………..………...
…………………………………………………….…..………
………………………………………………………………………...………..
…………………………………………....………..
…………………………………....…...
………..………...
………………………..…..
………………………………………………….….……
Page
Executive Summary iii
List of Tables viii
List of Exhibits x
Introduction 1
Background 4
Data and Measures 7
Findings 10
Summary and Limitations 22
References 24
Appendix A: Standard Error Tables A-1
Appendix B: Methodology and Technical Notes B-1
Appendix C: Caution Concerning Changes in Estimates Over Time C-1
Appendix D: Description of Variables Used in This Report D-1
Appendix E: Glossary of Terms E-1
viii
List of Tables
Table Page
1. Number of public high school-level teachers who reported a particular main assignment and the percentage of teachers who taught various percentages of classes within that main assignment, by subject of main assignment: 2007–08…. 12
2. Number of public high school-level teachers who reported a particular main assignment and the percentage with a major and certification in that main assignment, by subject of main assignment: 2007–08 ….………………..……..... 14
3. Number of public high school-level teachers who reported a particular main assignment and the percentage of teachers with various qualifications who taught various percentages of classes within that main assignment, by subject of main assignment: 2007–08..…………………………………………………………..... 16
4. Number and percentage of grade 9–12 public school classes of various subjects taught by a teacher with a major and certification in that subject area, by selected subject areas: 2007–08..…………………………………………………………... 18
5. Number and percentage of students in grade 9–12 public school classes of various subjects taught by a teacher with a major and certification in that subject area, by selected subject areas: 2007–08…………………………………………. 20
Appendix A: Standard Error Tables
A-1. Standard errors for Table 1: Number of public high school-level teachers who reported a particular main assignment and the percentage of teachers who taught various percentages of classes within that main assignment, by subject of main assignment: 2007–08 ….…………..…………………………...………………..... A-2
A-2. Standard errors for Table 2: Number of public high school-level teachers who reported a particular main assignment and the percentage with a major and certification in that main assignment, by subject of main assignment: 2007–08.... A-3
A-3. Standard errors for Table 3: Number of public high school-level teachers who reported a particular main assignment and the percentage of teachers with various qualifications who taught various percentages of classes within that main assignment, by subject of main assignment: 2007–08 …………………...………. A-4
A-4. Standard errors for Table 4: Number and percentage of grade 9–12 public school classes of various subjects taught by a teacher with a major and certification in that subject area, by selected subject areas: 2007–08…………………………….. A-5
ix
Table Page
A-5. Standard errors for Table 5: Number and percentage of students in grade 9–12 public school classes of various subjects taught by a teacher with a major and certification in that subject area, by selected subject areas: 2007–08…………….. A-6
Appendix B: Methodology and Technical Notes
B-1. Unweighted, based-weighted, and base-weighted overall response rates for the public school teacher survey population: 2007–08 …………………………..… B-6
B-2. Comparisons between frame distribution and base-weighted and final-weighted respondent distributions for school teachers with an indication of potential sources of bias, by school type and survey instrument: 2007–08 ……………… B-7
Appendix C: Caution Concerning Changes in Estimates Over Time
C-1. Among public school students taught by a grade 9–12 teacher, the percentage of students taught by a teacher certified in that subject area, by school year and course subject area: 1999–2000, 2003–04, and 2007–08..…………...… C-8
x
List of Exhibits
Exhibit Page
Appendix C: Caution Concerning Changes in Estimates Over Time
C-1. Main assignment and certification items from the 1999–2000 Public School Teacher Questionnaire ………………………….……………………….……….. C-2
C-2. Main assignment item from the 2003–04 Teacher Questionnaire ……………….. C-3
C-3. Certification items from the 2003–04 Teacher Questionnaire …………………… C-4
C-4. Departmentalized teacher main assignment item from the 2007–08 Teacher Questionnaire …………………………………………………………………….. C-5
C-5. Certification items from the 2007–08 Teacher Questionnaire …………………… C-6
Appendix D: Description of Variables Used in This Report
D-1. Coding of main assignment or course subject areas, major fields, and certification areas, by subject area: 2007–08 ...…………………………………... D-4
1
Introduction This report uses data from the Schools and Staffing Survey (SASS). SASS is a sample survey of elementary and secondary schools in the United States sponsored by the National Center for Education Statistics (NCES) within the Institute of Education Sciences (IES) of the U.S. Department of Education. SASS has been conducted six times beginning in the 1987−88 school year. When SASS was designed in the 1980’s, the influential report titled “A Nation at Risk” “suggested that half of the newly employed mathematics, science, and English teachers were not qualified to teach these subjects and that fewer than one-third of U.S. high schools offered physics taught by qualified teachers” (Smith 1995, p 9). This led to the inclusion of a number of questions on the SASS teacher questionnaire that support the analysis of teaching assignments, degree majors, and subject matter certification. NCES published nationally representative 1987−88 and 1990−91 data on teacher qualifications (Bobbitt and McMillen 1994 and Smith 1995). Subsequently, findings on out-of-field teaching have been published using nationally representative data from SASS in 1993−94, 1999−2000, 2003−04 (Ingersoll 1996; Seastrom et al. 2004; and Morton et al. 2008), with the most recent data, from 2007–08, presented in this report. Although the policy emphasis has changed, concern with the impact of teacher quality on students’ learning has persisted over the 20 year period between the first and the most recent SASS. For example, the Elementary and Secondary Education Act of 1965, as amended in 2001 (ESEA) included funds intended to “increase student academic achievement through strategies such as improving teacher and principal quality and increasing the number of highly qualified teachers in the classroom and highly qualified principals and assistant principals in schools” (Public Law 107-110, Title II, Part A, Section 2101 (1)). In the current law, highly qualified teachers are defined as having (1) a bachelor’s degree; (2) full state certification; and (3) demonstrated competency, as defined by the state, in each core academic subject that they teach.
ESEA motivated key aspects of the report, including limiting the sample selection to public school teachers (traditional and charter)1 and examining subject fields that are defined as core academic subjects under ESEA. Although ESEA guided the structure of the analyses, this report is not meant to report percentages of Highly Qualified Teachers, nor be a commentary on any part of the law in general. This report examines the postsecondary majors and teaching certifications of public high school-level teachers of departmentalized2
•
•
classes and provides data at the level of teachers, students, and classes. Three main areas are addressed:
the percentage of high school-level teachers who held either an in-field postsecondary major, an in-field certification, both qualifications, or neither qualification, in a selection of main assignment fields—the subject in which they reported teaching the most classes;
the percentage of grade 9–12 classes taught by a teacher with one, both, or neither in-field qualifications—in a selection of course subject areas; and
1 Bureau of Indian Education (BIE)-funded schools were omitted because the SASS sample of teachers in BIE-funded schools is too small to support separate stable estimates. 2 The SASS Teacher Questionnaire defines departmentalized teachers as those who typically instruct several classes of different students most or all of the day in one or more subjects.
2
• the percentage of grade 9–12 students taught by a teacher with one, both, or neither in-field qualifications—in a selection of course subject areas.
Teachers’ postsecondary education qualifications are measured by the correspondence between the degree held in the major field(s) of study and the subject(s) taught. Three criteria were used to determine teacher3 certification status—the certification type, content area(s), and grade level(s). To be considered certified in a given field, the teacher must hold at least a regular4 or probationary5
To report on the match between a teacher’s assignment and college major or certification subject, a typology of subject-matter specialties was developed based on the core subjects in ESEA and state teaching certification requirements (see Measures: Subjects Taught and Teacher Qualifications in the “Data and Measures” section on page 7). Consequently, a selection of 20 subjects was chosen, including subfields within science and social science.
certification recognized by the state in which the teacher is teaching and the certification’s content area(s) and grade level(s) should be consistent with what subject and grade levels are being taught. For more information on matching criteria, please see appendix D.
6
While each teacher reports one main assignment in SASS, some teachers also instructed classes outside their main assignments. To capture the qualifications of teachers in all classes taught, data are presented using classes and students, rather than teachers, as units of analysis. The class- and student-level analyses shed light on the qualifications of teachers in relation to these “other” assignments. Analysis at three levels of measurement—teacher, class, and student—is also important to explore the prevalence of teachers’ qualifications while considering variation in the number of classes they taught and the number of students in those classes.
The report’s findings open with a discussion of teachers’ main assignments and the percentage of their classes that they taught in their main assignments (table 1). Next, the findings present the percentage of high school-level departmentalized teachers in public schools with varying combinations of majors and certifications in relation to their main assignments. Table 2 details the percentage of teachers who held an in-field major, held an in-field certification, had both in-field qualifications, or had neither in-field certifications, within a selection of main assignments. Table 3 combines components from tables 1 and 2 to present three combinations of qualifications (both an in-field major and in-field certification, only an in-field major or only an in-field certification, and neither an in-field major nor an in-field certification) by the percentage of classes taught within teachers’ main assignments.
3 The population of teachers analyzed in tables 1–3 includes departmentalized public teachers of any of grades 10-12, or grade 9 and no grade lower, in core subjects. Teacher-level is based on all of the grade levels teachers report teaching. Overall, this population represents 64 percent of the total public high school-level teacher population. 4 A regular or standard state certificate or advanced professional certificate. 5 A certificate is issued after satisfying all requirements for a regular certificate except the completion of a probationary period. 6 Under science and social science, several subfields are examined in detail. However, these subfields are not inclusive of all subfields in science and social science, and therefore do not sum to the broad field totals.
3
Tables 4 and 5 shift the unit of analysis by presenting the percentage of grade 9–12 classes (table 4) and students (table 5) taught by departmentalized teachers with varying combinations of majors and certifications in relation to the course subject areas taught.7
This report presents findings from multiple levels of analyses (teacher, student, and class) in order to provide a more comprehensive picture of teacher qualifications, using cross-tabulations of the data to produce all reported estimates. Differences cited in this report are statistically significant at the p < .05 level. No correction was made for multiple comparisons; as a result, an increase in Type I error is possible. Type I error is the observation of a statistical difference when, in fact, there is none. Readers are cautioned not to make causal inferences about the data presented here. For more information on methodology, please see appendix B.
7 Tables 4 and 5 are based on teacher reports of grade-level of the individual classes they teach. Classes and students included in these tables are in any of grades 9–12 and may or may not be taught by high school-level teachers.
4
Background Much of the literature on teacher qualifications examines the proportion of teachers who earn degrees, hold majors in and/or obtain certifications specific to the subjects they teach. The literature largely focuses on the relationship between the types of qualifications and the subjects and grade levels teachers instruct (Ingersoll 2007; Goldhaber and Brewer 2000; U.S. Department of Education, Office of the Deputy Secretary 2004; McGrath, Holt, and Seastrom 2005; Holt, McGrath, and Seastrom 2006). Further research investigates this match between teacher qualifications and teaching assignments to student-level outcomes (Goldhaber and Brewer 1997, 1999, 2000). For example, some earlier research links improved student performance with teachers who earned a formal postsecondary degree or certification in the field of their assigned subject (Ferguson 1991; Goldhaber and Brewer 1997, 1999, 2000; Mayer, Mullens, and Moore 2000; Wenglinksy 2002). However, results vary by subject (e.g., more evidence of a correlation in mathematics and science than in other subjects) and in strength (e.g., generally positive, but not always statistically significant). Other research confirming the importance of teachers—e.g., their training, experience, and qualifications—to student outcomes includes Darling-Hammond (1999); Goldhaber and Brewer (1999, 2000); Mayer, Mullens, and Moore (2000); Rivkin, Hanushek, and Kain (2005); and Sanders, Wright, and Horn (1997).
More recent research on teacher quality concentrates less on initial preparation of teachers and more on teaching effectiveness or “value added” measures of teachers (Clotfelter, Ladd, and Vigdor 2007; Weisberg et al. 2009; Hanushek 2010; Bill and Melinda Gates Foundation 2010; Yoon et al. 2007). Some researchers also focus on the intrinsic qualities of effective teachers and whether principals can detect which teacher candidates will be the most effective teachers (Kimball, Milanowski, and Heneman 2010; Staiger and Rockoff 2010). As a result of different conceptualizations, a variety of perspectives exist on the relationship between teacher preparation or certification and teacher effectiveness. Findings from Kane, Rockoff, and Staiger (2008) indicate little or no differences in the effectiveness of certified, uncertified, and alternatively certified New York City teachers. However, Clotfelter et al. (2007) make the case that, although teacher credentials do not explain all variation in teacher quality, they remain an important factor in predicting student achievement and are also integral policy levers.
While this report does not examine teacher qualifications in relation to their students’ levels of achievement, prior studies and different perspectives on teacher quality and qualifications provide background and support for the particular measures of teacher qualifications used in this report.
Postsecondary Majors
The research on teachers’ majors has largely examined the relationship between majors and student test scores (Goldhaber and Brewer 1997, 1999, 2000). Goldhaber and Brewer (1997) found a significant positive relationship between teacher education and students’ 10th-grade achievement in mathematics and science. Goldhaber and Brewer (1999, 2000) also examined the National Education Longitudinal Study of 1988 (NELS:88) data and found that students whose teachers held a degree in mathematics had higher 12th-grade test scores in mathematics. Specifically, students whose teachers held both bachelor’s and master’s degrees in mathematics showed an increase in mathematics scores of “more than a third of a year of schooling”
5
compared to students whose teachers did not hold the same credentials (Goldhaber and Brewer 1999, p. 94). However, Goldhaber and Brewer (1997, 1999, and 2000) did not control for the level of classes students took in the models, thus they left out the confounding relationship between students’ ability and their test scores. Higher performing students could be taking higher level math or science classes. As a result they may be more likely to have teachers with advanced skills and to have better test scores. Secondly, their findings were only consistent for mathematics, but not for other subjects, such as Science, English or History. Their 1997 study of 10th-grade test scores showed a positive relationship between teachers with a bachelor’s degree in science and their students’ test scores. However, their studies of 12th-grade test scores showed no relationship between teachers who held a degree in science, or had taken postsecondary classes in science, and the 12th-grade achievement of those teachers’ students (Goldhaber and Brewer 1999, 2000). Additionally, earlier research by Goldhaber and Brewer (1997) showed that having a teacher with an in-subject major was not related to student achievement in English and history. Though the author admitted there were limitations to the data and research available, it was concluded that there appeared to be some value, measured in student achievement, when teachers of “technical subject[s]” (mathematics and science) held subject-specific degrees (Goldhaber and Brewer 1997, p. 208).
Certification
Literature supporting teacher certification requirements contends that teaching is a profession that requires specialized skills and that certification ensures at least minimal standards in teacher quality (Goldhaber and Brewer 2000). However, there is another side to the debate, one that argues certification is a barrier to entering the profession, and notes the limitations of the research on the positive benefits of teacher certification and educational outcomes (Walsh 2001). Generally, the focus of the research seems to be on whether the teachers hold certifications, and for certified teachers, the certification types (e.g., regular, emergency, provisional, temporary, and probational)8 and content areas included in the certification (e.g., mathematics, science).
Certification Content Area and Type
The body of research on teacher certification that examines the correlation between teacher certification and student outcomes typically focuses on the correlation between the certification content area, type (e.g., regular, probationary, emergency), and student test scores. Using the 12th-grade wave of NELS:88, Goldhaber and Brewer (1999, 2000) found that students whose teachers held any certification in mathematics scored significantly higher on a 12th-grade mathematics achievement test than did students who were taught by teachers with no certification or a certification in another subject. Students who were taught by teachers with a mathematics certification recorded a 2-point increase on the NELS:88 mathematics test (about three-quarters of a year of schooling). This was about twice the size of the association that Goldhaber and Brewer (1999, 2000) found among students whose teachers held a degree in mathematics. Goldhaber and Brewer (1999, 2000) found similarly positive but small and statistically nonsignificant findings in science for students taught by a teacher certified in science. 8 Typically, state education agencies award certification types other than regular certification to novice teachers, teachers who are still completing requirements for a full certification, or teachers who were given emergency credentials to teach.
6
Measuring Postsecondary Education (Major) and Certification in Combination
Two recent National Center for Education Statistics (NCES) publications used the 1999–2000 SASS data to examine major and certification qualifications of teachers who teach students in grades 5–12 across two subfields: biology and history. McGrath, Holt, and Seastrom (2005, 2006) demonstrated that even teachers considered “out of field based on the presence or absence of a postsecondary major and state certification” may still have relevant training and education, such as minors or a closely related major to their main assignments.
7
Data and Measures Data used in this report come from the 2007–08 Schools and Staffing Survey (SASS) Restricted-Use Public School Teacher Data File. The following section contains an explanation of the multiple levels of analysis, differing subpopulations, and the measures (subjects taught and teacher qualifications) utilized in this report. Additional information about the SASS data and the measures used in this report can be found in detail in appendix B.
Levels of Analysis and Subpopulations: Teacher, Class, and Student
This report presents findings from multiple levels of analyses (teacher, student, and class) in order to provide a more comprehensive picture of teacher qualifications. The teacher-level analyses provide a description of the status of teachers’ qualifications by subject area and relate directly to current federal education legislation. Teacher-level analyses in this report consider all degrees (bachelor’s and above) and certifications (probationary and above) held by teachers and compare these qualifications with the subject of their main assignments.
The class- and student-level analyses are critical to exploring variations in the number of classes and students instructed by teachers with different qualifications. Separate class- and student-level analyses are important because not all teachers instruct the same number of classes and not all classes have the same number of students. Class- and student-level analyses explore all classes taken by 9th- through 12th-graders in the 11 broad fields and nine subfields discussed in this report.
Although all tables present high school-level groups, important distinctions exist between the teacher subpopulation in the teacher-level tables and the teacher subpopulation in the class- and student-level tables. At the teacher level, the teacher subpopulation of analysis only includes teachers in departmentalized classrooms who instruct classes in any of grades 10–12, or grade 9 but no lower grade. At the class and student levels, the teacher subpopulation includes all departmentalized teachers who taught classes or students in grades 9–12. More information on the concepts and measures can be found in appendix B.
Subjects Taught: Main Assignment and Class Subject Area
For purposes of the analyses presented here, teacher qualifications are considered as they relate to one of two measures of the subjects teachers instruct: main assignment and class subject area taught. Each teacher self-reports one main assignment, defined in the SASS Teacher Questionnaire as the field in which he or she reported teaching the most (i.e., highest number of) classes. Teaching the most classes does not necessarily mean teaching more than 50 percent of a teacher’s classes, especially if he or she teaches multiple subjects. The class subject area measure includes all subjects (or fields) taught by a teacher. This report examines a selection of 20 main assignment fields and class subject areas, including some subfields of general (i.e., broad) subjects. More information on the subject areas excluded can be found in appendix B, page B-12. The broad subject areas are the following: English, mathematics, science, social science, French, German, Latin, Spanish, art/arts and crafts, music, and dance/drama or theater. Within these broad subject areas, analyses of subfields are presented in the tables. The broad subject area of science includes the subfield areas of biology/life sciences and physical science, which includes
8
further subfields of chemistry, earth sciences, and physics. The broad subject area of social science includes the subfields of economics, geography, government/civics, and history. These 11 broad subject areas and nine subfield areas represent academic subjects for which clear matches exist between teacher assignment and teacher qualifications and there are a sufficient number of sampled teachers to support accurate estimates. The reported broad areas and subfields are generally the certification fields and the core subjects of ESEA. No subfields of English and mathematics, and not all subfields of science and social science are reported due to a lack of comparability of possible subfield for certification purposes. Additional information on the matching of the subject areas and subfield areas can be found in appendix D.
Teacher Qualifications: Major and Certification
This report addresses two primary measures of teacher qualifications—teacher education and teaching certification—as they relate to the main assignment and course subject area(s) taught. The definition of “in-field” qualifications included in this report is aligned with the ESEA definition of Highly Qualified Teachers, but is different from that used in prior publications (Seastrom et al. 2004; Morton et al. 2008). Due to differences in the analyses and changes in survey questions, readers are strongly cautioned against making comparisons of estimates in this report and previously published reports that used data from 1999–2000 or earlier SASS administrations. The analyses include teachers of all academic backgrounds. No distinction is made between degrees awarded within or outside a department, college, or school of education (i.e., degrees from both education and subject specific departments are included). The teacher major field of study measure was produced using the educational background items in the SASS Teacher Questionnaire. Teacher education was categorized using two components of teachers’ academic majors: the level at which the postsecondary degree was earned and the major field of study. The measure considered a teacher to have an in-field major if he/she either held at least a bachelor’s degree in a major corresponding to the subject of the main assignment (tables 1–3), or held a degree corresponding to the subject of the class areas (tables 4 and 5).
Teacher certification status was based on three criteria—certification type, content area(s), and grade level(s). The SASS Teacher Questionnaire allows the respondent to report a first and second certification, if applicable, and both are considered in the analyses. To satisfy the analytical requirements of the teacher certification measure a teacher must have reported a regular or standard state certification, an advanced professional certificate, or a certificate issued after satisfying all certification requirements except the completion of a probationary period. In addition, the certification must have been granted by, or recognized in, the state in which the teacher currently teaches. Further, given this report’s focus on high school-level teachers, all certificates must apply to any of grades 9−12.
Matching Subject Taught and Teacher Qualifications
Not only may teachers teach more than one subject, but also they may have earned more than one postsecondary degree and/or more than one certification. The analyses in this paper consider a teacher to have an in-field major or in-field certification if the major or certification that the teacher holds matches the subjects taught. Therefore, matches need to be made across all the

9
subjects taught and all the qualifications held. For example, a mathematics teacher is considered to hold a mathematics major if he or she reported any of the following majors: mathematics, computer science, engineering, or physics. See appendix D and exhibit D-1 for information on how the matches between subjects taught and teacher qualifications were determined.
10
Findings Presented below are findings from the teacher qualifications analyses using the 2007–08 Schools and Staffing Survey (SASS) Restricted-Use Public School Teacher Data File. Henceforth, when referring to teacher-level findings (tables 1, 2, and 3), the term “teacher” denotes a traditional public and public charter school teacher of departmentalized classes who instructs students in any of grades 10–12, or grade 9 but no grade lower. In contrast, when referencing class- and student-level findings (tables 4 and 5), the term “teacher” describes a traditional public and public charter school teacher of a departmentalized class containing students in any of grades 9−12.
At all levels of analysis, the term “major” refers to any major that is in-field and held at the bachelor’s degree level or higher. The term “certification” refers to a regular or standard state certification, advanced professional certificate, or a certificate issued after satisfying all requirements except the completion of a probationary period. For teachers to be categorized as “certified” in this report certifications must apply to any of grades 9−12, except for the subjects of art/arts and crafts, music, and dance/drama or theater, for which an ungraded certification is acceptable.
With the exception of table 1, results are compared and described based on whether or not teachers had in-field majors, certifications, a combination of both, or neither. These percentages provide an overall picture of the teacher qualification status, and give information regarding the variation between broad field and subfield areas. In the teacher-level analyses, teachers may be counted more than once (e.g., counted in the row for broad field and a subfield main assignment). For the broad fields, teachers were credited as being in-field if they reported teaching in their main assignments in the specific broad fields or any corresponding subfield areas. However, at the subfield level, teachers were credited as being in-field only if they reported a main assignment of any science or social science subfields and instructed courses within the same respective subfields.
The tables present cross-tabulation estimates, and t tests were used to compare differences between the estimates for statistical significance. All differences cited in this report are statistically significant at the p < .05 level. No corrections were made for multiple comparisons. As a result, an increase in Type I error is possible. Type I error is the observation of a statistical difference when, in fact, there is none. Readers are cautioned not to make causal inferences about the data presented here.
In addition, readers are cautioned against making direct comparisons between estimates in this report and previously published estimates that use SASS data from the 1999–2000 and prior administrations. Several changes were implemented in the 2003−04 SASS Teacher Questionnaire and carried over into the 2007−08 SASS. For example, questions that allowed matching between certifications and main assignments and teacher grade levels taught were changed after the 1999–2000 administration. Small changes were made to the 2007–08 SASS Teacher Questionnaire, but they do not undermine comparisons to 2003–04 data. All changes are fully documented in appendix C.
11
Teacher-Level Findings: Selected Main Assignments
The SASS Teacher Questionnaire asked teachers to report their main teaching assignment, that is, the field in which they taught the most classes. As stated earlier in the report, teachers may have taught additional classes outside the reported main assignments. This section examines the percentage of classes that teachers taught in their main assignments (table 1), as well as the percentage of teachers who held various combinations of qualifications (major and/or certification) in relation to their main assignments (table 2). Table 3 combines information from tables 1 and 2 to examine the qualifications of teachers in four selected main assignments by the percentage of classes they taught in their main assignment areas.
Classes Taught in Main Assignment
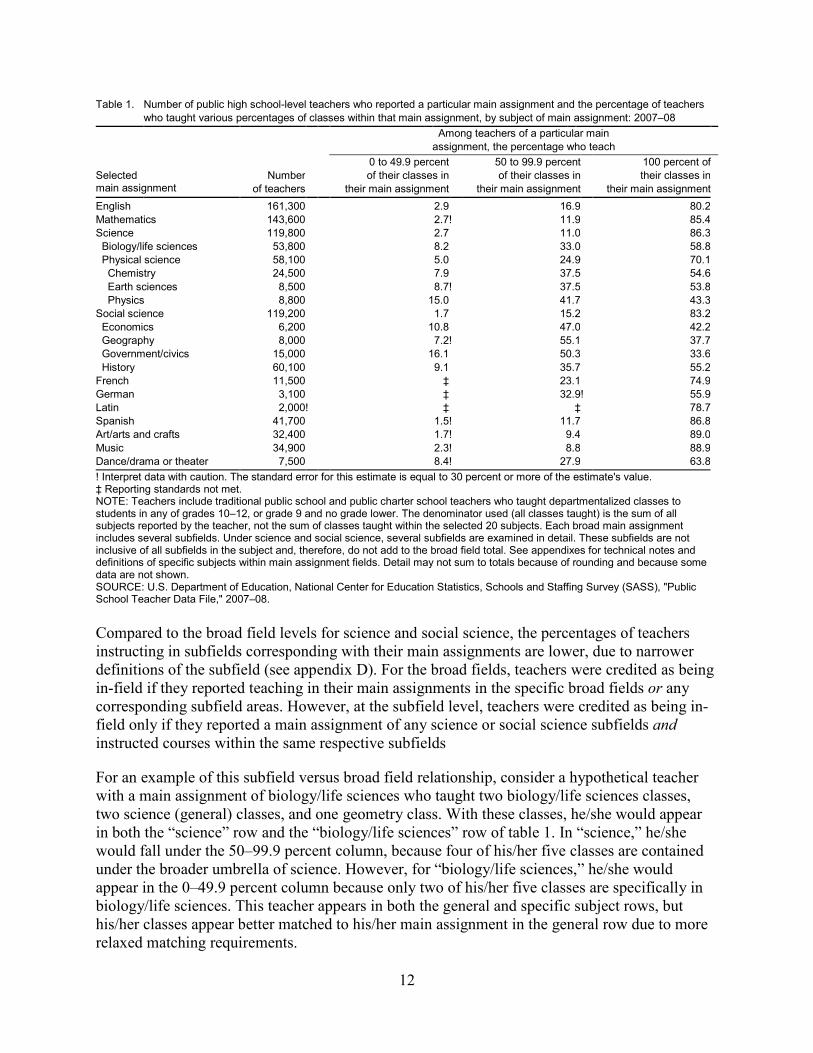
As shown in table 1, the four most frequently reported main assignments for public high school-level teachers who taught in departmentalized classes in 2007–08 were English (161,300), mathematics (143,600), science (119,800), and social science (119,200). The two least frequently reported main assignments were German (3,100) and Latin (2,000). While some teachers may have instructed additional classes outside their main assignments, many teachers only instructed classes within their main assignments. For example, of approximately 161,300 teachers with an English main assignment, about 80 percent taught all of their classes in English, while an additional 17 percent taught 50 to 99.9 percent of their classes in English. Only 3 percent of these teachers taught less than half of their classes in English. In fact, in all broad subject areas with the exception of German,9
a majority of teachers instructed all classes in their main assignments. Further, more than three-quarters of teachers of the four most frequently reported subjects taught only classes in their respective main assignments. Because the SASS Teacher Questionnaire defines main assignment as the subject in which the teacher instructs the most classes and asks teachers to report their main assignments with that definition in mind, these findings are expected.
9 Estimate for German was not statistically significantly greater than 50 percent based on a t test calculation.
12
Table 1. Number of public high school-level teachers who reported a particular main assignment and the percentage of teachers
who taught various percentages of classes within that main assignment, by subject of main assignment: 2007–08
Among teachers of a particular main assignment, the percentage who teach
f t
Selected main assign ment
0 to 49.9 percent
50 to 99.9 percent of their classes in
their main assignment
100 percent oNumber
of their classes in their classes in
of teachers
their main assignment their main assignmenEnglish 161,300
2.9 16.9 80.2
Mathematics 143,600
2.7 ! 11.9 85.4 Science 119,800
2.7 11.0 86.3
Biology/life sciences 53,800
8.2 33.0 58.8 Physical science 58,100
5.0 24.9 70.1
Chemistry 24,500
7.9 37.5 54.6 Earth sciences 8,500
8.7 ! 37.5 53.8
Physics 8,800
15.0 41.7 43.3 Social science 119,200
1.7 15.2 83.2
Economics 6,200
10.8 47.0 42.2 Geography 8,000
7.2 ! 55.1 37.7
Government/civics 15,000
16.1 50.3 33.6 History 60,100
9.1 35.7 55.2
French 11,500
‡
23.1 74.9 German 3,100
‡
32.9 ! 55.9 Latin 2,000 !
‡
‡
78.7 Spanish 41,700
1.5 ! 11.7 86.8
Art/arts and crafts 32,400
1.7 ! 9.4 89.0 Music 34,900
2.3 ! 8.8 88.9
Dance/drama or theater 7,500
8.4 ! 27.9 63.8 ! Interpret data with caution. The standard error for this estimate is equal to 30 percent or more of the estimate's value. ‡ Reporting standards not met. NOTE: Teachers include traditional public school and public charter school teachers who taught departmentalized classes to students in any of grades 10–12, or grade 9 and no grade lower. The denominator used (all classes taught) is the sum of all subjects reported by the teacher, not the sum of classes taught within the selected 20 subjects. Each broad main assignment includes several subfields. Under science and social science, several subfields are examined in detail. These subfields are not inclusive of all subfields in the subject and, therefore, do not add to the broad field total. See appendixes for technical notes and definitions of specific subjects within main assignment fields. Detail may not sum to totals because of rounding and because some data are not shown. SOURCE: U.S. Department of Education, National Center for Education Statistics, Schools and Staffing Survey (SASS), "Public School Teacher Data File," 2007–08. Compared to the broad field levels for science and social science, the percentages of teachers instructing in subfields corresponding with their main assignments are lower, due to narrower definitions of the subfield (see appendix D). For the broad fields, teachers were credited as being in-field if they reported teaching in their main assignments in the specific broad fields or any corresponding subfield areas. However, at the subfield level, teachers were credited as being in-field only if they reported a main assignment of any science or social science subfields and instructed courses within the same respective subfields
For an example of this subfield versus broad field relationship, consider a hypothetical teacher with a main assignment of biology/life sciences who taught two biology/life sciences classes, two science (general) classes, and one geometry class. With these classes, he/she would appear in both the “science” row and the “biology/life sciences” row of table 1. In “science,” he/she would fall under the 50–99.9 percent column, because four of his/her five classes are contained under the broader umbrella of science. However, for “biology/life sciences,” he/she would appear in the 0–49.9 percent column because only two of his/her five classes are specifically in biology/life sciences. This teacher appears in both the general and specific subject rows, but his/her classes appear better matched to his/her main assignment in the general row due to more relaxed matching requirements.
13
Across the science and social science subfields in table 1, only three of nine subfields (i.e., biology/life sciences, physical science, and history) have more than 50 percent of the teachers instructing all classes in their main teaching assignment.10 Among these subfields, physical science (70 percent) has the highest percentage of teachers instructing all classes in their main assignments.
Teacher Qualifications by Main Assignment
The following section presents the percentage distribution of teachers with a major in the main assignment (regardless of certification status), certification in the main assignment (regardless of major status), both major and certification in the main assignment, and neither major nor certification in the main assignment.
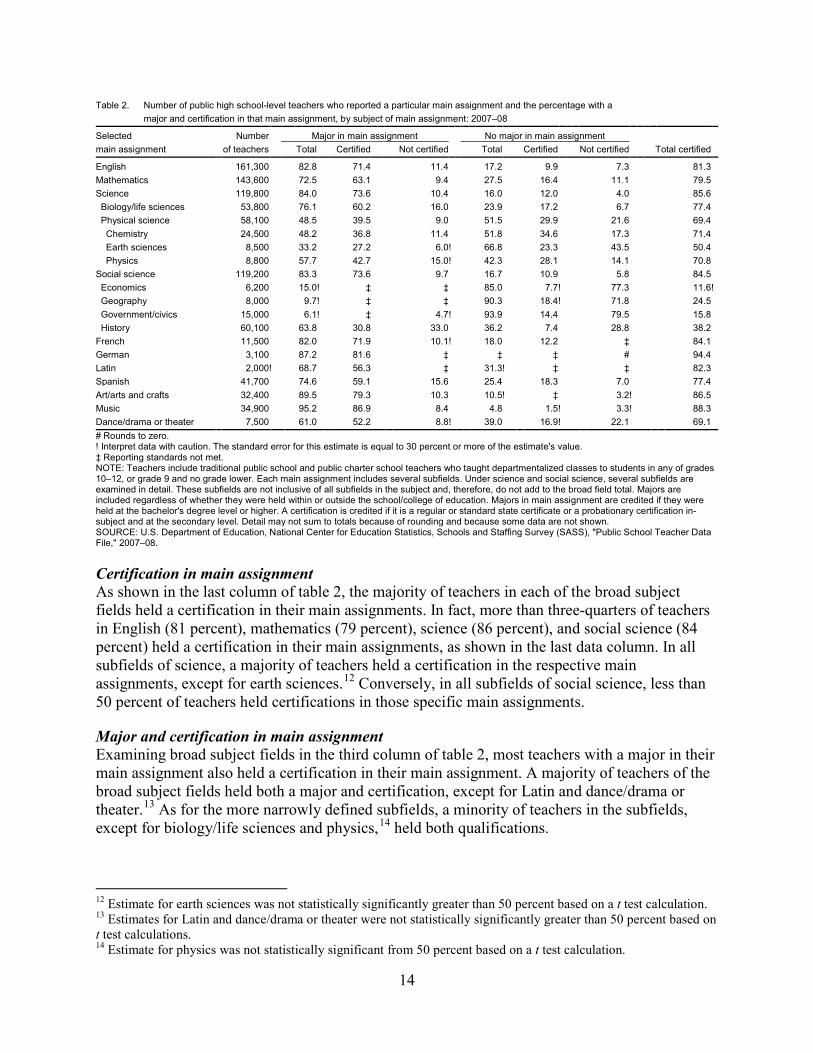
Major in main assignment The second data column of table 2 show that the majority of teachers in each of the broad subject fields held a major in the respective main assignments, except in Latin and dance/drama or theater.11
Further, more than three-quarters of teachers of English (83 percent), science (84 percent), and social science (83 percent) held a major in their main assignments . About 73 percent of teachers with a main assignment of mathematics held a major in mathematics. Compared to the broad fields, a lower percentage of teachers held a major in the corresponding subfields of science and social science, which, again, are more narrowly defined than the broad fields].
10 Estimates for chemistry and earth sciences were not statistically significantly greater than 50 percent based on t test calculations. 11 Estimates for Latin and dance/drama or theater were not statistically significantly greater than 50 percent based on t test calculations.
14
Table 2. Number of public high school-level teachers who reported a particular main assignment and the percentage with a
major and certification in that main assignment, by subject of main assignment: 2007–08
Selected
Number
Major in main assignment
No major in main assignment
main assignment of teachers
Total
Certified
Not certified
Total
Certified
Not certified
Total certified English
161,300 82.8 71.4 11.4 17.2 9.9 7.3 81.3
Mathematics
143,600 72.5 63.1 9.4 27.5 16.4 11.1 79.5 Science
119,800 84.0 73.6 10.4 16.0 12.0 4.0 85.6
Biology/life sciences
53,800 76.1 60.2 16.0 23.9 17.2 6.7 77.4 Physical science
58,100 48.5 39.5 9.0 51.5 29.9 21.6 69.4
Chemistry
24,500 48.2 36.8 11.4 51.8 34.6 17.3 71.4 Earth sciences
8,500 33.2 27.2 6.0 ! 66.8 23.3 43.5 50.4
Physics
8,800 57.7 42.7 15.0 ! 42.3 28.1 14.1 70.8 Social science
119,200 83.3 73.6 9.7 16.7 10.9 5.8 84.5
Economics
6,200 15.0 ! ‡
‡
85.0 7.7 ! 77.3 11.6 ! Geography
8,000 9.7 ! ‡
‡
90.3 18.4 ! 71.8 24.5 Government/civics
15,000 6.1 ! ‡
4.7 ! 93.9 14.4 79.5 15.8
History
60,100 63.8 30.8 33.0 36.2 7.4 28.8 38.2 French
11,500 82.0 71.9 10.1 ! 18.0 12.2 ‡
84.1
German
3,100 87.2 81.6 ‡
‡
‡
#
94.4 Latin
2,000 ! 68.7 56.3 ‡
31.3 ! ‡
‡
82.3 Spanish
41,700 74.6 59.1 15.6 25.4 18.3
7.0 77.4
Art/arts and crafts
32,400 89.5 79.3 10.3 10.5 ! ‡
3.2 ! 86.5 Music
34,900 95.2 86.9 8.4 4.8 1.5 ! 3.3 ! 88.3
Dance/drama or theater
7,500 61.0 52.2 8.8 ! 39.0 16.9 ! 22.1 69.1 # Rounds to zero. ! Interpret data with caution. The standard error for this estimate is equal to 30 percent or more of the estimate's value. ‡ Reporting standards not met. NOTE: Teachers include traditional public school and public charter school teachers who taught departmentalized classes to students in any of grades 10–12, or grade 9 and no grade lower. Each main assignment includes several subfields. Under science and social science, several subfields are examined in detail. These subfields are not inclusive of all subfields in the subject and, therefore, do not add to the broad field total. Majors are included regardless of whether they were held within or outside the school/college of education. Majors in main assignment are credited if they were held at the bachelor's degree level or higher. A certification is credited if it is a regular or standard state certificate or a probationary certification in-subject and at the secondary level. Detail may not sum to totals because of rounding and because some data are not shown. SOURCE: U.S. Department of Education, National Center for Education Statistics, Schools and Staffing Survey (SASS), "Public School Teacher Data File," 2007–08.
Certification in main assignment As shown in the last column of table 2, the majority of teachers in each of the broad subject fields held a certification in their main assignments. In fact, more than three-quarters of teachers in English (81 percent), mathematics (79 percent), science (86 percent), and social science (84 percent) held a certification in their main assignments, as shown in the last data column. In all subfields of science, a majority of teachers held a certification in the respective main assignments, except for earth sciences.12 Conversely, in all subfields of social science, less than 50 percent of teachers held certifications in those specific main assignments.
Major and certification in main assignment Examining broad subject fields in the third column of table 2, most teachers with a major in their main assignment also held a certification in their main assignment. A majority of teachers of the broad subject fields held both a major and certification, except for Latin and dance/drama or theater.13 As for the more narrowly defined subfields, a minority of teachers in the subfields, except for biology/life sciences and physics,14
held both qualifications.
12 Estimate for earth sciences was not statistically significantly greater than 50 percent based on a t test calculation. 13 Estimates for Latin and dance/drama or theater were not statistically significantly greater than 50 percent based on t test calculations. 14 Estimate for physics was not statistically significant from 50 percent based on a t test calculation.
15
Teacher Qualifications by Main Assignment and Percentage of Classes Taught in Main Assignment
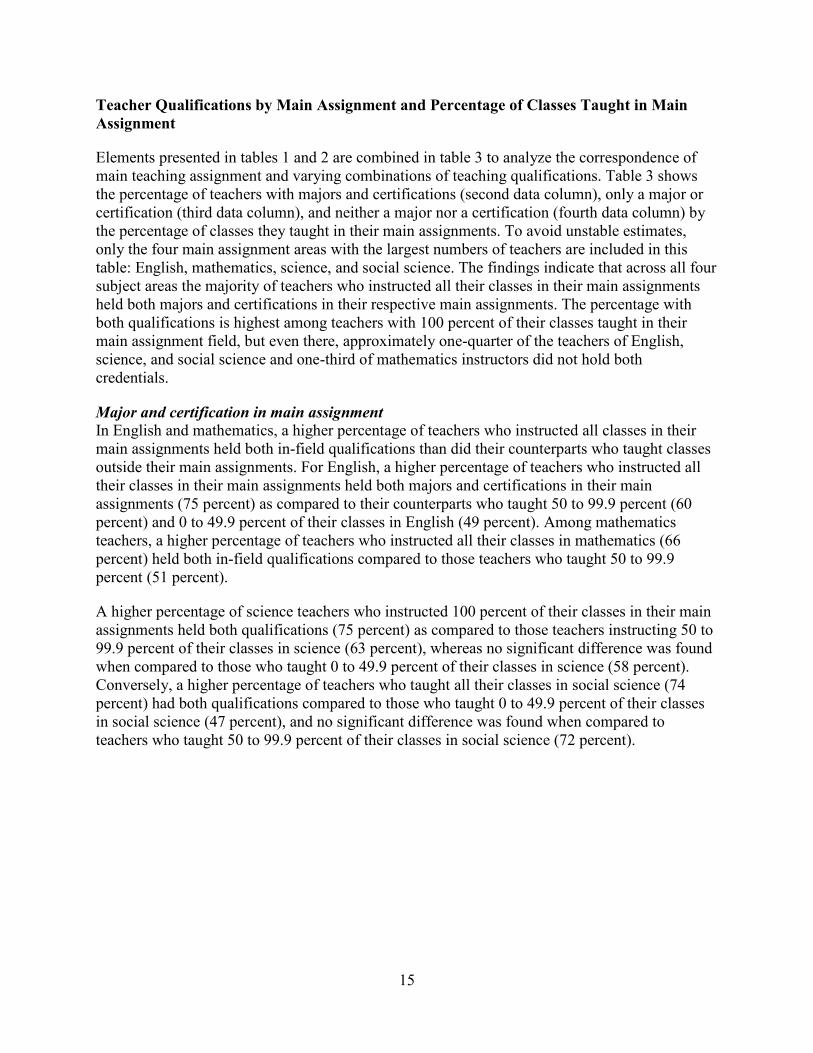
Elements presented in tables 1 and 2 are combined in table 3 to analyze the correspondence of main teaching assignment and varying combinations of teaching qualifications. Table 3 shows the percentage of teachers with majors and certifications (second data column), only a major or certification (third data column), and neither a major nor a certification (fourth data column) by the percentage of classes they taught in their main assignments. To avoid unstable estimates, only the four main assignment areas with the largest numbers of teachers are included in this table: English, mathematics, science, and social science. The findings indicate that across all four subject areas the majority of teachers who instructed all their classes in their main assignments held both majors and certifications in their respective main assignments. The percentage with both qualifications is highest among teachers with 100 percent of their classes taught in their main assignment field, but even there, approximately one-quarter of the teachers of English, science, and social science and one-third of mathematics instructors did not hold both credentials.
Major and certification in main assignment In English and mathematics, a higher percentage of teachers who instructed all classes in their main assignments held both in-field qualifications than did their counterparts who taught classes outside their main assignments. For English, a higher percentage of teachers who instructed all their classes in their main assignments held both majors and certifications in their main assignments (75 percent) as compared to their counterparts who taught 50 to 99.9 percent (60 percent) and 0 to 49.9 percent of their classes in English (49 percent). Among mathematics teachers, a higher percentage of teachers who instructed all their classes in mathematics (66 percent) held both in-field qualifications compared to those teachers who taught 50 to 99.9 percent (51 percent).
A higher percentage of science teachers who instructed 100 percent of their classes in their main assignments held both qualifications (75 percent) as compared to those teachers instructing 50 to 99.9 percent of their classes in science (63 percent), whereas no significant difference was found when compared to those who taught 0 to 49.9 percent of their classes in science (58 percent). Conversely, a higher percentage of teachers who taught all their classes in social science (74 percent) had both qualifications compared to those who taught 0 to 49.9 percent of their classes in social science (47 percent), and no significant difference was found when compared to teachers who taught 50 to 99.9 percent of their classes in social science (72 percent).
16
Table 3. Number of public high school-level teachers who reported a particular main assignment and the percentage of teachers with various qualifications who taught various percentages of classes within that main assignment, by subject of main assignment: 2007–08
Percent with a major
Percent with only a major
Percent with neither Selected
Number
and certification in
or only a certification
a major nor a certification
main assignment of teachers
their main assignment
in their main assignment
in their main assignment English
161,300 71.4 21.3 7.3
Percentage of classes taught in English 0 to 49.9
4,700 48.7 21.5 ! 29.9 !
50 to 99.9
27,200 60.0 28.9 11.0 100
129,300 74.6 19.7 5.7
Mathematics 143,600 63.1 25.8 11.1
Percentage of classes taught in mathematics 0 to 49.9
3,900 ! ‡
‡
50.1 ! 50 to 99.9
17,100 51.3 30.5 18.2
100
122,700 66.5 24.6 8.9
Science
119,800 73.6 22.4 4.0
Percentage of classes taught in science 0 to 49.9
3,200 58.1 23.5 ! 18.4 !
50 to 99.9
13,200 63.3 28.7 7.9 100
103,300 75.4 21.6 3.0
Social science 119,200 73.6 20.6 5.8
Percentage of classes taught in social science 0 to 49.9
2,000 47.3 32.4 ! 20.3 !
50 to 99.9
18,100 71.7 20.4 7.8 100
99,100 74.5 20.4 5.1
! Interpret data with caution. The standard error for this estimate is equal to 30 percent or more of the estimate's value. ‡ Reporting standards not met. NOTE: Teachers include traditional public school and public charter school teachers who taught departmentalized classes to students in any of grades 10–12, or grade 9 and no grade lower. Majors are included regardless of whether they were held within or outside the school/college of education. Majors in main assignment are credited if they were held at the bachelor's degree level or higher. A certification is credited if it is a regular or standard state certificate or a probationary certification in-subject and at the secondary level. Detail may not sum to totals because of rounding and because some data are not shown. SOURCE: U.S. Department of Education, National Center for Education Statistics, Schools and Staffing Survey (SASS), "Public School Teacher Data File," 2007–08.
Neither major nor certification in main assignment Of the four subjects presented in table 3, less than 10 percent of English, science, and social science teachers who taught all classes in their main assignments had neither an in-field major nor a certification. Specifically, 6 percent of English teachers, 3 percent of science teachers, and 5 percent of social science teachers taught all classes in their main assignment without an in-field major or certification.
Class- and Student-Level Findings: Selected Subject Areas
Not all teachers instruct the same number of classes and not all classes have the same number of students. Class- and student-level analyses15 offer additional insight into the issues of the qualifications of teachers that individual students experience. At the same time, some grade 9–12 classes are taught by teachers who do not fit the definition of high school-level teachers. The analyses below are at the class and student levels to capture the effects that may be hidden if examined only at the teacher level.
15 SASS was designed as a representative sample of teachers. Class- and student-level estimates are based on classes and students taught by teachers in SASS and may not be nationally representative of classes and students.
17
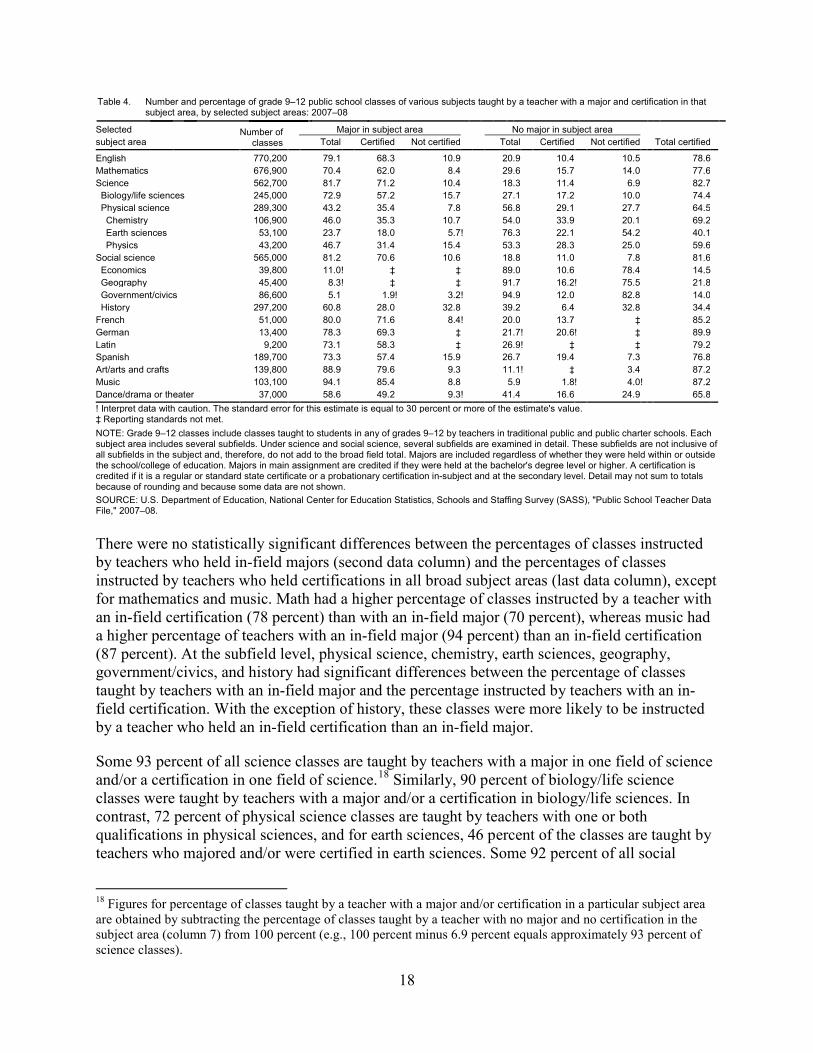
This section analyzes teacher qualifications at the class and student levels to examine what percentage of classes and students, respectively, are taught by teachers with the range of qualification categories examined in this report. Tables 4 and 5 present estimates of grade 9–12 classes and students taught in various subject areas by teachers who hold different combinations of majors and certifications. Both tables consider all departmentalized teachers of grades 9–12 who taught a class in one or more of the 11 broad field or nine subfield areas examined in this report. Table 4 presents the percentage of public grade 9–12 classes of the subject areas instructed by a teacher with a major or certification in that specific subject area. Table 5 shows the percentage of students in public grade 9–12 classes taught by a teacher with a major or certification in that subject area.
Grade 9–12 Classes by Teacher Qualifications and Subject Area
Table 4 displays the percentage of grade 9–12 classes instructed by a teacher with a major and certification in the subject area.
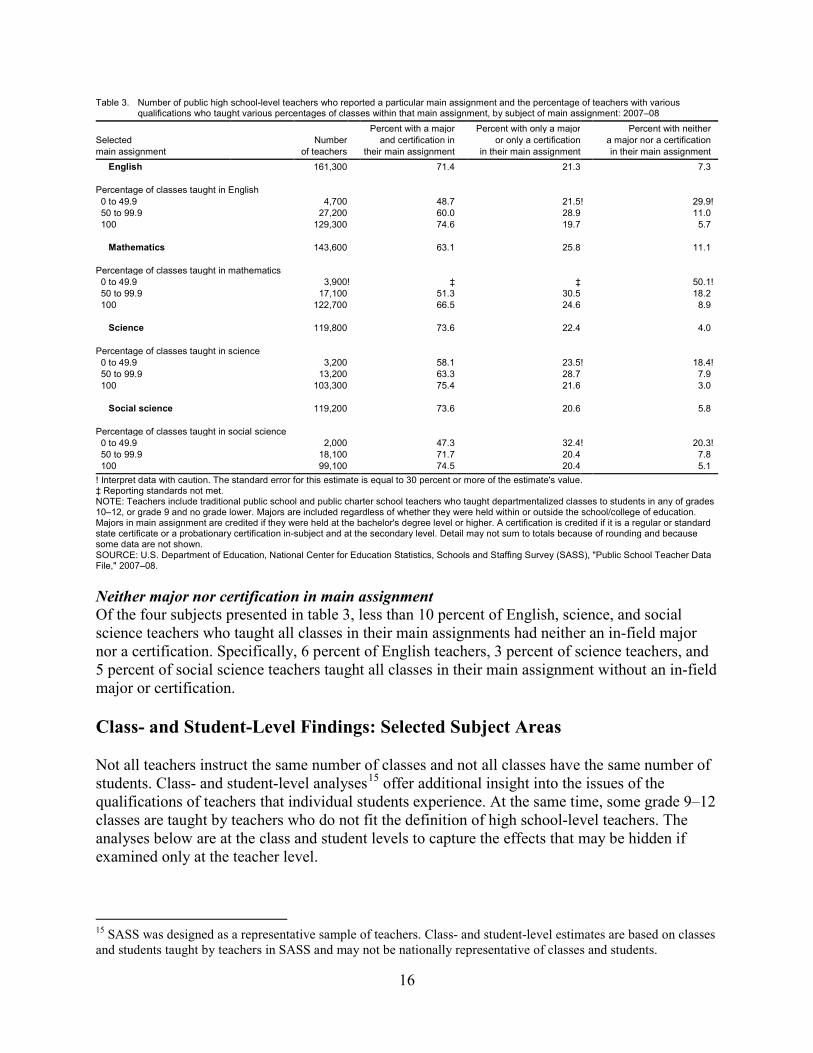
Major and certification in subject area In the broad subject areas, a majority of grade 9–12 classes were taught by teachers with both a major and certification in the same subject area, except for German, Latin, and dance/drama or theater.16 Conversely, at the subfield level, only classes of biology/life sciences (57 percent) had more than 50 percent of teachers with both qualifications.
Major or certification in subject area A majority of grade 9–12 classes in the broad fields were taught by teachers with majors in their respective subject area, except dance/drama or theater.17
As shown in the last data column, “Total certified,” the majority of classes for all broad subject areas were taught by teachers with an in-field certification. While no social science subfields had more than 50 percent of classes taught by teachers with in-field certification, all science subfields except earth sciences had a majority of teachers with in-field certification.
At the subfield level, only biology/life sciences (73 percent) and history (61 percent) had more than 50 percent of classes taught by teachers with in-field majors.
16 Estimates for German and Latin were not statistically significantly greater than 50 percent based on t test calculations. 17 Estimate for dance/drama or theater was not statistically significantly greater than 50 percent based on t test calculation.
18
Table 4. Number and percentage of grade 9–12 public school classes of various subjects taught by a teacher with a major and certification in that subject area, by selected subject areas: 2007–08
Selected subject area
Number of classes
No major in su bject area
Major in su bject area
Total Certified Not certified Total Certified Not certified Total certified
English
770,200 79.1 68.3 10.9
20.9 10.4 10.5
78.6 Mathematics 676,900 70.4 62.0 8.4
29.6 15.7 14.0
77.6
Science
562,700 81.7 71.2 10.4
18.3 11.4 6.9
82.7 Biology/life sciences 245,000 72.9 57.2 15.7
27.1 17.2 10.0
74.4
Physical science 289,300 43.2 35.4 7.8
56.8 29.1 27.7
64.5 Chemistry 106,900 46.0 35.3 10.7
54.0 33.9 20.1
69.2
Earth sciences 53,100 23.7 18.0 5.7 !
76.3 22.1 54.2
40.1 Physics
43,200 46.7 31.4 15.4
53.3 28.3 25.0
59.6
Social science 565,000 81.2 70.6 10.6
18.8 11.0 7.8
81.6 Economics 39,800 11.0 ! ‡
‡
89.0 10.6 78.4
14.5 Geography 45,400 8.3 ! ‡
‡
91.7 16.2 ! 75.5
21.8 Government/civics 86,600 5.1 1.9 ! 3.2 !
94.9 12.0 82.8
14.0
History
297,200 60.8 28.0 32.8
39.2 6.4 32.8
34.4 French
51,000 80.0 71.6 8.4 !
20.0 13.7 ‡
85.2
German
13,400 78.3 69.3 ‡
21.7 ! 20.6 ! ‡
89.9 Latin
9,200 73.1 58.3 ‡
26.9 ! ‡
‡
79.2 Spanish
189,700 73.3 57.4 15.9
26.7 19.4 7.3
76.8
Art/arts and crafts 139,800 88.9 79.6 9.3
11.1 ! ‡
3.4
87.2 Music
103,100 94.1 85.4 8.8
5.9 1.8 ! 4.0 !
87.2
Dance/drama or theater 37,000
58.6 49.2 9.3 ! 41.4 16.6 24.9 65.8 ! Interpret data with caution. The standard error for this estimate is equal to 30 percent or more of the estimate's value. ‡ Reporting standards not met. NOTE: Grade 9–12 classes include classes taught to students in any of grades 9–12 by teachers in traditional public and public charter schools. Each subject area includes several subfields. Under science and social science, several subfields are examined in detail. These subfields are not inclusive of all subfields in the subject and, therefore, do not add to the broad field total. Majors are included regardless of whether they were held within or outside the school/college of education. Majors in main assignment are credited if they were held at the bachelor's degree level or higher. A certification is credited if it is a regular or standard state certificate or a probationary certification in-subject and at the secondary level. Detail may not sum to totals because of rounding and because some data are not shown. SOURCE: U.S. Department of Education, National Center for Education Statistics, Schools and Staffing Survey (SASS), "Public School Teacher Data File," 2007–08.
There were no statistically significant differences between the percentages of classes instructed by teachers who held in-field majors (second data column) and the percentages of classes instructed by teachers who held certifications in all broad subject areas (last data column), except for mathematics and music. Math had a higher percentage of classes instructed by a teacher with an in-field certification (78 percent) than with an in-field major (70 percent), whereas music had a higher percentage of teachers with an in-field major (94 percent) than an in-field certification (87 percent). At the subfield level, physical science, chemistry, earth sciences, geography, government/civics, and history had significant differences between the percentage of classes taught by teachers with an in-field major and the percentage instructed by teachers with an in-field certification. With the exception of history, these classes were more likely to be instructed by a teacher who held an in-field certification than an in-field major.
Some 93 percent of all science classes are taught by teachers with a major in one field of science and/or a certification in one field of science.18
Similarly, 90 percent of biology/life science classes were taught by teachers with a major and/or a certification in biology/life sciences. In contrast, 72 percent of physical science classes are taught by teachers with one or both qualifications in physical sciences, and for earth sciences, 46 percent of the classes are taught by teachers who majored and/or were certified in earth sciences. Some 92 percent of all social
18 Figures for percentage of classes taught by a teacher with a major and/or certification in a particular subject area are obtained by subtracting the percentage of classes taught by a teacher with no major and no certification in the subject area (column 7) from 100 percent (e.g., 100 percent minus 6.9 percent equals approximately 93 percent of science classes).
19
science classes are taught by teachers with one or both social science credentials, but when subfields are examined, two-thirds of history classes are taught by teachers with credentials in History, while one-quarter or less of the classes in the subfields of economics, geography, and government/civics were taught by teachers who held any credentials in the specific subfield taught. These data suggest that relatively large percentages of social science teachers hold general social science credentials or teach classes in subfields other than the fields in which they are qualified.
Neither major nor certification in subject area less than 15 percent of classes in the broad subject
areas were taught by teachers with neither an in-field major nor a certification. Specifically, 11 percent of English classes, 14 percent of math classes, 7 percent of science classes, and 8 percent of social science classes were taught by teachers who did not have either qualification.
Except for math and dance/drama or theater,19
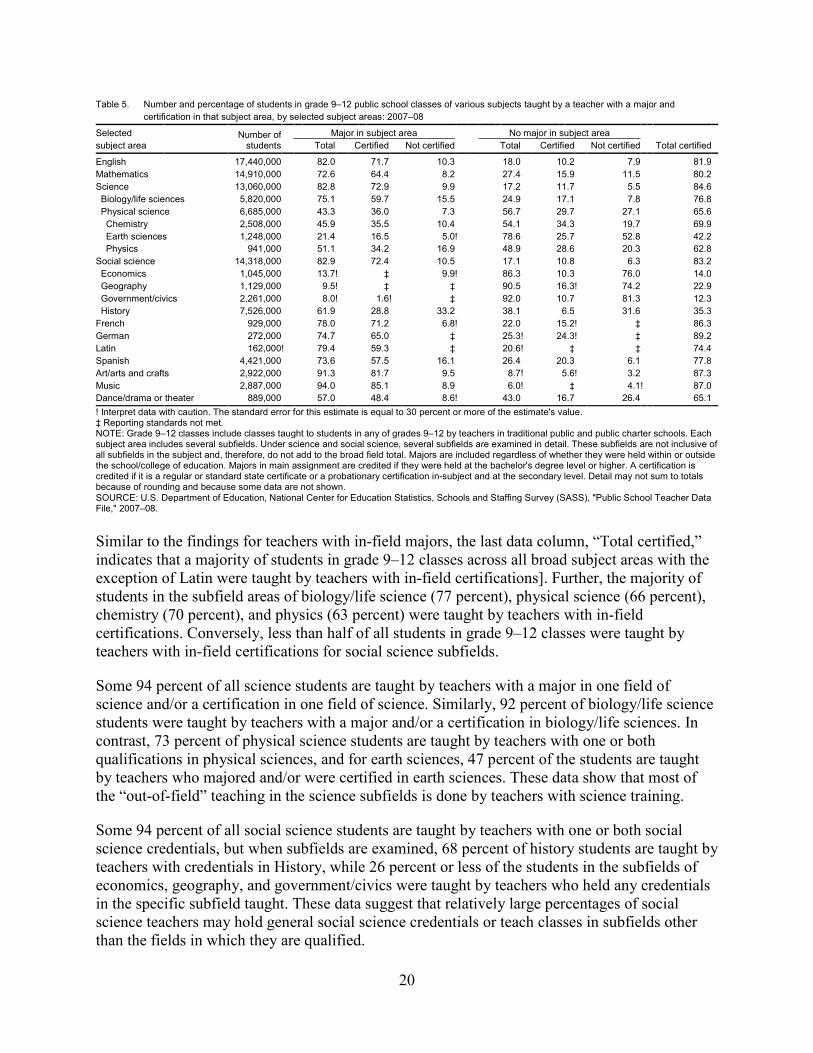
Students in Grade 9–12 Classes by Teacher Qualifications and Subject Area
Major and certification in subject area Similar to the results in table 4, table 5 shows that a majority of students in all but three broad subject areas were taught by teachers who had a major in a subject and were certified in the same subject area.20
Regarding subfields, only biology/life sciences (60 percent) had more than 50 percent of students in classes taught by teachers with both qualifications.
Major or certification in subject area The results presented in the second data column of table 5 indicate that the majority of students in broad subject area classes in grades 9–12, except dance/drama or theater, were taught by teachers with in-field majors in their respective main assignments taught.21 However, at the subfield level, only the subject areas of biology/life science (75 percent) and history (62 percent) had more than 50 percent of students taught by teachers with in-field majors.
19 French, German, and Latin are not included because their associated estimates fail to meet reporting requirements. 20 Estimates for German and Latin were not statistically significantly greater than 50 percent based on t test calculations. 21 Estimate for dance/drama or theater was not statistically significantly greater than 50 percent based on t test calculation.
20
Table 5. Number and percentage of students in grade 9–12 public school classes of various subjects taught by a teacher with a major and
certification in that subject area, by selected subject areas: 2007–08
Selected
Number of students
Major in subject area
No major in subject area subject area
Total Certified Not certified Total Certified Not certified Total certified
English
17,440,000 82.0 71.7 10.3
18.0 10.2 7.9
81.9 Mathematics 14,910,000 72.6 64.4 8.2
27.4 15.9 11.5
80.2
Science
13,060,000 82.8 72.9 9.9
17.2 11.7 5.5
84.6 Biology/life sciences 5,820,000 75.1 59.7 15.5
24.9 17.1 7.8
76.8
Physical science 6,685,000 43.3 36.0 7.3
56.7 29.7 27.1
65.6 Chemistry 2,508,000 45.9 35.5 10.4
54.1 34.3 19.7
69.9
Earth sciences 1,248,000 21.4 16.5 5.0 !
78.6 25.7 52.8
42.2 Physics
941,000 51.1 34.2 16.9
48.9 28.6 20.3
62.8
Social science 14,318,000 82.9 72.4 10.5
17.1 10.8 6.3
83.2 Economics
1,045,000 13.7 ! ‡
9.9 !
86.3 10.3 76.0
14.0
Geography
1,129,000 9.5 ! ‡
‡
90.5 16.3 ! 74.2
22.9 Government/civics 2,261,000 8.0 ! 1.6 ! ‡
92.0 10.7 81.3
12.3
History
7,526,000 61.9 28.8 33.2
38.1 6.5 31.6
35.3 French
929,000 78.0 71.2 6.8 !
22.0 15.2 ! ‡
86.3
German
272,000 74.7 65.0 ‡
25.3 ! 24.3 ! ‡
89.2 Latin
162,000 ! 79.4 59.3 ‡
20.6 ! ‡
‡
74.4 Spanish
4,421,000 73.6 57.5 16.1
26.4 20.3 6.1
77.8
Art/arts and crafts 2,922,000 91.3 81.7 9.5
8.7 ! 5.6 ! 3.2
87.3 Music
2,887,000 94.0 85.1 8.9
6.0 ! ‡
4.1 !
87.0
Dance/drama or theater 889,000 57.0 48.4 8.6 !
43.0 16.7 26.4 65.1 ! Interpret data with caution. The standard error for this estimate is equal to 30 percent or more of the estimate's value. ‡ Reporting standards not met. NOTE: Grade 9–12 classes include classes taught to students in any of grades 9–12 by teachers in traditional public and public charter schools. Each subject area includes several subfields. Under science and social science, several subfields are examined in detail. These subfields are not inclusive of all subfields in the subject and, therefore, do not add to the broad field total. Majors are included regardless of whether they were held within or outside the school/college of education. Majors in main assignment are credited if they were held at the bachelor's degree level or higher. A certification is credited if it is a regular or standard state certificate or a probationary certification in-subject and at the secondary level. Detail may not sum to totals because of rounding and because some data are not shown. SOURCE: U.S. Department of Education, National Center for Education Statistics, Schools and Staffing Survey (SASS), "Public School Teacher Data File," 2007–08.
Similar to the findings for teachers with in-field majors, the last data column, “Total certified,” indicates that a majority of students in grade 9–12 classes across all broad subject areas with the exception of Latin were taught by teachers with in-field certifications]. Further, the majority of students in the subfield areas of biology/life science (77 percent), physical science (66 percent), chemistry (70 percent), and physics (63 percent) were taught by teachers with in-field certifications. Conversely, less than half of all students in grade 9–12 classes were taught by teachers with in-field certifications for social science subfields.
Some 94 percent of all science students are taught by teachers with a major in one field of science and/or a certification in one field of science. Similarly, 92 percent of biology/life science students were taught by teachers with a major and/or a certification in biology/life sciences. In contrast, 73 percent of physical science students are taught by teachers with one or both qualifications in physical sciences, and for earth sciences, 47 percent of the students are taught by teachers who majored and/or were certified in earth sciences. These data show that most of the “out-of-field” teaching in the science subfields is done by teachers with science training.
Some 94 percent of all social science students are taught by teachers with one or both social science credentials, but when subfields are examined, 68 percent of history students are taught by teachers with credentials in History, while 26 percent or less of the students in the subfields of economics, geography, and government/civics were taught by teachers who held any credentials in the specific subfield taught. These data suggest that relatively large percentages of social science teachers may hold general social science credentials or teach classes in subfields other than the fields in which they are qualified.
21
In addition, across all the broad subject areas, only mathematics had a higher percentage of students instructed by teachers with in-field certifications (80 percent) than by teachers with in-field majors (73 percent). The subfields of science, physical science, chemistry, and earth sciences had higher percentages of students instructed by teachers with in-field certification than by teachers with in-field majors.
Neither major nor certification in subject area Except for math and dance/drama or theater,22
less than 10 percent of students in grade 9–12 classes across all broad subject areas were taught by a teacher with neither an in-field major nor an in-field certification. Specifically, 8 percent of students in English, 6 percent of students in science, and 6 percent of students in social science were taught by teachers who did not have either qualification.
22 French, German and Latin are not included because their associated estimates fail to meet reporting requirements..
22
Summary and Limitations
Summary
Overall, the results indicate that among the four most frequently reported main assignments of departmentalized public high school-level teachers (English, mathematics, science, and social science), more than three-quarters of teachers taught all their classes in their respective main assignments and a majority of these teachers held both a postsecondary degree and certification in their respective main assignments. Across the broad subject fields, a majority of teachers instructed all their classes in their main assignments and had both a major and a teaching certificate in that main assignment, except for German, Latin, and dance/drama or theater. At the subfield level, only three of the nine subfields (i.e., biology/life sciences, physical science, and history) had more than 50 percent of teachers instructing all classes in their main teaching assignment.
Among all broad subject areas at the class and student levels, teachers with majors in the subject areas they taught instructed a majority of high school-level classes and students, except dance/drama or theater. At the subfield level, only biology/life science and history had more than 50 percent of classes or students taught by teachers with in-field majors. Similarly, teachers with in-field certifications taught the majority of classes and students of broad subject areas, except Latin. At the subfield level, teachers with in-field certifications taught the majority of biology/life science, physical science, chemistry, and physics classes or students.
Limitations
The findings presented in this report provide a picture of majors and certifications at the teacher, class, and student levels. The teacher-level analysis was limited to a very specific group of teachers that represent 64 percent of all public high school-level teachers, and readers should be careful not to generalize beyond this population.
It is not within the scope of this report to investigate if any states do not offer certifications in subfield areas of science and social science. It is possible that when states don’t offer certification in the subfields, the percentages of teachers who held certifications in these subfield areas are likely to be low. Some inconsistencies are likely to be observed when comparing subfield-level estimates with broad field-level estimates. In addition, direct certification matches at the subfield level are difficult to obtain for all specific subject areas.
Also, direct comparisons between the teacher-level, class-level, and student-level estimates should be interpreted with caution. Although the subpopulations used in these different analyses largely overlap, there are differences. The teacher-level subpopulation counts teachers only once, based on their main assignments, and only teachers who taught any of grades 10–12, or grade 9 and no grade lower. The class- and student-level subpopulations consider teachers as many times as different subjects they instruct. Teacher qualifications are represented multiple times in these estimates for all classes they teach in any of grades 9–12, regardless of other grades taught.
23
Readers are cautioned against making direct comparisons between estimates in this report and previously published estimates that use SASS data from the 1999–2000 and prior administrations. Several changes were implemented in the 2003−04 SASS Teacher Questionnaire and carried over into the 2007−08 SASS, such as alterations to the way certifications were matched to main assignments and grade levels. Small changes were also made to the 2007–08 SASS Teacher Questionnaire, but they do not undermine comparisons to 2003–04 data. All changes are fully documented in appendix C.
Finally, although teachers’ majors and certifications offer substantial information regarding teachers’ qualifications, other measures could be used, such as a teacher’s highest degree achieved, certification from the National Board for Professional Teaching Standards, or perceptions of job conditions. Readers are encouraged to explore alternative measures available in the SASS data.
24
References Bill and Melinda Gates Foundation. (2010). Learning About Teaching: Initial Findings From the
Measures of Effective Teaching Project. Retrieved April 26, 2011 from http://www.gatesfoundation.org/college-ready-education/Documents/preliminary-findings-research-paper.pdf
Bobbitt, S., and McMillen, M.M. (1994). Qualifications of the Public School Teacher Workforce: 1988 and 1991 (NCES 95-665). U.S. Department of Education, National Center for Education Statistics. Washington, DC: U.S. Government Printing Office.
.
Clotfelter, C., Ladd, H., and Vigdor, J. (2007). Teacher Credentials and Student Achievement in High School: A Cross-Subject Analysis With Student Fixed Effects. Working Paper 11 (October 2007), National Center for the Analysis of Longitudinal Data in Educational Research. Retrieved April 26, 2011, from http://www.caldercenter.org/PDF/1001104_Teacher_Credentials_HighSchool.pdf
Darling-Hammond, L. (1999). Teacher Quality and Student Achievement: A Review of State Policy Evidence. Education Policy Analysis Archives, 8(1). Retrieved January 4, 2006, from
.
http://epaa.asu.edu/epaa/v8n1.
Ferguson, R.F. (1991). Paying for Public Education: New Evidence on How and Why Money Matters. Harvard Journal on Legislation, 28(2): 465–498.
Ferguson, R.F. (1998). Can School Narrow the Black-White Test Score Gap? In C. Jencks and M. Phillips (Eds.), The Black-White Test Score Gap. Washington, DC: Brookings Institution Press.
Goldhaber, D., and Brewer, D. (1997). Evaluating the Effect of Teacher Degree Level on Educational Performance. In W. Fowler (Ed.), Developments in School Finance, 1996 (NCES 97-535) (pp. 199−208). U.S. Department of Education, National Center for Education Statistics. Washington, DC: U.S. Government Printing Office.
Goldhaber, D., and Brewer, D. (1999). Teacher Licensing and Student Achievement. In M. Kanstoroom and C.E. Finn, Jr. (Eds.), Better Teachers, Better Schools (pp. 83–102). Washington, DC: Thomas B. Fordham Foundation.
Goldhaber, D.D., and Brewer, D.J. (2000). Does Teacher Certification Matter? High School Certification Status and Student Achievement. Educational Evaluation and Policy Analysis, 22(2): 129–145.
Hanushek, E. (2010). “Generalizations About Using Value-Added Measures of Teacher Quality.” American Economic Review, 100 (2):267–271.
Holt, E.W., McGrath, D.J., and Seastrom, M.M. (2006). Qualifications of Public Secondary School History Teachers, 1999–2000 (NCES 2006-004). U.S. Department of Education. Washington, DC: National Center for Education Statistics, Institute of Education Sciences.
25
Ingersoll, R.M. (1996). Out-of-Field Teaching and Educational Equality (NCES 96-040). U.S. Department of Education, National Center for Education Statistics. Washington, DC: U.S. Government Printing Office.
Ingersoll, R.M. (2007). A Comparative Study of Teacher Preparation and Qualifications in Six Nations. Retrieved January 14, 2011, from http://www.cpre.org/images/stories/cpre_pdfs/RB47.pdf.
Kane, T., Rockoff, J.E., and Staiger, D.O. (2008). What Does Certification Tell Us About Teacher Effectiveness? Evidence From New York City. Economics of Education Review, 27(6):615–631.
Kimball, S., Milanowski, A., and Heneman, H. (2010). Principals as Human Capital Manager: Evidence From Two Large Districts. Madison, WI: Consortium for Policy Research in Education, Strategic Management of Human Capital Project.
Mayer, D.P., Mullens, J.E., and Moore, M.T. (2000). Monitoring School Quality: An Indicators Report (NCES 2001-030). U.S. Department of Education, National Center for Education Statistics. Washington, DC: U.S. Government Printing Office.
McGrath, D., Holt, M., and Seastrom, M.M. (2005). Qualifications of Public Secondary School Biology Teachers, 1999–2000 (NCES 2005-081). U.S. Department of Education. Washington, DC: National Center for Education Statistics, Institute of Education Sciences.
Morton, B.A., Hurwitz, M.D., Strizek, G.A., Peltola, P., and Orlofsky, G.F. (2008). Education and Certification Qualifications of Departmentalized Public High School-Level Teachers of Core Subjects: Evidence From the 2003–04 Schools and Staffing Survey (NCES 2008-338). U.S. Department of Education. Washington, DC: National Center for Education Statistics, Institute of Education Sciences.
Murnane, R.J., and Schwinden, M. (1989). Race, Gender, and Opportunity: Supply and Demand for New Teachers in North Carolina, 1975–1985. Educational Evaluation and Policy Analysis, 11(2): 93–108.
No Child Left Behind Act of 2001, P.L. 107–110, 115 Stat. 1425 (2002).
Rivkin, S.G., Hanushek, E.A., and Kain, J.F. (2005). Teachers, Schools, and Academic Achievement. Econometrica, 73(2): 417–458.
Sanders, W.L., Wright, S.P., and Horn, S.P. (1997). Teacher and Classroom Context Effects on Student Achievement: Implications for Teacher Evaluation. Journal of Personnel Evaluation in Education, 11(1): 57–67.
Seastrom, M.M., Gruber, K.J., Henke, R., McGrath, D.J., and Cohen, B.A. (2004). Qualifications of the Public School Teacher Workforce: Prevalence of Out-of-Field Teaching, 1987−88 to 1999−2000 (NCES 2002-603 Revised). U.S. Department of Education. Washington, DC: National Center for Education Statistics.
26
Smith, T. (1995). Findings From The Condition of Education 1994: Number 3 - America's Teachers Ten Years After (NCES 95-766). U.S. Department of Education, National Center for Education Statistics. Washington, DC: U.S. Government Printing Office.
Staiger, D.O., and Rockoff, J.E. (2010). Searching for Effective Teachers With Imperfect Information. Journal of Economic Perspectives, 24(3): 97–118.
Tourkin, S., Thomas, T., Swaim, N., Cox, S., Parmer, R., Jackson, B., Cole, C., and Zhang, B. (2010). Documentation for the 2007−08 Schools and Staffing Survey (NCES 2009-318). U.S. Department of Education. Washington, DC: National Center for Education Statistics, Institute of Education Sciences.
U.S. Department of Commerce, Census Bureau. (2006). Statistical Abstract of the United States: 2006 (126th ed.). Washington, DC: Author.
U.S. Department of Education. (2003). NCES Statistical Standards (NCES 2003-601). Washington, DC: National Center for Education Statistics.
U.S. Department of Education, Office of the Deputy Secretary. (2004). No Child Left Behind: A Toolkit for Teachers. Washington, DC: Author. Retrieved July 16, 2008, from http://www.ed.gov/teachers/nclbguide/nclb-teachers-toolkit.pdf.
Walsh, K. (2001). Teacher Certification Reconsidered: Stumbling for Quality. Baltimore, MD: Abell Foundation.
Weisberg, D., Sexton, S., Mulhern, J., and Keeling, D. (2009). The Widget Effect, Our National Failure to Acknowledge and Act on Differences in Teacher Effectiveness. New York: The New Teacher Project. Retrieved April 26, 2011, from http://tntp.org/publications/reports/the-widget-effect/
Wenglinsky, H. (2002). How Schools Matter: The Link Between Teacher Classroom Practices and Student Academic Performance. Education Policy Analysis Archives, 10(12). Retrieved January 4, 2006, from
.
http://epaa.asu.edu/epaa/v10n12.
Yoon, K.S., Duncan, T., Lee, S.W.-Y., Scarloss, B., and Shapley, K. (2007). Reviewing the Evidence on How Teacher Professional Development Affects Student Achievement (Issues & Answers Report, REL 2007–No. 033). U.S. Department of Education, Washington, DC: Institute of Education Sciences, National Center for Education Evaluation and Regional Assistance, Regional Educational Laboratory Southwest. Retrieved April 26, 2011, from http://ies.ed.gov/ncee/edlabs.

A-1
Appendix A: Standard Error Tables
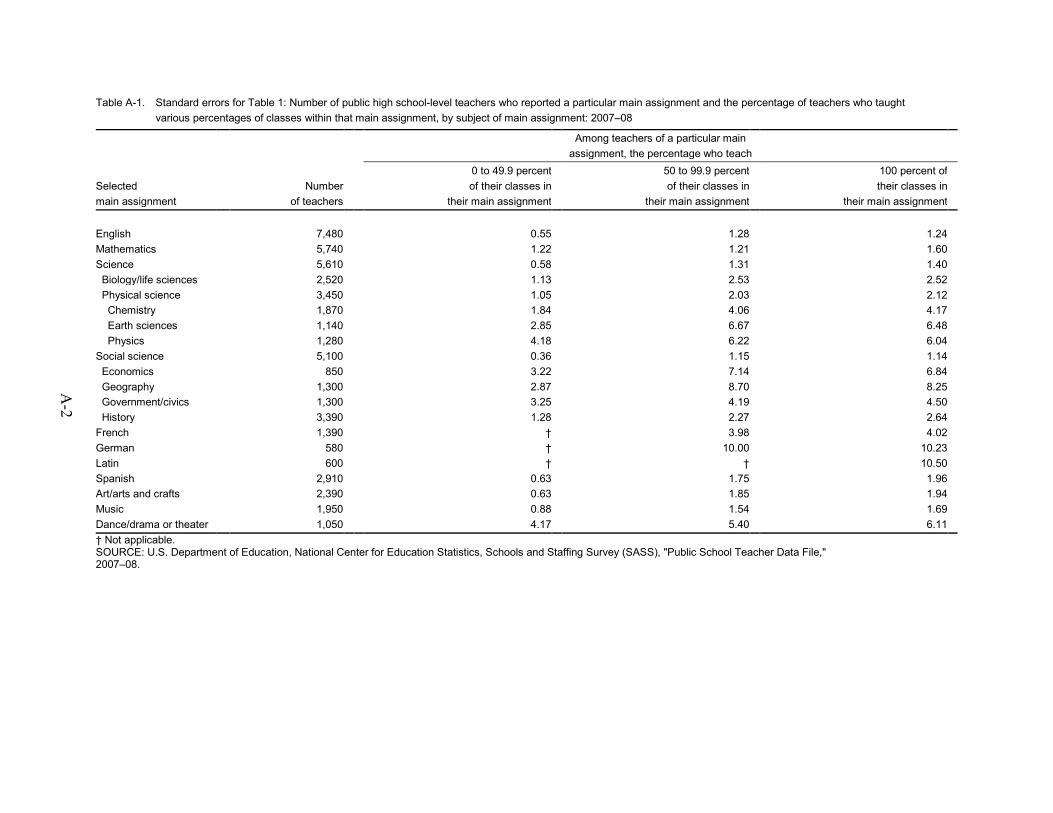
Table A-1. Standard errors for Table 1: Number of public high school-level teachers who reported a particular main assignment and the percentage of teachers who taught various percentages of classes within that main assignment, by subject of main assignment: 2007–08
Among teachers of a particular main
assignment, the percentage who teach
0 to 49.9 percent
50 to 99.9 percent
100 percent of
Selected
Number
of their classes in
of their classes in
their classes in main assignment of teachers
their main assignment their main assignment their main assignment
English
7,480
0.55
1.28
1.24
Mathematics 5,740
1.22
1.21
1.60 Science
5,610
0.58
1.31
1.40
Biology/life sciences 2,520
1.13
2.53
2.52 Physical science 3,450
1.05
2.03
2.12
Chemistry 1,870
1.84
4.06
4.17 Earth sciences 1,140
2.85
6.67
6.48
Physics
1,280
4.18
6.22
6.04 Social science 5,100
0.36
1.15
1.14
Economics 850
3.22
7.14
6.84 Geography 1,300
2.87
8.70
8.25
Government/civics 1,300
3.25
4.19
4.50 History
3,390
1.28
2.27
2.64
French
1,390
†
3.98
4.02 German
580
†
10.00
10.23 Latin
600
†
†
10.50 Spanish
2,910
0.63
1.75
1.96
Art/arts and crafts 2,390
0.63
1.85
1.94 Music
1,950
0.88
1.54
1.69
Dance/drama or theater 1,050
4.17 5.40 6.11 † Not applicable. SOURCE: U.S. Department of Education, National Center for Education Statistics, Schools and Staffing Survey (SASS), "Public School Teacher Data File," 2007–08.
A-2
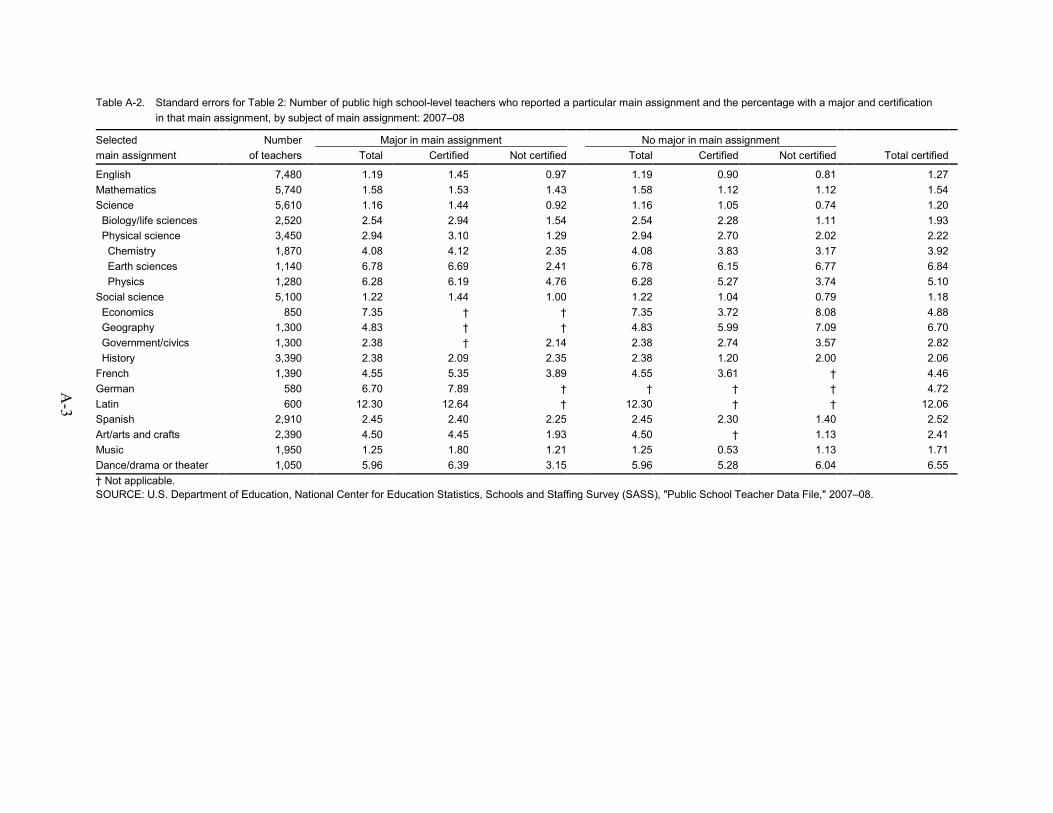
Table A-2. Standard errors for Table 2: Number of public high school-level teachers who reported a particular main assignment and the percentage with a major and certification in that main assignment, by subject of main assignment: 2007–08
Selected
Number
Major in main assignment
No major in main assignment main assignment of teachers
Total Certified Not certified Total Certified Not certified Total certified
English
7,480
1.19
1.45
0.97
1.19
0.90
0.81
1.27 Mathematics
5,740
1.58
1.53
1.43
1.58
1.12
1.12
1.54
Science
5,610
1.16
1.44
0.92
1.16
1.05
0.74
1.20 Biology/life sciences
2,520
2.54
2.94
1.54
2.54
2.28
1.11
1.93
Physical science
3,450
2.94
3.10
1.29
2.94
2.70
2.02
2.22 Chemistry
1,870
4.08
4.12
2.35
4.08
3.83
3.17
3.92
Earth sciences
1,140
6.78
6.69
2.41
6.78
6.15
6.77
6.84 Physics
1,280
6.28
6.19
4.76
6.28
5.27
3.74
5.10
Social science
5,100
1.22
1.44
1.00
1.22
1.04
0.79
1.18 Economics
850
7.35
†
†
7.35
3.72
8.08
4.88
Geography
1,300
4.83
†
†
4.83
5.99
7.09
6.70 Government/civics
1,300
2.38
†
2.14
2.38
2.74
3.57
2.82
History
3,390
2.38
2.09
2.35
2.38
1.20
2.00
2.06 French
1,390
4.55
5.35
3.89
4.55
3.61
†
4.46
German
580
6.70
7.89
†
†
†
†
4.72 Latin
600
12.30
12.64
†
12.30
†
†
12.06
Spanish
2,910
2.45
2.40
2.25
2.45
2.30
1.40
2.52 Art/arts and crafts
2,390
4.50
4.45
1.93
4.50
†
1.13
2.41
Music
1,950
1.25
1.80
1.21
1.25
0.53
1.13
1.71 Dance/drama or theater
1,050 5.96 6.39 3.15 5.96 5.28 6.04 6.55
† Not applicable. SOURCE: U.S. Department of Education, National Center for Education Statistics, Schools and Staffing Survey (SASS), "Public School Teacher Data File," 2007–08.
A-3
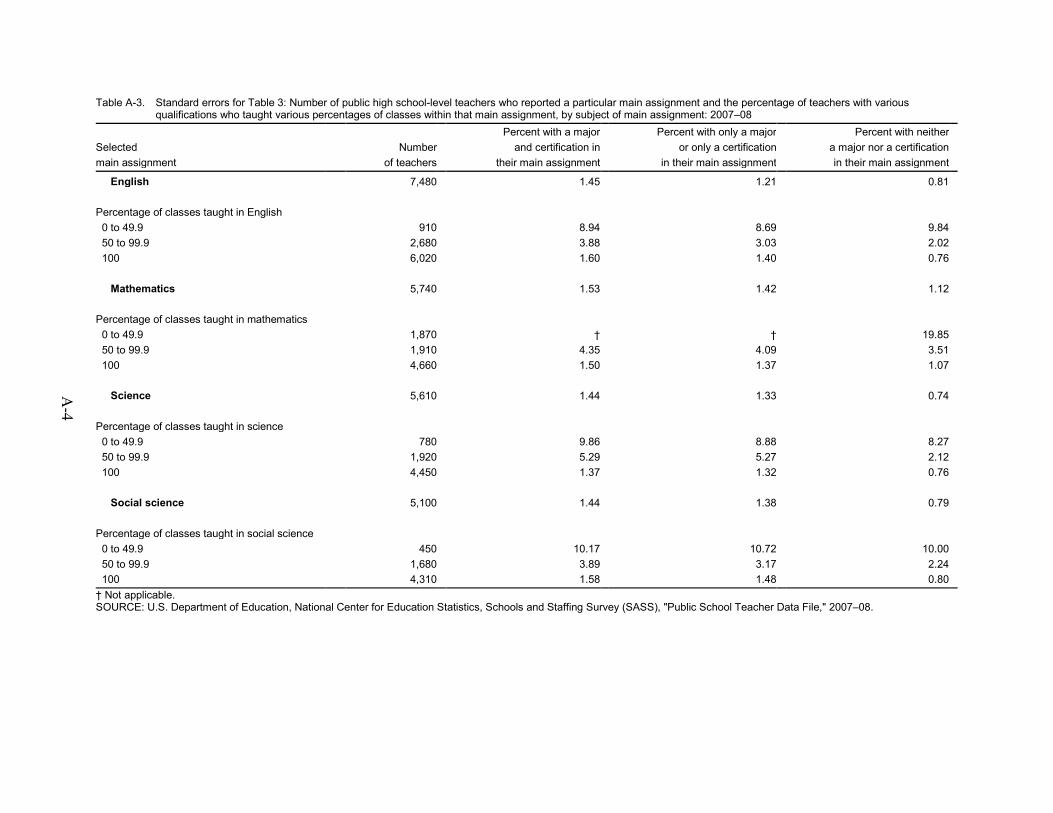
Table A-3. Standard errors for Table 3: Number of public high school-level teachers who reported a particular main assignment and the percentage of teachers with various qualifications who taught various percentages of classes within that main assignment, by subject of main assignment: 2007–08
Percent with a major
Percent with only a major
Percent with neitherSelected Number and certification in or only a certification
a major nor a certification
main assignment of teachers
their main assignment in their main assignment in their main assignment
English 7,480 1.45 1.21 0.81
Percentage of classes taught in English 0 to 49.9 910 8.94 8.69 9.84
50 to 99.9 2,680 3.88 3.03 2.02 100
6,020 1.60 1.40 0.76
Mathematics 5,740 1.53 1.42 1.12
Percentage of classes taught in mathematics 0 to 49.9 1,870 † † 19.85
50 to 99.9 1,910 4.35 4.09 3.51 100
4,660 1.50 1.37 1.07
Science
5,610 1.44 1.33 0.74
Percentage of classes taught in science 0 to 49.9 780 9.86 8.88 8.27
50 to 99.9 1,920 5.29 5.27 2.12 100
4,450 1.37 1.32 0.76
Social science 5,100
1.44 1.38 0.79
Percentage of classes taught in social science 0 to 49.9 450 10.17 10.72 10.00
50 to 99.9 1,680 3.89 3.17 2.24 100
4,310 1.58 1.48 0.80
† Not applicable. SOURCE: U.S. Department of Education, National Center for Education Statistics, Schools and Staffing Survey (SASS), "Public School Teacher Data File," 2007–08.
A-4
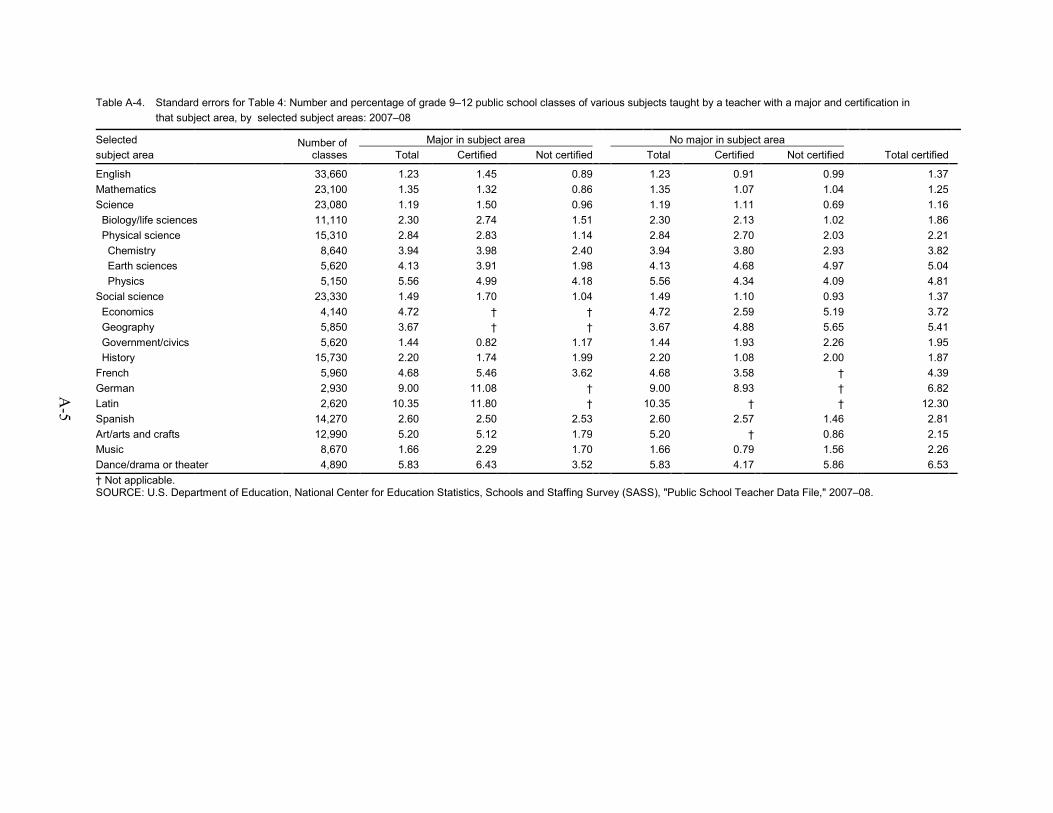
Table A-4. Standard errors for Table 4: Number and percentage of grade 9–12 public school classes of various subjects taught by a teacher with a major and certification in that subject area, by selected subject areas: 2007–08
Selected Number of classes
Major in subject area
No major in subject area
subject area Total
Certified
Not certified
Total
Certified
Not certified Total certified
English 33,660 1.23 1.45 0.89 1.23 0.91 0.99 1.37Mathematics 23,100 1.35 1.32 0.86 1.35 1.07 1.04 1.25Science
23,080 1.19 1.50 0.96 1.19 1.11 0.69 1.16
Biology/life sciences 11,110 2.30 2.74 1.51 2.30 2.13 1.02 1.86 Physical science 15,310 2.84 2.83 1.14 2.84 2.70 2.03 2.21 Chemistry 8,640 3.94 3.98 2.40 3.94 3.80 2.93 3.82 Earth sciences 5,620 4.13 3.91 1.98 4.13 4.68 4.97 5.04 Physics 5,150 5.56 4.99 4.18 5.56 4.34 4.09 4.81Social science 23,330 1.49 1.70 1.04 1.49 1.10 0.93 1.37 Economics 4,140 4.72 † † 4.72 2.59 5.19 3.72 Geography 5,850 3.67 † † 3.67 4.88 5.65 5.41 Government/civics 5,620 1.44 0.82 1.17 1.44 1.93 2.26 1.95 History 15,730 2.20 1.74 1.99 2.20 1.08 2.00 1.87French 5,960 4.68 5.46 3.62 4.68 3.58 † 4.39German 2,930 9.00 11.08 † 9.00 8.93 † 6.82Latin 2,620 10.35 11.80 † 10.35 † † 12.30Spanish 14,270 2.60 2.50 2.53 2.60 2.57 1.46 2.81Art/arts and crafts 12,990 5.20 5.12 1.79 5.20 † 0.86 2.15Music 8,670 1.66 2.29 1.70 1.66 0.79 1.56 2.26Dance/drama or theater 4,890
5.83 6.43 3.52 5.83 4.17 5.86 6.53
† Not applicable. SOURCE: U.S. Department of Education, National Center for Education Statistics, Schools and Staffing Survey (SASS), "Public School Teacher Data File," 2007–08.
A-5
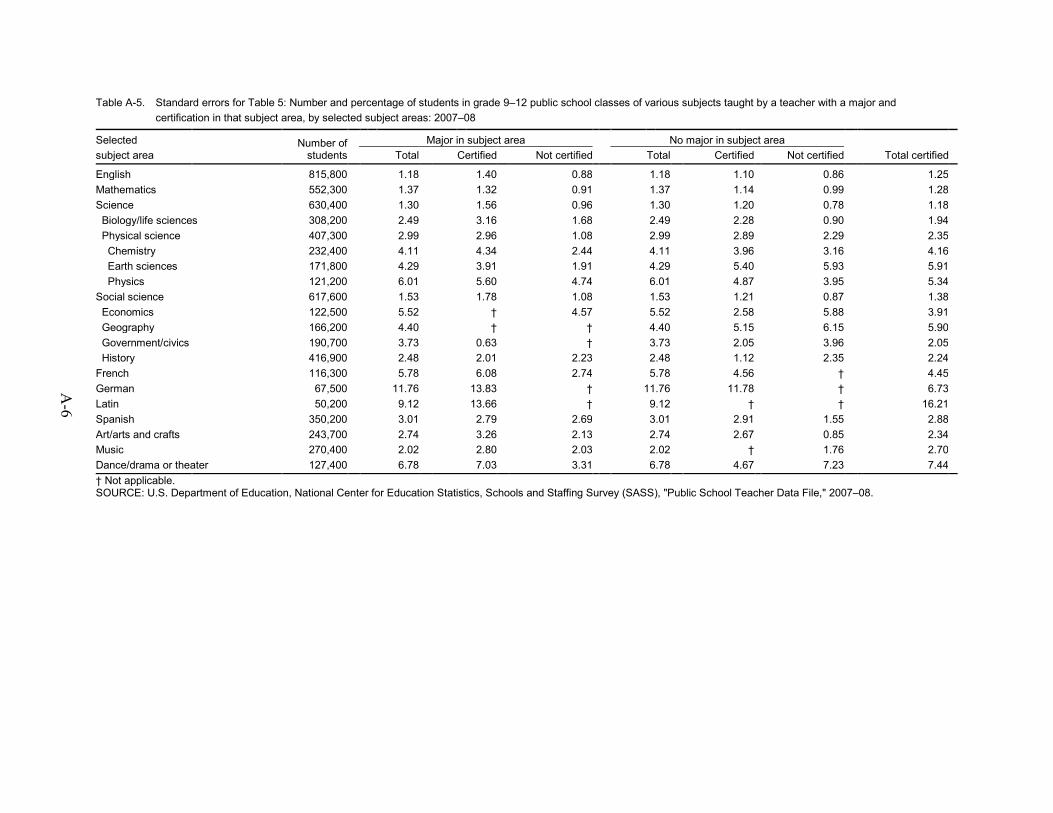
Table A-5. Standard errors for Table 5: Number and percentage of students in grade 9–12 public school classes of various subjects taught by a teacher with a major and certification in that subject area, by selected subject areas: 2007–08
Selected
Number of students
Major in subject area No major in subject area subject area Total
Certified Not certified Total Certified Not certified Total certified
English 815,800 1.18 1.40 0.88 1.18 1.10 0.86 1.25 Mathematics 552,300 1.37 1.32 0.91 1.37 1.14 0.99 1.28 Science 630,400 1.30 1.56 0.96 1.30 1.20 0.78 1.18 Biology/life sciences 308,200 2.49 3.16 1.68 2.49 2.28 0.90 1.94 Physical science 407,300 2.99 2.96 1.08 2.99 2.89 2.29 2.35 Chemistry 232,400 4.11 4.34 2.44 4.11 3.96 3.16 4.16 Earth sciences 171,800 4.29 3.91 1.91 4.29 5.40 5.93 5.91 Physics 121,200 6.01 5.60 4.74 6.01 4.87 3.95 5.34 Social science 617,600 1.53 1.78 1.08 1.53 1.21 0.87 1.38 Economics 122,500 5.52 † 4.57 5.52 2.58 5.88 3.91 Geography 166,200 4.40 † † 4.40 5.15 6.15 5.90 Government/civics 190,700 3.73 0.63 † 3.73 2.05 3.96 2.05 History 416,900 2.48 2.01 2.23 2.48 1.12 2.35 2.24 French 116,300 5.78 6.08 2.74 5.78 4.56 † 4.45 German 67,500 11.76 13.83 † 11.76 11.78 † 6.73 Latin 50,200 9.12 13.66 † 9.12 † † 16.21 Spanish 350,200 3.01 2.79 2.69 3.01 2.91 1.55 2.88 Art/arts and crafts 243,700 2.74 3.26 2.13 2.74 2.67 0.85 2.34 Music 270,400 2.02 2.80 2.03 2.02 † 1.76 2.70 Dance/drama or theater 127,400 6.78 7.03 3.31 6.78 4.67 7.23 7.44 † Not applicable. SOURCE: U.S. Department of Education, National Center for Education Statistics, Schools and Staffing Survey (SASS), "Public School Teacher Data File," 2007–08.
A-6
B-1
Appendix B: Methodology and Technical Notes
B-2
Methodology and Technical Notes The data used in this report come from the 2007–08 Schools and Staffing Survey (SASS) Restricted-Use Public School Teacher Data File. The following section contains an overview of the SASS and an explanation of the multiple levels of analysis, differing subpopulations, and the measures (subjects taught and teacher qualifications) utilized in this report.
Overview of the Schools and Staffing Survey
The Schools and Staffing Survey (SASS) is sponsored by the National Center for Education Statistics (NCES) of the Institute of Education Sciences within the U.S. Department of Education and is conducted by the U.S. Census Bureau. SASS is a nationally representative sample survey of public,1
For general information on SASS, please visit the SASS home page at
private, and Bureau of Indian Education-funded (BIE) K–12 schools, principals, and teachers in the 50 states and the District of Columbia. School districts associated with public schools and library media centers in public and BIE schools are also part of SASS. Conducted six times, SASS data covers school years 1987–88, 1990–91, 1993–94, 1999–2000, 2003–04, and 2007–08.
http://nces.ed.gov/surveys/sass. For specific information on SASS planning and administration, see the Documentation for the 2007–08 Schools and Staffing Survey (Tourkin et al. 2010).
Teacher Questionnaire (Form SASS-4A)
The data for this report come from the 2007–08 Teacher Questionnaire, which was designed to obtain information on topics such as education and training, teaching assignment, certification, workload, and perceptions and attitudes about teaching. Other SASS questionnaires and those from all SASS administrations are available online at http://nces.ed.gov/surveys/sass/questionnaire.asp.
SASS Teacher-Level Estimates and Target Population
SASS is designed to produce national, regional, and state estimates for public elementary and secondary schools and their related components (i.e., teachers, principals, school districts, and school library media centers). Data from the SASS Teacher Questionnaire are designed to support comparisons for public school teachers between new and experienced teachers (3 years or less of experience vs. more than 3 years of experience) at the state level. Comparisons by race/ethnicity and full- or part-time status are supported at the national level.
2007–08 SASS Public School and Public School Teacher Sample Selection
Public schools. The starting point for the 2007–08 SASS public school sampling frame was the preliminary 2005–06 Common Core of Data (CCD) Nonfiscal School Universe data file. The CCD includes regular and nonregular schools (special education, alternative, vocational, or technical), public charter schools, and BIE schools. The sampling frame was adjusted from the CCD in order to fit the definition of a school eligible for SASS. To be eligible for SASS, a
1 Public schools include traditional public and charter schools.
B-3
school was defined as an institution or part of an institution that provides classroom instruction to students; has one or more teachers to provide instruction; serves students in one or more of grades 1–12 or the ungraded equivalent; and is located in one or more buildings apart from a private home. It was possible for two or more schools to share the same building; in this case, they were treated as different schools if they had different administrators (i.e., principal or school head).
The SASS definition of a school is generally similar to the CCD definition, with some exceptions. SASS is confined to the 50 states plus the District of Columbia and excludes the other jurisdictions and Department of Defense overseas schools. The CCD includes some schools that do not offer teacher-provided classroom instruction in grades 1–12 or the ungraded equivalent. In some instances, schools in the CCD are essentially administrative units that may oversee entities that provide classroom instruction or they may only provide funding and oversight. The CCD schools with the same location, address, and phone number were collapsed during the SASS frame building on the assumption that the respondent would consider them to be one school. Because SASS allows schools to define themselves, Census Bureau staff observed that schools generally report as one entity in situations where the administration of two or more schools in the CCD is the same. A set of rules was applied in certain states to determine in which instances school records should be collapsed together. When school records were collapsed together, the student and teacher counts, grade ranges, and names as reported to the CCD were all modified to reflect the change.
Finally, additional school records were added to the sampling frame. Most of these records were for Career Technical Centers or alternative, special education, or juvenile justice facilities in California, Pennsylvania, New York, and other states. For a detailed list of frame modifications, see the Documentation for the 2007–08 Schools and Staffing Survey (Tourkin et al. 2010). After adding, deleting, and collapsing school records, the SASS public school sampling frame consisted of 90,410 traditional public schools and 3,850 public charter schools.
The SASS sample is a stratified probability-proportionate-to-size (PPS) sample, and all public schools underwent multiple levels of stratification. The sample was allocated so that national-, regional-, and state-level elementary, secondary, and combined public school estimates could be made. The sample was allocated to each state by grade range (elementary, secondary, and combined) and school type (traditional public, public charter, BIE-funded, and schools with high American Indian enrollment). For a full description of the allocation procedure, see the Documentation for the 2007–08 Schools and Staffing Survey (Tourkin et al. 2010). Within each stratum, all public schools were systematically selected using a PPS algorithm. The measure of size used for the schools was the square root of the number of full-time-equivalent teachers reported or imputed for each school during the sampling frame creation. Any school with a measure of size greater than the sampling interval (the inverse of the rate at which the sample is selected) was included in the sample with certainty and thus automatically excluded from the probability sampling operation. These sampling procedures resulted in a total public school sample of about 9,800 public schools, including both traditional public and public charter schools, in the 2007–08 SASS.
Public Teachers. Teachers in SASS are defined as staff who teach regularly scheduled classes to students in any of grades K–12. Teacher rosters (i.e., Teacher Listing Forms) were collected
B-4
from sampled schools, primarily by mail, and compiled at the Census Bureau. This compilation was done on an ongoing basis throughout the roster collection period. Along with the names of teachers, respondents at the sampled schools were asked to provide information about each teacher’s teaching experience (1–3 years, 4–19 years, and 20 or more years), teaching status (full or part time), and subject matter taught (special education, general elementary, math, science, English/language arts, social studies, vocational/technical, or other), as well as whether they felt the teacher would likely be teaching at the same school in the following year.
Sampling was also done on an ongoing basis throughout the roster collection period. The Census Bureau first stratified teachers into five teacher types: (1) new teachers expected to be teaching at the same school in the next school year, (2) experienced teachers expected to be teaching at the same school in the next school year, (3) new teachers expected to leave before or during the next school year, (4) mid-career teachers expected to leave before or during the next school year, and (5) highly experienced teachers expected to leave before or during the next school year. Before teachers were allocated to these strata, schools were allocated an overall number of teachers to be selected within each school stratum.
Sampling rates for teachers varied between the strata listed above. So that a school would not be overburdened by sampling too large a proportion of its teachers, the maximum number of teachers per school was set at 20. About 14 percent of the eligible public schools did not provide teacher lists. For these schools, no teachers were selected. Within each teacher stratum in each school, teachers were selected systematically with equal probability. About 47,440 teachers were sampled from public schools.
Data Collection Procedures
Before the administration of the 2007–08 SASS, several changes were made in the survey sample design, questionnaire content, procedures, and methodology. For details on these changes, see the Documentation for the 2007–08 Schools and Staffing Survey (Tourkin et al. 2010).
In 2007–08, SASS employed a mail-based survey approach, with subsequent telephone and field follow-up. In preparation for data collection, advance letters were mailed to the sampled schools in September 2007 to verify their addresses. School packages were mailed at the beginning of the school year.2
2 The SASS school package contained a cover letter to the principal, a cover letter to the survey coordinator, the Teacher Listing Form, the Public School Principal Questionnaire/Private School Principal Questionnaire, the Public School Questionnaire/Public School Questionnaire (With District Items)/Private School Questionnaire, the School Library Media Center Questionnaire (for public and BIE-funded schools only), postage-paid return envelopes, an NCES pamphlet detailing general information about SASS, an NCES brochure detailing some of the findings from the 2003–04 SASS, and the Statistical Abstract of the United States: 2007 CD (U.S Department of Commerce 2006).
Next, schools were telephoned using a computer-assisted telephone interviewing (CATI) instrument to verify school information, to establish a survey coordinator (who became the main contact person at the school for subsequent communication), and to follow up on the Teacher Listing Form. Teacher questionnaires were mailed to schools on a flow basis as teachers were sampled on an ongoing basis from the data provided on the Teacher Listing Form. The field follow-up period was preceded by phone calls from the telephone centers to remind the survey
B-5
coordinator to have staff complete and return all forms. Individual survey respondents (principal, librarian, and teachers) were also called from the telephone centers and asked to complete the questionnaire by phone. Data collection ended in June 2008.
Data Processing and Imputation
The Census Bureau used both central processing and headquarters staff to check returned questionnaires, capture data, and implement quality control procedures. Questionnaires that had a preliminary classification of a complete interview were submitted to a series of computer edits consisting of a range check, a consistency edit, and a blanking edit.3
After the final edits were run, cases with “not-answered” values for items remained. Values were imputed using a two-stage process. In the first stage, items were imputed with a valid response using data either from the sample frame, other items in the same SASS questionnaire, or another questionnaire associated with the same school or school district. In addition, data were ratio adjusted in some circumstances so that items were consistent with one another. In the second stage, donor-respondent methods, such as hot-deck imputation, were used. If no suitable donor case could be matched, the few remaining items were imputed with a mean or mode from groups of similar cases. After each stage of imputation, computer edits were run again to verify that the imputed data were consistent with the existing questionnaire data. If that was not the case, an imputed value was blanked out by one of these computer edits due to inconsistency with other data within the same questionnaire or because it was out of the range of acceptable values. In these situations, Census Bureau analysts looked at the items and tried to determine an appropriate value. Imputation flags, indicating which imputation method was used, were assigned to each imputed survey variable. For further information, see the section on data processing and imputation in the Documentation for the 2007–08 Schools and Staffing Survey (Tourkin et al. 2010).
After these edits were run and reviewed by analysts, the records were put through another edit to make a final determination as to whether the case was eligible for the survey and whether sufficient data had been collected for the case to be classified as a complete interview.
Response Rates
Unit response rates. The unit response rate indicates the percentage of sampled cases that met the definition of a complete interview. The weighted SASS unit response rate was produced by dividing the base-weighted number of respondents who completed questionnaires by the base-weighted number of eligible sampled cases.4
Table B-1 summarizes the base-weighted unit response rates for public school teachers.
3 Blanking edits delete answers to questions that should not have been filled in (e.g., if a respondent followed a wrong skip pattern). 4 For the formula used to calculate the unit response rate, see NCES Statistical Standards (U.S. Department of Education 2003).
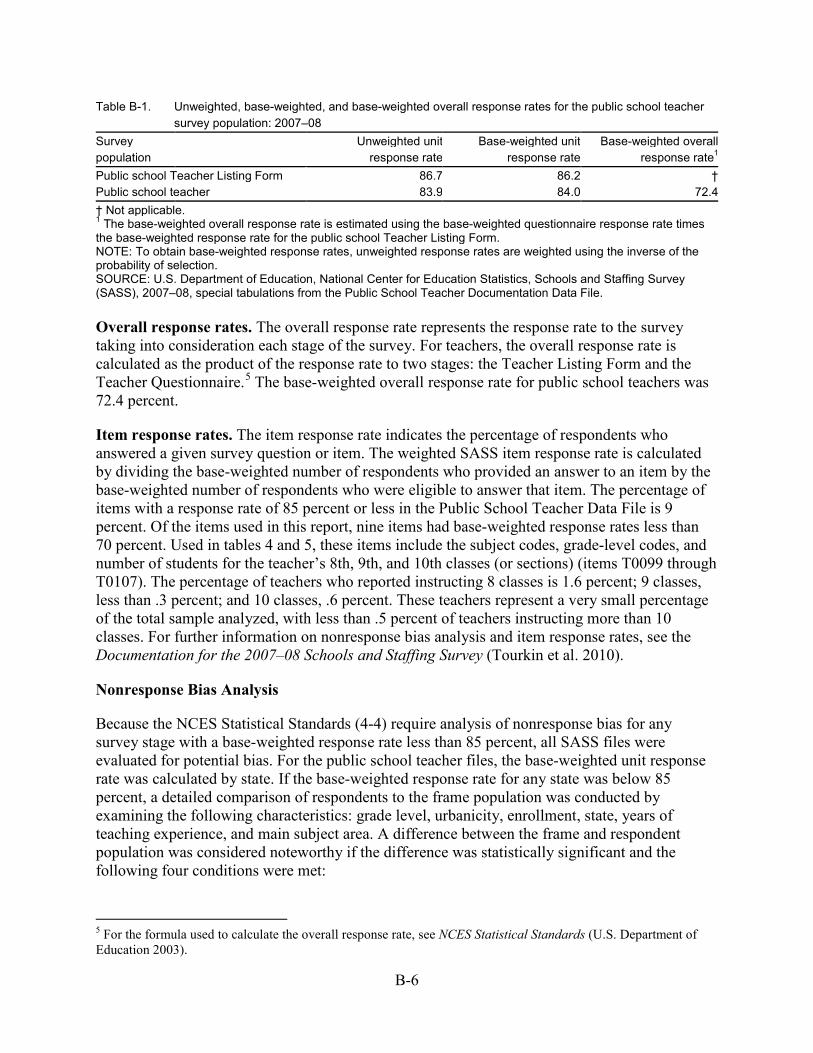
B-6
Table B-1. Unweighted, base-weighted, and base-weighted overall response rates for the public school teacher
survey population: 2007–08
Survey Unweighted unit Base-weighted unit Base-weighted overall population response rate response rate response rate1 Public school Teacher Listing Form 86.7 86.2 † Public school teacher 83.9 84.0 72.4 † Not applicable. 1 The base-weighted overall response rate is estimated using the base-weighted questionnaire response rate times the base-weighted response rate for the public school Teacher Listing Form. NOTE: To obtain base-weighted response rates, unweighted response rates are weighted using the inverse of the probability of selection. SOURCE: U.S. Department of Education, National Center for Education Statistics, Schools and Staffing Survey (SASS), 2007–08, special tabulations from the Public School Teacher Documentation Data File. Overall response rates. The overall response rate represents the response rate to the survey taking into consideration each stage of the survey. For teachers, the overall response rate is calculated as the product of the response rate to two stages: the Teacher Listing Form and the Teacher Questionnaire.5
Item response rates. The item response rate indicates the percentage of respondents who answered a given survey question or item. The weighted SASS item response rate is calculated by dividing the base-weighted number of respondents who provided an answer to an item by the base-weighted number of respondents who were eligible to answer that item. The percentage of items with a response rate of 85 percent or less in the Public School Teacher Data File is 9 percent. Of the items used in this report, nine items had base-weighted response rates less than 70 percent. Used in tables 4 and 5, these items include the subject codes, grade-level codes, and number of students for the teacher’s 8th, 9th, and 10th classes (or sections) (items T0099 through T0107). The percentage of teachers who reported instructing 8 classes is 1.6 percent; 9 classes, less than .3 percent; and 10 classes, .6 percent. These teachers represent a very small percentage of the total sample analyzed, with less than .5 percent of teachers instructing more than 10 classes. For further information on nonresponse bias analysis and item response rates, see the Documentation for the 2007–08 Schools and Staffing Survey (Tourkin et al. 2010).
The base-weighted overall response rate for public school teachers was 72.4 percent.
Nonresponse Bias Analysis
Because the NCES Statistical Standards (4-4) require analysis of nonresponse bias for any survey stage with a base-weighted response rate less than 85 percent, all SASS files were evaluated for potential bias. For the public school teacher files, the base-weighted unit response rate was calculated by state. If the base-weighted response rate for any state was below 85 percent, a detailed comparison of respondents to the frame population was conducted by examining the following characteristics: grade level, urbanicity, enrollment, state, years of teaching experience, and main subject area. A difference between the frame and respondent population was considered noteworthy if the difference was statistically significant and the following four conditions were met:
5 For the formula used to calculate the overall response rate, see NCES Statistical Standards (U.S. Department of Education 2003).
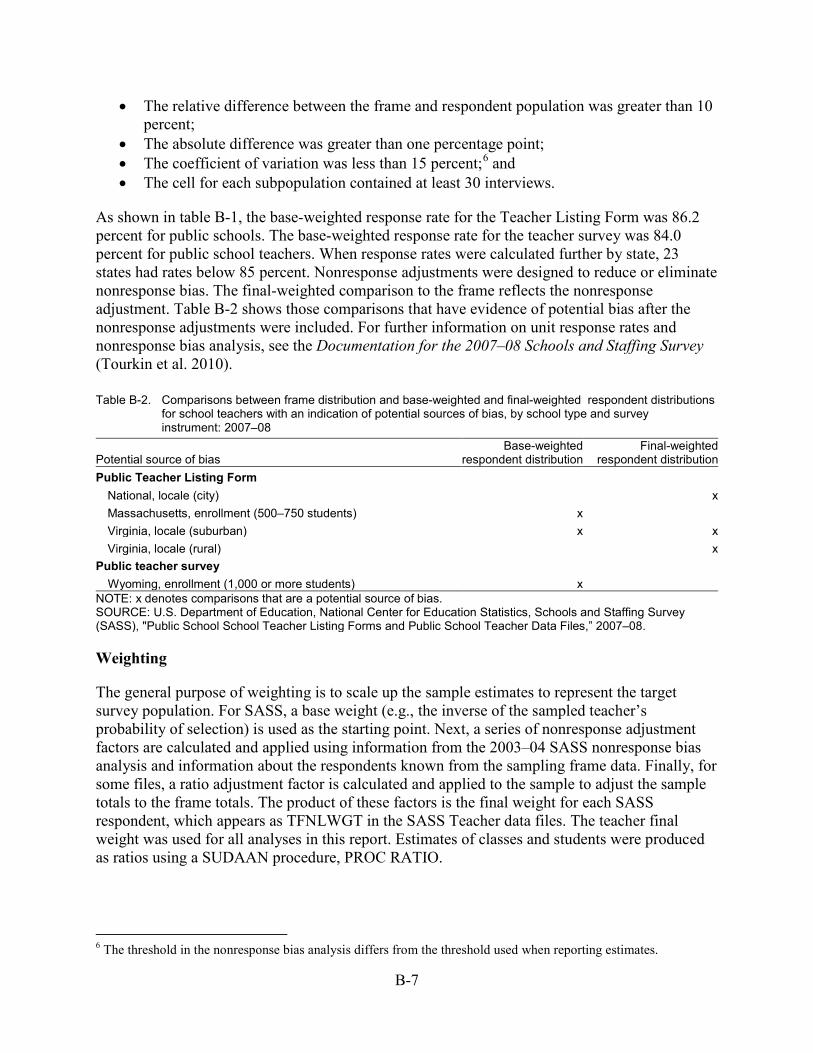
B-7
•
• • •
The relative difference between the frame and respondent population was greater than 10 percent; The absolute difference was greater than one percentage point; The coefficient of variation was less than 15 percent;6
The cell for each subpopulation contained at least 30 interviews. and
As shown in table B-1, the base-weighted response rate for the Teacher Listing Form was 86.2 percent for public schools. The base-weighted response rate for the teacher survey was 84.0 percent for public school teachers. When response rates were calculated further by state, 23 states had rates below 85 percent. Nonresponse adjustments were designed to reduce or eliminate nonresponse bias. The final-weighted comparison to the frame reflects the nonresponse adjustment. Table B-2 shows those comparisons that have evidence of potential bias after the nonresponse adjustments were included. For further information on unit response rates and nonresponse bias analysis, see the Documentation for the 2007–08 Schools and Staffing Survey (Tourkin et al. 2010).
Table B-2. Comparisons between frame distribution and base-weighted and final-weighted. respondent distributions for school teachers with an indication of potential sources of bias, by school type and survey instrument: 2007–08 Potential source of bias
Base-weighted respondent distribution
Final-weighted respondent distribution
Public Teacher Listing Form National, locale (city)
x
Massachusetts, enrollment (500–750 students) x Virginia, locale (suburban) x x
Virginia, locale (rural)
x Public teacher survey
Wyoming, enrollment (1,000 or more students) x NOTE: x denotes comparisons that are a potential source of bias.
SOURCE: U.S. Department of Education, National Center for Education Statistics, Schools and Staffing Survey (SASS), "Public School School Teacher Listing Forms and Public School Teacher Data Files,” 2007–08.
Weighting
The general purpose of weighting is to scale up the sample estimates to represent the target survey population. For SASS, a base weight (e.g., the inverse of the sampled teacher’s probability of selection) is used as the starting point. Next, a series of nonresponse adjustment factors are calculated and applied using information from the 2003–04 SASS nonresponse bias analysis and information about the respondents known from the sampling frame data. Finally, for some files, a ratio adjustment factor is calculated and applied to the sample to adjust the sample totals to the frame totals. The product of these factors is the final weight for each SASS respondent, which appears as TFNLWGT in the SASS Teacher data files. The teacher final weight was used for all analyses in this report. Estimates of classes and students were produced as ratios using a SUDAAN procedure, PROC RATIO.
6 The threshold in the nonresponse bias analysis differs from the threshold used when reporting estimates.
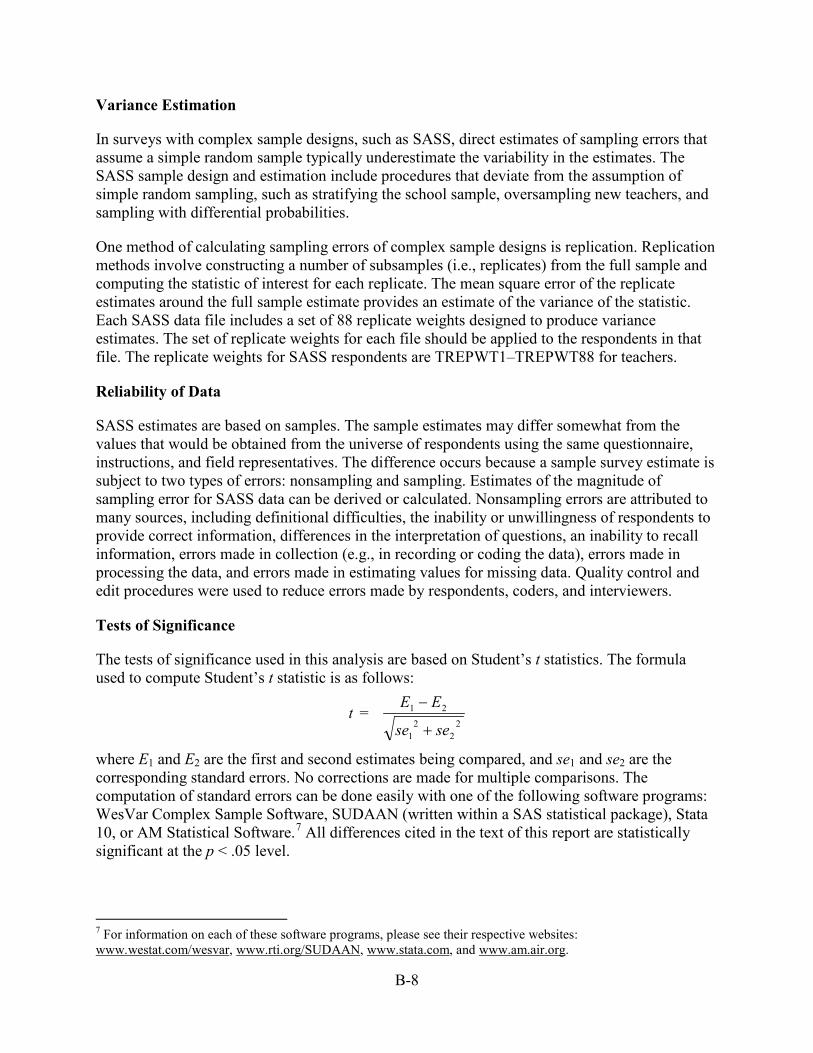
B-8
Variance Estimation
In surveys with complex sample designs, such as SASS, direct estimates of sampling errors that assume a simple random sample typically underestimate the variability in the estimates. The SASS sample design and estimation include procedures that deviate from the assumption of simple random sampling, such as stratifying the school sample, oversampling new teachers, and sampling with differential probabilities.
One method of calculating sampling errors of complex sample designs is replication. Replication methods involve constructing a number of subsamples (i.e., replicates) from the full sample and computing the statistic of interest for each replicate. The mean square error of the replicate estimates around the full sample estimate provides an estimate of the variance of the statistic. Each SASS data file includes a set of 88 replicate weights designed to produce variance estimates. The set of replicate weights for each file should be applied to the respondents in that file. The replicate weights for SASS respondents are TREPWT1–TREPWT88 for teachers.
Reliability of Data
SASS estimates are based on samples. The sample estimates may differ somewhat from the values that would be obtained from the universe of respondents using the same questionnaire, instructions, and field representatives. The difference occurs because a sample survey estimate is subject to two types of errors: nonsampling and sampling. Estimates of the magnitude of sampling error for SASS data can be derived or calculated. Nonsampling errors are attributed to many sources, including definitional difficulties, the inability or unwillingness of respondents to provide correct information, differences in the interpretation of questions, an inability to recall information, errors made in collection (e.g., in recording or coding the data), errors made in processing the data, and errors made in estimating values for missing data. Quality control and edit procedures were used to reduce errors made by respondents, coders, and interviewers.
Tests of Significance
The tests of significance used in this analysis are based on Student’s t statistics. The formula used to compute Student’s t statistic is as follows:
t = 2
22
1
21
sese
EE
+
−
where E1 and E2 are the first and second estimates being compared, and se1 and se2 are the corresponding standard errors. No corrections are made for multiple comparisons. The computation of standard errors can be done easily with one of the following software programs: WesVar Complex Sample Software, SUDAAN (written within a SAS statistical package), Stata 10, or AM Statistical Software.7
All differences cited in the text of this report are statistically significant at the p < .05 level.
7 For information on each of these software programs, please see their respective websites: www.westat.com/wesvar, www.rti.org/SUDAAN, www.stata.com, and www.am.air.org.
B-9
Levels of Analysis: Teacher, Class, and Student Levels
This report presents findings from multiple levels of analyses (teacher, student, and class) in order to provide a more comprehensive picture of teacher qualifications. The teacher-level analyses provide a clear description of the status of teachers’ qualifications by subject area and relate directly to current federal education legislation. The class- and student-level analyses are critical to exploring variations in the number of classes and students instructed by teachers with different qualifications. Separate class- and student-level analyses are important because not all teachers instruct the same number of classes and not all classes have the same number of students. Taking these variations into account, the three levels of analyses offer a more precise picture of the numbers and percentages of classes and students being taught by teachers with various types of qualifications.
The following scenario provides an example of the relationship between the three levels: a teacher teaches four mathematics classes and one English class, has a major and certification in mathematics, and reports mathematics as his/her main assignment. At the teacher level, this teacher would be considered “in-field” in his/her main assignment. At the class level, the teacher would be “in-field” in his/her mathematics classes, but not in his/her English class. This would result in a class-level measure of 80 percent of his/her classes taught by an “in-field” teacher. If all five of these classes had identical numbers of students, the student-level measure would be the same (e.g., if the enrollment of the four mathematics classes totaled 80 students and the English class had 20 students, the student-level measure would also be 80 percent). However, if a total of 60 students were enrolled in the four mathematics classes and the one English class had 40 students, the student-level measure would indicate 60 percent of this teacher’s students were taught by an “in-field” teacher.
Teacher Level
Teacher-level analyses in this report consider all degrees (bachelor’s and above) and certifications (probationary and above) held by teachers and compare these qualifications with the subject of their main assignments. Some teachers may or may not have in-field qualifications for additional classes they teach in subjects other than their main assignments. Tables 1–3 present the percentages of teachers who instruct classes in their main assignments as well as the percentages of teachers who hold degrees and certifications in their main assignments.
Class and Student Levels
Class- and student-level analyses explore all classes taken by 9th- through 12th-graders in the 11 broad fields and nine subfields discussed in this report. The degrees and certifications of all teachers who teach these classes are considered and compared for correspondence with each of the subject areas. At the class and student levels, teachers who instruct classes in more than one subject appear multiple times for each subject they teach.
Subpopulations: Teacher, Class, and Student Levels
This report examines the teacher, class, and student levels in schools to offer descriptive information about teachers. Although all tables present high school-level groups, important
B-10
distinctions exist between the teacher subpopulation in the teacher-level tables and the teacher subpopulation in the class- and student-level tables. At the teacher level, the teacher subpopulation of analysis includes departmentalized teachers who strictly fall into the high school-level teacher definition. That is, a teacher is considered a high school-level teacher if he or she instructs classes in any of grades 10–12, or grade 9 but no lower grade. At the class and student levels, the teacher subpopulation includes all departmentalized teachers who taught classes or students in grades 9–12. That is, teachers who taught a 9th-grade class and also a 6th-grade class would be included in the class- and student-level analyses but not in the teacher-level analyses. The teacher-level tables use a teacher’s main assignment area as the unit of analysis, considering only one observation per teacher. Class- and student-level tables count teachers based on the different classes and assignment areas taught.
Readers should remember these differences when examining and comparing teacher-, class-, and student-level results. Although the purpose of these analyses is to provide a more complete picture of teacher qualifications, readers should take caution in making direct comparisons between tables.
Teacher-Level Subpopulation
Since the Elementary and Secondary Education Act of 1965, as amended in 2001 (ESEA) pertains to public education, the teacher-level analyses in this report include only public school teachers. Public school teachers include both traditional public school and public charter school teachers. Bureau of Indian Education (BIE)-funded school teachers are not included because the small sample size would not support stable estimates.
In addition to restricting analyses in this report to public school teachers, the analyses further narrow to include only those that teach in high school-level departmentalized classrooms. High school-level teachers are defined using items from question 12 in the SASS Teacher Questionnaire: “In which grades are ALL of the STUDENTS you currently teach at THIS school?” As mentioned above, teachers are included if they instructed students in any of grades 10−12, or grade 9 but no grade lower. Further, only departmentalized teachers are included in the analyses, because they represent a majority of teachers at the high school level and allow for analyses that tie specific teachers to specific classes and students.8 Teachers of departmentalized classrooms instruct several classes of different students all or most of the day in one or more subjects. At the high school level, there were 1,100,000 public school teachers in 2007–08. Of these teachers, 89 percent (940,000) taught in departmentalized classrooms, of which 72 percent (677,000) taught one of the 11 broad fields or nine subfields examined in this report. Therefore, the subpopulation of teachers in this report represents 64 percent of all public high school-level teachers.9
The findings presented in tables 1, 2, and 3 provide context on the frequency with which teachers instruct classes in their reported main assignments and their qualifications in relation to the main assignments.
8 Elementary subject specialists, teachers of self-contained classrooms, team teachers, and pull-out teachers were not included in the report because very few teach at the high school level or because of the difficultly of obtaining a substantive match between their classes and qualifications. 9 The stated percentages are based on calculations of unrounded counts of teachers.
B-11
Class- and Student-Level Subpopulations
Class- and student-level analyses use information from question 22 of the SASS Teacher Questionnaire, which asked departmentalized teachers to report the subject name, subject-matter code, grade level, and number of students for each class period or section instructed. Teachers were able to report a maximum of 10 classes.10
The class-level analysis (table 4) present the percentage of grade 9−12 classes taught by traditional public and public charter school teachers of departmentalized classes who held various combinations of majors and certifications. The class-level analysis accounts for the variation in the number of classes taught by teachers. The student-level measure (table 5) examines the percentage of students in grade 9−12 classes taught by public school teachers of departmentalized classes who held various combinations of majors and certifications. The student-level findings compensate for variations in the number of classes as well as the number of students in each class instructed by each teacher.
Both the class- and student-level measures consider all classes taught by a teacher, not just classes within a teacher’s reported main assignment.
Teacher-, Class-, and Student-Level Comparisons
Comparing teacher-level results with those from class- and student-level analyses can provide information regarding the percentage of classes or students instructed by teachers with qualifications outside their main assignments, but important distinctions should be considered. Using a hypothetical example, the percentage of teachers who hold in-field qualifications in a particular main assignment may be higher than the percentage of classes taught by teachers who hold in-field qualifications. This result may indicate that some teachers teach subjects outside of their main assignments without in-field qualifications for those subjects, or that teachers with in-field qualifications on average instruct fewer classes than teachers without in-field qualifications.
Student-level results (table 5) further explain differences both in the number of classes taught by a teacher and the number of students enrolled in those classes. Using a hypothetical example, the percentage of classes instructed by teachers who hold in-field qualifications could be larger than the percentage of students instructed by teachers who hold in-field qualifications. This would suggest that classes taught by teachers with in-field qualifications are smaller than classes taught by teachers without in-field qualifications. It is important to note that SASS was designed as a representative sample of teachers. Class- and student-level estimates are based on classes and students taught by teachers in SASS and may not be nationally representative of classes and students.
10 Less than 0.43 percent of the teachers in this report taught more than 10 classes. However, teachers were only given space on the questionnaire to report the subject area of up to 10 classes. Since the subject area was used to match teacher qualifications, it is not possible to say whether these teachers have in-field qualifications for classes beyond the 10 that were reported. Given the small fraction of teachers who reported more than 10 classes, examining only the first 10 classes reported should not introduce significant bias into the findings.
B-12
Measures: Subjects Taught and Teacher Qualifications
Subjects Taught: Main Assignment and Class Subject Area
For purposes of the analyses presented here, teacher qualifications are considered as they relate to one of two measures of the subjects teachers instruct: main assignment and course subject area taught. Each teacher has one main assignment, the field in which he or she reported teaching the most classes. Used for all teacher-level analyses (tables 1–3), the information comes directly from question 15 of the SASS Teacher Questionnaire, which asks, “This school year, what is your MAIN teaching assignment field at THIS school? (Your main assignment is the field in which you teach the most classes).”
The class subject area measure includes all subjects (or fields) taught by a teacher. This measure is used for all class- and student-level analyses (tables 4 and 5, respectively). Some teachers may instruct all their classes within their main assignments, and other teachers may instruct one or more classes outside the main assignments. During SASS data collection, detailed information was requested from teachers on up to 10 of the classes they taught in question 22 of the Teacher Questionnaire.
This report examines a selection of 20 main assignment fields and class subject areas, including some subfields of general (i.e., broad) subjects. The broad subject areas are the following: English, mathematics, science, social science, French, German, Latin, Spanish, art/arts and crafts, music, and dance/drama or theater. The reported broad areas and subfields are generally the certification fields and the core subjects of ESEA. No subfields of English and mathematics, and not all subfields of science and social science are reported due to a lack of comparability of possible subfield for certification purposes. Separate foreign languages are broad areas rather than subfields is because of the way that state certification standards are set up – each foreign language is considered to be its own content area, and one cannot be substituted for another. That is, a Spanish major cannot be certified as a French teacher, or vice versa. Therefore, each separate coded foreign language has to be treated as a broad subject field rather than as a subfield, where the broad field of certification can cover a number of subfields that may or may not have separate certification areas recognized by a particular state. There is no general certification content area of “Foreign languages.” Within these broad subject areas, analyses of subfields are presented in the tables. The broad subject area of science includes the subfield areas of biology/life sciences and physical science, which includes further subfields of chemistry, earth sciences, and physics. The broad subject area of social science includes the subfields of economics, geography, government/civics, and history. These 11 broad subject areas and nine subfield areas represent academic subjects for which clear matches exist between teacher assignment and teacher qualifications. Further, the sample sizes for these subject areas and subfields include sufficient numbers of teachers to support stable estimates. Teachers of elementary education; special education; English as a Second Language; health education; vocational, career, and technical education; driver’s education; library or information science; military science or ROTC; philosophy; religious studies; theology or divinity; other foreign languages; and “other” were not examined in this report due to analytical constraints. For example, all of the fields aside from Vocational & CTE lack a sufficient number of responses for analysis at the high school level. Teachers of Vocational & CTE subjects often lack any
B-13
postsecondary degree and may be state-certified by virtue of a postsecondary vocational certificate or vocational work experience.
Prior to matching teacher assignment with qualifications, a typology of subject-matter specialties was determined to classify teachers into various assignment fields. The typology includes main disciplinary fields and certain subfields consistent with previous studies that investigated broad subjects of various disciplinary fields and subfields of science and social science (Ingersoll 1996; Murnane and Schwinden 1989). Subfields are typically separated from the larger disciplinary field for certification purposes and for investigation of teacher demand and quality in the subfields. Although not all states certify science and social science subfields distinctly from the broad fields, to be consistent with previous research and state certification requirements (where implemented), the analyses in this report includes the following subfields of science: biology/life sciences and physical science; within the subfield of physical science: chemistry, earth sciences, and physics (Ingersoll 1996; U.S. Department of Education, Office of the Deputy Secretary 2004; Murnane and Schwinden 1989). The following subfields of social science are included: economics, geography, government/civics, and history.
The analyses in this report include ESEA core subjects (English, mathematics, science, social science, economics, geography, government/civics, history, foreign language, and arts). When interpreting these results it is important to note that the law allows states to decide on the specific fields under arts and foreign language. This report uses the subjects of French, German, Latin, and Spanish, commonly defined by states as specific fields of “foreign language” and art/arts and crafts, music, and dance/drama or theatre as specific fields of “arts.” Generally, English and mathematics are not reported at the subfield levels, not only because there are few comparable certification matches but also because the ESEA list of core subjects does not include subfields for English or mathematics. In fact, the Praxis II test typically includes only one general mathematics test and one English/language arts test that teachers have to pass in order to obtain state certification.
Teacher Qualifications: Major and Certification
This report addresses two primary measures of teacher qualifications—teacher education and teaching certification—as they relate to the main assignment and course subject area(s) taught. The definition of “in-field” qualifications included in this report is aligned with the ESEA definition of Highly Qualified Teachers, but is different from that used in prior publications (Seastrom et al. 2004; Morton et al. 2008). Due to differences in the analyses and changes in survey questions, readers are strongly cautioned against making comparisons of estimates in this report and previously published reports that used data from 1999–2000 or earlier SASS administrations.11
See appendix D and exhibit D-1 for information on how the matches between subjects taught and teacher qualifications were determined.
11 Several changes were implemented in the 2003−04 SASS Teacher Questionnaire and carried over into the 2007–08 SASS. For example, questions used for matching between certifications and main assignments and teacher grade levels taught were changed after the 1999–2000 administration. All changes are fully documented in appendix C.
B-14
Teacher major field of study The analyses include teachers of all academic backgrounds. The teacher major field of study measure was produced using the educational background items in the SASS Teacher Questionnaire. Teacher education was categorized using two components of teachers’ academic majors: the level at which the postsecondary degree was earned and the major field of study.
Teachers satisfied the analytical requirement if they had an in-field degree, whether it was earned through a university’s Department or College of Education or a college’s Department or School of Education. The measure considered a teacher to have an in-field major if he/she either held at least a bachelor’s degree in a major corresponding to the subject of the main assignment (tables 1–3), or held a degree corresponding to the subject of the class areas (tables 4 and 5). The measure considered degrees to be at the bachelor’s degree level or higher if they included a first or second bachelor’s degree, a first or second master’s degree, an educational specialist or professional diploma, a Certificate of Advanced Graduate Studies, or a doctorate or first professional degree. Teachers who did not hold degrees in the subjects they taught were reported as those with majors in other subjects and those with a highest degree as a vocational certificate or associate’s degree. The analysis did not include academic minors.
Thus, according to the major field of study measure, teachers who reported a main assignment in English were classified as not holding a degree in the main assignment if they (1) received one or more degrees in any field other than English, but no degree in English; (2) held a vocational certificate or an associate’s degree in English or any other subject, but no higher degrees; or (3) held no degree.
Only a selection of science and social science subfields are presented in this report’s tables.12 However, the estimates for the broad fields of science and social science consider all their subfields. For example, the social sciences subfields of social studies (general), anthropology, Native American studies, psychology, and sociology are subfields not reported in detail, but are included in the broad field category of “social science.” Since all subfields are not reported, the subfield levels do not sum to the totals reported at the broad field level. For example, a teacher with a main assignment of sociology would be included in the broad field of social science, and would be considered in-field if the teacher held any of the social science majors.13 However, sociology is not examined in detail and, therefore, it is not reported in any of the social science subfields.
Teacher certification Teacher certification status was determined based on three criteria—certification type, content area(s), and grade level(s). The SASS Teacher Questionnaire allows the respondent to report a first and second certification, if applicable. Analyses considered both first and second teacher
12 Some subfields of science and social science are excluded from the analyses because a substantive match between subject matter, major field of study, and certification area was not possible. That is, comparable codes were not available in each of the three areas. For example, while integrated science was a subject assignment, it was not available as a major or certification. Also, teachers of many of the subfields represented too small of a population to achieve stable estimates of teacher qualifications. 13 Social science subfield majors included anthropology, area or ethnic studies, criminal justice, cultural studies, economics, geography, government/civics, history, international studies, law, Native American studies, political science, psychology, sociology, and other social sciences.
B-15
certifications.14
Further, given this report’s focus on high school-level teachers, all certificates must apply to any of grades 9−12. At the subfield level, some states do not grant secondary-level certifications in all of the subfields examined in this report. As a result, the percentage of in-field certifications in the subfield subject might be underestimated. For this reason, it is important to take both the broad field- and subfield-level findings into account.
To satisfy the analytical requirements of the teacher certification measure a teacher must have reported a regular or standard state certification, an advanced professional certificate, or a certificate issued after satisfying all certification requirements except the completion of a probationary period. In addition, the certification must have been granted by, or recognized in, the state in which the teacher currently teaches. Teachers not considered certified were those who reported a certificate that requires some additional coursework, student teaching, or passage of a test before regular certification can be obtained; a certificate issued to persons who must still complete a certification program in order to continue teaching; or no certification in the state in which they teach.
Matching Subject Taught and Teacher Qualifications
Matching Process
Teachers may not only teach more than one subject, but also may have earned more than one postsecondary degree and/or more than one certification. The analyses in this paper consider a teacher to have an in-field major or in-field certification if the major or certification that the teacher holds matches the subjects taught. Therefore, matches need to be made across all the subjects taught and all the qualifications held. For example, a mathematics teacher is considered to hold a mathematics major if he or she reported any of the following majors: mathematics, computer science, engineering, or physics. See appendix D and exhibit D-1 for information on how the matches between subjects taught and teacher qualifications were determined.
It is particularly important to remember these matching criteria when interpreting results for the broad fields and subfields of science and social science. Teachers who appear in the science or social science rows are not mutually exclusive from teachers who appear in the subfield rows within those subjects. The analyses in the broad field allowed more lenient requirements. For example, a teacher with a main assignment of history appears in the broad social science row and the subfield history row. This teacher is considered to hold an in-field major or certification in the broad field of social science if he or she holds a major or certification in any of the following fields: anthropology, area/ethnic studies, criminal justice, cultural studies, economics, geography, government/civics, history, international studies, law, Native American studies, political science, psychology, sociology, or other social sciences. However, this same teacher must hold a major or hold a certification in history to be counted as in-field in the specific subfield of history.
14 Since SASS collects information on only two certifications, it was not known how many teachers have three or more certifications or the additional fields in which they may be certified. About 13 percent of teachers in this report held a second certification. The percentage of teachers with a third or more certifications was likely to be small; hence, potential problems with underestimating the rates of teachers with in-field certifications were likely to be minor.
B-16
The construction of the major field of study and certification measures considered teachers’ majors and certifications in several combinations. Taken collectively, the following combinations of qualifications were examined in relation to the subjects that teachers taught (both main assignment and course subject area taught). While the unit of analysis varies throughout the report, the numerators are based on the number of teachers meeting the specified criteria (in-field major and/or in-field certification) and the denominators are based on all teachers of that subject. In some cases the unit of analysis is the number of teachers; in others, it is the number of classes or students taught by teachers who meet the specified criteria.

C-1
Appendix C: Caution Concerning Changes in Estimates Over Time
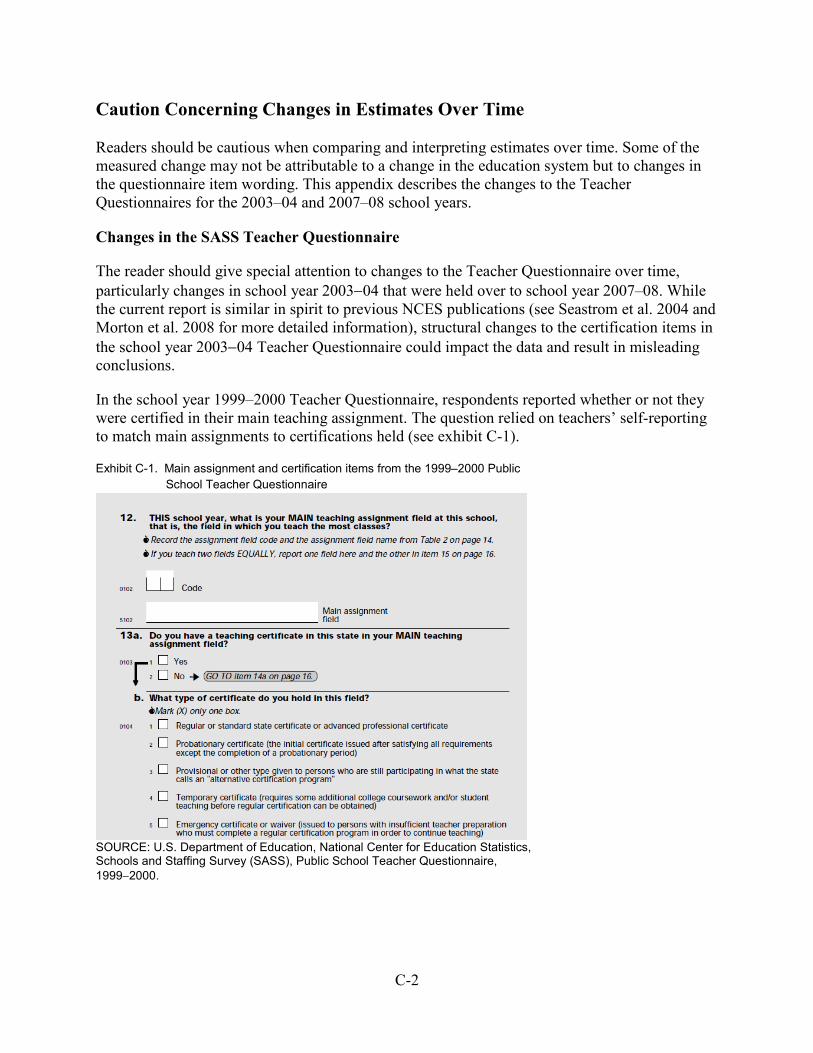
C-2
Caution Concerning Changes in Estimates Over Time
Readers should be cautious when comparing and interpreting estimates over time. Some of the measured change may not be attributable to a change in the education system but to changes in the questionnaire item wording. This appendix describes the changes to the Teacher Questionnaires for the 2003–04 and 2007–08 school years.
Changes in the SASS Teacher Questionnaire
The reader should give special attention to changes to the Teacher Questionnaire over time, particularly changes in school year 2003−04 that were held over to school year 2007–08. While the current report is similar in spirit to previous NCES publications (see Seastrom et al. 2004 and Morton et al. 2008 for more detailed information), structural changes to the certification items in the school year 2003−04 Teacher Questionnaire could impact the data and result in misleading conclusions.
In the school year 1999–2000 Teacher Questionnaire, respondents reported whether or not they were certified in their main teaching assignment. The question relied on teachers’ self-reporting to match main assignments to certifications held (see exhibit C-1).
Exhibit C-1. Main assignment and certification items from the 1999–2000 Public School Teacher Questionnaire
SOURCE: U.S. Department of Education, National Center for Education Statistics, Schools and Staffing Survey (SASS), Public School Teacher Questionnaire, 1999−2000.
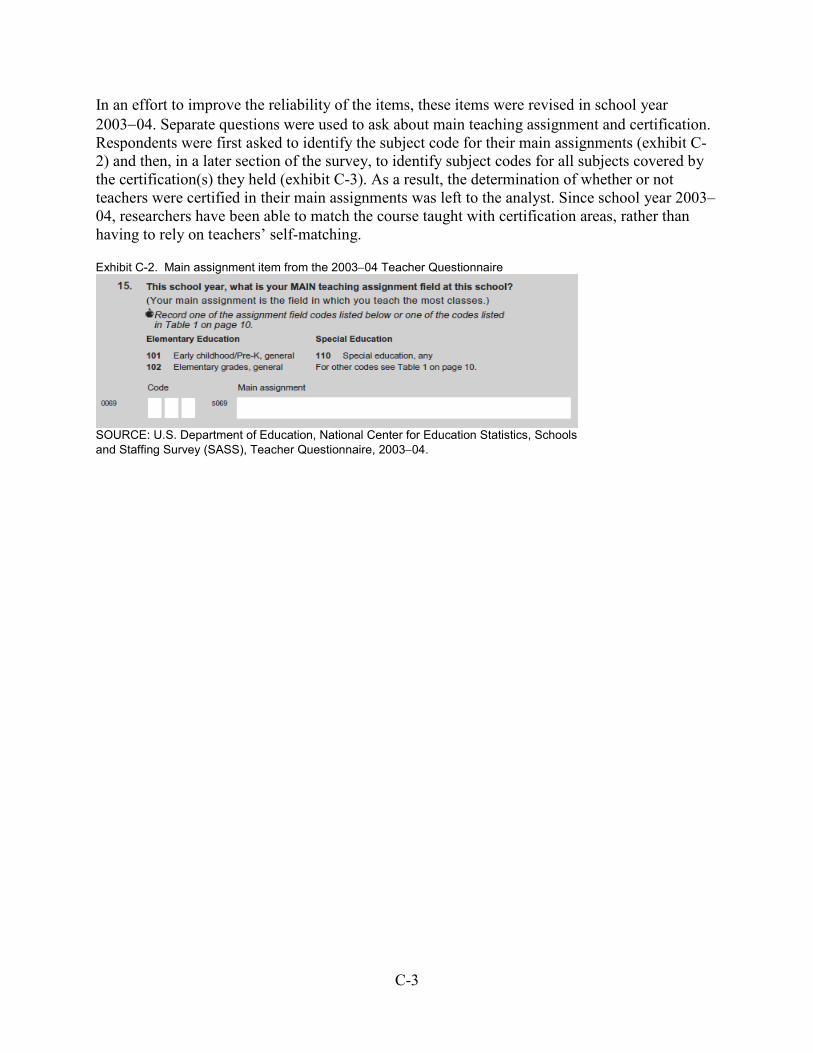
C-3
In an effort to improve the reliability of the items, these items were revised in school year 2003−04. Separate questions were used to ask about main teaching assignment and certification. Respondents were first asked to identify the subject code for their main assignments (exhibit C-2) and then, in a later section of the survey, to identify subject codes for all subjects covered by the certification(s) they held (exhibit C-3). As a result, the determination of whether or not teachers were certified in their main assignments was left to the analyst. Since school year 2003–04, researchers have been able to match the course taught with certification areas, rather than having to rely on teachers’ self-matching.
Exhibit C-2. Main assignment item from the 2003−04 Teacher Questionnaire
SOURCE: U.S. Department of Education, National Center for Education Statistics, Schools and Staffing Survey (SASS), Teacher Questionnaire, 2003−04.
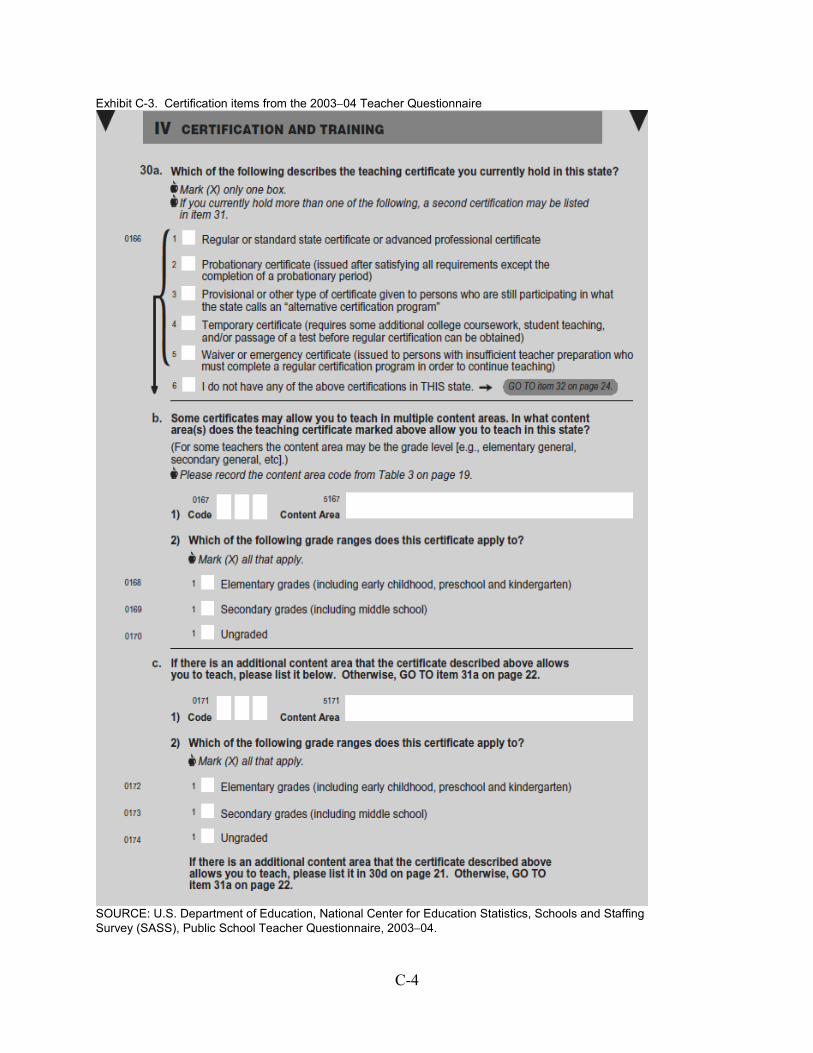
C-4
Exhibit C-3. Certification items from the 2003−04 Teacher Questionnaire
SOURCE: U.S. Department of Education, National Center for Education Statistics, Schools and Staffing Survey (SASS), Public School Teacher Questionnaire, 2003−04.
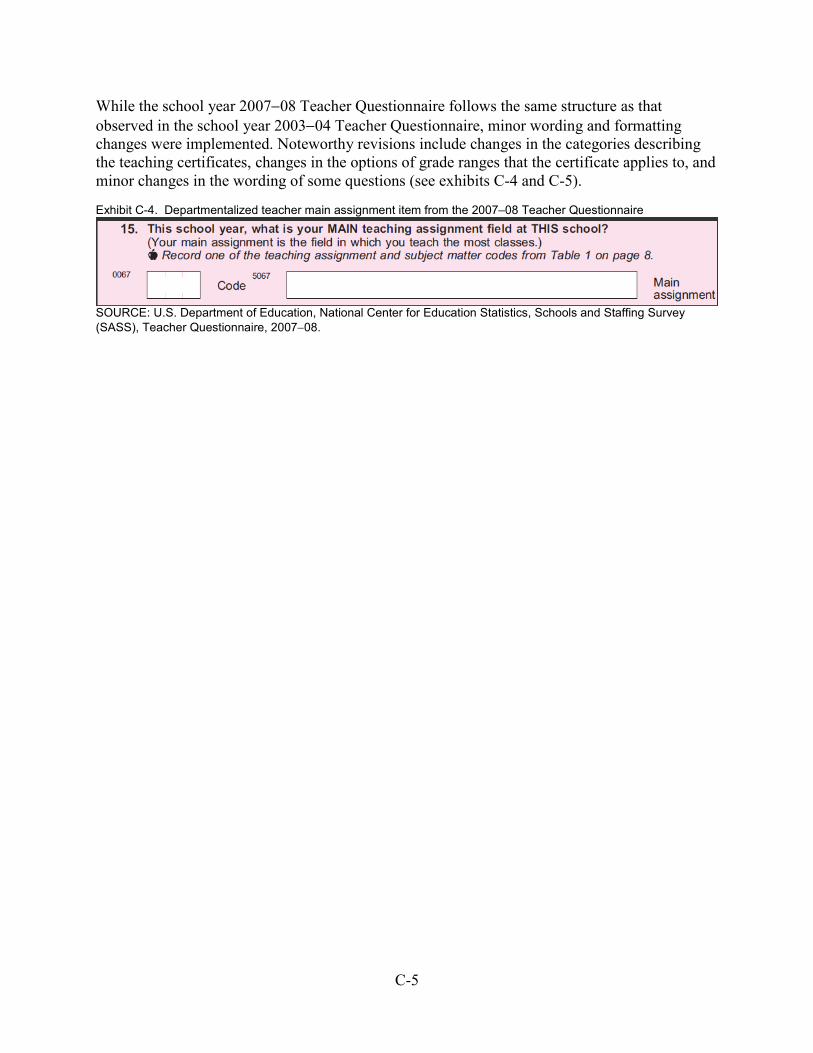
C-5
While the school year 2007−08 Teacher Questionnaire follows the same structure as that observed in the school year 2003−04 Teacher Questionnaire, minor wording and formatting changes were implemented. Noteworthy revisions include changes in the categories describing the teaching certificates, changes in the options of grade ranges that the certificate applies to, and minor changes in the wording of some questions (see exhibits C-4 and C-5).
Exhibit C-4. Departmentalized teacher main assignment item from the 2007–08 Teacher Questionnaire
SOURCE: U.S. Department of Education, National Center for Education Statistics, Schools and Staffing Survey (SASS), Teacher Questionnaire, 2007−08.
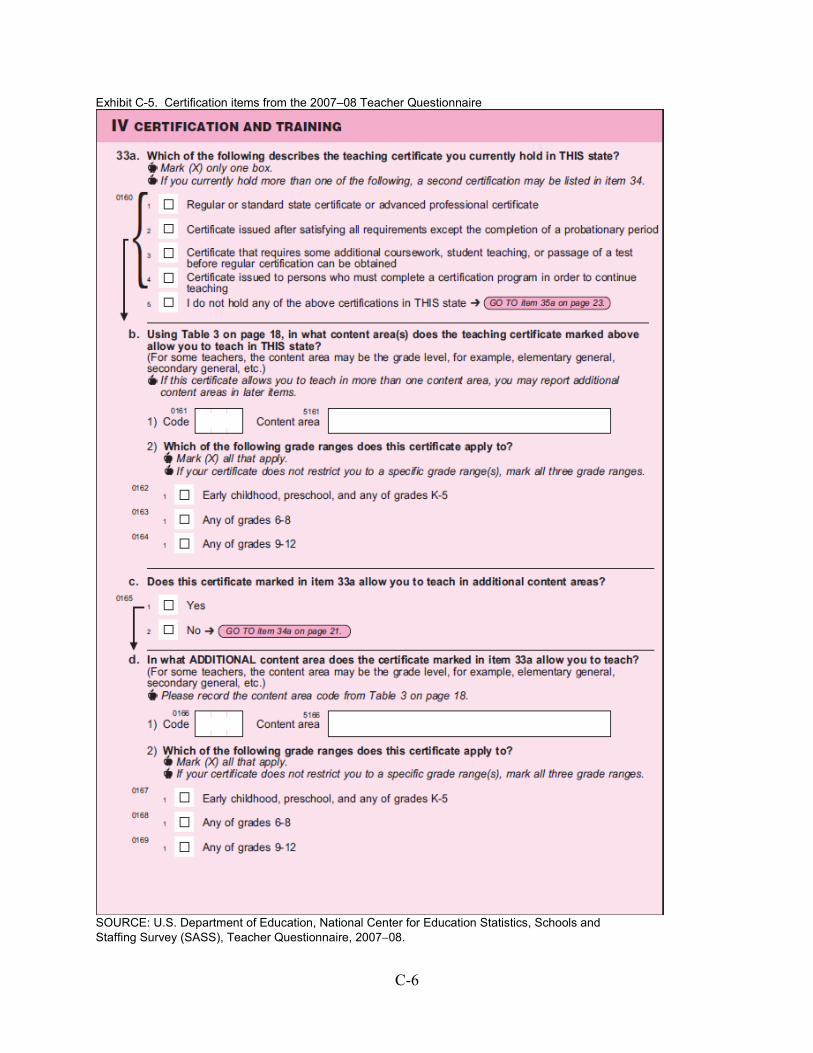
C-6
Exhibit C-5. Certification items from the 2007–08 Teacher Questionnaire
SOURCE: U.S. Department of Education, National Center for Education Statistics, Schools and Staffing Survey (SASS), Teacher Questionnaire, 2007−08.
C-7
Potential Implications of Changes to SASS
Due to differences in measurement, along with changes in the analyses, readers are cautioned against making direct comparisons between estimates in this report and previously published estimates that use SASS data from administrations in school year 1999–2000 and years prior. For example, several changes were implemented in the school year 2003−04 SASS Teacher Questionnaire and carried over in the school year 2007−08 SASS, such as alterations to the way certifications were matched to main assignments and grade levels as compared to the school year 1999–2000 and prior administrations. Smaller changes were also made to the school year 2007–08 SASS Teacher Questionnaire that distinguish it from all previous SASS administrations.1
For example, the reader could assume a hypothetical case of a high school teacher with a main assignment in pre-algebra and a certification in “secondary grades, general.” In school year 1999−2000, this teacher would have reported a main assignment of mathematics and “yes” to the question of being certified in his or her main assignment if the teacher considered the general secondary school certification as applicable. However, the same teacher in school year 2007−08 would not be considered certified in mathematics because only codes for mathematics (190), computer science (197), and physics (217) are valid for a mathematics certification in the analyses of this report.
Further, although the subject codes for main assignment and postsecondary majors changed slightly between school years 1999–2000, 2003–04, and 2007−08, the structure of questions related to assignment and postsecondary majors remained the same. Unlike certification, an analysis of majors in relation to assignment is possible, but analysts should be aware of coding changes.
Table C-1 compares school years 1999−2000, 2003−04, and 2007−08 estimates of the percentage of students taught by grade 9–12 teachers who were certified in the subject being taught. For comparison reasons, unlike the tables in the body of the report, table C-1 does not include the secondary-level certification requirement, as information on certification grade level was not collected in school year 1999–2000. Only a subset of those subjects reported in the body of the text are described in this table. Differences between the 2003−04 and 1999−2000 estimates as well as between the 2007−08 and 2003−04 estimates are also presented.
1 For more information see Tourkin, S., Thomas, T., Swaim, N., Cox, S., Parmer, R., Jackson, B., Cole, C., and Zhang, B. (2010). Documentation for the 2007−08 Schools and Staffing Survey (NCES 2009-318). U.S. Department of Education. Washington, DC: National Center for Education Statistics, Institute of Education Sciences.
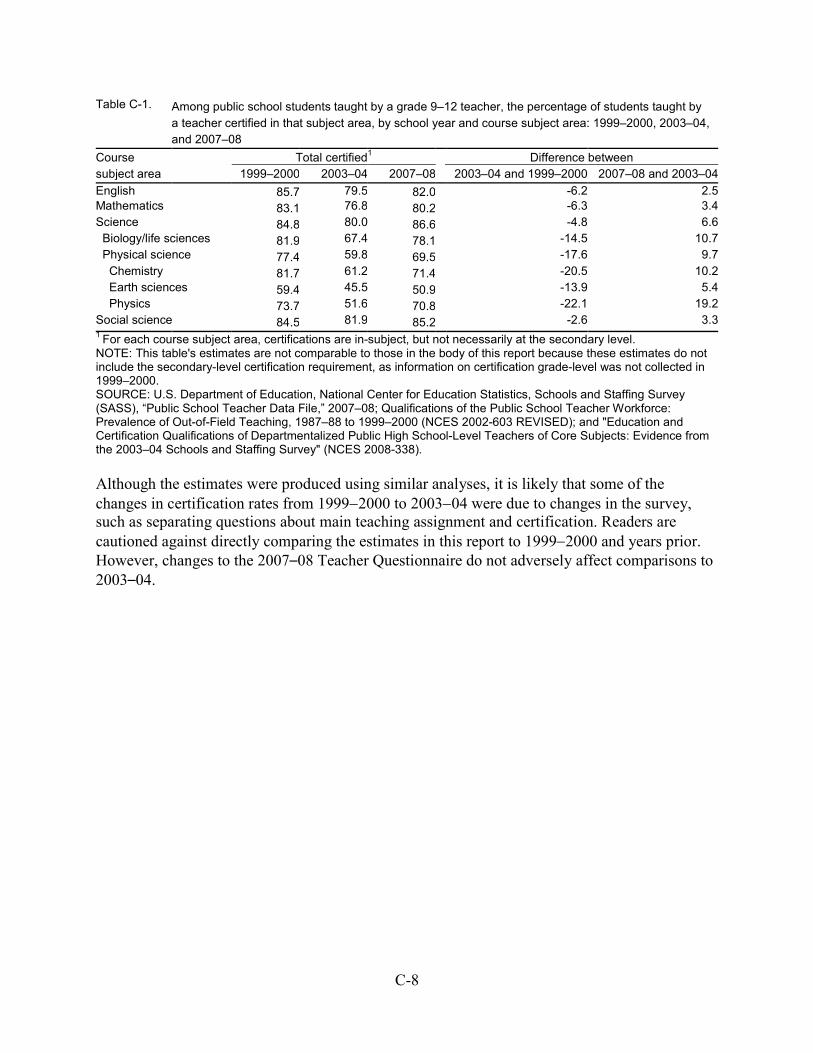
C-8
Table C-1. Among public school students taught by a grade 9–12 teacher, the percentage of students taught by a teacher certified in that subject area, by school year and course subject area: 1999–2000, 2003–04, and 2007–08
Course Total certified1
Difference between subject area
1999–2000 2003–04 2007–08 2003–04 and 1999–2000 2007–08 and 2003–04
English 85.7 79.5 82.0
-6.2 2.5 Mathematics 83.1 76.8 80.2
-6.3 3.4
Science 84.8 80.0 86.6
-4.8 6.6 Biology/life sciences 81.9 67.4 78.1
-14.5 10.7
Physical science 77.4 59.8 69.5
-17.6 9.7 Chemistry 81.7 61.2 71.4
-20.5 10.2
Earth sciences 59.4 45.5 50.9
-13.9 5.4 Physics 73.7 51.6 70.8
-22.1 19.2
Social science 84.5 81.9 85.2
-2.6 3.3 1 For each course subject area, certifications are in-subject, but not necessarily at the secondary level. NOTE: This table's estimates are not comparable to those in the body of this report because these estimates do not include the secondary-level certification requirement, as information on certification grade-level was not collected in 1999–2000. SOURCE: U.S. Department of Education, National Center for Education Statistics, Schools and Staffing Survey (SASS), “Public School Teacher Data File,” 2007–08; Qualifications of the Public School Teacher Workforce: Prevalence of Out-of-Field Teaching, 1987–88 to 1999–2000 (NCES 2002-603 REVISED); and "Education and Certification Qualifications of Departmentalized Public High School-Level Teachers of Core Subjects: Evidence from the 2003–04 Schools and Staffing Survey" (NCES 2008-338). Although the estimates were produced using similar analyses, it is likely that some of the changes in certification rates from 1999−2000 to 2003−04 were due to changes in the survey, such as separating questions about main teaching assignment and certification. Readers are cautioned against directly comparing the estimates in this report to 1999−2000 and years prior. However, changes to the 2007–08 Teacher Questionnaire do not adversely affect comparisons to 2003–04.

D-1
Appendix D: Description of Variables Used in This Report
D-2
General Table Variables
Teacher level: The SASS restricted-use data files allow users to identify high school teachers in several ways. Users may select TEALEV, where high school-level teachers are identified based on the grade level of the students they teach. TEALEV uses a four-category distribution of primary, middle, high school, and combined. Users may also select the four-category variable SCHLEVE2, where high school teachers are identified as those who teach in schools that offer high school grades. SCHLEVE2 also allows users to identify schools at the primary, middle, high school, and combined levels.
Examination of the correspondence between departmentalized high school-level teachers and teachers in high schools indicated that the large majority of teachers of students in grades 10–12, or grade 9 and no grade lower, instruct in schools that the SASS definition considers a high school: a school in which the lowest grade offered is any of grades 7–12 and the highest grade offered is any of grades 9–12. Among teachers who instruct students in grades 9–12, about 2 percent instruct classes in elementary schools, 90 percent teach in high schools, and 8 percent teach in combined schools. For this reason, readers must give special attention to understanding the meaning of “high school-level teachers” in this analysis sample.
The teacher-level analyses (tables 1–3) of this report define high school-level teachers using TEALEV (category 3), the level of students they reported teaching. TEALEV is constructed from responses to variables T0050–T0064, found in the Public School Teacher Data File and on the SASS Teacher Questionnaire. These analyses use TEALEV = 3, defined as teachers who instruct students in grades 10–12, or grade 9 and no grade lower. Using this definition, about 3 percent of teachers of 9th-grade students were dropped from these analyses because they also reported teaching a grade lower than grade 9. The majority of the teachers who were dropped instructed students in grades 7 and/or 8 (2 percent), therefore moving them to TEALEV = 2 (middle-level teacher).1
Class and student levels: Like the 2003–04 questionnaire, the 2007–08 Teacher Questionnaire asked teachers of departmentalized and elementary enrichment classes to report information on up to 10 classes or sections they taught, including the subject, enrollment, and grade level of each class. Classes (table 4) and the students enrolled in them (table 5) were included if taught at the grade 9–12 level.
Classroom organization: This report includes data on departmentalized teachers—defined as teachers who instruct several classes of different students most or all of the day in one or more subjects. These teachers were selected because they provided extensive details on the classes and students they taught. These details allow for analyses that tie specific teachers to specific classes and students. Departmentalized teachers were defined using question 16 (T0068), which asks, “Which statement best describes the way YOUR classes at THIS school are organized?”
Main assignment: Tables 1–3 report the qualifications of departmentalized teachers with respect to their main assignments. These tables are constructed using question 15 (T0067), which asks,
1 Comparisons between table 2 (i.e., high school-level teachers with TEALEV = 3) and estimates of all grade 9–12 teachers do not indicate any statistically significant differences between these groups.
D-3
“This school year, what is your MAIN teaching assignment field at THIS school? (Your main assignment is the field in which you teach the most classes.)” Each teacher has one reported main assignment field.
Course subject area(s) taught: Departmentalized teachers are asked to report the subject area of up to 10 classes taught in column B of question 22 in the Teacher Questionnaire (T0078, T0081, T0084, T0087, T0090, T0093, T0096, T0099, T0102, and T0105). These classes comprise the course subject area(s) taught and were used to construct tables 4 and 5. Course subject area(s) taught include both classes taught within the reported main assignment and in other assignments (where applicable).
Using exhibit D-1, readers are able to crosswalk the majors and certification areas that were matched to the subjects that teachers instructed, either main assignments or course subject areas taught (i.e., the “in-field” qualifications for each subject). In general, the subjects and corresponding “in-field” qualifications included in this report are closely aligned with prior NCES publications (Seastrom et al. 2004; Morton et al. 2008).
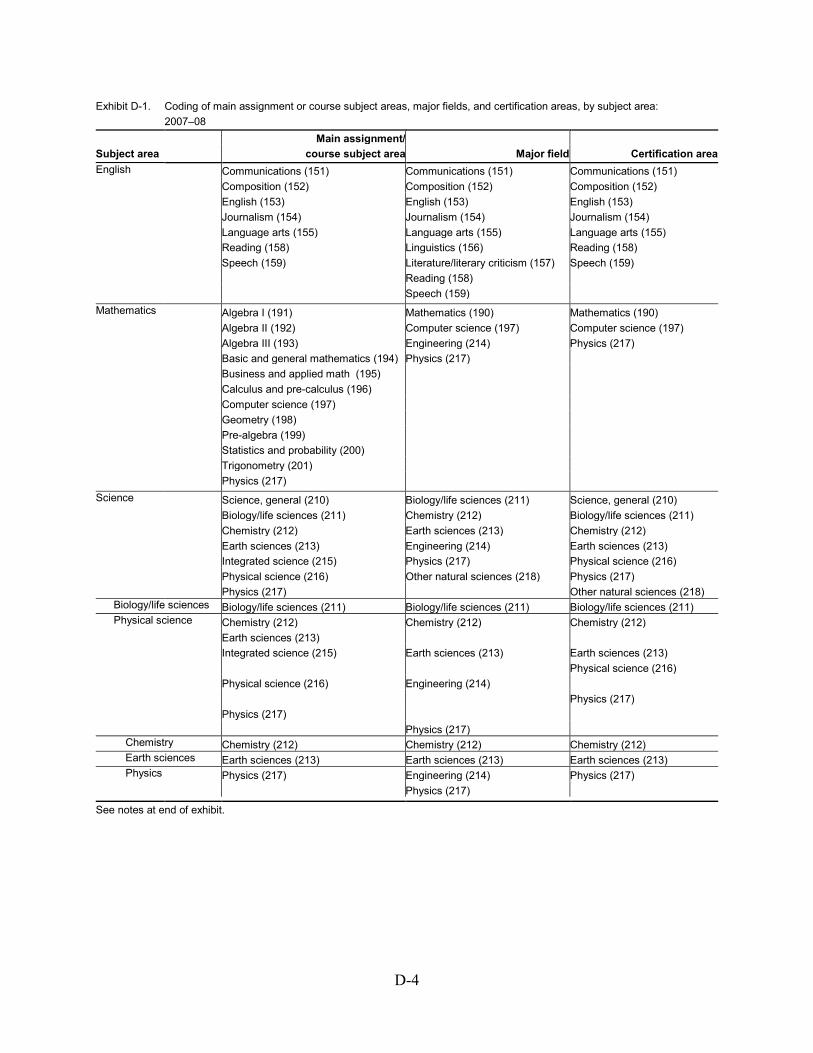
D-4
Exhibit D-1. Coding of main assignment or course subject areas, major fields, and certification areas, by subject area: 2007–08
Main assignment/ Subject area course subject area Major field Certification area English Communications (151) Communications (151) Communications (151) Composition (152) Composition (152) Composition (152) English (153) English (153) English (153) Journalism (154) Journalism (154) Journalism (154) Language arts (155) Language arts (155) Language arts (155) Reading (158) Linguistics (156) Reading (158) Speech (159) Literature/literary criticism (157) Speech (159) Reading (158) Speech (159) Mathematics Algebra I (191) Mathematics (190) Mathematics (190) Algebra II (192) Computer science (197) Computer science (197) Algebra III (193) Engineering (214) Physics (217) Basic and general mathematics (194) Physics (217) Business and applied math (195) Calculus and pre-calculus (196) Computer science (197) Geometry (198) Pre-algebra (199) Statistics and probability (200) Trigonometry (201) Physics (217) Science Science, general (210) Biology/life sciences (211) Science, general (210) Biology/life sciences (211) Chemistry (212) Biology/life sciences (211) Chemistry (212) Earth sciences (213) Chemistry (212) Earth sciences (213) Engineering (214) Earth sciences (213) Integrated science (215) Physics (217) Physical science (216) Physical science (216) Other natural sciences (218) Physics (217) Physics (217) Other natural sciences (218) Biology/life sciences Biology/life sciences (211) Biology/life sciences (211) Biology/life sciences (211) Physical science Chemistry (212) Chemistry (212) Chemistry (212) Earth sciences (213) Integrated science (215) Earth sciences (213) Earth sciences (213) Physical science (216) Physical science (216) Engineering (214) Physics (217) Physics (217) Physics (217) Chemistry Chemistry (212) Chemistry (212) Chemistry (212) Earth sciences Earth sciences (213) Earth sciences (213) Earth sciences (213) Physics Physics (217) Engineering (214) Physics (217) Physics (217) See notes at end of exhibit.
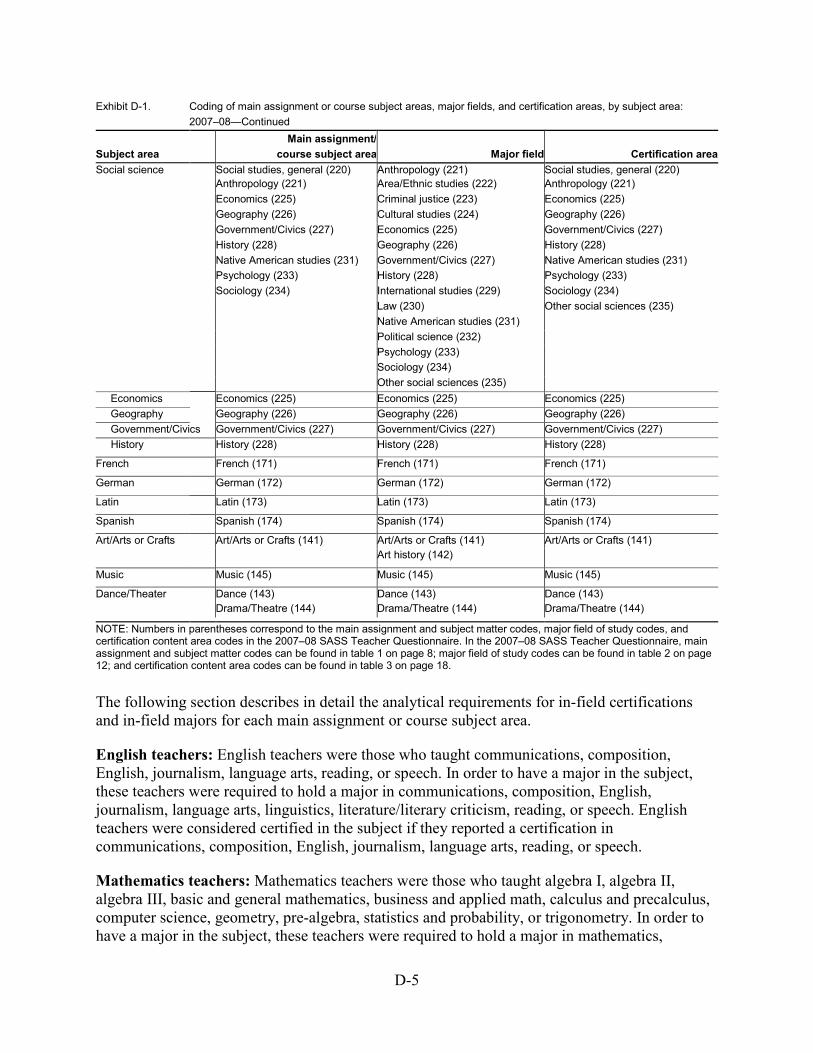
D-5
Exhibit D-1. Coding of main assignment or course subject areas, major fields, and certification areas, by subject area: 2007–08—Continued Main assignment/ Subject area course subject area Major field Certification area
Social science Social studies, general (220) Anthropology (221) Social studies, general (220) Anthropology (221) Area/Ethnic studies (222) Anthropology (221) Economics (225) Criminal justice (223) Economics (225) Geography (226) Cultural studies (224) Geography (226) Government/Civics (227) Economics (225) Government/Civics (227) History (228) Geography (226) History (228)
Native American studies (231) Government/Civics (227) Native American studies (231) Psychology (233) History (228) Psychology (233) Sociology (234) International studies (229) Sociology (234) Law (230) Other social sciences (235) Native American studies (231) Political science (232) Psychology (233) Sociology (234) Other social sciences (235) Economics Economics (225) Economics (225) Economics (225) Geography Geography (226) Geography (226) Geography (226) Government/Civics Government/Civics (227) Government/Civics (227) Government/Civics (227) History History (228) History (228) History (228)
French French (171) French (171) French (171)
German German (172) German (172) German (172)
Latin Latin (173) Latin (173) Latin (173)
Spanish Spanish (174) Spanish (174) Spanish (174)
Art/Arts or Crafts Art/Arts or Crafts (141) Art/Arts or Crafts (141) Art/Arts or Crafts (141) Art history (142)
Music Music (145) Music (145) Music (145)
Dance/Theater Dance (143) Dance (143) Dance (143) Drama/Theatre (144) Drama/Theatre (144) Drama/Theatre (144)
NOTE: Numbers in parentheses correspond to the main assignment and subject matter codes, major field of study codes, and certification content area codes in the 2007–08 SASS Teacher Questionnaire. In the 2007–08 SASS Teacher Questionnaire, main assignment and subject matter codes can be found in table 1 on page 8; major field of study codes can be found in table 2 on page 12; and certification content area codes can be found in table 3 on page 18. The following section describes in detail the analytical requirements for in-field certifications and in-field majors for each main assignment or course subject area.
English teachers: English teachers were those who taught communications, composition, English, journalism, language arts, reading, or speech. In order to have a major in the subject, these teachers were required to hold a major in communications, composition, English, journalism, language arts, linguistics, literature/literary criticism, reading, or speech. English teachers were considered certified in the subject if they reported a certification in communications, composition, English, journalism, language arts, reading, or speech.
Mathematics teachers: Mathematics teachers were those who taught algebra I, algebra II, algebra III, basic and general mathematics, business and applied math, calculus and precalculus, computer science, geometry, pre-algebra, statistics and probability, or trigonometry. In order to have a major in the subject, these teachers were required to hold a major in mathematics,
D-6
computer science, engineering, or physics. Mathematics teachers were considered certified in the subject if they reported a certification in mathematics, computer science, or physics.
Science teachers: Science teachers are reported in a broad science row in the tables. These science teachers included teachers of science (general), biology/life sciences, chemistry, earth sciences, integrated science, physical science, or physics. In order to have a major in the subject, these teachers were required to hold a major in biology/life sciences, chemistry, earth sciences, engineering, physics, or other natural sciences. Science teachers were considered certified in the subject if they reported a certification in science (general), biology/life sciences, chemistry, earth sciences, physical science, physics, or other natural sciences.
Many high school-level science teachers teach specific subfields within the science field. A biology/life sciences teacher was required to hold both a major and certification in biology/life sciences. Physical science teachers were considered in-field with a major and certification in any of chemistry, earth sciences, engineering, or physics.
Within physical science, qualifications were further specified. Chemistry and Earth sciences teachers were required to hold a major and certification in chemistry and earth sciences, respectively. Physics teachers are considered to have a major in the subject if they have a major in physics or engineering. They are considered certified in the subject if they hold a physics certification. This was done both to account for more specific qualification requirements in some states and to align with past NCES reports on teacher qualifications (Seastrom et al. 2004; Morton et al. 2008).
Social science teachers: Social science teachers are reported in a general social science row. These social science teachers included teachers of social studies (general), anthropology, economics, geography, government/civics, history, Native American studies, psychology, or sociology. In order to have a major in the subject, these teachers were required to hold a major in anthropology, area/ethnic studies, criminal justice, cultural studies, economics, geography, government/civics, history, international studies, law, Native American studies, political science, psychology, sociology, or other social science. Social science teachers were considered certified in the subject if they reported a certification in social studies (general), anthropology, economics, geography, government/civics, history, Native American studies, psychology, sociology, or other social science.
Within the individual rows, teachers of the social science subfields of economics, geography, government/civics, and history were each held to stricter standards at the subfield level than at the broad field level. At the broad field level, any social science major or certification was considered in-field. However, in order to be considered as having an in-field major and certification, teachers of the social science subfields were required to have a major and certification in the respective subfield (e.g., economics teachers had to earn a major and certification in economics). Again, this was done both to account for more specific qualification requirements in some states and to align with past NCES reports on teacher qualifications (e.g., Seastrom et al. 2004).
Foreign language teacher: In order to meet qualification conditions, French teachers were required to hold a major and certification in French. The same requirements were applied to
D-7
teachers of German, Latin, and Spanish. In order to meet qualifications requirements, foreign language teachers were required to hold a major and certification in their respective foreign language. As mentioned above, teachers of other foreign languages were not included in the tables due to small sample sizes.
Art/Arts and Crafts teachers: Art/arts and crafts teachers were required to hold a major in art/arts and crafts or art history, and were required to have a certification in art/arts and crafts.
Music teachers: Music teachers were required to hold a major and certification in music.
Dance/Drama or Theater teachers: Dance/drama or theater teachers were required to hold a major and certification in dance/drama or theater.
Variable Used in the Creation of the Columns
Major field of study: Teachers’ major fields of study were calculated using variables T0113 (first bachelor’s, first major), T0115 (first bachelor’s, second major), T0123 (first master’s, major), T0129 (second bachelor’s, major), T0132 (second master’s, major), T0135 (educational specialist/professional diploma), T0138 (Certificate of Advanced Graduate Studies), and T0141 (doctorate or first professional degree). Codes provided in these variables were matched to teachers’ main assignment/subject areas taught and certification areas.
Certification type: Certification type was measured using questions 33a (T0160) and 34a (T0185) for the first and, if applicable, second certification held in the state in which teachers currently teach. Teachers were required to hold a regular or standard state certification or advanced certification, or a certificate issued after satisfying all requirements except the completion of a probationary period. All other certification types, such as those requiring some additional coursework, student teaching, passage of a test, or completion of a certification program, along with those teachers without a certification, comprise the not certified category.
Since SASS collects information on two certifications, it is not known how many teachers have three or more certifications or the additional fields in which they may be certified. About 13 percent of teachers in this report held a second certification. It can be surmised that fewer teachers hold three or more certifications. Certainly, having data on three or more certifications would have provided more information on the fields in which a teacher is qualified to teach and would have caused some estimates of the rates of teachers with in-field certifications to increase slightly.
Certification content area: Teachers were asked to report the content area(s) covered by their first and, if applicable, second certification in questions 33b[1]–j[1] (T0161, T0166, T0171, T0176, and T0181) and 34c[1] –k[1] (T0187, T0192, T0197, T0202, and T0207). Codes provided in these variables were matched to teachers’ main assignment/subject areas taught and majors.
Certification grade range(s): The 2007–08 SASS Teacher Questionnaire includes items that measured the grade range(s) for which teachers’ certifications applied. However, the certification grade range changed in 2007–08—from elementary, secondary, or combined in 2003–04—to early childhood, preschool, and any of grades K–5; any of grades 6–8; or any of grades 9–12.
D-8
This report requires in-field certifications to apply to “any of grades 9–12” in the subject taught. The specific questions used are 33b[2], 33d[2], 33f[2], 33h[2], and 33j[2] (T0164, T0169, T0174, T0179, and T0184) for the first certification and 34c[2], 34e[2], 34g[2], 34i[2], and 34k[2] (T0190, T0195, T0200, T0205, and T0210) for the second certification.

E-1
Appendix E: Glossary of Terms
E-2
Certification: A license or certificate awarded to teachers by the state to teach in a public school. The Schools and Staffing Survey (SASS) includes five types of certification: a regular or standard state certification or advanced professional certificate; a certificate issued after satisfying all requirements except the completion of a probationary period; a certificate that requires some additional coursework, student teaching, or passage of a test before regular certification can be obtained; and a certificate issued to persons who must complete a certification program in order to continue teaching.
For this report, a certificate is limited to two of the five SASS options. To be precise, a certificate in this report is a regular or standard state certification, advanced professional certificate, or a certificate issued after satisfying all requirements except the completion of a probationary period. Certifications must apply to any of grades 9−12, except for the subjects of art/arts and crafts, music, and dance/drama or theater, for which an ungraded certification is accepted.
Charter school: See Public charter school.
Common Core of Data (CCD): The CCD is a group of surveys that acquires and maintains public elementary and secondary education data from the 50 states, the District of Columbia, Department of Defense schools, and the outlying areas through state-level (or equivalent) education agencies. Information about staff and students in public schools is collected annually at the school, local education agency (i.e., school district), and state levels. Information about revenues and expenditures is also collected at the state level. The CCD is the basis for the SASS sampling frame for public, public charter, and Bureau of Indian Education (BIE)-funded schools.
Course subject area taught: This term is not defined in the SASS questionnaires. A general definition is any subject taught by a teacher, including both main assignment and other assignments. Teachers may report multiple subject areas taught.
Departmentalized teacher: The SASS Teacher Questionnaire defines departmentalized teachers as those who instruct several classes of different students most or all of the day in one or more subjects (such as algebra, history, or biology).
In-field teacher: This term is not defined by SASS. In education research literature, an in-field teacher is usually one whose postsecondary degree (major) and/or certification (type or content area covered) match the subject(s) that he or she has been assigned to teach.
Itinerant teacher: See Teacher.
Main assignment field: The SASS Teacher Questionnaire defines main assignment as the field in which the teacher teaches the most classes. Teachers may report only one main assignment.
Major: This term is not defined by SASS, but is meant as a field of study in which an individual has taken substantial academic coursework, implying that the individual has substantial knowledge of the academic discipline or subject area.
Public charter school: A public charter school is a public school that, in accordance with an enabling state statute, has been granted a charter exempting it from selected state or local rules
E-3
and regulations. A public charter school may be a newly created school or it may previously have been a public or private school.
Public school: A public school is an institution or part of an institution that provides classroom instruction to students, has one or more teachers to provide instruction, serves students in one or more of grades 1–12 or the ungraded equivalent, and is located in one or more buildings. It is possible for two or more schools to share the same building; in this case, they were treated as different schools if they had different administrators (i.e., principals). Public schools include regular, special education, vocational/technical, alternative, and public charter schools. Schools in juvenile detention centers and schools located on domestic military bases and operated by the Department of Defense are included. See also entries for Public charter school and Traditional public school.
Regular full-time teacher: See Teacher.
Student enrollment: The number of students officially enrolled in the school or district as of October 1, 2007.
Teacher: A teacher is defined as a full-time or part-time teacher who teaches any regularly scheduled classes in any of grades K–12. This includes administrators, librarians, and other professional or support staff members who teach regularly scheduled classes on a part-time basis. Itinerant teachers are included, as well as long-term substitutes who are filling the role of a regular teacher on a long-term basis. An itinerant teacher is defined as a teacher whose assignment requires teaching at more than one school (e.g., a music teacher who teaches three days per week at one school and 2 days per week at another). Itinerant teachers who teach full time in any district, but teach part time in a particular school, are considered part-time teachers at that particular school. A regular full-time teacher is any teacher whose primary position in a school is not as an itinerant teacher, a long-term substitute, a short-term substitute, a student teacher, a teacher aide, an administrator, a library media specialist or librarian, another type of professional staff (e.g., counselor, curriculum coordinator, social worker), support staff (e.g., secretary), or a part-time teacher. Short-term substitute teachers and student teachers are not included.
Teacher level: This is based on the grade level of students taught by teachers. Teachers are grouped into four categories based on the grade levels of the students taught and the teachers’ main assignments. Teacher level does not necessarily reflect the level of the school in which teachers teach. Primary-level teachers include teachers who taught only grades K–4, as well as other teachers who taught grades 5–8 but identified themselves as elementary or special education teachers. Middle-level teachers include teachers who taught students in grades 5–9 and did not teach any students in grades 10–12; some teachers who taught grades 5–8 who identified themselves as elementary or special education teachers were classified as primary-level teachers. High school-level teachers include all teachers who taught any of grades 10–12, as well as teachers who taught grade 9 and no grade lower. All other teachers are categorized as combined.
Traditional public school: Traditional public schools are the subset of all public schools that are not public charter schools. They include regular, special education, vocational/technical, and alternative schools. They also include schools in juvenile detention centers and schools located

E-4
on domestic military bases and operated by the Department of Defense. See also the definitions for Public school and Public charter school.