Embed Size (px)
Citation preview

Education & cooperation will deliver eMobility expansionExploring consumer perceptions and non-technical challenges that impact mass EV adoption
ihsmarkit.com/automotive
By IHS Markit; prepared for and commissioned by Eaton | February 2021
1Source: IHS Markit, February 2021
Table of Contents Methodology 2
Executive Summary 2
Infrastructure and EV Adoption 3
EVSE Locations 4
EVSE Types & Advantages 5
Consumer Perspectives 7
Special Insert — Plug-in Sales Insights & TCO 10
Regulatory Challenges & The Grid 12
Impact to the Grid 14
Industry Interview Perspectives 15
Conclusions & Future Outlook 17
2Source: IHS Markit, February 2021
This shift in the overall sales of electrified vehicles, as well as the segment shift toward full BEVs in these major global markets illustrates the progress the industry has made on improving both “the chicken” and “the egg.”
MethodologyIHS Markit has reviewed the topic of automotive eMobility infrastructure and its various interdependencies from EV sales, consumer perspectives, and regulatory milestones. For this paper, IHS Markit leveraged its internal fact-based expertise and data, in addition to independent opinions from key automotive industry representatives. IHS Markit performed several interviews from high-ranking officials from automakers, utilities, suppliers, and charging network operators to triangulate perspectives on this topic. IHS Markit then compared the key takeaways with analysis from its experts and proprietary data to form the subsequent report. IHS Markit has performed all research and analysis independently and delivered herein the findings of this report; a study commissioned by Eaton.
Executive Summary• There is strong growth in electric vehicle supply equipment (EVSE)
and the scales are tipped strongly toward Level 2 AC installations due to costs and compatibility.
• The electric vehicle user experience is not to drive to fuel, but to fuel where you park, and consumers are unfamiliar with this fact.
• Today’s biggest challenge to the buildout of a complete EV charging infrastructure is coordination of stakeholders.
Historically, the development of the electric vehicle has been distilled down to the age-old “chicken or egg” paradox. Will the sale of EVs (electric vehicles) drive the development of eMobility infrastructure, or will the network of charging stations drive EVs volumes? The early adopters have already adopted, and now the automotive industry is investing billions to scale EVs into mass market pricing, appeal, product requirements and usability.
When peering into the challenges of the charging infrastructure, the issues were formerly technical in nature. Does the grid (macro and micro) have the power necessary to support charging stations? Is the connector compatible with the various types of EVs on the road? How reliable are the charging stations? How do I manage and optimize the network of stations on the backend?
These challenges have – for the most part – been met with improvements in both hardware and software. Yet, the industry still has issues with scaling EV sales to the mass market. IHS Markit calculates approximately 1.2 percent of vehicle sales in the US in 2017 had a plug-in, 48 percent of which were full BEVs (battery electric vehicles). By the end of 2024, nearly 10 percent of vehicles

3Source: IHS Markit, February 2021
sold in the US will have a plug-in, and by then 72 percent of those will be a full BEV.
Growth in EVs is even stronger in Europe and China than in the US. Among the EU28, EV sales will reach more than 20 percent of overall sales by 2024, according to IHS Markit forecasts, with 64 percent of those being BEVs. As a point of reference, in Europe in 2020, registration of plug-in electric vehicles jumped nearly 211% year on year (y/y) in the third quarter, to nearly 274,000 units. In China, the world’s largest automotive sales market, EV sales will reach 17 percent in 2024, and 70 percent of those will be full BEVs. In mainland China, sales of new energy vehicles (NEVs), were up 3.9% year on year to 1.1 million units during the January to November 2020 period.
This shift in the overall sales of electrified vehicles, as well as the segment shift toward full BEVs in these major global markets illustrates the progress the industry has made on improving both “the chicken” and “the egg.” However, 10 to 20 percent of vehicle sales is by no measure mass market adoption.
The truth is the industry still must overcome some serious consumer barriers to adoption. According to IHS Markit consumer research in 2019, three of the top five reasons why people chose not to buy an EV are charging-related issues. This includes anything from charging times to station availability and range. These barriers remain, even while experts know the current public infrastructure has more than enough capacity to keep these vehicles charged and that range anxiety is overblown as most commuters do not come close to tapping out their battery range on a daily basis.
Beyond the consumer barriers, the eMobility infrastructure build out has more regulatory and utility-oriented challenges than one would imagine. Experts IHS Markit spoke to repeatedly cited the challenges in simply organizing the local authorities to work with utility commissions and oversight bodies to open sites for infrastructure development. So much is tied up in outdated frameworks and policy, that deployment can be slow, regardless of the demand presented. This can vary quite widely across regions. For example, in Europe, there is little regulation on small EVSE installations, but larger installations are more challenging to coordinate. Ultimately, the eMobility infrastructure challenges are global in nature, but local in execution, presenting a fragmented approach for any one company or association to help drive expansion.
Infrastructure and EV adoptionMarket Trends: Global Cumulative Electric Vehicle Supply Equipment (EVSE) Deployments
Source: IHS Markit EV Infrastructure Forecast, Jul 2020
Americas
APAC
EMEA
Americas
APAC
EMEA
31.3M
27.4M
8.2M
1.5M
3.4M
2.4M
2025 Electric Vehicle Supply Equipment (EVSE) Deployments (Millions)
2019 Electric Vehicle Supply Equipment (EVSE) Deployments (Millions)

4Source: IHS Markit, February 2021
Most major automotive markets have come a long way since the introduction of mass-produced EVs. With the arrival of disruptors like Tesla, and the shift toward electrification at industry stalwarts like General Motors and Volkswagen, the representative investments and deployments of adequate charging infrastructure have been underway.
IHS Markit forecasts significant growth in EVSE (electric vehicle supply equipment) deployments over the next 5 years in these major markets. The APAC region, lead primarily by China, will grow from a cumulative 2.4 million charging stations in 2019 to 31.3 million by 2025. EMEA, which leads today, will grow from a stock of 3.4 million charging stations to 27.4 million by 2025. The Americas, led by the US, but including Canada and Latin America, will grow from 1.5 million cumulative stations in 2019 up to 8.2 million stations by 2025, a respectively low number given the region’s geographical size.
All three major regions will see strong CAGRs (compound annual growth rates) ranging from 33 percent to more than 50 percent between 2019 and 2025. This growth is predominantly in service of the commensurate growth in EV sales as well as federal and regional incentives to build out EVSE networks and equipment.
EVSE LocationsThe growth in EVSE installations is only a small part of the story. Much of the consumer objection on charging availability is caused by the fact that the large majority of total EVSE is installed in domestic locations, outside of the access or purview of the general public.
Global Cumulative EVSE Deployments, by Location
0
10
20
30
40
50
60
2016 2017 2018 2019 2020 2021 2022 2023 2024 2025
Mill
ions
Domestic charging Public & Semi-public chargingSource: IHS Markit EV Infrastructure Forecast, Jul 2020 © 2020 IHS Markit
While municipal deployments will vary greatly, on the global scale, domestic charging station installations represent 80 to 85 percent of all EVSE in operation today and this number will hold steady throughout the next five years. To put it in real terms, only 1.04 million public, semi-public or commercial charging stations are in the ground, globally, as of 2019. This number is set to grow to 13.6 million EVSE installations by 2025, according to IHS Markit forecasts. By contrast, the global domestic EVSE installations will grow from 6.3 million in 2019 to 53.3 million by 2025. The public EVSE will grow at a slightly higher 53.4 percent CAGR compared to the domestic CAGR of 42.8 percent, but the latter will still outpace the former by nearly 40 million cumulative units in 2025.
5Source: IHS Markit, February 2021
IHS Markit spoke with experts in the industry about this trend and a common theme emerged in the discussions. Overall, the eMobility infrastructure available on the market today is strong enough to meet the demand presented from the various electric vehicles on the road. However, due to the heavy reliance on domestic charging sources – which are most often hidden behind a garage door from the public eye – the general non-EV owning public is unaware of the presence or location of public EVSE.
EV owners are acutely aware of publicly-accessible charging stations, but everyone else is – for the most part – unaware. Thus, a major incentive for the industry to install more stations is literally to advertise their availability, even if a large majority will choose to charge at home.
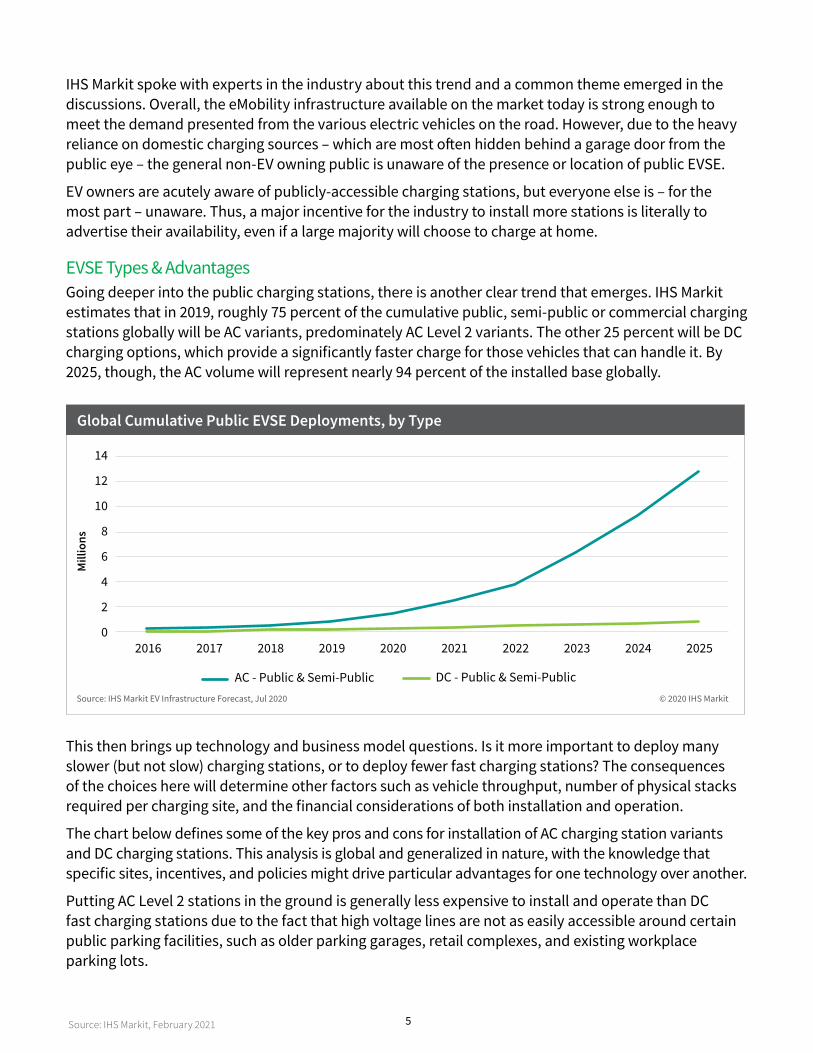
EVSE Types & AdvantagesGoing deeper into the public charging stations, there is another clear trend that emerges. IHS Markit estimates that in 2019, roughly 75 percent of the cumulative public, semi-public or commercial charging stations globally will be AC variants, predominately AC Level 2 variants. The other 25 percent will be DC charging options, which provide a significantly faster charge for those vehicles that can handle it. By 2025, though, the AC volume will represent nearly 94 percent of the installed base globally.
Global Cumulative Public EVSE Deployments, by Type
0
2
4
6
8
10
12
14
2016 2017 2018 2019 2020 2021 2022 2023 2024 2025
Mill
ions
AC - Public & Semi-Public DC - Public & Semi-PublicSource: IHS Markit EV Infrastructure Forecast, Jul 2020 © 2020 IHS Markit
This then brings up technology and business model questions. Is it more important to deploy many slower (but not slow) charging stations, or to deploy fewer fast charging stations? The consequences of the choices here will determine other factors such as vehicle throughput, number of physical stacks required per charging site, and the financial considerations of both installation and operation.
The chart below defines some of the key pros and cons for installation of AC charging station variants and DC charging stations. This analysis is global and generalized in nature, with the knowledge that specific sites, incentives, and policies might drive particular advantages for one technology over another.
Putting AC Level 2 stations in the ground is generally less expensive to install and operate than DC fast charging stations due to the fact that high voltage lines are not as easily accessible around certain public parking facilities, such as older parking garages, retail complexes, and existing workplace parking lots.

6Source: IHS Markit, February 2021
Furthermore, the AC stations will generally offer the end-user a less expensive charge, since it is delivered at a slower rate. This then provides the station host with a chance to consider different business models to offset costs of installation and electricity charges. These may include longer time in the host’s store or restaurant, or simply a competitive edge for an urban parking facility.
The negatives include the need for more physical stations per site in order to meet demand, which can become an issue for smaller EV charging sites where fewer vehicle parking spots are available. It is also less likely for AC units to generate direct charging revenues, and obviously provides a slower charge to the end-user. AC stations are more likely to be free or very inexpensive to the end-user, depending on level and potential incentives from other sources.
On the flip side of the equation, DC fast charging offers end-users a “rapid” charging experience, especially compared to user’s experiences with home charging. Strategically placed DC fast chargers can help make or break the usability of EVs for lengthy commutes or road trips. DC fast chargers will match more of the traditional vehicle fueling user experience (UX) model, wherein the user must go to a station to refuel. In particular areas and scenarios, this is the optimal solution.
Given the speed of refueling, site hosts are much more likely to charge users by the minute or kWh of energy consumed. This provides an incentive to install a DC fast charger for direct revenue purposes, which can include layered fees for activation, time-of-use charges, and even overage charges for a vehicle that stays plugged-in after charging is complete.
As the industry (and end-users alike) becomes familiar with various charging technologies, different strategies will be deployed for different use-cases. For example, an individual EV owner may choose not to buy an EVSE for their home use based on their individual commute needs, their vehicle’s range, other vehicles in the household, or proximity to public AC or DC charging.
Meanwhile, a fleet owner who has tens, hundreds, or thousands of EVs in their fleet will need to consider operational uptime and their existing footprint of fleet maintenance and storage facilities when purchasing EVSE technologies. Electrified fleets are in a nascent stage today, but both light commercial and medium and heavy commercial vehicles are beginning to come to market, offering fleet owners a major operational cost advantage over gasoline, diesel or even natural gas fuel types. Even with a small scale EV fleet, AC Level 2 charging stations will help to optimize the fleet’s efficiency. Depending on the use-case of the fleet (long-haul, fixed route, or local goods or passenger transport) DC charging could prove to be a better choice or the more expensive one.
Strategically placed DC fast chargers can help make or break the usability of EVs for lengthy commutes or road trips.

7Source: IHS Markit, February 2021
Public Charging Considerations
Source: IHS Markit
DC Charging AC Charging
FASTER
FEWER
SMALLER
MULTIPLE DC
MORE
LARGER
Charging
Units needed per site for same throughput
Site footprint needed
Individual station footprint needed
SLOWER
MORE
LARGER
SMALLER
LESS
ONE AC
Complicated site electrical install process
Required connector standard
Commonly drives indirect revenues from charging (neutral point)
Consumer PerspectivesAs shown, strategies will differ for each individual use-case, and herein lies another educational imperative. The industry must work to educate buyers (both private and fleet) about the differences in fueling EVs. As one interviewee put it, “In many ways, this is a better user experience than gas – you don’t have to go out of your way.”
But this is not the general public’s perception. IHS Markit consumer research in 2019 revealed a few interesting shortcomings around the awareness and acuity of charging electric vehicles.
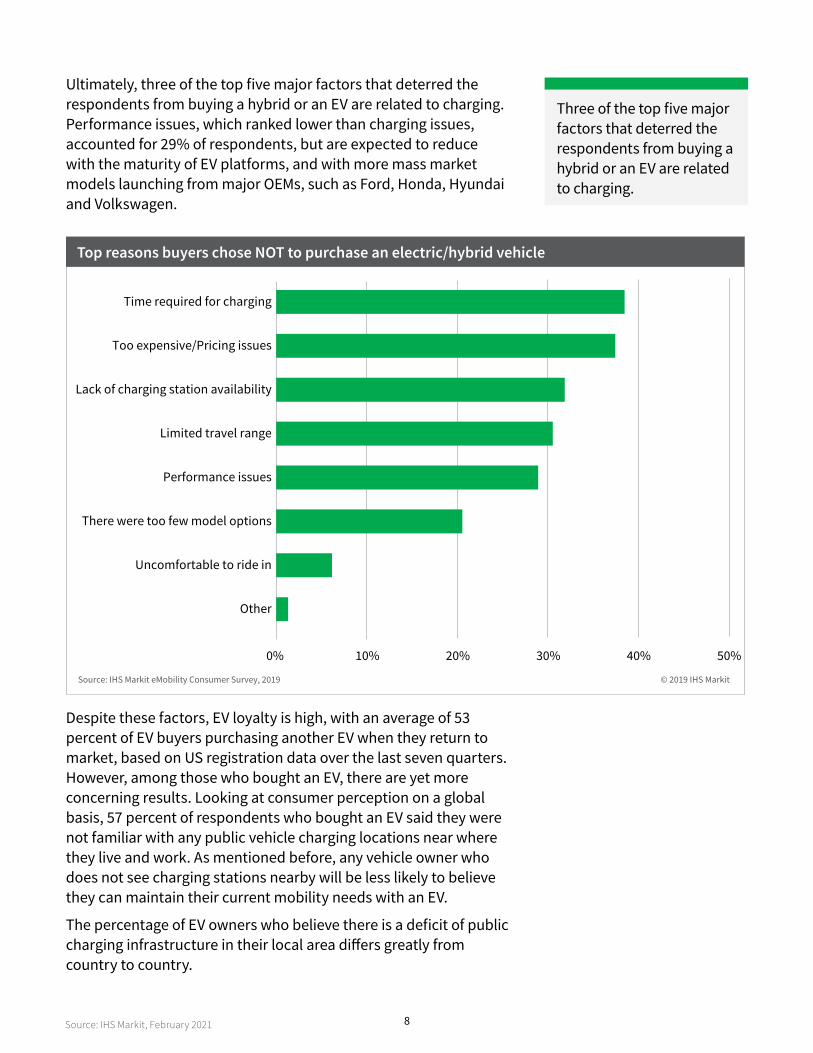
The survey interviewed buyers of new vehicles in countries and regions all over the world on topics from connectivity and safety to electrification perspectives. Of the respondents who had not purchased a hybrid or electric vehicle, longer charging duration, cost, inadequate charging infrastructure, and range were the major pain points that kept customers in traditional ICE (internal combustion engine) vehicles. Time required for charging came in at the top spot at 37 percent of respondents, and lack of charging station availability came in third at 32 percent of respondents.
8Source: IHS Markit, February 2021
Ultimately, three of the top five major factors that deterred the respondents from buying a hybrid or an EV are related to charging. Performance issues, which ranked lower than charging issues, accounted for 29% of respondents, but are expected to reduce with the maturity of EV platforms, and with more mass market models launching from major OEMs, such as Ford, Honda, Hyundai and Volkswagen.
Top reasons buyers chose NOT to purchase an electric/hybrid vehicle
Time required for charging
Too expensive/Pricing issues
Lack of charging station availability
Limited travel range
Performance issues
There were too few model options
Uncomfortable to ride in
Other
0% 10% 20% 30% 40% 50%
Source: IHS Markit eMobility Consumer Survey, 2019 © 2019 IHS Markit
Despite these factors, EV loyalty is high, with an average of 53 percent of EV buyers purchasing another EV when they return to market, based on US registration data over the last seven quarters. However, among those who bought an EV, there are yet more concerning results. Looking at consumer perception on a global basis, 57 percent of respondents who bought an EV said they were not familiar with any public vehicle charging locations near where they live and work. As mentioned before, any vehicle owner who does not see charging stations nearby will be less likely to believe they can maintain their current mobility needs with an EV.
The percentage of EV owners who believe there is a deficit of public charging infrastructure in their local area differs greatly from country to country.
Three of the top five major factors that deterred the respondents from buying a hybrid or an EV are related to charging.

9Source: IHS Markit, February 2021
Much of the problem lies in the public perception of their fueling experience. Simply put, this is not a drive to fuel model. It is a fuel where you park model.
(Owners of electric vehicles) Do you believe the public charging infrastructure is su�icient in your local area?
100%
90%
80%
70%
60%
50%
40%
30%
20%
10%
0%US ChinaGermany South Korea
Source: IHS Markit eMobility Consumer Survey, 2019 © 2019 IHS Markit
Yes No Unsure
The West Coast states of California, Oregon and Washington make up 51.4 percent of the US EV vehicles in operation (VIO) today, according to IHS Markit. Respondents from this region felt that their charging infrastructure was inadequate compared with other regions. Respondents from Germany, and South Korea believed charging infrastructure was poorest in their localities.
In contrast, the major public charging infrastructure development by the government authorities in China resulted in more than 35 percent of respondents appreciating the results, while most of the respondents still felt there was room for improvement.
Globally, much of the perception problem lies in the public perceiving their fueling experience similarly to gas or diesel. Early EV adopters have not had this perception problem, but in order to reach mainstream consumers, charging resources need to be more widely distributed. Simply put, this is not a “drive to fuel” model. It is a “fuel where you park” model. And there are examples all over the US and Europe where workplaces, multi-family housing complexes, and retail centers have begun leveraging EVSE deployments to attract certain types of owners and customers.
Again, the consumer research backs this up. 61 percent of respondents globally said they would be more likely to purchase a pure battery electric vehicle if there was a readily available charging station at their workplace. This is especially strong among
10Source: IHS Markit, February 2021
buyers already interested in purchasing an electric vehicle. What will be most interesting is to see if this trend continues in a post COVID-19 world where workplace commutes will be far less common among knowledge workers.
Special Insert: Plug-in Sales Insights & Total Cost of Ownership (TCO)Without demand, there would be no need for the supply – in this case the EVSE or Electric Vehicle Supply Equipment. This section highlights IHS Markit forecasts on electric vehicle sales, and the different usability and economic considerations for customers buying electric vehicles.
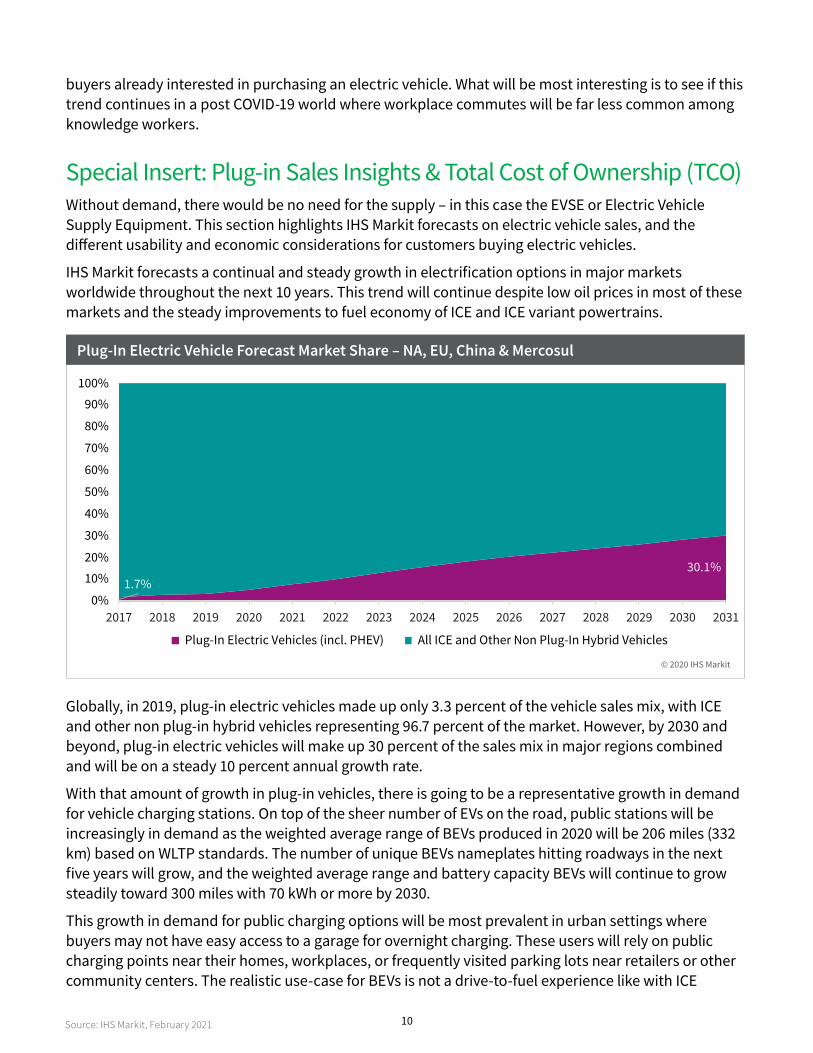
IHS Markit forecasts a continual and steady growth in electrification options in major markets worldwide throughout the next 10 years. This trend will continue despite low oil prices in most of these markets and the steady improvements to fuel economy of ICE and ICE variant powertrains.
Plug-In Electric Vehicle Forecast Market Share – NA, EU, China & Mercosul
© 2020 IHS Markit
1.7%30.1%
0%
10%
20%
30%
40%
50%
60%
70%
80%
90%
100%
2017 2018 2019 2020 2021 2022 2023 2024 2025 2026 2027 2028 2029 2030 2031
Plug-In Electric Vehicles (incl. PHEV) All ICE and Other Non Plug-In Hybrid Vehicles
Globally, in 2019, plug-in electric vehicles made up only 3.3 percent of the vehicle sales mix, with ICE and other non plug-in hybrid vehicles representing 96.7 percent of the market. However, by 2030 and beyond, plug-in electric vehicles will make up 30 percent of the sales mix in major regions combined and will be on a steady 10 percent annual growth rate.
With that amount of growth in plug-in vehicles, there is going to be a representative growth in demand for vehicle charging stations. On top of the sheer number of EVs on the road, public stations will be increasingly in demand as the weighted average range of BEVs produced in 2020 will be 206 miles (332 km) based on WLTP standards. The number of unique BEVs nameplates hitting roadways in the next five years will grow, and the weighted average range and battery capacity BEVs will continue to grow steadily toward 300 miles with 70 kWh or more by 2030.
This growth in demand for public charging options will be most prevalent in urban settings where buyers may not have easy access to a garage for overnight charging. These users will rely on public charging points near their homes, workplaces, or frequently visited parking lots near retailers or other community centers. The realistic use-case for BEVs is not a drive-to-fuel experience like with ICE
11Source: IHS Markit, February 2021
vehicles, but a fuel-where-you-park experience. This trend will highlight the need for a specific mix of Level 2 and DC charging options, based on the housing types and user-base nearby.
Lastly, the increasing demand for economical mobility options is forcing automakers to scale up their EV platforms in order to bring down the price for consumers. Tesla brought EVs to the mainstream automotive world, and still captures a large amount of the luxury car segment. If OEMs like Honda, Nissan, and Volkswagen are to be successful, they must configure options that fit within the economy budgets of their buyers.
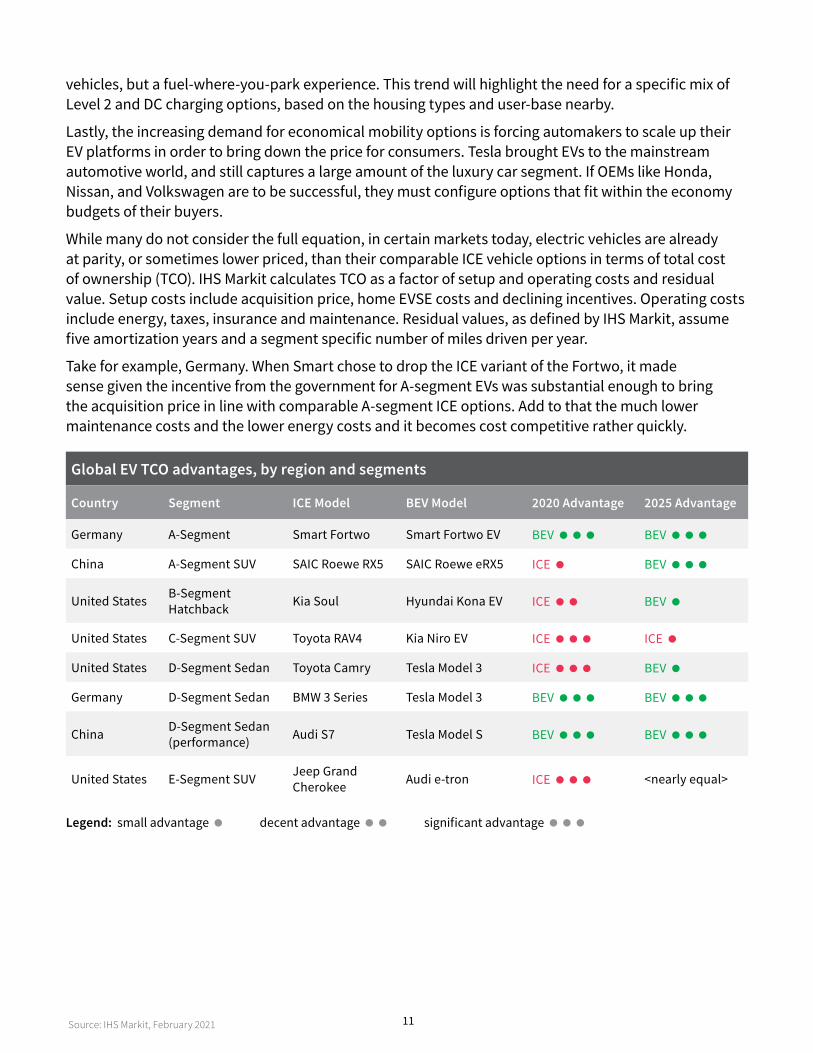
While many do not consider the full equation, in certain markets today, electric vehicles are already at parity, or sometimes lower priced, than their comparable ICE vehicle options in terms of total cost of ownership (TCO). IHS Markit calculates TCO as a factor of setup and operating costs and residual value. Setup costs include acquisition price, home EVSE costs and declining incentives. Operating costs include energy, taxes, insurance and maintenance. Residual values, as defined by IHS Markit, assume five amortization years and a segment specific number of miles driven per year.
Take for example, Germany. When Smart chose to drop the ICE variant of the Fortwo, it made sense given the incentive from the government for A-segment EVs was substantial enough to bring the acquisition price in line with comparable A-segment ICE options. Add to that the much lower maintenance costs and the lower energy costs and it becomes cost competitive rather quickly.
Global EV TCO advantages, by region and segments
Country Segment ICE Model BEV Model 2020 Advantage 2025 Advantage
Germany A-Segment Smart Fortwo Smart Fortwo EV BEV BEV
China A-Segment SUV SAIC Roewe RX5 SAIC Roewe eRX5 ICE BEV
United States B-Segment Hatchback Kia Soul Hyundai Kona EV ICE BEV
United States C-Segment SUV Toyota RAV4 Kia Niro EV ICE ICE
United States D-Segment Sedan Toyota Camry Tesla Model 3 ICE BEV
Germany D-Segment Sedan BMW 3 Series Tesla Model 3 BEV BEV
China D-Segment Sedan (performance) Audi S7 Tesla Model S BEV BEV
United States E-Segment SUV Jeep Grand Cherokee Audi e-tron ICE <nearly equal>
Legend: small advantage decent advantage significant advantage

12Source: IHS Markit, February 2021
When comparing the Kia Soul and Hyundai Kona EV in the B-segment hatchback in the US market, the Kia wins out in 2020 on total cost of ownership by a decent margin over the competitive Hyundai EV. However, fast-forward to 2025, and with the reduction in battery pricing, IHS Markit forecasts EVs in this segment to become more economical than their ICE competition.
As the vehicles get larger and more expensive, the economics begin to favor the EV variants more. Comparing D-segment options in the US and Germany today, the Tesla Model 3 comes out ahead of the BMW 3-Series in TCO yet lags behind the Toyota Camry overall. However, by 2025, not even the Toyota Camry will be able to provide a better total cost value equation than the Model 3.
In performance segments, the cost considerations are already favoring the EVs strongly, as is the case when comparing the Audi S7 with the Tesla Model S in China. The largest factors here are the acquisition costs and insurance. These seriously limit the Audi in comparison to the Tesla. However, TCO is not often a factor for performance vehicle buyers.
The last major segment for EVs to provide a challenge is in full-size SUVs and pick-up trucks. In 2020, there are no viable EV options in these segments to compete with their ICE opponents, though announcements of forthcoming models have been made. The incentives help to bring a vehicle like the Audi e-tron in line with a comparably equipped Jeep Grand Cherokee. However, the insurance and residual values of the e-tron weigh it down heavily. This makes the Jeep’s TCO more compelling today, but by 2025, IHS Markit expects these types of products to hit TCO parity with each other, as luxury manufacturers create better options with better performance and range. In the full-size truck segment, it could take even longer, as the first offerings from GMC Hummer, Rivian, and Tesla will be quite expensive in comparison to a common ICE pickup truck from Ford or RAM.
Ultimately, EVs are coming to market in all shapes and sizes, providing customers more options for electric mobility in the segment and price-class they are familiar with. However, the economics of buying an EV today over its competitive ICE options will vary based upon the segment in question and the regional incentives offered. Additionally, it will take consumers time to carefully consider the TCO calculus, which is an unfamiliar process for most car buyers today.
Regulatory Challenges & The Grid “The biggest challenge is coordination of the various stakeholders.”
This is possibly the most succinct way of describing the problem with eMobility infrastructure. This interviewee went on to describe the challenges that come with organizing and planning for EVSE installations.
For example, in the US there are 49 individual commissions whose mission is to ensure cost prudence and be gatekeepers over this type of infrastructure development. These commissions exist since each state regulates these energy and infrastructure policies differently. On top of that, there are often watch-dog organizations who watch over the commissioners. All this puts pressure on the utilities, and if the utilities do not have approvals from the regulators, then development programs will stall. No wonder coordination of stakeholders is the biggest challenge.
As cities big and small begin to transform their infrastructure to a more connected, digital footprint, the incentives and development projects will help to drive further electric vehicle charging infrastructure. In the public domain, the key factors at play are electrical provisioning at the site, adequate incentives, uniform building codes, and significant planning.

13Source: IHS Markit, February 2021
Meanwhile, the automakers are investing as well. Several OEMs have either developed their own infrastructure or partnered with network operators to grow the base of chargers. Some of the many examples include Volkswagen and its Electrify America program, General Motors and its recent investment the EVGo network, and Ionity, in Europe, and its joint venture ownership between BMW, Mercedes-Benz, Ford, Hyundai, and Volkswagen Group.
Some believe automakers have invested more than their fair share into this market, just to keep this going. As one interviewee mentioned, “There aren’t a lot of other industries where the device maker is required to build the infrastructure. Apple builds phones, but not the network.” While there are not federal or state requirements for automakers to build out the network, it certainly is in their interest to keep the momentum in the industry, so they can continue to sell vehicles.
In regions throughout the world, government incentives have traditionally been more focused on EV sales, than on EVSE network infrastructure development. In addition, the consumer awareness and focus on the incentives seems to have less impact than intended in certain regions.
How aware are you of tax credits and other incentives for owning electric and hybird vehicles?
100%
90%
80%
70%
60%
50%
40%
30%
20%
10%
0%US ChinaGermany South Korea
Source: IHS Markit eMobility Consumer Survey, 2019 © 2019 IHS Markit
■ I am unaware of any incentives regarding owning an electric or hybrid vehicle. ■ I am aware of the benefits, but I have not received them. ■ I've heard about the government credits and have received benefits.
IHS Markit consumer research illustrates this fact. Awareness about the various incentives from the federal government is the highest in China, South Korea. Although most people are aware of such incentives, they have not availed them. This can be attributed to low adoption of EVs and hybrids in these countries. The German respondents have the lowest awareness, though policy changes in Germany might be making a difference there.

14Source: IHS Markit, February 2021
Impact to the gridOne of the biggest unknowns in the industry is that strong growth in electric vehicles will weaken national and regional electricity grids. Although there is some truth to the concern, there is no clear guidance here, only because there has not been enough volume in one specific region test to see if the grid will bend and flex, or simply break. “This is, honestly, a million-dollar question,” said one interviewee, “but for 100 years of growth in electricity demand, we have managed not to break the grid yet.”
In one scenario, the growth of EVs could impact the grid and have detrimental effects on power transmission to other electricity destinations like housing, public works, industry, and more. Furthermore, the increased load from EVs is coupled with a dramatic increase in renewables and is changing the characteristics of loads on the grid. However, this scenario implies that build out of charging stations goes unchecked and is unregulated. Based on the prior section, we can conclude there is almost too much oversight for this to become an issue.
Nevertheless, stakeholders can – and should – work together to create an ecosystem that works for the grid. This is a continual issue with development planning, permitting, and incentive programming, but if cooperation between the various stakeholders improves, then the grid’s future is stable.
More specifically, if the grid becomes an open access point, there could be some long-term effects to supply, resulting in outages. If the distribution side is left ignored, there will be issues in normalizing the load when demand is highest. However, there is a lot of focus from the ecosystem players to design an intelligent grid that works from the top-down and the bottom-up.
15Source: IHS Markit, February 2021
Some of the novel solutions to this problem include time-of-use charging, demand-response methods, employing renewable energy technologies, building bi-directionality into the vehicles and charging stations, compatibility of charging networks, and incentivizing consumers and fleet managers to be active in sharing their charging stats. These are both technical and non-technical solutions that will enable EVs to become a living, dynamic part of the electric grid, versus an endpoint that simply consumes energy.
Industry PerspectivesIHS Markit conducted many industry interviews during the process of this research, surveying respondents over the last six months. The personas included high-ranking executives and engineers from OEMs, suppliers, and charging network operators. The following section highlights some of the key verbatim comments captured during the research.
All the respondents generally agreed that non-technical issues remain the highest barriers for eMobility infrastructure development. Many of these conclusions have been highlighted throughout the report already.
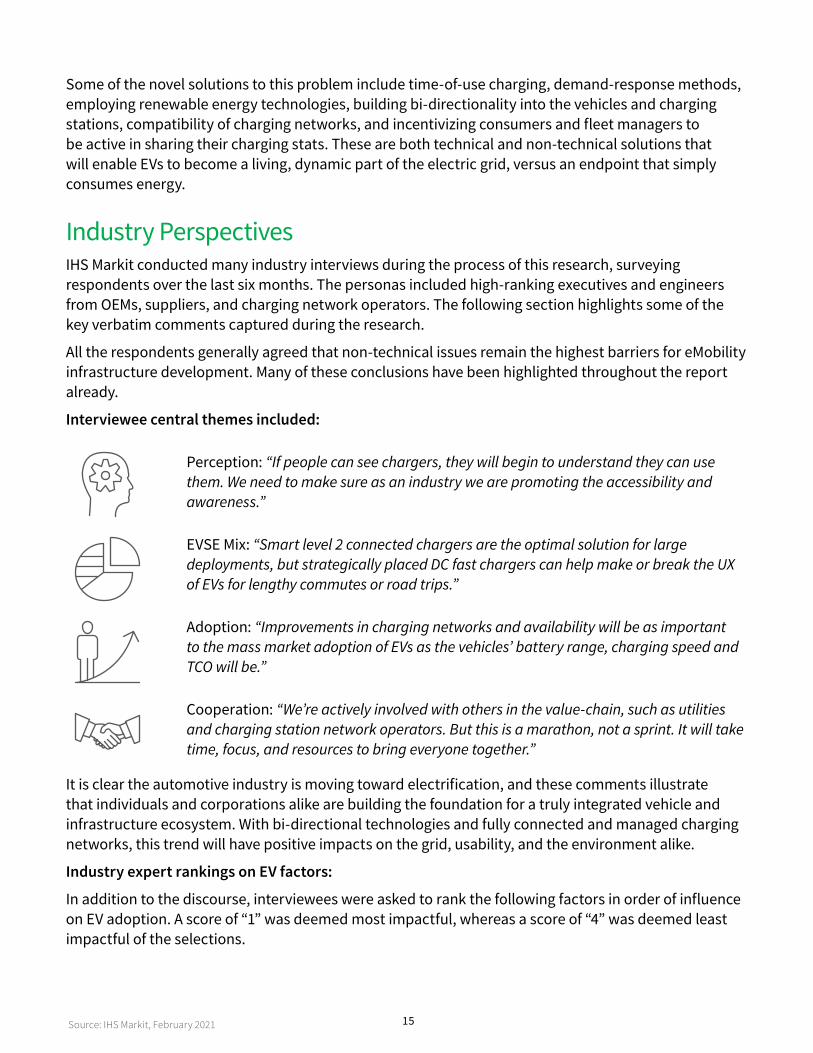
Interviewee central themes included:
Perception: “If people can see chargers, they will begin to understand they can use them. We need to make sure as an industry we are promoting the accessibility and awareness.”
EVSE Mix: “Smart level 2 connected chargers are the optimal solution for large deployments, but strategically placed DC fast chargers can help make or break the UX of EVs for lengthy commutes or road trips.”
Adoption: “Improvements in charging networks and availability will be as important to the mass market adoption of EVs as the vehicles’ battery range, charging speed and TCO will be.”
Cooperation: “We’re actively involved with others in the value-chain, such as utilities and charging station network operators. But this is a marathon, not a sprint. It will take time, focus, and resources to bring everyone together.”
It is clear the automotive industry is moving toward electrification, and these comments illustrate that individuals and corporations alike are building the foundation for a truly integrated vehicle and infrastructure ecosystem. With bi-directional technologies and fully connected and managed charging networks, this trend will have positive impacts on the grid, usability, and the environment alike.
Industry expert rankings on EV factors:
In addition to the discourse, interviewees were asked to rank the following factors in order of influence on EV adoption. A score of “1” was deemed most impactful, whereas a score of “4” was deemed least impactful of the selections.

16Source: IHS Markit, February 2021
Charging availability
• Ranked “1” (highest) across all respondents
• Illustrates that the need for highly-visible, networked charging stations is still under-developed.
Pricing & incentives
• Tied for second place, averaged among respondents
• In addition to the TCO calculations, this is further evidence that costs need to come down to gain broader support.
Charging speed
• Tied for second place, averaged among respondents
• The debate on AC vs. DC will continue, and the industry should strive for faster charging solutions to meet customer expectations.
Charging reliability
• Ranked lowest, averaged among respondents
• While outages can create problems for users, reliability seems to be meeting customer demands at this point.
Among the rankings, the experts put high importance of charging availability as a major influencing factor toward EV adoption and growth. This is echoed in the 2019 IHS Markit consumer survey data referenced previously and the verbatim commentary that defines the need for more EVSE as a leading force for EV sales growth.
It is interesting that pricing, incentives and charging speed all come in as secondary influencers to the adoption of EVs. Many OEMs have put a lot of effort into scaling EVs in order to bring down their price to the mass market consumer. Yet, many have also invested in the growth of DC Fast Charging solutions to run parallel to the scale of their model lineup.
This point identifies that after the charging infrastructure gap, many other factors need to be considered. Fortunately, this shows the industry is focused on all remaining factors holistically. The alternative is ignoring some factors in order to reach a minimum viable product. If the latter were to occur, we would see usability issues arise, product dissatisfaction grow, and disloyalty to the EV powertrain design.
Lastly, it is encouraging that charging reliability was listed lowest among the four major influencing factors. This indicates that the industry has proven the hardware is robust. Furthermore, the connected services offerings in the EV infrastructure market have proven their ability to flex with demand trends.

17Source: IHS Markit, February 2021
Conclusions and Future OutlookThis report has defined the biggest challenges facing the deployment of EV infrastructure, and it has supported those definitions with data from industry expert testimony and IHS Markit forecasts. As the automotive industry grapples with the ever-increasing electrification of the fleet, it will continue to invest time, resources, and technology to ensure the eMobility infrastructure is equipped to handle the demand.
Looking to the future, though, there is a long list of externalities that can accelerate or hinder the momentum in the industry to date. These include political agendas, economic shifts, globalization (or the breakdown of it), unknown innovations from disruptors, and a constantly changing consumer landscape.
Taking these into account is not trivial, as the industry faces more transformation now than it has in the past the century. Electrified mobility is not only changing vehicle engineering, but also business models and the consumer experience. The infrastructure that supports the growth in EVs will be as important as the new vehicles themselves, and now as the industry looks to pivot, education and cooperation will critical to make electrified mobility a reality for all.
By IHS Markit; prepared for and commissioned by Eaton | February 2021
About IHS MarkitIHS Markit (NYSE: INFO) is a world leader in critical information, analytics and expertise to forge solutions for the major industries and markets that drive economies worldwide. The company delivers next-generation information, analytics and solutions to customers in business, finance and government, improving their operational efficiency and providing deep insights that lead to well-informed, confident decisions. IHS Markit has more than 50,000 business and government customers, including 80 percent of the Fortune Global 500 and the world’s leading financial institutions. Headquartered in London, IHS Markit is committed to sustainable, profitable growth.
Copyright © 2021 IHS Markit. All Rights Reserved 593698828-0221-CU
CUSTOMER CARE
NORTH AND SOUTH AMERICA T +1 800 447 2273 +1 303 858 6187 (Outside US/Canada)
EUROPE, MIDDLE EAST AND AFRICAT +44(0) 134 432 8300
ASIA PACIFICT +604 291 3600
JAPANT +81 3 6262 1887
DisclaimerThe IHS Markit data and information referenced herein (the “IHS Markit Materials”) are the copyrighted property and of IHS Markit Ltd. and its subsidiaries (“IHS Markit”) and represent data, research, or opinions of IHS Markit, and are not representations of fact. The information and opinions expressed in the IHS Markit Materials are subject to change without notice and IHS Markit has no duty or responsibility to update the IHS Markit Materials. Moreover, while the IHS Markit Materials reproduced herein are from sources considered reliable, the accuracy and completeness thereof are not warranted. IHS Markit makes no representation or warranty of any kind, express or implied, regarding the contents or data herein. Nothing in this document constitutes or is intended to constitute financial advice in any way whatsoever. Data and information shall not be relied upon for any investment activities.


![Emobility remote access services clientcurrent[1]](https://img.pdfslide.us/doc/110x75/554c0894b4c9058e098b54cd/emobility-remote-access-services-clientcurrent1.jpg)