Embed Size (px)
Citation preview
TTRRAANNSSIITTIIOONN BBIINNDDEERR
2013
.
Page 1 EDU-2013-00071 - PHASE 1
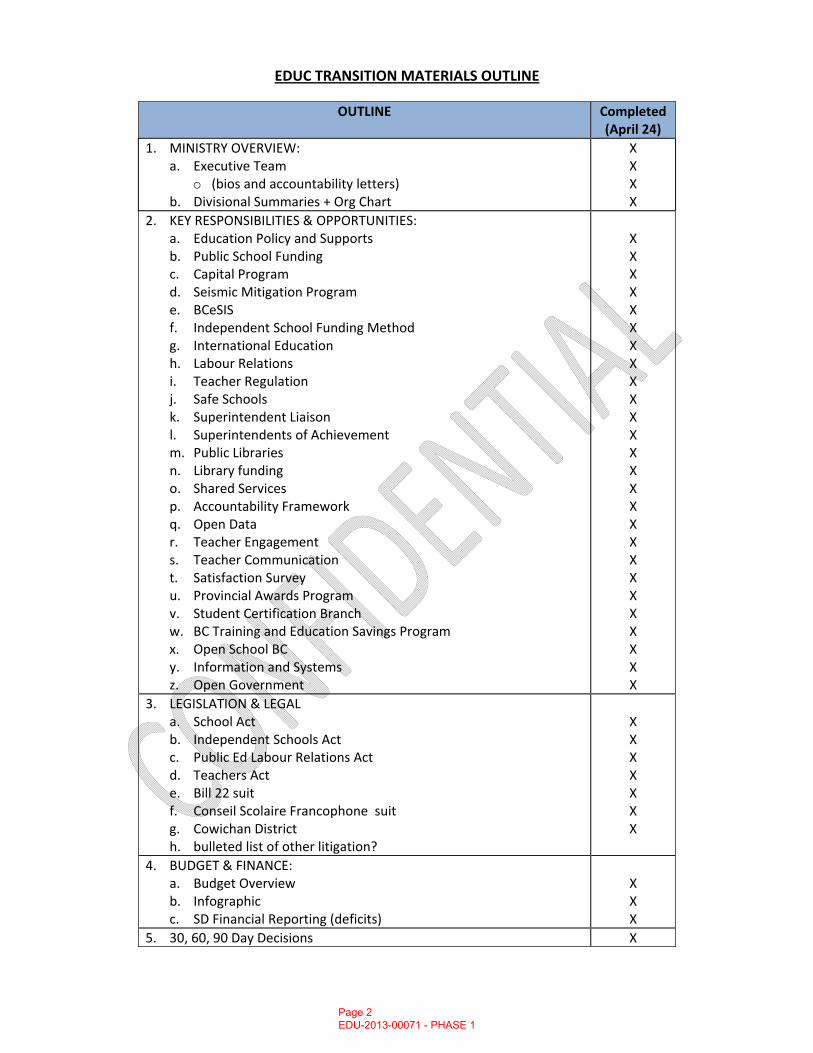
EDUC TRANSITION MATERIALS OUTLINE
OUTLINE Completed (April 24)
1. MINISTRY OVERVIEW: a. Executive Team
o (bios and accountability letters) b. Divisional Summaries + Org Chart
X X X X
2. KEY RESPONSIBILITIES & OPPORTUNITIES: a. Education Policy and Supports b. Public School Funding c. Capital Program d. Seismic Mitigation Program e. BCeSIS f. Independent School Funding Method g. International Education h. Labour Relations i. Teacher Regulation j. Safe Schools k. Superintendent Liaison l. Superintendents of Achievement m. Public Libraries n. Library funding o. Shared Services p. Accountability Framework q. Open Data r. Teacher Engagement s. Teacher Communication t. Satisfaction Survey u. Provincial Awards Program v. Student Certification Branch w. BC Training and Education Savings Program x. Open School BC y. Information and Systems z. Open Government
X X X X X X X X X X X X X X X X X X X X X X X X X X
3. LEGISLATION & LEGAL a. School Act b. Independent Schools Act c. Public Ed Labour Relations Act d. Teachers Act e. Bill 22 suit f. Conseil Scolaire Francophone suit g. Cowichan District h. bulleted list of other litigation?
X X X X X X X
4. BUDGET & FINANCE: a. Budget Overview b. Infographic c. SD Financial Reporting (deficits)
X X X
5. 30, 60, 90 Day Decisions X
Page 2 EDU-2013-00071 - PHASE 1
OUTLINE Completed
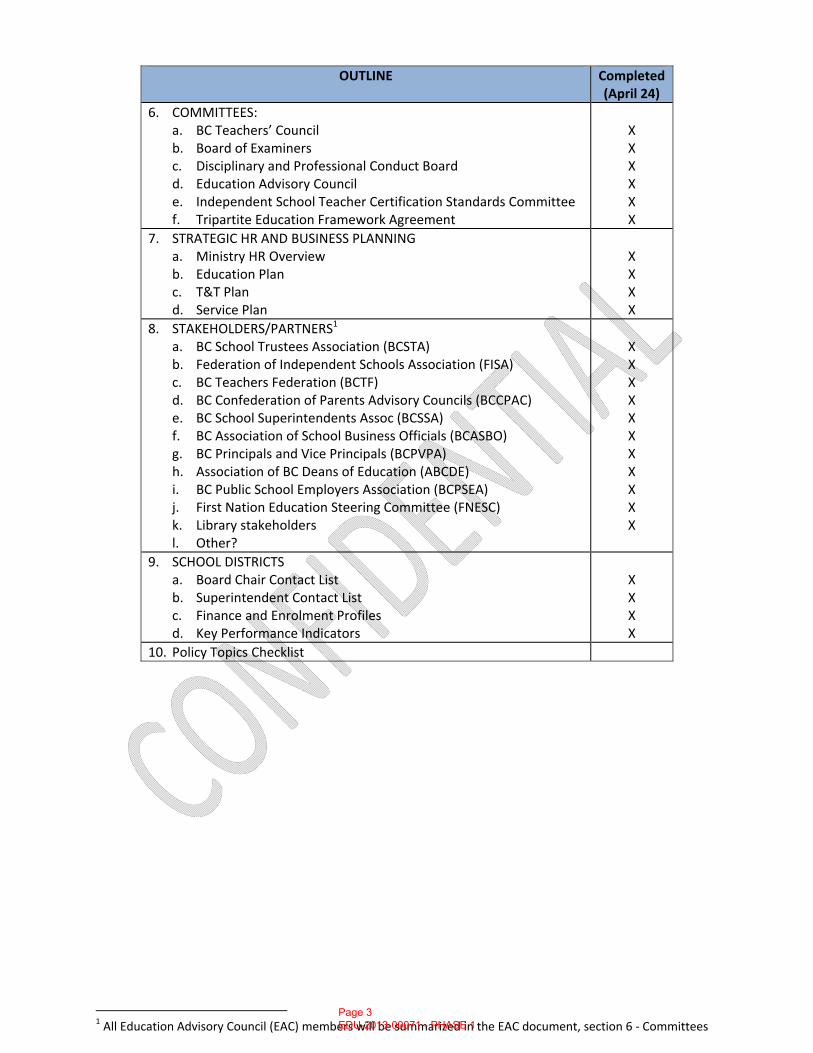
(April 24) 6. COMMITTEES:
a. BC Teachers’ Council b. Board of Examiners c. Disciplinary and Professional Conduct Board d. Education Advisory Council e. Independent School Teacher Certification Standards Committee f. Tripartite Education Framework Agreement
X X X X X X
7. STRATEGIC HR AND BUSINESS PLANNING a. Ministry HR Overview b. Education Plan c. T&T Plan d. Service Plan
X X X X
8. STAKEHOLDERS/PARTNERS1 a. BC School Trustees Association (BCSTA) b. Federation of Independent Schools Association (FISA) c. BC Teachers Federation (BCTF) d. BC Confederation of Parents Advisory Councils (BCCPAC) e. BC School Superintendents Assoc (BCSSA) f. BC Association of School Business Officials (BCASBO) g. BC Principals and Vice Principals (BCPVPA) h. Association of BC Deans of Education (ABCDE) i. BC Public School Employers Association (BCPSEA) j. First Nation Education Steering Committee (FNESC) k. Library stakeholders l. Other?
X X X X X X X X X X X
9. SCHOOL DISTRICTS a. Board Chair Contact List b. Superintendent Contact List c. Finance and Enrolment Profiles d. Key Performance Indicators
X X X X
10. Policy Topics Checklist
1 All Education Advisory Council (EAC) members will be summarized in the EAC document, section 6 ‐ Committees
Page 3 EDU-2013-00071 - PHASE 1
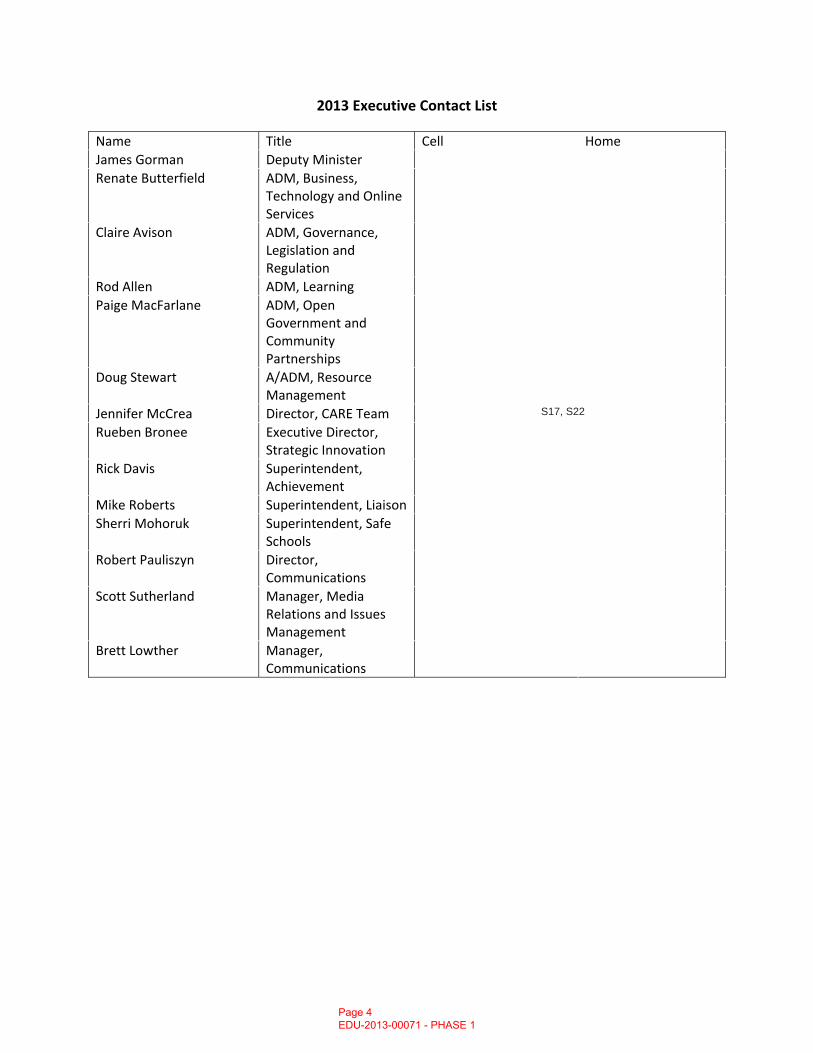
2013 Executive Contact List
Name Title Cell Home James Gorman Deputy Minister Renate Butterfield ADM, Business,
Technology and Online Services
Claire Avison ADM, Governance, Legislation and Regulation
Rod Allen ADM, Learning Paige MacFarlane ADM, Open
Government and Community Partnerships
Doug Stewart A/ADM, Resource Management
Jennifer McCrea Director, CARE Team Rueben Bronee Executive Director,
Strategic Innovation Rick Davis Superintendent,
Achievement Mike Roberts Superintendent, Liaison Sherri Mohoruk Superintendent, Safe
Schools Robert Pauliszyn Director,
Communications Scott Sutherland Manager, Media
Relations and Issues Management
Brett Lowther Manager, Communications
Page 4 EDU-2013-00071 - PHASE 1
S17, S22
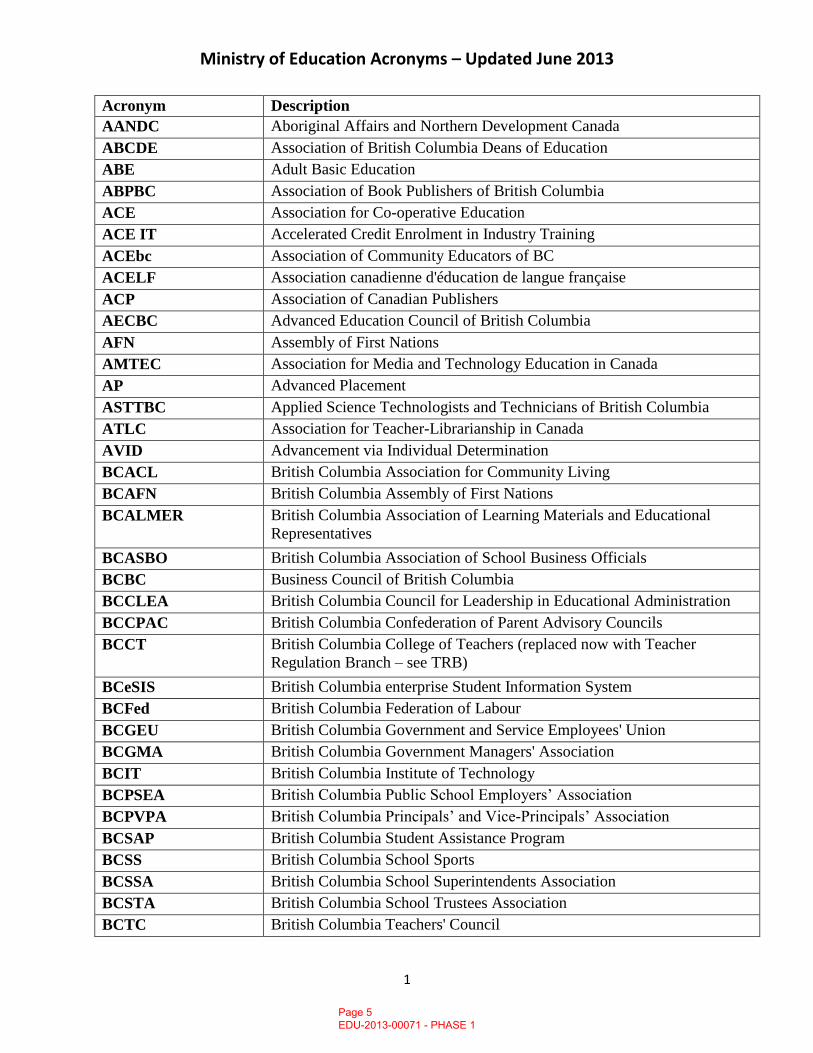
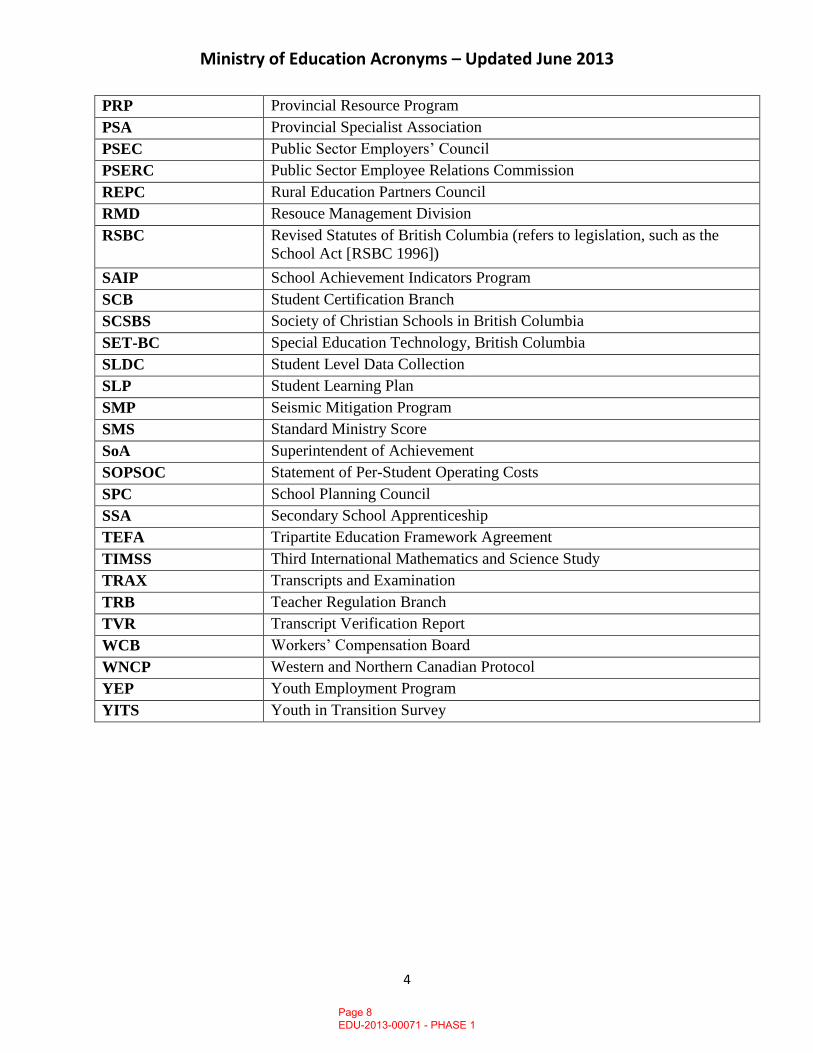
Ministry of Education Acronyms – Updated June 2013
1
Acronym Description
AANDC Aboriginal Affairs and Northern Development Canada
ABCDE Association of British Columbia Deans of Education
ABE Adult Basic Education
ABPBC Association of Book Publishers of British Columbia
ACE Association for Co-operative Education
ACE IT Accelerated Credit Enrolment in Industry Training
ACEbc Association of Community Educators of BC
ACELF Association canadienne d'éducation de langue française
ACP Association of Canadian Publishers
AECBC Advanced Education Council of British Columbia
AFN Assembly of First Nations
AMTEC Association for Media and Technology Education in Canada
AP Advanced Placement
ASTTBC Applied Science Technologists and Technicians of British Columbia
ATLC Association for Teacher-Librarianship in Canada
AVID Advancement via Individual Determination
BCACL British Columbia Association for Community Living
BCAFN British Columbia Assembly of First Nations
BCALMER British Columbia Association of Learning Materials and Educational
Representatives
BCASBO British Columbia Association of School Business Officials
BCBC Business Council of British Columbia
BCCLEA British Columbia Council for Leadership in Educational Administration
BCCPAC British Columbia Confederation of Parent Advisory Councils
BCCT British Columbia College of Teachers (replaced now with Teacher
Regulation Branch – see TRB)
BCeSIS British Columbia enterprise Student Information System
BCFed British Columbia Federation of Labour
BCGEU British Columbia Government and Service Employees' Union
BCGMA British Columbia Government Managers' Association
BCIT British Columbia Institute of Technology
BCPSEA British Columbia Public School Employers’ Association
BCPVPA British Columbia Principals’ and Vice-Principals’ Association
BCSAP British Columbia Student Assistance Program
BCSS British Columbia School Sports
BCSSA British Columbia School Superintendents Association
BCSTA British Columbia School Trustees Association
BCTC British Columbia Teachers' Council
Page 5 EDU-2013-00071 - PHASE 1
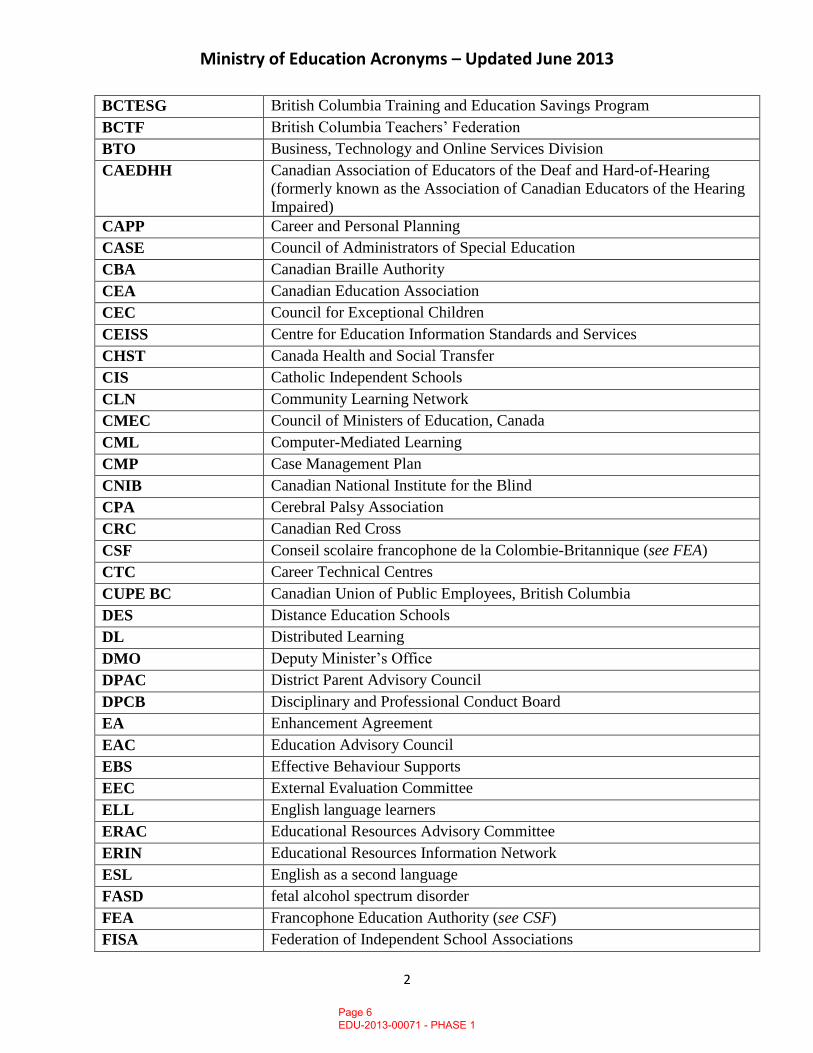
Ministry of Education Acronyms – Updated June 2013
2
BCTESG British Columbia Training and Education Savings Program
BCTF British Columbia Teachers’ Federation
BTO Business, Technology and Online Services Division
CAEDHH Canadian Association of Educators of the Deaf and Hard-of-Hearing
(formerly known as the Association of Canadian Educators of the Hearing
Impaired)
CAPP Career and Personal Planning
CASE Council of Administrators of Special Education
CBA Canadian Braille Authority
CEA Canadian Education Association
CEC Council for Exceptional Children
CEISS Centre for Education Information Standards and Services
CHST Canada Health and Social Transfer
CIS Catholic Independent Schools
CLN Community Learning Network
CMEC Council of Ministers of Education, Canada
CML Computer-Mediated Learning
CMP Case Management Plan
CNIB Canadian National Institute for the Blind
CPA Cerebral Palsy Association
CRC Canadian Red Cross
CSF Conseil scolaire francophone de la Colombie-Britannique (see FEA)
CTC Career Technical Centres
CUPE BC Canadian Union of Public Employees, British Columbia
DES Distance Education Schools
DL Distributed Learning
DMO Deputy Minister’s Office
DPAC District Parent Advisory Council
DPCB Disciplinary and Professional Conduct Board
EA Enhancement Agreement
EAC Education Advisory Council
EBS Effective Behaviour Supports
EEC External Evaluation Committee
ELL English language learners
ERAC Educational Resources Advisory Committee
ERIN Educational Resources Information Network
ESL English as a second language
FASD fetal alcohol spectrum disorder
FEA Francophone Education Authority (see CSF)
FISA Federation of Independent School Associations
Page 6 EDU-2013-00071 - PHASE 1
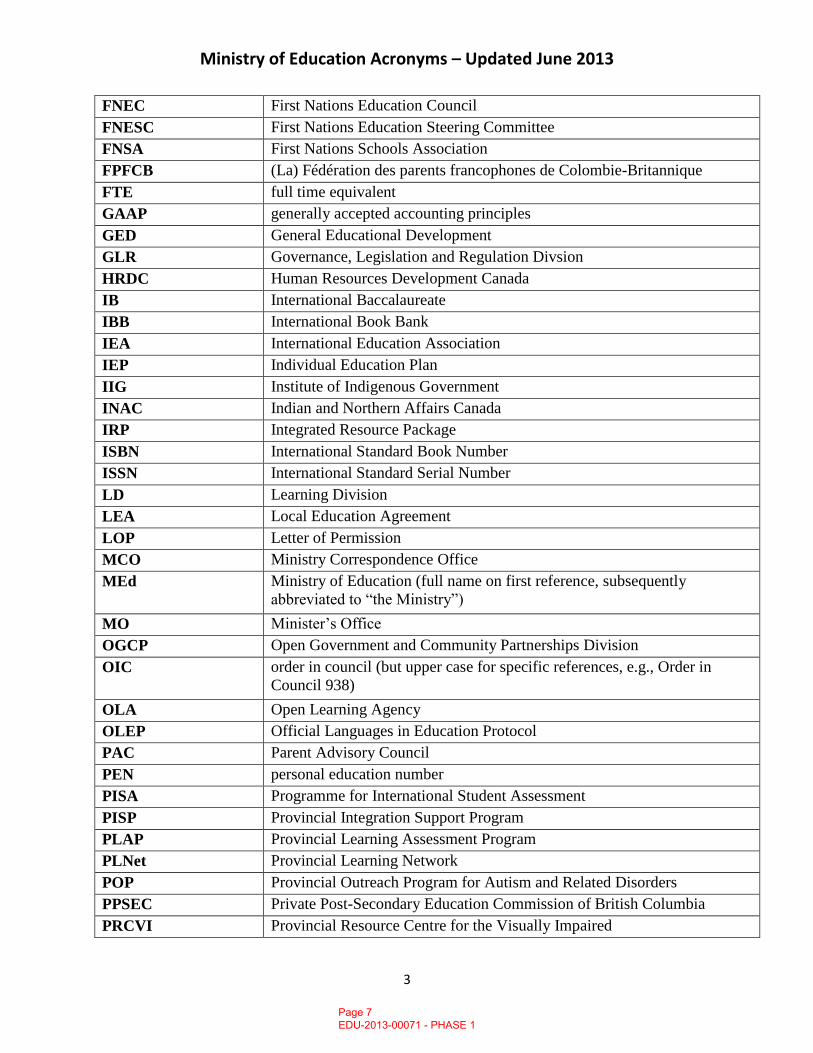
Ministry of Education Acronyms – Updated June 2013
3
FNEC First Nations Education Council
FNESC First Nations Education Steering Committee
FNSA First Nations Schools Association
FPFCB (La) Fédération des parents francophones de Colombie-Britannique
FTE full time equivalent
GAAP generally accepted accounting principles
GED General Educational Development
GLR Governance, Legislation and Regulation Divsion
HRDC Human Resources Development Canada
IB International Baccalaureate
IBB International Book Bank
IEA International Education Association
IEP Individual Education Plan
IIG Institute of Indigenous Government
INAC Indian and Northern Affairs Canada
IRP Integrated Resource Package
ISBN International Standard Book Number
ISSN International Standard Serial Number
LD Learning Division
LEA Local Education Agreement
LOP Letter of Permission
MCO Ministry Correspondence Office
MEd Ministry of Education (full name on first reference, subsequently
abbreviated to “the Ministry”)
MO Minister’s Office
OGCP Open Government and Community Partnerships Division
OIC order in council (but upper case for specific references, e.g., Order in
Council 938)
OLA Open Learning Agency
OLEP Official Languages in Education Protocol
PAC Parent Advisory Council
PEN personal education number
PISA Programme for International Student Assessment
PISP Provincial Integration Support Program
PLAP Provincial Learning Assessment Program
PLNet Provincial Learning Network
POP Provincial Outreach Program for Autism and Related Disorders
PPSEC Private Post-Secondary Education Commission of British Columbia
PRCVI Provincial Resource Centre for the Visually Impaired
Page 7 EDU-2013-00071 - PHASE 1
Ministry of Education Acronyms – Updated June 2013
4
PRP Provincial Resource Program
PSA Provincial Specialist Association
PSEC Public Sector Employers’ Council
PSERC Public Sector Employee Relations Commission
REPC Rural Education Partners Council
RMD Resouce Management Division
RSBC Revised Statutes of British Columbia (refers to legislation, such as the
School Act [RSBC 1996])
SAIP School Achievement Indicators Program
SCB Student Certification Branch
SCSBS Society of Christian Schools in British Columbia
SET-BC Special Education Technology, British Columbia
SLDC Student Level Data Collection
SLP Student Learning Plan
SMP Seismic Mitigation Program
SMS Standard Ministry Score
SoA Superintendent of Achievement
SOPSOC Statement of Per-Student Operating Costs
SPC School Planning Council
SSA Secondary School Apprenticeship
TEFA Tripartite Education Framework Agreement
TIMSS Third International Mathematics and Science Study
TRAX Transcripts and Examination
TRB Teacher Regulation Branch
TVR Transcript Verification Report
WCB Workers’ Compensation Board
WNCP Western and Northern Canadian Protocol
YEP Youth Employment Program
YITS Youth in Transition Survey
Page 8 EDU-2013-00071 - PHASE 1
Page 1 of 14
MINISTRY PROFILE
Ministry: Ministry of Education
Ministry Mandate: The Ministry of Education provides leadership and support to the Kindergarten to Grade 12 (K-12) education system through governance, legislation, policy, and standards, and it is accountable to the public through the monitoring of student performance and reporting results. The Ministry of Education co-governs the K–12 system with boards of education and independent school authorities. The Ministry also has responsibility for literacy, early learning, and public libraries.
The purpose of the K-12 system is to enable all learners to become literate, to develop their individual potential and to acquire the knowledge, skills and attitudes needed to contribute to a healthy, democratic and pluralistic society and a prosperous and sustainable economy. Working collaboratively with its partners, the Ministry is helping to build an even stronger education system that better meets the needs of the 21st century and will ensure that B.C.’s children are prepared for the workforce of today, and in the future.
The Ministry is comprised of five divisions and supported by field support, Strategic Human Resources and Safe Schools.
The Learning Division is responsible for providing leadership and support to school districts in the areas of Aboriginal Education, Curriculum and Assessment, Diversity and Equity, the Early Years, Transition Years, French Programs, and e-Learning.
The Governance, Legislation and Regulation Division is responsible for legislation, independent schools, international education, teacher regulation, governance policy for K–12 public and independent education, and sector labour relations.
The Resource Management Division provides operational and capital funding for school districts and monitors financial accountability and compliance of boards of education. The Division also provides a wide range of financial support services to the Ministry.
The Business, Technology and Online Services Division houses the Ministry’s service centre for the K-12 sector and the public, establishes and oversees ongoing operations related to the provincial Student Information System (BCeSIS), is actively engaged with the sector to review and implement aspects of shared services, houses the Information Technology Management Branch (ITMB), and Open School BC.
Page 9 EDU-2013-00071 - PHASE 1
Page 2 of 14
The Open Government and Community Partnerships Division (OGCP) has three key priorities: open government, community partnerships and accountability. It leads the Ministry's open government approach, and supports education transformation by leveraging open government principles of transparency, collaboration and participation to involve and engage the public in policy development.
Budget: Program Administration: $ 17,460,000 Grants: $ 5,263,758,000 Salaries/Benefits: $ 23,103,000 Minister’s Office: $ 565,000 Amortization, Communication and Other $ 3,752,000 Total $ 5,308,638,000
Full Time Equivalents (FTEs)*: Minister’s Office 4.7 Deputy Minister’s Office 3.0 Learning 57.1 Governance, Legislation & Regulation 65.4 Business, Technology & Online Services 83.5 Open Government and Community Partnerships 55.0 Resource Management 40.3 Liaison/ Safe Schools/Teacher Quality 4.6 CARE Team 5.9 Total FTEs 319.6
Source: Financial Services Branch, 2012/13 FTE Report as at March 31, 2013.
Page 10 EDU-2013-00071 - PHASE 1
Page 3 of 14
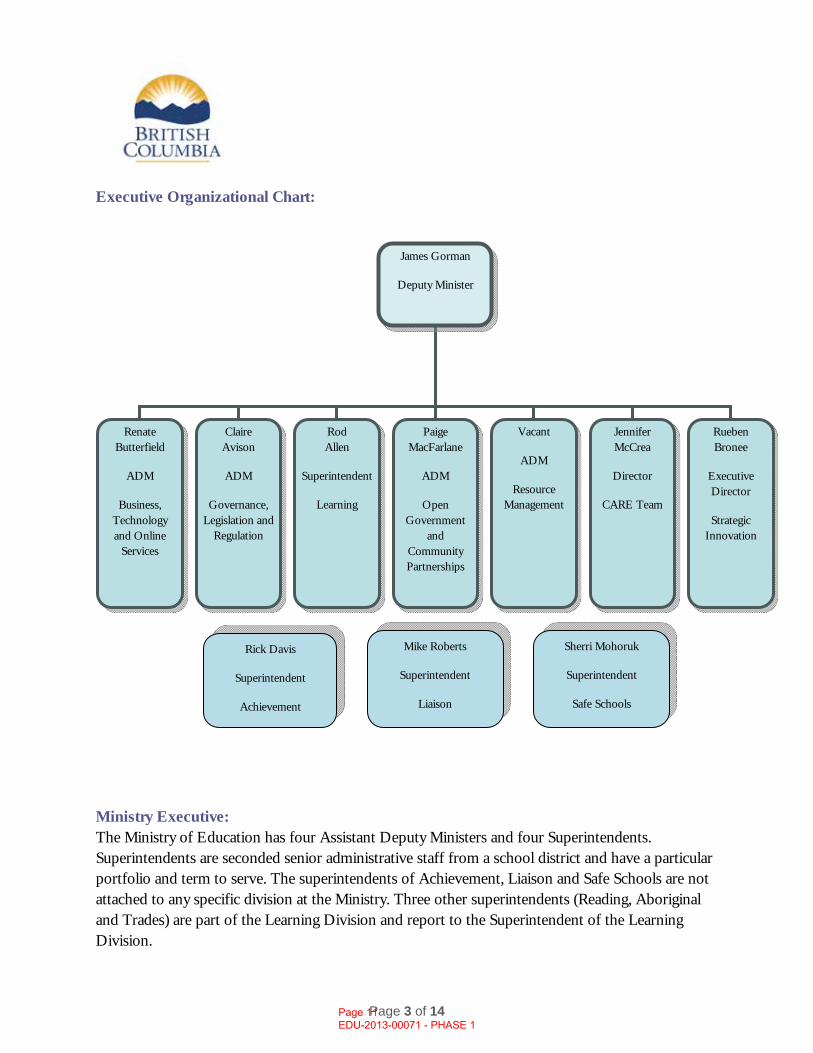
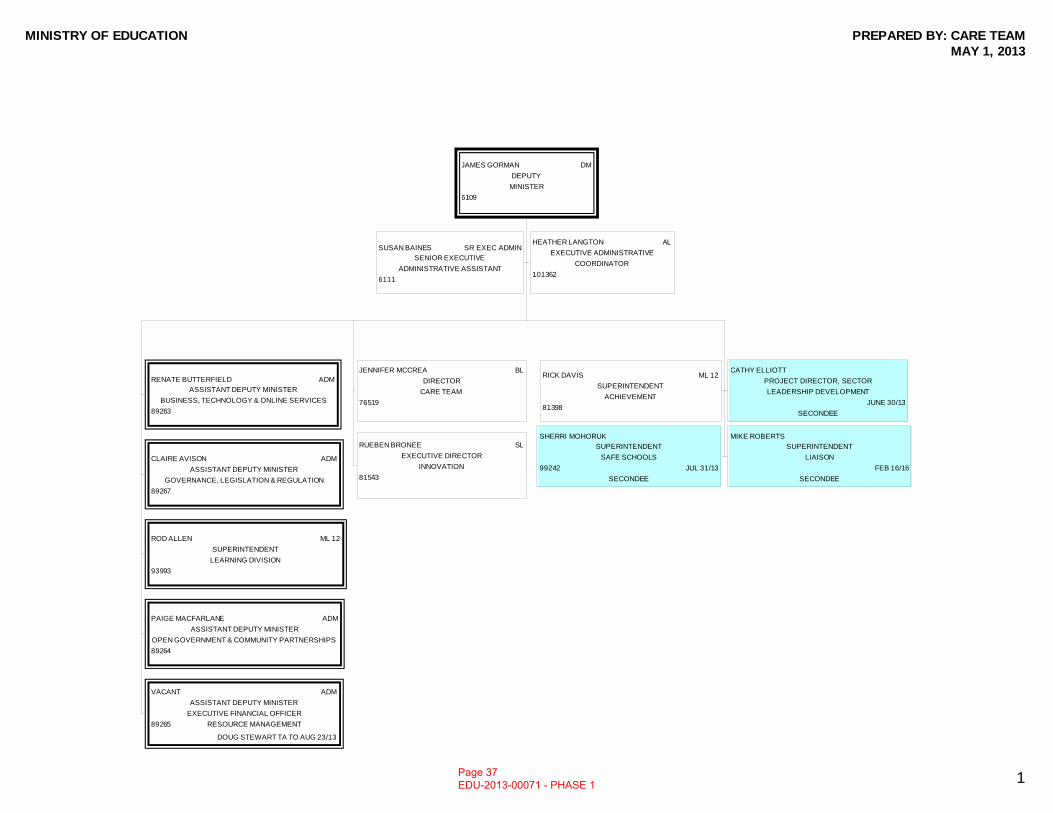
Executive Organizational Chart:
Ministry Executive: The Ministry of Education has four Assistant Deputy Ministers and four Superintendents. Superintendents are seconded senior administrative staff from a school district and have a particular portfolio and term to serve. The superintendents of Achievement, Liaison and Safe Schools are not attached to any specific division at the Ministry. Three other superintendents (Reading, Aboriginal and Trades) are part of the Learning Division and report to the Superintendent of the Learning Division.
James Gorman
Deputy Minister
Renate Butterfield
ADM
Business, Technology and Online
Services
Claire Avison
ADM
Governance, Legislation and
Regulation
Rod Allen
Superintendent
Learning
Paige MacFarlane
ADM
Open Government
and Community Partnerships
Vacant
ADM
Resource Management
Jennifer McCrea
Director
CARE Team
Rueben Bronee
Executive Director
Strategic Innovation
Rick Davis
Superintendent
Achievement
Mike Roberts
Superintendent
Liaison
Sherri Mohoruk
Superintendent
Safe Schools
Page 11 EDU-2013-00071 - PHASE 1
Page 4 of 14
EXECUTIVE MEMBER BIOGRAPHY
JAMES GORMAN
DEPUTY MINISTER
James Gorman joined the BC Public Service in 1995 as a Research Officer with what was then the Ministry of Employment and Investment. Prior to his appointment as Deputy Minister of Education in January 2008, he served as Deputy Minister of the BC Public Service Agency and Assistant Deputy Minister and Executive Financial Officer at the Ministry of Children and Family Development. James also held senior management positions with the Ministry of Advanced Education, Partnerships BC, and Treasury Board staff in the Ministry of Finance.James holds a master’s degree in political science from McGill University and bachelor’s degree from the University of British Columbia.
Page 12 EDU-2013-00071 - PHASE 1
Page 5 of 14
EXECUTIVE MEMBER BIOGRAPHY
RENATE BUTTERFIELD
ASSISTANT DEPUTY MINISTER
BUSINESS, TECHNOLOGY AND ONLINE SERVICES DIVISION
Renate has been the Assistant Deputy Minister for the Business, Technology & Online Services Division since November 2006. She leads the program area that is responsible for B.C.’s virtual school: LearnNowBC. Students across the province benefit from its wide range of online course choices, as well as online services, such as academic counselling, tutoring, and AskAway, which is a live, chat based system that connects users with libraries offering immediate, interactive, and knowledgeable help.
In addition, she oversees Open School BC (OSBC) Canada's first correspondence school serving remote learners in all part of BC and the Yukon Territories. Now part of the Business, Technology & Online Services Division, OSBC develops and delivers print and digital content, and award-winning multimedia for both the public school system and the broader public sector. OSBC provides e-learning services to over 25,000 users in 23 school districts.
Renate is also responsible for assessing and reporting on K–12 student achievement. Her portfolio includes implementation and support for the province’s electronic student information system BCeSIS, provincial scholarships and awards, the BC graduation program, and all of the Ministry’s data collection activities.
She has a strong technology team that provides information management and information technology leadership to the BC Public Service Agency, the education sector, and the Ministry of Education, school authorities and post secondary institutions.
Renate has a solid change management and information technology background. She has held senior positions in a variety of sectors, including finance, health, community and social services, and education. Renate has an Honours Bachelor of Science degree from the University of Toronto.
Page 13 EDU-2013-00071 - PHASE 1
Page 6 of 14
EXECUTIVE MEMBER BIOGRAPHY
CLAIRE AVISON
ASSISTANT DEPUTY MINISTER
GOVERNANCE, LEGISLATION AND REGULATION DIVISION
Claire Avison joined the BC Public Service in 2001, working in the Ministry of Health for 5 years before moving to the Ministry of Education in 2006 where she has undertaken responsibility for a broad range of policy matters over the course of the last 7 years. These have included a two year term as the Executive Director responsible for the national consortium for school health and, subsequently a lead role in healthy schools, Neighborhood Learning Centers and CommunityLink initiatives.
In 2010 Claire began work with the Deputy Minister and ministry executive to ensure policy alignment within the K-12 sector's transformation initiatives. This was followed by her appointment as Assistant Deputy Minister, Governance, Legislation and Regulation on an acting basis in 2011. She was confirmed in that position in 2012. Her current responsibilities include governance and legislation, teacher regulation, international education, independent schools and labour relations. In this latter capacity she is a member of the Board of the B.C. Public Schools Employers Association.
Page 14 EDU-2013-00071 - PHASE 1
Page 7 of 14
EXECUTIVE MEMBER BIOGRAPHY
ROD ALLEN
SUPERINTENDENT OF LEARNING
LEARNING DIVISION
The Learning Division within the Ministry of Education is responsible for providing leadership and support to school districts in the areas of Aboriginal Education, Curriculum and Assessment, Diversity and Equity, French Programs and International Languages, the Early Years and E-Learning. With all of these areas working together in an aligned, coherent manner, we are well placed to provide each learner in B.C. with an excellent educational experience allowing them to succeed at the highest levels. Through a series of transformation initiatives in areas such as reading, special education, and assessment, the Learning Division promotes personalized learning based on strong basic skills and competencies, choice and flexibility, and student engagement.
Rod Allen is Superintendent of Learning, a position he was appointed to in January 2008. In May 2011 he assumed an Assistant Deputy Minister position, and is responsible for leading the Learning Division and has a central role in British Columbia’s transformation to personalized learning. Rod is actively involved in the Global Education Leadership Program, along with 15 other international jurisdictions. Prior to this he was Superintendent of Schools in British Columbia’s School District 54 (Bulkley Valley). Rod has taught at most grade levels in British Columbia, where he advanced through school and district leadership positions.
He received his undergraduate degree, teaching qualification, and master’s degree in education administration from the University of Victoria.
Page 15 EDU-2013-00071 - PHASE 1

Page 8 of 14
EXECUTIVE MEMBER BIOGRAPHY
PAIGE MACFARLANE
ASSISTANT DEPUTY MINISTER
OPEN GOVERNMENT AND COMMUNITY PARTNERSHIPS DIVISION
Paige MacFarlane leads the ministry’s Open Government and Community Partnerships Division. OGCP supports the transformation of education by leveraging open government principles of transparency, collaboration and participation to involve and engage the public in policy development.
The ministry's accountability, information and reporting functions are housed within OGCP and provide evidence and data to support transformation of both the education and library sectors; within the ministry and in the field.
Paige and her team work to ensure the Ministry’s priorities are coordinated both internally and externally with other ministries, agencies and jurisdictions to advance the Ministry’s service plan objectives and ensure alignment with Government’s strategic plan.
Her professional background is in communications and media. She holds a Certificate in Public Relations from the University of Victoria and the Canadian Public Relations Society, a Diploma in Broadcast Journalism from the BC Institute of Technology, and a degree in sociology from the University of Victoria.
Paige has been a member of the BC Public Service since 1997, working in several ministries including Finance; Small Business, Tourism and Culture; and Management Services. She was appointed Assistant Deputy Minister in November 2006.
Page 16 EDU-2013-00071 - PHASE 1
Page 9 of 14
EXECUTIVE MEMBER BIOGRAPHY
VACANT
ASSISTANT DEPUTY MINISTER
RESOURCE MANAGEMENT DIVISION
Page 17 EDU-2013-00071 - PHASE 1
Page 10 of 14
EXECUTIVE MEMBER BIOGRAPHY
JENNIFER MCCREA
DIRECTOR, CARE TEAM
Jennifer McCrea joined the BC Public Service in 1990 as a co‐op student with the Ministry of Advanced Education.
Before taking on her current role with the Ministry of Education, she served as Education Communications Director for seven years and was part Government Communications and Public Engagement for 12 years in various roles. During her time in communications she was responsible for strategic planning, issues and media management, event logistics and opinion research.
In her current role as Director of the Ministry’s Strategic Human Resources team (the “Care Team”), she is responsible for advising executive on HR matters ranging from succession planning, staff training and development, employee engagement, and workplace health and wellness. She is the executives’ primary interface with the BC Public Service Agency, and takes a lead role in the development of Ministry Human Resource Plans.
In addition to her Care Team responsibilities she has supported and led pieces of the ERASE Bullying strategy in partnership with the Superintendent of Safe Schools.
Jennifer holds a Bachelor of Science in Business Management, a diploma in Public Administration and certification in Human Resource Management.
Page 18 EDU-2013-00071 - PHASE 1
Page 11 of 14
EXECUTIVE MEMBER BIOGRAPHY
RUEBEN BRONEE
EXECUTIVE DIRECTOR, STRATEGIC INNOVATION
Rueben Bronee joined the BC Public Service in 1998 as a Communications Officer with the then Ministry of Employment and Investment. Before taking on his current role with the Ministry of Education, he served as Executive Director for the Public Service Initiative in the Ministry of Citizens’ Services and Open Government. In that capacity he was responsible for corporate employee engagement and internal communications, developing the annual Corporate Human Resource Plan for the BC Public Service, and providing secretariat support for the Deputy Ministers’ Committee on the Public Service.
As Executive Director, Strategic Innovation, Rueben is responsible for teacher engagement and teacher communications, including supporting the development of an improved relationship between the ministry and the nine B.C. universities offering teacher development programs. He also works closely with the Open Government Division, providing strategic advice and support on student and parent engagement strategies.
Page 19 EDU-2013-00071 - PHASE 1
Page 12 of 14
EXECUTIVE MEMBER BIOGRAPHY
RICK DAVIS
SUPERINTENDENT OF ACHIEVEMENT
Rick Davis was appointed Superintendent of Achievement in July 2007. In this position, Rick is responsible for monitoring the levels of student achievement in the school districts, including reviewing district achievement contracts and superintendent’s reports on student achievement. When a district needs assistance, Rick provides advice, recommends a direction, and builds connections and networks to improve the district’s capacity to improve student success. On request, Rick provides reports to the Minister regarding student achievement in a specific school district.
Rick is also engaged in supporting the personalized learning work of the Ministry, principally through promoting strategies to improve teacher quality and considering changes to organizational structures that provide barriers to personalized learning. Rick provides advice to the minister and deputy minster on labour relations matters in the public education sector.
He began teaching in 1972 in Camrose, Alberta, where he taught Grade 1 and Grade 7. Two years later, he moved to Nelson, British Columbia, as a senior science and math teacher at a small rural high school. He has taught at all grade levels as he advanced through school and school district administrative positions in Dawson Creek, Vanderhoof and Vernon. From 1997 to 2002, Rick worked with the British Columbia Public School Employers’ Association in Vancouver as a superintendent representative and bargaining spokesperson. In July 2002, Rick joined the Ministry of Education as a Superintendent in the Liaison Division, where he worked until his current appointment. Between 2006 and 2011, Rick has served as president of the British Columbia Education Leadership Council, a not-for-profit society established and funded by the Government of British Columbia to develop leadership capacity in public education.
Rick is married and has three children and four grandchildren.
Page 20 EDU-2013-00071 - PHASE 1
Page 13 of 14
EXECUTIVE MEMBER BIOGRAPHY
MIKE ROBERTS
SUPERINTENDENT, LIAISON
Mike Roberts joined the Ministry of Education in February, 2013 as the new seconded Superintendent – Liaison. His work includes facilitating communication and development work between all 60 BC school districts and the Ministry. In addition, he has an advisory role in regard to educational and labour relations issues at the Ministry level. He is also currently the government policy representative at the provincial teacher bargaining table and remains based at the Vancouver Ministry of Education offices.
The Liaison Division’s work involves building connections and networks among B.C.’s education partners, schools and districts, so we can all work together to improve student achievement. Generally, the Division is responsible for leadership development, partner liaison, stakeholder analysis, team building for learning results, ministry/field connections, and information and communication. It places a strong emphasis on communications that share best practices, and is responsible for bringing field-based information to the deputy minister’s and minister’s offices.
Prior to joining the Ministry, Mike was the seconded Liaison Superintendent to the BC Public School Employers Association for just under four years. During the time, he covered a wide variety of assignments including district liaison, labour relations and human resource liaison, arbitration support, teacher bargaining, external professional development and a number of event functions. Mike’s experience in education prior to moving to BCPSEA was primarily with School District No. 23 (Central Okanagan), where he undertook a wide variety of roles from teacher and administrator to district superintendent.
Page 21 EDU-2013-00071 - PHASE 1
Page 14 of 14
EXECUTIVE MEMBER BIOGRAPHY
SHERRI MOHORUK
SUPERINTENDENT, SAFE SCHOOLS
Sherri Mohoruk was appointed as the Superintendent of Safe Schools on February 18, 2013. She has responsibility for all aspects of student and school safety with a specific focus on five key areas:
1. ERASE Bullying – implementing all 10 points of the strategy
2. Internal government/national liaison on safety
3. Threat/Risk Assessment and Critical Incident and Trauma
Response with districts – case specific
4. Emergency Preparedness including common emergency procedures/practices
5. Student issues that include substance misuse and abuse, mental health issues, child abuse and
reporting, domestic violence and gang prevention
Sherri began her teaching career in 1978 in Edmonton, Alberta, where she taught Kindergarten. Two years later she moved to Vernon, British Columbia, as a Kindergarten teacher. In 1985 Sherri moved to Escondido, California, as an exchange teacher. She remained in the United States for an additional five years on an extended professional visa. From 1986 to 1991, Sherri taught primary and intermediate grades, developed and implemented an ESL program, served as an interim principal for a state preschool and as a principal of an elementary school. She moved to Surrey, British Columbia, in 1991. From 1991 to 2006, Sherri served in several school and district administrative positions including principal, director - student services, director - curriculum and instruction, and assistant superintendent.
She joined the Ministry as a superintendent in the Liaison Division in 2006. She became the sole Superintendent, Liaison in 2007. In this position, she provided a link between the Minister of Education, the Ministry of Education and the province’s school districts and education partners. She advised the Deputy Minister and senior Ministry staff on educational issues that affect student learning. She facilitated connections between ministry divisions, school districts and partner organizations to improve implementation of ministry policy, initiatives and directions.
Page 22 EDU-2013-00071 - PHASE 1
Page 1
MINISTRY OF EDUCATION
LEARNING DIVISION
Superintendent Responsible: Rod Allen
Core Business/Program Area Description/Critical Business Processes: The Learning Division is responsible for providing leadership and support to school districts in the areas of Aboriginal Education, Curriculum and Assessment, Diversity and Equity, the Early Years, Transition Years, French Programs, and e-Learning. Through a focus on personalized learning, the Learning Division promotes choice and flexibility, student engagement, and strong basic skills and competencies.
The goal of the Aboriginal Education area is to improve student success for all Aboriginal students and to provide the opportunity for all students to benefit from learning about Aboriginal history, culture and language. The following principles provide policy direction and focus:
• all Aboriginal students are to achieve high educational outcomes and strengthen their academic abilities and personal growth within a K-12 education system that provides a challenging, relevant, high-quality personalized education experience;
• each student will graduate with knowledge and an enriched perspective of Aboriginal peoples in Canada and BC from a curriculum that is infused with Aboriginal languages, histories and traditions;
• collaboratively work with the education system and partners, providing leadership to increase the ability of BC’s education system and its current transformation initiative to ensure a solid foundation for lifelong learning, and
• support the engagement of Aboriginal peoples in the goal of improving school success for Aboriginal students.
The Curriculum and Assessment area of the Learning Division is responsible for setting K-12 educational standards and carrying out the main accountability requirements of the school system. Specifically, the area is responsible for: the development of all provincial K-12 curriculum standards, development of all provincial assessment and examination programs, the design and administration of national and international student assessments, the development of classroom assessment instruments to monitor student progress in relation to provincial standards, and student reporting
Page 23 EDU-2013-00071 - PHASE 1
Page 2
policies and report cards. The area is currently heavily involved with K-12 curriculum redesign as part of the educational transformation efforts. The Diversity and Equity team provides leadership, stewardship and influence, within government and throughout the school system, to help equip all students to maximize their potential and improve their achievement in the areas of intellectual, human and social development. The team is responsible for:
• policy, guidelines and issue management to assist ongoing efforts throughout the school system to create and maintain learning and working environments that are responsive to the diverse needs of all members in communities served; helping schools create and maintain policies/practices/conditions that foster success for all students and that promote fair and equitable treatment for all i.e., equitable access to and equitable participation in quality education for all students (personalized learning, IEPs, system audit processes), school cultures that value diversity and respond to the diverse social and cultural needs of individuals and groups in the communities they serve (Diversity in BC Schools Framework) – understanding of others and respect for all (social skill development), learning and working environments that are safe and welcoming, and free from discrimination, harassment and violence (positive behaviour support), decision-making processes that give a voice to all members of the school community.
• policy, standards, funding and issues management: to assist the school system in the delivery of supports and services to students with special or exceptional needs; for the provision of Provincial Resource Programs (PRPs) i.e., Specialized Education Technology-BC (SET-BC), and the Provincial Resource Centre for the Visually Impaired (PRCVI); Provincial Outreach Programs, i.e., POP Fetal Alcohol Spectrum Disorder, POP Autism and Related Disorders, POP for Deafblindness, POP for Deaf and Hard of Hearing, POP for Cochlear Implants and Auditory Training; school programs in hospitals, youth drug and alcohol programs, Deaf programs, e.g., the BC Provincial School for the Deaf, custody/attendance centres; and, to facilitate adjudication processes to ensure equity and accessibility to students with special needs who qualify for adaptations on provincial exams.
• policy, standards, funding and issues management to assist the school system in the delivery of supports and services to students who require English Language Learning (ELL) support, and students new to Canada enrolling in British Columbia’s public schools requiring Learning and Settlement, and Immigration support.
The Early Years team provides leadership, and stewardship within government and throughout the school system regarding Early Years programs for children in the school system, up to the age of eight years. The team is responsible for Early Years policy and standards (the BC Early Learning Framework), funding, and issues management. The team is also responsible for providing leadership
Page 24 EDU-2013-00071 - PHASE 1
Page 3
and assistance to the school system in the delivery of the StrongStart BC and Ready Set Learn programs, and for developing resources to support Early Years curriculum.
The French Programs team is responsible for policy designed for francophone students and learners of French-as-a-second language. The team is also responsible for federal funding support under the Protocol for Agreements for Minority-Language Education and Second-Language Instruction, the negotiation and administration of the bilateral agreement that provides financial support for the offering of French programs throughout the province. The team works closely with stakeholders to support and discuss a range of issues and priorities for French learning in BC. The team provides the provincial coordination of the national Explore and Odyssey programs, the BC/Quebec Six-Month Exchange Program, French Teacher Bursaries and Student Fellowships Bursaries.
The eLearning team monitors existing and emerging educational technologies and works with stakeholders to promote and support their integration into K-12 teaching practices. The team also supports public distributed learning (DL) in the province by managing the development of public DL policies and standards, reviewing public DL schools and their programs for quality practice, and using data to report on student achievement.
The Transition Years team is responsible for graduation requirements and policies for school-aged and adult students in British Columbia, including adult continuing education centres, alternative schools, career programs and trades training. The team coordinates its graduation work with the Student Certification Branch in the Business, Technology, and Online Services Division. Career and Trades activities are shared responsibilities with the Ministry of Advanced Education, Innovation and Trade and the Ministry of Jobs, Tourism, and Skills Training.
Budget: Program Administration: $ 4,685,000 Grants: $ 44,965,000 Total $ 49,650,000
Full Time Equivalents (FTEs): Executive Office 4.7 Aboriginal Education 6.6 Diversity and Equity 6.0 Early Years 0.3 E-Learning 9.4 French programs & International Languages 10.8 Curriculum & Assessment 19.5 Total FTE 57.3
Page 25 EDU-2013-00071 - PHASE 1
Page 4
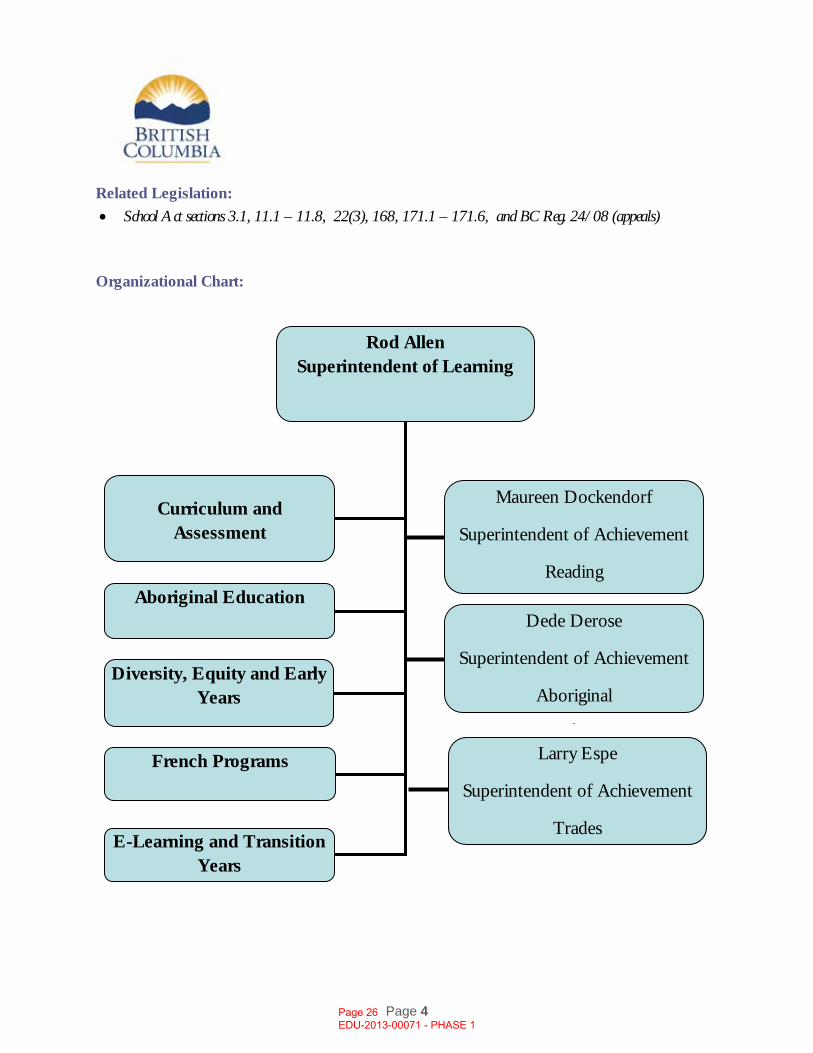
Related Legislation:
• School Act sections 3.1, 11.1 – 11.8, 22(3), 168, 171.1 – 171.6, and BC Reg. 24/08 (appeals)
Organizational Chart:
Rod Allen Superintendent of Learning
Curriculum and Assessment
Aboriginal Education
Diversity, Equity and Early Years
French Programs
E-Learning and Transition Years
Maureen Dockendorf
Superintendent of Achievement
Reading
Dede Derose
Superintendent of Achievement
Aboriginal
Larry Espe
Superintendent of Achievement
Trades
Page 26 EDU-2013-00071 - PHASE 1
Page 1
MINISTRY OF EDUCATION
GOVERNANCE, LEGISLATION AND REGULATION DIVISION
ADM Responsible: Claire Avison
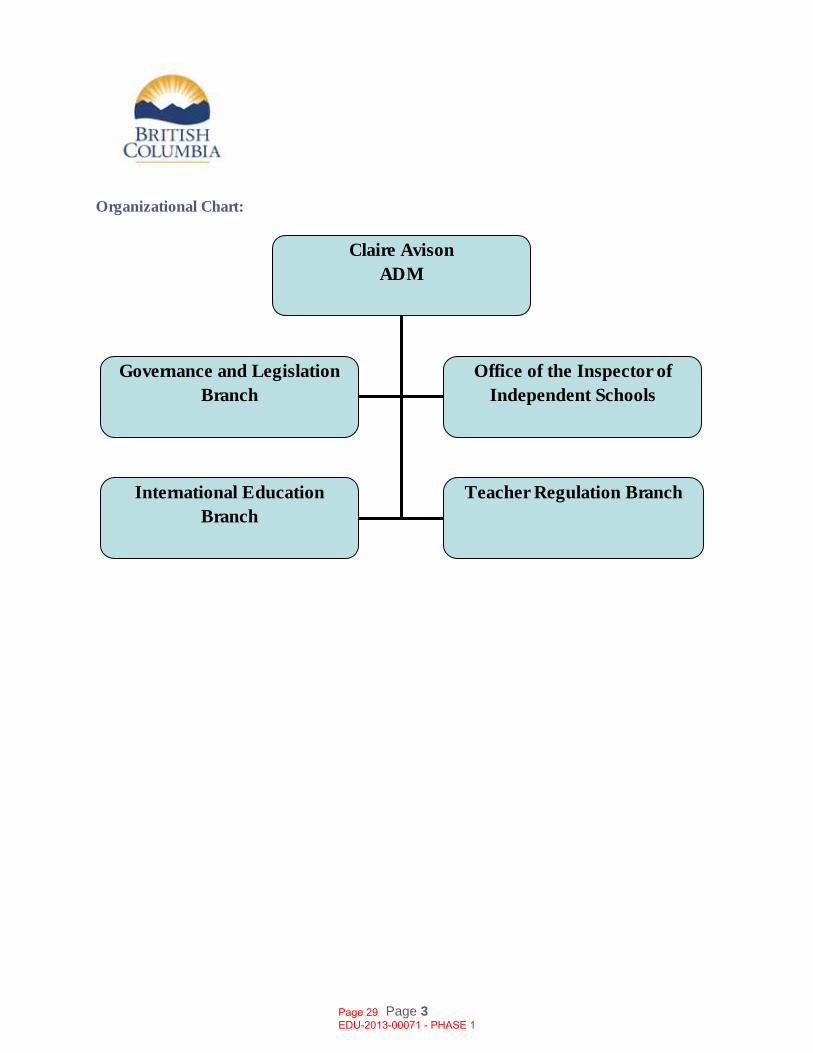
Core Business/Program Area Description/Critical Business Processes: The Governance, Legislation and Regulation Division is responsible for legislation, independent schools, international education, teacher regulation, governance policy for K–12 public and independent education, and sector labour relations.
The Governance and Legislation Branch is responsible for the development of legislation and for ensuring that education policies and initiatives have the necessary legislative authority. The branch also processes student appeals, reviews calendars submitted by school districts, and serves as the Ministry’s primary liaison with the Ministry of Justice.
The Office of the Inspector of Independent Schools regulates independent schools within the province based on requirements set out in the Independent School Act and its related regulations and orders. The Office inspects, certifies and classifies independent schools as set out in the related legislation, regulations and orders. The Office is also responsible for setting homeschooling policies and responding to issues raised by parents relating to independent schools and homeschooling.
The International Education Branch is responsible for the policy and regulation of BC’s k – 12 international education program, including the offshore, onshore and Distributed Learning components. This includes responsibility for monitoring and certifying offshore schools, working with federal and provincial counterparts, embassies and consulates, hosting international delegations, providing advice and support to boards of education on international educational initiatives.
The Teacher Regulation Branch supports the regulation of BC teachers in accordance with the Teachers Act. The Branch certifies teachers, assesses teacher education programs against certification standards, and supports the work of the Commissioner for Teacher Regulation by investigating reports and complaints about teacher conduct and competence, and administering discipline processes. The branch also supports the work of the BC Teachers’ Council, the Discipline and Professional Conduct Board and the Independent School Teaching Certificate Standards Committee.
The ADM is also the ministry’s executive lead for sector labour relations, working closely with the Public Sector Employers’ Council Secretariat and the BC Public School Employers’ Association.
Page 27 EDU-2013-00071 - PHASE 1
Page 2
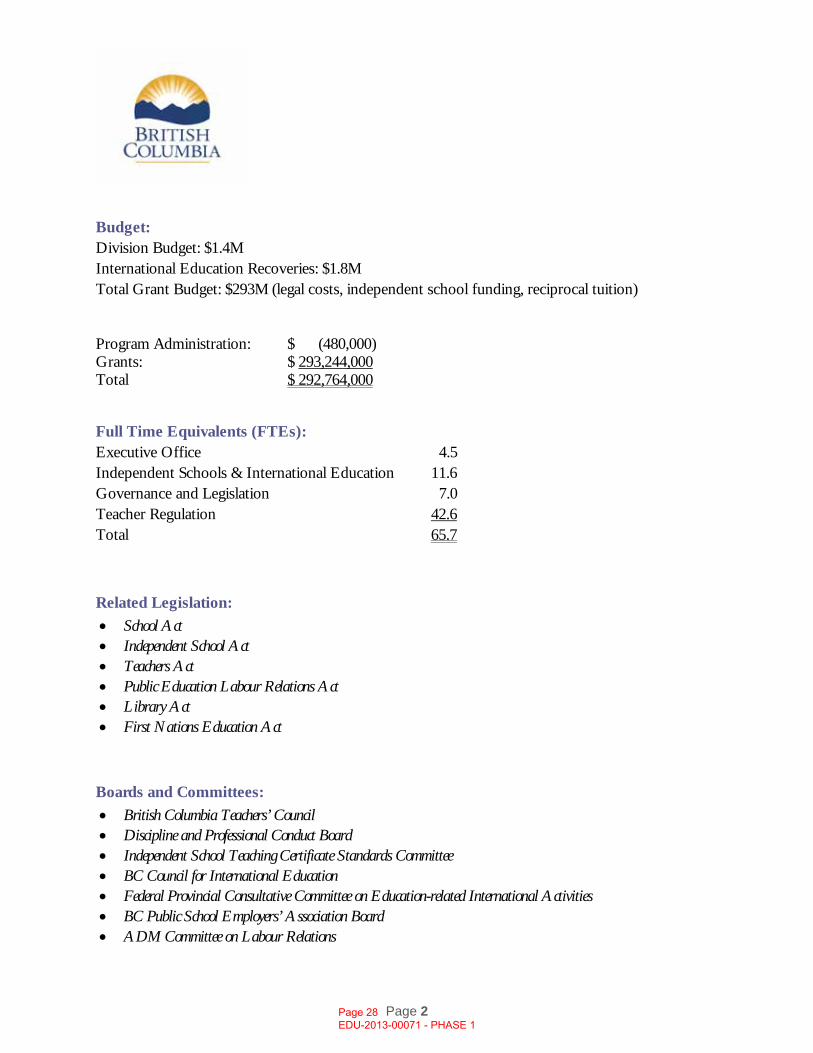
Budget: Division Budget: $1.4M International Education Recoveries: $1.8M Total Grant Budget: $293M (legal costs, independent school funding, reciprocal tuition)
Program Administration: $ (480,000) Grants: $ 293,244,000 Total $ 292,764,000
Full Time Equivalents (FTEs): Executive Office 4.5 Independent Schools & International Education 11.6 Governance and Legislation 7.0 Teacher Regulation 42.6 Total 65.7
Related Legislation:
• School Act • Independent School Act • Teachers Act • Public Education Labour Relations Act • Library Act • First Nations Education Act
Boards and Committees:
• British Columbia Teachers’ Council • Discipline and Professional Conduct Board • Independent School Teaching Certificate Standards Committee • BC Council for International Education • Federal Provincial Consultative Committee on Education-related International Activities • BC Public School Employers’ Association Board • ADM Committee on Labour Relations
Page 28 EDU-2013-00071 - PHASE 1
Page 3
Organizational Chart:
Claire Avison
ADM
Governance and Legislation Branch
Office of the Inspector of Independent Schools
International Education Branch
Teacher Regulation Branch
Page 29 EDU-2013-00071 - PHASE 1
Page 1
MINISTRY OF EDUCATION
RESOURCE MANAGEMENT DIVISION
ADM Responsible: Vacant
Core Business/Program Area Description/Critical Business Processes: The Resource Management Division provides operational and capital funding for school districts and monitors financial accountability and compliance of boards of education. The Division also provides a wide range of financial support services to the Ministry.
The Division is comprised of several branches and program areas:
The Capital Management Branch assists boards of education with the development of their long-term capital plans and allocates funding for improving or expanding B.C.’s public schools. The branch also presents public school capital needs to government and manages government’s Seismic Mitigation Program.
The Funding and Compliance Branch develops and maintains an equitable funding formula for the public Kindergarten to Grade 12 education system. This branch develops and conducts annual compliance audits of school districts to ensure that public education funds are being used for their intended purposes.
The School District Financial Reporting Branch works with school districts to monitor how their funding allocation is budgeted and spent.
The Financial Services Branch provides the financial support functions that enable the Ministry of Education to operate its programs and achieve its business objectives. This includes budgets, accounting, reporting, transaction processing, systems, procurement, contract management, policy, and decision support.
Budget: Program Administration: $ 850,000 Grants: $ 4,815,894,000 Total $ 4,816,804,000
Page 30 EDU-2013-00071 - PHASE 1
Page 2
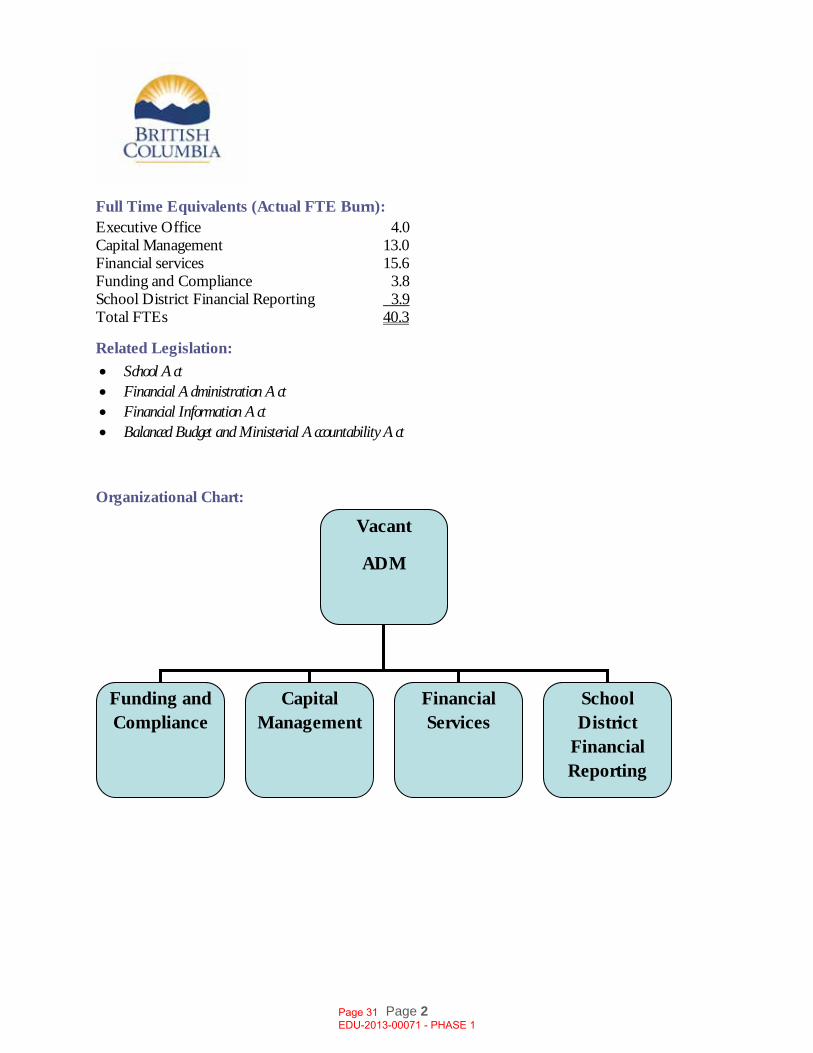
Full Time Equivalents (Actual FTE Burn): Executive Office 4.0 Capital Management 13.0 Financial services 15.6 Funding and Compliance 3.8 School District Financial Reporting 3.9 Total FTEs 40.3
Related Legislation:
• School Act • Financial Administration Act • Financial Information Act • Balanced Budget and Ministerial Accountability Act
Organizational Chart:
Vacant
ADM
Funding and Compliance
Capital Management
Financial Services
School District
Financial Reporting
Page 31 EDU-2013-00071 - PHASE 1
Page 1
MINISTRY OF EDUCATION
BUSINESS, TECHNOLOGY AND ONLINE SERVICES DIVISION
ADM Responsible: Renate Butterfield
Core Business/Program Area Description/Critical Business Processes: The Business, Technology and Online Services Division has five primary areas of responsibility.
This Division houses Education’s service centre for the K-12 sector and the public, providing information and services related to graduation, provincial examinations and assessments, data collections, historical transcripts, scholarships and the BC Training and Education Savings grant. Operationally, it provides professional and timely support to teachers, administrators, parents, students, post-secondary institutions and offshore and Yukon schools on day to day functions related to the administration of education services.
In addition, it establishes and oversees ongoing operations related to the provincial Student Information System (BCeSIS) and is currently leading the procurement for a replacement of that system. A nine-member core evaluation team, made up of sector and Ministry staff and supplemented by 15 subject matter experts from the K-12 community, is working through this procurement cycle. Procurement will likely conclude in June 2013 with transition to the new service completed by early 2016.
Working jointly with the Resource Management Division, BTO is actively engaged with our sector to review and implement aspects of shared services. Based on a 2012 report provided by Deloitte & Touché LLP entitled Service Delivery Transformation, an initial set of 14 opportunities to reduce overhead costs, look for efficiencies and find savings through collaboration and alternate service delivery in the public education sector are being explored. These 14 opportunities cover the areas of procurement, legal services, HR/Payroll, attendance and occupational safety and information technology.
The Information Technology Management Branch (ITMB) supports both the Ministry of Education and the 60 districts that make up our sector. This team provides technology solutions that support the day to day work of Ministry staff and the 50 plus computer systems that are used to support operations and funding to the sector. A growing part of this team’s responsibilities is to partner with IT leaders in the school districts and build the technology base to best support the Education Plan.
Page 32 EDU-2013-00071 - PHASE 1
Page 2
Part of this partnering extends to key vendors, leveraging large government contracts, such as those with TELUS, IBM, and Hewlett Packard to support education’s transformation.
The division also houses Open School BC, which provides elearning services to school districts and the public sector, and also develops and distributes a wide range of learning resources (e.g. courses, online training, multimedia, printed materials). In addition the division supports LearnNowBC, which delivers tutoring, academic counselling, reference services, and information about accessing online courses to students and teachers across the province.
Budget: Program Administration: $ 8,031,000 Grants: $ 30,663,000 Total $ 38,694,000
Full Time Equivalents (Actual FTE Burn): Executive Office 3.6 ITMB Strategic/PLNet 14.1 ITMB Client Br. 17.5 Open School BC 22.6 Student Certification 25.9 Total 83.7
Related Legislation:
• Independent School Act • Library Act • School Act • Teachers Act • Special Accounts Appropriation and Control Act
Page 33 EDU-2013-00071 - PHASE 1
Page 3
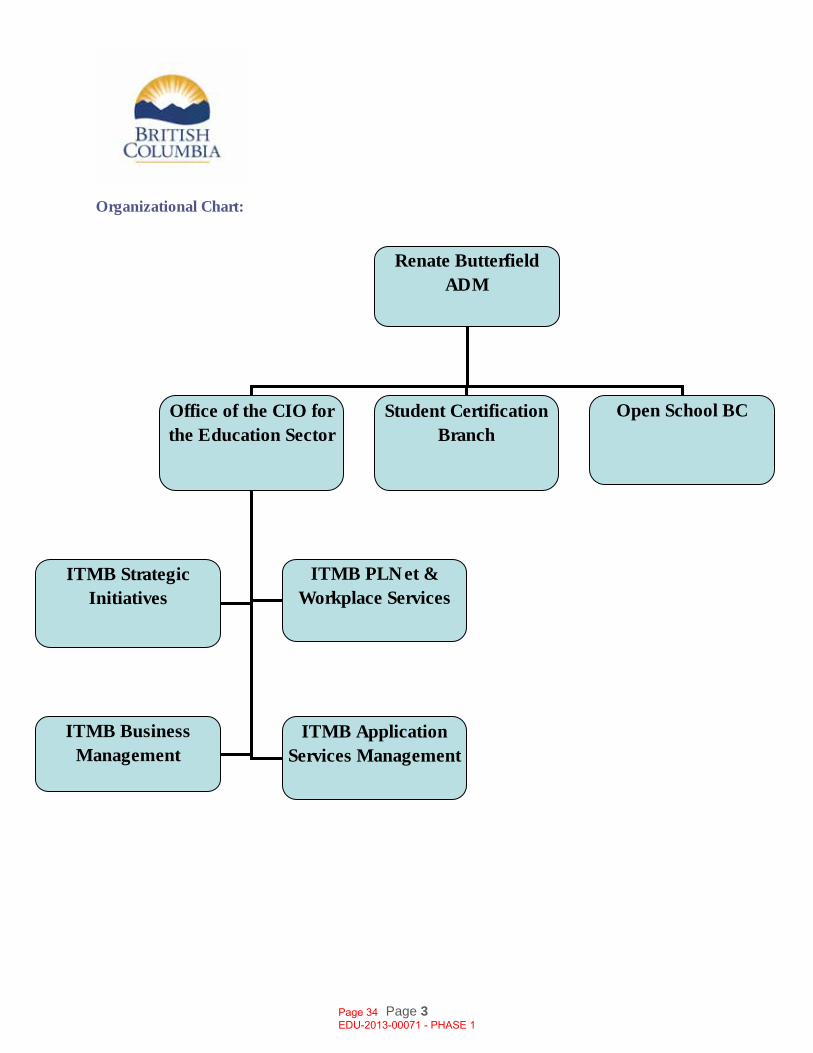
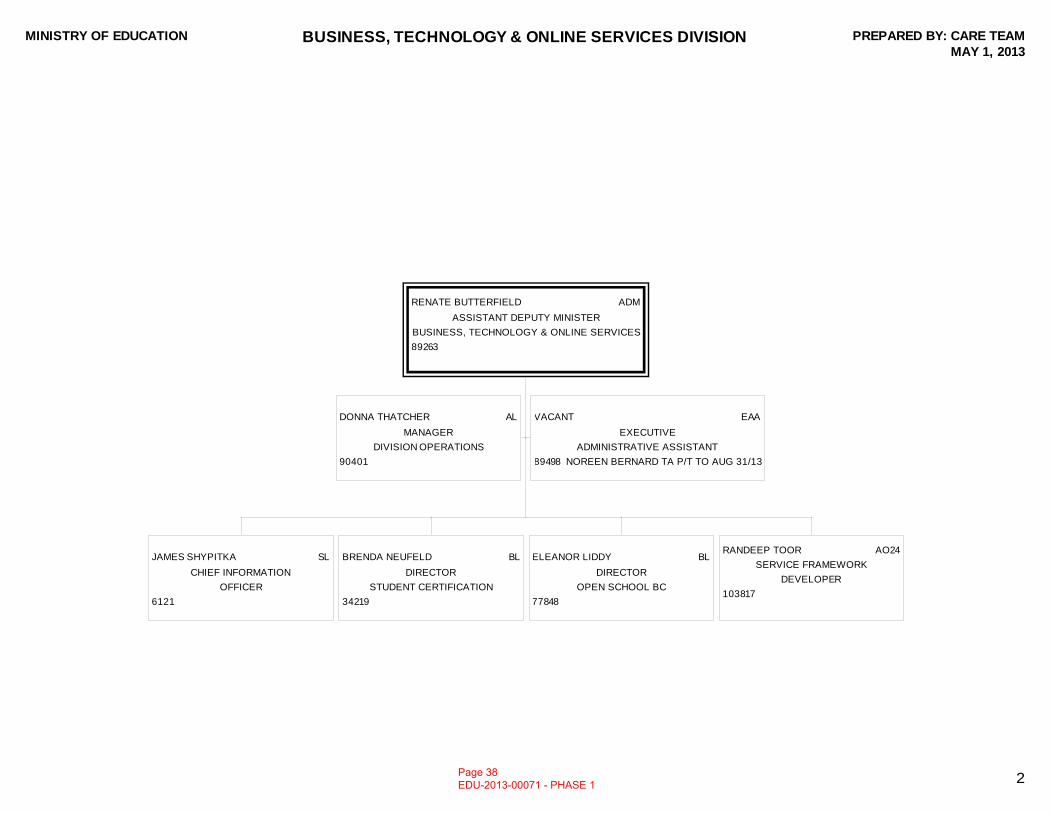
Organizational Chart:
Renate Butterfield ADM
Office of the CIO for the Education Sector
Student Certification Branch
ITMB Strategic Initiatives
ITMB PLNet & Workplace Services
ITMB Business Management
Open School BC
ITMB Application Services Management
Page 34 EDU-2013-00071 - PHASE 1
Page 1
MINISTRY OF EDUCATION
OPEN GOVERNMENT AND COMMUNITY PARTNESHIPS DIVISION
ADM Responsible: Paige MacFarlane
Core Business/Program Area Description/Critical Business Processes: The Open Government and Community Partnerships Division (OGCP) has three key priorities: open government, community partnerships and accountability.
The division leads the ministry's open government approach, and supports education transformation by leveraging open government principles of transparency, collaboration and participation to involve and engage the public in policy development.
The ministry's accountability, information and reporting functions are housed within OGCP and provide evidence and data to support transformation of both the education and library sectors; within the ministry and in the field.
Key strategic linkages are through community and sector partnerships in support of BC’s education transformation; Service Plan; Transformation and Technology Plan; Libraries Without Walls; and the Gov 2.0 plan: Citizens@the Centre.
The Open Government team is responsible for Citizen Engagement, Open Data, Open Information and Online Presence. This includes production – web and graphic design/videography – and internal communications.
The Accountability & Business Intelligence business area is responsible for: corporate and school district accountability, data management, intergovernmental relations, correspondence, and comprehensive school health.
The Libraries & Literacy business area is responsible for community literacy, public libraries, and partnerships in support of rural education.
The Division also encompasses business integration, integrated planning and Lean initiatives, and is responsible for research and evaluation both within the Division and corporately.
Page 35 EDU-2013-00071 - PHASE 1
Page 2
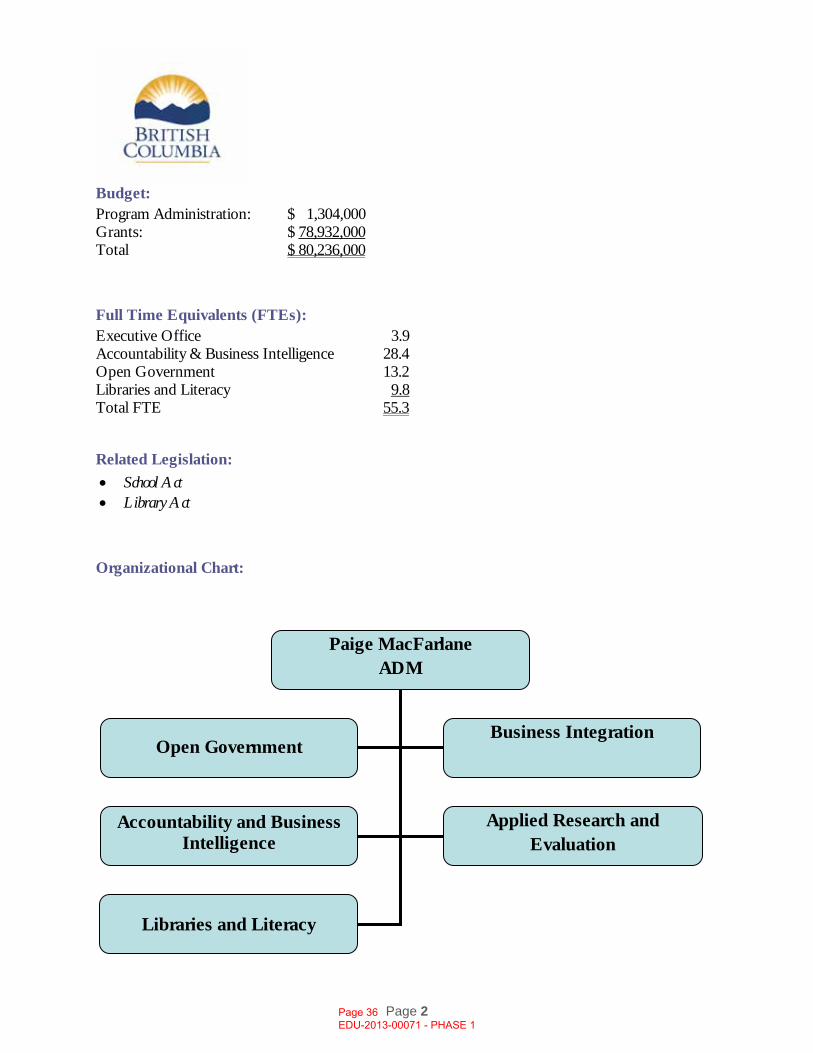
Budget: Program Administration: $ 1,304,000 Grants: $ 78,932,000 Total $ 80,236,000
Full Time Equivalents (FTEs): Executive Office 3.9 Accountability & Business Intelligence 28.4 Open Government 13.2 Libraries and Literacy 9.8 Total FTE 55.3
Related Legislation:
• School Act • Library Act
Organizational Chart:
Paige MacFarlane ADM
Open Government Business Integration
Accountability and Business Intelligence
Applied Research and Evaluation
Libraries and Literacy
Page 36 EDU-2013-00071 - PHASE 1
MINISTRY OF EDUCATION PREPARED BY: CARE TEAMMAY 1, 2013
1
JAMES GORMAN DM
DEPUTY
MINISTER
6109
SUSAN BAINES SR EXEC ADMIN
SENIOR EXECUTIVE
ADMINISTRATIVE ASSISTANT
6111
HEATHER LANGTON AL
EXECUTIVE ADMINISTRATIVE
COORDINATOR
101362
RENATE BUTTERFIELD ADM
ASSISTANT DEPUTY MINISTER
BUSINESS, TECHNOLOGY & ONLINE SERVICES
89263
CLAIRE AVISON ADM
ASSISTANT DEPUTY MINISTER
GOVERNANCE, LEGISLATION & REGULATION
89267
ROD ALLEN ML 12
SUPERINTENDENT
LEARNING DIVISION
93993
PAIGE MACFARLANE ADM
ASSISTANT DEPUTY MINISTER
OPEN GOVERNMENT & COMMUNITY PARTNERSHIPS
89264
VACANT ADM
ASSISTANT DEPUTY MINISTER
EXECUTIVE FINANCIAL OFFICER
89265 RESOURCE MANAGEMENT
DOUG STEWART TA TO AUG 23/13
JENNIFER MCCREA BL
DIRECTOR
CARE TEAM
76519
RUEBEN BRONEE SL
EXECUTIVE DIRECTOR
INNOVATION
81543
RICK DAVIS ML 12
SUPERINTENDENT
ACHIEVEMENT
81398
CATHY ELLIOTT
PROJECT DIRECTOR, SECTOR
LEADERSHIP DEVELOPMENT
JUNE 30/13
SECONDEE
SHERRI MOHORUK
SUPERINTENDENT
SAFE SCHOOLS
99242 JUL 31/13
SECONDEE
MIKE ROBERTS
SUPERINTENDENT
LIAISON
FEB 16/16
SECONDEE
Page 37 EDU-2013-00071 - PHASE 1
MINISTRY OF EDUCATION BUSINESS, TECHNOLOGY & ONLINE SERVICES DIVISION PREPARED BY: CARE TEAMMAY 1, 2013
2
RENATE BUTTERFIELD ADM
ASSISTANT DEPUTY MINISTER
BUSINESS, TECHNOLOGY & ONLINE SERVICES
89263
DONNA THATCHER AL
MANAGER
DIVISION OPERATIONS
90401
VACANT EAA
EXECUTIVE
ADMINISTRATIVE ASSISTANT
89498 NOREEN BERNARD TA P/T TO AUG 31/13
JAMES SHYPITKA SL
CHIEF INFORMATION
OFFICER
6121
BRENDA NEUFELD BL
DIRECTOR
STUDENT CERTIFICATION
34219
ELEANOR LIDDY BL
DIRECTOR
OPEN SCHOOL BC
77848
RANDEEP TOOR AO24
SERVICE FRAMEWORK
DEVELOPER
103817
Page 38 EDU-2013-00071 - PHASE 1
MINISTRY OF EDUCATION CIO OFFICE PREPARED BY: CARE TEAMMAY 1, 2013
3
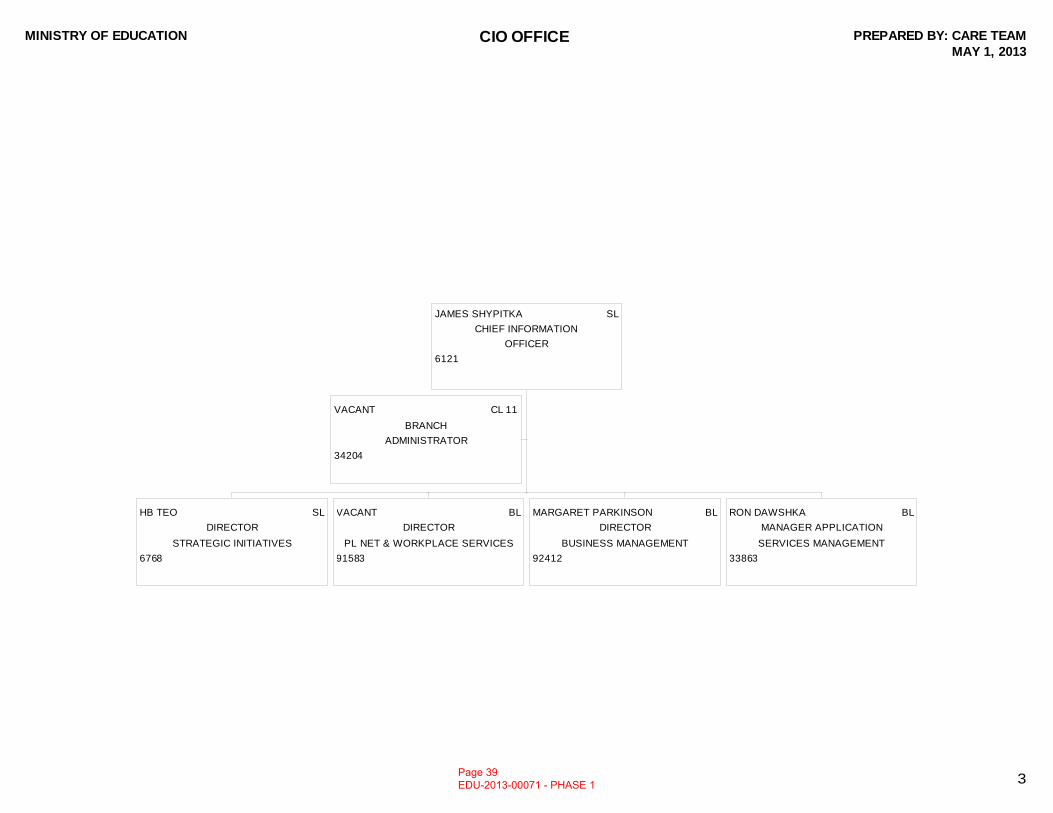
JAMES SHYPITKA SL
CHIEF INFORMATION
OFFICER
6121
VACANT CL 11
BRANCH
ADMINISTRATOR
34204
HB TEO SL
DIRECTOR
STRATEGIC INITIATIVES
6768
VACANT BL
DIRECTOR
PL NET & WORKPLACE SERVICES
91583
MARGARET PARKINSON BL
DIRECTOR
BUSINESS MANAGEMENT
92412
RON DAWSHKA BL
MANAGER APPLICATION
SERVICES MANAGEMENT
33863
Page 39 EDU-2013-00071 - PHASE 1
MINISTRY OF EDUCATION STRATEGIC INITIATIVES - ITMB PREPARED BY: CARE TEAMMAY 1, 2013
4
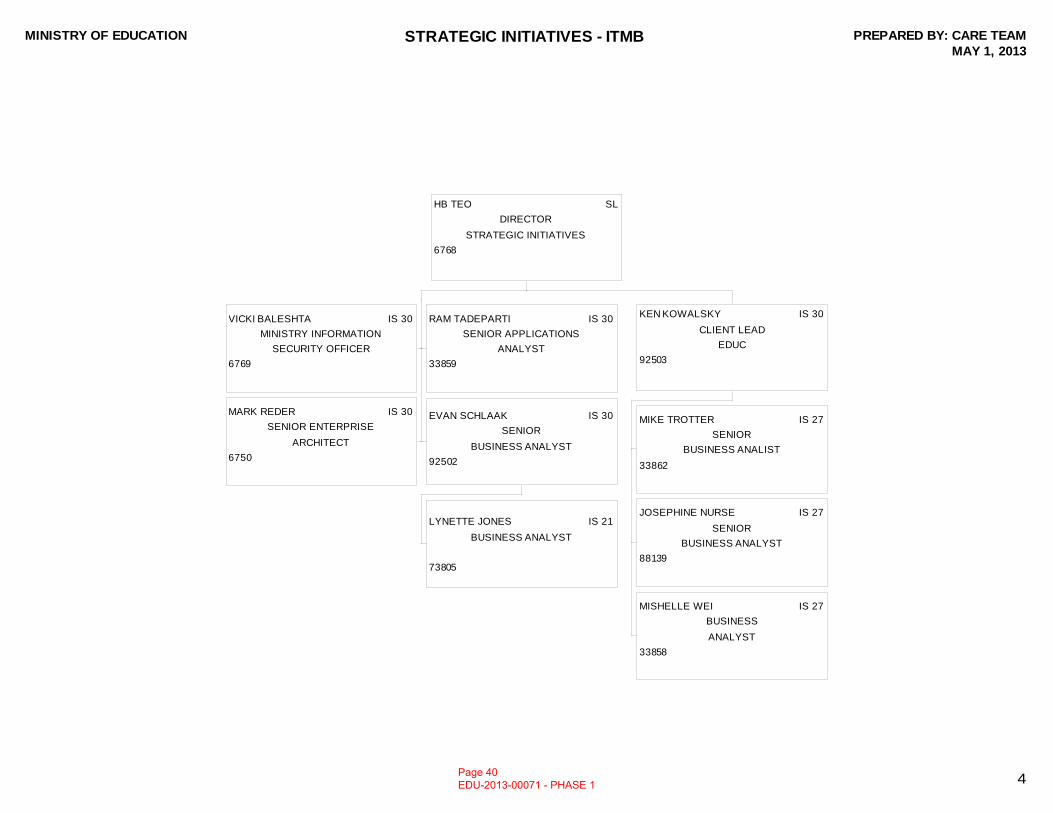
HB TEO SL
DIRECTOR
STRATEGIC INITIATIVES
6768
VICKI BALESHTA IS 30
MINISTRY INFORMATION
SECURITY OFFICER
6769
RAM TADEPARTI IS 30
SENIOR APPLICATIONS
ANALYST
33859
MARK REDER IS 30
SENIOR ENTERPRISE
ARCHITECT
6750
EVAN SCHLAAK IS 30
SENIOR
BUSINESS ANALYST
92502
LYNETTE JONES IS 21
BUSINESS ANALYST
73805
KEN KOWALSKY IS 30
CLIENT LEAD
EDUC
92503
MIKE TROTTER IS 27
SENIOR
BUSINESS ANALIST
33862
JOSEPHINE NURSE IS 27
SENIOR
BUSINESS ANALYST
88139
MISHELLE WEI IS 27
BUSINESS
ANALYST
33858
Page 40 EDU-2013-00071 - PHASE 1
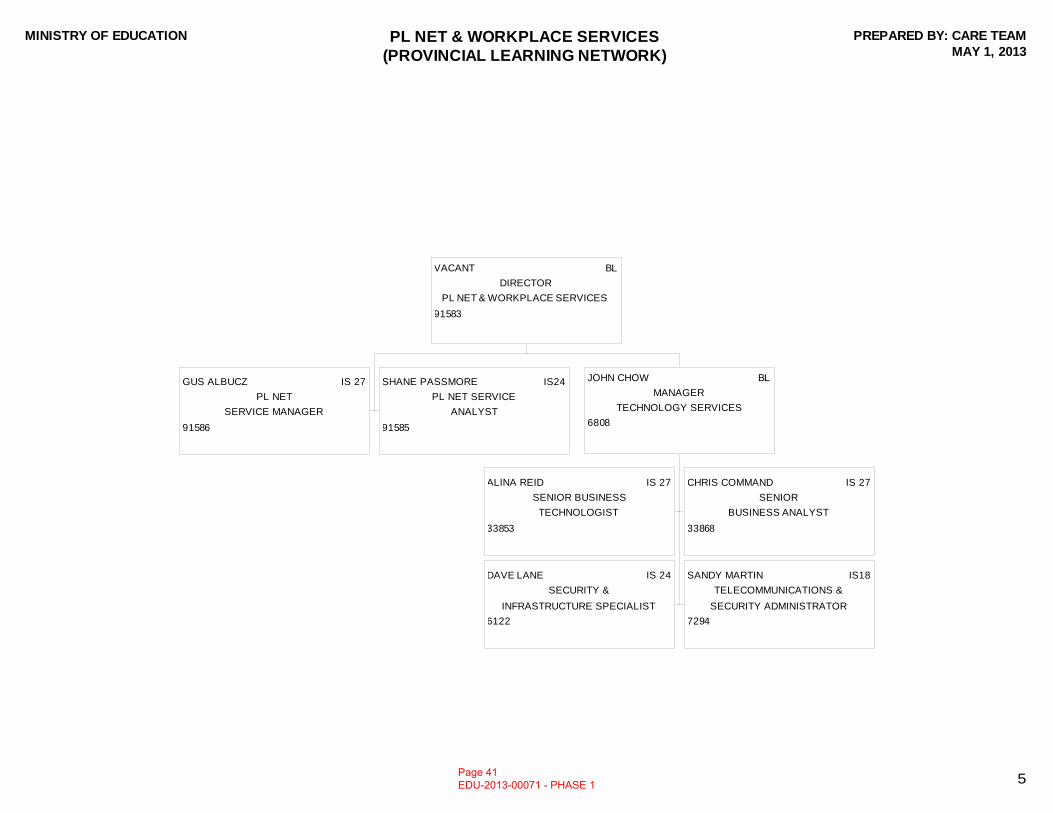
MINISTRY OF EDUCATION PL NET & WORKPLACE SERVICES(PROVINCIAL LEARNING NETWORK)
PREPARED BY: CARE TEAMMAY 1, 2013
5
VACANT BL
DIRECTOR
PL NET & WORKPLACE SERVICES
91583
GUS ALBUCZ IS 27
PL NET
SERVICE MANAGER
91586
SHANE PASSMORE IS24
PL NET SERVICE
ANALYST
91585
JOHN CHOW BL
MANAGER
TECHNOLOGY SERVICES
6808
ALINA REID IS 27
SENIOR BUSINESS
TECHNOLOGIST
33853
CHRIS COMMAND IS 27
SENIOR
BUSINESS ANALYST
33868
DAVE LANE IS 24
SECURITY &
INFRASTRUCTURE SPECIALIST
6122
SANDY MARTIN IS18
TELECOMMUNICATIONS &
SECURITY ADMINISTRATOR
7294
Page 41 EDU-2013-00071 - PHASE 1
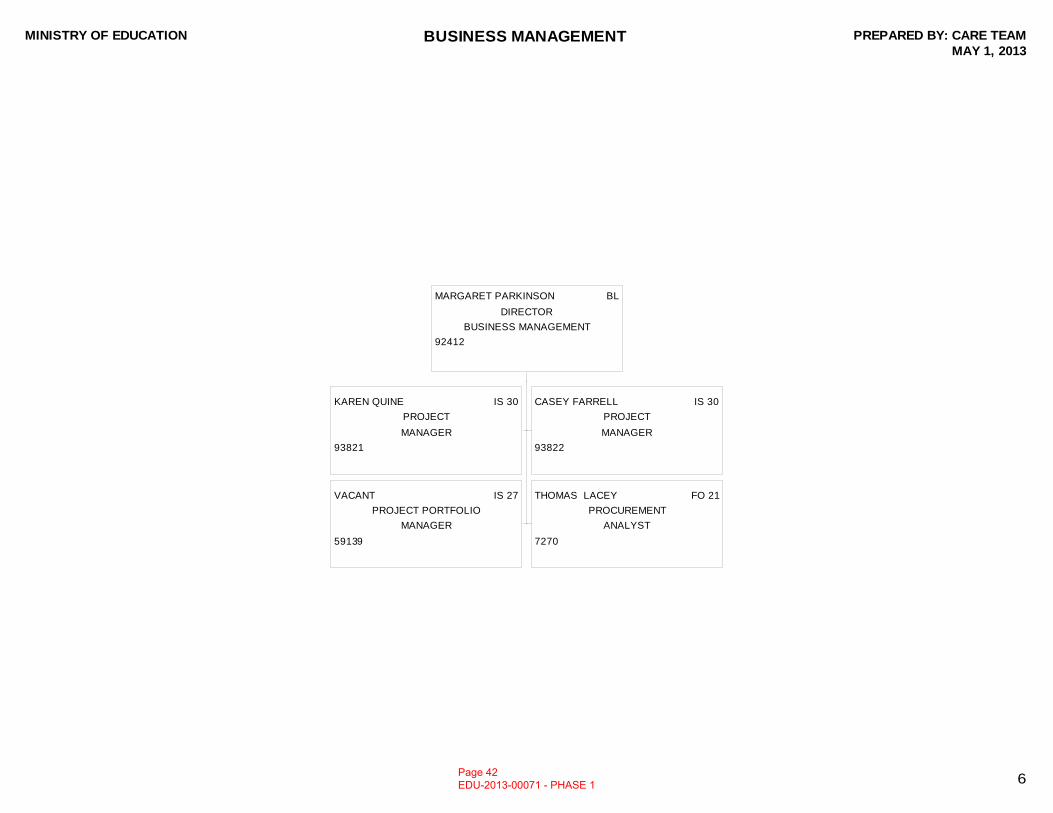
MINISTRY OF EDUCATION BUSINESS MANAGEMENT PREPARED BY: CARE TEAMMAY 1, 2013
6
MARGARET PARKINSON BL
DIRECTOR
BUSINESS MANAGEMENT
92412
KAREN QUINE IS 30
PROJECT
MANAGER
93821
CASEY FARRELL IS 30
PROJECT
MANAGER
93822
VACANT IS 27
PROJECT PORTFOLIO
MANAGER
59139
THOMAS LACEY FO 21
PROCUREMENT
ANALYST
7270
Page 42 EDU-2013-00071 - PHASE 1
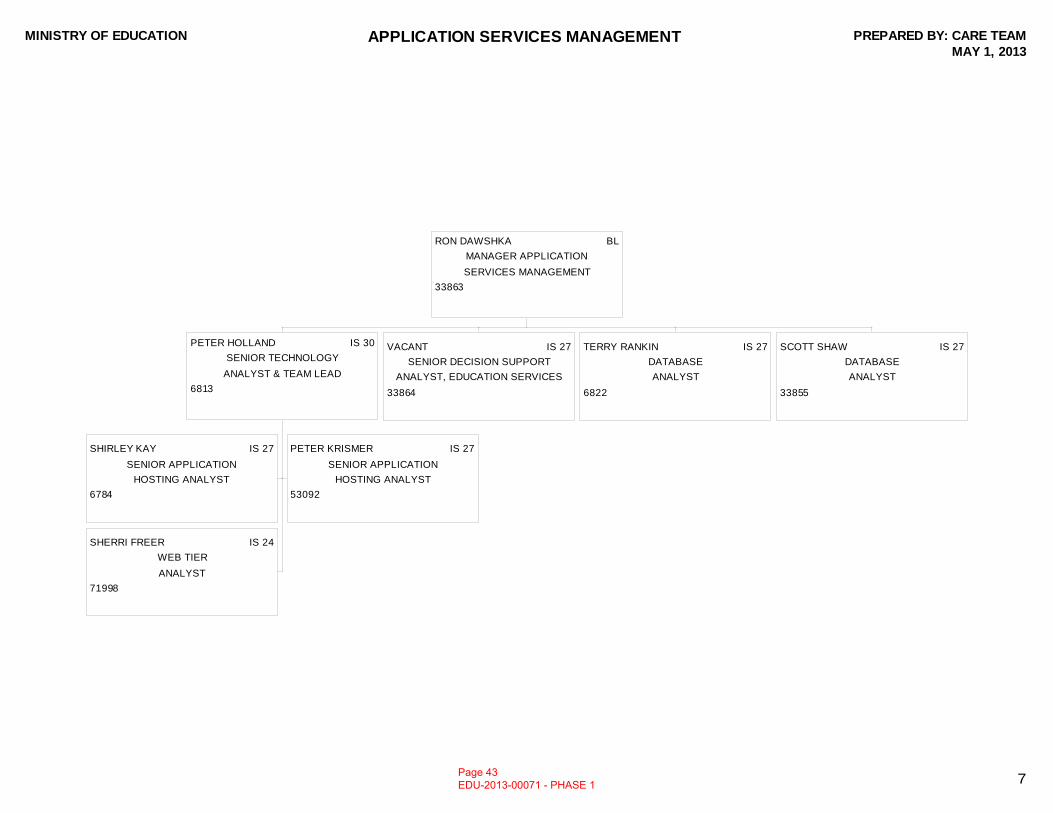
MINISTRY OF EDUCATION APPLICATION SERVICES MANAGEMENT PREPARED BY: CARE TEAMMAY 1, 2013
7
RON DAWSHKA BL
MANAGER APPLICATION
SERVICES MANAGEMENT
33863
PETER HOLLAND IS 30
SENIOR TECHNOLOGY
ANALYST & TEAM LEAD
6813
SHIRLEY KAY IS 27
SENIOR APPLICATION
HOSTING ANALYST
6784
PETER KRISMER IS 27
SENIOR APPLICATION
HOSTING ANALYST
53092
SHERRI FREER IS 24
WEB TIER
ANALYST
71998
VACANT IS 27
SENIOR DECISION SUPPORT
ANALYST, EDUCATION SERVICES
33864
TERRY RANKIN IS 27
DATABASE
ANALYST
6822
SCOTT SHAW IS 27
DATABASE
ANALYST
33855
Page 43 EDU-2013-00071 - PHASE 1
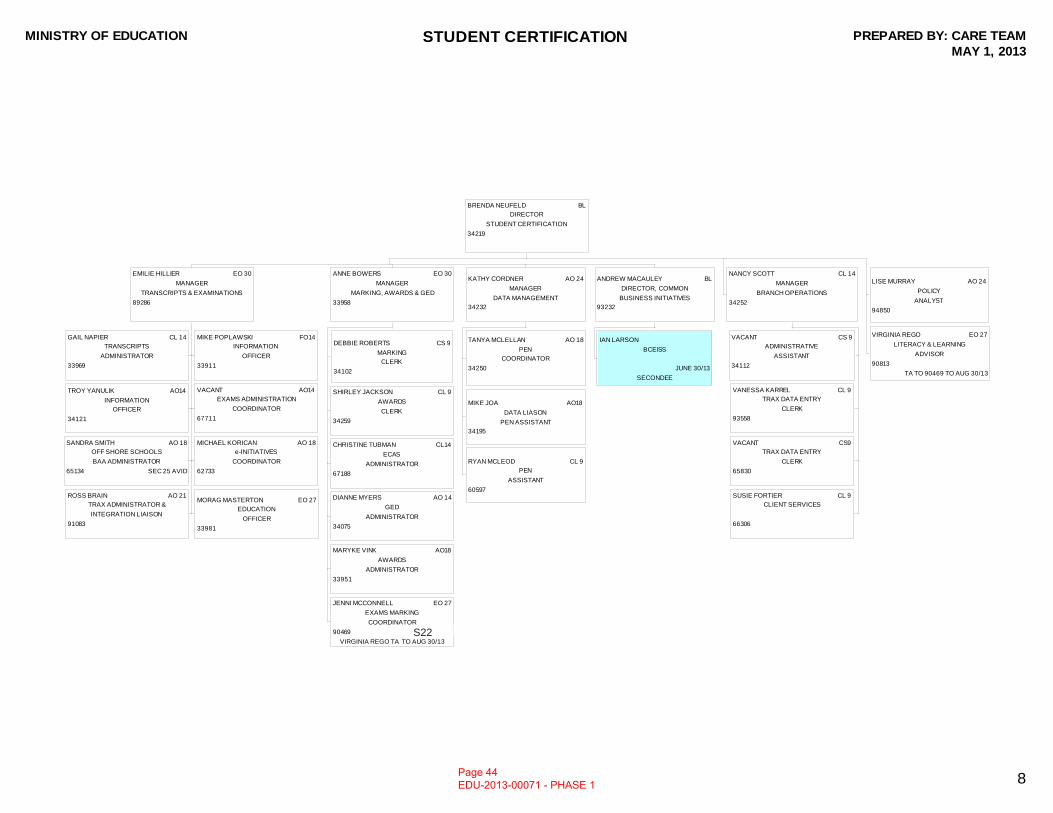
MINISTRY OF EDUCATION STUDENT CERTIFICATION PREPARED BY: CARE TEAMMAY 1, 2013
8
BRENDA NEUFELD BL
DIRECTOR
STUDENT CERTIFICATION
34219
EMILIE HILLIER EO 30
MANAGER
TRANSCRIPTS & EXAMINATIONS
89286
GAIL NAPIER CL 14
TRANSCRIPTS
ADMINISTRATOR
33969
MIKE POPLAWSKI FO14
INFORMATION
OFFICER
33911
TROY YANULIK AO14
INFORMATION
OFFICER
34121
VACANT AO14
EXAMS ADMINISTRATION
COORDINATOR
67711
SANDRA SMITH AO 18
OFF SHORE SCHOOLS
BAA ADMINISTRATOR
65134 SEC 25 AVID
MICHAEL KORICAN AO 18
e-INITIATIVES
COORDINATOR
62733
ROSS BRAIN AO 21
TRAX ADMINISTRATOR &
INTEGRATION LIAISON
91083
MORAG MASTERTON EO 27
EDUCATION
OFFICER
33981
ANNE BOWERS EO 30
MANAGER
MARKING, AWARDS & GED
33958
DEBBIE ROBERTS CS 9
MARKING
CLERK
34102
SHIRLEY JACKSON CL 9
AWARDS
CLERK
34259
CHRISTINE TUBMAN CL14
ECAS
ADMINISTRATOR
67188
DIANNE MYERS AO 14
GED
ADMINISTRATOR
34075
MARYKE VINK AO18
AWARDS
ADMINISTRATOR
33951
JENNI MCCONNELL EO 27
EXAMS MARKING
COORDINATOR
90469
VIRGINIA REGO TA TO AUG 30/13
KATHY CORDNER AO 24
MANAGER
DATA MANAGEMENT
34232
TANYA MCLELLAN AO 18
PEN
COORDINATOR
34250
MIKE JOA AO18
DATA LIASON
PEN ASSISTANT
34195
RYAN MCLEOD CL 9
PEN
ASSISTANT
60597
ANDREW MACAULEY BL
DIRECTOR, COMMON
BUSINESS INITIATIVES
93232
IAN LARSON
BCEISS
JUNE 30/13
SECONDEE
NANCY SCOTT CL 14
MANAGER
BRANCH OPERATIONS
34252
VACANT CS 9
ADMINISTRATIVE
ASSISTANT
34112
VANESSA KARREL CL 9
TRAX DATA ENTRY
CLERK
93558
VACANT CS9
TRAX DATA ENTRY
CLERK
65830
SUSIE FORTIER CL 9
CLIENT SERVICES
66306
LISE MURRAY AO 24
POLICY
ANALYST
94850
VIRGINIA REGO EO 27
LITERACY & LEARNING
ADVISOR
90813
TA TO 90469 TO AUG 30/13
Page 44 EDU-2013-00071 - PHASE 1
S22
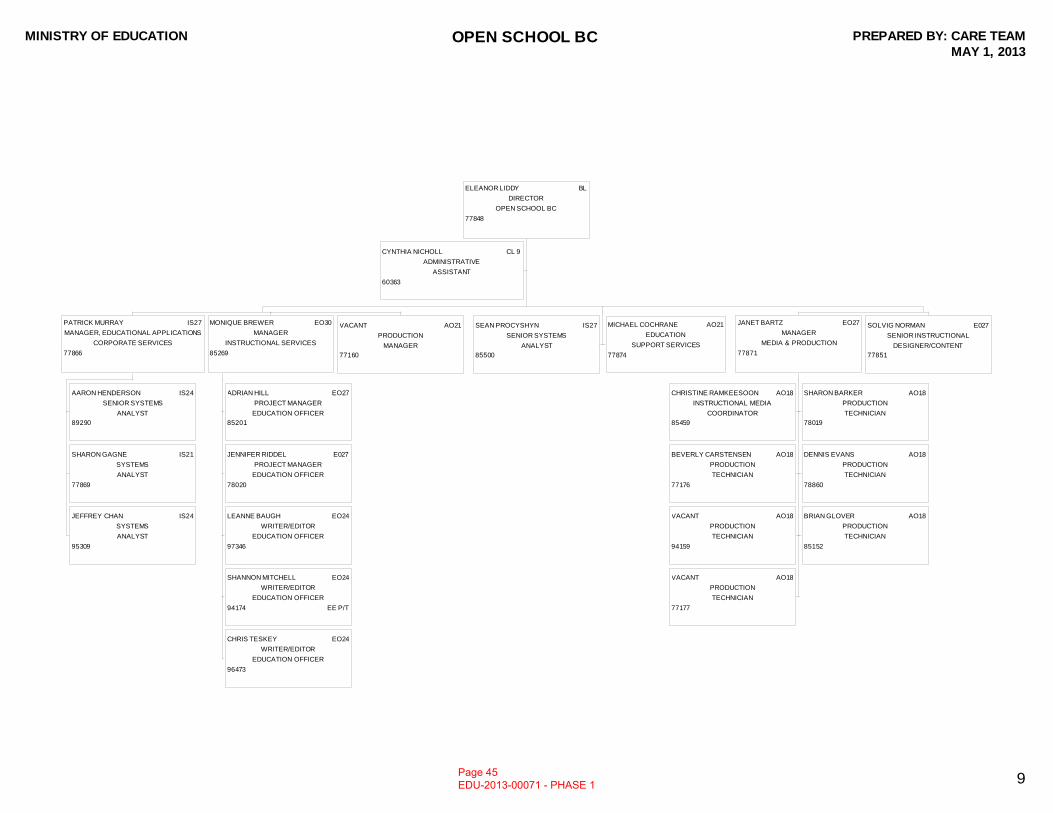
MINISTRY OF EDUCATION OPEN SCHOOL BC PREPARED BY: CARE TEAMMAY 1, 2013
9
ELEANOR LIDDY BL
DIRECTOR
OPEN SCHOOL BC
77848
CYNTHIA NICHOLL CL 9
ADMINISTRATIVE
ASSISTANT
60363
PATRICK MURRAY IS27
MANAGER, EDUCATIONAL APPLICATIONS
CORPORATE SERVICES
77866
AARON HENDERSON IS24
SENIOR SYSTEMS
ANALYST
89290
SHARON GAGNE IS21
SYSTEMS
ANALYST
77869
JEFFREY CHAN IS24
SYSTEMS
ANALYST
95309
MONIQUE BREWER EO30
MANAGER
INSTRUCTIONAL SERVICES
85269
ADRIAN HILL EO27
PROJECT MANAGER
EDUCATION OFFICER
85201
JENNIFER RIDDEL E027
PROJECT MANAGER
EDUCATION OFFICER
78020
LEANNE BAUGH EO24
WRITER/EDITOR
EDUCATION OFFICER
97346
SHANNON MITCHELL EO24
WRITER/EDITOR
EDUCATION OFFICER
94174 EE P/T
CHRIS TESKEY EO24
WRITER/EDITOR
EDUCATION OFFICER
96473
VACANT AO21
PRODUCTION
MANAGER
77160
SEAN PROCYSHYN IS27
SENIOR SYSTEMS
ANALYST
85500
MICHAEL COCHRANE AO21
EDUCATION
SUPPORT SERVICES
77874
JANET BARTZ EO27
MANAGER
MEDIA & PRODUCTION
77871
CHRISTINE RAMKEESOON AO18
INSTRUCTIONAL MEDIA
COORDINATOR
85459
SHARON BARKER AO18
PRODUCTION
TECHNICIAN
78019
BEVERLY CARSTENSEN AO18
PRODUCTION
TECHNICIAN
77176
DENNIS EVANS AO18
PRODUCTION
TECHNICIAN
78860
VACANT AO18
PRODUCTION
TECHNICIAN
94159
BRIAN GLOVER AO18
PRODUCTION
TECHNICIAN
85152
VACANT AO18
PRODUCTION
TECHNICIAN
77177
SOLVIG NORMAN E027
SENIOR INSTRUCTIONAL
DESIGNER/CONTENT
77851
Page 45 EDU-2013-00071 - PHASE 1
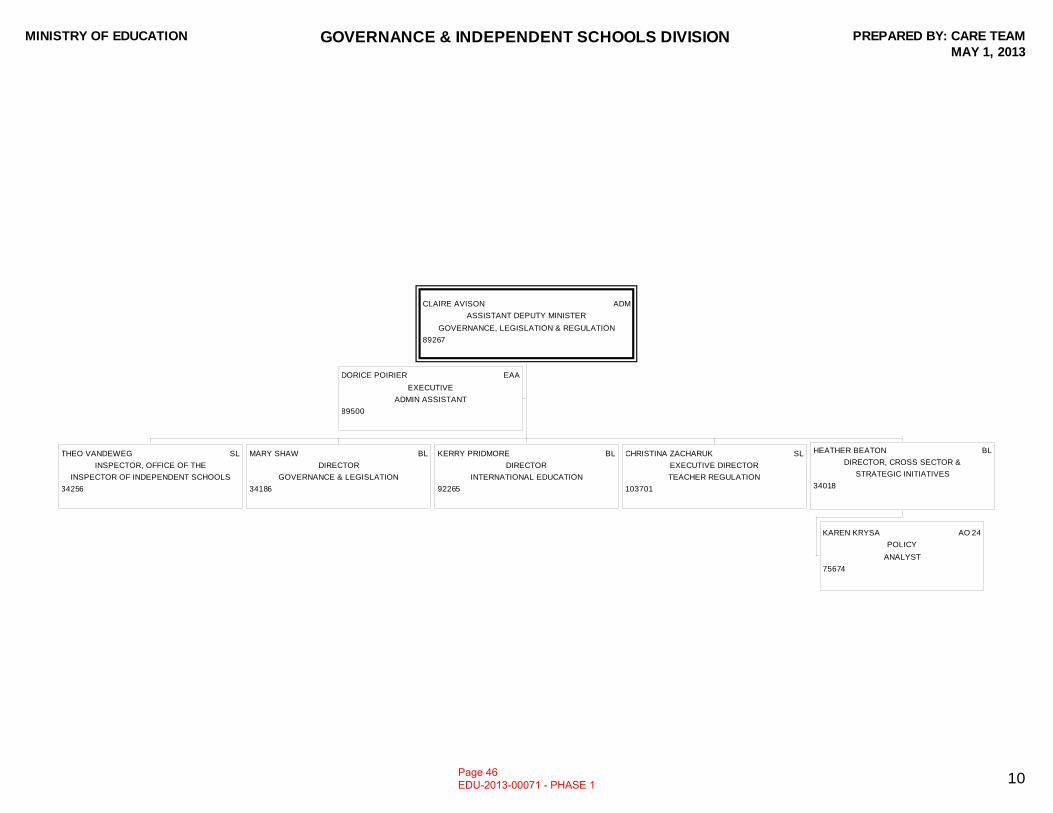
MINISTRY OF EDUCATION GOVERNANCE & INDEPENDENT SCHOOLS DIVISION PREPARED BY: CARE TEAMMAY 1, 2013
10
CLAIRE AVISON ADM
ASSISTANT DEPUTY MINISTER
GOVERNANCE, LEGISLATION & REGULATION
89267
DORICE POIRIER EAA
EXECUTIVE
ADMIN ASSISTANT
89500
THEO VANDEWEG SL
INSPECTOR, OFFICE OF THE
INSPECTOR OF INDEPENDENT SCHOOLS
34256
MARY SHAW BL
DIRECTOR
GOVERNANCE & LEGISLATION
34186
KERRY PRIDMORE BL
DIRECTOR
INTERNATIONAL EDUCATION
92265
CHRISTINA ZACHARUK SL
EXECUTIVE DIRECTOR
TEACHER REGULATION
103701
HEATHER BEATON BL
DIRECTOR, CROSS SECTOR &
STRATEGIC INITIATIVES
34018
KAREN KRYSA AO 24
POLICY
ANALYST
75674
Page 46 EDU-2013-00071 - PHASE 1
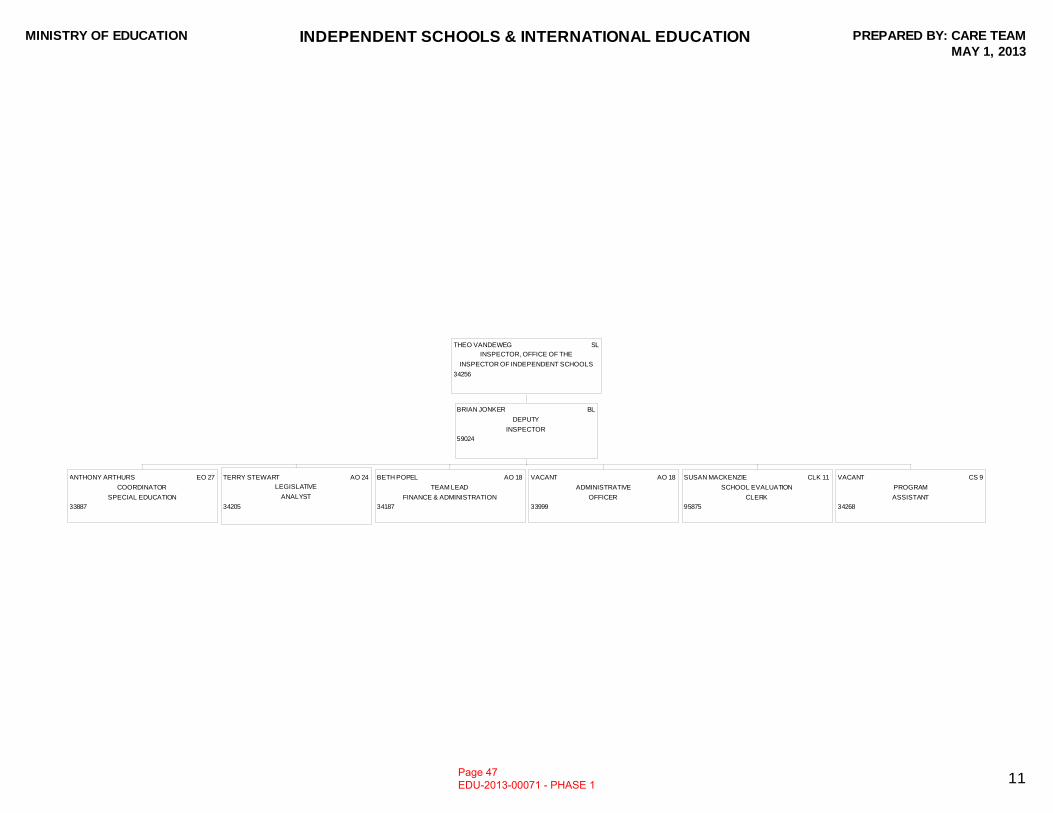
MINISTRY OF EDUCATION INDEPENDENT SCHOOLS & INTERNATIONAL EDUCATION PREPARED BY: CARE TEAMMAY 1, 2013
11
THEO VANDEWEG SL
INSPECTOR, OFFICE OF THE
INSPECTOR OF INDEPENDENT SCHOOLS
34256
BRIAN JONKER BL
DEPUTY
INSPECTOR
59024
ANTHONY ARTHURS EO 27
COORDINATOR
SPECIAL EDUCATION
33887
TERRY STEWART AO 24
LEGISLATIVE
ANALYST
34205
BETH POPEL AO 18
TEAM LEAD
FINANCE & ADMINISTRATION
34187
VACANT AO 18
ADMINISTRATIVE
OFFICER
33999
SUSAN MACKENZIE CLK 11
SCHOOL EVALUATION
CLERK
95875
VACANT CS 9
PROGRAM
ASSISTANT
34268
Page 47 EDU-2013-00071 - PHASE 1
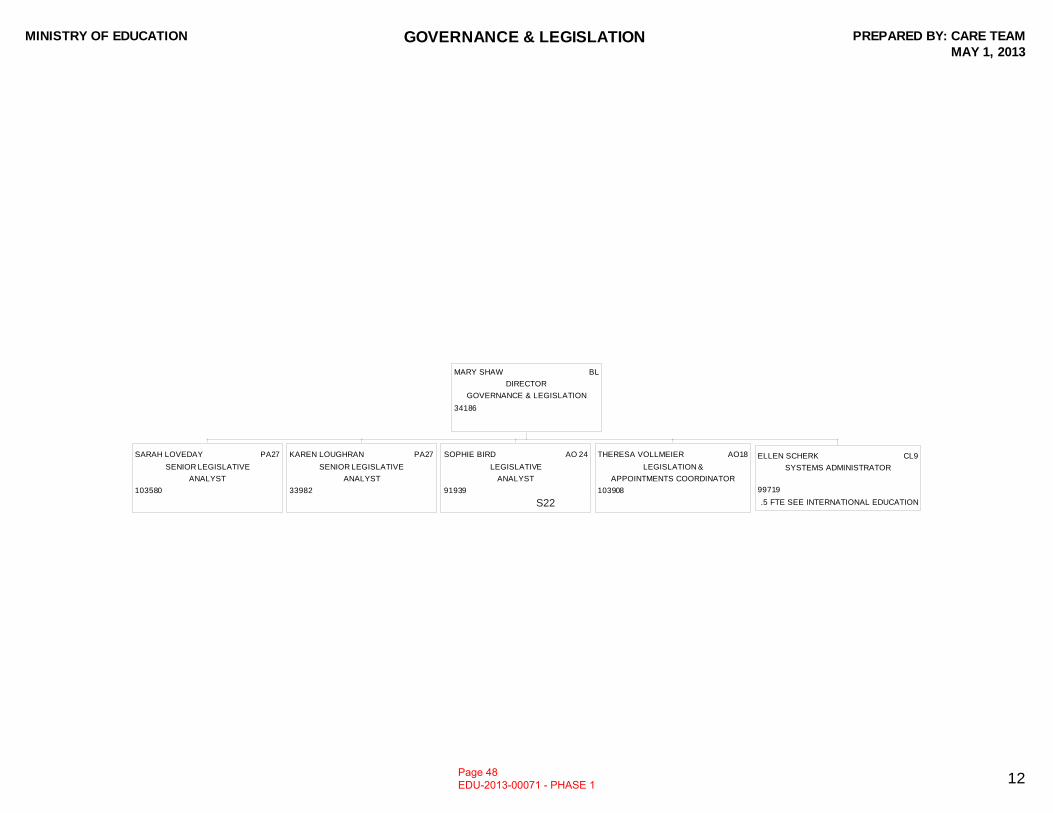
MINISTRY OF EDUCATION GOVERNANCE & LEGISLATION PREPARED BY: CARE TEAMMAY 1, 2013
12
MARY SHAW BL
DIRECTOR
GOVERNANCE & LEGISLATION
34186
SARAH LOVEDAY PA27
SENIOR LEGISLATIVE
ANALYST
103580
KAREN LOUGHRAN PA27
SENIOR LEGISLATIVE
ANALYST
33982
SOPHIE BIRD AO 24
LEGISLATIVE
ANALYST
91939
THERESA VOLLMEIER AO18
LEGISLATION &
APPOINTMENTS COORDINATOR
103908
ELLEN SCHERK CL9
SYSTEMS ADMINISTRATOR
99719
.5 FTE SEE INTERNATIONAL EDUCATION
Page 48 EDU-2013-00071 - PHASE 1
S22
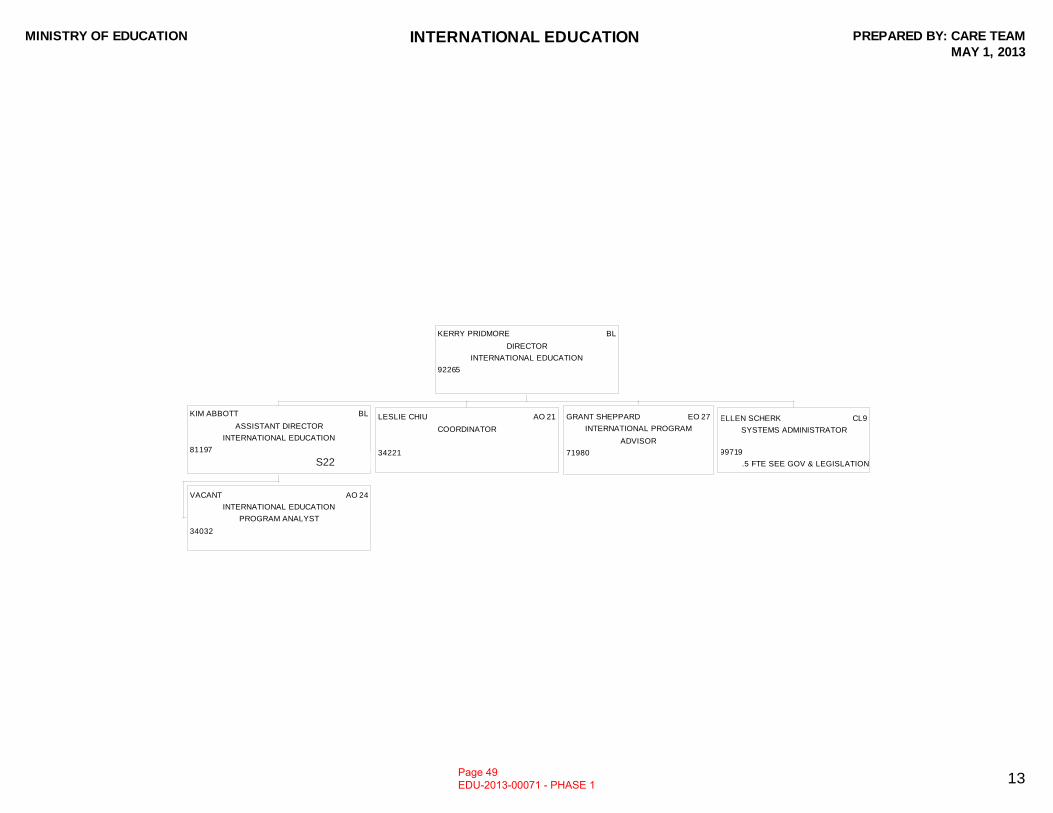
MINISTRY OF EDUCATION INTERNATIONAL EDUCATION PREPARED BY: CARE TEAMMAY 1, 2013
13
KERRY PRIDMORE BL
DIRECTOR
INTERNATIONAL EDUCATION
92265
KIM ABBOTT BL
ASSISTANT DIRECTOR
INTERNATIONAL EDUCATION
81197
VACANT AO 24
INTERNATIONAL EDUCATION
PROGRAM ANALYST
34032
LESLIE CHIU AO 21
COORDINATOR
34221
GRANT SHEPPARD EO 27
INTERNATIONAL PROGRAM
ADVISOR
71980
ELLEN SCHERK CL9
SYSTEMS ADMINISTRATOR
99719
.5 FTE SEE GOV & LEGISLATION
Page 49 EDU-2013-00071 - PHASE 1
S22
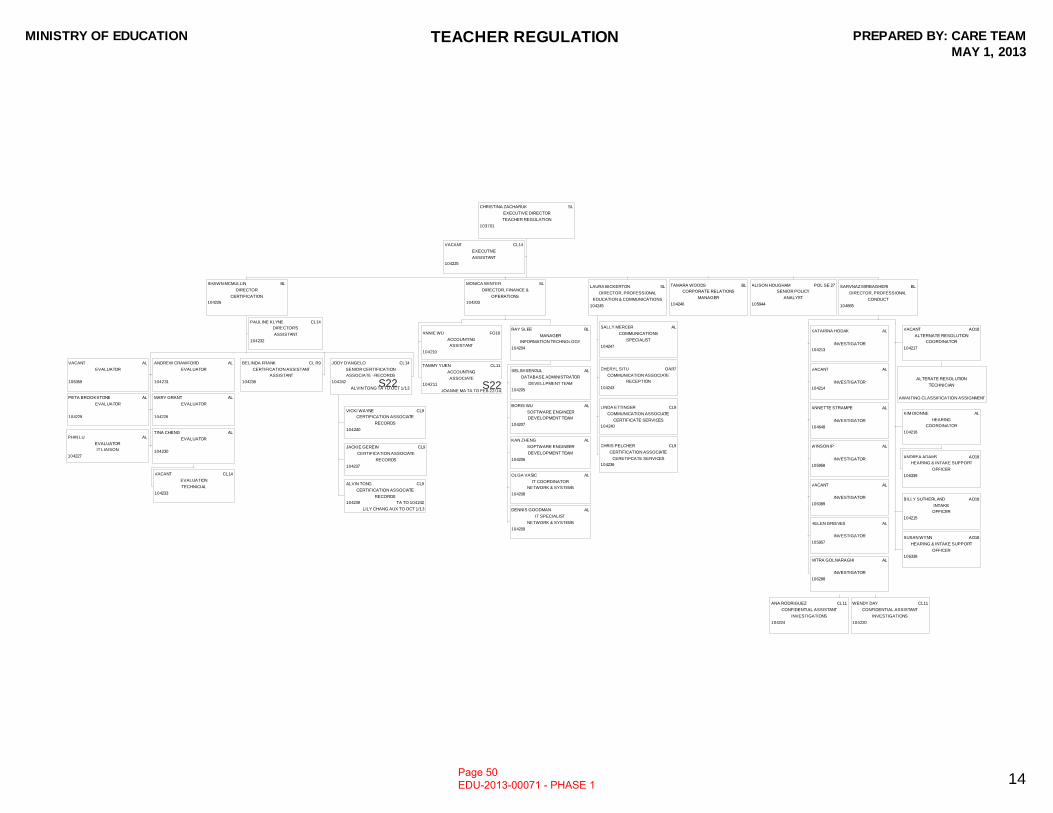
MINISTRY OF EDUCATION TEACHER REGULATION PREPARED BY: CARE TEAMMAY 1, 2013
14
CHRISTINA ZACHARUK SL
EXECUTIVE DIRECTOR
TEACHER REGULATION
103701
VACANT CL14
EXECUTIVE
ASSISTANT
104225
SHAWN MCMULLIN BL
DIRECTOR
CERTIFICATION
104226
PAULINE KLYNE CL14
DIRECTOR’S
ASSISTANT
104232
VACANT AL
EVALUATOR
106359
ANDREW CRAWFORD AL
EVALUATOR
104231
PETA BROOKSTONE AL
EVALUATOR
104229
MARY GRANT AL
EVALUATOR
104228
PHIN LU AL
EVALUATOR
IT LIAISON
104227
TINA CHENG AL
EVALUATOR
104230
VACANT CL14
EVALUATION
TECHNICIAL
104233
BELINDA FRANK CL R9
CERTIFICATION ASSISTANT
ASSISTANT
104238
JODY D’ANGELO CL14
SENIOR CERTIFICATION
ASSOCIATE - RECORDS
104242
ALVIN TONG TA TO OCT 1/13
VICKI WAYNE CL9
CERTIFICATION ASSOCIATE
RECORDS
104240
JACKIE GEREIN CL9
CERTIFICATION ASSOCIATE
RECORDS
104237
ALVIN TONG CL9
CERTIFICATION ASSOCIATE
RECORDS
104239 TA TO 104242
LILY CHANG AUX TO OCT 1/13
MONICA WINTER SL
DIRECTOR, FINANCE &
OPERATIONS
104203
ANNIE WU FO18
ACCOUNTING
ASSISTANT
104210
TAMMY YUEN CL11
ACCOUNTING
ASSOCIATE
104211
JOANNE MA TA TO FEB 22/14
RAY SLEE BL
MANAGER
INFORMATION TECHNOLOGY
104204
SELIM SENGUL AL
DATABASE ADMINISTRATOR
DEVELLPMENT TEAM
104205
BORIS WU AL
SOFTWARE ENGINEER
DEVELOPMENT TEAM
104207
KAN ZHENG AL
SOFTWARE ENGINEER
DEVELOPMENT TEAM
104206
OLGA VASIC AL
IT COORDINATOR
NETWORK & SYSTEMS
104208
DENNIS GOODMAN AL
IT SPECIALIST
NETWORK & SYSTEMS
104209
LAURA BICKERTON SL
DIRECTOR, PROFESSIONAL
EDUCATION & COMMUNICATIONS
104245
SALLY MERCER AL
COMMUNICATIONS
SPECIALIST
104247
CHERYL SITU OAR7
COMMUNICATION ASSOCIATE
RECEPTION
104243
LINDA ETTINGER CL9
COMMUNICATION ASSOCIATE
CERTIFICATE SERVICES
104240
CHRIS PELCHER CL9
CERTIFICATION ASSOCIATE
CERETIFCATE SERVICES
104236
TAMARA WOODS BL
CORPORATE RELATIONS
MANAGER
104246
ALISON HOUGHAM POL SE 27
SENIOR POLICY
ANALYST
105944
SARVNAZ MIRBAGHERI BL
DIRECTOR, PROFESSIONAL
CONDUCT
104865
KATARINA HODAK AL
INVESTIGATOR
104213
VACANT AL
INVESTIGATOR
104214
ANNETTE STRAMPE AL
INVESTIGATOR
104648
WINSON IP AL
INVESTIGATOR
105958
VACANT AL
INVESTIGATOR
106389
HELEN GRIEVES AL
INVESTIGATOR
105957
MITRA GOLNARAGHI AL
INVESTIGATOR
106288
ANA RODRIGUEZ CL11
CONFIDENTIAL ASSISTANT
INVESTIGATIONS
104224
WENDY DAY CL11
CONFIDENTIAL ASSISTANT
INVESTIGATIONS
104220
VACANT AO18
ALTERNATE RESOLUTION
COORDINATOR
104217
ALTERATE RESOLUTION
TECHNICIAN
AWAITING CLASSIFICATION ASSIGNMENT
KIM DIONNE AL
HEARING
COORDINATOR
104216
ANDREA ADAMS AO18
HEARING & INTAKE SUPPORT
OFFICER
106339
BILLY SUTHERLAND AO18
INTAKE
OFFICER
104215
SUSAN WYNN AO18
HEARING & INTAKE SUPPORT
OFFICER
106338
Page 50 EDU-2013-00071 - PHASE 1
S22 S22
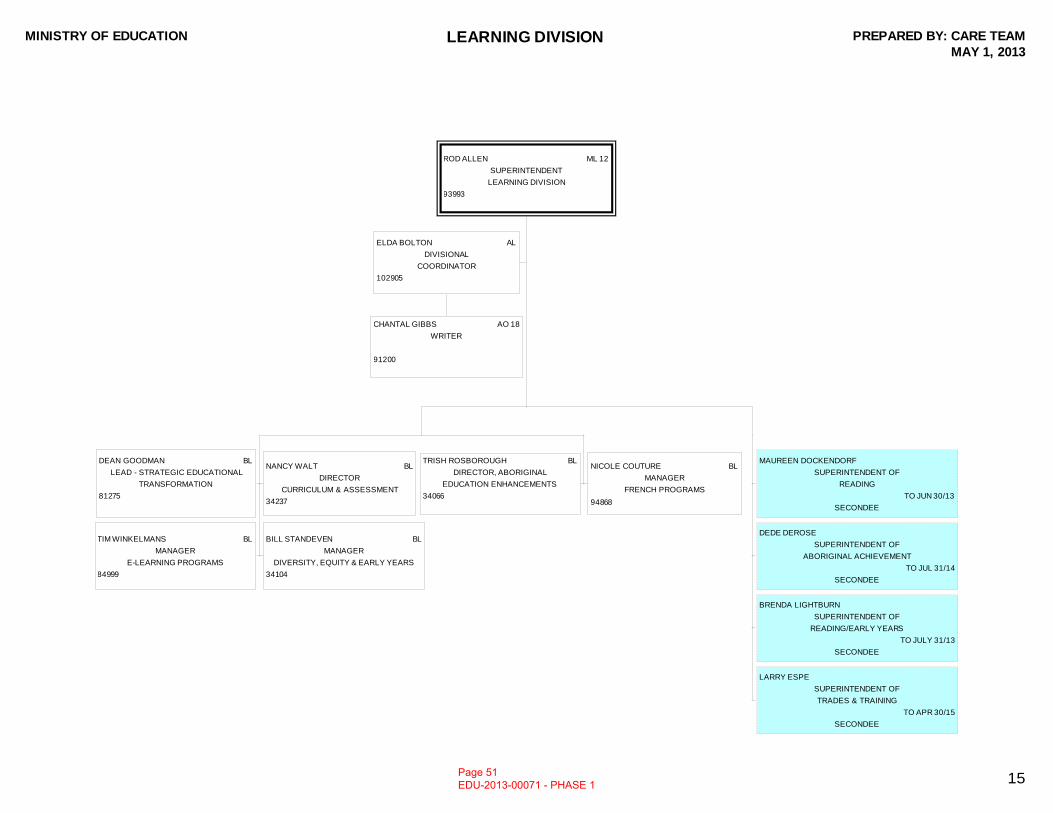
MINISTRY OF EDUCATION LEARNING DIVISION PREPARED BY: CARE TEAMMAY 1, 2013
15
ROD ALLEN ML 12
SUPERINTENDENT
LEARNING DIVISION
93993
ELDA BOLTON AL
DIVISIONAL
COORDINATOR
102905
CHANTAL GIBBS AO 18
WRITER
91200
DEAN GOODMAN BL
LEAD - STRATEGIC EDUCATIONAL
TRANSFORMATION
81275
NANCY WALT BL
DIRECTOR
CURRICULUM & ASSESSMENT
34237
TRISH ROSBOROUGH BL
DIRECTOR, ABORIGINAL
EDUCATION ENHANCEMENTS
34066
NICOLE COUTURE BL
MANAGER
FRENCH PROGRAMS
94868
TIM WINKELMANS BL
MANAGER
E-LEARNING PROGRAMS
84999
BILL STANDEVEN BL
MANAGER
DIVERSITY, EQUITY & EARLY YEARS
34104
MAUREEN DOCKENDORF
SUPERINTENDENT OF
READING
TO JUN 30/13
SECONDEE
DEDE DEROSE
SUPERINTENDENT OF
ABORIGINAL ACHIEVEMENT
TO JUL 31/14
SECONDEE
BRENDA LIGHTBURN
SUPERINTENDENT OF
READING/EARLY YEARS
TO JULY 31/13
SECONDEE
LARRY ESPE
SUPERINTENDENT OF
TRADES & TRAINING
TO APR 30/15
SECONDEE
Page 51 EDU-2013-00071 - PHASE 1
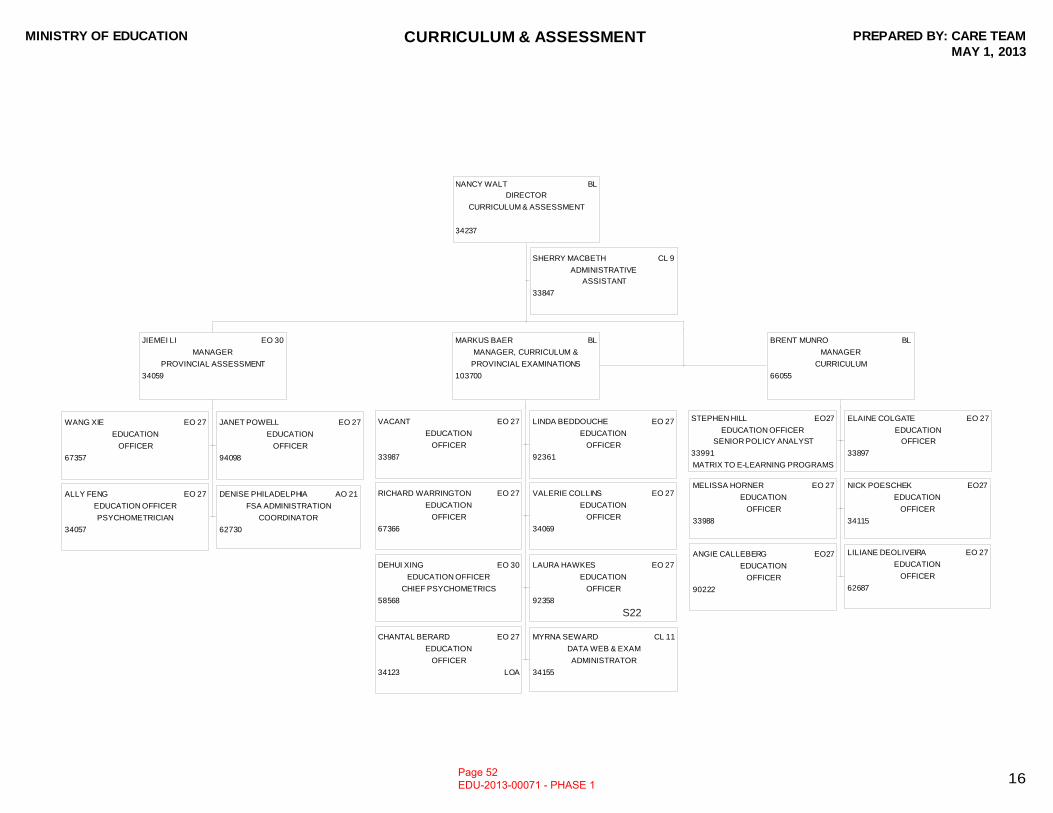
MINISTRY OF EDUCATION CURRICULUM & ASSESSMENT PREPARED BY: CARE TEAMMAY 1, 2013
16
NANCY WALT BL
DIRECTOR
CURRICULUM & ASSESSMENT
34237
SHERRY MACBETH CL 9
ADMINISTRATIVE
ASSISTANT
33847
JIEMEI LI EO 30
MANAGER
PROVINCIAL ASSESSMENT
34059
WANG XIE EO 27
EDUCATION
OFFICER
67357
JANET POWELL EO 27
EDUCATION
OFFICER
94098
ALLY FENG EO 27
EDUCATION OFFICER
PSYCHOMETRICIAN
34057
DENISE PHILADELPHIA AO 21
FSA ADMINISTRATION
COORDINATOR
62730
MARKUS BAER BL
MANAGER, CURRICULUM &
PROVINCIAL EXAMINATIONS
103700
VACANT EO 27
EDUCATION
OFFICER
33987
LINDA BEDDOUCHE EO 27
EDUCATION
OFFICER
92361
RICHARD WARRINGTON EO 27
EDUCATION
OFFICER
67366
VALERIE COLLINS EO 27
EDUCATION
OFFICER
34069
DEHUI XING EO 30
EDUCATION OFFICER
CHIEF PSYCHOMETRICS
58568
LAURA HAWKES EO 27
EDUCATION
OFFICER
92358
CHANTAL BERARD EO 27
EDUCATION
OFFICER
34123 LOA
MYRNA SEWARD CL 11
DATA WEB & EXAM
ADMINISTRATOR
34155
BRENT MUNRO BL
MANAGER
CURRICULUM
66055
STEPHEN HILL EO27
EDUCATION OFFICER
SENIOR POLICY ANALYST
33991
MATRIX TO E-LEARNING PROGRAMS
ELAINE COLGATE EO 27
EDUCATION
OFFICER
33897
MELISSA HORNER EO 27
EDUCATION
OFFICER
33988
NICK POESCHEK EO27
EDUCATION
OFFICER
34115
ANGIE CALLEBERG EO27
EDUCATION
OFFICER
90222
LILIANE DEOLIVEIRA EO 27
EDUCATION
OFFICER
62687
Page 52 EDU-2013-00071 - PHASE 1
S22
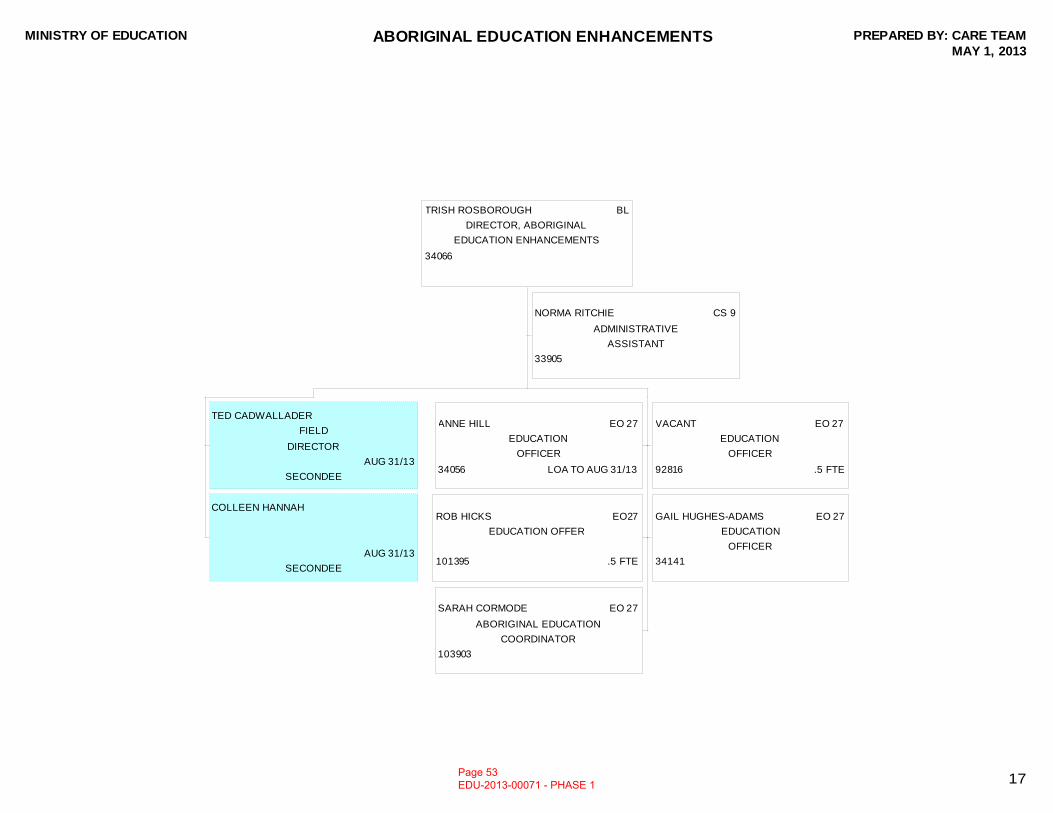
MINISTRY OF EDUCATION ABORIGINAL EDUCATION ENHANCEMENTS PREPARED BY: CARE TEAMMAY 1, 2013
17
TRISH ROSBOROUGH BL
DIRECTOR, ABORIGINAL
EDUCATION ENHANCEMENTS
34066
NORMA RITCHIE CS 9
ADMINISTRATIVE
ASSISTANT
33905
TED CADWALLADER
FIELD
DIRECTOR
AUG 31/13
SECONDEE
COLLEEN HANNAH
AUG 31/13
SECONDEE
ANNE HILL EO 27
EDUCATION
OFFICER
34056 LOA TO AUG 31/13
VACANT EO 27
EDUCATION
OFFICER
92816 .5 FTE
ROB HICKS EO27
EDUCATION OFFER
101395 .5 FTE
GAIL HUGHES-ADAMS EO 27
EDUCATION
OFFICER
34141
SARAH CORMODE EO 27
ABORIGINAL EDUCATION
COORDINATOR
103903
Page 53 EDU-2013-00071 - PHASE 1
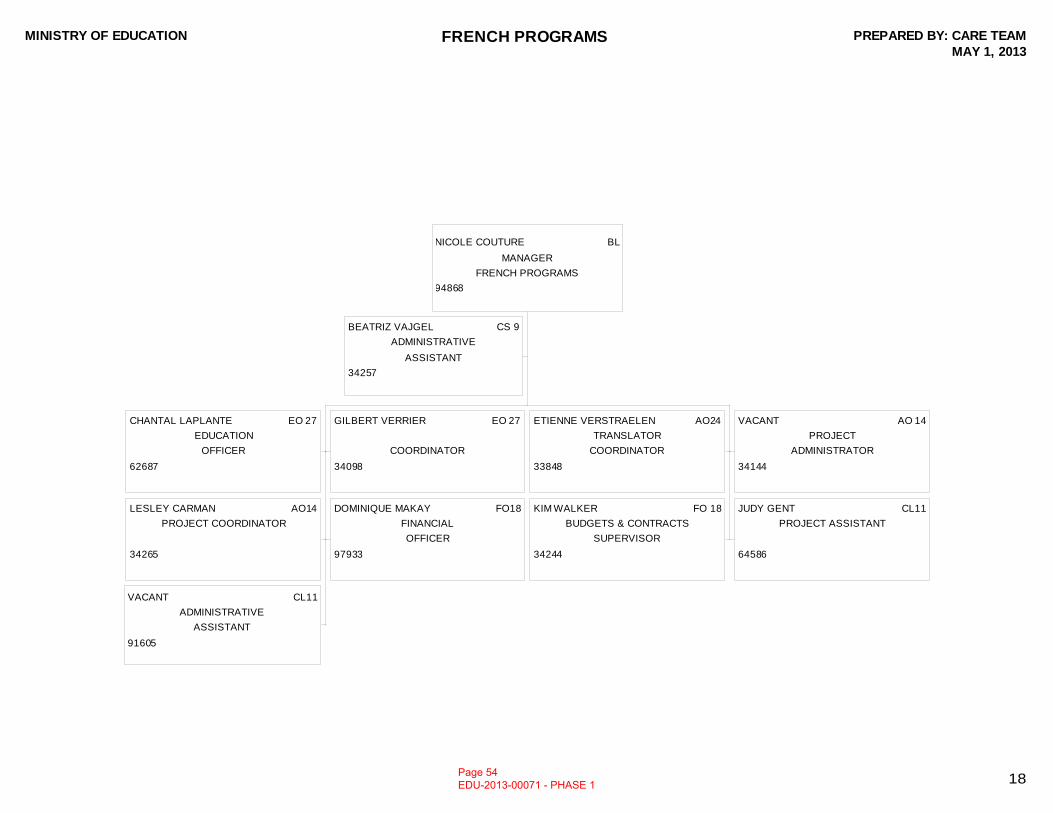
MINISTRY OF EDUCATION FRENCH PROGRAMS PREPARED BY: CARE TEAMMAY 1, 2013
18
NICOLE COUTURE BL
MANAGER
FRENCH PROGRAMS
94868
BEATRIZ VAJGEL CS 9
ADMINISTRATIVE
ASSISTANT
34257
CHANTAL LAPLANTE EO 27
EDUCATION
OFFICER
62687
GILBERT VERRIER EO 27
COORDINATOR
34098
ETIENNE VERSTRAELEN AO24
TRANSLATOR
COORDINATOR
33848
VACANT AO 14
PROJECT
ADMINISTRATOR
34144
LESLEY CARMAN AO14
PROJECT COORDINATOR
34265
DOMINIQUE MAKAY FO18
FINANCIAL
OFFICER
97933
KIM WALKER FO 18
BUDGETS & CONTRACTS
SUPERVISOR
34244
JUDY GENT CL11
PROJECT ASSISTANT
64586
VACANT CL11
ADMINISTRATIVE
ASSISTANT
91605
Page 54 EDU-2013-00071 - PHASE 1
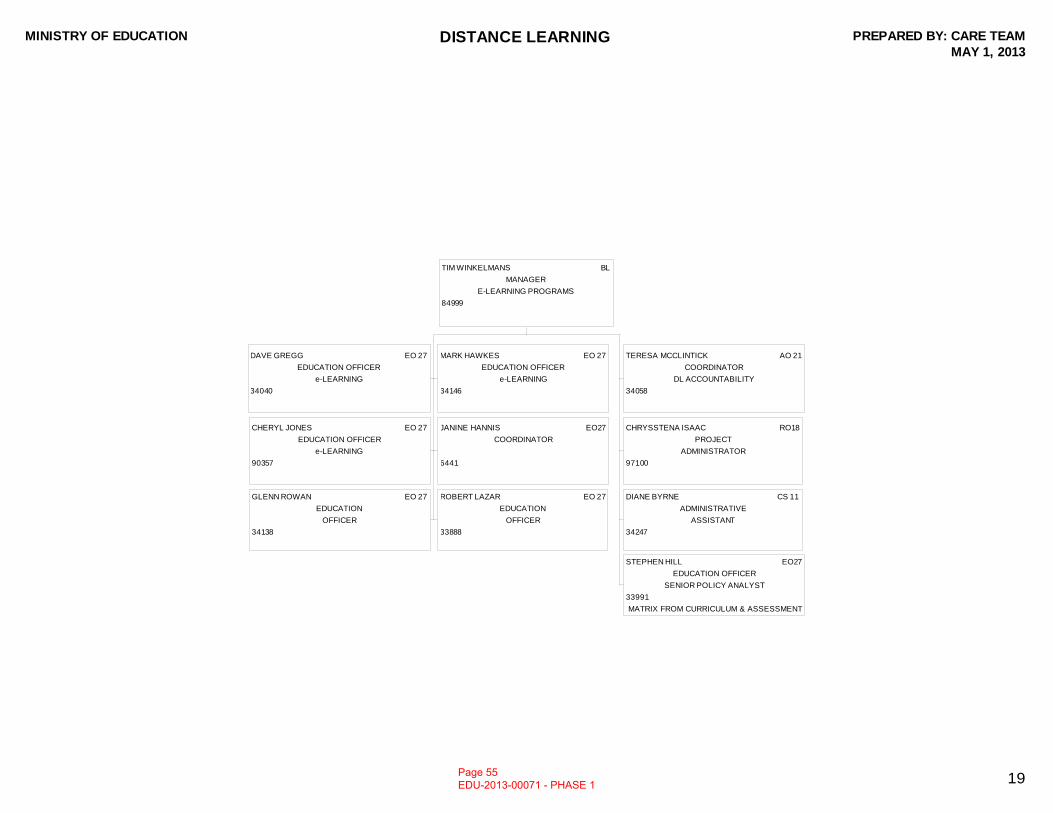
MINISTRY OF EDUCATION DISTANCE LEARNING PREPARED BY: CARE TEAMMAY 1, 2013
19
TIM WINKELMANS BL
MANAGER
E-LEARNING PROGRAMS
84999
DAVE GREGG EO 27
EDUCATION OFFICER
e-LEARNING
34040
MARK HAWKES EO 27
EDUCATION OFFICER
e-LEARNING
34146
CHERYL JONES EO 27
EDUCATION OFFICER
e-LEARNING
90357
JANINE HANNIS EO27
COORDINATOR
6441
GLENN ROWAN EO 27
EDUCATION
OFFICER
34138
ROBERT LAZAR EO 27
EDUCATION
OFFICER
33888
TERESA MCCLINTICK AO 21
COORDINATOR
DL ACCOUNTABILITY
34058
CHRYSSTENA ISAAC RO18
PROJECT
ADMINISTRATOR
97100
DIANE BYRNE CS 11
ADMINISTRATIVE
ASSISTANT
34247
STEPHEN HILL EO27
EDUCATION OFFICER
SENIOR POLICY ANALYST
33991
MATRIX FROM CURRICULUM & ASSESSMENT
Page 55 EDU-2013-00071 - PHASE 1
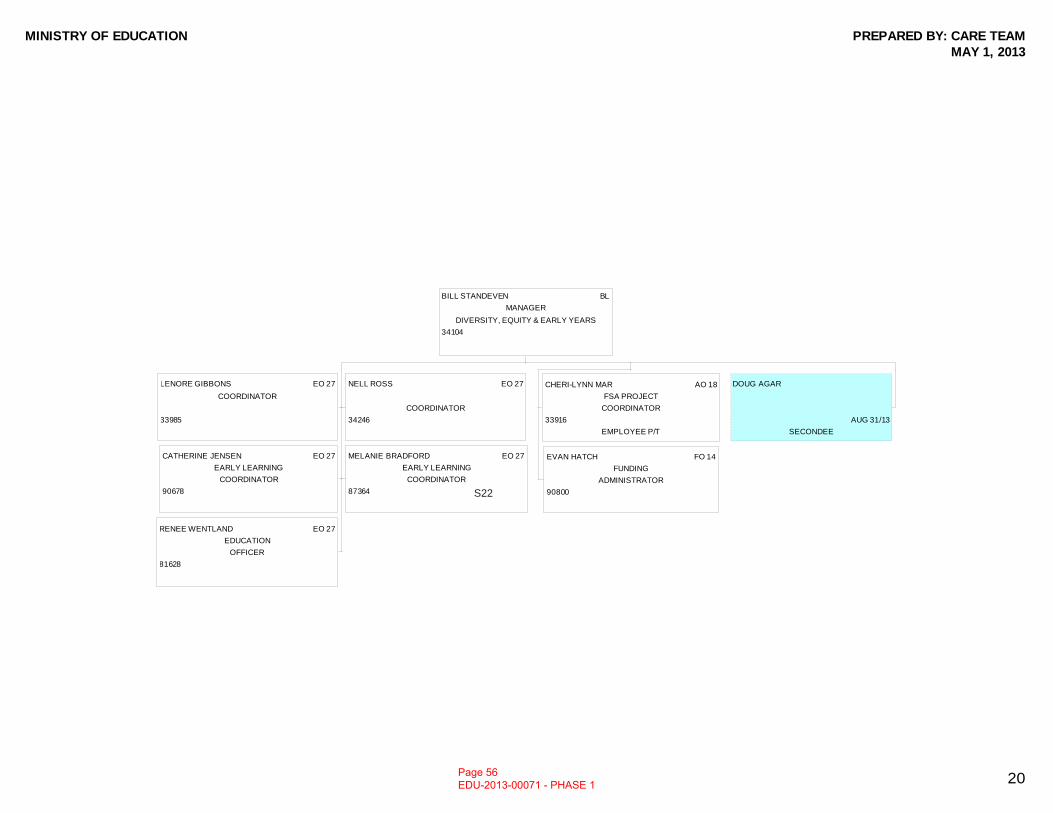
MINISTRY OF EDUCATION PREPARED BY: CARE TEAMMAY 1, 2013
20
BILL STANDEVEN BL
MANAGER
DIVERSITY, EQUITY & EARLY YEARS
34104
LENORE GIBBONS EO 27
COORDINATOR
33985
NELL ROSS EO 27
COORDINATOR
34246
CATHERINE JENSEN EO 27
EARLY LEARNING
COORDINATOR
90678
MELANIE BRADFORD EO 27
EARLY LEARNING
COORDINATOR
87364
RENEE WENTLAND EO 27
EDUCATION
OFFICER
81628
CHERI-LYNN MAR AO 18
FSA PROJECT
COORDINATOR
33916
EMPLOYEE P/T
EVAN HATCH FO 14
FUNDING
ADMINISTRATOR
90800
DOUG AGAR
AUG 31/13
SECONDEE
Page 56 EDU-2013-00071 - PHASE 1
S22
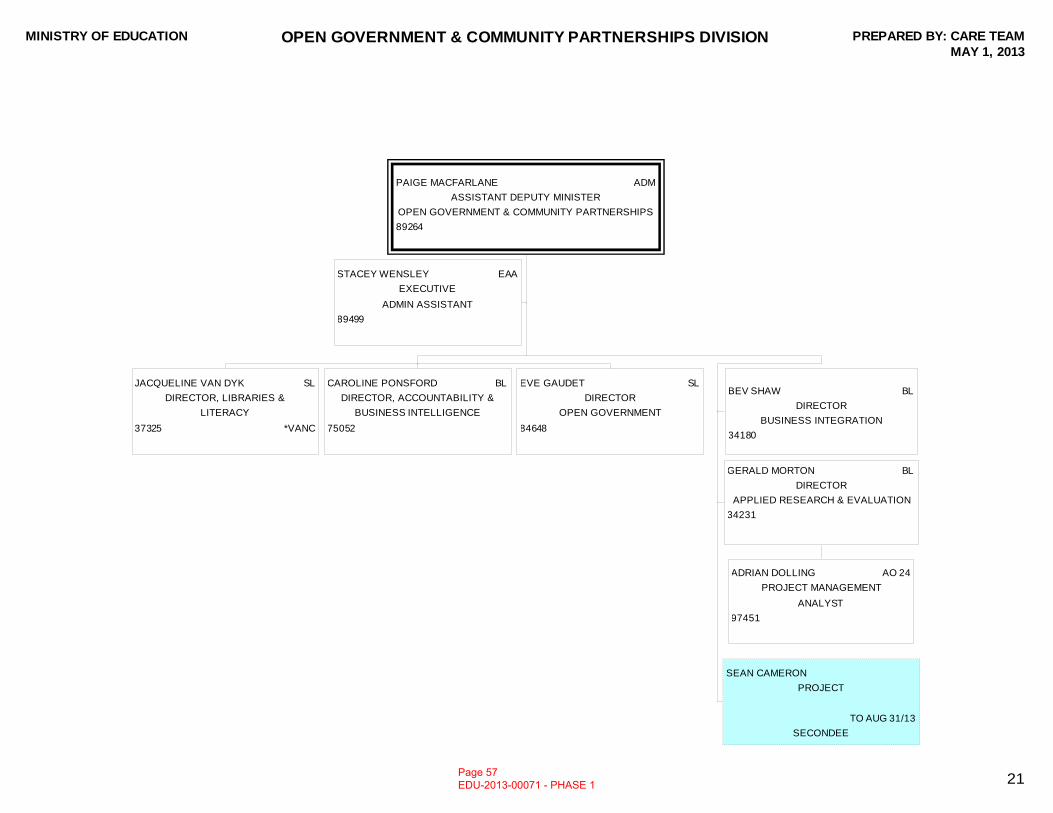
MINISTRY OF EDUCATION OPEN GOVERNMENT & COMMUNITY PARTNERSHIPS DIVISION PREPARED BY: CARE TEAMMAY 1, 2013
21
PAIGE MACFARLANE ADM
ASSISTANT DEPUTY MINISTER
OPEN GOVERNMENT & COMMUNITY PARTNERSHIPS
89264
STACEY WENSLEY EAA
EXECUTIVE
ADMIN ASSISTANT
89499
JACQUELINE VAN DYK SL
DIRECTOR, LIBRARIES &
LITERACY
37325 *VANC
CAROLINE PONSFORD BL
DIRECTOR, ACCOUNTABILITY &
BUSINESS INTELLIGENCE
75052
EVE GAUDET SL
DIRECTOR
OPEN GOVERNMENT
84648
BEV SHAW BL
DIRECTOR
BUSINESS INTEGRATION
34180
GERALD MORTON BL
DIRECTOR
APPLIED RESEARCH & EVALUATION
34231
ADRIAN DOLLING AO 24
PROJECT MANAGEMENT
ANALYST
97451
SEAN CAMERON
PROJECT
TO AUG 31/13
SECONDEE
Page 57 EDU-2013-00071 - PHASE 1
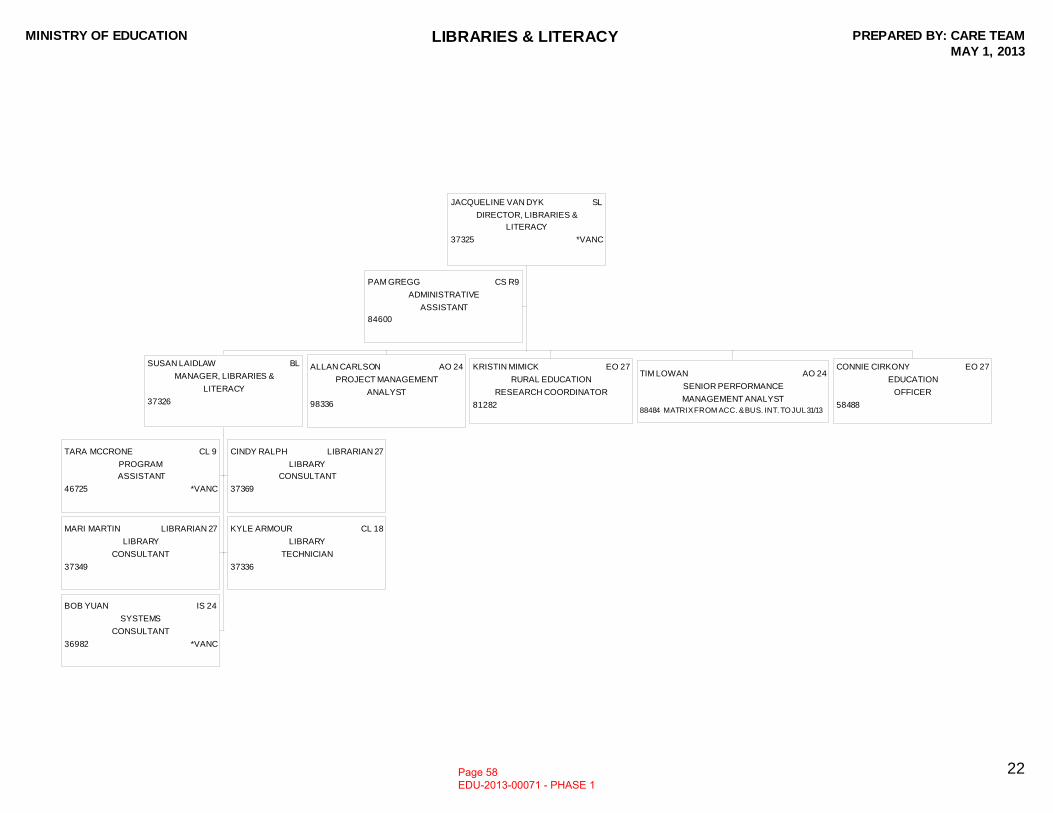
MINISTRY OF EDUCATION LIBRARIES & LITERACY PREPARED BY: CARE TEAMMAY 1, 2013
22
JACQUELINE VAN DYK SL
DIRECTOR, LIBRARIES &
LITERACY
37325 *VANC
PAM GREGG CS R9
ADMINISTRATIVE
ASSISTANT
84600
SUSAN LAIDLAW BL
MANAGER, LIBRARIES &
LITERACY
37326
TARA MCCRONE CL 9
PROGRAM
ASSISTANT
46725 *VANC
CINDY RALPH LIBRARIAN 27
LIBRARY
CONSULTANT
37369
MARI MARTIN LIBRARIAN 27
LIBRARY
CONSULTANT
37349
KYLE ARMOUR CL 18
LIBRARY
TECHNICIAN
37336
BOB YUAN IS 24
SYSTEMS
CONSULTANT
36982 *VANC
ALLAN CARLSON AO 24
PROJECT MANAGEMENT
ANALYST
98336
KRISTIN MIMICK EO 27
RURAL EDUCATION
RESEARCH COORDINATOR
81282
TIM LOWAN AO 24
SENIOR PERFORMANCE
MANAGEMENT ANALYST
88484 MATRIX FROM ACC. & BUS. INT. TO JUL 31/13
CONNIE CIRKONY EO 27
EDUCATION
OFFICER
58488
Page 58 EDU-2013-00071 - PHASE 1
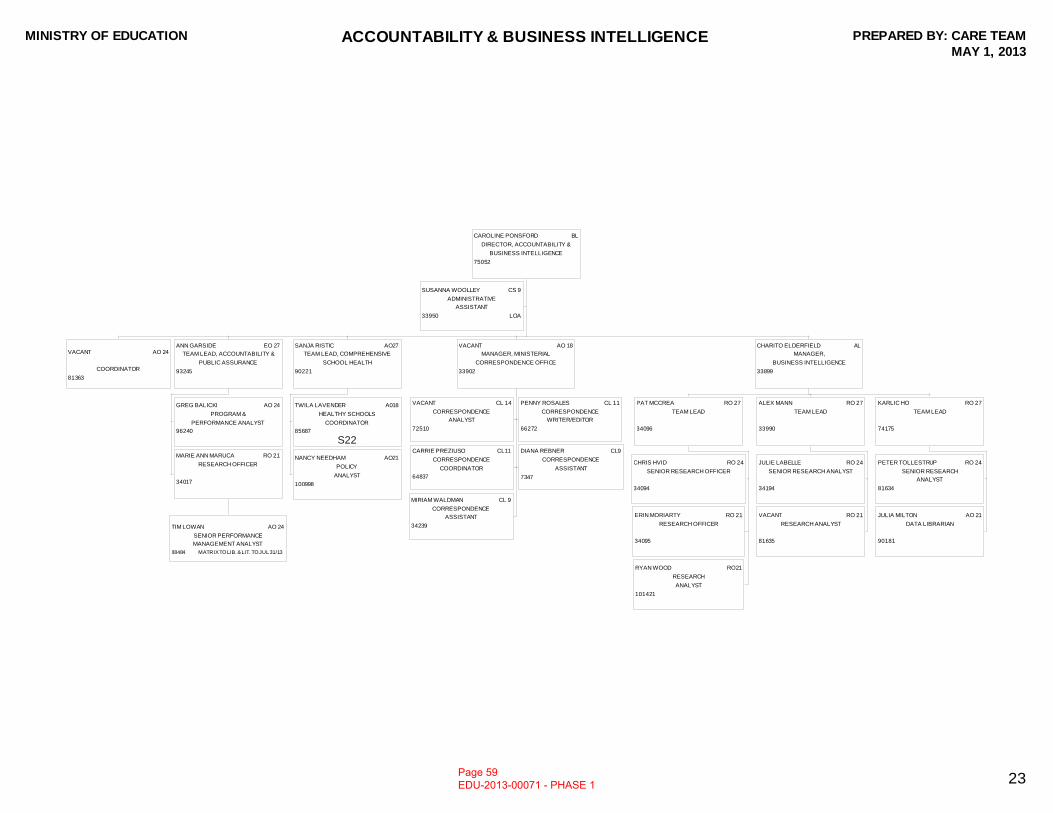
MINISTRY OF EDUCATION ACCOUNTABILITY & BUSINESS INTELLIGENCE PREPARED BY: CARE TEAMMAY 1, 2013
23
CAROLINE PONSFORD BL
DIRECTOR, ACCOUNTABILITY &
BUSINESS INTELLIGENCE
75052
SUSANNA WOOLLEY CS 9
ADMINISTRATIVE
ASSISTANT
33950 LOA
VACANT AO 24
COORDINATOR
81363
ANN GARSIDE EO 27
TEAM LEAD, ACCOUNTABILITY &
PUBLIC ASSURANCE
93245
GREG BALICKI AO 24
PROGRAM &
PERFORMANCE ANALYST
96240
MARIE ANN MARUCA RO 21
RESEARCH OFFICER
34017
TIM LOWAN AO 24
SENIOR PERFORMANCE
MANAGEMENT ANALYST
88484 MATRIX TO LIB. & LIT. TO JUL 31/13
SANJA RISTIC AO27
TEAM LEAD, COMPREHENSIVE
SCHOOL HEALTH
90221
TWILA LAVENDER A018
HEALTHY SCHOOLS
COORDINATOR
85687
NANCY NEEDHAM AO21
POLICY
ANALYST
100998
VACANT AO 18
MANAGER, MINISTERIAL
CORRESPONDENCE OFFICE
33902
VACANT CL 14
CORRESPONDENCE
ANALYST
72510
PENNY ROSALES CL 11
CORRESPONDENCE
WRITER/EDITOR
66272
CARRIE PREZIUSO CL11
CORRESPONDENCE
COORDINATOR
64837
DIANA REBNER CL9
CORRESPONDENCE
ASSISTANT
7347
MIRIAM WALDMAN CL 9
CORRESPONDENCE
ASSISTANT
34239
CHARITO ELDERFIELD AL
MANAGER,
BUSINESS INTELLIGENCE
33899
PAT MCCREA RO 27
TEAM LEAD
34096
CHRIS HVID RO 24
SENIOR RESEARCH OFFICER
34094
ERIN MORIARTY RO 21
RESEARCH OFFICER
34095
RYAN WOOD RO21
RESEARCH
ANALYST
101421
ALEX MANN RO 27
TEAM LEAD
33990
JULIE LABELLE RO 24
SENIOR RESEARCH ANALYST
34194
VACANT RO 21
RESEARCH ANALYST
81635
KARLIC HO RO 27
TEAM LEAD
74175
PETER TOLLESTRUP RO 24
SENIOR RESEARCH
ANALYST
81634
JULIA MILTON AO 21
DATA LIBRARIAN
90181
Page 59 EDU-2013-00071 - PHASE 1
S22
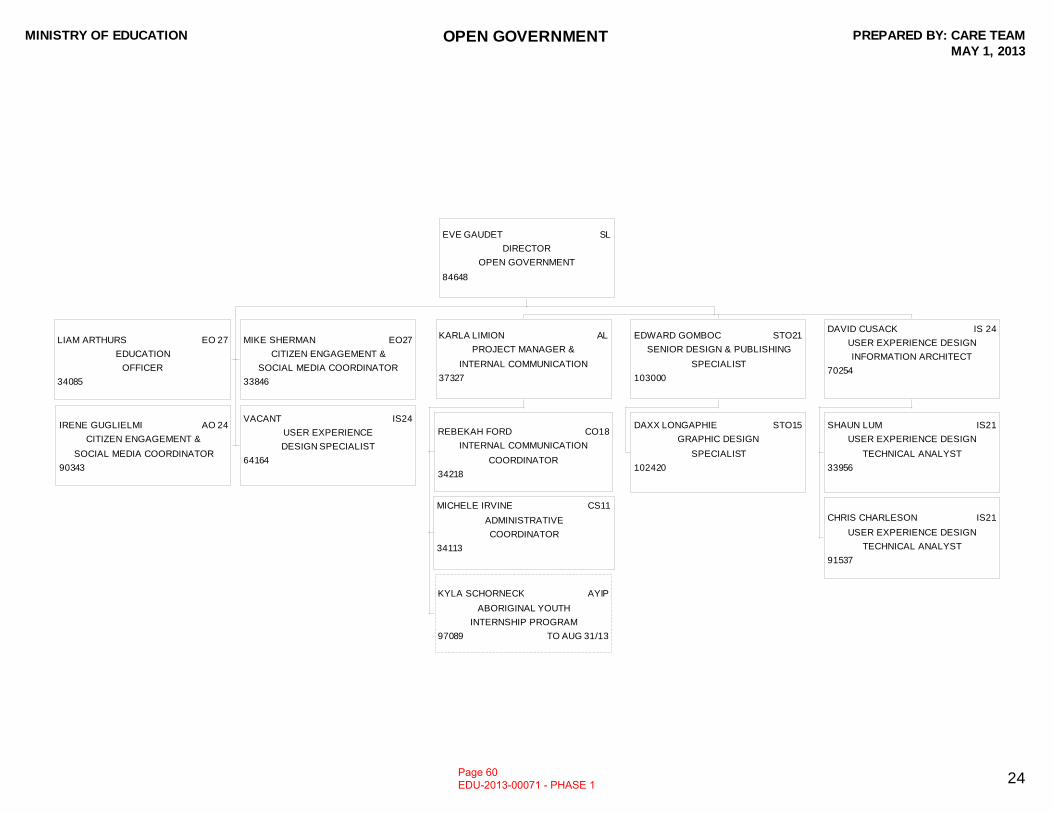
MINISTRY OF EDUCATION OPEN GOVERNMENT PREPARED BY: CARE TEAMMAY 1, 2013
24
EVE GAUDET SL
DIRECTOR
OPEN GOVERNMENT
84648
LIAM ARTHURS EO 27
EDUCATION
OFFICER
34085
MIKE SHERMAN EO27
CITIZEN ENGAGEMENT &
SOCIAL MEDIA COORDINATOR
33846
IRENE GUGLIELMI AO 24
CITIZEN ENGAGEMENT &
SOCIAL MEDIA COORDINATOR
90343
VACANT IS24
USER EXPERIENCE
DESIGN SPECIALIST
64164
KARLA LIMION AL
PROJECT MANAGER &
INTERNAL COMMUNICATION
37327
REBEKAH FORD CO18
INTERNAL COMMUNICATION
COORDINATOR
34218
MICHELE IRVINE CS11
ADMINISTRATIVE
COORDINATOR
34113
KYLA SCHORNECK AYIP
ABORIGINAL YOUTH
INTERNSHIP PROGRAM
97089 TO AUG 31/13
EDWARD GOMBOC STO21
SENIOR DESIGN & PUBLISHING
SPECIALIST
103000
DAXX LONGAPHIE STO15
GRAPHIC DESIGN
SPECIALIST
102420
DAVID CUSACK IS 24
USER EXPERIENCE DESIGN
INFORMATION ARCHITECT
70254
SHAUN LUM IS21
USER EXPERIENCE DESIGN
TECHNICAL ANALYST
33956
CHRIS CHARLESON IS21
USER EXPERIENCE DESIGN
TECHNICAL ANALYST
91537
Page 60 EDU-2013-00071 - PHASE 1
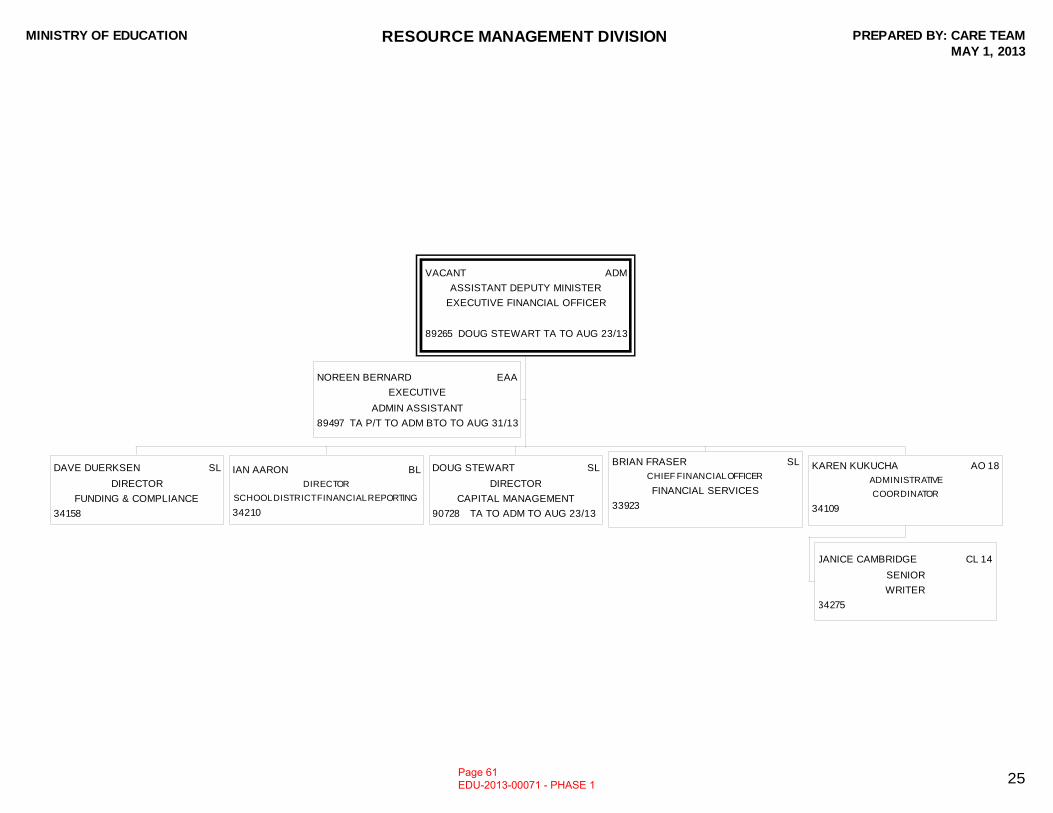
MINISTRY OF EDUCATION RESOURCE MANAGEMENT DIVISION PREPARED BY: CARE TEAMMAY 1, 2013
25
VACANT ADM
ASSISTANT DEPUTY MINISTER
EXECUTIVE FINANCIAL OFFICER
89265 DOUG STEWART TA TO AUG 23/13
NOREEN BERNARD EAA
EXECUTIVE
ADMIN ASSISTANT
89497 TA P/T TO ADM BTO TO AUG 31/13
DAVE DUERKSEN SL
DIRECTOR
FUNDING & COMPLIANCE
34158
IAN AARON BL
DIRECTOR
SCHOOL DISTRICT FINANCIAL REPORTING
34210
DOUG STEWART SL
DIRECTOR
CAPITAL MANAGEMENT
90728 TA TO ADM TO AUG 23/13
BRIAN FRASER SL
CHIEF FINANCIAL OFFICER
FINANCIAL SERVICES
33923
KAREN KUKUCHA AO 18
ADMINISTRATIVE
COORDINATOR
34109
JANICE CAMBRIDGE CL 14
SENIOR
WRITER
34275
Page 61 EDU-2013-00071 - PHASE 1
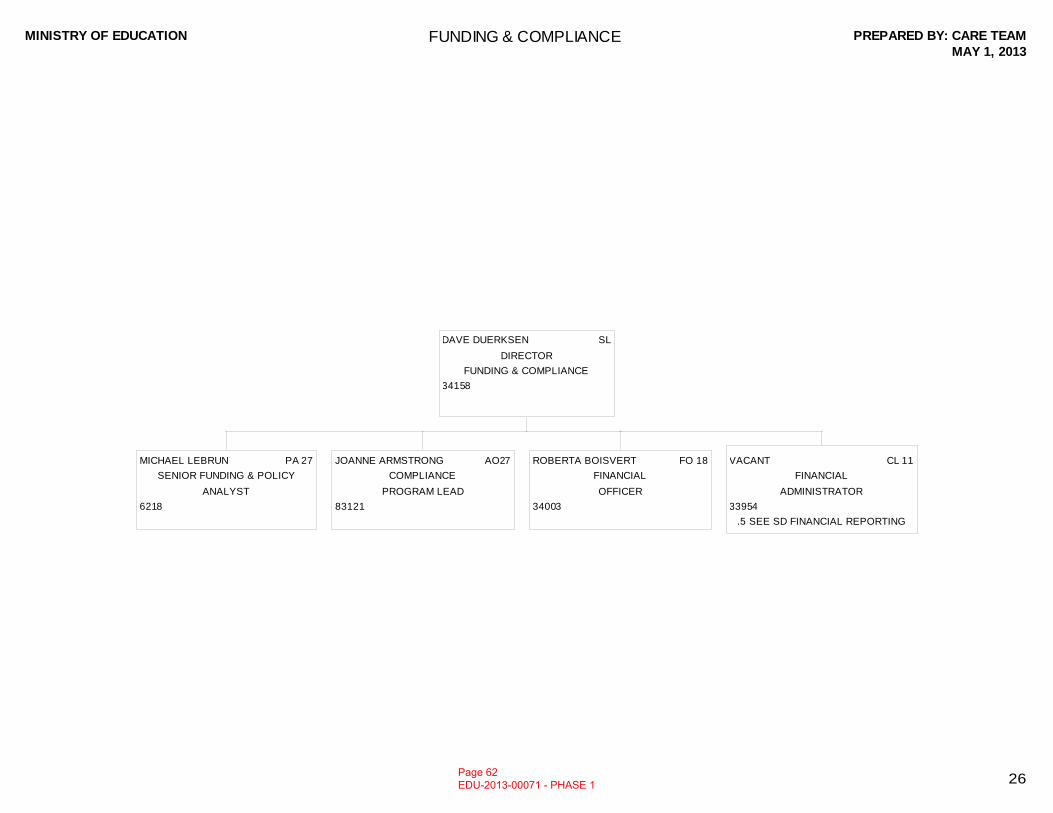
MINISTRY OF EDUCATION FUNDING & COMPLIANCE PREPARED BY: CARE TEAMMAY 1, 2013
26
DAVE DUERKSEN SL
DIRECTOR
FUNDING & COMPLIANCE
34158
MICHAEL LEBRUN PA 27
SENIOR FUNDING & POLICY
ANALYST
6218
JOANNE ARMSTRONG AO27
COMPLIANCE
PROGRAM LEAD
83121
ROBERTA BOISVERT FO 18
FINANCIAL
OFFICER
34003
VACANT CL 11
FINANCIAL
ADMINISTRATOR
33954
.5 SEE SD FINANCIAL REPORTING
Page 62 EDU-2013-00071 - PHASE 1
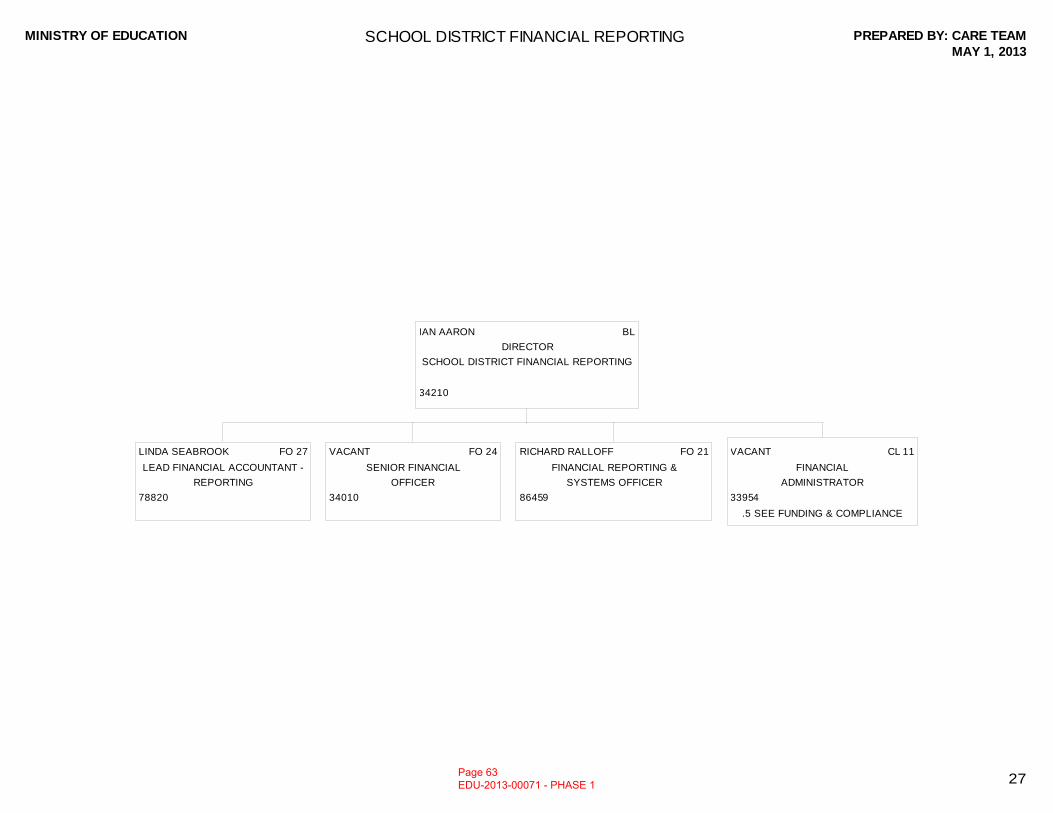
MINISTRY OF EDUCATION SCHOOL DISTRICT FINANCIAL REPORTING PREPARED BY: CARE TEAMMAY 1, 2013
27
IAN AARON BL
DIRECTOR
SCHOOL DISTRICT FINANCIAL REPORTING
34210
LINDA SEABROOK FO 27
LEAD FINANCIAL ACCOUNTANT -
REPORTING
78820
VACANT FO 24
SENIOR FINANCIAL
OFFICER
34010
RICHARD RALLOFF FO 21
FINANCIAL REPORTING &
SYSTEMS OFFICER
86459
VACANT CL 11
FINANCIAL
ADMINISTRATOR
33954
.5 SEE FUNDING & COMPLIANCE
Page 63 EDU-2013-00071 - PHASE 1
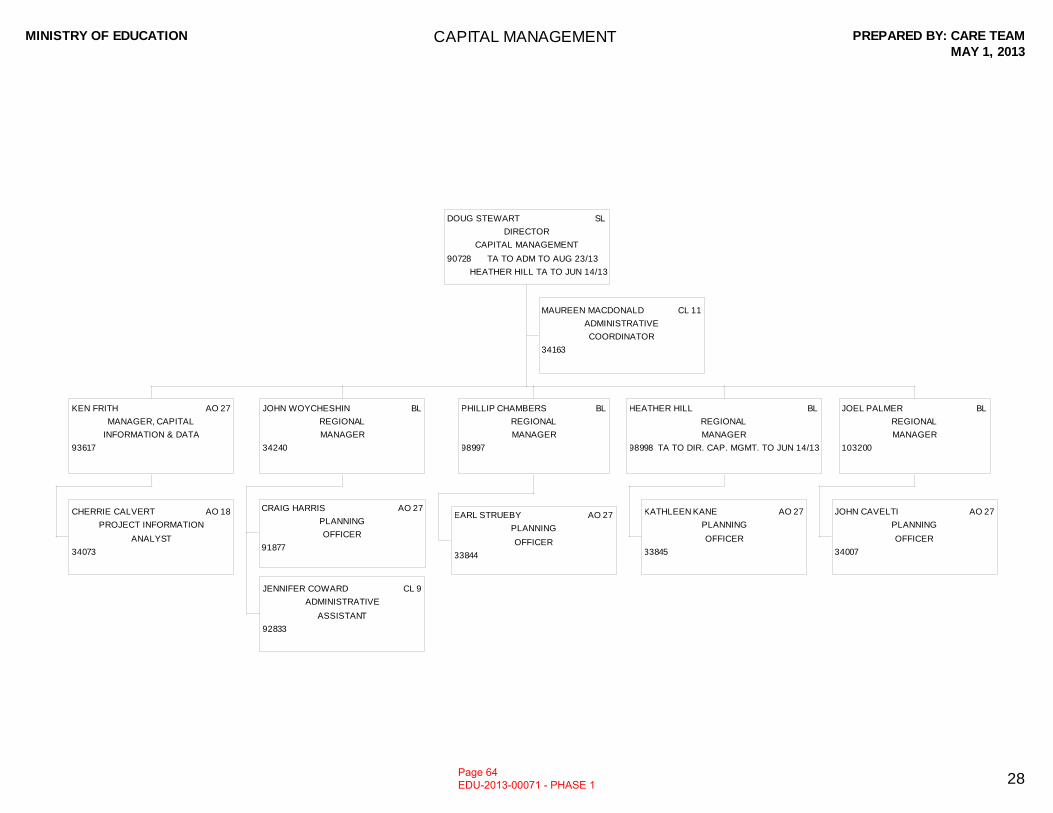
MINISTRY OF EDUCATION CAPITAL MANAGEMENT PREPARED BY: CARE TEAMMAY 1, 2013
28
DOUG STEWART SL
DIRECTOR
CAPITAL MANAGEMENT
90728 TA TO ADM TO AUG 23/13
HEATHER HILL TA TO JUN 14/13
MAUREEN MACDONALD CL 11
ADMINISTRATIVE
COORDINATOR
34163
KEN FRITH AO 27
MANAGER, CAPITAL
INFORMATION & DATA
93617
CHERRIE CALVERT AO 18
PROJECT INFORMATION
ANALYST
34073
JOHN WOYCHESHIN BL
REGIONAL
MANAGER
34240
CRAIG HARRIS AO 27
PLANNING
OFFICER
91877
JENNIFER COWARD CL 9
ADMINISTRATIVE
ASSISTANT
92833
PHILLIP CHAMBERS BL
REGIONAL
MANAGER
98997
EARL STRUEBY AO 27
PLANNING
OFFICER
33844
HEATHER HILL BL
REGIONAL
MANAGER
98998 TA TO DIR. CAP. MGMT. TO JUN 14/13
KATHLEEN KANE AO 27
PLANNING
OFFICER
33845
JOEL PALMER BL
REGIONAL
MANAGER
103200
JOHN CAVELTI AO 27
PLANNING
OFFICER
34007
Page 64 EDU-2013-00071 - PHASE 1
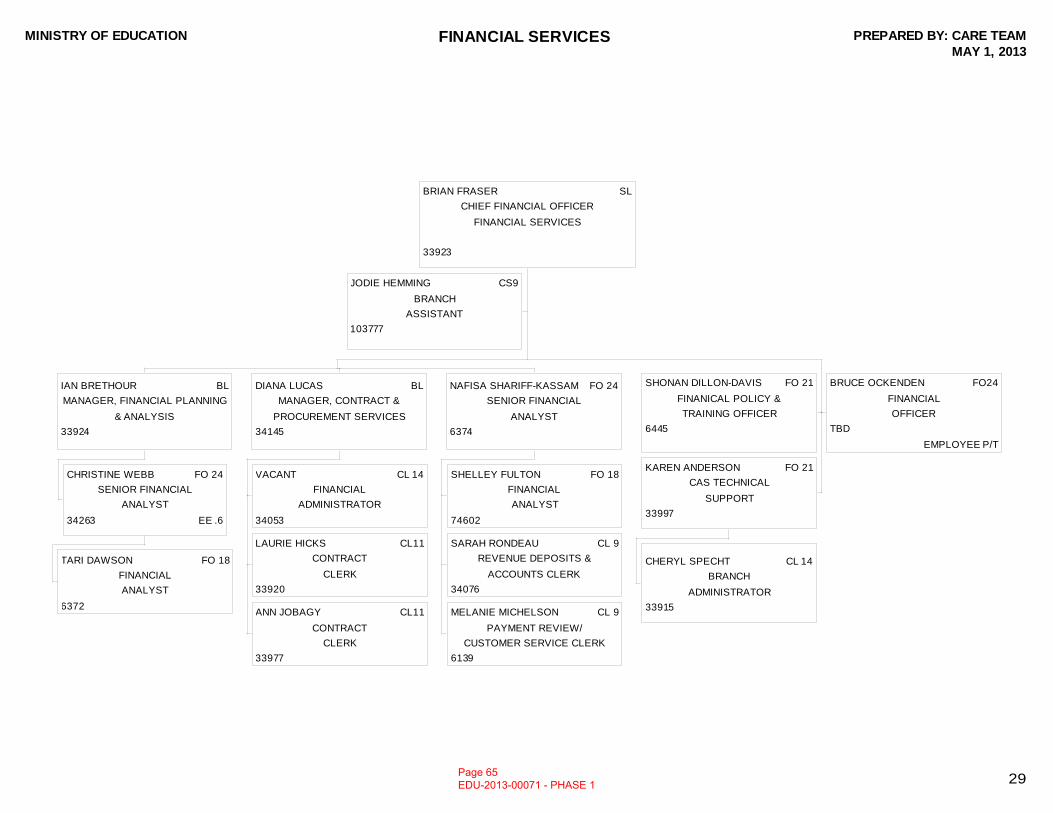
MINISTRY OF EDUCATION FINANCIAL SERVICES PREPARED BY: CARE TEAMMAY 1, 2013
29
BRIAN FRASER SL
CHIEF FINANCIAL OFFICER
FINANCIAL SERVICES
33923
JODIE HEMMING CS9
BRANCH
ASSISTANT
103777
IAN BRETHOUR BL
MANAGER, FINANCIAL PLANNING
& ANALYSIS
33924
CHRISTINE WEBB FO 24
SENIOR FINANCIAL
ANALYST
34263 EE .6
TARI DAWSON FO 18
FINANCIAL
ANALYST
6372
DIANA LUCAS BL
MANAGER, CONTRACT &
PROCUREMENT SERVICES
34145
VACANT CL 14
FINANCIAL
ADMINISTRATOR
34053
LAURIE HICKS CL11
CONTRACT
CLERK
33920
ANN JOBAGY CL11
CONTRACT
CLERK
33977
NAFISA SHARIFF-KASSAM FO 24
SENIOR FINANCIAL
ANALYST
6374
SHELLEY FULTON FO 18
FINANCIAL
ANALYST
74602
SARAH RONDEAU CL 9
REVENUE DEPOSITS &
ACCOUNTS CLERK
34076
MELANIE MICHELSON CL 9
PAYMENT REVIEW/
CUSTOMER SERVICE CLERK
6139
SHONAN DILLON-DAVIS FO 21
FINANICAL POLICY &
TRAINING OFFICER
6445
BRUCE OCKENDEN FO24
FINANCIAL
OFFICER
TBD
EMPLOYEE P/T
KAREN ANDERSON FO 21
CAS TECHNICAL
SUPPORT
33997
CHERYL SPECHT CL 14
BRANCH
ADMINISTRATOR
33915
Page 65 EDU-2013-00071 - PHASE 1
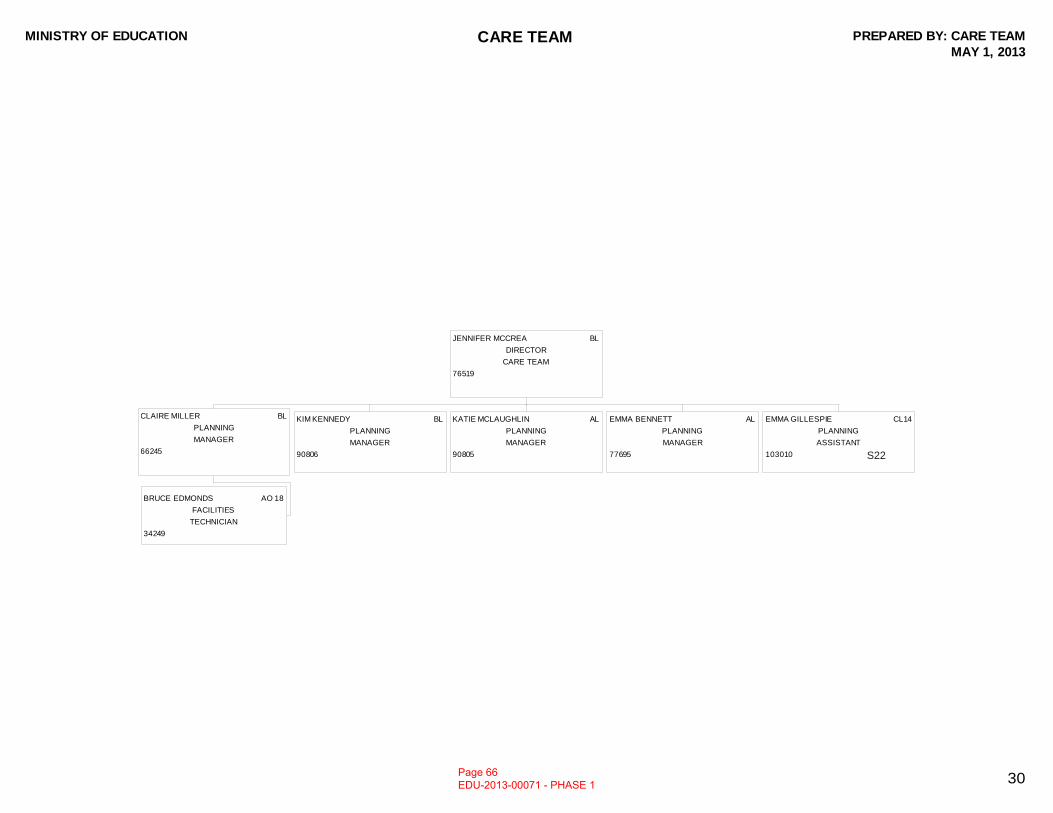
MINISTRY OF EDUCATION CARE TEAM PREPARED BY: CARE TEAMMAY 1, 2013
30
JENNIFER MCCREA BL
DIRECTOR
CARE TEAM
76519
CLAIRE MILLER BL
PLANNING
MANAGER
66245
BRUCE EDMONDS AO 18
FACILITIES
TECHNICIAN
34249
KIM KENNEDY BL
PLANNING
MANAGER
90806
KATIE MCLAUGHLIN AL
PLANNING
MANAGER
90805
EMMA BENNETT AL
PLANNING
MANAGER
77695
EMMA GILLESPIE CL14
PLANNING
ASSISTANT
103010
Page 66 EDU-2013-00071 - PHASE 1
S22
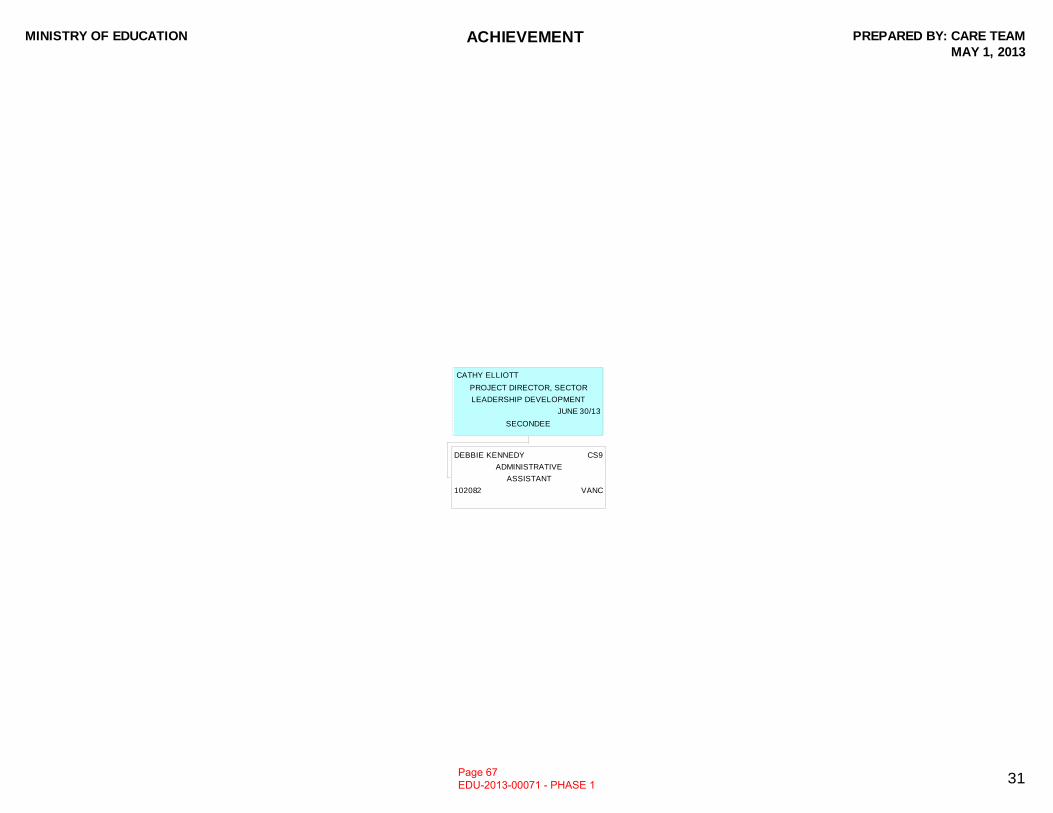
MINISTRY OF EDUCATION ACHIEVEMENT PREPARED BY: CARE TEAMMAY 1, 2013
31
CATHY ELLIOTT
PROJECT DIRECTOR, SECTOR
LEADERSHIP DEVELOPMENT
JUNE 30/13
SECONDEE
DEBBIE KENNEDY CS9
ADMINISTRATIVE
ASSISTANT
102082 VANC
Page 67 EDU-2013-00071 - PHASE 1
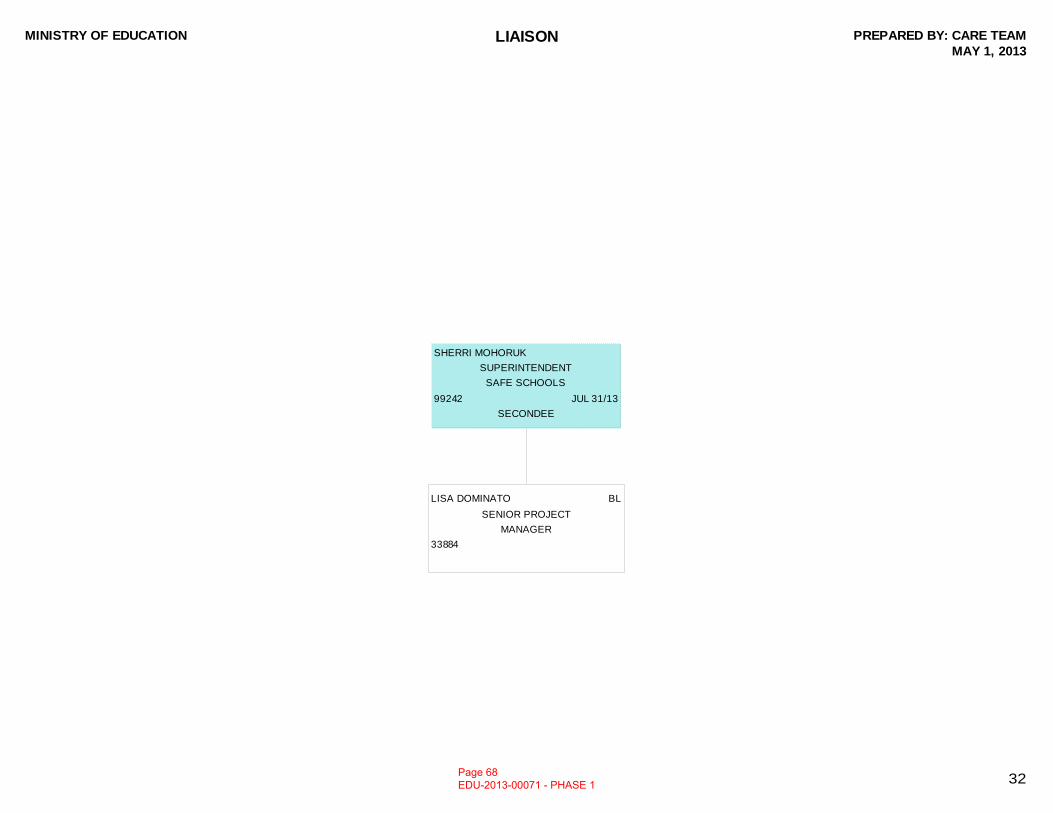
MINISTRY OF EDUCATION LIAISON PREPARED BY: CARE TEAMMAY 1, 2013
32
SHERRI MOHORUK
SUPERINTENDENT
SAFE SCHOOLS
99242 JUL 31/13
SECONDEE
LISA DOMINATO BL
SENIOR PROJECT
MANAGER
33884
Page 68 EDU-2013-00071 - PHASE 1
MINISTRY OF EDUCATION KEY RESPONSIBILTIES AND OPPORTUNITIES NOTE
ACCOUNTABILITY FRAMEWORK 2013
Edited: 6/25/2013 at 4:58:45 PM Page 1 of 2
TOPIC DESCRIPTION: This note reviews the statutory framework for holding school districts accountable for student achievement, provides a snapshot of how the framework is currently functioning, and identifies opportunities for improving district accountability in respect to student achievement. BACKGROUND:
Before 2002, there was no reference to “student achievement” in the School Act (Act). Boards of education were responsible for providing educational programs, but there was no specific statutory accountability for student achievement and success.
In 2002, the Act was amended to require a board of education to prepare and submit to the ministry an achievement contract outlining the board’s plan for improving student achievement. Parents were given input into the achievement contract via school planning councils.
In 2007, the Act was further amended to:
• Establish that the superintendent of schools is responsible to the board of education for the improvement of student achievement in the district; and
• Create the office of superintendent of achievement. Appointed by the minister, superintendents of achievement are assigned to school districts to review and make recommendations for the improvement of student achievement in the district.
There are currently three superintendents of achievement appointed under the Act. Two superintendents of achievement (SOAs) work with districts to improve student achievement while the third has responsibility for managing a division of the ministry and implementing education transformation plans. This work relies heavily on Foundation Skills Assessment, provincial exam and school completion data, which enables the ministry to identify underperforming districts, schools and classes.
In districts where the superintendent and board of education are receptive and there is capacity to implement SOA recommendations, this model can lead to changes in practice that support improved student achievement. However, the SOA model has little impact in districts where the board is philosophically opposed to the use of and/or does not support and accept Ministry interventions or assistance. The Ministry recently contracted with the BC School Superintendents’ Association (BCSSA) to canvass superintendents about the effectiveness of the SOA model and report on these views by June 15, 2013.
Page 69 EDU-2013-00071 - PHASE 1
MINISTRY OF EDUCATION KEY RESPONSIBILTIES AND OPPORTUNITIES NOTE
ACCOUNTABILITY FRAMEWORK 2013
Edited: 6/25/2013 at 4:58:45 PM Page 2 of 2
Generally speaking, boards do not hold superintendents accountable for improvement of student achievement as envisioned in the School Act. Board interests tend to align more closely with financial trusteeship and community political pressures.
A successful public education system is characterized by continuous improvement. Between 2002 and 2006, improvement in a number of metrics was observable. Although BC has one of the highest performing systems in the world presently, improvement has stalled since 2006 while other jurisdictions are continuing to improve. It is believed that a strong accountability framework will produce the needed improvements.
OPPORTUNITIES:
Primary Contact: ADM: Claire Avison Phone: 250-356-6760 Cell:
Page 70 EDU-2013-00071 - PHASE 1
S13
S17
MINISTRY OF EDUCATION KEY RESPONSIBILTIES AND OPPORTUNITIES NOTE
BC TRAINING AND EDUCATION SAVINGS PROGRAM 2013
Edited: 6/25/2013 at 4:58:57 PM Page 1 of 3
TOPIC DESCRIPTION: The BC Government will contribute $1,200 into a Registered Education Savings Plan (RESP) for every eligible child at age 6 born on or after January 1, 2007, who is a resident of BC, and is enrolled/registered in a BC school, at age 6. FACTS AND FIGURES (optional):
Government directed the Children’s Education Fund to be restructured into an annual entitlement program called the BC Training and Education Savings Program (BCTESP)
BCTESP was announced in Budget 2013 on February 19 BCTESP is supported by the BC Training and Education Savings
Grant (BCTESG). The grant is a one-time payment of $1,200 for eligible children dispensed through Individual RESP plans (under current regulation).
The BCTESG will be administered by the Ministry of Education in partnership with Human Resource and Skills Development Canada who will work with Financial Institutions on our behalf.
BACKGROUND:
The Children’s Education Fund (CEF) was established on April 1, 2007. A special account was set up under the Special Accounts Appropriation and Control Act to hold the funds.
Under the terms of the CEF, for every child born or adopted in BC on or after January 1, 2007, $1000 would be invested in the Fund at the beginning of each fiscal year for that year’s cohort.
Each year, the government transferred an amount of money based on an estimate of the total number of potential new beneficiaries to the CEF. This contribution – approximately $47 million annually – was invested by the British Columbia Investment Management Corporation (bcIMC).
The CEF was held by the Ministry of Finance from January 1, 2007 to August 2008. In August 2008, responsibility for the CEF was transferred to the Ministry of Education.
Page 71 EDU-2013-00071 - PHASE 1
MINISTRY OF EDUCATION KEY RESPONSIBILTIES AND OPPORTUNITIES NOTE
BC TRAINING AND EDUCATION SAVINGS PROGRAM 2013
Edited: 6/25/2013 at 4:58:57 PM Page 2 of 3
The CEF balance is currently valued at approximately $300 million and held in a special account under the purview of the Ministry of Education. The remaining balance will continue to be held as a part of consolidated revenue, with annual obligations expensed in the fiscal plan.
In December 2012, following public consultation through the Families First website, the Cabinet Committee on Family Affordability (in discussion with Minister of Education) directed that the CEF be restructured from an investment fund to an annual entitlement program – the BC Training and Education Savings Program (BCTESP).
A letter of intent from BC Minister of Finance (Mike de Jong) was sent to the federal Minister of Finance HRSDC (Diane Finley) indicating the Ministry’s desire to enter into a partnership with HRSDC.
The BCTESP operates under the same legislation that informs the CEF. Regulations for BCTESP were passed and deposited on March 20, 2013.
The estimated fiscal impact of the BCTESP is $30 million annually, beginning in 2013/14.
OPPORTUNITIES: BCTESP encourages parents to start saving today for their child’s post-secondary
education. It is an improvement on the Children’s Education Fund (CEF) for the following reasons: it makes it easier for parents to access federal RESP grants; it aligns provincial and federal programs that encourage families to save for future education costs; and it will generate greater benefits for beneficiaries and provide greater flexibility on where they can pursue post-secondary education.
The BCTESP model allows for better savings outcomes, particularly for lower income families. Outreach to partners and agencies that represent Aboriginal families, lower income families and children in care will provide information and support to encourage families and guardians to access available federal and provincial grants related to RESPs, ensuring that all children have equal opportunities for post-secondary education.
Future amendments to the CEF legislation and regulations will better support the BCTESG model of grant contribution by eliminating complexity related to eligibility. This will encourage more parents to open RESPs, providing access to federal incentives as well as the BCTES grant and ensure students are better prepared financially for post-secondary education. These changes will also encourage more financial institutes to offer the BC grant, thereby making it more accessible to parents.
The transformation of CEF into the BCTESP provides for better, more transparent fiscal management. This is an opportunity to revisit the investment strategy with Provincial Treasury and bcIMC into liquid, short-term investments.
Page 72 EDU-2013-00071 - PHASE 1
MINISTRY OF EDUCATION KEY RESPONSIBILTIES AND OPPORTUNITIES NOTE
BC TRAINING AND EDUCATION SAVINGS PROGRAM 2013
Edited: 6/25/2013 at 4:58:57 PM Page 3 of 3
Primary Contact: Brenda Neufeld ADM: Renate Butterfield PhonCell:
Page 73 EDU-2013-00071 - PHASE 1
S17
S17
MINISTRY OF EDUCATION KEY RESPONSIBILTIES AND OPPORTUNITIES NOTE
BCESIS 2013
Edited: 6/25/2013 at 4:59:08 PM Page 1 of 5
TOPIC DESCRIPTION: Since 2005, the British Columbia enterprise Student Information System (BCeSIS) has been used to manage student records and school operations in BC. With the contract for operational support expiring in August 2015 and an out-of-date operating platform, the process for procuring a new student information service has been initiated. FACTS AND FIGURES:
BCeSIS contains records for more than 580,000 students in 56 out of 60 School Districts, 100 Independent and 30 First Nations schools, and more than 300 StrongStart BC Centres.
Since its inception, approximately $15.9M has been spent in capital for licenses and customization. The cost to operate BCeSIS over 10 years, through 2013, is approximately $81.3M. Costs are shared between school authorities and the Ministry of Education. School Districts contribute $10-per-student per year.
The system is in need of replacement and is a major source of frustration for teachers, administrators, trustees and Ministry staff.
A Request for Proposals (RFP) for a new student information service to replace BCeSIS was issued to 16 pre-qualified vendors in December 2012, and six responses were received in February 2013. School District and Ministry representatives will have completed the evaluation process by June 2013.
The transition to the new student information service could commence in 2014, with full, province-wide implementation in 2015. The current BCeSIS could be decommissioned early in 2016.
BACKGROUND:
• BCeSIS is a shared, web-based student information system that stores student records. It is made available through the collaboration among boards of education, independent school authorities, First Nations school authorities and the Ministry of Education. Although participation is voluntary, 56 of 60 school districts, along with other school authorities in B.C. and the Yukon, have adopted BCeSIS as their primary student record system.
• BCeSIS is a comprehensive, integrated system that includes a variety of operational
features, the following of which are used by most schools: student registration, daily
Page 74 EDU-2013-00071 - PHASE 1
MINISTRY OF EDUCATION KEY RESPONSIBILTIES AND OPPORTUNITIES NOTE
BCESIS 2013
Edited: 6/25/2013 at 4:59:08 PM Page 2 of 5
attendance, period attendance, course scheduling, student course selection, course history, timetable builder, diploma management, student intervention, and admit/withdraw/cross-enrol. While other features of BCeSIS are also widely used, some districts have opted to supplement BCeSIS with 3rd party products such as grade books for teachers, report cards, and Individual Education Plans.
• An important feature of BCeSIS is that it maintains a single record for each student in the
province. This allows students to easily transition between schools, cross-enrol in several schools or distance learning schools simultaneously, and transfer between schools and districts. BCeSIS is also the primary source for enrolment and achievement data and streamlines the reporting processes for school and district administrators as well as the Ministry.
• The deployment of a province-wide common student information system was very innovative when it was first conceived in 2003. However experience has since shown that while the concept is sound the eSIS software itself was not sufficiently scalable or flexible to address evolving business and technical requirements and does not meet long-term strategic needs.
Delivery Partners
• In 2002, the BCeSIS initiative began as a request to the Ministry by nine school districts wishing to replace their obsolete student information systems. It was determined that the best approach was to acquire a commercial software package from a software vendor, have the application hosted by a third party service provider, and provide access to users in the schools through the Provincial Learning Network (PLNet).
• A working group composed of a cross-section of school and district users from the initial
“core” districts and the Ministry was established. In 2003, after an analysis of requirements and a competitive process, the group selected the eSIS software from Administrative Assistants Ltd. (AAL) of Burlington, Ontario. eSIS was considered to be the best enterprise product on the market at that time.
• In 2005, Fujitsu Consulting Canada Inc. was awarded a contract to host BCeSIS and provide operational support services, including help desk, implementation, and training. BCeSIS is hosted on dedicated servers located in a secure data centre in Vancouver and connected to the provincial data network and the PLNet by a dedicated fibre-optic cable. The initial 5-year term of the Fujitsu contact was subsequently extended to August 31, 2015.
• Districts are responsible for the provision of workstations and local infrastructure,
technical support, training, developing business processes, and implementation planning. The Ministry is responsible for financial management, entering into contracts on behalf of the school authorities, and managing the delivery of services through its contractors.
Page 75 EDU-2013-00071 - PHASE 1
MINISTRY OF EDUCATION KEY RESPONSIBILTIES AND OPPORTUNITIES NOTE
BCESIS 2013
Edited: 6/25/2013 at 4:59:08 PM Page 3 of 5
• Implementation of BCeSIS was very challenging for some districts that did not have
experience deploying complex systems. Many users, especially teachers, found the eSIS interface difficult to use and were reluctant to adopt standardized procedures. The software did not have the flexibility to easily adapt to changes in business practices and technology.
• An mid-project review of the BCeSIS product and delivery model was conducted by the
Ministry in 2007. It was recommended at that time that the province continue with the then current strategy of acquiring and operating a single integrated solution based upon eSIS.
Funding Model
• BCeSIS is a partnership and the cost of operating it is shared between school districts, independent schools, First Nations schools and the Ministry. Under a Memorandum of Understanding, schools pay $10 per student per year while the Ministry pays the remainder. Districts also have the option to purchase additional services if needed.
Governance Model
• Participation in the BCeSIS initiative is voluntary and follows a co-governance model. Districts and independent schools joined this venture by signing a Memorandum of Understanding with the Ministry that describes the responsibilities of the respective partners and an initial funding and support model.
Finding a New Common Solution
• In November 2010 Pearson Canada Inc. acquired AAL, the vendor of the eSIS software, and announced that the product was being discontinued. The Ministry negotiated an agreement with Pearson Canada to extend support for eSIS until July 2013 and to provide the application source code so that BCeSIS can be maintained until a new solution is implemented.
• In 2011, based upon advice from the Student Information System Executive Steering
Committee (SIS-ESC), the Ministry commissioned Gartner Consulting to review BCeSIS and recommend a strategy for going forward. The Gartner Report concluded that BCeSIS would meet the Province’s student information requirements for the next 1-3 years but could not address long-term strategic needs. An open stakeholder engagement process confirmed that there is strong support for replacing BCeSIS with a new common student information system but that the solution must be deployed within 1-2 years.
• A business case concluded that the best approach is to enter into a long-term contract
with a single vendor to provide access to student information software as a hosted
Page 76 EDU-2013-00071 - PHASE 1
MINISTRY OF EDUCATION KEY RESPONSIBILTIES AND OPPORTUNITIES NOTE
BCESIS 2013
Edited: 6/25/2013 at 4:59:08 PM Page 4 of 5
service. This approach leverages existing operational funding and provides a solution that will meet the needs of the districts within an acceptable timeframe at a reasonable cost. It is anticipated that the Province will enter into a twelve-year contract with an annual operating cost of approximately $10.5M.
• In 2012, the Ministry began the Request for Proposals (RFP) development process by
engaging key stakeholders to prepare user requirements for the new student information service. Working groups were established which represented a cross-section of provincial school districts and independent schools and included teachers, counselors, principals and vice principals. Meetings were held with school districts and stakeholder organizations including the First Nations Education Steering Committee (FNESC), Federation of Independent School Authorities (FISA), BC Confederation of Parent Advisory Councils (BCCPAC), BC Teachers’ Federation (BCTF), BC School Trustees Association (BCSTA) and BC Principals and Vice Principals Association (BCPVPA). Draft requirements documents were posted on the BC Education Plan website and individual teachers, school/district staff, parents, students, and the public provided comments.
• A Core Evaluation Committee (CEC), made up of five district/school and four Ministry
representatives, was established to review business and technical requirements, draft evaluation criteria, approve RFP documents, and evaluate vendor responses. In addition, teams of subject matter experts from school districts, independent schools, and the Ministry will review vendor responses, critique product demonstrations, and provide advice to the CEC regarding functionality, the user interface, and system usability. Ministry staff have also worked closely with the Strategic Partnership Office, Attorney General, Office of the Auditor General, the Chief Information Officer, and the Intellectual Property Office.
• A RFP for a new student information service to replace BCeSIS was issued to 16 pre-qualified vendors in December 2012, and six responses were received by February 2013. The CEC will complete the evaluation process in June 2013.
• The transition to the new student information service will likely begin in 2014, with full, province-wide implementation expected in 2015. The existing BCeSIS will be decommissioned early in 2016. Due to constraints imposed by the school year, any delays in contract development will likely defer implementation by an entire year.
• As RFP evaluation continues, the SIS-ESC, Service Management Council (SMC) and
Ministry are reviewing the processes that support continued collaboration: updating governance models, addressing challenges with the current SIS, streamlining the exchange of data between schools, districts, and the Ministry, developing an implementation strategy, and preparing the system to accommodate system-wide education transformation.
Page 77 EDU-2013-00071 - PHASE 1
MINISTRY OF EDUCATION KEY RESPONSIBILTIES AND OPPORTUNITIES NOTE
BCESIS 2013
Edited: 6/25/2013 at 4:59:08 PM Page 5 of 5
OPPORTUNITIES:
There is an opportunity to implement a system that effectively meets the needs of all
users and benefits students and parents.
Building upon the BCeSIS experience, there is growing recognition in schools and districts of the value of common systems and sharing student data. This has led to substantial improvements in data quality, business processes and service to students (especially when students transfer or attend several schools simultaneously).
Student information software designed for province- or state-wide implementation has matured considerably in the past ten years. The deployment of a new student information service in 2014 addresses many long-standing complaints about the eSIS software, including poor usability and reporting.
Adoption of common practices by schools provides an opportunity for the Ministry to
redesign obsolete reporting systems and to improve services to students and schools.
Improved access to information is needed to support and protect each student, including vulnerable children, children in care, students at risk academically and children with special needs.
Adopting a common student information service within the provincial infrastructure
improves security practices and the protection of personal information.
Primary Contact: ADM: Renate Butterfield Phone: 250-387-7097 Cell:
Page 78 EDU-2013-00071 - PHASE 1
S13
S17
MINISTRY OF EDUCATION KEY RESPONSIBILTIES AND OPPORTUNITIES NOTE
CAPITAL MANAGEMENT 2013
Edited: 6/25/2013 at 4:59:20 PM Page 1 of 2
TOPIC DESCRIPTION: Together the Ministry of Education and Boards of Education plan for the capital needs of school districts and manage approved capital projects. FACTS AND FIGURES:
There are 1,604 public schools in BC, down from a high of 1,779 in 2001.
Every year, Boards submit 5-year capital plans to the Ministry. The principal drivers for school district capital planning are student
enrolment and facility condition. The Ministry of Education has not had a routine capital plan
approved by government since 2005/06 – capital for transportation infrastructure was government’s priority.
In October 2011, government did approve and announce $353 million of new space projects to meet enrolment demand in growth districts.
Additional approvals were granted for seismic projects (see Seismic Mitigation Program note)
The Ministry typically provides a $110 million Annual Facility Grant (AFG) to Boards for routine maintenance requirements. This is normally split between about 1/3 operating and 2/3 capital funding.
BACKGROUND:
The move to student-based funding in 2002 incented school districts to utilize their facilities more efficiently. Since 2001, student enrolment has declined by over 70,000 students, leaving many school districts with excess capacity and leading to the closure of about 200 schools since 2001.
Despite enrolment decline in most school districts across the province, enrolment has been increasing in some communities (e.g. Surrey, Langley, Kelowna, Langford), leading to requirements for new school space in those school districts.
Page 79 EDU-2013-00071 - PHASE 1
MINISTRY OF EDUCATION KEY RESPONSIBILTIES AND OPPORTUNITIES NOTE
CAPITAL MANAGEMENT 2013
Edited: 6/25/2013 at 4:59:20 PM Page 2 of 2
The lack of capital funding in the education sector in recent years has resulted in some schools in growing districts operating well above their intended capacities and a backlog of deferred maintenance.
In addition, no contingency is provided to meet emergent project requirements, including fire or flood loss or building component failure. Funding for these government responsibilities must be taken from scarce capital resources, requiring reallocation of supported priorities.
The Annual Facility Grant (AFG) funding is intended for facility maintenance and is split between operating and capital funding: generally about $70 million capital and $40 million operating. Based on recent assessments of the existing stock of schools in the province, at current funding levels deferred maintenance requirements will continue to grow each year.
BC Housing manages the Building Envelope Program (BEP) on behalf of the Ministry. The BEP assists school districts with remediation of schools built between 1985 and 2000 that are encountering water ingress resulting from premature failure of the building envelope. This program is not currently funded but at least $160 million of work remains to be done, resulting in further deterioration and additional costs.
OPPORTUNITIES:
Primary Contact: A/ADM: Doug Stewart Phone: n/a Cell:
Page 80 EDU-2013-00071 - PHASE 1
S13
S17
MINISTRY OF EDUCATION KEY RESPONSIBILTIES AND OPPORTUNITIES NOTE
EDUCATION POLICY AND SUPPORTS 2013
TOPIC DESCRIPTION: Education policies and supports related to student learning are being reviewed and transformed as part of the K-12 transformation efforts, and are coordinated, developed, and delivered through the Ministry’s Learning Division. BACKGROUND:
In 2001 and until 2011, responsibilities for educational policies and supports were spread across several divisions in the Ministry.
In 2010, the Ministry of Education and stakeholders throughout the province began discussions on how BC’s strong education system could better meet the needs of all learners. Possible changes in education policies and supports to better enable personalized learning approaches were a regular part of the discussions.
To help in the coordination and development of cohesive provincial policies and supports, learning-related education policies and supports were consolidated under a single division, the Learning Division, in the mid-2011. These include curriculum, assessment, graduation, early learning, early reading, student supports, Aboriginal education, diversity and equity, trades, adult learning, e-learning, and French programs.
In October 2011, the BC Education Plan was released. The document provided a framework for continued discussions on how our education system could better meet the needs of each learner.
Over the last several years, there have been extensive consultations with stakeholders on how learning-related policies and supports could change, including the educated citizen, curriculum, assessment, competencies, graduation, trades, student supports, Aboriginal education, early reading, and student reporting (communicating student learning). Detailed actions to date are provided in the accompanying Transition 2013 Policy Topics document in Section 10.
All proposed changes would focus on putting the child at the center of their learning (having the education system fit the child versus the other way around).
Budget for education policy and supports has remained steady, with considerable new work to come. Current administrative budget for Learning Division’s operational work is $4,685,000. Grants and contribution funding for school districts is $44,965,000.
Page 81 EDU-2013-00071 - PHASE 1
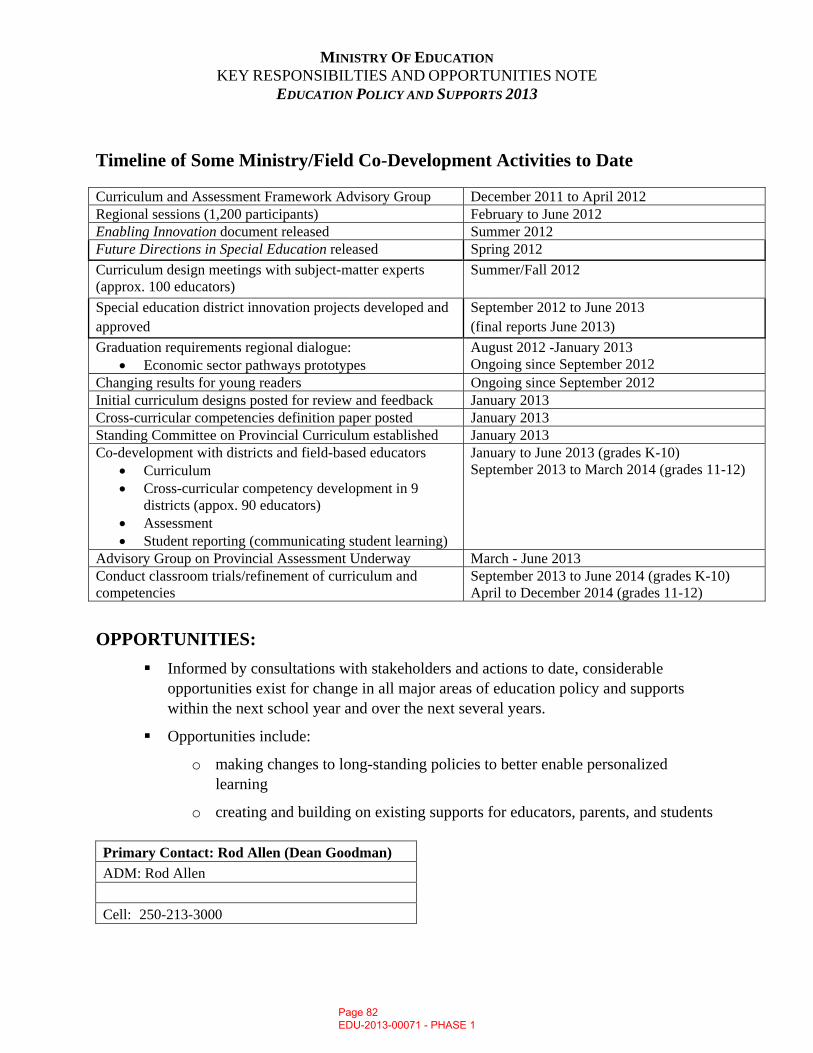
MINISTRY OF EDUCATION KEY RESPONSIBILTIES AND OPPORTUNITIES NOTE
EDUCATION POLICY AND SUPPORTS 2013
Timeline of Some Ministry/Field Co-Development Activities to Date Curriculum and Assessment Framework Advisory Group December 2011 to April 2012 Regional sessions (1,200 participants) February to June 2012 Enabling Innovation document released Summer 2012 Future Directions in Special Education released Spring 2012 Curriculum design meetings with subject-matter experts (approx. 100 educators)
Summer/Fall 2012
Special education district innovation projects developed and approved
September 2012 to June 2013 (final reports June 2013)
Graduation requirements regional dialogue: • Economic sector pathways prototypes
August 2012 -January 2013 Ongoing since September 2012
Changing results for young readers Ongoing since September 2012 Initial curriculum designs posted for review and feedback January 2013 Cross-curricular competencies definition paper posted January 2013 Standing Committee on Provincial Curriculum established January 2013 Co-development with districts and field-based educators
• Curriculum • Cross-curricular competency development in 9
districts (appox. 90 educators) • Assessment • Student reporting (communicating student learning)
January to June 2013 (grades K-10) September 2013 to March 2014 (grades 11-12)
Advisory Group on Provincial Assessment Underway March - June 2013 Conduct classroom trials/refinement of curriculum and competencies
September 2013 to June 2014 (grades K-10) April to December 2014 (grades 11-12)
OPPORTUNITIES: Informed by consultations with stakeholders and actions to date, considerable
opportunities exist for change in all major areas of education policy and supports within the next school year and over the next several years.
Opportunities include:
o making changes to long-standing policies to better enable personalized learning
o creating and building on existing supports for educators, parents, and students Primary Contact: Rod Allen (Dean Goodman) ADM: Rod Allen Cell: 250-213-3000
Page 82 EDU-2013-00071 - PHASE 1
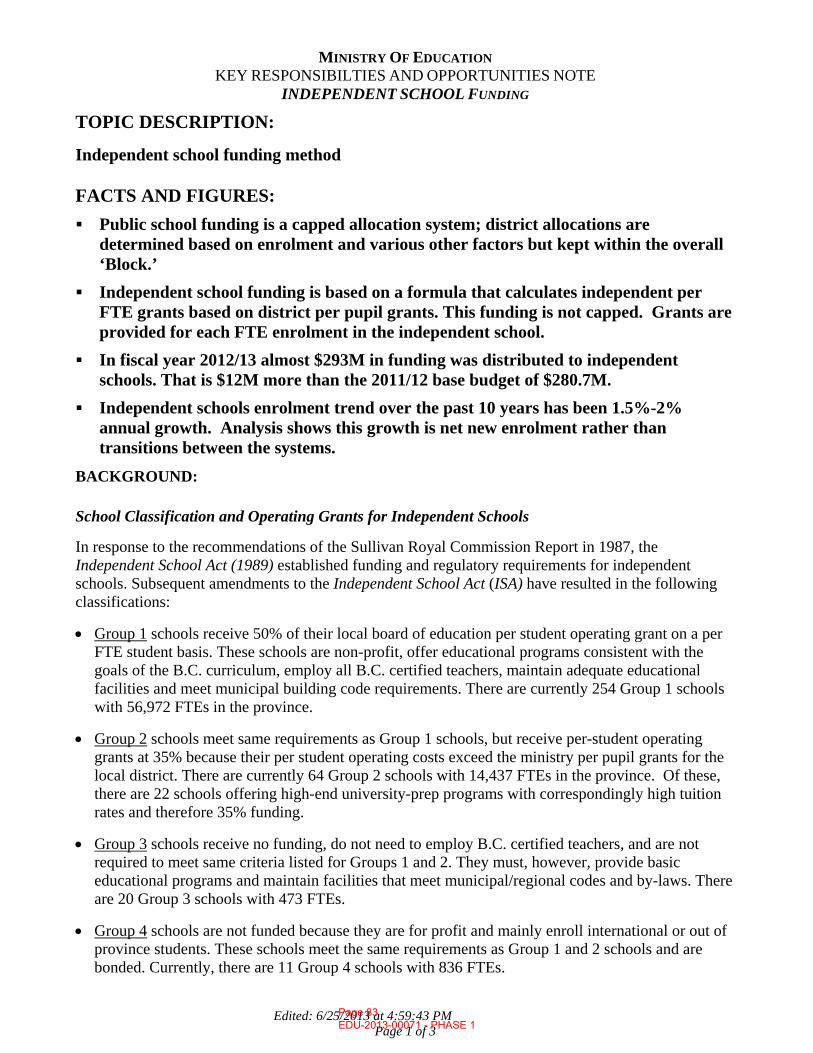
MINISTRY OF EDUCATION KEY RESPONSIBILTIES AND OPPORTUNITIES NOTE
INDEPENDENT SCHOOL FUNDING
Edited: 6/25/2013 at 4:59:43 PM Page 1 of 3
TOPIC DESCRIPTION:
Independent school funding method
FACTS AND FIGURES:
Public school funding is a capped allocation system; district allocations are determined based on enrolment and various other factors but kept within the overall ‘Block.’
Independent school funding is based on a formula that calculates independent per FTE grants based on district per pupil grants. This funding is not capped. Grants are provided for each FTE enrolment in the independent school.
In fiscal year 2012/13 almost $293M in funding was distributed to independent schools. That is $12M more than the 2011/12 base budget of $280.7M.
Independent schools enrolment trend over the past 10 years has been 1.5%-2% annual growth. Analysis shows this growth is net new enrolment rather than transitions between the systems.
BACKGROUND:
School Classification and Operating Grants for Independent Schools In response to the recommendations of the Sullivan Royal Commission Report in 1987, the Independent School Act (1989) established funding and regulatory requirements for independent schools. Subsequent amendments to the Independent School Act (ISA) have resulted in the following classifications:
• Group 1 schools receive 50% of their local board of education per student operating grant on a per FTE student basis. These schools are non-profit, offer educational programs consistent with the goals of the B.C. curriculum, employ all B.C. certified teachers, maintain adequate educational facilities and meet municipal building code requirements. There are currently 254 Group 1 schools with 56,972 FTEs in the province.
• Group 2 schools meet same requirements as Group 1 schools, but receive per-student operating grants at 35% because their per student operating costs exceed the ministry per pupil grants for the local district. There are currently 64 Group 2 schools with 14,437 FTEs in the province. Of these, there are 22 schools offering high-end university-prep programs with correspondingly high tuition rates and therefore 35% funding.
• Group 3 schools receive no funding, do not need to employ B.C. certified teachers, and are not required to meet same criteria listed for Groups 1 and 2. They must, however, provide basic educational programs and maintain facilities that meet municipal/regional codes and by-laws. There are 20 Group 3 schools with 473 FTEs.
• Group 4 schools are not funded because they are for profit and mainly enroll international or out of province students. These schools meet the same requirements as Group 1 and 2 schools and are bonded. Currently, there are 11 Group 4 schools with 836 FTEs.
Page 83 EDU-2013-00071 - PHASE 1
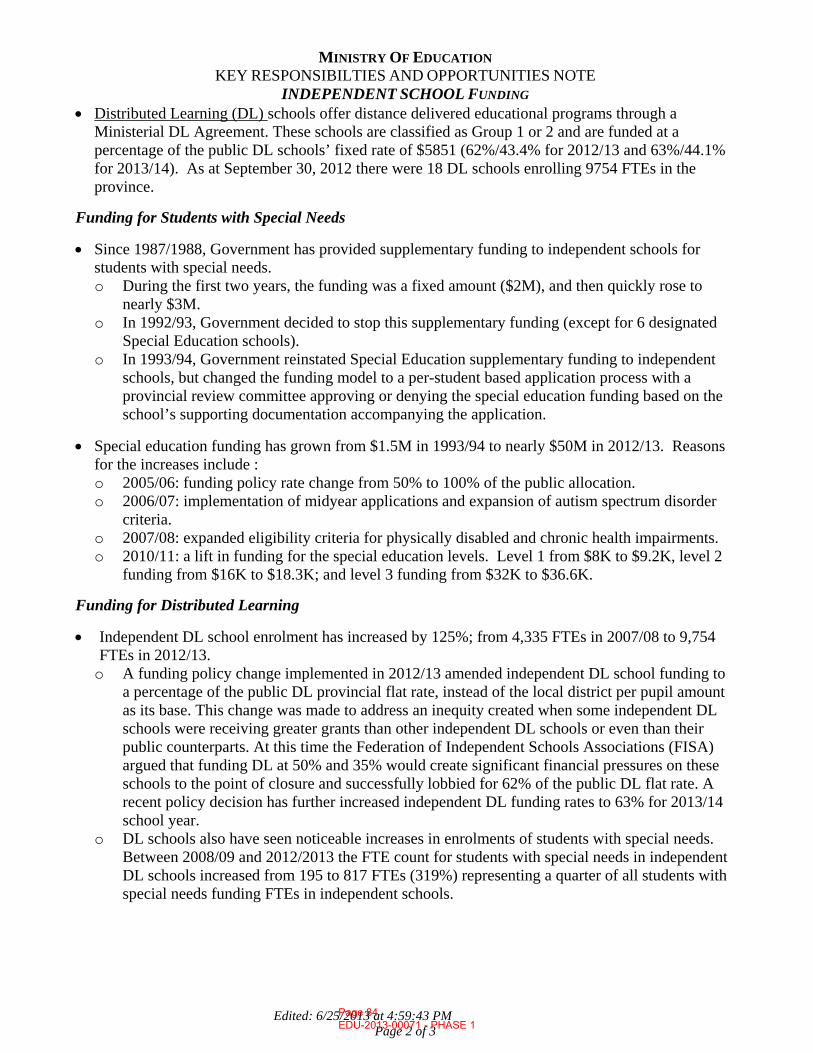
MINISTRY OF EDUCATION KEY RESPONSIBILTIES AND OPPORTUNITIES NOTE
INDEPENDENT SCHOOL FUNDING
Edited: 6/25/2013 at 4:59:43 PM Page 2 of 3
• Distributed Learning (DL) schools offer distance delivered educational programs through a Ministerial DL Agreement. These schools are classified as Group 1 or 2 and are funded at a percentage of the public DL schools’ fixed rate of $5851 (62%/43.4% for 2012/13 and 63%/44.1% for 2013/14). As at September 30, 2012 there were 18 DL schools enrolling 9754 FTEs in the province.
Funding for Students with Special Needs
• Since 1987/1988, Government has provided supplementary funding to independent schools for students with special needs. o During the first two years, the funding was a fixed amount ($2M), and then quickly rose to
nearly $3M. o In 1992/93, Government decided to stop this supplementary funding (except for 6 designated
Special Education schools). o In 1993/94, Government reinstated Special Education supplementary funding to independent
schools, but changed the funding model to a per-student based application process with a provincial review committee approving or denying the special education funding based on the school’s supporting documentation accompanying the application.
• Special education funding has grown from $1.5M in 1993/94 to nearly $50M in 2012/13. Reasons for the increases include : o 2005/06: funding policy rate change from 50% to 100% of the public allocation. o 2006/07: implementation of midyear applications and expansion of autism spectrum disorder
criteria. o 2007/08: expanded eligibility criteria for physically disabled and chronic health impairments. o 2010/11: a lift in funding for the special education levels. Level 1 from $8K to $9.2K, level 2
funding from $16K to $18.3K; and level 3 funding from $32K to $36.6K.
Funding for Distributed Learning
• Independent DL school enrolment has increased by 125%; from 4,335 FTEs in 2007/08 to 9,754 FTEs in 2012/13.
o A funding policy change implemented in 2012/13 amended independent DL school funding to a percentage of the public DL provincial flat rate, instead of the local district per pupil amount as its base. This change was made to address an inequity created when some independent DL schools were receiving greater grants than other independent DL schools or even than their public counterparts. At this time the Federation of Independent Schools Associations (FISA) argued that funding DL at 50% and 35% would create significant financial pressures on these schools to the point of closure and successfully lobbied for 62% of the public DL flat rate. A recent policy decision has further increased independent DL funding rates to 63% for 2013/14 school year.
o DL schools also have seen noticeable increases in enrolments of students with special needs. Between 2008/09 and 2012/2013 the FTE count for students with special needs in independent DL schools increased from 195 to 817 FTEs (319%) representing a quarter of all students with special needs funding FTEs in independent schools.
Page 84 EDU-2013-00071 - PHASE 1
MINISTRY OF EDUCATION KEY RESPONSIBILTIES AND OPPORTUNITIES NOTE
INDEPENDENT SCHOOL FUNDING
Edited: 6/25/2013 at 4:59:43 PM Page 3 of 3
OPPORTUNITIES:
Primary Contact: ADM: Claire Avison Phone: 250-356-6760 Cell:
Page 85 EDU-2013-00071 - PHASE 1
S13
S17
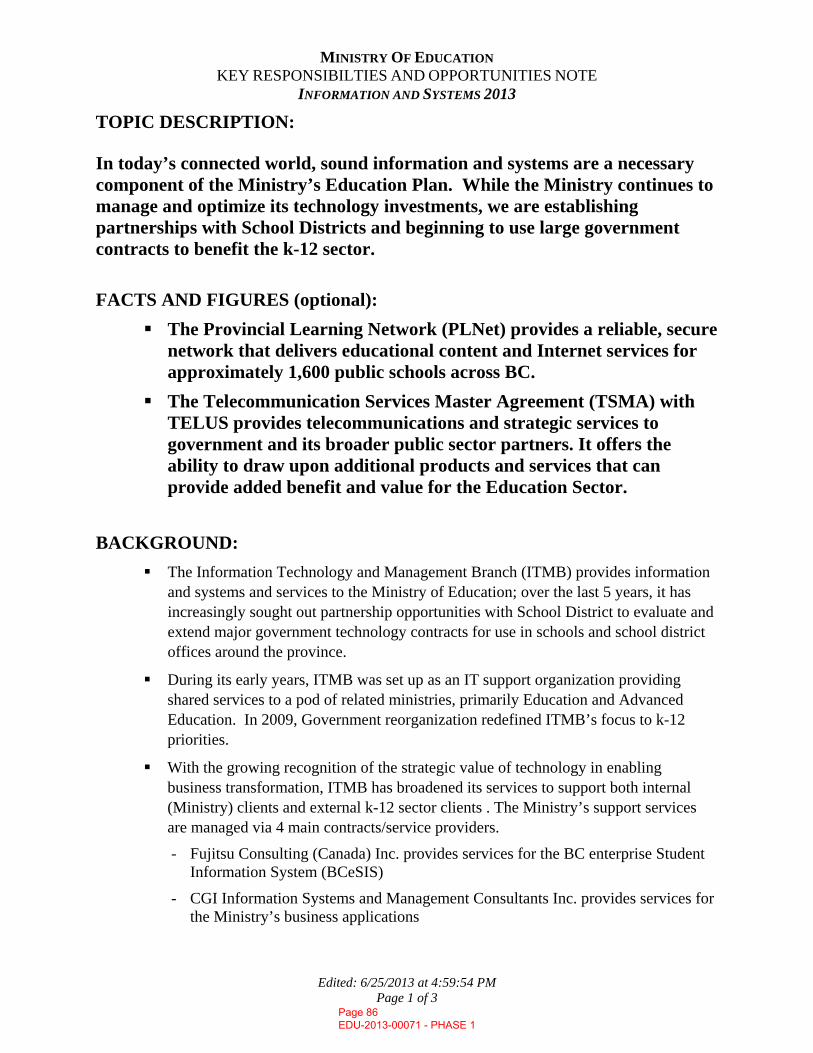
MINISTRY OF EDUCATION KEY RESPONSIBILTIES AND OPPORTUNITIES NOTE
INFORMATION AND SYSTEMS 2013
Edited: 6/25/2013 at 4:59:54 PM Page 1 of 3
TOPIC DESCRIPTION: In today’s connected world, sound information and systems are a necessary component of the Ministry’s Education Plan. While the Ministry continues to manage and optimize its technology investments, we are establishing partnerships with School Districts and beginning to use large government contracts to benefit the k-12 sector. FACTS AND FIGURES (optional):
The Provincial Learning Network (PLNet) provides a reliable, secure network that delivers educational content and Internet services for approximately 1,600 public schools across BC.
The Telecommunication Services Master Agreement (TSMA) with TELUS provides telecommunications and strategic services to government and its broader public sector partners. It offers the ability to draw upon additional products and services that can provide added benefit and value for the Education Sector.
BACKGROUND: The Information Technology and Management Branch (ITMB) provides information
and systems and services to the Ministry of Education; over the last 5 years, it has increasingly sought out partnership opportunities with School District to evaluate and extend major government technology contracts for use in schools and school district offices around the province.
During its early years, ITMB was set up as an IT support organization providing shared services to a pod of related ministries, primarily Education and Advanced Education. In 2009, Government reorganization redefined ITMB’s focus to k-12 priorities.
With the growing recognition of the strategic value of technology in enabling business transformation, ITMB has broadened its services to support both internal (Ministry) clients and external k-12 sector clients . The Ministry’s support services are managed via 4 main contracts/service providers.
- Fujitsu Consulting (Canada) Inc. provides services for the BC enterprise Student Information System (BCeSIS)
- CGI Information Systems and Management Consultants Inc. provides services for the Ministry’s business applications
Page 86 EDU-2013-00071 - PHASE 1
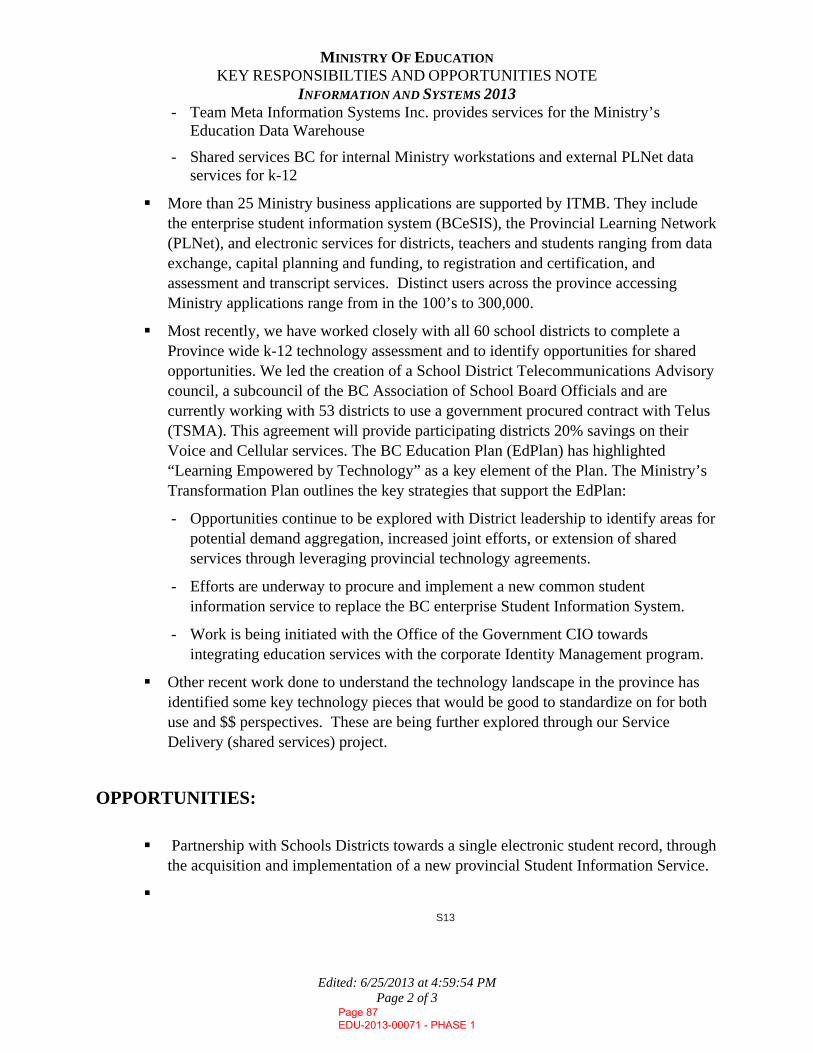
MINISTRY OF EDUCATION KEY RESPONSIBILTIES AND OPPORTUNITIES NOTE
INFORMATION AND SYSTEMS 2013
Edited: 6/25/2013 at 4:59:54 PM Page 2 of 3
- Team Meta Information Systems Inc. provides services for the Ministry’s Education Data Warehouse
- Shared services BC for internal Ministry workstations and external PLNet data services for k-12
More than 25 Ministry business applications are supported by ITMB. They include the enterprise student information system (BCeSIS), the Provincial Learning Network (PLNet), and electronic services for districts, teachers and students ranging from data exchange, capital planning and funding, to registration and certification, and assessment and transcript services. Distinct users across the province accessing Ministry applications range from in the 100’s to 300,000.
Most recently, we have worked closely with all 60 school districts to complete a Province wide k-12 technology assessment and to identify opportunities for shared opportunities. We led the creation of a School District Telecommunications Advisory council, a subcouncil of the BC Association of School Board Officials and are currently working with 53 districts to use a government procured contract with Telus (TSMA). This agreement will provide participating districts 20% savings on their Voice and Cellular services. The BC Education Plan (EdPlan) has highlighted “Learning Empowered by Technology” as a key element of the Plan. The Ministry’s Transformation Plan outlines the key strategies that support the EdPlan:
- Opportunities continue to be explored with District leadership to identify areas for potential demand aggregation, increased joint efforts, or extension of shared services through leveraging provincial technology agreements.
- Efforts are underway to procure and implement a new common student information service to replace the BC enterprise Student Information System.
- Work is being initiated with the Office of the Government CIO towards integrating education services with the corporate Identity Management program.
Other recent work done to understand the technology landscape in the province has identified some key technology pieces that would be good to standardize on for both use and $$ perspectives. These are being further explored through our Service Delivery (shared services) project.
OPPORTUNITIES:
Partnership with Schools Districts towards a single electronic student record, through the acquisition and implementation of a new provincial Student Information Service.
Page 87 EDU-2013-00071 - PHASE 1
S13
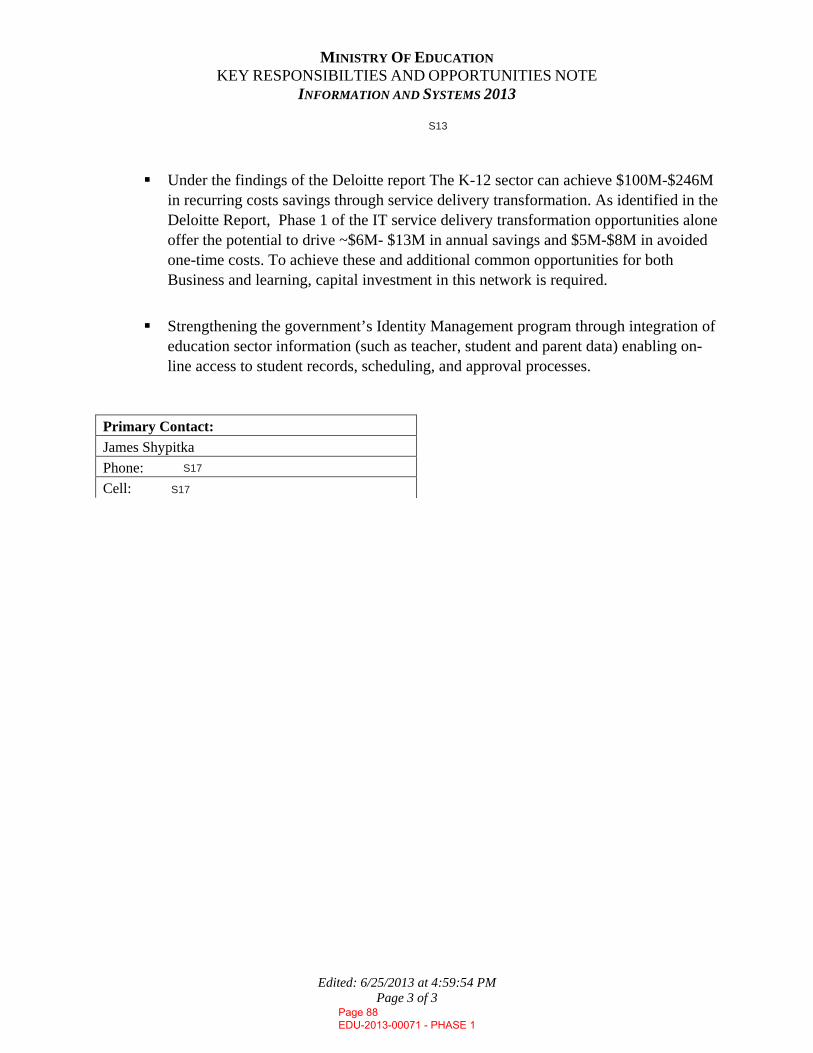
MINISTRY OF EDUCATION KEY RESPONSIBILTIES AND OPPORTUNITIES NOTE
INFORMATION AND SYSTEMS 2013
Edited: 6/25/2013 at 4:59:54 PM Page 3 of 3
Under the findings of the Deloitte report The K-12 sector can achieve $100M-$246M in recurring costs savings through service delivery transformation. As identified in the Deloitte Report, Phase 1 of the IT service delivery transformation opportunities alone offer the potential to drive ~$6M- $13M in annual savings and $5M-$8M in avoided one-time costs. To achieve these and additional common opportunities for both Business and learning, capital investment in this network is required.
Strengthening the government’s Identity Management program through integration of education sector information (such as teacher, student and parent data) enabling on-line access to student records, scheduling, and approval processes.
Primary Contact: James Shypitka Phone:Cell:
Page 88 EDU-2013-00071 - PHASE 1
S13
S17
S17
MINISTRY OF EDUCATION KEY RESPONSIBILTIES AND OPPORTUNITIES NOTE
INTERNATIONAL EDUCATION
Edited: 6/25/2013 at 5:00:06 PM Page 1 of 4
TOPIC DESCRIPTION: B.C.’s K–12 International Education Program
FACTS AND FIGURES:
Approximately 13,000 non resident students are currently studying in BC (10,124 enrolled at a school district and 2,904 enrolled in independent schools).
In 2011/12, these international students paid approximately $168M in K–12 school fees: $129.4M went to Boards of Education and an estimated $31.1 million went to independent schools.
International education (K–12 and post-secondary) support the diversification of the B.C. economy and generate more than $2 billion a year in revenue.
10.9% (62,080) of the student population in BC public schools in 2011- 12 were English Language Learners (ELL).
The B.C. Ministry of Education has signed memoranda of understanding (MOUs) of educational cooperation with three nations: China, Egypt, and Thailand.
23 provincial and municipal MOUs have also been signed with provinces and municipalities in China and Korea where the Ministry has or intends to certify an offshore B.C. educational program.
As of May 2013, there are approximately 10,000 students enrolled in 34 certified offshore schools through the BC Global Education Program located in China, Egypt, Thailand, Korea, and Qatar. An additional 16 offshore schools are working towards certification.
In 2011/12, 1,128 students graduated with a Dogwood certificate from B.C. offshore schools.
The Ministry signed a 3-year pilot agreement with the Kamloops Thompson School District Business Company for the delivery of distributed learning programs to students internationally.
Page 89 EDU-2013-00071 - PHASE 1

MINISTRY OF EDUCATION KEY RESPONSIBILTIES AND OPPORTUNITIES NOTE
INTERNATIONAL EDUCATION
Edited: 6/25/2013 at 5:00:06 PM Page 2 of 4
BACKGROUND: Onshore Program British Columbia’s education system - including curriculum and teachers - has a strong
international reputation. B.C. is generally viewed as a safe and affordable place to obtain an education in English.
B.C. is in an excellent position to strengthen international relationships through the promotion of the K–12 education system as a destination for international students.
International education has received considerable public and media interest over the last few years both nationally and provincially. BC leads the country with 39% of Canada’s international students choosing B.C. as a destination of choice.
The provincial international education strategy focuses on four key directions: o Increasing international student enrolment. o Connecting international education to the long-term goals of increased immigration and
having international students help fill projected demand in the skilled labour force. o Increasing internationalization in schools by helping B.C. students to fully understand
and participate in global commerce and culture. o Develop actions to optimize international students’ education and life-experiences.
A variety of perspectives exist within the international education sector on whether B.C. has sufficient supports and structures in place to enable the highest quality B.C. learning and living experiences for those international students that choose B.C. The Ministry has received feedback from students, teachers, parents and post-secondary universities raising quality control and risk management concerns.
K-12 international education is a highly competitive and complex sector. Some challenges include the:
o Capacity of large versus small programs; o Lack of program governance, oversight and support; o Demographic variations between school communities; o Homestay availability, quality and management strategies; and o International education student fees being the primary driver of programming.
School districts and independent schools use some publicly funded resources (infrastructure, curriculum, etc.) to support international student activities. All revenue from international student activity in B.C. currently remains within the school district or independent school.
In 2012, the Ministry developed a provincial K-12 international education strategic framework that sets out the vision, objectives, goals and actions to support the sector.
In the spring 2013, the Ministry held five K-12 international regional roundtable meetings to seek input from the sector into the development of an action plan to improve and better support international students coming to B.C. A final report from these roundtables is currently under development.
Page 90 EDU-2013-00071 - PHASE 1
MINISTRY OF EDUCATION KEY RESPONSIBILTIES AND OPPORTUNITIES NOTE
INTERNATIONAL EDUCATION
Edited: 6/25/2013 at 5:00:06 PM Page 3 of 4
A Minister’s K-12 International Advisory group was established in September 2012 to provide strategic advice, help assess policy options, identify opportunities, and provide feedback on implementation plans. The advisory has met twice and is planned to hold a final meeting in June 2013.
Offshore Schools In September 1997, the first B.C.-certified offshore school - Dalian Maple Leaf International
School – was established in the People’s Republic of China, enabling the graduates to receive the BC Dogwood graduation certificate.
Today, 34 B.C.-certified offshore school programs are inspected annually to ensure that program standards and requirements are met, including curriculum, assessment, and staffing requirements, all based on the B.C. education system.
The costs associated with the program are fully recovered.
During 2012, the Ministry undertook the first comprehensive review of the offshore program. The review identified a number of critical issues and recommended:
o Strategically aligning the program with government’s objectives o Developing rigorous program eligibility & certification criteria o Simplifying the program governance structure o Developing new rules to ensure quality, and a clear process for school decertification o Increasing recoveries to cover forecasted program costs o Updating and streamline program oversight and administration practices
In January 2013, new program criteria and certification processes were implemented.
Distributed Learning for International Students
A pilot through the Kamloops Thompson School District Business Company has been in operation for three years and has been extended until 2015.
This pilot enables the Kamloops Thompson School District Business Company to deliver the B.C. curriculum, with the exception of Social Studies 11 and English 12, to international students worldwide.
To date, the primary focus has been working with B.C. offshore schools. The Kamloops Thompson School District Business Company intends to expand this pilot internationally.
A thorough review and assessment of the pilot is anticipated by the Ministry in the next school year.
Page 91 EDU-2013-00071 - PHASE 1

MINISTRY OF EDUCATION KEY RESPONSIBILTIES AND OPPORTUNITIES NOTE
INTERNATIONAL EDUCATION
Edited: 6/25/2013 at 5:00:06 PM Page 4 of 4
OPPORTUNITIES: Put in place policy and legislation to provide a clear statutory framework to enable and support
increased accountability and oversight for international education, both onshore and offshore.
Implement plans and actions that support the K-12 international education strategic framework.
Provide provincial supports to provide greater equity of opportunity.
Participate in a formal distributed learning review to identify if this means of delivery is effective and appropriate for international students.
Establish and sustain strong working relationships with senior government representatives offshore through strategic Ministerial and senior bureaucratic engagement.
Primary Contact: ADM: Claire Avison Phone: 250-356-6760 Cell
Page 92 EDU-2013-00071 - PHASE 1
S17

MINISTRY OF EDUCATION KEY RESPONSIBILTIES AND OPPORTUNITIES NOTE
LABOUR RELATIONS 2013
Edited: 6/25/2013 at 5:00:18 PM Page 1 of 3
TOPIC DESCRIPTION: The Ministry of Education supports the work of the Public Sector Employers’ Council Secretariat with respect to the coordination of public sector bargaining, as it relates to bargaining with both teachers and support staff in the K–12 sector. This includes providing policy direction and representation at the teachers’ bargaining table.
FACTS AND FIGURES:
The Public Sector Employers’ Council (PSEC), under the authority of the Public Sector Employers Act, supports government in setting and coordinating strategic directions in human resource management and labour relations for the broad public sector, which employs approximately 370,000 people, of which approximately 300,000 are unionized.
There are approximately 42,000 unionized teachers represented by the BC Teachers Federation (BCTF). The current collective agreement expires June 30, 2013.
The approximately 32,000 K-12 support staff are represented by 12 unions and professional associations across 69 separate collective agreements, with the Canadian Union of Public Employees (CUPE) representing the vast majority of these employees. All agreements expired June 30, 2012.
Annual compensation costs for unionized employees in the K-12 sector is approximately $3.9 billion.
BACKGROUND:
In 2009, government made a concerted effort to more actively include ministries responsible in the coordination of public sector collective bargaining to better align negotiated outcomes with service delivery priorities.
In establishing bargaining mandates for public sector employers and employer associations, PSEC includes three elements:
− Monetary mandate – set by PSEC; − Operational mandate – the changes the employer is seeking in negotiations to
support front-line operations and service delivery;
Page 93 EDU-2013-00071 - PHASE 1
MINISTRY OF EDUCATION KEY RESPONSIBILTIES AND OPPORTUNITIES NOTE
LABOUR RELATIONS 2013
Edited: 6/25/2013 at 5:00:18 PM Page 2 of 3
− Policy mandate – set by the Ministry responsible and providing strategic direction for negotiations to ensure that collective agreements support the delivery of services, rather than determine how they are delivered.
BC Public School Employers’ Associaton (BCPSEA) is the accredited bargaining agent for both teacher and support staff bargaining. BCPSEA delegates local teacher, and support staff bargaining, to Boards of Education.
BCPSEA and the support staff unions have engaged in central negotiations on common items (e.g., wage increases and sector-wide policy issues) through a support staff representative Presidents’ Council for the last three rounds of negotiations.
BCPSEA negotiates directly with the BCTF on provincial items, primarily monetary as outlined by the Public Education Labour Relations Act.
The Ministry of Education currently has two appointed members on the board of BCPSEA – two other government representatives from the PSEC Secretariat also sit on the board. A representative from both the Ministry and PSEC Secretariat also sit on the teacher bargaining team.
Current bargaining falls under the 2012 Cooperative Gains Mandate, which applies to all public sector employees whose collective agreements expire on or after December 31, 2011. The key feature of the Cooperative Gains Mandate is that it provides public sector employers with the ability to negotiate modest wage increases made possible by productivity increases or other savings within existing budgets.
Teachers: The teachers’ collective agreement will expire June 30, 2013. Pursuant to the Agreement in Committee process for this round of bargaining, negotiations are scheduled to continue until June 30th with the assistance of a facilitator. Should an agreement not be reached by June 30th, the facilitator will issue a report to the parties outlining the outstanding issues and the position of the parties on these issues, matters resolved at the table, and suggested processes for continued negotiations.
Support Staff: Under the Cooperative Gains mandate, BCPSEA and the Presidents’ Council engaged in non-financial negotiations in the fall of 2012; barring the identification and approval of a sector-wide or individual district savings plans, negotiation of substantive items (e.g. wages) is subject to a net-zero mandate. Negotiations have stalled.
It is unlikely that negotiated collective agreements will be achieved for either teachers or support staff prior to June 30th without savings to fund compensation increases. It is highly likely that Boards of Education, the BCTF, and support staff unions will continue to pressure government to deviate from the Cooperative Gains Mandate and fund compensation increases in the K-12 sector in order to conclude negotiations.
Page 94 EDU-2013-00071 - PHASE 1
MINISTRY OF EDUCATION KEY RESPONSIBILTIES AND OPPORTUNITIES NOTE
LABOUR RELATIONS 2013
Edited: 6/25/2013 at 5:00:18 PM Page 3 of 3
OPPORTUNITIES: It is unlikely that labour disruptions can be avoided without a revised bargaining
mandate in both the teacher and support staff sector.
Opportunities in the current round of bargaining and in future ones include the ability to better align teacher and support staff bargaining outcomes with the ministry’s transformation agenda to better enable Boards of Education to organize teaching and learning in a manner that supports flexibility, choice and personalized learning.
Primary Contact: ADM: Claire Avison Phone: 250-356-6760 Cell:
Page 95 EDU-2013-00071 - PHASE 1
S17
MINISTRY OF EDUCATION KEY RESPONSIBILTIES AND OPPORTUNITIES NOTE
LIBRARIES 2013
Edited: 6/25/2013 at 5:00:30 PM Page 1 of 3
TOPIC DESCRIPTION: Infrastructure and programs that encourage library integration, collaboration and community connection. FACTS AND FIGURES:
There are 243 public library locations in BC, in 71 library systems, providing access to free public library service for 99% of the provincial population.
50% of British Columbians, or 2.5M people, are active library users, borrowing more than 57 million items each year.
BACKGROUND: The Libraries and Literacy Branch (LLB) administers the Library Act and provides
funding for local library services and collaborative province-wide services.
In 2001, LLB was part of the Ministry of Community and Women’s Services. Priorities from 2001 to 2004 were focused on improving the quality of library service through training and consulting advice, on sharing of resources among libraries through Interlibrary Loan, and on developing consensus for a provincial strategic plan for public libraries.
In 2004, the Libraries without Walls strategic plan was released, which resulted in several significant improvements toward equitable library service for all British Columbians, particularly improved access to books in other libraries and citizens ability to reach quality information on the internet regardless of their location.
Since 2009, LLB has focused its resources on technological improvements, collaborative services and professional development that serve the entire BC library system, through the BC Libraries Cooperative, partner libraries and the work of LLB staff. This work includes:
o The Sitka Integrated Library System (used in nearly 70% of BC libraries), o Accessible library services for the blind and sight-impaired (NNELS), o Training and professional support for library professionals and volunteers, o Regional library federations, which support coordination and collaboration
between libraries o Improved library services for targeted populations (such as immigrants), and o The Commons online community for library workers which aids provincial
service delivery, and creates a platform for communication, planning and collaboration between different groups in the library sector, both locally and provincially.
Looking to the future, the Libraries and Literacy Branch is working to ready the library sector for the major technological and cultural shifts that are changing the way BC citizens and communities use knowledge and libraries, through:
Page 96 EDU-2013-00071 - PHASE 1

MINISTRY OF EDUCATION KEY RESPONSIBILTIES AND OPPORTUNITIES NOTE
LIBRARIES 2013
Edited: 6/25/2013 at 5:00:30 PM Page 2 of 3
o Improved local library capacity for long-term planning and accountability, o Increased BC libraries’ engagement and collaboration with local communities; o Improved relationships between libraries, the Province and other library
sectors (public, K-12 and academic); o Increased use of collaborative and shared resources; o Building local communities’ data literacy capacity, and the capacity of
citizens to use and understand open data; o Extended reach in populations that do not or cannot access library services (eg
Aboriginal and rural populations); and o Improving Government’s use of libraries as a platform for local service.
OPPORTUNITIES: Libraries Online: Improve the critical technology infrastructure in libraries to support
all future efforts to extend and improve service. Includes high speed network connections for libraries, virtual libraries, improved online resources and distributed professional development for rural library workers.
Libraries First, First Libraries: Improve access to libraries for the few remaining rural and First Nations communities without library service, and improve the relevance of library materials and collections for Aboriginal peoples.
The New Library: In partnership with library sector partners, the ministry responsible for local government, the Union of BC Municipalities and the Local Government Management Association, improve the readiness for significant change through improved training for the library sector and improving local governments’ understanding of effective library service.
Community History Project: Funding for training and resources to digitize and share local history resources. In partnership with UBC’s Irving K. Barber Learning Centre.
Immigrant Connections: In collaboration with the ministry responsible for immigration, extended funding to support immigrant and newcomer services in libraries after March 201, when it is scheduled to expire.
Government-Library Collaboration: Improve community access to Provincial government services. Some potential programs: o One-Stop Service @ the Library – increased use of libraries as a portal for
Government services to citizens. In partnership with the ministry responsible for citizen and business services.
o Libraries and Learning: Training and program support to encourage stronger local ties between Public, K-12 and academic librarians as well as better student transitions between K-12 to academic library settings.
Page 97 EDU-2013-00071 - PHASE 1
MINISTRY OF EDUCATION KEY RESPONSIBILTIES AND OPPORTUNITIES NOTE
LIBRARIES 2013
Edited: 6/25/2013 at 5:00:30 PM Page 3 of 3
o Build a Future @ the Library: A library-based work counseling, skills development, and local employers connection program. In collaboration with the ministry responsible for jobs and skills training.
o Understanding Health: Health information resources and programs (e.g. Biometric clinics, etc.) in libraries, focused on improving quality of life and reducing system and individual health costs. In collaboration with the ministry responsible for health and local health, wellness and medical resources.
o Community heARTs: Bringing together local creative professionals, community organizers, and citizens to make art and engage in creative processes that focus on local challenges and to work together to face one or more of those challenges. In collaboration with the ministry responsible for arts development (the Creative Communities program).
Primary Contact: Jacqueline van Dyk ADM: Paige Macfarlane Phone: 250-356-0891 Cell:
Page 98 EDU-2013-00071 - PHASE 1
S17
MINISTRY OF EDUCATION KEY RESPONSIBILTIES AND OPPORTUNITIES NOTE
LIBRARY FUNDING AND GOVERNANCE 2013
Edited: 6/25/2013 at 5:00:41 PM Page 1 of 3
TOPIC DESCRIPTION: An overview of provincial funding and governance for libraries since 2001 and key opportunities for the future. FACTS AND FIGURES:
Annual provincial funding for public libraries is currently $14M down from $18M in FY 2008/09.
Provincial funding accounts for an average of 5% of public library budgets. Most library funding comes from local government.
Small libraries do not have the economies of scale to provide effective library service; they increasingly receive a higher percentage of their funding from the province than larger libraries. (18% on average for libraries serving fewer than 10,000 people).
BACKGROUND: Responsibility for public library services, which had previously been under the
ministry responsible for municipal affairs, was transferred to the Ministry of Education in 2005, as part of the expansion of the ministry’s mandate at that time, which included public libraries, early learning and community literacy. This expansion was meant to align with the first of the provincially-mandated five Great Goals: “the best educated, most literate jurisdiction”
The provincial mandate within the Library Act is the extension and improvement of library service in BC. The Act provides the governance framework for libraries, specifying the allowable types of libraries, their budget and reporting relationships with local government, structure and function of library boards and structure and function of regional library federations.
The Library Act does not specify a regulatory role for the province in the management of libraries. The Libraries and Literacy Branch (LLB) uses funding levers, communication and trust relationships to help ensure that everyone in the province has access to a high-quality library, with a strong library system.
In 2009, as part of a cross-government review of all grant funding in response to the global economic downturn, annual provincial funding for libraries was decreased by $4M. This resulted in the elimination of a number of provincially-funded library programs and a decrease in operating funding for large libraries.
The funding decrease had a significant effect on: the Province’s influence in the library sector, trust relationships with libraries and key partners; the strength of the provincial library infrastructure; local library programs; and, the ability for larger libraries to support smaller ones.
The $15M annual LLB budget currently provides:
Page 99 EDU-2013-00071 - PHASE 1
MINISTRY OF EDUCATION KEY RESPONSIBILTIES AND OPPORTUNITIES NOTE
LIBRARY FUNDING AND GOVERNANCE 2013
Edited: 6/25/2013 at 5:00:41 PM Page 2 of 3
o Operating and other grants directly to libraries for core local service and collections, literacy programs and rural library support (approximately $11M);
o Provincial library infrastructure support; including Internet supports for libraries, shared library catalog and management systems, collection sharing between libraries, provincial library access for visually-impaired users, and regional library federations (approximately $3M); and
o Staff, systems and other LLB support for libraries, including: local library governance and professional training, communication and collaboration for the library sector, and library transformation leadership (approximately $1M).
Direct funding to local libraries has traditionally been spent according to local priorities and needs. Beginning in 2011, LLB began to implement a more rigorous accountability framework for library funding, reflecting the need for outcomes that serve the province’s goals for library improvement and extension. Funding for 2013 is focused on:
o Efforts to extend library service to unsupported communities or populations, or to under-represented groups of users within the local area;
o Supports for education transformation, particularly reading for early learners; o Collaboration among different types of libraries (public, school, academic); o Improvements in accountability, transparency and planning; and o Greater engagement between libraries and local communities.
Dramatic shifts in the way citizens and communities access and use information, particularly online, is creating a need for transformational shifts in the way libraries provide service. Areas of greatest change include the rise of eBooks, digital information resources, outreach services, uses of library space and community engagement.
Coordination and reporting for provincial community literacy programs was made part of the LLB portfolio in 2011. Funding for community literacy coordinators is delivered through a contracted agency, Decoda Literacy Solutions, who also deliver literacy programs for a number of other government ministries.
Funding for the Decoda program was reduced from $2.5 M to $1 M in 2011/12. In 2012/13, Decoda received a $2 M grant, using a $500,000 Decoda budget surplus to make up the difference. After considerable public pressure, this grant was extended in 2013/14.
OPPORTUNITIES: Stable funding and planning for libraries: A more accountable and outcome-based 4-year
planning, funding and evaluation cycle for library operating grants with a guaranteed 4-year provincial grant paid in annual installments and anchored by a one-year evaluation, planning and consultation period.
Page 100 EDU-2013-00071 - PHASE 1
MINISTRY OF EDUCATION KEY RESPONSIBILTIES AND OPPORTUNITIES NOTE
LIBRARY FUNDING AND GOVERNANCE 2013
Edited: 6/25/2013 at 5:00:41 PM Page 3 of 3
Library Transformation Fund: dedicated funding for provincial infrastructure and professional improvement projects with the library sector identifying needs, developing pilots, testing success and deploying successful projects provincially.
Review of the Library Act to enable new forms of governance and partnership among libraries and communities, and clarify the role of library federations,
Community Literacy Funding Redesign: Consider the ministry’s mandate for community literacy, and options for reallocation of the $1M currently allocated to the Decoda literacy outreach coordinators program, to invest in locally-delivered literacy programs and services that build on the established province-wide infrastructure of public libraries.
Primary Contact: Jacqueline van Dyk ADM: Paige MacFarlane Phone: 250-356-0891 Cell:
Page 101 EDU-2013-00071 - PHASE 1
S17
MINISTRY OF EDUCATION KEY RESPONSIBILTIES AND OPPORTUNITIES NOTE
OPEN DATA 2013
Edited: 6/25/2013 at 5:00:53 PM Page 1 of 2
TOPIC DESCRIPTION: Open data makes information collected by the Ministry of Education (MEd) available to the public in an open format, giving citizens and businesses the raw material to make informed decisions and create opportunities. The challenge is making it more accessible and understandable to a broad public audience.
FACTS AND FIGURES (optional): August 2011 MEd’s Open Government strategic plan introduced to align
with Gov 2.0 Citizens @ the Centre, the Technology and Transformation Plan and to support education transformation
Open Data is one component of this plan (see Open Government Note). There are currently 146 Education datasets (e.g., student enrollment) on
the Data BC website, encompassing roughly 70% of all ministry data. Education data sets are consistently among the most frequently
downloaded data from Data BC. Less than $20,000 has been spent on Open Data since the project began
in 2011. BACKGROUND:
The goal is to make publicly available all education and ministry data provided it meets Freedom of Information and Privacy requirements.
Since August 2011 the focus of Open Data has been publishing education data online in raw formats thereby increasing transparency of government processes and performance.
Education data released to date includes mainly student achievement, enrolment,
demographics, class size and funding; MEd is currently working on releasing capital, seismic and teacher data.
Not all education data is available for release. MEd can only release ministry-held
data; school districts hold other education data. MEd is currently developing a strategic framework for education data aimed at
improving use, access, transparency, timeliness, and efficiency of data and data processes. Open Data is a component of the framework.
Key MEd milestones of Open Data include:
Page 102 EDU-2013-00071 - PHASE 1
MINISTRY OF EDUCATION KEY RESPONSIBILTIES AND OPPORTUNITIES NOTE
OPEN DATA 2013
Edited: 6/25/2013 at 5:00:53 PM Page 2 of 2
Launching Discover Your School, a web tool offering data in easy to understand formats such as school choice web pages and maps.
Hosting B.C.’s first student event (code-a-thon) that helps students turn data into useful information (e.g., apps).
Supporting a Public Library sponsored Data Summit, which was successful in helping librarians become aware of their role in improving data literacy for the public.
Producing a hackathon (codeathon) toolkit for public libraries and school districts to use with students in building awareness and skills in use of data.
Challenges with Open Data include:
An education sector culture that is unfamiliar with open data Less public interest and use of the open data sets than originally anticipated Low levels of data literacy by educators and students Data the ministry holds but that has not yet been released due to technical
issues (eg., Teacher Regulation Branch data) Risk aversion to publicly providing data and information
OPPORTUNITIES:
• All current ministry data will be proactively released through DataBC.ca (subject to privacy).
• Support and enable districts to publicly release their data. • Create knowledge of and value from data by developing/providing a self service
visualization tool for the public and other web tools/apps like Discover Your School to showcase and contextualize education data.
• Work with several Superintendents to use EARS (Education Analytics and Reporting System) to organize, analyze and use attendance data to improve student success and demonstrate transparency and open data at the district level.
• Increase the number and variety of datasets to Discover Your School tool. • Provide a mechanism for students to better access their own education data. • Focus on improving data literacy with students, ministry and education sector by incenting
libraries and schools through events and to embed data/digital literacy in new curriculum. • Focus on changing to a culture of data transparency and risk mitigation versus aversion. • Use Open Data as a way for increasing public confidence in education by undertaking the
previous opportunities quickly and decisively. Primary Contact: Eve Gaudet ADM: Paige Macfarlane Phone: 250-356-0891 Cell:
Page 103 EDU-2013-00071 - PHASE 1
S17

MINISTRY OF EDUCATION KEY RESPONSIBILTIES AND OPPORTUNITIES NOTE
OPEN GOVERNMENT 2013
Page 1 of 3
TOPIC DESCRIPTION: Open Government is an approach that provides citizens with access to government information and input into government decisions. How could the Ministry of Education (MEd) further respond to government’s corporate direction? FACTS AND FIGURES:
• Government mandated Open Government to all ministries in July 2011, based on the principles of transparency, collaboration and participation.
• In August 2011 the Ministry of Education introduced its Open Government strategy, in alignment with Gov 2.0 Citizens@the Centre.
• The ministry has adopted Open Government principles and practices as a way of doing business, and in support of education transformation.
• The ministry launched government’s first large-scale on-line citizen engagement forum on transforming education, with 6,000 comments on 38 discussion topics and 250,000 page views (BCEdPlan)
• To date, the ministry has released 176 data files through DataBC website • In order to provide accessible, clear information to the public, the ministry is
in the process of aligning its online content with new government-wide standards.
BACKGROUND: The purpose of the Ministry of Education’s Open Government approach is to build
understanding and share ownership of education transformation with British Columbians, beyond the education sector.
Open Government enables and supports education transformation by enhancing the accessibility and relevance of government data and information, improving process transparency, and creating opportunities for public participation.
Ultimately, an Open Government approach builds confidence in the education system and social license for change.
The ministry’s Open Government strategy includes:
1. Citizen engagement - using face-to-face and online/social media tools to engage the public in conversations about education transformation and seek input in order to help shape policy direction.
• Launched BC’s Education Plan website and online discussion forum • Hosted 4 Twitter TownHalls
Page 104 EDU-2013-00071 - PHASE 1
MINISTRY OF EDUCATION KEY RESPONSIBILTIES AND OPPORTUNITIES NOTE
OPEN GOVERNMENT 2013
Page 2 of 3
• Developed parent engagement strategy, launched Discover Your School web tool and released report on improving communication between parents and schools
• Online forum activity has declined significantly over the past 8 months, with social media activity increasing (2,500 Twitter followers; 1,100 Facebook followers)
• A challenge is how to clearly link input from the public with progress on education transformation. To date we have seen only limited success in creating an effective feedback loop to the public on how their input is affecting change.
2. Open data - making information collected by the ministry available to the public in an open, standardized, and machine-readable format.
• For details on our open data initiatives, see Open Data 2013 Key Responsibilities and Opportunities Note.
3. Online services – improving the ministry’s web site by shifting from a site defined by
the ministry’s organizational structure to a more user-friendly, accessible model. • The project is currently in progress, approximately 30% of the ministry’s overall
online content has been redesigned, restructured and rewritten to date. • Completion of the project has been delayed due to competing priorities.
4. Open information- proactively and routinely releasing ministry information that may be of use or interest to the public.
• The ministry is now routinely releasing executive travel expenses and calendars. • As part of a government-wide project, categorizations of information are being
catalogued for potential release. • Frequently-requested information is being identified through FOI and ministry
correspondence requests, for potential proactive release.
OPPORTUNITIES: Pursuing an Open Government approach provides the opportunity to build public confidence through improved and easy access to information, digital services and opportunities to actively participate in BC’s public education system. 1. Continually improve online services in response to public demands and expectations:
• Full implementation of web presence redesign. • Provide ongoing, embedded public engagement opportunities, using multiple methods
and means for the public to have input and influence. • Report out to the public clearly and regularly on the impact of public participation on
education policy direction. • Explore, design and implement digital services for direct client services, where feasible. • Provide relevant, clear information and data proactively to education stakeholders and the
public through multiple channels and in accessible formats. • Make useful and responsive multi-media, interactive and mobile-friendly information and
data readily available to the public. • Create a self-serve database/repository for educators to share resources.
Page 105 EDU-2013-00071 - PHASE 1
MINISTRY OF EDUCATION KEY RESPONSIBILTIES AND OPPORTUNITIES NOTE
OPEN GOVERNMENT 2013
Page 3 of 3
• Use the web presence as an entry portal to a common, virtual education space for educator, parent and student access.
• Publish a monthly on-line BC Education magazine with current information and ideas, and showcasing local and provincial innovative initiatives on education.
2. Expand parent engagement through districts and schools: • Leverage Discover Your School as the virtual platform for parent engagement. • Increase the number of data sets available on Discover Your School to reflect
parent/public demand. • Explore the feasibility of further parent engagement action research projects in several
school districts. • Translate key resources for parents. • Leverage funding provided to BCCPAC in order to improve parent communication and
build capacity at all levels. • Create relevant, accessible, user-friendly resources for parents including tools to support
effective communication and collaboration. • Consider making effective parent/family engagement part of formal school district
accountabilities.
3. Expand the focus of Open Government to include the education sector: • Partner with external open government champions to build awareness of open data and
public engagement opportunities. • Work with the sector to build data literacy and awareness of open data. • Work with the sector to identify and build digital service opportunities. • Explore opportunities to work with districts on events such as community
“unconferences” aimed at building awareness of education transformation and creating opportunities for collaboration and participation.
• Extend the reach of open data through a pilot project with a few key districts to publicly release district datasets.
• Explore the feasibility of engaging students through a social innovation strategy with their communities.
Primary Contact: Eve Gaudet
ADM: Paige Macfarlane Phone: 250-356-0891 Cell:
Page 106 EDU-2013-00071 - PHASE 1
S17
MINISTRY OF EDUCATION KEY RESPONSIBILTIES AND OPPORTUNITIES NOTE
OPEN SCHOOL BC 2013 Background Initially established in 1919 by the British Columbia Department of Education, Open School BC (OSBC) was Canada’s first correspondence school, serving remote learners in all parts of British Columbia and the Yukon Territories. Now part of the Business, Technology and Online Services Division of the Ministry of Education, OSBC develops and delivers e-learning services, digital and print content, and award-winning multimedia, for both the public and independent school system and the broader public sector. OSBC returned to the Ministry of Education in 2010 from the Ministry of Citizens’ Services. Our skill set and experience in implementing technologies and resources were to support the education transformation and drive to personalized learning. OSBC continues to operate on primarily a cost-recovery basis, generating revenue through sales of its print and online materials, as well as by charging for its design, development, and e-learning services. Revenues in the 2012 fiscal year were close to $2.5 million. OSBC has 23 staff members with professional backgrounds in project management; education and training; instructional design; instructional writing and editing; graphic, web, and multimedia design; computer programming; and educational software applications.
CURRENT AREAS OF RESPONSIBILITY AND OPPORTUNITIES Skills and Trades Training We have built a strong relationship with the Industry Training Authority (ITA) and develop learning resources used in all apprenticeship programs for a variety of trades. We also work closely with the Trades and Training initiative to support trades awareness and training in the K-12 sector. Opportunity:
Open Education Resources (OER) Increasing cost pressure necessitated some changes and limits be applied to the Education Guarantee that provided “free, easy access to adult basic education”. As funding became available, OSBC maintained the Government’s commitment by providing free access to online course resources. As of September 2012, any member of the public can access self-study materials for a number of courses, including Law 12, Mathematics 10 & 11, English 10, B.C. First Nations Studies 12, Financial Planning, and Career Planning. All OERs are uploaded to the LearnNowBC resource repository so BC teachers can
Page 107 EDU-2013-00071 - PHASE 1
S13
S13
MINISTRY OF EDUCATION KEY RESPONSIBILTIES AND OPPORTUNITIES NOTE
OPEN SCHOOL BC 2013 download and modify them for their own teaching purposes. Students can also access these free resources. Opportunity:
eLearning Delivery – Hosting and Support OSBC provides e-learning services through hosting a learning management system (LMS) for 14 school districts and a number of public sector clients on a fee for service basis. Our school district member members range from the largest (Surrey) to the smallest (Stikine) and we serve over 15,500 online K-12 distributed learners. Over 6,000 public sector employees use our service annually for mandatory training courses. Districts participating in the consortium realize significant cost savings. Opportunity:
Resource Development and Training OSBC continues to develop and supply high quality learning resources to the K-12 system, focusing on developing digital resources that can be used flexibly by teachers in multiple learning environments and on multiple devices, including tablets, smartphones and other mobile technology. With the support of the Learning Division, OSBC has been working with teams of teachers to develop “demonstrations of learning” to support the new directions in curriculum. Opportunity:
Page 108 EDU-2013-00071 - PHASE 1
S13
S13
S13
S13
S13
S13
MINISTRY OF EDUCATION KEY RESPONSIBILTIES AND OPPORTUNITIES NOTE
OPEN SCHOOL BC 2013 Primary Contact: Eleanor Liddy ADM: Renate Butterfield Phone:Cell:
Page 109 EDU-2013-00071 - PHASE 1
S17
S17
MINISTRY OF EDUCATION KEY RESPONSIBILTIES AND OPPORTUNITIES NOTE
PROVINCIAL AWARDS PROGRAM 2013
Edited: 6/25/2013 at 5:01:27 PM Page 1 of 3
TOPIC DESCRIPTION: Changes to the Provincial Awards Program could be contemplated to better align it with new learning models and to manage a budget pressure of $2.2 million. FACTS AND FIGURES (optional):
The Provincial Awards Program operates on a budget of $15.2 million Each year the Ministry issues:
• 5000 provincial exam scholarships ($1,000 each) • 5,500 District/Authority awards ($1,000 each) • 20 scholarships to the top 20 academic students in the province
($2,500 each) • 27,000 Passport to Education awards ($250 for Gr. 10 and 11, $500
for Gr. 12) • approximately 450 Secondary School Apprenticeship scholarships
($1,000 each) • 20 Pathway to Teacher Education scholarships ($5,000 each)
Funding for this program was repatriated back into the Minsitry of Education from the Ministry of Advanced Education, Innovation and Technology (AEIT) in 2012.
BACKGROUND: The Provincial Awards program has been in place since 1987.
The Provincial Awards Program is closely aligned with the secondary school graduation program: as graduation policy revisions occur, awards program policy must as be revised.
Optional provincial examinations were discontinued in August, 2011. With this change the criteria for provincial exam scholarships also changed; new criteria were based on achievement on the five required provincial exams in Grades 10 – 12.
Until September 2012, the program was jointly managed by the Ministries of Education and Advanced Education. The budget was held by AEIT with the program administered by the Ministry of Education.
Page 110 EDU-2013-00071 - PHASE 1
S13, S17
S13, S17
MINISTRY OF EDUCATION KEY RESPONSIBILTIES AND OPPORTUNITIES NOTE
PROVINCIAL AWARDS PROGRAM 2013
Edited: 6/25/2013 at 5:01:27 PM Page 2 of 3
Ministry of Education staff consulted with education stakeholders in January 2012 to determine the appetite for revising the awards program to align with new directions in personalized learning.
The feedback indicated that schools and districts favoured fewer, high value district-based scholarships supporting personalized learning competencies with the ability to tailor to local demographic factors.
As a start down this path, the Provincial Awards Program responded by capping the provincial exam scholarship at 5,000, and increasing the number of District/Authority awards from 3,000 to 5,500. In addition to the existing categories of applied skills, fine arts, athletics, two additional categories were added: community service and trades and technology.
Stakeholders also recommended discontinuing one aspect of the awards program, the Passport to Education scholarship. The Passport to Education Program accounts for the largest portion of the provincial scholarship fund and is the only provincial scholarship program that awards academic achievement to students in each of grades 10, 11 and 12. Longer term systemic changes will need to be considered in the broader context of personalized learning.
In the fall of 2012 the Ministry organized regional consultations as part of the graduation program review. Participants were asked for their views regarding a more personalized awards program.
Suggestions for broad principles for a renewed awards program include:
recognizing and rewarding all forms of authentic student learning
placing equal incentive on all learning pathways
ensuring equitable access and support
recognizing students throughout K-12
OPPORTUNITIES: An opportunity exists to revise the Provincial Awards Program by ensuring it aligns
with the core values and new directions in education transformation.
It also provides an opportunity to change the funding of this program into a predictable, district driven model that can be better tailored to the unique demographics in each district while maintaining high standards.
Page 111 EDU-2013-00071 - PHASE 1
S13, S17
MINISTRY OF EDUCATION KEY RESPONSIBILTIES AND OPPORTUNITIES NOTE
PROVINCIAL AWARDS PROGRAM 2013
Edited: 6/25/2013 at 5:01:27 PM Page 3 of 3
Potential changes to the graduation program could indicate a shift in the awards program from the current narrow focus on academics, to a more inclusive model with an expanded vision of success. Recommendations from the field for changes to the awards program suggest a need for more flexibility and local authority.
Primary Contact: Brenda Neufeld ADM: Renate Butterfield Phone:Cell:
Page 112 EDU-2013-00071 - PHASE 1
S13
S17
S17
MINISTRY OF EDUCATION KEY RESPONSIBILTIES AND OPPORTUNITIES NOTE
PUBLIC SCHOOL FUNDING 2013
Edited: 6/25/2013 at 5:01:39 PM Page 1 of 3
TOPIC DESCRIPTION: The kindergarten to grade 12 public school system is funded using a funding formula designed to allocate more than $4.7 billion to school districts on a fair and equitable basis, taking into account local conditions. The general operating grants are calculated using individual district enrolment and specific factors that apply to each school district. FACTS AND FIGURES:
Funding for 2013/14 will be over $4,725,363,400. Enrolment has declined by 72,256 FTE since 2000/01, a decrease of
12.1%. Average per pupil funding will be $8,603 in 2013/14.
BACKGROUND:
Previous to 2002/03, public school funding was based upon a resource cost model. The model used a complex set of formulae to approximate the cost of various school district expenditures. There were over 50 funding categories, using more than four hundred formulae which determined how much funding each district received. These criteria dictated how much school districts were required to spend on each provincially determined program area, with no regard to the unique circumstances and individual needs of their communities.
Beginning with the 2002/03 school year, the Ministry implemented a new funding formula, which endeavored to establish an enrollment-based and transparent approach to calculating funding for school districts. It was also at this time that three-year funding envelopes were introduced.
The current funding allocation formula distributes a fixed amount of money established as part of the Provincial budget each year. This amount is referred to as the “Block” and makes up approximately 92% of the Ministry of Education’s budget. The funding formula allocates all of the funds in the Block to public schools as operating funding. Other grants, including capital grants and independent school funding are “outside” the Block.
The funding allocation formula is based on a per FTE student funding amount (81% of total Block funding) called the “basic allocation”. The number of students is primarily counted as of September 30th but also includes enrolment counts in February and May for growth in special needs students, distributed learning (DL) and continuing
Page 113 EDU-2013-00071 - PHASE 1
MINISTRY OF EDUCATION KEY RESPONSIBILTIES AND OPPORTUNITIES NOTE
PUBLIC SCHOOL FUNDING 2013
Edited: 6/25/2013 at 5:01:39 PM Page 2 of 3
education (CE) programs. The funding formula also contains supplementary grants for special needs students, English language learners, Aboriginal education, teacher salary differentials, enrolment decline, and unique geographic factors. The number of targets, caps and trust funds has been significantly reduced since 2001, providing school boards with more flexibility and control over the delivery of education services in their districts.
Over the last 16 years, demographics in B.C. have shown a marked decline in the number of school age students. From a high of 603,974 FTE students in 1997/98, to the current forecast of 525,692 FTE students for September 2013, there are now 78,282 fewer students in the public school system [and 211 fewer schools]. As a result, average per pupil funding has risen.
BC Stats estimates that school age population will begin to rise again by 2015/16 and be back to record levels by the 2020’s. The projected increase will have implications for funding, and for facility needs, since the funding allocation formula is based on enrolment levels.
A 100% funding protection supplement was added to the funding allocation formula in 2006 to ensure the many districts with declining student enrolment did not receive less funding than the previous year. However, as the enrolment decline is not universal (some districts such as Surrey have increasing student populations) and funding levels have plateaued, keeping declining districts at 100% proved to be unsustainable.
Beginning with the 2012/13 school year, districts with declining enrolment are protected to 98.5% of the previous autumn funding level. This allows funds to be available for districts with enrolment growth, while at the same time providing a reasonable level of protection for districts with declining enrolment.
Each year, the Ministry holds back a portion of the preliminary operating grant allocation to ensure there are funds available in case district estimates for enrolment throughout the year are higher than forecasted. Holdbacks are calculated by determining the difference between the Ministry estimate (from BC Stats) and the districts’ estimate of enrolment, plus a contingency amount. In 2012/13 the holdback was calculated to be $51.26 million; in 2013/14 it is $59.6 million.
When enrolment is less than projected, such as 2012/13, additional funds are available and are added to the holdback. Funds in the holdback are allocated to cover enrolment growth in February and May, with any remaining funds released to school districts, usually on a per pupil basis. In 2012/13, due to a larger than expected drop in enrolment, a further $26.3 million was added to the holdback. The Ministry used $2.13 million for the operating grant for BC Public School Employers’ Association, and $15.6 million as a “prepayment” of the Annual Facilities Grant (AFG). The balance of the holdback [$61.56 million] will be distributed back to school districts throughout the year.
Page 114 EDU-2013-00071 - PHASE 1
MINISTRY OF EDUCATION KEY RESPONSIBILTIES AND OPPORTUNITIES NOTE
PUBLIC SCHOOL FUNDING 2013
Edited: 6/25/2013 at 5:01:39 PM Page 3 of 3
OPPORTUNITIES:
Primary Contact: A/ADM: Doug Stewart Phone: n/a Cell:
Page 115 EDU-2013-00071 - PHASE 1
S13, S17
S17
MINISTRY OF EDUCATION KEY RESPONSIBILTIES AND OPPORTUNITIES NOTE
SAFE SCHOOLS 2013
Edited: 6/25/2013 at 5:01:50 PM Page 1 of 2
TOPIC DESCRIPTION: In B.C., there have been a number of serious incidents that involve school-aged children where in some incidents warning signs were not recognized, missing an opportunity to provide possible intervention and supports to students, parents, teachers, and administrators. The ERASE Bullying strategy, led by the Ministry of Education, is a comprehensive prevention and intervention strategy introduced in June 2012 to support educators and community partners identifying potential issues and threats before they happen.
FACTS AND FIGURES:
• As of March 1, 2013 more than 3,500 people have been trained across 45 school districts to identify and address threats and at-risk behavior. All 60 school districts will receive training by the end of May 2013.
• A parent portal www.erasebullying.ca links parents to the very best information available to them from third party organizations. Since its launch in November 2012, the website has received well over 60,000 visits.
• An anonymous online reporting tool has been established to give
students a safe place to report bullying or incidents they feel put them or their classmates at risk.
• BC’s strategy was created from best practices based on research,
evaluation, and lessons learned mainly from Finland, Quebec, and Ontario.
BACKGROUND: With the introduction of technology and social networking, the opportunity for bullying to escalate into a serious issue is only growing. Now, bullying goes beyond the schoolyard – it reaches a child 24/7, even breaching the walls of their bedrooms, a former safe haven for many. It has resulted in suicides, violent attacks on peers (on and off of school property), and can leave a deeply damaging impact on victims. It is time for change, and that is what is at the heart of ERASE Bullying.
Our strategy differs from other anti-bullying efforts that focus only on students; we believe we need to better support our educators ensuring they are trained to understand positive school cultures, and are able to respond to incidents as they arise. This multi-faceted approach was created specifically for B.C. after determining no other existing anti-bullying programs were comprehensive enough to meet our ambitious goals.
Page 116 EDU-2013-00071 - PHASE 1
MINISTRY OF EDUCATION KEY RESPONSIBILTIES AND OPPORTUNITIES NOTE
SAFE SCHOOLS 2013
Edited: 6/25/2013 at 5:01:50 PM Page 2 of 2
All 10 elements of ERASE are linked, and create a comprehensive strategy that works. To ensure success, we sought out subject matter experts Theresa Campbell (Safer Schools Together) and Kevin Cameron (Canadian Center for Threat Assessment and Trauma Response) who played a key role in developing training material for the strategy, and continue to play a role in delivering various elements of ERASE.
The B.C. government’s strategy includes: 1. A five-year, multi-level training program for 15,000 educators and community partners to
help proactively identify and address threats. The ministry allocates about 20% of the training space to community partners like police and mental health workers.
2. An anonymous online reporting tool for students. (www.reportbullyingbc.ca) 3. Dedicated safe school coordinators in every school district. 4. Stronger codes of conduct for schools. 5. Provincial guidelines for threat assessments. 6. Online resources for parents. (www.erasebullying.ca) 7. Formal protocols to guide and co-ordinate the work of school and community partners. 8. A provincial advisory committee with representatives from police, school and social
agency partners. 9. Focusing one of the existing six provincial teacher professional development days on
anti-bullying. 10. Anti-bullying and threat assessment training for pre-service teachers.
OPPORTUNITIES:
Primary Contact: Prepared by: the person who researched and wrote the information
ADM: Sherri Mohoruk Name: Jennifer McCrea Phone: 250-514-2543 Phone: 250-896-3735 Cell: 250-514-2543 Cell: 250-896-3735
Page 117 EDU-2013-00071 - PHASE 1
S13
MINISTRY OF EDUCATION KEY RESPONSIBILTIES AND OPPORTUNITIES NOTE
SATISFACTION SURVEY 2013
Edited: 6/25/2013 at 5:02:01 PM Page 1 of 3
TOPIC DESCRIPTION: The Satisfaction Survey is an annual survey of school staff, parents and students in Grades 3/4, 7, 10 and 12. The survey measures the quality of the learning environment (e.g., parent involvement, school connectedness, safety, and academics). Results can be used for planning of educational program delivery. Should the ministry explore continuation of the survey either in its current form, or enhancing it as a customizable tool for collection of information? FACTS AND FIGURES:
Surveys have been administered every year since 2001 in British Columbia to public schools students in grades 3/4, 7, 10 and 12, their parents and school staff.
Participation rates vary from relatively high for students to low for parents and staff.
Satisfaction of Grade 4 students has declined significantly over the past 10 years from 72% to 62%, while grades 7, 10 and 12 have remained fairly steady over this time frame.
In 2010/11, as part of a review of the survey, over 850 school principals provided feedback. Results indicate that the majority of principals use survey data for planning and communications to staff. The most useful measures were related to safety/bullying, learning environment and academics.
BACKGROUND:
The survey is the only source of province-wide data on school culture and learning environment (e.g., involvement of parents, collegial development of learning materials, safety, expectation of success and sense of welcome).
Student participation rates have always been high – ranging from nearly 90 percent for grades 3/4 and 7, over 70 percent for grade 10, and about 60 percent for grade 12, providing information that is representative at the individual school level.
Parent participation rates are low at about 9 per cent overall. The mechanics of accessing the survey may contribute to these low rates.
Staff participation rates are below 15 per cent.
Page 118 EDU-2013-00071 - PHASE 1

MINISTRY OF EDUCATION KEY RESPONSIBILTIES AND OPPORTUNITIES NOTE
SATISFACTION SURVEY 2013
Edited: 6/25/2013 at 5:02:01 PM Page 2 of 3
In October 2012, a decision was made to discontinue administering the survey to teachers and administrators. Feedback from these two groups would occur through the proposed teacher engagement strategy planned for 2013/14. After further internal Ministry consultations, these survey changes have been delayed to January 2015 while awaiting decision on the teacher engagement strategy.
While participation in the annual satisfaction survey has traditionally been mandatory, in response to job action in the 2011/12 school year, the Ministry communicated to school districts that participation in the survey was voluntary. Consequently, overall participation dropped from 1,300 to approximately 630 schools.
The survey is currently administered electronically from January to April. Options to extend the survey “window”, or to facilitate multiple sessions per year, are currently being explored.
Survey results are used by schools and school districts in Achievement Contracts and the Superintendents Report on Achievement. Survey results are publicly available. In past years results have been reported in the Ministry service plan.
The survey continues to be optional for independent schools.
The core questions are currently under review and options are being explored to facilitate customization of the survey by school districts and schools.
Options to improve access to the survey are being explored.
A consultation process should occur with the field prior to any major changes to the survey.
OPPORTUNITIES:
Increase the value of the survey for the Ministry, school districts and schools by analyzing the data to inform decision making (e.g. explore why satisfaction of grade 4 students has declined by 10% in the past 10 years).
.Improve participation of all survey groups.
Continue to improve access and usability for survey respondents and customizability for school districts and schools.
Use the parent results to support and measure parent engagement.
The survey tool can be easily extended to independent schools. This can be achieved by promoting the use and benefits of the survey in collaboration with the Federation of Independent Schools Association and Independent Schools Branch.
Extend the survey tool to Federal band schools as part of the Tripartite Education Framework Agreement.
Align core questions to support and inform education transformation.
Page 119 EDU-2013-00071 - PHASE 1
MINISTRY OF EDUCATION KEY RESPONSIBILTIES AND OPPORTUNITIES NOTE
SATISFACTION SURVEY 2013
Edited: 6/25/2013 at 5:02:01 PM Page 3 of 3
Primary Contact: Caroline Ponsford ADM: Paige MacFarlane Phone: 250 356-0891 Cell:
Page 120 EDU-2013-00071 - PHASE 1
S17
MINISTRY OF EDUCATION KEY RESPONSIBILTIES AND OPPORTUNITIES NOTE
SEISMIC MITIGATION PROGRAM (SMP) 2013
Edited: 6/25/2013 at 5:02:13 PM Page 1 of 3
TOPIC DESCRIPTION: The primary objective of the SMP is to achieve a life-safety standard for schools by minimizing the probability of local structural collapse as a result of a seismic event. FACTS AND FIGURES:
Since the inception of the Seismic Mitigation Program: o 131 projects completed; o 5 under construction; o 16 proceeding to construction; and o 61 supported.
With the above 213 projects underway, there are another 102 schools remaining to be addressed.
Since 2001 government has spent or committed $2.2 billion to seismically upgrade or replace 213 high-risk schools. It is anticipated it will cost a further $600 million to address the remaining 102 high-risk schools in the province.
BACKGROUND:
March 2004 - the Ministry initiated seismic assessments of 877 schools within 37 school districts located in high-risk seismic zones.
November 2004 - Government committed to a $1.5 billion plan for the seismic upgrading of 749 schools over 15 years to make BC schools earthquake safe.
2005 – The initial SMP approval of 95 projects was announced as part of a 3-year SMP capital announcement.
Since 2005, a technical team with members from the Association of Professional Engineers and Geoscientists (AGEGBC) and the University of BC’s (UBC) Earthquake Engineering Research Facility has continued to refine the risk assessment and mitigation strategies through experience in actual seismic upgrade projects, extensive laboratory testing at UBC’s world-class shake table lab, and peer review by leading international structural experts. This work was the basis of a new assessment methodology that led to a reassessment of the remaining high-risk schools in 2010. Schools were categorized as High 1, High 2, High 3, Medium or Low.
Page 121 EDU-2013-00071 - PHASE 1
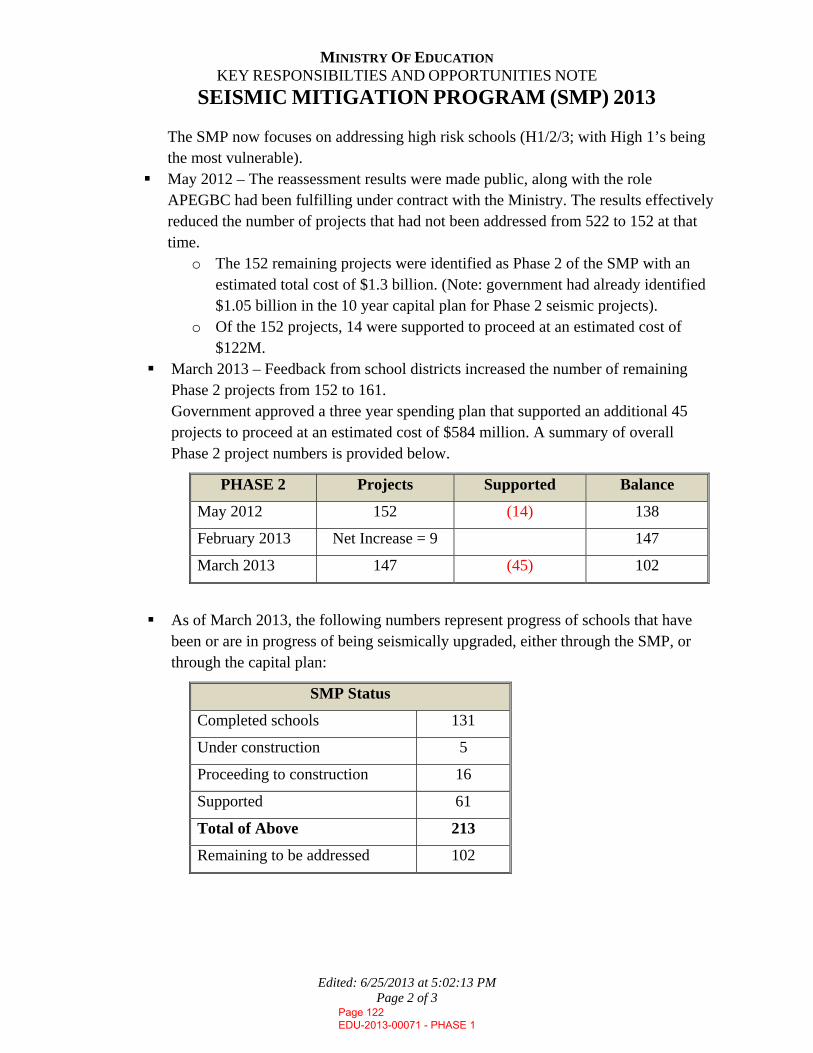
MINISTRY OF EDUCATION KEY RESPONSIBILTIES AND OPPORTUNITIES NOTE
SEISMIC MITIGATION PROGRAM (SMP) 2013
Edited: 6/25/2013 at 5:02:13 PM Page 2 of 3
The SMP now focuses on addressing high risk schools (H1/2/3; with High 1’s being the most vulnerable).
May 2012 – The reassessment results were made public, along with the role APEGBC had been fulfilling under contract with the Ministry. The results effectively reduced the number of projects that had not been addressed from 522 to 152 at that time.
o The 152 remaining projects were identified as Phase 2 of the SMP with an estimated total cost of $1.3 billion. (Note: government had already identified $1.05 billion in the 10 year capital plan for Phase 2 seismic projects).
o Of the 152 projects, 14 were supported to proceed at an estimated cost of $122M.
March 2013 – Feedback from school districts increased the number of remaining Phase 2 projects from 152 to 161. Government approved a three year spending plan that supported an additional 45 projects to proceed at an estimated cost of $584 million. A summary of overall Phase 2 project numbers is provided below.
PHASE 2 Projects Supported Balance
May 2012 152 (14) 138
February 2013 Net Increase = 9 147
March 2013 147 (45) 102
As of March 2013, the following numbers represent progress of schools that have been or are in progress of being seismically upgraded, either through the SMP, or through the capital plan:
SMP Status
Completed schools 131
Under construction 5
Proceeding to construction 16
Supported 61
Total of Above 213
Remaining to be addressed 102
Page 122 EDU-2013-00071 - PHASE 1
MINISTRY OF EDUCATION KEY RESPONSIBILTIES AND OPPORTUNITIES NOTE
SEISMIC MITIGATION PROGRAM (SMP) 2013
Edited: 6/25/2013 at 5:02:13 PM Page 3 of 3
Primary challenges to the SMP are: o Scope control. Processes are in place to ensure the seismic structural scope is
well defined, however, some school districts continue to lobby for more expansive projects.
o Approximately 40% of all supported and remaining projects are in Vancouver. The Vancouver Board of Education has stated that the SMP is an opportunity to renew their schools. This creates pressure on available funds.
o Changing assumptions of ground motion assumptions. A key determining factor to identifying the risk to school structures are the assumed ground motions for different types of earthquakes. Ongoing research, from time to time, may change these assumptions, thereby changing the assessed risk of some schools. Currently under review are forces for the Tofino/Ucluelet area that may add new schools to the list for structural upgrades.
OPPORTUNITIES: Government has an opportunity to reinforce its commitment to the SMP, and to the
primary objective of achieving a life-safety standard for schools by minimizing the probability of local structural collapse.
Assuming continued support for the SMP, there are 102 projects yet to be addressed, or announced as supported and able to proceed. Included are:
21 High 1’s (all in Vancouver)
12 High 2’s
69 High 3’s Primary Contact: A/ADM: Doug Stewart Phone: n/a Cell
Page 123 EDU-2013-00071 - PHASE 1
S17
MINISTRY OF EDUCATION KEY RESPONSIBILTIES AND OPPORTUNITIES NOTE
SHARED SERVICES 2013
Edited: 6/25/2013 at 5:02:24 PM Page 1 of 4
Service Delivery Opportunities The Ministry is supporting a service delivery project led by senior management of school districts to provide workable, cost effective opportunities to school districts. FACTS AND FIGURES:
Boards of Education spend $835 million or 16.68% of their budget annually in non-instructional areas.
Report in 2012 by Deloitte& Touche LLP outlined estimated cost savings of $100 to $246 million of Boards non-instructional budget if shared services initiatives were adopted. Some of the opportunities require implementation investments in the range of $10 to $19 million.
Organizational and succession planning are becoming increasingly important in the sector as the work force ages and there is continued risk due to the loss of expertise.
Funded Enrolment has declined significantly since 2001 which has challenged districts to reduce overhead and facility costs.
Annual cost pressures since 2001 total 3 to 4 percent of school district budgets net of the provincial funding increases and cost reductions for enrolment decline.
BC Association of School Business Officials estimate additional cost pressures in the K-12 sector for 2013/14 at $134 million or 2.6% of their budgets.
BACKGROUND:
Since 2001, the Province has provided a number of services to school districts in a shared service model:
The Provincial Learning Network (PLNet) provides a cost effective network and communications infrastructure
System for school districts to provide their financial and budget data to the Province
School Protection Plan which provides insurance and risk management support
Page 124 EDU-2013-00071 - PHASE 1
MINISTRY OF EDUCATION KEY RESPONSIBILTIES AND OPPORTUNITIES NOTE
SHARED SERVICES 2013
Edited: 6/25/2013 at 5:02:24 PM Page 2 of 4
In 2003, the Report on the Task Force on Rural Education recommended shared services as a way to create cost savings and support rural areas
In 2006, the province provided a common student information system and school districts shared in the cost of operation
In 2009, the Ministry supported the implementation of a common database of HR and payroll data called EDAS (Employment Data Analysis System). This database provides employment information that can be mined for bargaining questions and costing.
In 2009, the Ministry supported a project to evaluate sharing Secretary-Treasurer positions for small school districts. This resulted in Central Coast and Vancouver Island West sharing a Director of Business Operations allowing the Superintendents to take on the role of Secretary-Treasurer in those smaller enrolment districts
In 2011, the Ministry supported a project called IBAS to determine if a common financial and payroll system would be viable and benefit the K-12 system. This project did not proceed to implementation due to the initial investment requirement.
In 2011, the agreement signed with Telus providing long-distance, voice, conferencing, cellular and data services to the provincial government provided expansion of services to school districts.
450 schools received upgrades to high speed fibre optics and the Ministry is actively working with school districts to complete the remainder
The agreement offers school districts a cost savings opportunity on voice services. The School District Telecommunication Advisory Council was put in place in August 2012 to lead this from concept to contract implementation.
In 2012, the Ministry supported an assessment by IBM of the technology in school districts to support the new Education Plan. This has resulted in a number of proof of concept evaluations of system and network improvements and will support the work of the Service Delivery Project outlined below.
In 2012, a report was provided by Deloitte & Touché LLP entitled Service Delivery Transformation which identified potential opportunities for efficiencies and savings.
In follow up to the report, the Ministry of Education is supporting a Service Delivery Project and has contracted a project lead to support the sector in this work. Focus is on areas where savings can be generated in the near term:
Consolidate purchasing cards Encourage all districts to participate in the consolidated cards Expand group buying Increase collective buying Provincial fuel procurement Centralize vehicle fleet purchases Centralize Print services Centralize staff e-mail and communications Develop a Share Point Portal HR/Payroll pilot Support and Wellness program Extend shared Work Safe program Coordinate legal services
Page 125 EDU-2013-00071 - PHASE 1

MINISTRY OF EDUCATION KEY RESPONSIBILTIES AND OPPORTUNITIES NOTE
SHARED SERVICES 2013
Edited: 6/25/2013 at 5:02:24 PM Page 3 of 4
The Minister of Education, in his letter of August 24, 2012 outlined that savings from these initiatives will be reinvested into the public education sector.
The Service Delivery Project Committee (SDPC) is the lead committee and a number of working groups will be established to provide technical advice to the Committee.
Five working groups are working to do the detailed technical work; they are Procurement, Legal Services, HR/Payroll, Attendance Support, Wellness and Occupational Safety, and Information Technology and Communication Services
Timelines of the Opportunities to School Districts: Legal Services August 31, 2013 Procurement Services December 31, 2013 Information Technology and
Communication Services January 31, 2014
Attendance Support, Wellness and Occupational Safety
November 30, 2013
HR/Payroll March 31, 2014 Final Report June 30, 2014
Implementation Investment Considerations and Constraints Many of the options will need initial investment offset by a payback period from
savings which will be determined through the business case preparation of each group.
Many school districts have limited local capital or operating reserves to finance any startup costs. Other capital expenditures need to be available in the Ministry of Education budget
The Ministry of Education budget does not include implementation costs for any initiatives coming from this project
Deliverables of the Project: For each opportunity the project will provide to school districts • Options and implementation plans • Business cases which outline savings, initial investments and ongoing costs • Ongoing governance structures The responsibility and role of Boards of Education is respected by providing the
opportunities and decision making documents and allowing each district to make an individual decision to participate
Early Successes: Vancouver Pilot project
Review of application of Government HR/Payroll system to school districts Sharing of project costs of project between Vancouver School Board, Public Service
Agency and Ministry of Education Evaluation of the provision of services and information
Page 126 EDU-2013-00071 - PHASE 1

MINISTRY OF EDUCATION KEY RESPONSIBILTIES AND OPPORTUNITIES NOTE
SHARED SERVICES 2013
Edited: 6/25/2013 at 5:02:24 PM Page 4 of 4
Sharing of common software and licenses between the school district and province Efficiencies of processing and avoidance of risks of back and recovery, staff training,
help desk, and employee support Initial proposals indicated that expansion of government contracts could reduce costs
in the provincial contract and for Vancouver School Board Vehicle Purchases
School districts were given the opportunity to purchase their maintenance vehicles through the provincial agreement
8 districts have expressed interest with 3 districts making a purchase saving them 10 to 15% on the cost of the vehicle
Telus Contract for Voice Services 53 of the 55 districts that could participate have returned their letters of intent Annual savings of $1.6 million or 22% of the current costs are expected A joint governance structure was created and the Ministry of Education will support
an administrator for this contract to ensure savings This project proved that there were savings in legal and procurement services by
working together
OPPORTUNITIES: Tier 2 and 3 opportunities identified in the Deloitte, Touche LLP report that were not
part of the Service Delivery Project due to investment requirements, concerns about outsourcing of school district work, and difficulty of implementation:
Capital Project Planning and Management Facilities cleaning and maintenance services Alternative model for student transportation Expand shared recruitment of staff Common financial reporting system
Build on early successes: Telus Voice Vehicle Purchases Provincial procurement contracts expanded to include the K-12 sector
Address risks in the K-12 sector of a lack of systems, processes and people to adequately manage the business functions
Provide a road map for school districts to follow to save costs in the non-instructional areas of their budgets and operate districts in a more effective manner.
Primary Contact: ADM: Renate Butterfield Phone: 250-387-7097 Cell:
Page 127 EDU-2013-00071 - PHASE 1
S17

MINISTRY OF EDUCATION KEY RESPONSIBILTIES AND OPPORTUNITIES NOTE
STUDENT CERTIFICATION BRANCH 2013
Edited: 6/25/2013 at 5:02:36 PM Page 1 of 3
TOPIC DESCRIPTION: The Student Certification Branch (SCB) is the central education service centre for the education sector and the public, providing information and services about graduation, provincial examinations and assessments, data collections, personal education number, historical transcripts, scholarships, the provincial Student Information System and the BC Training and Education Savings grant. FACTS AND FIGURES:
Provides education services to BC public and independent schools, Offshore Schools, Post-Secondary Institutions, the Yukon and federally funded band schools
Much of the services are provided in electronic format (e-exams and assessments, data collections, transcript transfers to post-secondary institutions) and branch work is highly application dependent.
Service requirements have increased in the past 12 years as a result of changes to the provincial graduation program, growth in offshore schools, and the trend toward a more flexible learning environment that includes continuous enrollment and distributed learning.
Recent new work includes the procurement and implementation of a new student information service, the BC Training and Education Savings Grant, the Pathway to Teacher Education Scholarship, and the inclusion of federally funded band schools in the BC provincial exam and graduation program.
BACKGROUND: The Student Certification Branch is the education service centre for the public and education sector. It comprises several areas of administration:
• It is the public facing first contact for schools, parents and students. It emulates a call centre, service desk environment providing high volume phone and email support.
Page 128 EDU-2013-00071 - PHASE 1
MINISTRY OF EDUCATION KEY RESPONSIBILTIES AND OPPORTUNITIES NOTE
STUDENT CERTIFICATION BRANCH 2013
Edited: 6/25/2013 at 5:02:36 PM Page 2 of 3
• It establishes and oversees ongoing governance and operations related to the provincial Student Information System (BCeSIS) and is currently leading the procurement for a new student information service, planning for school district transition to the new service and establishing the future operational model (see Appendix A ).
• It conducts all of the Ministry’s data collections including class-size and 1701 (which informs funding for districts).
• It is responsible for the assignment of the Personal Education Number (PEN), a nine-digit identifier unique to each student.
• It provides the historical transcript service for students who have graduated or left school and manages the provision of transcript information for students applying to BC post secondary institutions.
• It conducts the Ministry’s exam and assessment programs including the administration and scoring of the graduation program exams, administration of the electronic-Foundations Skills Assessment and the General Education Development Testing Service.
• It administers the graduation programs (2004 and Adult) and certifies the graduation of up to 50,000 students annually.
• It administers the Provincial Awards Program (see Appendix B) and the newly implemented BC Training and Education Savings Program (see Appendix C).
• It produces all administrative materials related to data collections, exam administration, and graduation and includes an annual Handbook of Procedures that provides updated information on policy and processes related to graduation.
SCB’s accountabilities are highly operational in nature; business cycles and short timelines for the post-secondary apllication process causes several spikes throughout the year and staff resourcing can be challenging. Ongoing training is critical as SCB is particularly vulnerable to changes in policy direction in other areas of the ministry and works to keep clear lines of communication to ensure appropriate implementation timelines. Since 2001, SCB has undergone a steady transition toward the implementation of electronic services. This includes the implementation of a robust electronic provincial exam program that has provided the opportunity to implement more exam sessions (seven each year) as well allowing for more flexibility for schools and students. It has also implemented an online transcript request service (TACO) that has streamlined the ordering of transcripts for the public. SCB’s work is supported by a number of legacy systems that are becoming more difficult to support from an IT perspective. SCB has an operating budget of $1.8 million dollars as well as a grant envelope of almost $16 million dollars for the scholarship and awards program.
Page 129 EDU-2013-00071 - PHASE 1
MINISTRY OF EDUCATION KEY RESPONSIBILTIES AND OPPORTUNITIES NOTE
STUDENT CERTIFICATION BRANCH 2013
Edited: 6/25/2013 at 5:02:36 PM Page 3 of 3
OPPORTUNITIES:
The implementation of a new Student Information Service is an opportunity for the Ministry to retire some of its legacy systems and to streamline data collections and graduation processes for districts and schools.
The shift towards personalized learning is allowing the Ministry to review its Provincial Awards Program, offering the prospect of moving from a highly administratively burdensome program with emphasis on academics to more personalized, district-based awards program.
Other opportunities for BCeSIS and the Provincial Awards Program and BCTESP are identified in the aapendices.
Primary Contact: Brenda Neufeld ADM: Renate Butterfield Phone:Cell:
Page 130 EDU-2013-00071 - PHASE 1
S17
S17
MINISTRY OF EDUCATION KEY RESPONSIBILTIES AND OPPORTUNITIES NOTE
LIAISON DIVISION 2013
Edited: 6/25/2013 at 5:02:47 PM Page 1 of 2
TOPIC DESCRIPTION: Overview of the Liaison Division What are the Liaison Division’s ‘single point of contact’ responsibilities for external and internal connections and communications support? The Liaison Division’s work involves building connections and networks among B.C.’s education partners, schools and districts, with a focus on working together to improve student achievement. The Division is responsible for leadership development, partner liaison, stakeholder analysis, team building for learning results, ministry/field connections, and the supply of information internally and externally. It places a strong emphasis on communications that share best practices, and is responsible for bringing field-based information to the deputy minister’s and minister’s offices as well as out to the field, partner groups and the public. Members of the public, parents, school districts and other levels of government often contact the ministry of education in search of information, data, explanations or help understanding an issue or circumstance. The Liaison Division provides a single point of contact and initial response to all such inquiries. While it is not possible for the Liaison Division to directly answer all questions or concerns, we are able to provide an initial discussion or clarification before connecting the individual or group with the most appropriate responder. This can include information on how to navigate through various levels of government or departments to which they may be unfamiliar. Direct communication is maintained with a large variety of education partner groups including: BC Confederation of Parent Advisory Councils (BCCPAC) Student Voice BC Fédération des parents francophones de C.-B. (FPFCB) BC Federation of Labour First Nations Education Steering Committee (FNESC) BC Teachers’ Federation (BCTF) Association of BC Deans of Education (ABCDE) Canadian Union of Public Employees (CUPE) Federation of Independent Schools Association (FISA) BC School Trustees Association (BCSTA) BC Principals and Vice-principals Association (BCPVPA) BC School Superintendents Association (BCSSA) BC Association of School Business Officials (BCASBO) Conseil scolaire francophone de la Colombie-Britannique (CSFBC) All of the above partner groups take part in regular meetings of the Education Advisory Committee (EAC), which is coordinated by the Liaison Division on behalf of the Ministry of Education. Additional meetings are also convened on an issue specific/needs basis. How does the Liaison Division support internal communications? All departments within the Ministry of Education as well as other ministries also often contact the Liaison Division for help with similar requests. The Liaison Division assists the minister’s office; Communications or other departments connect with the appropriate persons in the field or establishes a first point of contact regarding an issue, event or inquiry. The intent is to expedite communication or processes between the ministry and all outside groups or individuals.
Page 131 EDU-2013-00071 - PHASE 1
MINISTRY OF EDUCATION KEY RESPONSIBILTIES AND OPPORTUNITIES NOTE
LIAISON DIVISION 2013
Edited: 6/25/2013 at 5:02:47 PM Page 2 of 2
Mike Roberts is the Superintendent – Liaison and acts as the primary contact for all of the above. In addition to his work facilitating communication and development work between all 60 BC school districts and the Ministry, he has an advisory role in regard to educational and labour relations issues at the Ministry level. He is also the ministry of education/government policy representative at the provincial teacher bargaining table and is the first point of contact for work undertaken by BCPSEA. This includes representing priorities in bargaining, technical reviews of data, costing and union proposals as well as the general input of government on all related policy matters. He attends all bargaining and bargaining preparation meetings throughout the process through to the confirmation of a new collective agreement. There may also be representation at other associated processes such as Labour Relations Board hearings, implementation discussions, arbitrations and internal policy development discussions. In addition, he sits as one of 4 government appointees to the Board of BCPSEA. As a board member, his role is to assist with governance of the employers’ association on behalf of government under the dual authority structure (government and boards of education). Input and decision making in this role includes a wide variety of labour relations and human resource issues dealt with by the employers’ association.
OPPORTUNITIES: - Improving the communications link and working relationship with education partner
groups with an initial focus on the unions and boards of education.
- Expanding direct connections between the Liaison Division and school districts through increased presence at events and discussions especially related to significant initiatives or major decisions.
- Expanding dialogue around the intersection of ministry policy initiatives and the labour relations and human resource challenges facing BC education. This can include new opportunities to share data and integrate decision making.
- Support current initiatives in the areas of trades training, Aboriginal education and literacy through expanded external and internal connections and communications.
Primary Contact: Mike Roberts ADM: Reports directly to the Deputy Minister Phone: 604-660-1483 Cell: Office: 1550 - 555 West Hastings St., Vancouver
Page 132 EDU-2013-00071 - PHASE 1
S17
MINISTRY OF EDUCATION KEY RESPONSIBILTIES AND OPPORTUNITIES NOTE
OFFICE OF THE SUPERINTENDENT OF ACHIEVEMENT 2013
Edited: 6/25/2013 at 5:02:58 PM Page 1 of 2
TOPIC DESCRIPTION: Superintendents of Achievement monitor student achievement in each of 60 school districts in the province. What is the background and purpose of this position? FACTS AND FIGURES:
• Superintendents of Achievement (SOA) are appointed by the Minister of Education under the authority of the School Act by Ministerial Order and report to the Deputy Minister.
• SOAs are senior and experienced educators who have served as teachers, school based administrators and usually school district administrators.
• SOAs have powers of inspection provided under the terms of the School Act, are assigned districts by the minister, may be asked to report on district achievement.
• SOAs monitor district planning, student achievement data, district reporting and district implementation of government initiatives.
• SOAs consider appeals of board of education decisions respecting students and their programs.
BACKGROUND: There are currently three SOAs: Rick Davis, DeDe Derose (focusing on aboriginal education) and Rod Allen (currently inactive in this area). In 2007, the Office of Superintendent of Achievement was brought into force by amendment of the School Act in order to bolster the Ministry’s role in holding school districts accountable for improving student achievement. SOAs endeavour to meet with each school district superintendent and senior staff in each district every year. During these meetings, provincial and local evidence of student achievement are discussed. The superintendent is asked to report out on a variety of programs and initiatives originating with the ministry and the district. Recommendations and suggestions are offered by the SOA, which form the basis of subsequent meetings. At the outset in 2007, Boards of Education objected to the role of SOA on the basis that it introduced a level of oversight that interfered with their autonomy and was an unnecessary layer of bureaucracy. They particularly objected to appeal processes becoming the responsibility of the SOA where previously final decisions had rested with Boards.
Page 133 EDU-2013-00071 - PHASE 1
MINISTRY OF EDUCATION KEY RESPONSIBILTIES AND OPPORTUNITIES NOTE
OFFICE OF THE SUPERINTENDENT OF ACHIEVEMENT 2013
Edited: 6/25/2013 at 5:02:58 PM Page 2 of 2
Since 2007, these concerns have dissipated as Boards and senior staff have come to view SOAs as helpful resources. SOAs have focused on a collaborative approach with the goal of building school district capacity. That said, at times there are direct conversations between SOAs and district superintendents on matters of concern. In addition to wages and benefits, budget for the office of the SOA is quite modest. The main component of budget funds travel, which is extensive given the requirement to travel to meetings in 60 different communities. Primary Contact: Superintendent: Rick Davis Phone: 250-558-8722
Page 134 EDU-2013-00071 - PHASE 1
MINISTRY OF EDUCATION KEY RESPONSIBILTIES AND OPPORTUNITIES NOTE
TEACHER COMMUNICATION 2013
Edited: 6/25/2013 at 5:03:10 PM Page 1 of 2
TOPIC DESCRIPTION: For the first time, in 2012 the Ministry of Education began directly communicating with teachers. How should the ministry sustain and potentially expand this communication to support its goals? BACKGROUND:
Prior to 2012, government did not communicate directly with B.C.’s K-12 public school teachers. Beyond engagement of individual teachers on specific projects such as exam marking and curriculum design, contact with teachers was through the BCTF as per the union’s preference.
With the transition from the former College of Teachers to the new Teacher Regulation Branch (TRB), the ministry gained access to two potential communication channels to reach teachers directly: the TRB’s contact database for all 68,000 teaching certificate holders and the former college’s TC magazine, distributed to all certificate holders three times per year (spring, fall and winter).
In 2012, the TC magazine was rebranded as Learn with a new, broader editorial direction profiling successful educators and current professional issues and trends related to the transformation of education in B.C. With a total circulation of approximately 70,000, the magazine also publishes teacher discipline case decisions.
Learn feature articles have profiled issues such as curriculum transformation, trades and skills training issues, student self-regulation, and early-reading and literacy. Articles focus in providing valuable insight relevant to educators in the context of education transformation, rather than a strong government message.
Since June 2012, the ministry has used the TRB’s contact database to directly email four messages from the Minister of Education to all teaching certificate holders. In each instance, care was taken to ensure the message was of specific relevance and interest to teachers. Approximately 2,000 recipients have voluntarily unsubscribed from this distribution list in response to these four messages.
In the fall of 2012, the ministry was invited by the Association of B.C. Deans of Education to explore opportunities to work more closely with teacher development programs at nine B.C. universities. The ministry has initiated discussion with all nine universities, in part recognizing valuable opportunity these relationships could create to communicate with pre-service student teachers before their graduation and certification.
Page 135 EDU-2013-00071 - PHASE 1

MINISTRY OF EDUCATION KEY RESPONSIBILTIES AND OPPORTUNITIES NOTE
TEACHER COMMUNICATION 2013
Edited: 6/25/2013 at 5:03:10 PM Page 2 of 2
These channels provide a strong foundation for a comprehensive teacher communication strategy to support ministry priorities. That broader teacher communication strategy will be essential to the success of a ministry-led teacher engagement initiative.
Further development of teacher communication should:
Build credibility by continuing to focus on value and relevance for teachers with the goal of promoting awareness of and engagement in education transformation.
Seek to make better, more strategic use of the email distribution channel through closer alignment with a teacher engagement initiative and the transformation of education.
Expand to reach not only current certificate holders but also pre-service teachers currently in the nine teacher development universities.
Explore a dedicated social-media presence targeted at teachers, potentially under the umbrella of the Learn brand.
Any expansion of the teacher communication approach will require either some new dedicated resources or a reprioritization of existing resources to provide adequate support.
OPPORTUNITIES: A more comprehensive teacher communication strategy will be essential to support
the ongoing work of education transformation and specifically the potential for a ministry-led teacher engagement initiative.
Primary Contact: Exec. Director: Rueben Bronee Phone: 250-213-6614 Cell: 250-213-6614
Page 136 EDU-2013-00071 - PHASE 1
MINISTRY OF EDUCATION KEY RESPONSIBILTIES AND OPPORTUNITIES NOTE
TEACHER ENGAGEMENT 2013
Edited: 6/25/2013 at 5:03:22 PM Page 1 of 2
TOPIC DESCRIPTION: There is an emerging understanding of the relationship between teacher engagement and student engagement and achievement. Should the ministry lead a strategy to drive a system-wide adoption of teacher engagement as an important influence in both student success and education transformation? FACTS AND FIGURES:
Research shows teachers account for approximately 30 per cent of the variance in student achievement.
Teacher engagement has a direct influence on teacher performance, which in turn influences student achievement and outcomes.
BACKGROUND:
Employee engagement is a measure of the strength of employees’ job satisfaction and commitment to their work and their employer. Engagement is understood to be driven by factors such as supervisory/executive leadership, empowerment, workload, pay and benefits, recognition and professional development. Building this form of engagement has increasingly become a priority in many leading organizations because research has proven a clear link between improved employee engagement and organizational performance.
In 2011, the ministry began considering how to advance the concept of employee engagement to the K-12 education sector, where it has not yet been applied in any systemic way. This is considered an essential component of improving teacher quality as part of the education transformation led by the ministry.
The proposed approach for education draws on the experience of the BC Public Service, which began a data-driven focus on employee engagement in 2005 under the umbrella of its Corporate Human Resource Plan and saw significant improvement in engagement as measured by its annual Work Environment Survey (WES).
In the BC Public Service context, improved employee engagement was found to lead to improved employee performance, which in turns leads to improved service outcomes and improved citizen satisfaction. Applying that same model to education, improved teacher engagement can be expected to lead to improved student engagement and achievement, and in turn to improved student/parent/citizen satisfaction.
Page 137 EDU-2013-00071 - PHASE 1
MINISTRY OF EDUCATION KEY RESPONSIBILTIES AND OPPORTUNITIES NOTE
TEACHER ENGAGEMENT 2013
Edited: 6/25/2013 at 5:03:22 PM Page 2 of 2
Accepting that linkage, not acting on teacher engagement is an impediment to student achievement.
There are complicating factors that make applying an employee engagement model to teachers more challenging than in the public service, including:
Government is not the employer and so engagement needs to be pursued in partnership with districts.
The prevailing and historical relationship between government and the BCTF has created a climate of deep mistrust and conflict.
Many teachers do not consider themselves “employees” in a traditional sense and there is no systemic culture around engagement aspects such as performance management.
Reflecting the co-governance model, in the summer of 2012 the ministry and BCPSEA began planning to introduce a teacher engagement focus in the public K-12 system under a sector human resource strategy. This sector HR strategy concept and its engagement focus received a favourable response when proposed by the Deputy Minister of Education at the BCSSA Summer Leadership Academy in August 2012.
OPPORTUNITIES:
Primary Contact: Exec. Director: Rueben Bronee Phone: 250-213-6614 Cell: 250-213-6614
Page 138 EDU-2013-00071 - PHASE 1
S13
S13
MINISTRY OF EDUCATION KEY RESPONSIBILTIES AND OPPORTUNITIES NOTE
TEACHER REGULATION 2013
Edited: 6/25/2013 at 5:03:34 PM Page 1 of 3
TOPIC DESCRIPTION: The Teachers Act replaces the former Teaching Profession Act, and creates a new regulatory model for K-12 educators (certificate holders) in both the public and independent school systems in the province. FACTS AND FIGURES:
The Teachers Act (Act) came into force on January 9, 2012, replacing the former Teaching Profession Act (1996) and dissolving the former BC College of Teachers.
The new regulatory model is based on two guiding principles: public interest and transparency and is intended to raise the stature of the teaching profession, increase public confidence and better protect children.
There are approximately 68,000 certificate holders in B.C., including teachers and administrators in both the public and independent school systems.
BACKGROUND:
The former BC College of Teachers was established in the 1980’s as a self-regulating, body for the teaching profession.
From the beginning, the College had difficulties fulfilling its mandate in part because of the opposition of the British Columbia Teachers’ Federation (BCTF).
Based on continuing concerns about the functioning of the College and its ability to ensure student safety, the former Minister of Education appointed lawyer and former Deputy Minister of Education Don Avison in 2010 as a fact finder to gather information and make recommendations.
Based on the findings and recommendations in the Avison Report, considerable consultation with stakeholders occurred in 2011, followed by introduction of the Teachers Act in November 2011.
While stakeholders were supportive of the changes made to the regulation of teachers the BCTF was not. The BCTF is of the view that teacher representatives should be in the majority on disciplinary matters (law requires that they be in the minority).
Page 139 EDU-2013-00071 - PHASE 1
MINISTRY OF EDUCATION KEY RESPONSIBILTIES AND OPPORTUNITIES NOTE
TEACHER REGULATION 2013
Edited: 6/25/2013 at 5:03:34 PM Page 2 of 3
There are six distinct bodies who now share responsibility for the regulation of K-12 educators in both the public and independent schools in the province:
BC Teachers’ Council (BCTC) The BCTC establishes standards for the conduct, competence and education of certificate holders and approves teacher education programs with respect to the certification standards.
Independent Teaching Certification Standards Committee (ISTCSC) The ISTCSC is composed of current or former independent school educators, appointed by the Minister of Education under section 5 of the Independent School Act. The ISTCSC establishes standards for receiving and maintaining an independent school teaching certificate and at the request of the Inspector of Independent Schools or the Director of Certification, provides advice about independent school teaching certification applications or letters of permission. Disciplinary and Professional Conduct Board The Disciplinary and Professional Conduct Board (DPCB) is comprised of nine members from the BCTC. The role of DPCB members is to be available to sit on hearing panels for discipline and professional conduct matters. The Commissioner may choose panel members from the DPCB as well as from a pool of ad hoc hearing panel members drawn from the public. Teacher Regulation Branch The Branch, within the Governance, Legislation, and Regulation Division of the Ministry, is responsible for providing administrative support to the BCTC, the Commissioner, the DPCB, as well as operational responsibilities for certification; and support to the Commissioner in operationalizing disciplinary and professional conduct matters. Director of Certification The Director of Certification is responsible for overseeing the certification processes and determining fitness of applicants for certification. In addition, the Director is responsible for maintaining the public registry of all certificate holders and those with Letters of Permission, which identifies certification status for all certificate holders, including discipline history. Commissioner for Teacher Regulation The Commissioner is an independent decision maker, appointed under the Teachers Act, to oversee all discipline processes and consider certification appeals. Former B.C. Superior Court Judge, Bruce Preston was appointed by the Cabinet as the Commissioner for Teacher Regulation in November 2012 on the recommendation of the Minister of Education for a term of five years.
Page 140 EDU-2013-00071 - PHASE 1
MINISTRY OF EDUCATION KEY RESPONSIBILTIES AND OPPORTUNITIES NOTE
TEACHER REGULATION 2013
Edited: 6/25/2013 at 5:03:34 PM Page 3 of 3
OPPORTUNITIES:
Primary Contact: ADM: Claire Avison Phone: 250-356-6760 Cell:
Page 141 EDU-2013-00071 - PHASE 1
S13
S17

MINISTRY OF EDUCATION KEY RESPONSIBILTIES AND OPPORTUNITIES NOTE
TEN YEAR FRAMEWORK 2013
Edited: 6/25/2013 at 5:03:45 PM Page 1 of 3
TOPIC DESCRIPTION: After consultation with education stakeholders in the Fall 2012 for the purpose of reviewing teacher bargaining structures and processes, government released its “Framework for Long Term Stability in Education: Toward a 10-Year Agreement with Public School Teachers” for implementation post-election.
FACTS AND FIGURES:
There are approximately 42,000 public school unionized teachers represented by the BC Teachers Federation (BCTF). The teachers’ collective agreement expires June 30, 2013.
The current two-year collective agreement was negotiated in 2011 after 78 bargaining sessions, a year-long strike (non-classroom activities), a legislated “cooling off” period, and 16 mediation sessions.
Annual compensation costs for teachers in the K-12 sector is approximately $2.9 billion.
BACKGROUND:
BC Public Schools Employers’ Association (BCPSEA) is the accredited bargaining agent for both teacher and support staff bargaining. BCPSEA negotiates directly with the BCTF on provincial items, primarily monetary matters, as outlined by the Public Education Labour Relations Act. BCPSEA delegates local teacher bargaining to Boards of Education.
This round of bargaining between the BCTF and BCPSEA began in February pursuant to the Agreement in Committee (AIC) process for this round of bargaining.
Negotiations are scheduled to continue until June 30th with the assistance of a facilitator. Should an agreement not be reached by June 30th, the facilitator will issue a report to the parties outlining the outstanding issues and the position of the parties on these issues, matters resolved at the table, and suggested processes for continued negotiations.
In October, 2012, government announced it would consult with education stakeholders to review teacher bargaining.
Page 142 EDU-2013-00071 - PHASE 1
MINISTRY OF EDUCATION KEY RESPONSIBILTIES AND OPPORTUNITIES NOTE
TEN YEAR FRAMEWORK 2013
Edited: 6/25/2013 at 5:03:45 PM Page 2 of 3
In January, 2013 government released the “Framework for Long Term Stability in Education: Toward a 10-Year Agreement with Public School Teachers” (Framework). The Framework proposes both substantive changes to the collective agreement and structural changes to the bargaining process with the BCTF:
− Priority Education Investment Fund (PEIF) to address education priorities; the PEIF would be outside of the collective agreement. Government committed $100M to this fund in the third year of a ten-year agreement;
− Education Policy Council made up of representatives from government, the BCTF, and boards of education to advise government on education priorities, including allocation of the PEIF;
− Indexing of teachers’ compensation to an average of other major BC public sector increases;
− A new structured and transparent bargaining process, including direct negotiation of compensation between government and the BCTF, and conciliation and mediation dispute resolution mechanisms.
The intent of the Framework is to create long-term stability for students, families as well as the education system as a whole and to improve how government interacts and works with the BCTF to help reduce stress and disruption during and outside of contract negotiations.
OPPORTUNITIES: An opportunity exists to combine the AIC process with pursuing a ten-year deal with
the BCTF and implementing process and structural changes as outlined in the Framework through concurrent negotiation and consultation with the BCTF.
Primary Contact: ADM: Claire Avison Phone: 250-356-6760 Cell:
Appendix A – next page
Page 143 EDU-2013-00071 - PHASE 1
S17
MINISTRY OF EDUCATION KEY RESPONSIBILTIES AND OPPORTUNITIES NOTE
TEN YEAR FRAMEWORK 2013
Edited: 6/25/2013 at 5:03:45 PM Page 3 of 3
APPENDIX A
Framework Timelines (specific to 2013 to reflect the election period)
On June 15, if an agreement has not been reached the Minister of Labour will appoint a
special mediator to work with the parties. If an agreement has not been reached by June 30, the mediator will report out publicly on
the issues in dispute and the cost implications of each of the parties’ positions. If there is no agreement by July 15, the mediator will issue recommendations for
settlement. If neither party rejects the mediator’s recommendations by July 25, they become the
basis for the new collective agreement. If government rejects the mediator’s recommendations, it must provide an alternative
offer for settlement by August 7. If the BCTF rejects the mediator’s recommendations or government’s alternative offer,
they must issue strike notice by August 31. If they do not, then the mediator’s recommendations or government’s alternative offer will be deemed to be accepted and form the new collective agreement.
Schools will not open at the start of the school year if strike notice is issued, unless the BCTF agrees not to disrupt school operations until a settlement is reached.
Page 144 EDU-2013-00071 - PHASE 1
MINISTRY OF EDUCATION KEY RESPONSIBILTIES AND OPPORTUNITIES NOTE
TRADES 2013
Page 1 of 1
Topic Description: Trades Training Initiatives – Status Update Background:
• The Ministry, in partnership with the Industry Training Authority, offers two dual-credit trades programs: 1. Secondary School Apprenticeship (SSA) – on the job training 2. Accelerated Credit Enrolment in Industry Training (ACE IT) – formal in-class
instruction • The BC Skills and Training Plan and the Jobs Plan both mention the importance of
attracting youth to trades careers • Empower Aboriginal students and organizations to enter programs and partnerships that
will enable them to participate in opportunities in the trades and technology sector • The Skills and Training Plan in 2012 committed to increasing the number of youth entering
into trades and skills programs by 50% over 3 years • In response to these targets, the Ministry is working on a number of initiatives:
Trades Finder - The Ministry has created a province-wide tool that allows students to research trades training opportunities available at high schools.
Trades Sampler - The Ministry is currently working on the creation of a Ministry Authorized course intended to offer a range of legitimate trades experiences for youth, prior to enrolling in ACE IT, SSA, or related Applied Skill
Profile - As part of the Personalized Learning transformation, the Ministry intends to enhance vocational training (i.e., trades) in the next graduation program
Pathways - The Ministry is developing formalized, articulated pathways to graduation for trades and other vocations, including ICT
Workforce Capacity – The Ministry is looking at increasing training capacity in the system by training more Journeyman/Certified Teachers
• The Ministry has modified the rules for the District Authority Awards to include trades training as an area of distinction
• The Ministry has appointed a “Superintendent of Trades and Transitions “ who will visit school districts to inspire conversations, facilitate the sharing of successful practice, and encourage the partnerships of districts with their municipalities, industry and Post-Secondary Institutions
• The ITA has begun a process to renew its youth training strategies and programs, including SSA and ACE IT. The Ministry of Education will work closely with the ITA on this renewal in order to ensure continuing, relevant trades training opportunities for secondary school students
Primary Contact: Tim WinkelmansADM: Rod Allen Cell: 250-213-3000
Page 145 EDU-2013-00071 - PHASE 1
MINISTRY OF EDUCATION KEY RESPONSIBILTIES AND OPPORTUNITIES NOTE
BILL 22 LITIGATION 2013
Edited: 6/25/2013 at 5:04:09 PM Page 1 of 2
TOPIC DESCRIPTION:
The British Columbia Teachers Federation is challenging the constitutionality of the Education Improvement Act (Bill 22), the Province’s legislative response to the BC Supreme Court decision that struck down several provisions of Bill 28 as violating of the Charter right to freedom of association.
BACKGROUND:
In 2002, the Public Education Flexibility and Choice Act (Bill 28) removed provisions governing class size and composition and staffing ratios from teacher collective agreements and moved class size limits into the School Act. In addition, Bill 28 removed class size, composition, and staffing ratios from the scope of bargaining.
The BCTF launched a constitutional challenge to Bill 28, which was held in abeyance pending the conclusion to similar litigation in the health sector (the Hospital Employees’ Union challenge to Bill 29). The trial proceeded after the Supreme Court of Canada found in favour of the Hospital Employees’ Union, and in April 2011, the BC Supreme Court struck down several Bill 28 provisions as infringing the Charter right to freedom of association. The decision was suspended for one year to give government time to address the repercussions of the decison.
Government initiated consultations with the BCTF on how to address the
repercussions of the decision, but no agreement was reached by the end of 2011. In the absence of agreement, Bill 22 was intended to correct the unconstitutional provisions of Bill 28 before the court decision took effect in April 2012.
Bill 22 returned class size and composition to the scope of bargaining, but did not
restore the pre-2002 collective agreement provisions governing class size and composition. Bill 22 also established the Learning Improvement Fund, which provides new resources to districts to assist in addressing complex class composition issues.
Page 146 EDU-2013-00071 - PHASE 1
S13, S14
MINISTRY OF EDUCATION KEY RESPONSIBILTIES AND OPPORTUNITIES NOTE
BILL 22 LITIGATION 2013
Edited: 6/25/2013 at 5:04:09 PM Page 2 of 2
Examinations for discovery were held in February 2013 and a trial date is set for September 2013. The hearing on damages in the Bill 28 decision will be take place at the same time as the Bill 22 trial and is scheduled to be heard by the same judge.
OPPORTUNITIES: None identified.
Primary Contact: ADM: Claire Avison Phone: 250-356-6760 Cell:
Page 147 EDU-2013-00071 - PHASE 1
S17
S13, S14

MINISTRY OF EDUCATION KEY RESPONSIBILTIES AND OPPORTUNITIES NOTE
CONSEIL SCOLAIRE FRANCOPHONE LAWSUIT 2013
Edited: 6/25/2013 at 5:04:22 PM Page 1 of 3
TOPIC DESCRIPTION:
The Ministry of Education is currently defending two separate legal proceedings alleging violations of section 23 Charter rights to minority language education.
BACKGROUND: Section 23 of the Canadian Charter of Rights and Freedoms gives Canadian citizens
who reside in a province in which they are members of the English or French linguistic minority the right, where numbers warrant, to publicly funded minority language education for their children.
In BC, the Conseil scolaire francophone de la Colombie-Britannique (CSF) provides K-12 francophone education to children of section 23 rights holders. The CSF is similar to a board of education, but its trustees are elected by its members (primarily section 23 rights holders) and it operates across the province.
The Rose-des-Vents Parents’ Association Petition
The first proceeding is a petition filed by the Parents’ Association for Rose-des-Vents Elementary school against both the CSF and the Ministry of Education. It alleges that provincial funding levels for both transportation and new school facilities in relation to Rose-des-Vents violate section 23 of the Charter.
The Parents’ Association was successful at the first stage of the petition; the Court declared that the parents were not being provided with the facilities guaranteed to them under section 23 of the Charter. The Province has appealed this decision and the appeal is scheduled for mid-July 2013.
In early May 2013, the court heard an application by the Parents’ Association and the CSF seeking special costs.
The Court’s decision is under reserve.
In the first week of June 2013, the Court heard two applications in the Petition. The Parents’ Association applied for interim relief for the fall of 2013 and the Province applied for a stay of any further steps in the Petition until the appeal is decided. The decision on these applications will be issued June 17.
The CSF action
The second proceeding is an action filed by the CSF and several parents alleging that the Province’s system for funding capital projects and transportation violates section 23 of the Charter. In addition to a declaration that the CSF is entitled to a capital funding system that recognizes its specific capital needs, the CSF is seeking an order
Page 148 EDU-2013-00071 - PHASE 1
S13
S13
MINISTRY OF EDUCATION KEY RESPONSIBILTIES AND OPPORTUNITIES NOTE
CONSEIL SCOLAIRE FRANCOPHONE LAWSUIT 2013
Edited: 6/25/2013 at 5:04:22 PM Page 2 of 3
that the Province fund specific school projects and provide increased operational funding. The CSF also challenges certain sections of the School Act and Treasury Board’s Capital Asset Management Framework.
In the first week of June 2013, the court heard the CSF’s application for extensive interim and injunctive relief including: that the CSF be provided a school building in Vancouver for September 2013 with government paying all associated costs; that government be prevented from taking any action with respect to two other crown properties in Vancouver that would preclude the CSF’s ability to build a school on those properties; and that government pay the CSF’s legal costs. The decision on this application will be issued June 17.
The trial is currently scheduled for five months beginning on October 7, 2013. However, the trial may be postponed as the previously presiding judge has recently been appointed to the Court of Appeal, and a new judge has been assigned.
OPPORTUNITIES:
Page 149 EDU-2013-00071 - PHASE 1
S13, S17
S13, S17
S14
S13
MINISTRY OF EDUCATION KEY RESPONSIBILTIES AND OPPORTUNITIES NOTE
CONSEIL SCOLAIRE FRANCOPHONE LAWSUIT 2013
Edited: 6/25/2013 at 5:04:22 PM Page 3 of 3
Primary Contact: ADM: Claire Avison Phone: 250-356-6760 Cell:
Page 150 EDU-2013-00071 - PHASE 1
S17
S13
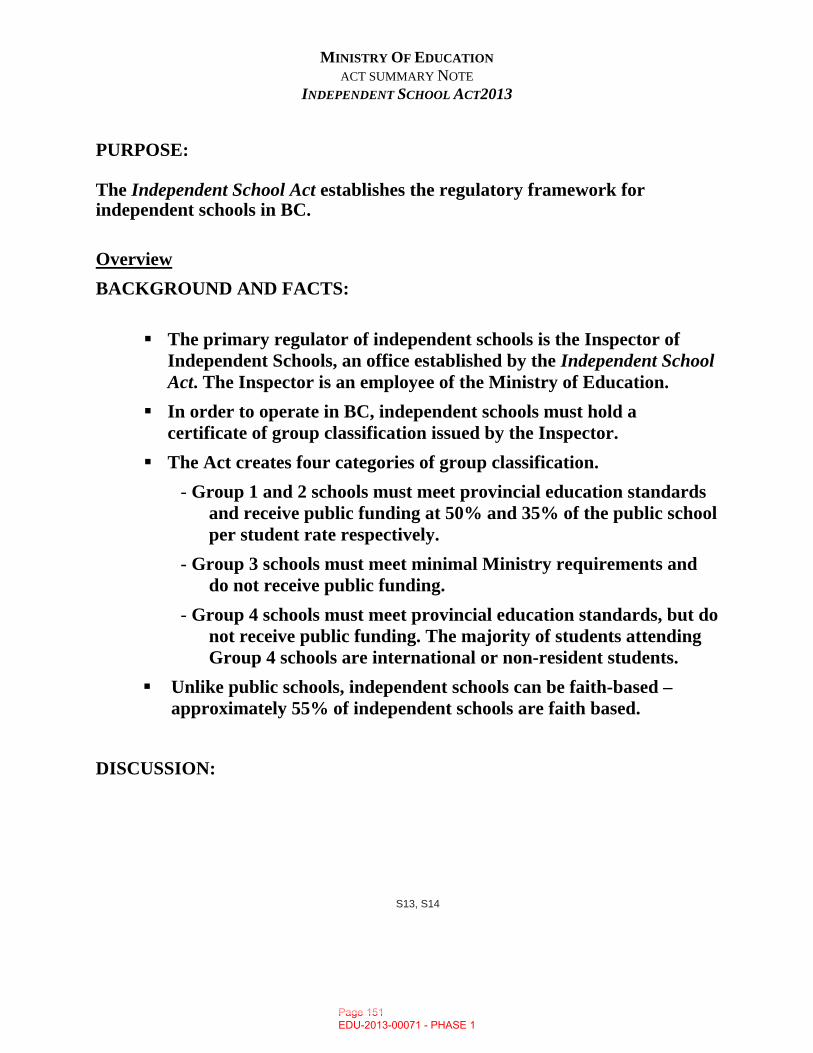
MINISTRY OF EDUCATION ACT SUMMARY NOTE
INDEPENDENT SCHOOL ACT2013
PURPOSE: The Independent School Act establishes the regulatory framework for independent schools in BC.
Overview BACKGROUND AND FACTS:
The primary regulator of independent schools is the Inspector of
Independent Schools, an office established by the Independent School Act. The Inspector is an employee of the Ministry of Education.
In order to operate in BC, independent schools must hold a certificate of group classification issued by the Inspector.
The Act creates four categories of group classification. - Group 1 and 2 schools must meet provincial education standards
and receive public funding at 50% and 35% of the public school per student rate respectively.
- Group 3 schools must meet minimal Ministry requirements and do not receive public funding.
- Group 4 schools must meet provincial education standards, but do not receive public funding. The majority of students attending Group 4 schools are international or non-resident students.
Unlike public schools, independent schools can be faith-based – approximately 55% of independent schools are faith based.
DISCUSSION:
Page 151 EDU-2013-00071 - PHASE 1
S13, S14
MINISTRY OF EDUCATION ACT SUMMARY NOTE
INDEPENDENT SCHOOL ACT2013
Edited: 6/25/2013 at 5:04:46 PM Page 2 of 2
Primary Contact: Prepared by: ADM: Claire Avison Name: Karen Loughran Phone: (250) 356-6760 Phone: (250) 896-1701 Cell: Cell: (250) 896-1701
Page 152 EDU-2013-00071 - PHASE 1
S13, S14
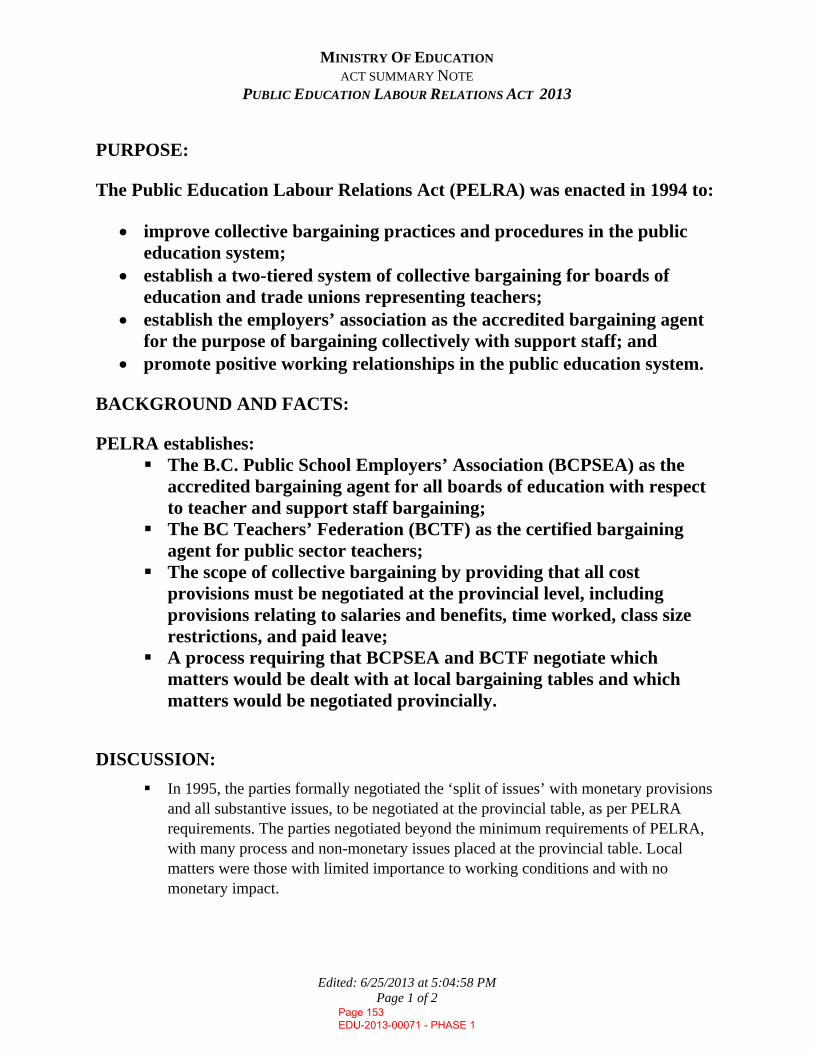
MINISTRY OF EDUCATION ACT SUMMARY NOTE
PUBLIC EDUCATION LABOUR RELATIONS ACT 2013
Edited: 6/25/2013 at 5:04:58 PM Page 1 of 2
PURPOSE:
The Public Education Labour Relations Act (PELRA) was enacted in 1994 to:
• improve collective bargaining practices and procedures in the public education system;
• establish a two-tiered system of collective bargaining for boards of education and trade unions representing teachers;
• establish the employers’ association as the accredited bargaining agent for the purpose of bargaining collectively with support staff; and
• promote positive working relationships in the public education system.
BACKGROUND AND FACTS: PELRA establishes:
The B.C. Public School Employers’ Association (BCPSEA) as the accredited bargaining agent for all boards of education with respect to teacher and support staff bargaining;
The BC Teachers’ Federation (BCTF) as the certified bargaining agent for public sector teachers;
The scope of collective bargaining by providing that all cost provisions must be negotiated at the provincial level, including provisions relating to salaries and benefits, time worked, class size restrictions, and paid leave;
A process requiring that BCPSEA and BCTF negotiate which matters would be dealt with at local bargaining tables and which matters would be negotiated provincially.
DISCUSSION: In 1995, the parties formally negotiated the ‘split of issues’ with monetary provisions
and all substantive issues, to be negotiated at the provincial table, as per PELRA requirements. The parties negotiated beyond the minimum requirements of PELRA, with many process and non-monetary issues placed at the provincial table. Local matters were those with limited importance to working conditions and with no monetary impact.
Page 153 EDU-2013-00071 - PHASE 1
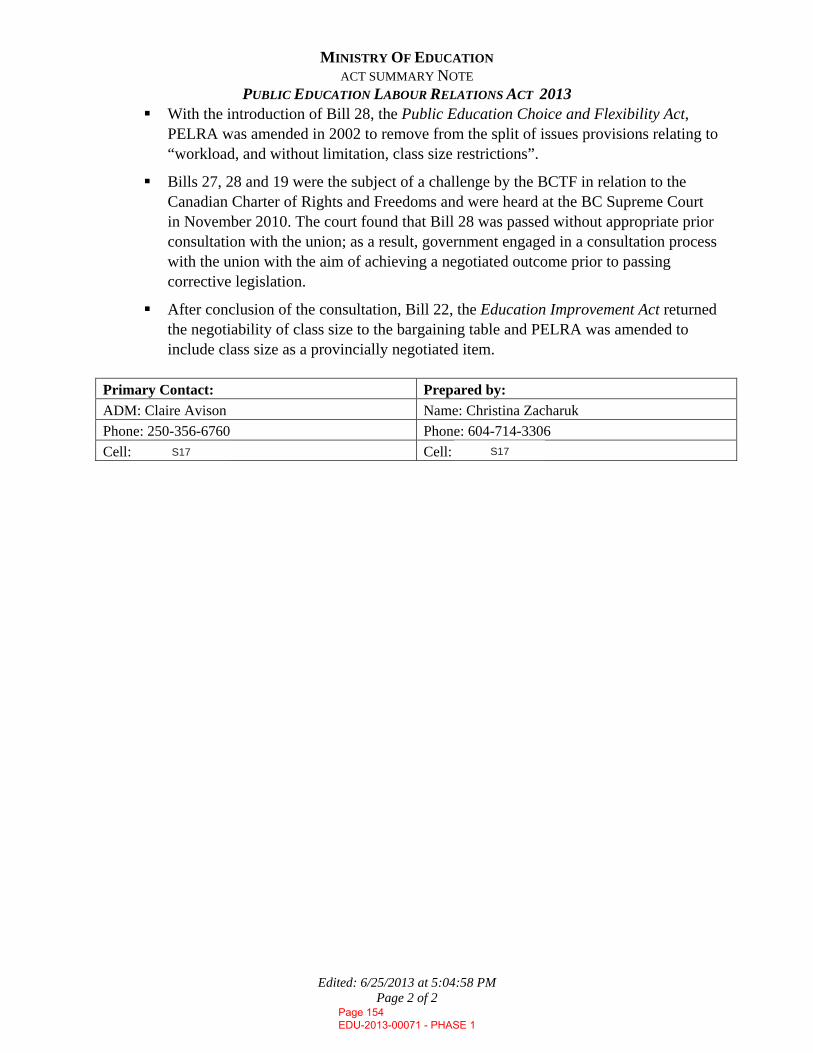
MINISTRY OF EDUCATION ACT SUMMARY NOTE
PUBLIC EDUCATION LABOUR RELATIONS ACT 2013
Edited: 6/25/2013 at 5:04:58 PM Page 2 of 2
With the introduction of Bill 28, the Public Education Choice and Flexibility Act, PELRA was amended in 2002 to remove from the split of issues provisions relating to “workload, and without limitation, class size restrictions”.
Bills 27, 28 and 19 were the subject of a challenge by the BCTF in relation to the Canadian Charter of Rights and Freedoms and were heard at the BC Supreme Court in November 2010. The court found that Bill 28 was passed without appropriate prior consultation with the union; as a result, government engaged in a consultation process with the union with the aim of achieving a negotiated outcome prior to passing corrective legislation.
After conclusion of the consultation, Bill 22, the Education Improvement Act returned the negotiability of class size to the bargaining table and PELRA was amended to include class size as a provincially negotiated item.
Primary Contact: Prepared by: ADM: Claire Avison Name: Christina Zacharuk Phone: 250-356-6760 Phone: 604-714-3306 Cell: Cell:
Page 154 EDU-2013-00071 - PHASE 1
S17 S17
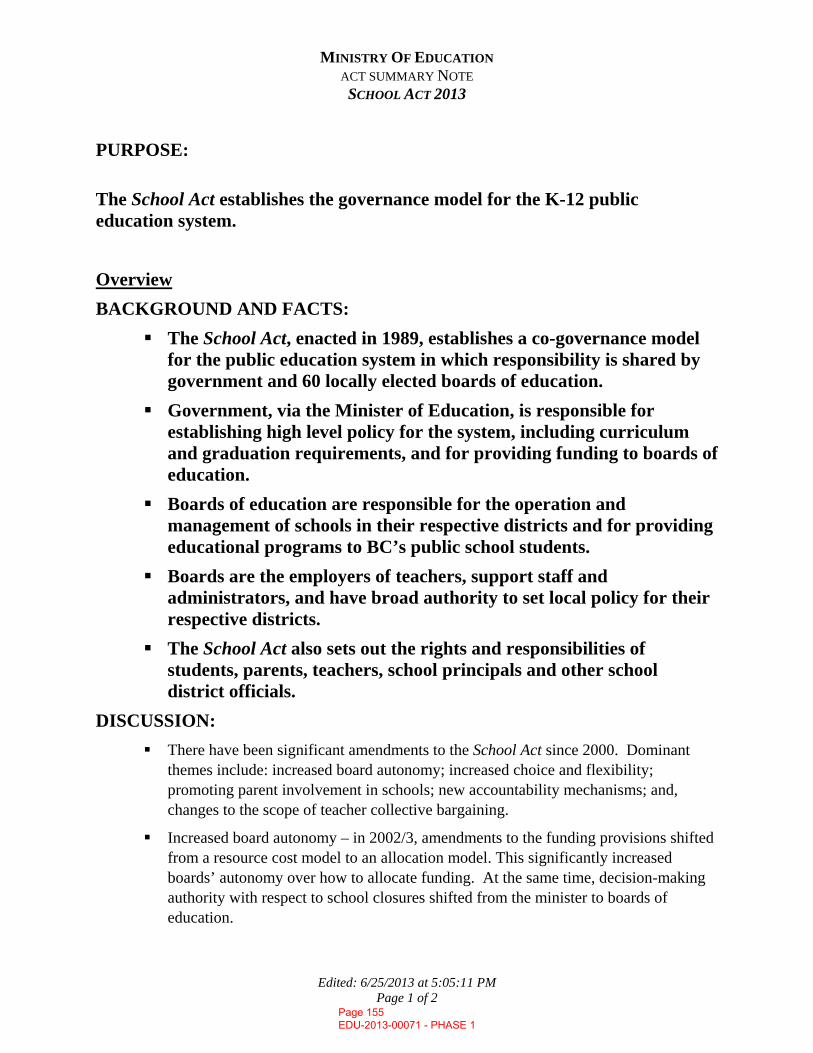
MINISTRY OF EDUCATION ACT SUMMARY NOTE
SCHOOL ACT 2013
Edited: 6/25/2013 at 5:05:11 PM Page 1 of 2
PURPOSE:
The School Act establishes the governance model for the K-12 public education system. Overview BACKGROUND AND FACTS:
The School Act, enacted in 1989, establishes a co-governance model for the public education system in which responsibility is shared by government and 60 locally elected boards of education.
Government, via the Minister of Education, is responsible for establishing high level policy for the system, including curriculum and graduation requirements, and for providing funding to boards of education.
Boards of education are responsible for the operation and management of schools in their respective districts and for providing educational programs to BC’s public school students.
Boards are the employers of teachers, support staff and administrators, and have broad authority to set local policy for their respective districts.
The School Act also sets out the rights and responsibilities of students, parents, teachers, school principals and other school district officials.
DISCUSSION: There have been significant amendments to the School Act since 2000. Dominant
themes include: increased board autonomy; increased choice and flexibility; promoting parent involvement in schools; new accountability mechanisms; and, changes to the scope of teacher collective bargaining.
Increased board autonomy – in 2002/3, amendments to the funding provisions shifted from a resource cost model to an allocation model. This significantly increased boards’ autonomy over how to allocate funding. At the same time, decision-making authority with respect to school closures shifted from the minister to boards of education.
Page 155 EDU-2013-00071 - PHASE 1
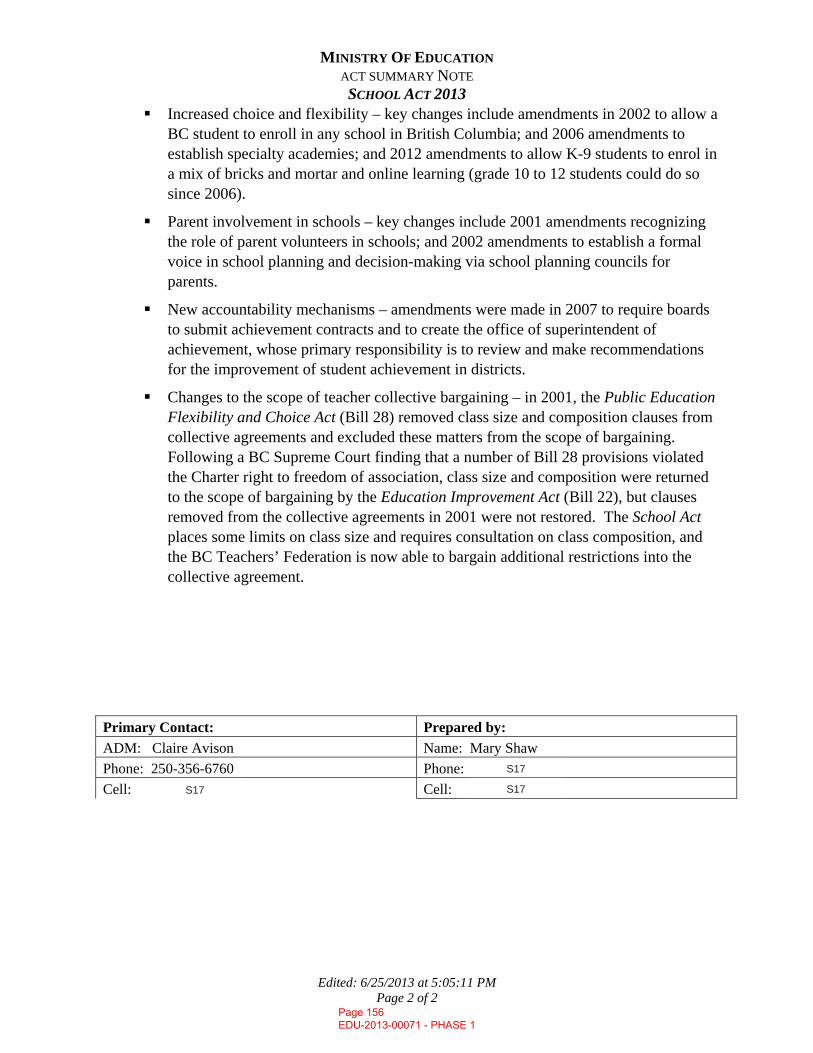
MINISTRY OF EDUCATION ACT SUMMARY NOTE
SCHOOL ACT 2013
Edited: 6/25/2013 at 5:05:11 PM Page 2 of 2
Increased choice and flexibility – key changes include amendments in 2002 to allow a BC student to enroll in any school in British Columbia; and 2006 amendments to establish specialty academies; and 2012 amendments to allow K-9 students to enrol in a mix of bricks and mortar and online learning (grade 10 to 12 students could do so since 2006).
Parent involvement in schools – key changes include 2001 amendments recognizing the role of parent volunteers in schools; and 2002 amendments to establish a formal voice in school planning and decision-making via school planning councils for parents.
New accountability mechanisms – amendments were made in 2007 to require boards to submit achievement contracts and to create the office of superintendent of achievement, whose primary responsibility is to review and make recommendations for the improvement of student achievement in districts.
Changes to the scope of teacher collective bargaining – in 2001, the Public Education Flexibility and Choice Act (Bill 28) removed class size and composition clauses from collective agreements and excluded these matters from the scope of bargaining. Following a BC Supreme Court finding that a number of Bill 28 provisions violated the Charter right to freedom of association, class size and composition were returned to the scope of bargaining by the Education Improvement Act (Bill 22), but clauses removed from the collective agreements in 2001 were not restored. The School Act places some limits on class size and requires consultation on class composition, and the BC Teachers’ Federation is now able to bargain additional restrictions into the collective agreement.
Primary Contact: Prepared by: ADM: Claire Avison Name: Mary Shaw Phone: 250-356-6760 Phone:Cell: Cell:
Page 156 EDU-2013-00071 - PHASE 1
S17
S17
S17
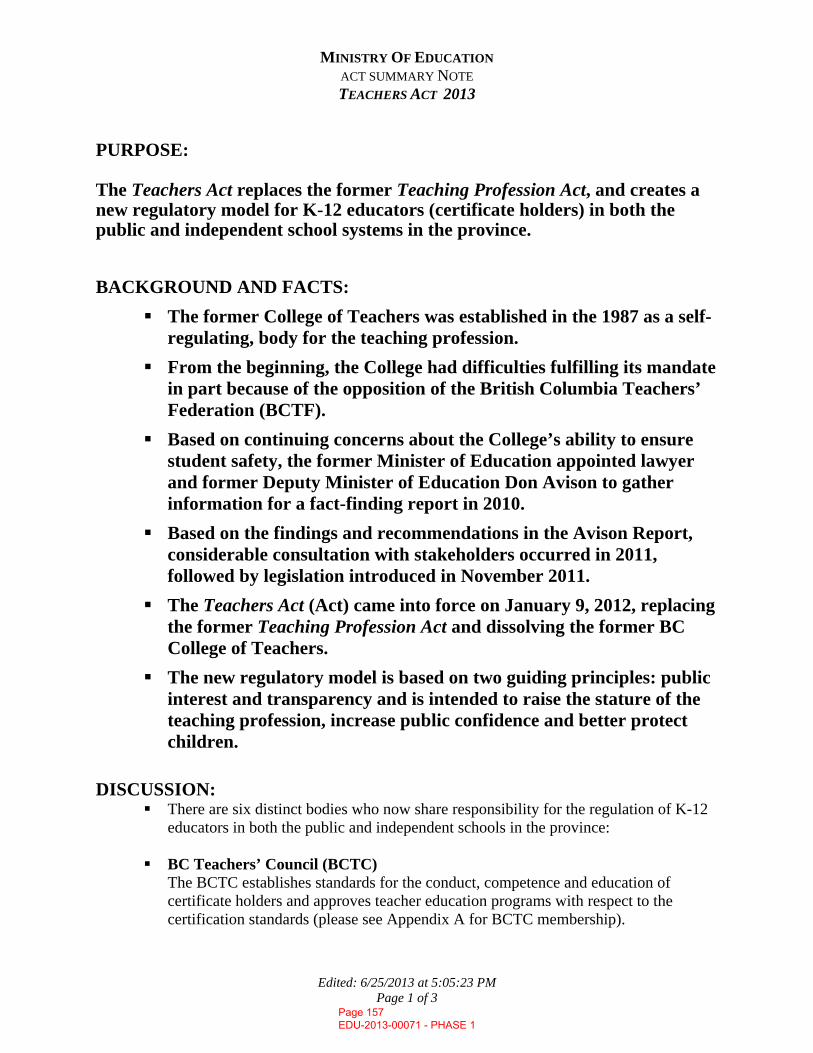
MINISTRY OF EDUCATION ACT SUMMARY NOTE
TEACHERS ACT 2013
Edited: 6/25/2013 at 5:05:23 PM Page 1 of 3
PURPOSE: The Teachers Act replaces the former Teaching Profession Act, and creates a new regulatory model for K-12 educators (certificate holders) in both the public and independent school systems in the province.
BACKGROUND AND FACTS:
The former College of Teachers was established in the 1987 as a self-regulating, body for the teaching profession.
From the beginning, the College had difficulties fulfilling its mandate in part because of the opposition of the British Columbia Teachers’ Federation (BCTF).
Based on continuing concerns about the College’s ability to ensure student safety, the former Minister of Education appointed lawyer and former Deputy Minister of Education Don Avison to gather information for a fact-finding report in 2010.
Based on the findings and recommendations in the Avison Report, considerable consultation with stakeholders occurred in 2011, followed by legislation introduced in November 2011.
The Teachers Act (Act) came into force on January 9, 2012, replacing the former Teaching Profession Act and dissolving the former BC College of Teachers.
The new regulatory model is based on two guiding principles: public interest and transparency and is intended to raise the stature of the teaching profession, increase public confidence and better protect children.
DISCUSSION: There are six distinct bodies who now share responsibility for the regulation of K-12
educators in both the public and independent schools in the province:
BC Teachers’ Council (BCTC) The BCTC establishes standards for the conduct, competence and education of certificate holders and approves teacher education programs with respect to the certification standards (please see Appendix A for BCTC membership).
Page 157 EDU-2013-00071 - PHASE 1
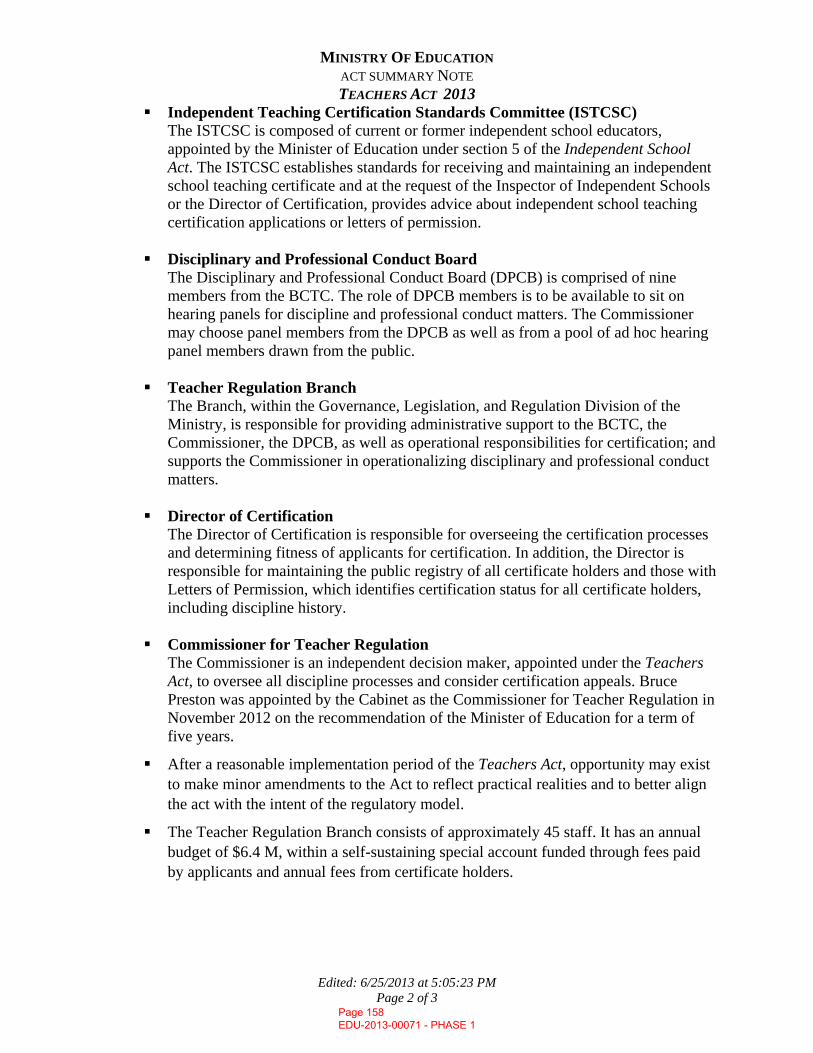
MINISTRY OF EDUCATION ACT SUMMARY NOTE
TEACHERS ACT 2013
Edited: 6/25/2013 at 5:05:23 PM Page 2 of 3
Independent Teaching Certification Standards Committee (ISTCSC) The ISTCSC is composed of current or former independent school educators, appointed by the Minister of Education under section 5 of the Independent School Act. The ISTCSC establishes standards for receiving and maintaining an independent school teaching certificate and at the request of the Inspector of Independent Schools or the Director of Certification, provides advice about independent school teaching certification applications or letters of permission.
Disciplinary and Professional Conduct Board The Disciplinary and Professional Conduct Board (DPCB) is comprised of nine members from the BCTC. The role of DPCB members is to be available to sit on hearing panels for discipline and professional conduct matters. The Commissioner may choose panel members from the DPCB as well as from a pool of ad hoc hearing panel members drawn from the public.
Teacher Regulation Branch The Branch, within the Governance, Legislation, and Regulation Division of the Ministry, is responsible for providing administrative support to the BCTC, the Commissioner, the DPCB, as well as operational responsibilities for certification; and supports the Commissioner in operationalizing disciplinary and professional conduct matters.
Director of Certification The Director of Certification is responsible for overseeing the certification processes and determining fitness of applicants for certification. In addition, the Director is responsible for maintaining the public registry of all certificate holders and those with Letters of Permission, which identifies certification status for all certificate holders, including discipline history.
Commissioner for Teacher Regulation The Commissioner is an independent decision maker, appointed under the Teachers Act, to oversee all discipline processes and consider certification appeals. Bruce Preston was appointed by the Cabinet as the Commissioner for Teacher Regulation in November 2012 on the recommendation of the Minister of Education for a term of five years.
After a reasonable implementation period of the Teachers Act, opportunity may exist to make minor amendments to the Act to reflect practical realities and to better align the act with the intent of the regulatory model.
The Teacher Regulation Branch consists of approximately 45 staff. It has an annual budget of $6.4 M, within a self-sustaining special account funded through fees paid by applicants and annual fees from certificate holders.
Page 158 EDU-2013-00071 - PHASE 1
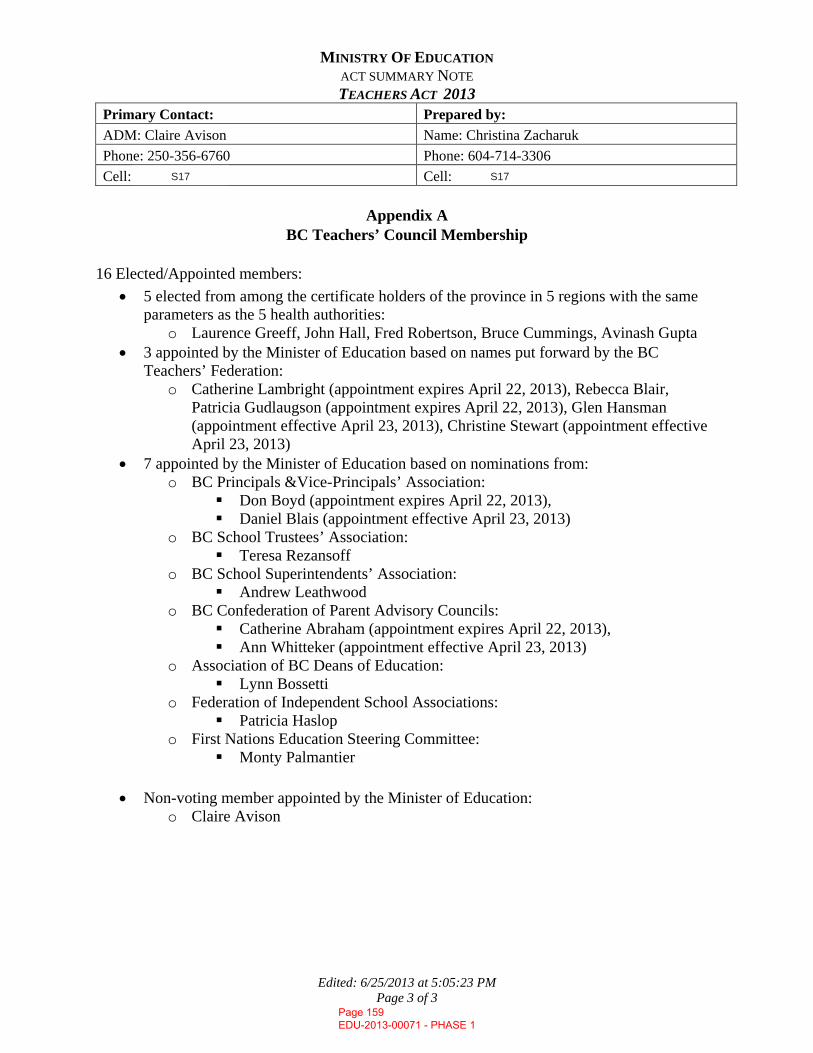
MINISTRY OF EDUCATION ACT SUMMARY NOTE
TEACHERS ACT 2013
Edited: 6/25/2013 at 5:05:23 PM Page 3 of 3
Primary Contact: Prepared by: ADM: Claire Avison Name: Christina Zacharuk Phone: 250-356-6760 Phone: 604-714-3306 Cell: Cell:
Appendix A
BC Teachers’ Council Membership
16 Elected/Appointed members: • 5 elected from among the certificate holders of the province in 5 regions with the same
parameters as the 5 health authorities: o Laurence Greeff, John Hall, Fred Robertson, Bruce Cummings, Avinash Gupta
• 3 appointed by the Minister of Education based on names put forward by the BC Teachers’ Federation:
o Catherine Lambright (appointment expires April 22, 2013), Rebecca Blair, Patricia Gudlaugson (appointment expires April 22, 2013), Glen Hansman (appointment effective April 23, 2013), Christine Stewart (appointment effective April 23, 2013)
• 7 appointed by the Minister of Education based on nominations from: o BC Principals &Vice-Principals’ Association:
Don Boyd (appointment expires April 22, 2013), Daniel Blais (appointment effective April 23, 2013)
o BC School Trustees’ Association: Teresa Rezansoff
o BC School Superintendents’ Association: Andrew Leathwood
o BC Confederation of Parent Advisory Councils: Catherine Abraham (appointment expires April 22, 2013), Ann Whitteker (appointment effective April 23, 2013)
o Association of BC Deans of Education: Lynn Bossetti
o Federation of Independent School Associations: Patricia Haslop
o First Nations Education Steering Committee: Monty Palmantier
• Non-voting member appointed by the Minister of Education:
o Claire Avison
Page 159 EDU-2013-00071 - PHASE 1
S17 S17
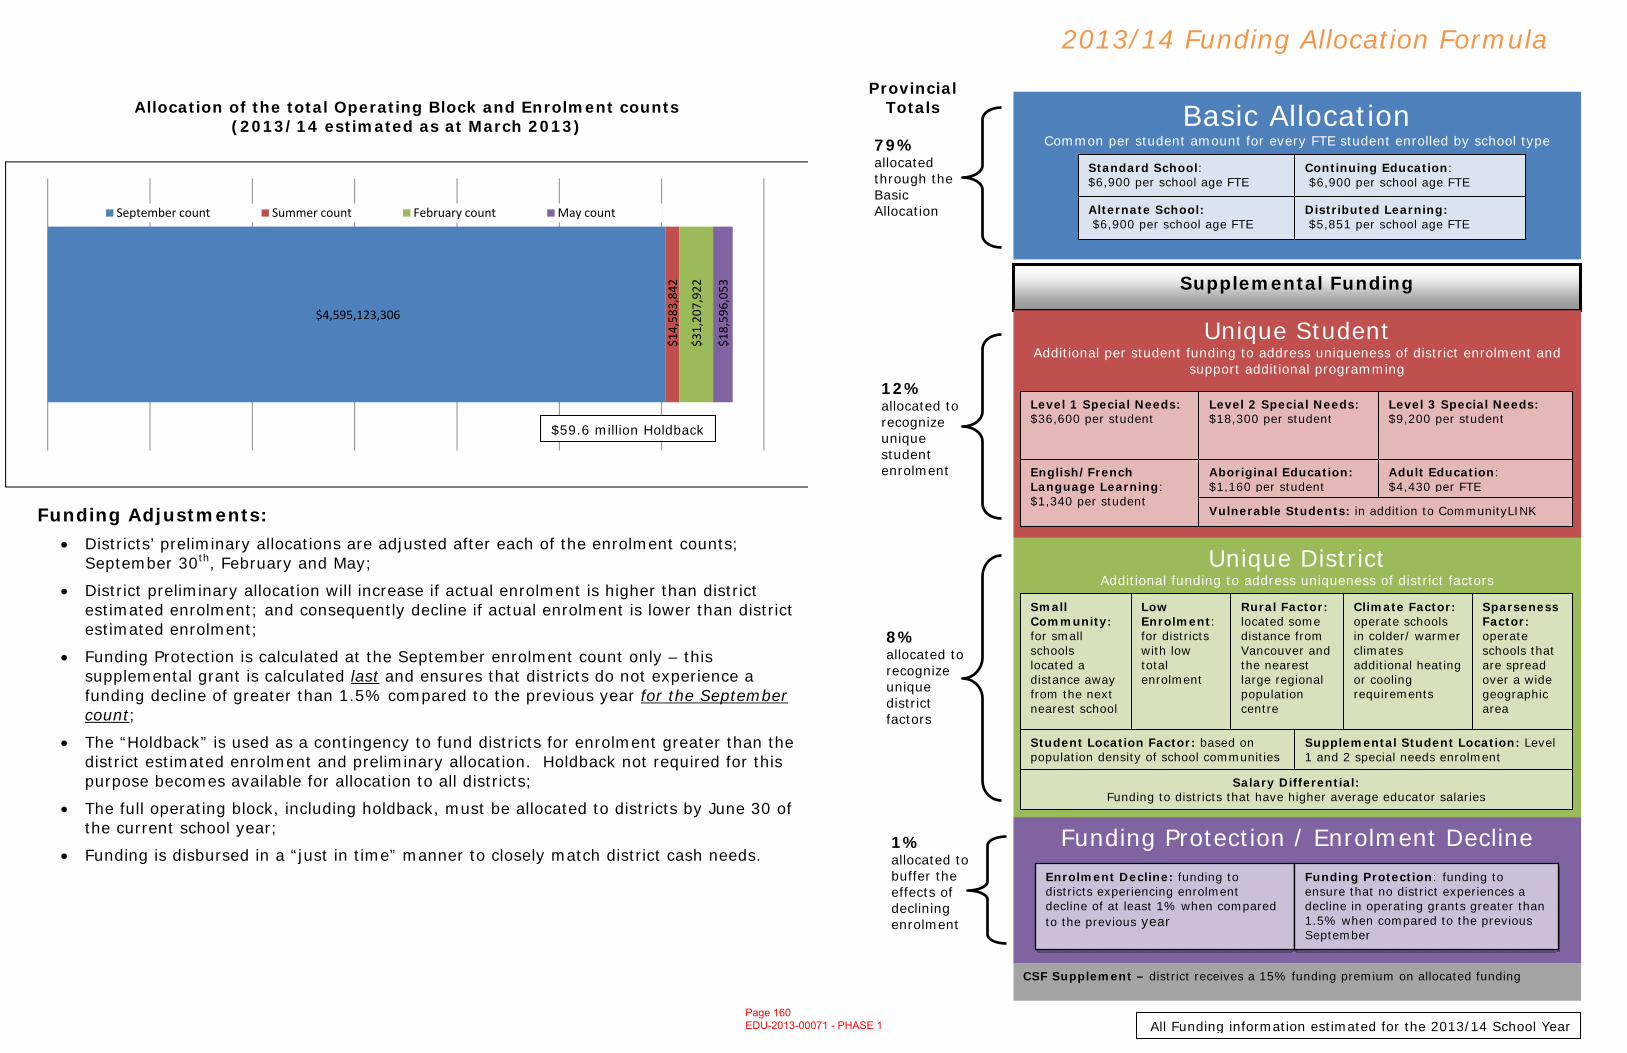
Supplemental Funding
Unique Student Additional per student funding to address uniqueness of district enrolment and
support additional programming
Unique District Additional funding to address uniqueness of district factors
Low Enrolment: for districts with low total enrolment
Rural Factor: located some distance from Vancouver and the nearest large regional population centre
Climate Factor: operate schools in colder/ warmer climates additional heating or cooling requirements
Sparseness Factor: operate schools that are spread over a wide geographic area
Small Community: for small schools located a distance away from the next nearest school
Salary Differential: Funding to districts that have higher average educator salaries
Level 1 Special Needs: $36,600 per student
Level 2 Special Needs: $18,300 per student
Level 3 Special Needs: $9,200 per student
English/French Language Learning: $1,340 per student
Aboriginal Education: $1,160 per student
Adult Education: $4,430 per FTE
Funding Protection / Enrolment Decline Enrolment Decline: funding to districts experiencing enrolment decline of at least 1% when compared to the previous year
Funding Protection: funding to ensure that no district experiences a decline in operating grants greater than 1.5% when compared to the previous September
2013/14 Funding Allocation Formula
Basic Allocation Common per student amount for every FTE student enrolled by school type
Standard School: $6,900 per school age FTE
Continuing Education: $6,900 per school age FTE
Alternate School: $6,900 per school age FTE
Distributed Learning: $5,851 per school age FTE
79% allocated through the Basic Allocation
12% allocated to recognize unique student enrolment
8% allocated to recognize unique district factors
1% allocated to buffer the effects of declining enrolment
$4,595,123,306
$14,58
3,842
$31,20
7,922
$18,59
6,053
September count Summer count February count May count
CSF Supplement – district receives a 15% funding premium on allocated funding
All Funding information estimated for the 2013/14 School Year
Allocation of the total Operating Block and Enrolment counts (2013/14 estimated as at March 2013)
Funding Adjustments: • Districts’ preliminary allocations are adjusted after each of the enrolment counts;
September 30th, February and May;
• District preliminary allocation will increase if actual enrolment is higher than district estimated enrolment; and consequently decline if actual enrolment is lower than district estimated enrolment;
• Funding Protection is calculated at the September enrolment count only – this supplemental grant is calculated last and ensures that districts do not experience a funding decline of greater than 1.5% compared to the previous year for the September count;
• The “Holdback” is used as a contingency to fund districts for enrolment greater than the district estimated enrolment and preliminary allocation. Holdback not required for this purpose becomes available for allocation to all districts;
• The full operating block, including holdback, must be allocated to districts by June 30 of the current school year;
• Funding is disbursed in a “just in time” manner to closely match district cash needs.
$59.6 million Holdback
Provincial Totals
Student Location Factor: based on population density of school communities
Supplemental Student Location: Level 1 and 2 special needs enrolment
Vulnerable Students: in addition to CommunityLINK
Page 160 EDU-2013-00071 - PHASE 1
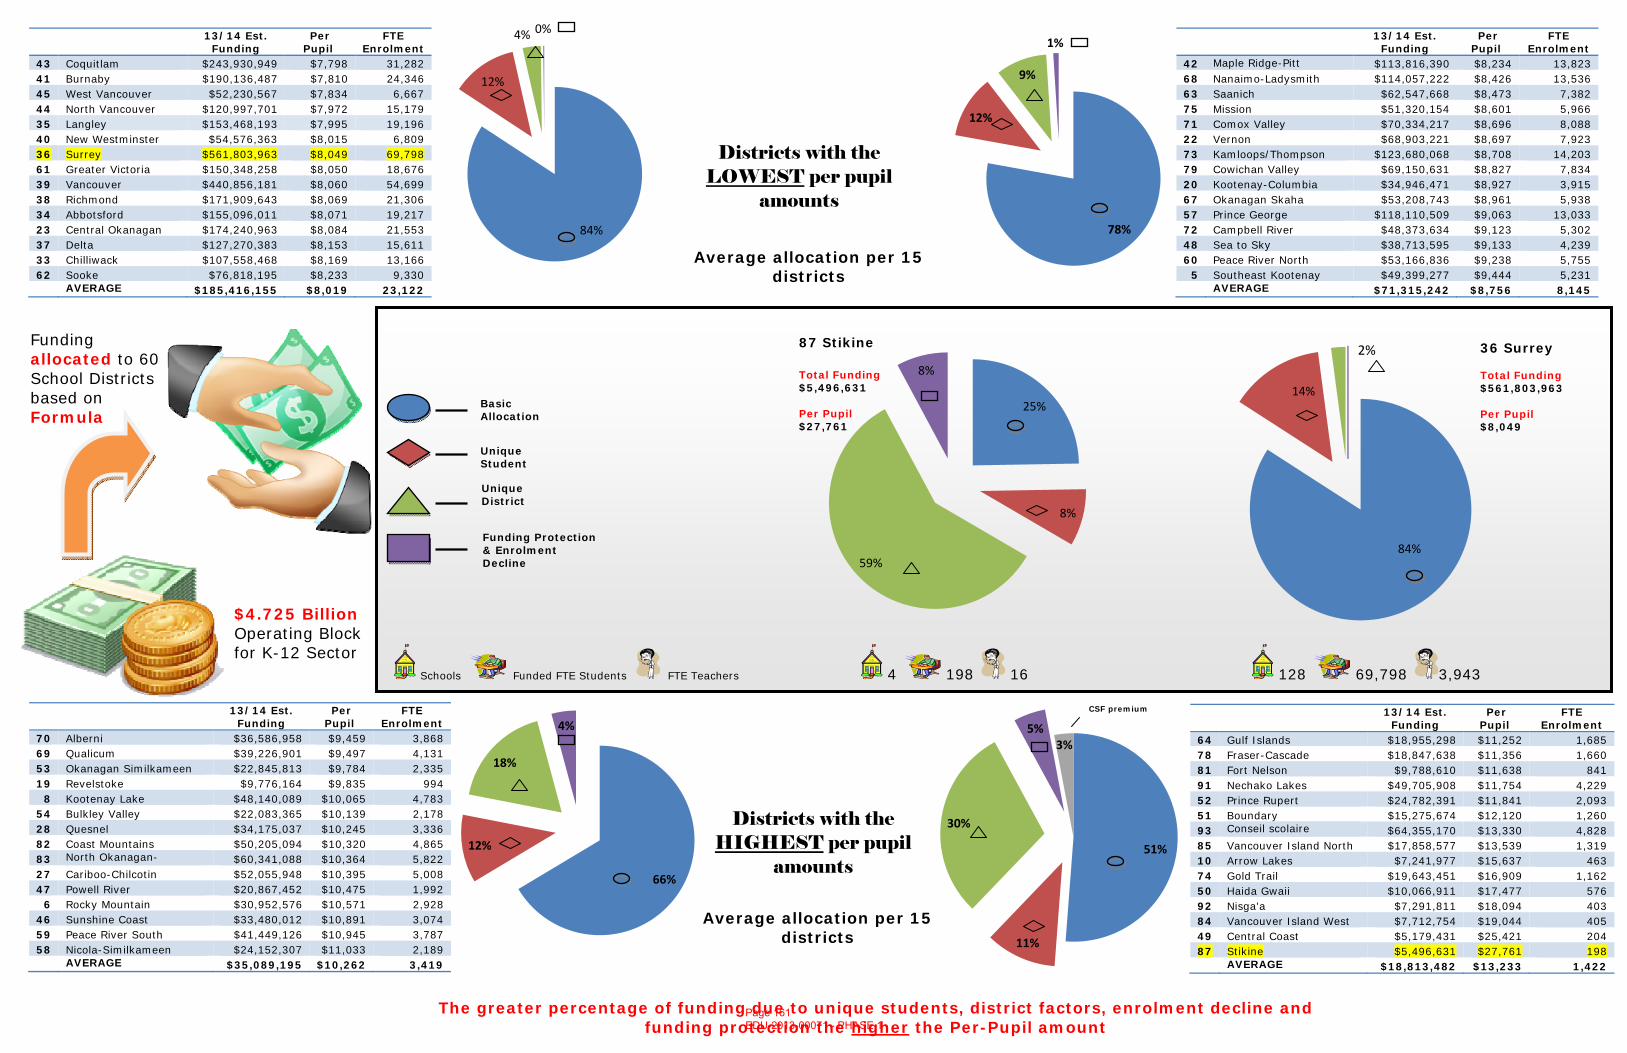
66%
12%
18%
4%
51%
11%
30%
5%3%
Schools Funded FTE Students FTE Teachers 4 198 16 128 69,798 3,943
25%
8%
59%
8%
87 Stikine
Total Funding$5,496,631
Per Pupil$27,761
Basic Allocation
Funding Protection & Enrolment Decline
Unique District
$4.725 Billion Operating Block for K-12 Sector
Funding allocated to 60 School Districts based on Formula
The greater percentage of funding due to unique students, district factors, enrolment decline and funding protection the higher the Per-Pupil amount
84%
14%
2% 36 Surrey Total Funding $561,803,963 Per Pupil $8,049
84%
12%
4% 0%
78%
12%
9%
1% 13/14 Est. Funding
Per Pupil
FTE Enrolment
42 Maple Ridge-Pitt $113,816,390 $8,234 13,823 68 Nanaimo-Ladysmith $114,057,222 $8,426 13,536 63 Saanich $62,547,668 $8,473 7,382 75 Mission $51,320,154 $8,601 5,966 71 Comox Valley $70,334,217 $8,696 8,088 22 Vernon $68,903,221 $8,697 7,923 73 Kamloops/Thompson $123,680,068 $8,708 14,203 79 Cowichan Valley $69,150,631 $8,827 7,834 20 Kootenay-Columbia $34,946,471 $8,927 3,915 67 Okanagan Skaha $53,208,743 $8,961 5,938 57 Prince George $118,110,509 $9,063 13,033 72 Campbell River $48,373,634 $9,123 5,302 48 Sea to Sky $38,713,595 $9,133 4,239 60 Peace River North $53,166,836 $9,238 5,755
5 Southeast Kootenay $49,399,277 $9,444 5,231 AVERAGE $71,315,242 $8,756 8,145
13/14 Est. Funding
Per Pupil
FTE Enrolment
70 Alberni $36,586,958 $9,459 3,868 69 Qualicum $39,226,901 $9,497 4,131 53 Okanagan Similkameen $22,845,813 $9,784 2,335 19 Revelstoke $9,776,164 $9,835 994
8 Kootenay Lake $48,140,089 $10,065 4,783 54 Bulkley Valley $22,083,365 $10,139 2,178 28 Quesnel $34,175,037 $10,245 3,336 82 Coast Mountains $50,205,094 $10,320 4,865 83 North Okanagan- $60,341,088 $10,364 5,822 27 Cariboo-Chilcotin $52,055,948 $10,395 5,008 47 Powell River $20,867,452 $10,475 1,992
6 Rocky Mountain $30,952,576 $10,571 2,928 46 Sunshine Coast $33,480,012 $10,891 3,074 59 Peace River South $41,449,126 $10,945 3,787 58 Nicola-Similkameen $24,152,307 $11,033 2,189 AVERAGE $35,089,195 $10,262 3,419
13/14 Est. Funding
Per Pupil
FTE Enrolment
64 Gulf Islands $18,955,298 $11,252 1,685 78 Fraser-Cascade $18,847,638 $11,356 1,660 81 Fort Nelson $9,788,610 $11,638 841 91 Nechako Lakes $49,705,908 $11,754 4,229 52 Prince Rupert $24,782,391 $11,841 2,093 51 Boundary $15,275,674 $12,120 1,260 93 Conseil scolaire $64,355,170 $13,330 4,828 85 Vancouver Island North $17,858,577 $13,539 1,319 10 Arrow Lakes $7,241,977 $15,637 463 74 Gold Trail $19,643,451 $16,909 1,162 50 Haida Gwaii $10,066,911 $17,477 576 92 Nisga'a $7,291,811 $18,094 403 84 Vancouver Island West $7,712,754 $19,044 405 49 Central Coast $5,179,431 $25,421 204 87 Stikine $5,496,631 $27,761 198 AVERAGE $18,813,482 $13,233 1,422
Average allocation per 15 districts
Districts with the HIGHEST per pupil
amounts
Average allocation per 15 districts
Districts with the LOWEST per pupil
amounts
Unique Student
CSF premium
13/14 Est. Funding
Per Pupil
FTE Enrolment
43 Coquitlam $243,930,949 $7,798 31,282 41 Burnaby $190,136,487 $7,810 24,346 45 West Vancouver $52,230,567 $7,834 6,667 44 North Vancouver $120,997,701 $7,972 15,179 35 Langley $153,468,193 $7,995 19,196 40 New Westminster $54,576,363 $8,015 6,809 36 Surrey $561,803,963 $8,049 69,798 61 Greater Victoria $150,348,258 $8,050 18,676 39 Vancouver $440,856,181 $8,060 54,699 38 Richmond $171,909,643 $8,069 21,306 34 Abbotsford $155,096,011 $8,071 19,217 23 Central Okanagan $174,240,963 $8,084 21,553 37 Delta $127,270,383 $8,153 15,611 33 Chilliwack $107,558,468 $8,169 13,166 62 Sooke $76,818,195 $8,233 9,330 AVERAGE $185,416,155 $8,019 23,122
Page 161 EDU-2013-00071 - PHASE 1
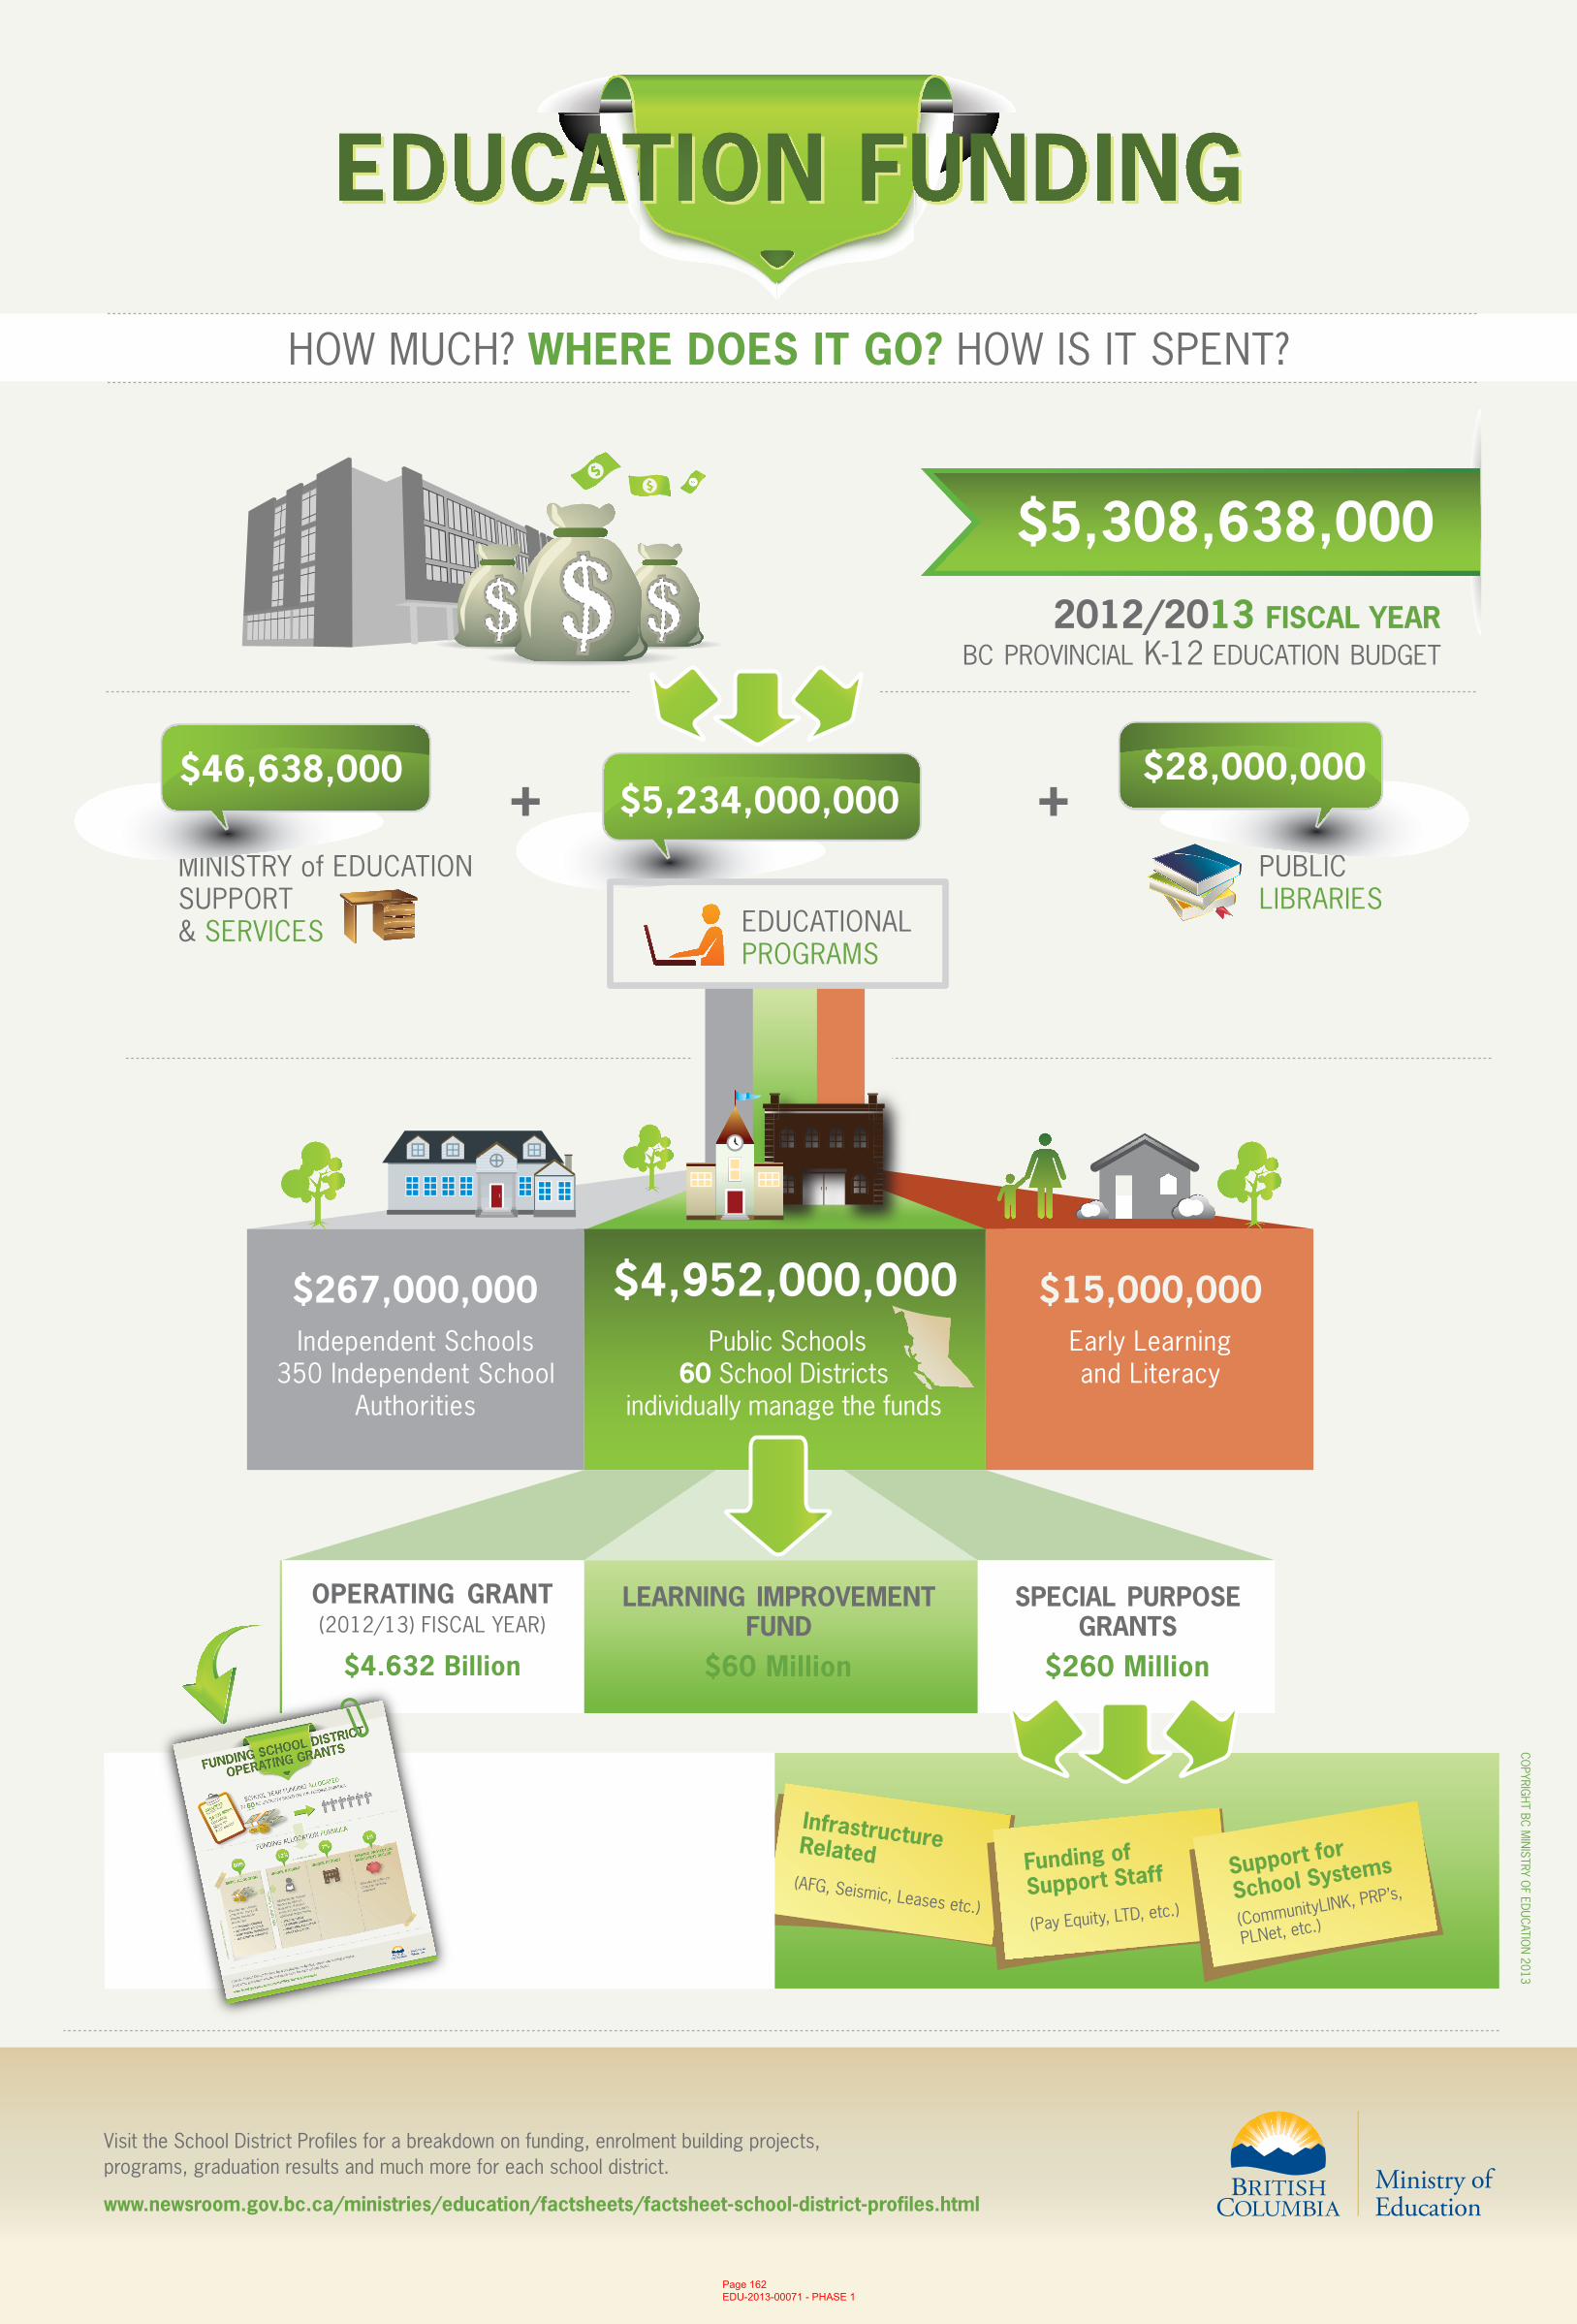
2012/2013 FISCAL YEAR BC PROVINCIAL K-12 EDUCATION BUDGET
$5,308,638,000
Early Learningand Literacy
PUBLIC LIBRARIES
++
COPYRIG
HT BC MIN
ISTRY OF EDUCATIO
N 2013
$5,234,000,000
$15,000,000
$28,000,000
MINISTRY of EDUCATIONSUPPORT & SERVICES
$46,638,000
$4,952,000,000Independent Schools
350 Independent SchoolAuthorities
$267,000,000
EDUCATIONAL PROGRAMS
HOW MUCH? WHERE DOES IT GO? HOW IS IT SPENT?
Public Schools 60 School Districts
individually manage the funds
Visit the School District Profiles for a breakdown on funding, enrolment building projects, programs, graduation results and much more for each school district.
www.newsroom.gov.bc.ca/ministries/education/factsheets/factsheet-school-district-profiles.html
InfrastructureRelated(AFG, Seismic, Leases etc.)
Funding ofSupport Staff
(Pay Equity, LTD, etc.)
Support for
School Systems
(CommunityLINK, PRP’s,
PLNet, etc.)
SPECIAL PURPOSE GRANTS
LEARNING IMPROVEMENTFUND
$60 Million
OPERATING GRANT (2012/13) FISCAL YEAR)
$260 Million$4.632 Billion
Page 162 EDU-2013-00071 - PHASE 1
Ministry of Education 2013/14 Fiscal Year
Briefing Material for
the Minister
February 13, 2013
Table of Contents
Highlights 1
Resource Summary 2
2013/14 Ministry Budget Allocation 3
Historic Budget Trends 4
Public Schools Component 8
Link Between School Year and Fiscal Year 9
Page 163 EDU-2013-00071 - PHASE 1
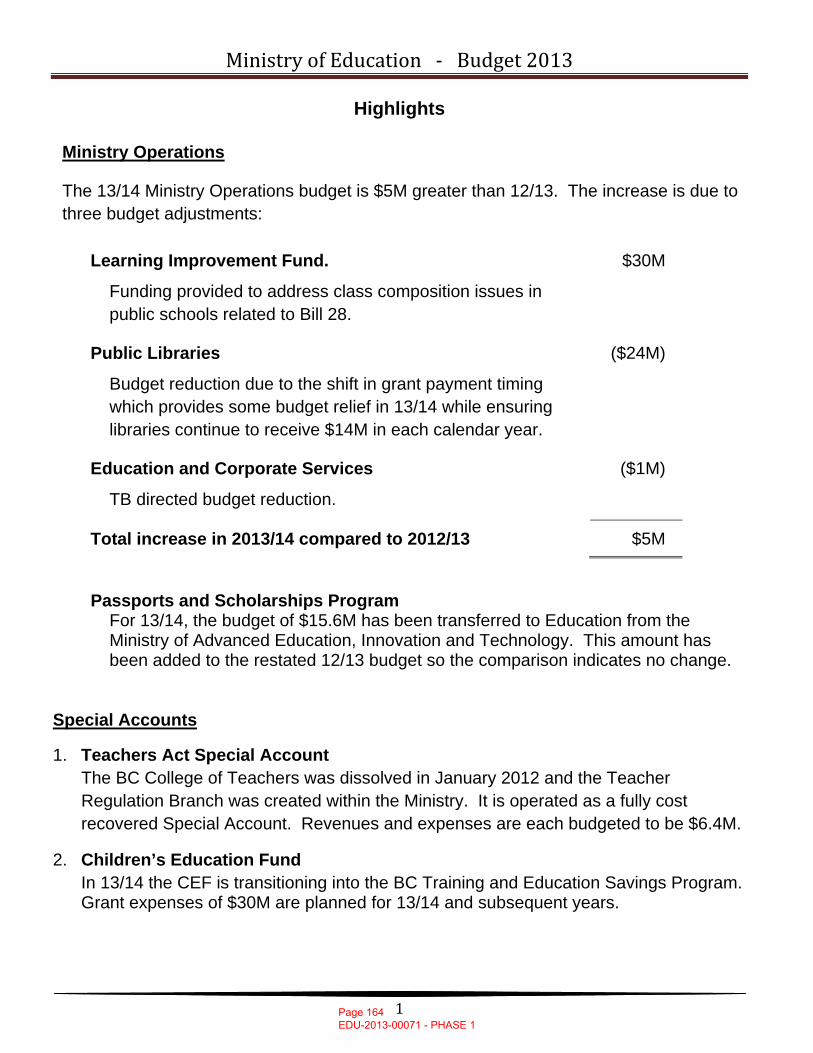
Ministry of Education ‐ Budget 2013
1
Highlights Ministry Operations
The 13/14 Ministry Operations budget is $5M greater than 12/13. The increase is due to three budget adjustments:
Learning Improvement Fund.
Funding provided to address class composition issues in public schools related to Bill 28.
$30M
Public Libraries
Budget reduction due to the shift in grant payment timing which provides some budget relief in 13/14 while ensuring libraries continue to receive $14M in each calendar year.
($24M)
Education and Corporate Services
TB directed budget reduction.
($1M)
Total increase in 2013/14 compared to 2012/13 $5M
Passports and Scholarships Program For 13/14, the budget of $15.6M has been transferred to Education from the Ministry of Advanced Education, Innovation and Technology. This amount has been added to the restated 12/13 budget so the comparison indicates no change.
Special Accounts
1. Teachers Act Special Account
The BC College of Teachers was dissolved in January 2012 and the Teacher Regulation Branch was created within the Ministry. It is operated as a fully cost recovered Special Account. Revenues and expenses are each budgeted to be $6.4M.
2. Children’s Education Fund In 13/14 the CEF is transitioning into the BC Training and Education Savings Program. Grant expenses of $30M are planned for 13/14 and subsequent years.
Page 164 EDU-2013-00071 - PHASE 1
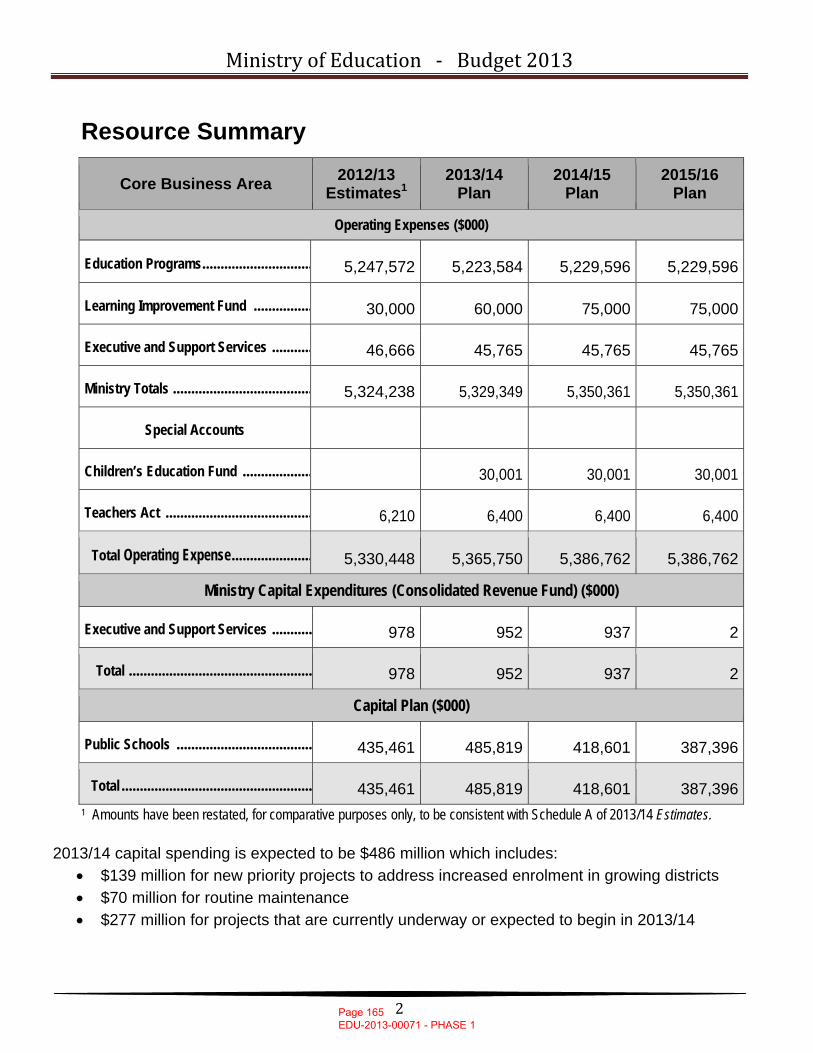
Ministry of Education ‐ Budget 2013
2
Resource Summary
Core Business Area 2012/13 Estimates1
2013/14 Plan
2014/15 Plan
2015/16 Plan
Operating Expenses ($000)
Education Programs .............................. 5,247,572 5,223,584 5,229,596 5,229,596
Learning Improvement Fund ................ 30,000 60,000 75,000 75,000
Executive and Support Services ........... 46,666 45,765 45,765 45,765
Ministry Totals ...................................... 5,324,238 5,329,349 5,350,361 5,350,361
Special Accounts
Children’s Education Fund ................... 30,001 30,001 30,001
Teachers Act ........................................ 6,210 6,400 6,400 6,400
Total Operating Expense ...................... 5,330,448 5,365,750 5,386,762 5,386,762
Ministry Capital Expenditures (Consolidated Revenue Fund) ($000)
Executive and Support Services ........... 978 952 937 2
Total .................................................. 978 952 937 2
Capital Plan ($000)
Public Schools ..................................... 435,461 485,819 418,601 387,396
Total .................................................... 435,461 485,819 418,601 387,3961 Amounts have been restated, for comparative purposes only, to be consistent with Schedule A of 2013/14 Estimates.
2013/14 capital spending is expected to be $486 million which includes:
• $139 million for new priority projects to address increased enrolment in growing districts • $70 million for routine maintenance • $277 million for projects that are currently underway or expected to begin in 2013/14
Page 165 EDU-2013-00071 - PHASE 1
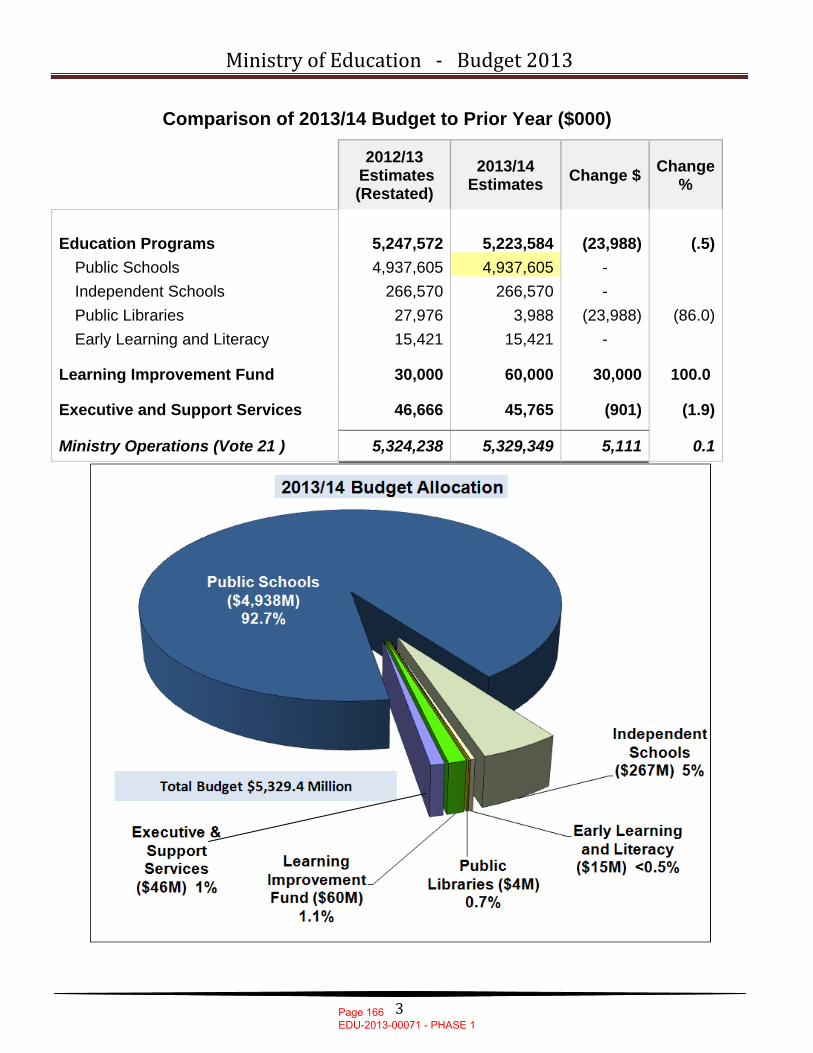
Ministry of Education ‐ Budget 2013
3
Comparison of 2013/14 Budget to Prior Year ($000)
2012/13 Estimates (Restated)
2013/14 Estimates Change $ Change
%
Education Programs 5,247,572 5,223,584 (23,988) (.5)
Public Schools 4,937,605 4,937,605 - Independent Schools 266,570 266,570 - Public Libraries 27,976 3,988 (23,988) (86.0) Early Learning and Literacy 15,421 15,421 -
Learning Improvement Fund 30,000 60,000 30,000 100.0
Executive and Support Services 46,666 45,765 (901) (1.9)
Ministry Operations (Vote 21 ) 5,324,238 5,329,349 5,111 0.1
Page 166 EDU-2013-00071 - PHASE 1
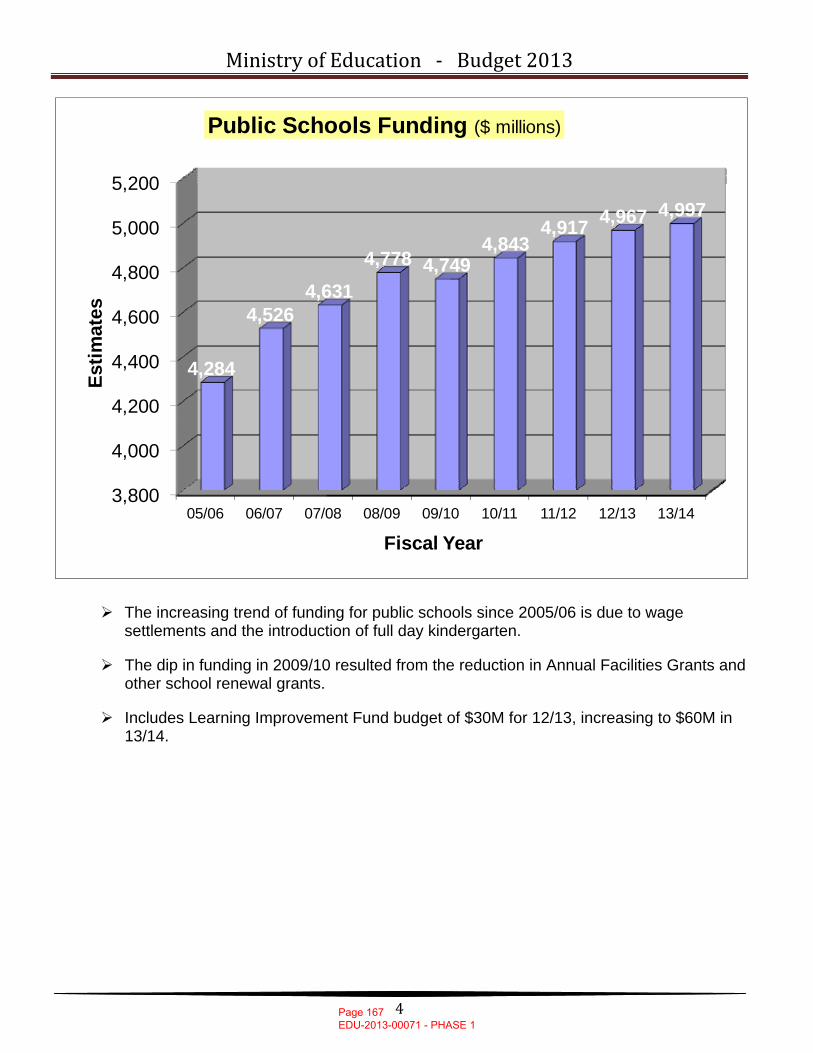
Ministry of Education ‐ Budget 2013
4
The increasing trend of funding for public schools since 2005/06 is due to wage settlements and the introduction of full day kindergarten.
The dip in funding in 2009/10 resulted from the reduction in Annual Facilities Grants and other school renewal grants.
Includes Learning Improvement Fund budget of $30M for 12/13, increasing to $60M in 13/14.
3,800
4,000
4,200
4,400
4,600
4,800
5,000
5,200
05/06 06/07 07/08 08/09 09/10 10/11 11/12 12/13 13/14
4,284
4,5264,631
4,778 4,7494,843
4,917 4,967 4,997
Estim
ates
Fiscal Year
Public Schools Funding ($ millions)
Page 167 EDU-2013-00071 - PHASE 1
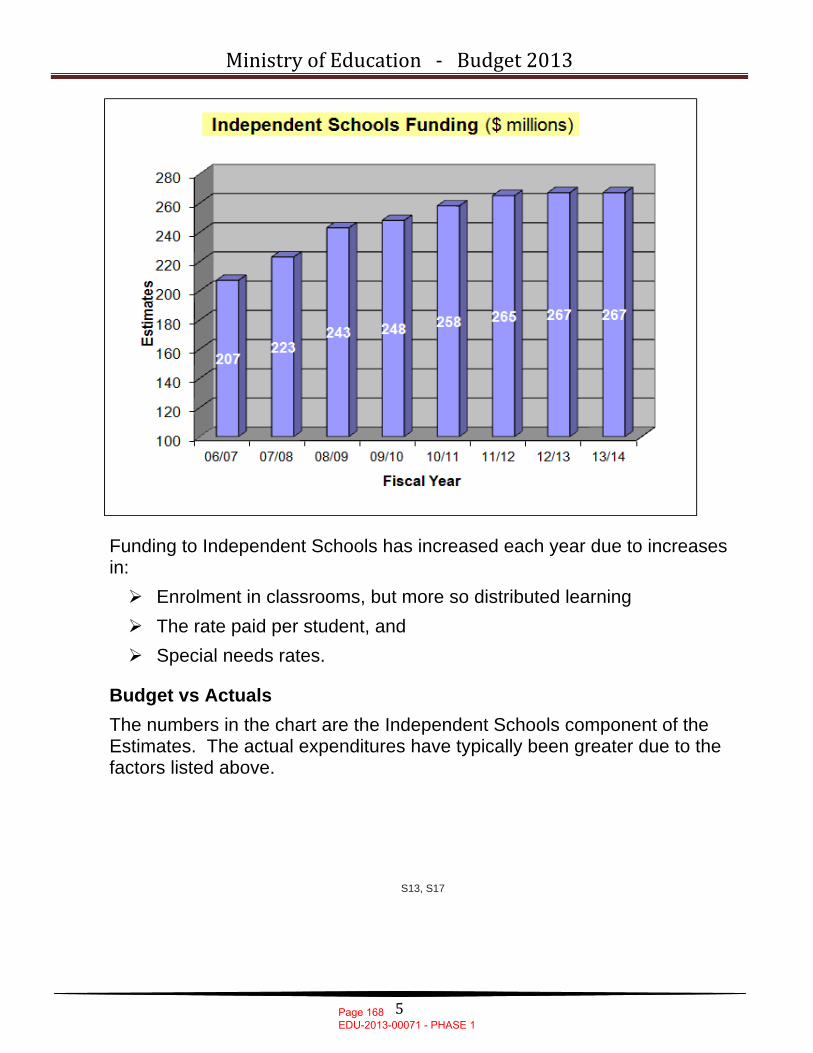
Ministry of Education ‐ Budget 2013
5
Funding to Independent Schools has increased each year due to increases in:
Enrolment in classrooms, but more so distributed learning The rate paid per student, and Special needs rates.
Budget vs Actuals The numbers in the chart are the Independent Schools component of the Estimates. The actual expenditures have typically been greater due to the factors listed above.
Page 168 EDU-2013-00071 - PHASE 1
S13, S17
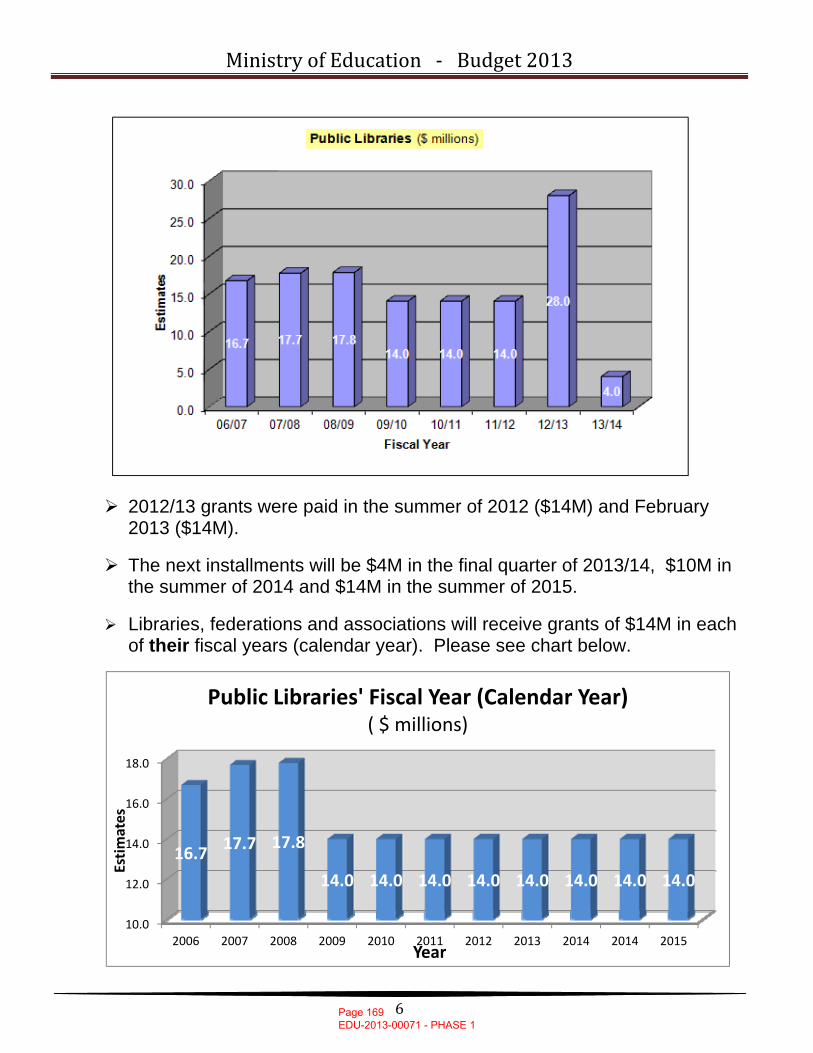
Ministry of Education ‐ Budget 2013
6
2012/13 grants were paid in the summer of 2012 ($14M) and February 2013 ($14M).
The next installments will be $4M in the final quarter of 2013/14, $10M in the summer of 2014 and $14M in the summer of 2015.
Libraries, federations and associations will receive grants of $14M in each of their fiscal years (calendar year). Please see chart below.
10.0
12.0
14.0
16.0
18.0
2006 2007 2008 2009 2010 2011 2012 2013 2014 2014 2015
16.7 17.7 17.8
14.0 14.0 14.0 14.0 14.0 14.0 14.0 14.0
Estimates
Year
Public Libraries' Fiscal Year (Calendar Year)( $ millions)
Page 169 EDU-2013-00071 - PHASE 1
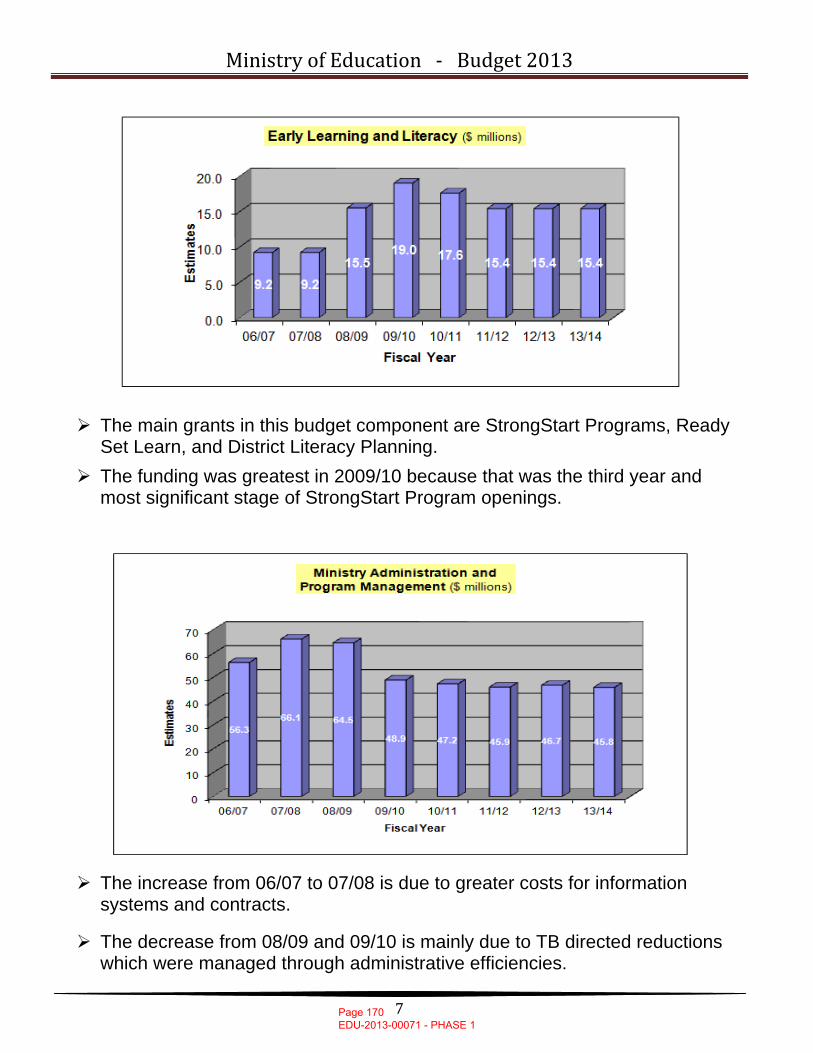
Ministry of Education ‐ Budget 2013
7
The main grants in this budget component are StrongStart Programs, Ready Set Learn, and District Literacy Planning.
The funding was greatest in 2009/10 because that was the third year and most significant stage of StrongStart Program openings.
The increase from 06/07 to 07/08 is due to greater costs for information systems and contracts.
The decrease from 08/09 and 09/10 is mainly due to TB directed reductions which were managed through administrative efficiencies.
Page 170 EDU-2013-00071 - PHASE 1
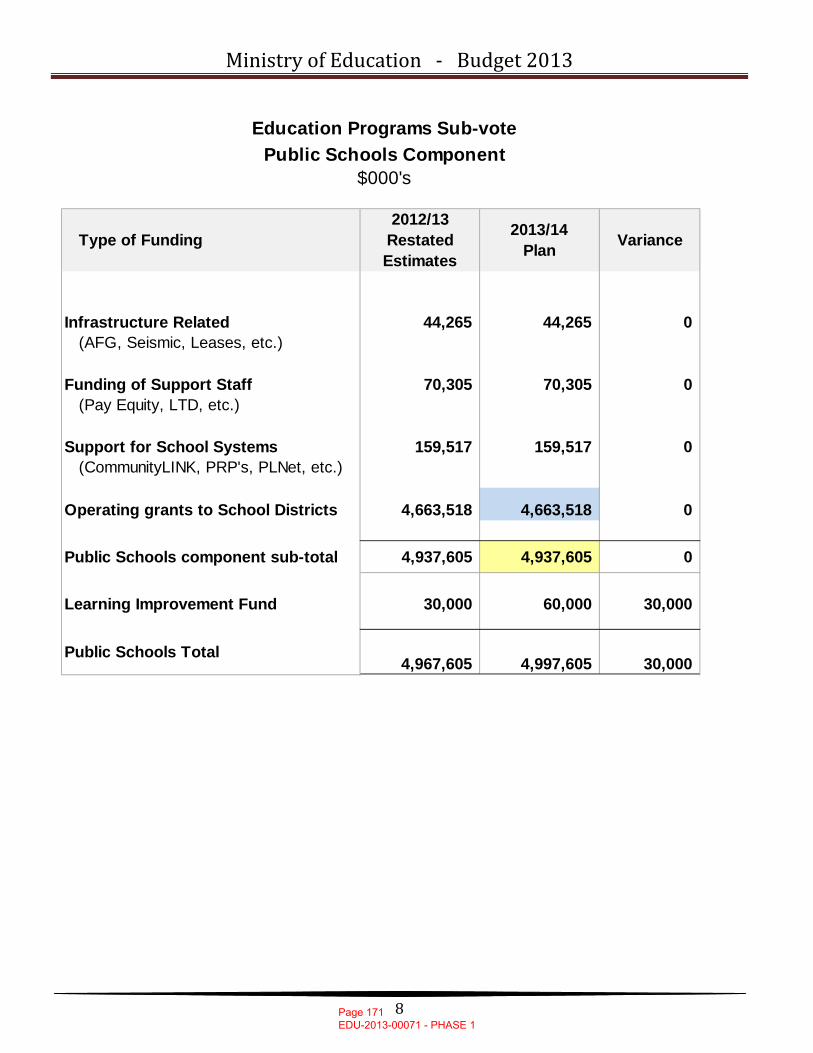
Ministry of Education ‐ Budget 2013
8
Type of Funding2012/13
Restated Estimates
2013/14Plan Variance
Infrastructure Related 44,265 44,265 0(AFG, Seismic, Leases, etc.)
Funding of Support Staff 70,305 70,305 0(Pay Equity, LTD, etc.)
Support for School Systems 159,517 159,517 0(CommunityLINK, PRP's, PLNet, etc.)
Operating grants to School Districts 4,663,518 4,663,518 0
Public Schools component sub-total 4,937,605 4,937,605 0
Learning Improvement Fund 30,000 60,000 30,000
Public Schools Total4,967,605 4,997,605 30,000
Public Schools ComponentEducation Programs Sub-vote
$000's
Page 171 EDU-2013-00071 - PHASE 1
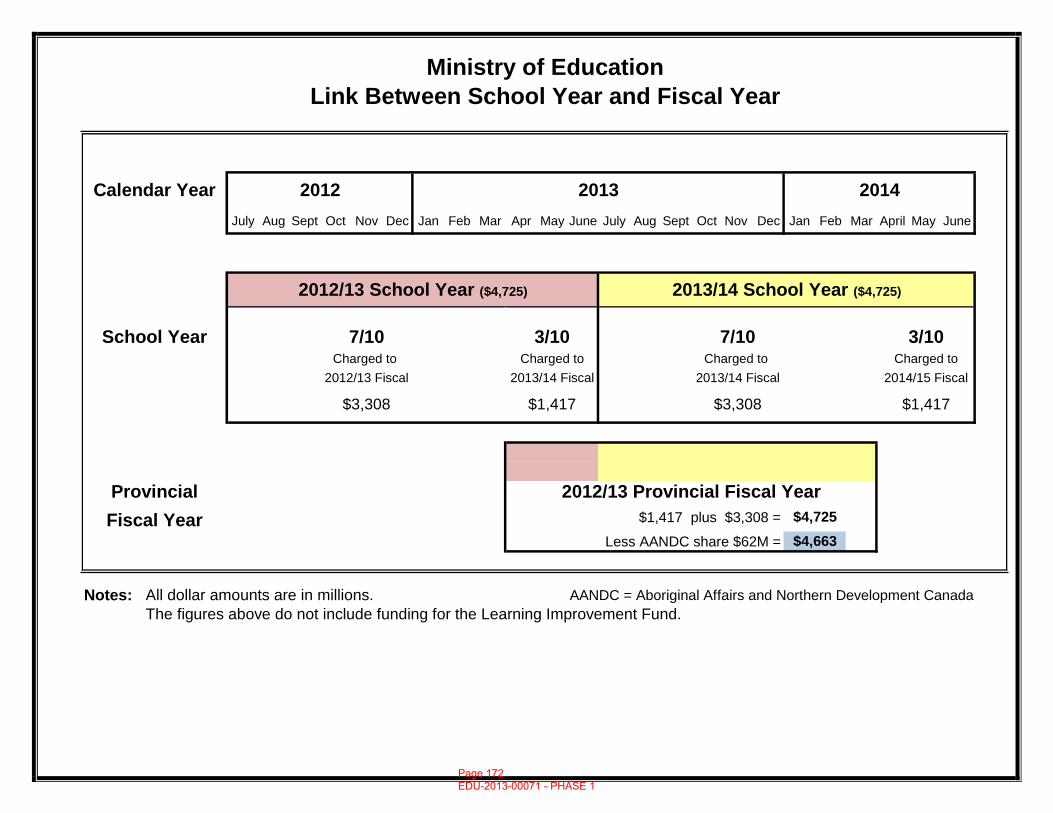
July Aug Sept Oct Nov Dec Jan Feb Mar Apr May June July Aug Sept Oct Nov Dec Jan Feb Mar April May June
$1,417 plus $3,308 =
Less AANDC share $62M =
Notes: All dollar amounts are in millions. AANDC = Aboriginal Affairs and Northern Development CanadaThe figures above do not include funding for the Learning Improvement Fund.
Charged to2013/14 Fiscal
$3,308
$4,725
2012/13 School Year ($4,725) 2013/14 School Year ($4,725)
2012 2013
Link Between School Year and Fiscal Year
Fiscal Year
Charged to 2013/14 Fiscal
Charged to 2012/13 Fiscal
$1,417 $3,308
3/10 7/10
2012/13 Provincial Fiscal Year
Ministry of Education
Provincial
Calendar Year
School Year 7/10
$4,663
2014
3/10Charged to
2014/15 Fiscal
$1,417
Page 172 EDU-2013-00071 - PHASE 1
MINISTRY OF EDUCATION KEY RESPONSIBILTIES AND OPPORTUNITIES NOTE
SCHOOL DISTRICT FINANCIAL REPORTING
Edited: 6/25/2013 at 5:05:57 PM Page 1 of 2
TOPIC DESCRIPTION: Boards of Education must not incur a deficit unless the board has approval of the Minister.
FACTS AND FIGURES:
As at June 30, 2012, three school districts had accumulated Operating Fund deficits totaling $6.6 million.
Excluding Unfunded Employee Future Benefits, the net balance of Operating Fund surpluses and deficits for all school districts totaled approximately $226 million as at June 30, 2012.
BACKGROUND: Boards of Education are required by legislation to prepare balanced annual operating
budgets.
During a school year, boards may experience exceptional circumstances such as unforeseen expenditures or reduced revenue due to unexpected enrolment declines.
Boards expecting to incur a deficit must seek the Minister’s approval prior to the end of the school year on June 30. Audited financial statements must be submitted by September 30.
Boards must retire the deficit from future operations, and the Ministry provides no additional funding.
Over the past decade, EDUC management of school district deficits has seen the number of deficits reduced from seventeen in 2000/01 to a low of two in 2007/08. Since 2008/09, three school districts have been in deficit.
Except for a debt service surplus, every surplus accruing in respect of operating expenses of a board of education may be retained as an unappropriated operating reserve of the board. Appropriations, or internal restrictions, may be placed by the board through a motion. Internally restricted operating reserves are within the power of the board to subsequently alter.
Excluding Unfunded Employee Future Benefits (EFB), the net balance of Operating Fund surpluses and deficits for all school districts totaled approximately $226 million as at June 30, 2012. Boards have internally restricted $197 million of the Operating Fund surpluses for specific future year purposes.
Page 173 EDU-2013-00071 - PHASE 1
MINISTRY OF EDUCATION KEY RESPONSIBILTIES AND OPPORTUNITIES NOTE
SCHOOL DISTRICT FINANCIAL REPORTING
Edited: 6/25/2013 at 5:05:57 PM Page 2 of 2
Since 2007/08, the cumulative Operating Fund surplus (excluding unfunded EFB) increased by $18.5 million.
31 districts increased surplus – $53.3 million
3 districts decreased surplus and incurred a cumulative deficit – $5.5 million
Remaining 26 districts decreased cumulative surplus – $29.3 million
Since 2010/11, the cumulative Operating Fund surplus, excluding unfunded EFBs, increased by $41.9 million.
OPPORTUNITIES: Maintain current practice of working with boards facing a deficit or working their
way out of one. Primary Contact: A/ADM: Doug Stewart Phone: n/a Cell:
Page 174 EDU-2013-00071 - PHASE 1
S17
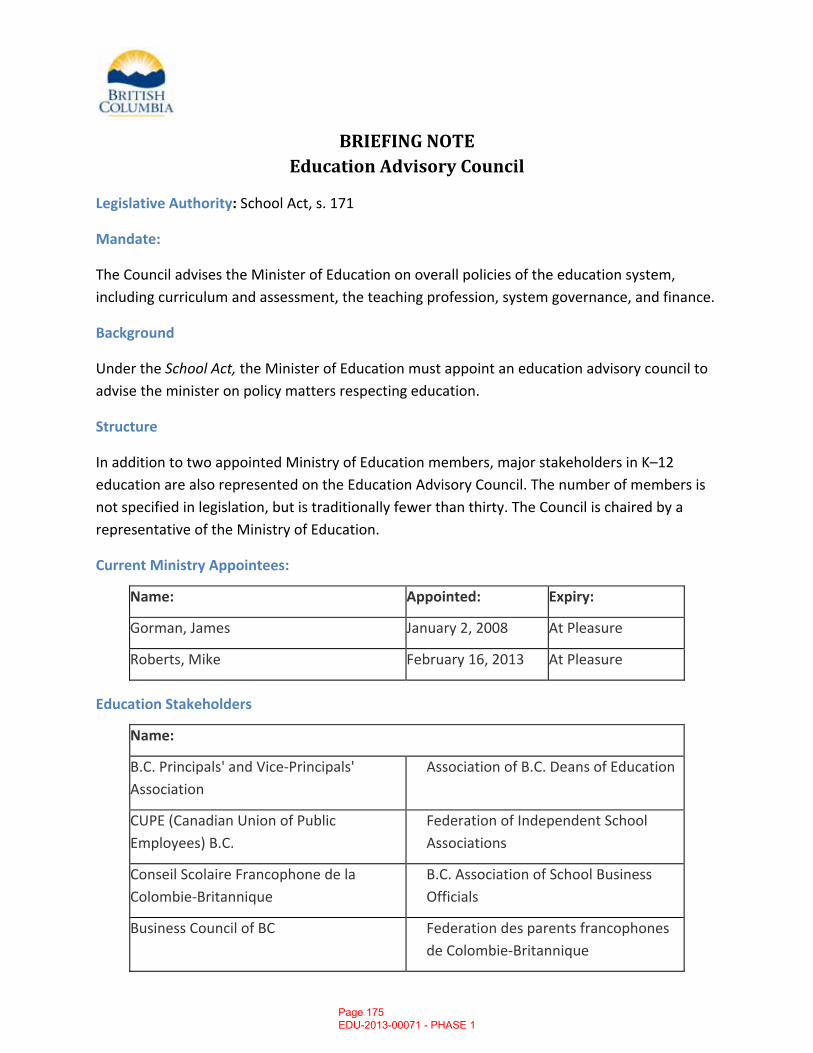
BRIEFING NOTE
Education Advisory Council
Legislative Authority: School Act, s. 171
Mandate:
The Council advises the Minister of Education on overall policies of the education system, including curriculum and assessment, the teaching profession, system governance, and finance.
Background
Under the School Act, the Minister of Education must appoint an education advisory council to advise the minister on policy matters respecting education.
Structure
In addition to two appointed Ministry of Education members, major stakeholders in K–12 education are also represented on the Education Advisory Council. The number of members is not specified in legislation, but is traditionally fewer than thirty. The Council is chaired by a representative of the Ministry of Education.
Current Ministry Appointees:
Name: Appointed: Expiry:
Gorman, James January 2, 2008 At Pleasure
Roberts, Mike February 16, 2013 At Pleasure
Education Stakeholders
Name:
B.C. Principals' and Vice‐Principals' Association
Association of B.C. Deans of Education
CUPE (Canadian Union of Public Employees) B.C.
Federation of Independent School Associations
Conseil Scolaire Francophone de la Colombie‐Britannique
B.C. Association of School Business Officials
Business Council of BC Federation des parents francophones de Colombie‐Britannique
Page 175 EDU-2013-00071 - PHASE 1
B.C. Student Voice B.C. Teachers' Federation
B.C. School Superintendents Association B.C. School Trustees Association
B.C. Federation of Labour B.C. Public School Employers' Association
British Columbia Assembly of First Nations B.C. Confederation of Parent Advisory Councils
Appointments required:
No appointments necessary.
Issue(s):
No issues.
Key Contact:
Name: Mike Roberts
Title: Superintendent, Liaison
Phone: 604‐660‐1483
Cell:
Page 176 EDU-2013-00071 - PHASE 1
S17
Partner Group: British Columbia Teachers’ Federation (BCTF)
Susan Lambert, President (retiring – Jim Iker will take over July 1, 2013) Jim Iker, First Vice‐President (Representative) Glen Hansman, Second Vice‐President
Contact Info: 100–550 W 6th Ave 604‐871‐2283 or
Vancouver BC V5Z 4P2 1‐800‐663‐9163 toll‐free
Description from Website: (www.bctf.ca) The British Columbia Teachers' Federation (BCTF), established in 1917, is the union of professionals representing 41,000 public school teachers in the province of British Columbia, Canada. All public school teachers belong to the BCTF and their local teachers' association. The BCTF was incorporated as a benevolent society in 1919 and achieved full collective bargaining rights in 1987. The BCTF is committed to communicating with members and the general public on issues of importance to teachers, students, parents, and the broader community. Current issues include funding for school libraries, class size and composition, the Foundation Skills Assessment (FSA), and teacher salaries (current contract expires June 30, 2011).
Page 177 EDU-2013-00071 - PHASE 1
Partner Group: BC Public School Employers’ Association (BCPSEA)
Alan Chell, Chair Silas White, Vice‐Chair Contact Info: 400–1333 West Broadway 604‐730‐0739 Vancouver BC V6H 4C1 Description from Website: (www.bcpsea.bc.ca) BCPSEA is the employers’ association and accredited bargaining agent for the province’s 60 public boards of education. Representatives from the 60 school boards elect nine school trustees to the Board of Directors, including the Chair and the Vice‐Chair; they are joined by four government representatives and a non‐voting representative each from the BC School Superintendents' Association and the BC School District Secretary‐Treasurers' Association. As the employers’ association, we have responsibility for:
• Promoting effective and cooperative human resources practices in the public school system that contribute to the betterment of public education.
• Coordinating benefits administration among the various school districts in order to maximize coverage in the most cost‐effective manner.
• Coordinating compensation for employees who are not subject to collective agreements—usually the administrative and management staff in school districts.
• Providing labour relations advice and services to boards of education, including contract interpretation and grievance/arbitration case management.
• Determining collective bargaining objectives for the public education sector. • Negotiating provincially with the British Columbia Teachers’ Federation (the teachers’
union) for a provincial teachers’ collective agreement covering the 60 public boards of education and their employees, for coordinating local bargaining between the school boards and their local teachers’ associations.
• Providing assistance, resources and coordination for support staff collective bargaining in our capacity as the accredited bargaining agent for all 60 public boards of education. While bargaining is done at the local board of education level, approval of the negotiated compensation provisions is required by our association.
• Leading the K‐12 public education sector in the development and implementation of strategies and resources to address labour market trends and demands to ensure the maintenance of a sustainable, qualified workforce.
• Facilitating the development and implementation of public policy through advice to government and services to school districts. Provide insight and advice on the human resource implications of legislative and policy initiatives.
Page 178 EDU-2013-00071 - PHASE 1
Partner Group: BC Confederation of Parent Advisory Councils (BCCPAC)
Terry Berting, President (Representative) John Puddifoot, First Vice‐President (Alternate) Nicole Mkohoniuk, Second Vice‐President
Contact Info: Suite 200 ‐ 4170 Still Creek Drive 604‐687‐4433 or
Burnaby BC V5C 6C6 1‐866‐529‐4397 toll‐free
Description from Website: (www.bccpac.bc.ca) BCCPAC is a charitable organization registered under the Society Act of BC and committed to enhancing the parental voice in public education in BC. BCCPAC's purposes are:
• To advance the public school education and well‐being of children in the province of BC. • To carry on activities to promote and enhance meaningful parent participation in an
advisory role at the school, school district and provincial levels. We are:
• Governed by a volunteer board of nine directors elected annually by the membership. • Managed by a committed full‐time staff. • Assisted by contract workers and volunteers.
About us:
• BCCPAC represents a membership of over 1,000 Parent Advisory Councils and District Parent Advisory Councils from every school district in the province.
• Collectively, we represent the parents of hundreds of thousands of children in BC. • We receive funding from the Ministry of Education, membership fees, conference
registration fees, sales of resources, advertising, sponsorship, and project funding. • We ensure that parents have a voice in their children's education. • We ensure that the BC public education system remains focused on the needs of
children. • We support parents as they navigate the education system and exercise their and their
children's rights in education. • We hold two annual conferences for members
o Fall Conference o Spring Conference and Annual General Meeting
• We assist members with a wide range of services, including the BCCPAC Advocacy Project and Member Services, and we produce many valuable resources.
Page 179 EDU-2013-00071 - PHASE 1
Partner Group: BC School Superintendents Association (BCSSA)
Terry Sullivan, President Kathy Sawchuk, Vice President Contact Info: 208–1118 Homer St 604‐687‐0590
Vancouver BC V6B 6L5
Description from Website: (www.bcssa.org) The members of the BCSSA are the superintendents, assistant superintendents, directors of instruction and other senior executives of BC's 60 school districts. Prior to their district‐level appointments, our members served for many years as teachers and principals. They each hold a valid BC Teacher's Certificate and bring highly developed skills and a lifelong passion for teaching and learning to their district positions. BCSSA members are the province's educational leaders, uniquely qualified to ensure the success of students and school district operations. There are currently more than 250 BCSSA members, including some members who have been seconded to the Ministry of Education. Additionally, there are more than 200 senior active (retired from school district) members who participate in association activities. The key work of the BC School Superintendents Association is to enable our members to be visionary leaders of public education by supporting their individual professional development and by representing their collective wisdom and interests. To support them in fulfilling their leadership roles, we create professional development (Pro‐D) events to address emerging issues, the changing needs of school district administrators and the development and effective use of advanced educational and administrative approaches and technologies. These events not only help our members enhance their leadership skills, but also present opportunities for them to network with colleagues throughout the province who share similar job responsibilities and interests.
Page 180 EDU-2013-00071 - PHASE 1
Partner Group: BC School Trustees’ Association (BCSTA) Michael McEvoy, President (Representative) Teresa Rezansoff, Vice‐President Contact Info: 4th floor, 1580 West Broadway Vancouver BC V6J 5K9 604‐734‐2721 Description from Website: (www.bcsta.org) The BC School Trustees Association (BCSTA) is a non‐profit, voluntary organization dedicated to assisting boards of education in their key work: improving student achievement through community engagement. The key work concept, which BCSTA introduced in 1998, explains in straightforward terms what it is that school trustees are elected to do, and how they do it. Boards of education are elected to improve student achievement. They do it by engaging their communities in building and maintaining a school system that reflects local priorities, values and expectations. School trustees listen to their communities, guide the work of their school district, setting a plan, policy and the annual budget—and report back to the public on how our students are doing. BC’s 60 boards of education are all members of BCSTA. Our school trustees and their boards look to their association to serve as a strong provincial voice and to influence government by representing the membership on matters affecting public education. The mission of the BCSTA is to support and advocate for effective public boards of education and quality public education in British Columbia. The key work of school boards is improving student achievement through community engagement.
Page 181 EDU-2013-00071 - PHASE 1
Partner Group: BC Association of School Business Officials (BCASBO)
Lynda Minnabarriet, President (Representative) Lyle Boyce, Executive Director Contact Info: 208–1118 Homer St Vancouver, BC V6B 6L5 604‐687‐0595 Description from Website: (www.bcasbo.ca) Effective February 1, 2008, the BC School District Secretary Treasurers' Association (BCSDSTA) officially became the BC Association of School Business Officials (BCASBO). The BC Association of School Business Officials is the professional association of the business officials working in school districts. The membership includes Secretary‐Treasurers, Assistant Secretary‐Treasurers, Comptrollers, Payroll and Benefits Supervisors, Managers of Human Resources, Accountants, Information Systems Managers. The Association provides its members with professional development opportunities and a forum to share ideas, new initiatives, and concerns. It provides an important communication vehicle to ensure that each individual school district is able to learn solutions from others. The Executive of the Association meets quarterly with officials of the Ministry of Education to ensure the Ministry is aware of concerns and issues as well as to provide the Ministry with valuable advice on their work. Our members participate on many advisory committees such as the Accounting Advisory Committee, Funding Review Committee, Risk Management Advisory Committee and the Education Advisory Council.
Page 182 EDU-2013-00071 - PHASE 1
Partner Group: BC Principals’ and Vice‐Principals’ Association (BCPVPA)
Shelley Green, President (Election for new president in April 2013) Kit Krieger, Executive Director
Contact Info: 200–525 10th Ave W 604‐689‐3399 Vancouver BC V5Z 1K9 Description from Website: (www.bcpvpa.bc.ca) BC Principals’ and Vice‐Principals’ Association (BCPVPA) works to ensure that the views of principals and vice‐principals are heard in all education matters. Although the BCPVPA has been an autonomous professional association since January 1988, the organization’s history dates back another 30 years as a Provincial Specialist Association (PSA) of the BC Teachers’ Federation. The BCPVPA is governed by an elected Board of Directors (President, either President Elect or Past President, and 10 directors). Three times per year, representatives from all BCPVPA Chapters convene at Chapter Council to provide guidance and direction to the Board; to prepare and receive reports; and to carry out activities assigned to it by the Board or by members at an AGM. The day to day business of the Association is directed by the executive director with five managers and six support staff. Today, the Association’s strategic priorities are:
• The BCPVPA will strive to ensure its members have the skills to be effective educational leaders;
• The BCPVPA will advocate for its members to have the time, resources and support to be effective educational leaders;
• The BCPVPA will work cooperatively with education partners to sustain and improve public education;
• The BCPVPA will proactively monitor emerging issues to inform and advise members; and
• The BCPVPA will be recognized as an innovative, inclusive and vigorous community of educational leaders
• The BCPVPA will maintain a strong efficient and effective organization.
Page 183 EDU-2013-00071 - PHASE 1
Partner Group: Federation of Independent School Association (FISA)
Doug Lauson, President Henry Contant, Vice‐President Peter Froese, Executive Director (Representative)
Contact Info: 150 Robson St (604) 684‐6023 Vancouver BC V6B 2A7
Description from Website: (www.fisabc.ca) Independent schools are understood to be those schools not owned and operated by the province which are regulated by the Independent School Act. The Federation of Independent School Associations (FISA), established in 1966, is an umbrella organization for independent school groups in British Columbia. FISA is the voice for its members in British Columbia, and acts as a liaison between the schools and the government, and other educational institutions. FISA is dedicated to assisting independent schools in maintaining their independence while seeking fair treatment for them in legislative and financial terms. FISA is a non‐profit society registered with the Corporate and Personal Property Registries office, Ministry of Finance of BC, Victoria, British Columbia, under the provisions of the Society Act of BC.
Page 184 EDU-2013-00071 - PHASE 1
Partner Group: BC Assembly of First Nations (BCAFN)
Jody Wilson‐Raybould (Puglaas), Regional Chief Contact Info: 507–100 Park Royal South 604‐922‐7733
West Vancouver BC V7T 1A2 Description from Website: (www.bcafn.ca) The BC Assembly of First Nations (BCAFN) is a Political Territorial Organization (PTO) that represents the 203 First Nations in British Columbia. The BCAFN is inclusive in its representation including First Nations involved in the treaty process and those that have chosen not to engage. In addition, we also represent the modern and historic treaty First Nations of BC, which include the Nisga’a Nation, and the Douglas and Treaty 8 First Nations. An elected Regional Chief provides the political leadership and activities for the BCAFN, and this role is a three‐year term, elected by the Chiefs of the First Nations of BC. The BCAFN is a regional arm of the National Assembly of First Nations (AFN), which makes the Regional Chief an Executive Member of the AFN Executive Committee. The Regional Chief represents the regional concerns of the BCAFN constituents on the Executive Committee to ensure that regional perspectives are included in National political discussions and decision‐making. The Regional Chief also holds specific portfolios that deal with national policy issues and concerns. The Regional Chief hosts regional assemblies that allow for the First Nations leadership of BC to engage in open socio‐political discussion in order to provide direction and mandates to the Regional Chief that are community‐driven. The Regional Chief then ensures that these mandates are represented and advocated at both the regional and federal level, creating linkages between the two processes. It is the role of the BCAFN to ensure that these activities continue to be communicated and represented at the community level. The BCAFN is working towards creating new and better memories for First Nations that include meaningful participatory relationships with the provincial and federal governments as well as with industry, and which close the socio‐economic gap that exists for First Nations. The new relationship with the BC Provincial Government and the recently signed made‐in‐BC tripartite Transformative Change Agreement will allow all parties to work towards reconciliation of Aboriginal rights and title with the Crown and to establish new relationships built on mutual respect and recognition. These principles and agreements will allow for First Nations, governments, industry, and other stakeholders to work together, inquire, and establish new forms of interaction that will respect and acknowledge First Nations title and rights.
Page 185 EDU-2013-00071 - PHASE 1

Partner Group: BC Federation of Labour (BCFed)
Jim Sinclair, President Irene Lanzinger, Secretary‐ Treasurer
Contact Info: 200‐5118 Joyce St 604‐430‐1421
Vancouver, BC V5R 4H1 Description from Website: (www.bcfed.ca) The British Columbia Federation of Labour represents more than half a million workers through affiliated unions in more than 800 locals, working in every aspect of the BC economy. Established in 1956, the BCFed, as it is most commonly known, has a long and proud history of fighting for the rights of all working people. The goals of the Federation are best exemplified by its slogan: "What we desire for ourselves, we wish for all." The B.C. Federation of Labour brings together the majority of unions in BC to provide a single voice on workers' rights. As well, the Federation provides support to affiliated unions during labour disputes and co‐ordinates cross‐union campaigns from health and safety to political action and women's rights. The Federation is a member of the Canadian Labour Congress (CLC) and works with it to further the interests of working people across the country.
Page 186 EDU-2013-00071 - PHASE 1
Partner Group: Canadian Union of Public Employees, BC (CUPE)
Mark Hancock, President Paul Faoro, Secretary‐Treasurer Contact Info: 510–4940 Canada Way 604‐291‐9119
Burnaby BC V5G 4T3 Description from Website: (www.cupe.bc.ca) CUPE BC represents 80,000 workers in more than 170 local unions and across many different sectors. Nearly every community in the province has one or more CUPE locals. CUPE members in B.C. work in hundreds of occupations that help keep communities strong. We work for municipalities, school boards, libraries, colleges, universities, social service agencies, community health centres, private agencies, the ambulance service, public utilities, and other public institutions.
Page 187 EDU-2013-00071 - PHASE 1
Partner Group: Association of BC Deans of Education (ABCDE)
Kris Magnusson, Chair (Representative) Sandra Bruneau, Executive Director Contact Info: c/o 3817 West 16th Avenue 604‐224‐3889 (UBC) or
Vancouver, BC V6R 3C6 604‐329‐8717 (Cell)
Description from Website: (www.educ.sfu.ca/abcde)
The Association of BC Deans of Education represents the nine provincial teacher education programs. The ABCDE exists to enhance cooperation among British Columbia's teacher education programs and other educational stakeholders in providing quality undergraduate and graduate teacher education programs as well as excellence in related scholarship and research. The ABCDE also promotes the exchange of ideas and discussion about enhancing educational opportunities for B.C.'s children. The mission of the Association of British Columbia Deans of Education (ABCDE) is to promote cooperation and collaboration between and among British Columbia’s Faculties of Education, as well as among their education partners. Such cooperation and collaboration is for the purposes of:
• supporting commitment to lifelong learning;
• providing innovative, resourceful, responsive, and inclusive undergraduate and graduate programs for the preparation and growth of teachers and others concerned with learning in both school and non‐school settings;
• building collaboration among, and partnership with, other educational stakeholders;
• encouraging and sharing pertinent scholarship and research;
• promoting the free and open exchange of ideas, analyses, and views of educational issues;
• enhancing learning opportunities for British Columbians; and
• exploring synergies and initiatives around shared priorities.
Page 188 EDU-2013-00071 - PHASE 1
Partner Group: Conseil scolaire francophone de la Colombia‐Britannique
M Roger Hebert, President, Board of Regional Trustees Contact Info: 180 ‐ 10200 Shellbridge Way 604‐214‐2600 Richmond BC V6X 2W7 Description from Website: (www.csf.bc.ca) The Conseil scolaire francophone de la Colombie‐Britanique (also known as Francophone Education Authority or School District No. 93) is the French‐language school board for all French schools located in British Columbia. Unlike the other school boards in British Columbia, this school board does not cover a specific geographic area, but instead takes ownership of schools based solely on language. The board of education for School District No. 93 helps ensure those with constitutional rights to minority language education under section 23 of the Canadian Charter of Rights and Freedoms receive it. Since its creation in 1995, the Conseil scolaire francophone de la Colombie‐Britannique offers educational programs and services geared towards the growth and cultural promotion of the province’s Francophone learners. An active partner in the development of British Columbia’s Francophone community, the Conseil has presently in its system, and distributed across 78 communities in the province, over 4,350 students and 38 schools, which includes 23 homogeneous schools.
Page 189 EDU-2013-00071 - PHASE 1
Partner Group: Fédération des parents francophones
de la Colombie‐Britannique Denis Roux, Présidente Denis L. Gendron, Trésorier Contact Info: 223–1555, 7e Avenue Ouest 604‐736‐5056
Vancouver BC V6J 1S1 Description from Website: (www.fpfcb.bc.ca) The Fédération des parents francophones de la Colombie‐Britannique (FPFCB) is the provincial organization that represents all parents whose children attend a francophone school or preschool. The mission of British Columbia’s Fédération des parents Francophones is to support BC Francophone parents:
• in their role as first educators of their children; and • in establishing the educational and community foundations that will support the
development of children and families within the French language and culture. Mandate The mandate of Fédération des parents francophones de la Colombie‐Britannique includes the following:
• Provide support and training to local parent advisory councils; • Negotiate on their behalf with decision‐making authorities; • Promote the importance of early childhood education; • Promote a common vision of early childhood education among stakeholder groups; • Identify overall needs with regard to services and programs for early childhood
education; • Facilitate and coordinate the efforts and actions of stakeholders; • Participate in provincial partnerships with regard to early childhood education, as well
as elementary and secondary education; • Undertake research and development in the field of policies and programs in French
education for children and families in British Columbia
Page 190 EDU-2013-00071 - PHASE 1
Partner Group: BC Student Voice
Sharon Cutcliffe, Manager [email protected]
Linda Dinsmore, Senior Administrative Assistant [email protected]
Contact Info: 200 ‐ 525 West 10th Avenue Vancouver, BC V5Z 1K9 (bcpvpa)
Description from Website: (bcstudentvoice.com)
Who are we?
Students leading with one voice in co‐operation with educators through mutual respect and support.
Our history
In 1990, a group of dedicated students and educators saw a need for enhancing student leadership in British Columbia. The B.C. Principals’ & Vice‐Principals’ Association, with the support of the Ministry of Education, assisted the group in launching a concept called BC Student Voice. Since then, the Voice has grown to represent all regions across the province. BC Student Voice has placed representatives on provincial Ministry of Education committees and represented student opinion at regional and provincial meetings. BC Student Voice has developed its own vision, mission and goals. Supported by adult advisors, students meet regularly to review provincial education directions, gather support for their various regional initiatives and facilitate developments of school and district student voices.
Goals
• To increase the awareness of BC Student Voice throughout the province. • To establish broad representation of students for the provincial BC Student Voice by
creating a regional representative network throughout the province. • To communicate information about BC Student Voice with all partners in education. • To encourage all members of BC Student Voice to meet with their principals and vice‐
principals to discuss further involvement of students and methods of networking with other schools.
• To increase awareness and understanding, and to facilitate positive change in social issues.
Page 191 EDU-2013-00071 - PHASE 1

Partner Group: Business Council of British Columbia Greg D’Avignon, President & CEO Barbara McNicholls, Executive Assistant to President Contact Info: 1050 West Pender St Suite 810 604 684 3384
Vancouver BC V6E 3S7
Description from Website: (www.bcbc.com)
Mission The Business Council of British Columbia aims to produce timely and exceptional public‐policy research and advice on issues to enhance BC’s competitiveness and prosperity. As a collaborative, non‐partisan organization, the Council strives to be a venue where members, policy experts, elected officials and government decision makers can address problems and form solutions together.
The Council works collaboratively with a committed membership that includes BC’s top employers to ensure that its work is credible, timely and relevant. Through diligent, evidence‐based research and interactive input from members and policy leaders, the Council provides informed, pertinent insight and advice to BC’s top decision makers, with the objective to create a prosperous and sustainable economy for all British Columbians.
History The Business Council of British Columbia was formed in 1966 as the Commercial and Industrial Research Foundation with a mission to advance BC’s economic development and improve relations with communities and governments. The group changed its name to the Business Council in 1984 and began working on a broader range of issues, including environmental matters, energy, First Nations, technology and innovation.
The Council has grown from 43 member companies in its first year to about 250 today. The Council’s membership consists of BC’s top employers, including companies from all of BC’s major economic sectors. Collectively, they are responsible for roughly a quarter of all jobs in BC. The Business Council has been a tireless advocate for competitive taxes, effective regulations, fiscally responsible government budgets and a well functioning set of government programs delivering education, health care and other services to citizens. Several landmark projects – including the 1998 and 2000/01 Business Summits; the Outlook 2020 series in the late 2000s and the Council’s newly launched BC Agenda for Shared Prosperity – demonstrate the Council’s ability to act as an effective and innovative voice for the business community in promoting a competitive economy that generates prosperity for all British Columbians.
Page 192 EDU-2013-00071 - PHASE 1
Updated April 2013
Page 1 of 2
BRIEFING NOTE BC Teachers’ Council
Legislative Authority: Teachers Act, s. 9.
Mandate:
The BC Teachers' Council (BCTC) establishes standards for the conduct, competence and education of teachers and approves post‐secondary teacher education programs with respect to the certification standards.
Background
On January 9, 2012 the Teachers Act came into force, repealing the Teaching Profession Act and dissolving the BC College of Teachers. It brought in a regulatory model with responsibility shared by five distinct bodies and administered by the Ministry of Education’s Teacher Regulation Branch.
The BC Teachers’ Council is part of this new regulatory framework.
Structure
The BCTC is made up of the following members:
• 5 members elected by teachers
• 1 non‐voting senior government appointee who reports to the Minister on activities of the BCTC
• 3 BC Teachers’ Federation (BCTF) nominees appointed by the Minister
• 7 other education partner nominees appointed by the Minister
Current Ministry Appointees:
Name: Appointed: Expiry:
Claire Avison (non‐voting Ministry representative) April 23, 2012 At pleasure
Rebecca Blair April 23, 2013 April 23, 2014
Daniel A.J. Blais April 23, 2013 April 23, 2016
Lynn Bosetti April 23, 2012 April 23, 2014
Glen Hansman April 23, 2013 April 23, 2016
Patricia Haslop April 23, 2012 April 23, 2014
Page 193 EDU-2013-00071 - PHASE 1
Updated April 2013
Page 2 of 2
Andrew Leathwood April 23, 2012 April 23, 2015
Montgomery Palmantier April 23, 2012 April 23, 2014
Teresa Rezansoff April 23, 2012 April 23, 2015
Blanche (Christine) Stewart April 23, 2013 April 23, 2015
Ann M. Whiteaker April 23, 2013 April 23, 2016
Elected Members (elected for three year terms)
Name Zone
Bruce Cummings Interior Zone
Laurence Greeff Fraser Zone
Avinash Gupta Northern Zone
John Hall Vancouver Coastal Zone
Fred Robertson Vancouver Island Zone
Appointments required:
No appointments are required at this time.
Issue(s):
• There are no emergent issues regarding the BC Teachers’ Council.
Key Contact:
Name: Christina Zacharuk
Title: Executive Director, Teacher Regulation Branch
Phone: 604‐714‐3306
Cell:
Page 194 EDU-2013-00071 - PHASE 1
S17
Updated April 2013
Page 1 of 2
BRIEFING NOTE Board of Examiners
Legislative Authority: School Act, section 174
Mandate:
The Board of Examiners provides professional advice to the ministry concerning the administration and procedures related to provincial examinations.
Background
The Lieutenant Governor in Council has authority to appoint members to the Board of Examiners under s. 174 of the School Act.
The Board is not currently meeting.
Structure
Legislation requires that the board include at least one representative from the Ministry of Education and one representative from B.C.’s universities.
Current Appointees:
Current Members
Name: Title Appointed: Expiry:
Nancy Walt Government Rep September 22, 2011 At Pleasure James, F. Colin Educational Consultant
University Representative September 30, 2010 September 30, 2013
Appointments required:
• No appointments are required at this time.
Issue(s):
• Since its inception, the Board of Examiners has evolved both in membership and mandate. The original intent of the Board was to provide assessment expertise to the Ministry during the implementation of the provincial exam program in 1984. The Board provided assessment expertise that the Ministry did not have in‐house at the time, and it gave credibility to the provincial examinations program. The original Board of Examiners met after every exam session to corroborate the standards and approve the release of results.
Page 195 EDU-2013-00071 - PHASE 1
Updated April 2013
Page 2 of 2
• As the provincial exam program evolved from three paper‐based sessions per year to seven primarily electronic sessions, as provincial exams were more fully implemented in the field, and as assessment expertise was attained in‐house, the Board changed from a hands‐on panel of experts to a committee acting in an advisory capacity.
• The Board is not actively meeting at this time.
• The Learning Division is considering options for the future role of this board, particularly in the context of personalized learning.
Key Contact:
Name: Nancy Walt
Title: Director, Curriculum and Assessment
Phone: 250 217‐4978
Page 196 EDU-2013-00071 - PHASE 1
Updated April 2013
Page 1 of 2
BRIEFING NOTE Disciplinary and Professional Conduct Board
Legislative Authority: Teachers Act, s. 26, s. 57, s. 73.
Mandate:
Members of the Disciplinary and Professional Conduct Board (DPCB) hear and decide matters related to teacher conduct, competence and certification appeals.
Background
The Teachers Act sets out the regulatory framework for teachers in the province, creating a system where reports and complaints about teacher conduct or competence can be resolved. The Commissioner, Teacher Regulation is responsible for overseeing the disciplinary processes, including receiving reports and complaints about teacher conduct and competence and determining if further action is required.
If, through the course of the review process, the Commissioner determines that a hearing is required, he or she establishes 3‐person hearing panels from amongst the DPCB members and the public pool of adjudicators available for the Commissioner to appoint to hearing panels. Panels cannot have more than one BCTF member.
Panel members consider evidence and interpret and apply the professional standards. If a panel finds the teacher failed to meet the standards, it must fairly determine appropriate consequences, which can include suspension, cancellation or imposition of terms on a teacher’s certificate.
Structure
The DPCB is made up of nine members of the BC Teachers’ Council:
• five DPCB members must be selected from those BCTC members who were nominated by education partners;
• four must be certificate holders selected from the BCTF members; and
• one must have substantial knowledge of and experience in the independent school system.
The Commissioner may also select a person from the public pool of adjudicators to sit on a disciplinary and professional conduct panel or certification appeal panel.
Page 197 EDU-2013-00071 - PHASE 1
Updated April 2013
Page 2 of 2
Current Ministry Appointees:
Name: Appointed: Expiry:
Daniel A.J. Blais April 23, 2013 April 23, 2016
Lynn Bosetti April 23, 2013 April 23, 2014
Patricia Haslop April 23, 2012 April 23, 2014
Andrew Leathwood April 23, 2012 April 23, 2015
Teresa Rezansoff April 23, 2012 April 23, 2015
Avinash Gupta April 23, 2012 April 23, 2014
Bruce Cummings May 30, 2012 April 23, 2014
Fred Robertson April 23, 2012 April 23, 2014
John Hall April 23, 2012 April 23, 2014
Appointments required:
No appointments are required at this time.
Issue(s):
• There are no emergent issues with the Disciplinary and Professional Conduct Board.
Key Contact:
Name: Christina Zacharuk
Title: Executive Director, Teacher Regulation Branch
Phone: 604‐714‐3306
Cell:
Page 198 EDU-2013-00071 - PHASE 1
S17
Updated April 2013
Page 1 of 2
BRIEFING NOTE Independent School Teaching Certificate Standards Committee
Legislative Authority: Section 5 of the Independent School Act (ISA)
Mandate:
The Independent School Teaching Certificate Standards Committee (ISTCSC) establishes the standards that must be met for a person to be issued, and maintain, an independent school teaching certificate. It also determines the standards that must be met for each type of independent school teaching certificate.
Background
Until the Teachers Act was brought into force in January 2012, this committee made recommendations to the Inspector of Independent Schools about the issuance, suspension, or revocation of independent school teaching certificates.
Under the Teachers Act, the Director of Certification is now responsible for issuing all teaching credentials in BC, including independent school teaching certificates. Independent school teaching certificates are generally more restrictive than the general Certificate of Qualification; out of approximately 68,000 certificate holders in the province, approximately 2000 hold independent school teaching certificates. The Director of Certification must consult with the Inspector of Independent Schools prior to issuing an independent school teaching certificate. The responsibility for suspension or cancellation of an independent school teaching certificate now falls to the Disciplinary and Professional Conduct Board and the Commissioner, Teacher Regulation.
Historically committee members have been appointed by the Minister of Education on the mutual recommendation of the Inspector of Independent Schools and the Federation of Independent School Authorities.
Structure
The Committee is composed of members appointed by the Minister of Education. There is no fixed number of members or length of term specified in legislation. Committee members are drawn from various sectors of the independent school community.
Page 199 EDU-2013-00071 - PHASE 1
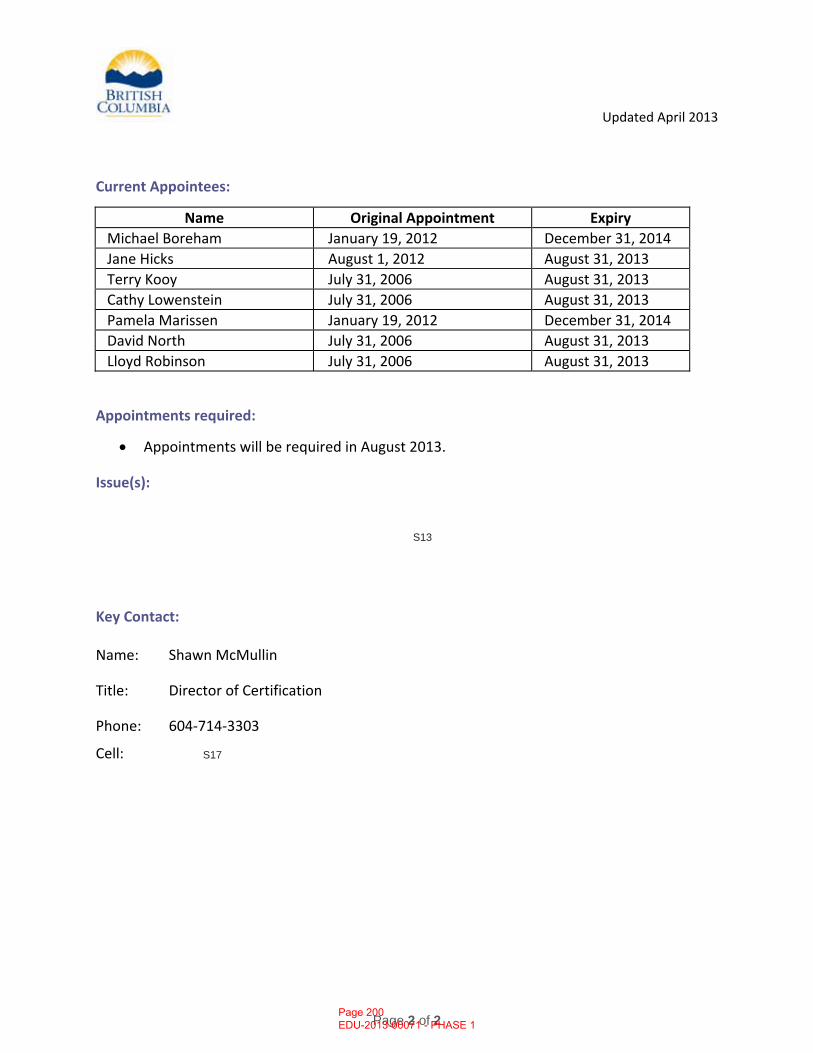
Updated April 2013
Page 2 of 2
Current Appointees:
Name Original Appointment Expiry Michael Boreham January 19, 2012 December 31, 2014 Jane Hicks August 1, 2012 August 31, 2013 Terry Kooy July 31, 2006 August 31, 2013 Cathy Lowenstein July 31, 2006 August 31, 2013 Pamela Marissen January 19, 2012 December 31, 2014 David North July 31, 2006 August 31, 2013 Lloyd Robinson July 31, 2006 August 31, 2013
Appointments required:
• Appointments will be required in August 2013.
Issue(s):
Key Contact:
Name: Shawn McMullin
Title: Director of Certification
Phone:
Cell:
604‐714‐3303
Page 200 EDU-2013-00071 - PHASE 1
S13
S17
Updated April 2013
Page 1 of 3
STATUTORY COMMITTEE SUMMARY NOTE Tripartite Education Framework Agreement Implementation
Committees
Legislative Authority:
The Tripartite Education Framework Agreement (TEFA) was signed by the governments of BC and Canada and the First Nations Education Steering Committee (FNESC) on January 27, 2012; “In the event of an inconsistency between this agreement and federal education policy or guidelines of general application, the provisions of this agreement shall prevail”.
Mandate:
TEFA outlines the roles, responsibilities, and commitments of the three parties in pursuit of improved educational outcomes for students studying on reserve in BC’s First Nation band‐operated schools. An Oversight Committee came together to advise a Working Group and generally ensure the three signatories are working together.
Background
TEFA includes provisions moving Aboriginal Affairs and Northern Development Canada (AANDC) to fund on‐reserve schools at a rate comparable to similarly situated B.C. public schools.
B.C.’s commitments under TEFA are those the Province volunteered in the 2006 jurisdiction agreements, including supporting the transfer of students at similar levels of achievement and creating with FNESC a process to issue the Dogwood to students who have attained outcomes comparable to Ministry graduation requirements.
At the same time, TEFA formalized the Ministry’s practice of consulting with FNESC so that BC is now obligated to consult FNESC concerning potential changes to provincial education funding, legislation, policy, and standards, just as it is obligated to work collaboratively, to share expertise, and to provide, where possible, free access to provincial learning resources.
Structure
Oversight Committee membership includes senior representation from the signatories of TEFA. Those individuals, listed here, often bring one or several staff members to support them during the committee’s quarterly meetings. Of course, a few send surrogates, such as Tyrone McNeil, who has been represented by Nathan Matthew.
Page 201 EDU-2013-00071 - PHASE 1
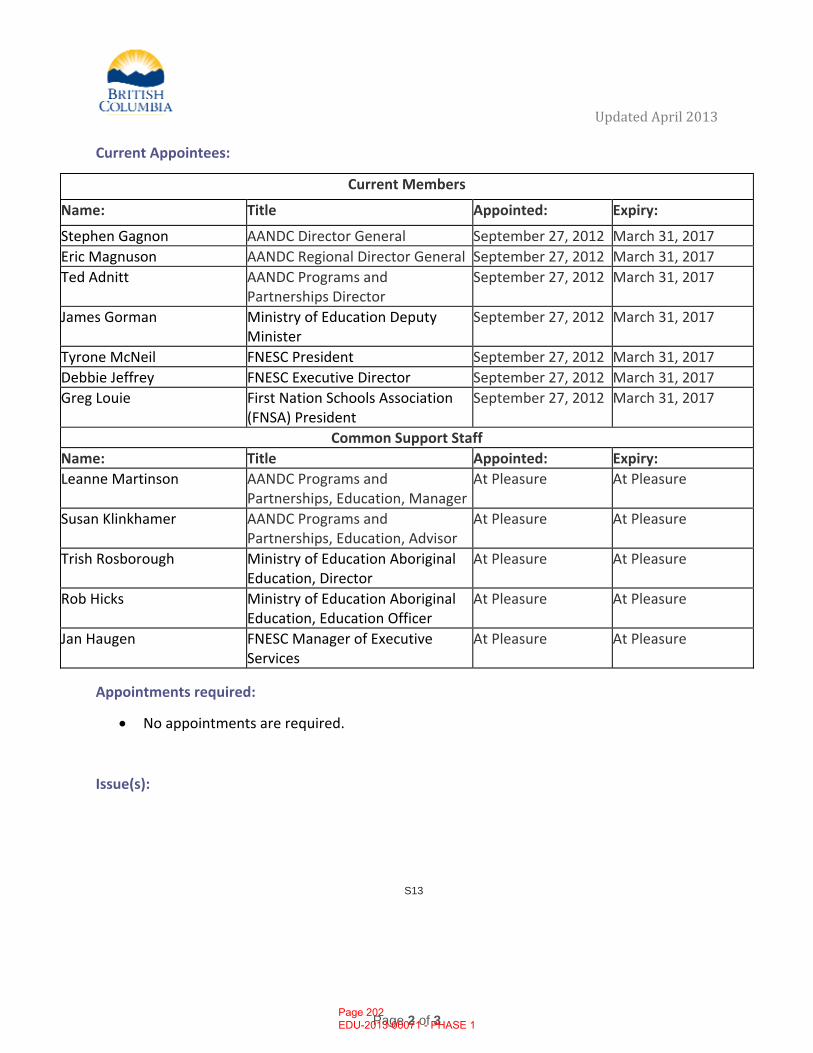
Updated April 2013
Page 2 of 3
Current Appointees:
Current Members
Name: Title Appointed: Expiry:
Stephen Gagnon AANDC Director General September 27, 2012 March 31, 2017 Eric Magnuson AANDC Regional Director General September 27, 2012 March 31, 2017 Ted Adnitt AANDC Programs and
Partnerships Director September 27, 2012 March 31, 2017
James Gorman Ministry of Education Deputy Minister
September 27, 2012 March 31, 2017
Tyrone McNeil FNESC President September 27, 2012 March 31, 2017 Debbie Jeffrey FNESC Executive Director September 27, 2012 March 31, 2017 Greg Louie First Nation Schools Association
(FNSA) President September 27, 2012 March 31, 2017
Common Support Staff Name: Title Appointed: Expiry: Leanne Martinson AANDC Programs and
Partnerships, Education, ManagerAt Pleasure At Pleasure
Susan Klinkhamer AANDC Programs and Partnerships, Education, Advisor
At Pleasure At Pleasure
Trish Rosborough Ministry of Education Aboriginal Education, Director
At Pleasure At Pleasure
Rob Hicks Ministry of Education Aboriginal Education, Education Officer
At Pleasure At Pleasure
Jan Haugen FNESC Manager of Executive Services
At Pleasure At Pleasure
Appointments required:
• No appointments are required.
Issue(s):
Page 202 EDU-2013-00071 - PHASE 1
S13
Updated April 2013
Page 3 of 3
Key Contact:
Name: Trish Rosborough
Title: Director, Aboriginal Education
Phone: 250 356‐1891
Page 203 EDU-2013-00071 - PHASE 1
S13

Ministry of Education Our People – by the numbers
Highlights • The Ministry has 313 staff. • Operations in Victoria (267 staff) and Vancouver (46). • The Teacher Regulation Branch (formerly the BC College of Teachers) moved into the Ministry in
January 2012, bringing 43 staff with them. • Education has five divisions, headed up by four ADMs and a Superintendent. • The position of ADM, Resource Management Division is currently vacant due to a retirement in
March. • There are eight Superintendents in the Ministry – a combination of secondments and regular
employees. • Since the hiring freeze took effect on September 13, 2012, the Ministry has 31 vacancies or 9%
of our workforce. • Vacancy rate in the Ministry is nine percent, Victoria 6%, Vancouver 19%. • One staffing request has gone forward since the hiring freeze – for positions related to student
safety and teacher investigations in the Teacher Regulation Branch.
Our People – Transforming our work and our skills Over the past year, the Ministry has undergone many changes. Many of our staff now work in a mobile and increasingly collaborative and flexible environment. We created BC’s Education Plan, which has been guiding much of our work. Not only has the nature of our work shifted significantly over the past two years to support transformation in the education sector, but so has the structure and physical environment of the Ministry. These changes support our move to become a more flexible, dynamic, collaborative and innovative workplace that supports education transformation. This change has presented short‐term challenges, such as staff needing to reorient themselves to their work environment, learning how to work in their new spaces, and learning how to use new collaborative and electronic tools. We have downsized the building footprint in Victoria from four to one, so naturally a time of adjustment is required. Our staff have shown remarkable resilience and professionalism through this transition phase, and we have supported them through training on the new tools, engaging them in the workplace redesign, and working with supervisors on how to effectively supervise in a mobile environment. Government also took over operations of the former BC College of Teachers, in part because it was found in the Avison Report to not be sufficiently taking into account the public interest with respect to the disciplining of teachers and safeguarding of students. The area of teacher discipline is one that the media follow and report on regularly. The transfer of the BC College of Teachers into government (now called the Teacher Regulation Branch) was very public, and commitments to improve public confidence were made by the Minister of Education.
Page 204 EDU-2013-00071 - PHASE 1
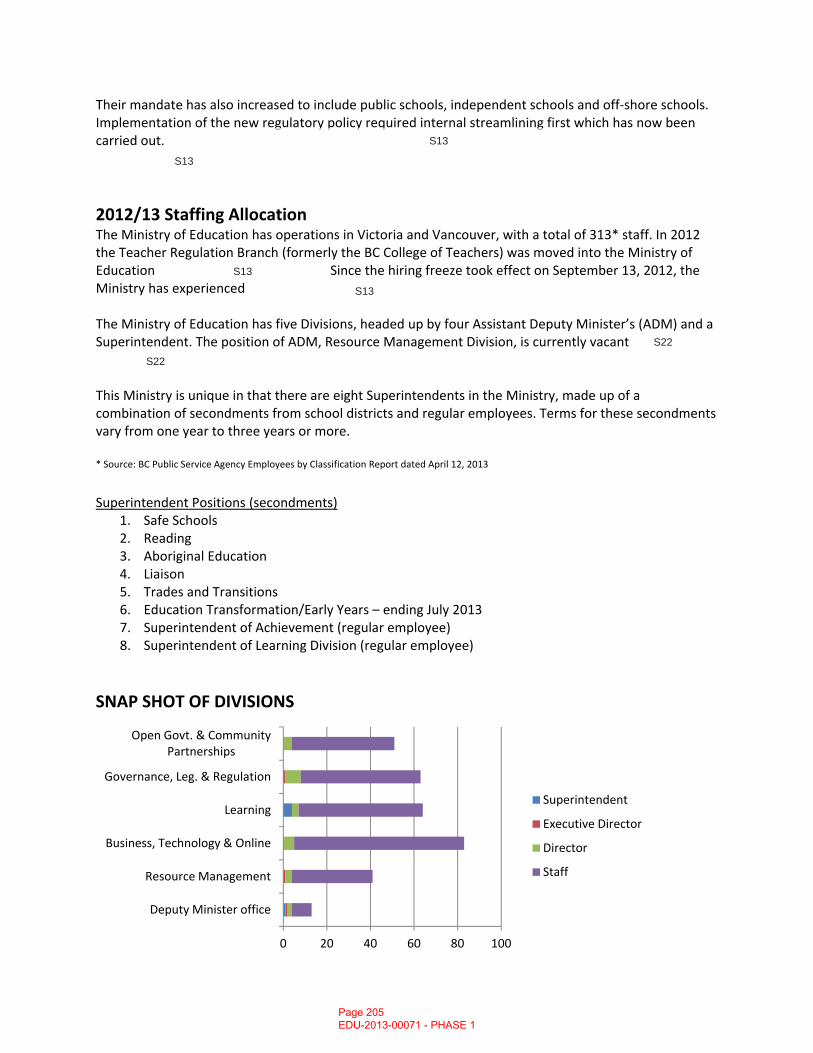
Their mandate has also increased to include public schools, independent schools and off‐shore schools. Implementation of the new regulatory policy required internal streamlining first which has now been carried out.
2012/13 Staffing Allocation The Ministry of Education has operations in Victoria and Vancouver, with a total of 313* staff. In 2012 the Teacher Regulation Branch (formerly the BC College of Teachers) was moved into the Ministry of Education Since the hiring freeze took effect on September 13, 2012, the Ministry has experienced The Ministry of Education has five Divisions, headed up by four Assistant Deputy Minister’s (ADM) and a Superintendent. The position of ADM, Resource Management Division, is currently vacant
This Ministry is unique in that there are eight Superintendents in the Ministry, made up of a combination of secondments from school districts and regular employees. Terms for these secondments vary from one year to three years or more. * Source: BC Public Service Agency Employees by Classification Report dated April 12, 2013
Superintendent Positions (secondments)
1. Safe Schools 2. Reading 3. Aboriginal Education 4. Liaison 5. Trades and Transitions 6. Education Transformation/Early Years – ending July 2013 7. Superintendent of Achievement (regular employee) 8. Superintendent of Learning Division (regular employee)
SNAP SHOT OF DIVISIONS
0 20 40 60 80 100
Deputy Minister office
Resource Management
Business, Technology & Online
Learning
Governance, Leg. & Regulation
Open Govt. & Community Partnerships
Superintendent
Executive Director
Director
Staff
Page 205 EDU-2013-00071 - PHASE 1
S13
S13
S13
S22
S22
S13
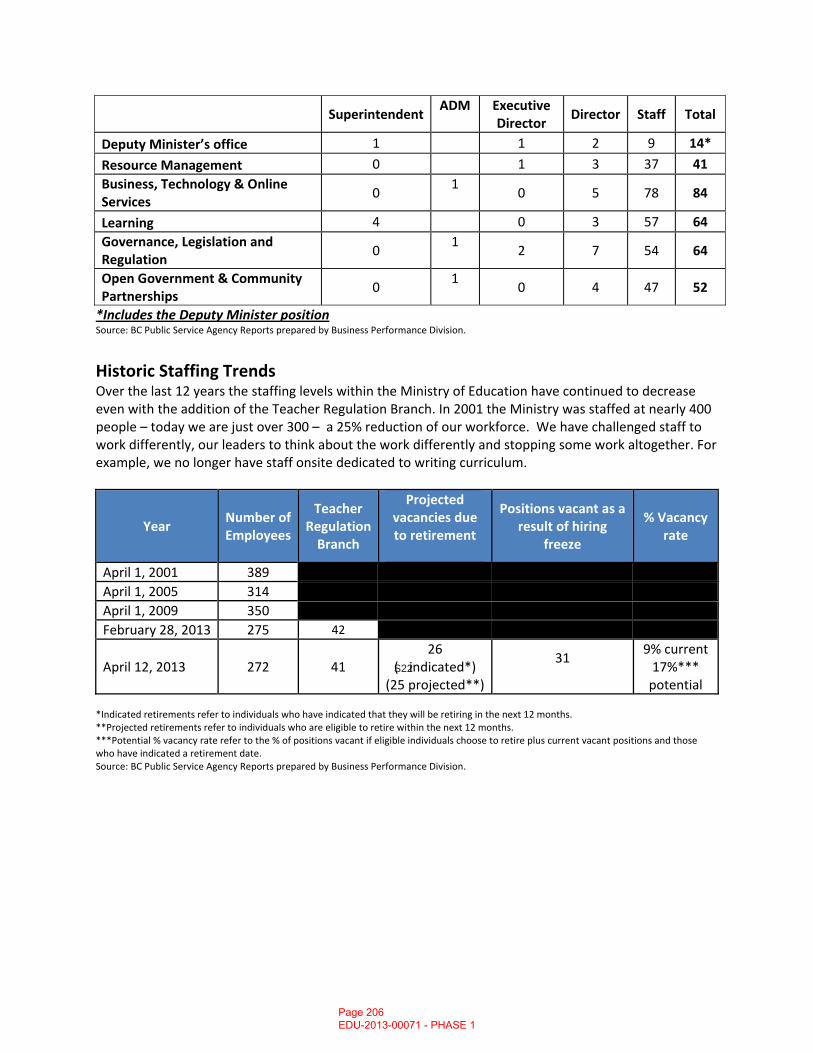
SuperintendentADM Executive
Director Director Staff Total
Deputy Minister’s office 1 1 2 9 14*
Resource Management 0 1 3 37 41 Business, Technology & Online Services
0 1
0 5 78 84
Learning 4 0 3 57 64 Governance, Legislation and Regulation
0 1
2 7 54 64
Open Government & Community Partnerships
0 1
0 4 47 52
*Includes the Deputy Minister position Source: BC Public Service Agency Reports prepared by Business Performance Division.
Historic Staffing Trends Over the last 12 years the staffing levels within the Ministry of Education have continued to decrease even with the addition of the Teacher Regulation Branch. In 2001 the Ministry was staffed at nearly 400 people – today we are just over 300 – a 25% reduction of our workforce. We have challenged staff to work differently, our leaders to think about the work differently and stopping some work altogether. For example, we no longer have staff onsite dedicated to writing curriculum.
Year Number of Employees
Teacher Regulation Branch
Projected vacancies due to retirement
Positions vacant as a result of hiring
freeze
% Vacancy rate
April 1, 2001 389
April 1, 2005 314
April 1, 2009 350
February 28, 2013 275 42
April 12, 2013 272 41 26
( indicated*) (25 projected**)
31
9% current17%*** potential
*Indicated retirements refer to individuals who have indicated that they will be retiring in the next 12 months. **Projected retirements refer to individuals who are eligible to retire within the next 12 months. ***Potential % vacancy rate refer to the % of positions vacant if eligible individuals choose to retire plus current vacant positions and those who have indicated a retirement date. Source: BC Public Service Agency Reports prepared by Business Performance Division.
Page 206 EDU-2013-00071 - PHASE 1
S22
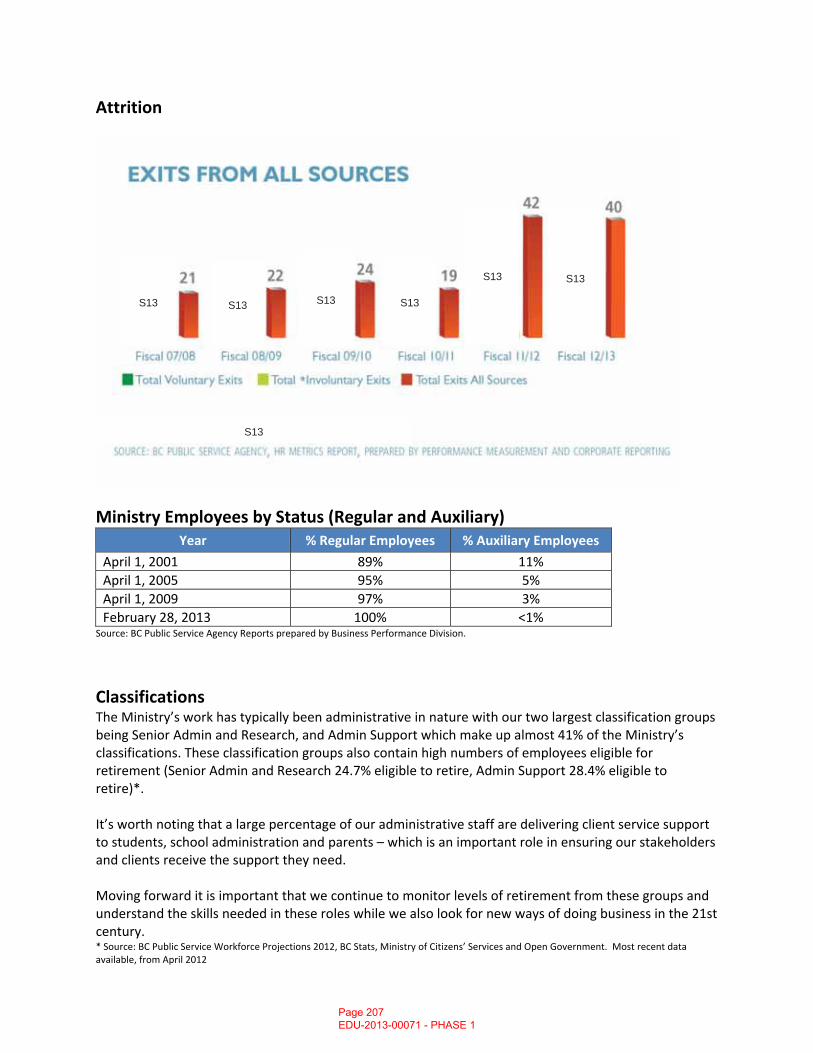
Attrition
Ministry Employees by Status (Regular and Auxiliary) Year % Regular Employees % Auxiliary Employees
April 1, 2001 89% 11% April 1, 2005 95% 5% April 1, 2009 97% 3%February 28, 2013 100% <1%
Source: BC Public Service Agency Reports prepared by Business Performance Division.
Classifications The Ministry’s work has typically been administrative in nature with our two largest classification groups being Senior Admin and Research, and Admin Support which make up almost 41% of the Ministry’s classifications. These classification groups also contain high numbers of employees eligible for retirement (Senior Admin and Research 24.7% eligible to retire, Admin Support 28.4% eligible to retire)*. It’s worth noting that a large percentage of our administrative staff are delivering client service support to students, school administration and parents – which is an important role in ensuring our stakeholders and clients receive the support they need. Moving forward it is important that we continue to monitor levels of retirement from these groups and understand the skills needed in these roles while we also look for new ways of doing business in the 21st century. * Source: BC Public Service Workforce Projections 2012, BC Stats, Ministry of Citizens’ Services and Open Government. Most recent data available, from April 2012
Page 207 EDU-2013-00071 - PHASE 1
S13 S13 S13 S13
S13 S13
S13
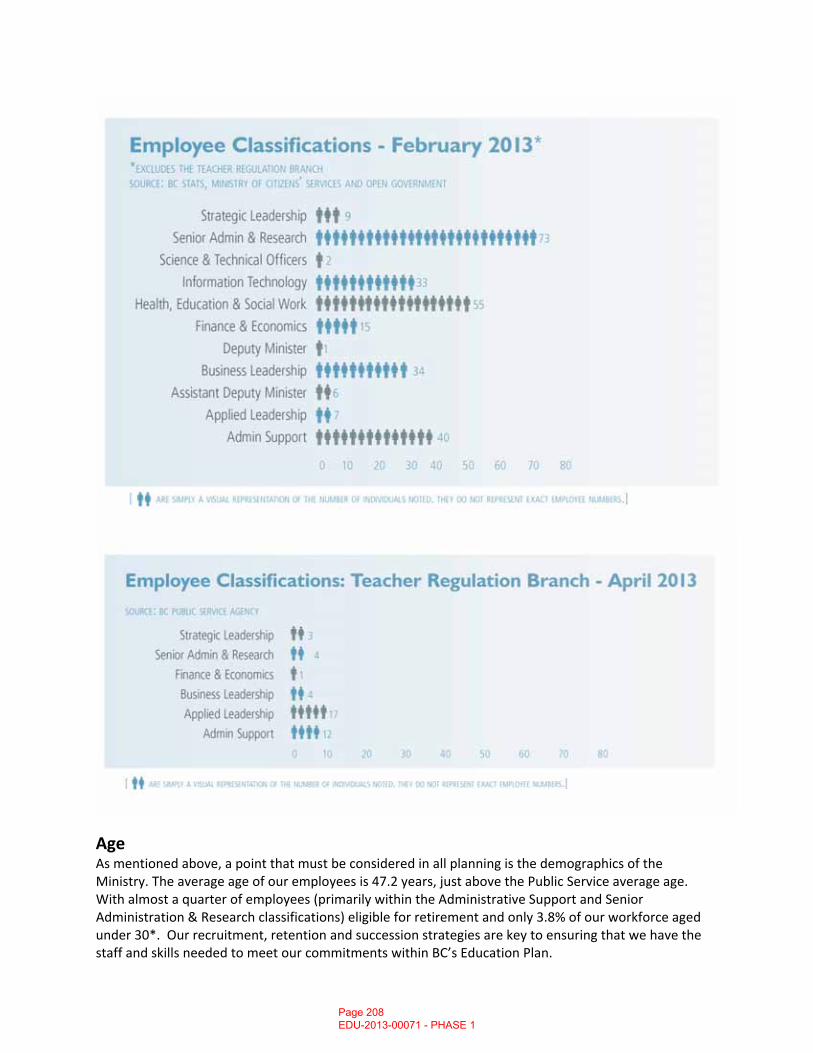
Age As mentioned above, a point that must be considered in all planning is the demographics of the Ministry. The average age of our employees is 47.2 years, just above the Public Service average age. With almost a quarter of employees (primarily within the Administrative Support and Senior Administration & Research classifications) eligible for retirement and only 3.8% of our workforce aged under 30*. Our recruitment, retention and succession strategies are key to ensuring that we have the staff and skills needed to meet our commitments within BC’s Education Plan.
Page 208 EDU-2013-00071 - PHASE 1
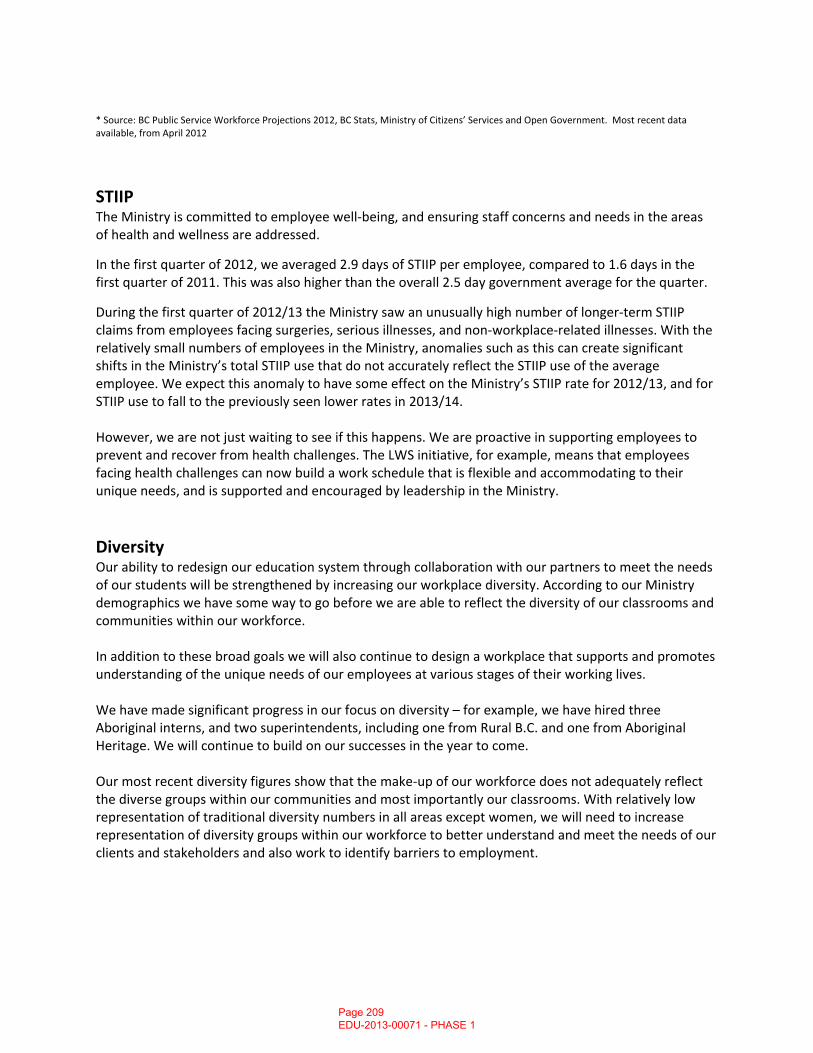
* Source: BC Public Service Workforce Projections 2012, BC Stats, Ministry of Citizens’ Services and Open Government. Most recent data available, from April 2012
STIIP The Ministry is committed to employee well‐being, and ensuring staff concerns and needs in the areas of health and wellness are addressed.
In the first quarter of 2012, we averaged 2.9 days of STIIP per employee, compared to 1.6 days in the first quarter of 2011. This was also higher than the overall 2.5 day government average for the quarter.
During the first quarter of 2012/13 the Ministry saw an unusually high number of longer‐term STIIP claims from employees facing surgeries, serious illnesses, and non‐workplace‐related illnesses. With the relatively small numbers of employees in the Ministry, anomalies such as this can create significant shifts in the Ministry’s total STIIP use that do not accurately reflect the STIIP use of the average employee. We expect this anomaly to have some effect on the Ministry’s STIIP rate for 2012/13, and for STIIP use to fall to the previously seen lower rates in 2013/14. However, we are not just waiting to see if this happens. We are proactive in supporting employees to prevent and recover from health challenges. The LWS initiative, for example, means that employees facing health challenges can now build a work schedule that is flexible and accommodating to their unique needs, and is supported and encouraged by leadership in the Ministry.
Diversity Our ability to redesign our education system through collaboration with our partners to meet the needs of our students will be strengthened by increasing our workplace diversity. According to our Ministry demographics we have some way to go before we are able to reflect the diversity of our classrooms and communities within our workforce. In addition to these broad goals we will also continue to design a workplace that supports and promotes understanding of the unique needs of our employees at various stages of their working lives. We have made significant progress in our focus on diversity – for example, we have hired three Aboriginal interns, and two superintendents, including one from Rural B.C. and one from Aboriginal Heritage. We will continue to build on our successes in the year to come. Our most recent diversity figures show that the make‐up of our workforce does not adequately reflect the diverse groups within our communities and most importantly our classrooms. With relatively low representation of traditional diversity numbers in all areas except women, we will need to increase representation of diversity groups within our workforce to better understand and meet the needs of our clients and stakeholders and also work to identify barriers to employment.
Page 209 EDU-2013-00071 - PHASE 1
Our People – moving forward Ensuring that we are filling needs within the organization with the right talent will be an important element in moving forward. Hiring practices will be reflective of the transformational nature of our organization, requiring skills that were not as important as before. Dealing with a high number of retirements and working towards a smaller workforce will result in fewer positions being available for competition. This will result in increased applications to job postings, which will increase the competitive nature of the hiring process. Priorities that may pose challenges include attracting employees from rural and remote areas. As we move forward it is important to include knowledge and experiences from these areas to ensure that we are reflective when creating policy, performance standards and curriculum. This is also true for reflecting ethnic, Aboriginal and people with special needs within our workplace. Leading Workplace Strategies The traditional classroom is being transformed, enabled and enhanced by electronic tools. There is growing recognition that there are many different ways for students to learn and achieve the same objectives. The integration of technology into everyday learning is increasing the flexibility of the education system to meet the diverse learning needs of our students.
Technological advances have also provided us the opportunity to re‐examine the way we work with each other within the Ministry, and with our education partners. Driven by a desire to model the changes now occurring within B.C.’s schools, the Ministry became an early adopter of Leading Workplace Strategies (LWS).
By September 2012 – about 16 months after the process began – we completed our LWS implementation in Victoria. This has resulted in all Victoria‐based staff working out of one location – not the four we started with.
More significantly, the Ministry has partnered this physical transformation with significant change in office culture, moving closer towards our goal of creating a more flexible, collaborative, and results focused work place. More than 60% of our employees now have the tools to work anywhere, allowing for increased collaboration, mobility and flexibility.
While the physical transformation of our Victoria workspace is nearly complete, the Ministry must continue to support this major shift in our organizational culture. In order to benefit fully, managers and their teams must be supported to work differently. Promoting an environment of trust is key, as we shift away from the idea that teams must be physically close to one another in order to meet work objectives. We must become fully proficient in the use of collaborative tools so we maximize our ability to work differently (and to keep up with the students).
Employee involvement has been critical to our LWS implementation and we will continue to engage with employees around LWS, as everyone transitions and adjusts to the new workplace.
Page 210 EDU-2013-00071 - PHASE 1
LIBRARIES AND LITERACY PARTNER ORGANIZATIONS – April 2013
Libraries and Literacy Partner Organizations at a Glance: • Association of BC Public Library Directors (ABCPLD) • BC Campus • BC Electronic Library Network (BCELN) • BC Libraries Cooperative • BC Library Association (BCLA) • BC Library Trustees Association (BCLTA) • BC Teacher Librarian Association (BCTLA) • Decoda Literacy Solutions • Irving K. Barber Learning Center at UBC • Provincial and Territorial Public Library Council (PTPLC) • The iSchool at UBC School of Library, Archival & Information Studies
Association of BC Public Library Directors (ABCPLD) The Association of British Columbia Public Library Directors (ABCPLD) is an executive association of public library directors in BC who represents the staff and professional functions of librarianship. It serves as a vehicle for information exchange among directors, represents the concerns of directors to both provincial and federal governments and provides a practical means of attaining cooperative solutions among BC public libraries.
Contact Information:
Rob O'Brennan, Chair CEO Fraser Valley Regional Library Email: [email protected] Website: http://www.abcpld.org/
Maureen Sawa, Incoming Chair Director Greater Victoria Public Library Email: [email protected]
BC Campus BCcampus is a publicly funded organization that aims to bring together B.C.'s post-secondary system and make higher education available to everyone, through the smart use of collaborative information technology services. Programs and services offered through BCcampus are separated into three main areas: Student Services and Data Exchange, Curriculum Services and Applied Research, and Shared Services and Collaborative Programs.
Contact Information:
David Porter Executive Director Email: [email protected] Phone: 604-562-8344
Website: http://www.bccampus.ca/
Page 211 EDU-2013-00071 - PHASE 1
LIBRARIES AND LITERACY PARTNER ORGANIZATIONS – April 2013
BC Electronic Library Network (BCELN) The British Columbia Electronic Library Network (BC ELN) is a partnership between the Province of British Columbia and its post-secondary libraries. BC ELN’s purpose is to develop, promote and maintain system-wide mechanisms that allow post-secondary libraries to meet the expanding information needs of the province’s learners, educators, and researchers at the lowest possible cost. BC ELN operates with core funding from the Province of British Columbia, with additional project funding and staff time contributed by partner libraries.
The mission of BC ELN is to provide superior and equitable information access for all learners, educators, and researchers by extending the expertise and resources of the BC post-secondary libraries.
Contact Information:
Anita Cocchia Executive Director Email: [email protected] Phone: 778-782-7004 Website: http://www.eln.bc.ca/index.php
Page 212 EDU-2013-00071 - PHASE 1
LIBRARIES AND LITERACY PARTNER ORGANIZATIONS – April 2013
BC Libraries Cooperative The BC Libraries Cooperative (BCLC) is a non‐profit library-community enterprise, focussed on the delivery of shared operational infrastructure and resources for a diverse membership – nearly 100 institutions in the provinces of BC, Saskatchewan, Manitoba, Nova Scotia, Nunavut and the Yukon. BCLC works to improve efficiency, reduce costs and extend service delivery in libraries.
Libraries and Literacy works closely with the BC Libraries Cooperative to ensure a solid technological foundation for libraries through the Sitka Integrated Library System (ILS), database licensing, and other technical infrastructure.
Contact Information:
Ben Hyman Managing Director Email: [email protected] Phone: 1-855-383-5761 x 1001 Website: http://bc.libraries.coop/
BC Library Association (BCLA) The BCLA is a 700-member non-profit association that encourages library organization and development throughout British Columbia by: coordinating library services in various parts of the province, creating friendly and helpful cooperation between libraries, maintaining contact with similar organizations throughout Canada and elsewhere, and advancing by education, research, friendly association and cooperative effort the mutual interest of all libraries and library personnel.
BCLA members include librarians, library personnel, library trustees and other interested individuals; corporate, government, school and academic libraries; publishers and library supply companies.
Contact Information:
Annette DeFaveri Executive Director Email: [email protected] Phone: 604-683-5354 or 1-888-683-5354 Website: http://www.bcla.bc.ca
Allie Douglas Office Manager [email protected] 604-683-5354 or 1-888-683-5354
Page 213 EDU-2013-00071 - PHASE 1
LIBRARIES AND LITERACY PARTNER ORGANIZATIONS – April 2013
BC Library Trustees Association (BCLTA)
The BCLTA represents the boards and trustees that govern local public libraries in British Columbia. They represent 70 library boards and more than 650 library trustees who volunteer their time on library boards throughout the province. They offer an annual conference, training workshops, awards, a newsletter and support for library trustees.
The BCLTA works to support and represent trustees in advancing public libraries through programs such as trustee orientation training programs, information updates for members, and working with library funders and decision-makers.
Contact Information:
Lauren Wolf Executive Director Email: [email protected] Phone: 604-913-1424 or 1-888-206-1245 Website: http://www.bclta.ca/
BC Teacher Librarian Association (BCTLA) The BC Teacher-Librarians' Association is a provincial specialist association of the BC Teachers' Federation, that works to develop high standards of school library services in British Columbia. The BCLTA provides members with opportunities for grants and awards, access to professional development opportunities, information sharing for various library and literacy initiatives, other advocacy tool-kits, and links to current reports and research.
Contact Information:
Heather Daly President Email:Phone: 604-937-6380 Website: http://bctf.ca/bctla/
Page 214 EDU-2013-00071 - PHASE 1
S22
LIBRARIES AND LITERACY PARTNER ORGANIZATIONS – April 2013
Decoda Literacy Solutions Decoda Literacy Solutions is a non-profit literacy organization dedicated to promoting literacy programs across the province. Decoda partners closely with local businesses and multiple levels of government to provide funding and support for local literacy programs, as well as to establish a province-wide literacy network. Through a coordinated network of 102 task groups in 400 B.C. communities, they work with government, business and community organizations to achieve local literacy goals and to build vibrant and resilient communities, successful individuals and sustainable businesses.
Contact Information:
Brenda Le Clair Chief Executive Officer Email: [email protected] Phone: 604-681-4199 Website: http://decoda.ca/
Irving K. Barber Learning Center at UBC The Irving K. Barber Learning Centre is a public-oriented research centre at the University of British Columbia and is part of UBC’s broader library network. The Learning Centre focuses primarily on programs and services that enhance the learning capabilities and opportunities for the greater community, including people across British Columbia. It is intended to act as a public gateway both to the UBC library and to learning communities around the world.
Contact Information:
Simon Neame Director Email: [email protected] Phone: 604-822-3096 Website: www.ikebarberlearningcentre.ubc.ca
Page 215 EDU-2013-00071 - PHASE 1
LIBRARIES AND LITERACY PARTNER ORGANIZATIONS – April 2013
Provincial and Territorial Public Library Council (PTPLC) Established in 1978, the Provincial/Territorial Public Library Council acts as a forum where provincial and territorial public library agencies share experience, information, skills and resources. It facilitates the coordination of cross-jurisdictional initiatives and serves as a point of contact with national library organizations and the federal government. The PTPLC is a Director-level body.
Since 2005, the Council has facilitated the process by which Federal, Provincial and Territorial Ministers and/or Deputy Ministers responsible for public libraries can meet on shared library issues.
Contact Information:
Diana Davidson, Chair Director, Alberta Public Library Services Email: [email protected] Phone: 780-415-0284 Website: http://www.bclibraries.ca/ptplc/
BC Contact: Jacqueline van Dyk, BC Public Library Director Email: [email protected] Phone: 604-660-7346
The iSchool at UBC School of Library, Archival & Information Studies The iSchool at UBC is an internationally recognized school of library studies that works to train library professional professionals to exercise leadership in planning, implementing and promoting the preservation, organization and effective use of society's recorded information and ideas.
It is the largest library professional development program in BC, offering a master's degree in Library and Information Studies and a master's degree in Archival Studies, a multidisciplinary Master of Arts in Children's Literature, and other opportunities for post-master's study.
Contact Information:
Caroline Haythornthwaite Director and Professor Email: [email protected] Phone: 604-827-4790 Website: http://www.slais.ubc.ca/
Page 216 EDU-2013-00071 - PHASE 1
RURAL EDUCATION PARTNER ORGANIZATIONS – April 2013
Rural Education Partner Organizations at a Glance: • Aboriginal Enhancements Schools Network • Vancouver Island University (VIU), Faculty of Education • University of British Columbia Growing Innovation Partnership • Mitchell Odyssey Foundation • Rural Education Partners Council (REPC)
Aboriginal Enhancements Schools Network (part of the Network of Inquiry and Innovation) The Aboriginal Enhancement Schools Network is one of the networks that comprise the Networks of Inquiry and Innovations, which are designed to improve quality and equity through inquiry, teamwork across roles, schools and districts, and a concentrated focus on applying coaching forms of assessment to assist learners to take greater ownership of their learning. Participation in the Networks is on an annual basis and is voluntary. There has been a steady growth in Networks membership since its inception in 2000, with volunteer leaders in 16 regions of the province. Contact Information:
Dr. Judy Halbert Email:Phone:Website: http://www.viu.ca/education/vision.asp
Dr. Linda Kaser Email:
Vancouver Island University (VIU), Faculty of Education The Education Faculty at Vancouver Island University works with the Ministry of Education on a research partnership to improve the quality of Rural Education, based in part on recommendations within Enhancing Rural Learning: Report of the Task Force on Rural Education (2003). The purpose of the partnership is to improve understanding of how to:
• enhance literacy achievement for K-7, rural, Aboriginal students • reduce the ‘achievement gap’ between rural/urban and Aboriginal/ non-Aboriginal
students • develop recommendations to support future decision-making • develop mechanisms to support access to student achievement data beyond FSA results
The results of this project will be delivered to the Ministry in December of 2013. Contact Information:
Dr. Harry Janzen Email: [email protected] Phone: (250) 740-6220 Website: http://www.viu.ca/education/vision.asp
Dr. Paige Fisher Email: [email protected] Phone: (250) 753-3245
Page 217 EDU-2013-00071 - PHASE 1
S22S22
RURAL EDUCATION PARTNER ORGANIZATIONS – April 2013
University of British Columbia Growing Innovation Partnership Since 2010, the Ministry of Education has partnered with UBC’s Eleanor Rix Professor of Rural Education, Dr. Linda Farr Darling, to develop and award local innovation grants focused on improving the effectiveness of education in rural communities. The grants include funding for pilot program development and extension of successes to other areas. In March 2013, the Ministry of Education extended the Growing Innovation Program with: funding to: document the successes of the existing program; cultivate professionalism, leadership and learning communities; continue local innovation grants; improve focus on student outcomes; and create a comprehensive report of the program for the Ministry of Education.
Contact Information:
Dr. Linda Farr Darling, Professor, UBC Faculty of Education Email: [email protected] Phone: 604-822-909 Website: http://www.ruralteachers.com/growing-innovation-2011
Mitchell Odyssey Foundation The Mitchell Odyssey Foundation works to improve the accessibility of science and technology information in schools and to reawaken the natural wonder of students’ interest in science. The Foundation offers a number of programs, including the Odyssey Schools Program, that work toward this objective and partners with the Ministry of Education in supporting science education in rural schools and communities through enriched learning experiences at four Odyssey support schools, supports for schools partnering with the resource industry and scientists, and sharing of success stories in with the rural school community. Contact Information:
Cheryl Kristiansen Managing Director Email: [email protected] Phone: (604) 889-0530 Website: http://www.m-o-f.org
Page 218 EDU-2013-00071 - PHASE 1
RURAL EDUCATION PARTNER ORGANIZATIONS – April 2013
Rural Education Partners Council (REPC) In early spring 2012, and at the request of Education Minister George Abbott, MEd partnered with BCSTA to create a BC Rural Education Partners Council (REPC) for the purpose of providing a forum that focuses on the unique needs of rural BC students and communities by:
• identifying challenges and opportunities; • identifying and sharing promising practices; • advising the Minister of Education in the development and implementation of policies;
and • informing the work of its member organizations related to the provision of education in
rural communities. MEd is the sole funder of REPC, which has met three times since its inception. Considering that other provincial rural education partners also focus on rural implementation/policy issues (and tend to have well-established provincial networks and ‘shared responsibility’ funding models), the ministry is beginning to explore how the resources of rural partners can be best leveraged. Contact Information:
Stephen Hansen Executive Director, BCSTA Email: [email protected] Phone: 604-235-2299
Page 219 EDU-2013-00071 - PHASE 1
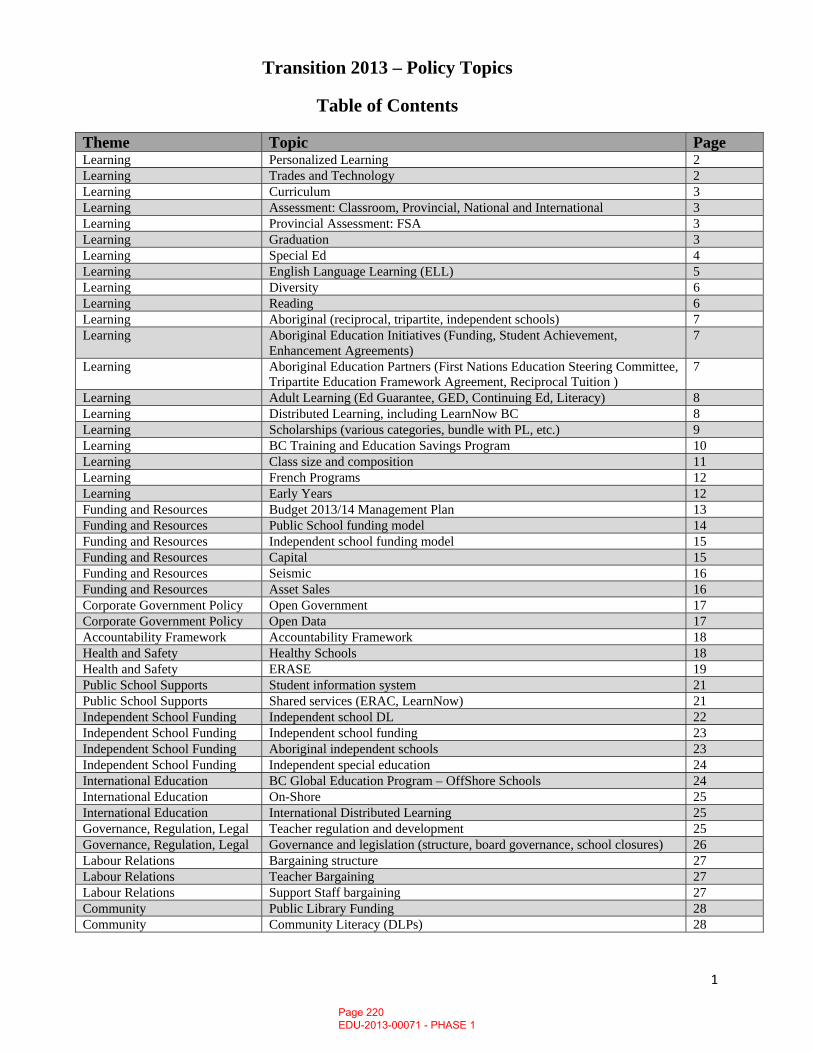
1
Transition 2013 – Policy Topics
Table of Contents
Theme Topic Page Learning Personalized Learning 2 Learning Trades and Technology 2 Learning Curriculum 3 Learning Assessment: Classroom, Provincial, National and International 3 Learning Provincial Assessment: FSA 3 Learning Graduation 3 Learning Special Ed 4 Learning English Language Learning (ELL) 5 Learning Diversity 6 Learning Reading 6 Learning Aboriginal (reciprocal, tripartite, independent schools) 7 Learning Aboriginal Education Initiatives (Funding, Student Achievement,
Enhancement Agreements) 7
Learning Aboriginal Education Partners (First Nations Education Steering Committee, Tripartite Education Framework Agreement, Reciprocal Tuition )
7
Learning Adult Learning (Ed Guarantee, GED, Continuing Ed, Literacy) 8 Learning Distributed Learning, including LearnNow BC 8 Learning Scholarships (various categories, bundle with PL, etc.) 9 Learning BC Training and Education Savings Program 10 Learning Class size and composition 11 Learning French Programs 12 Learning Early Years 12 Funding and Resources Budget 2013/14 Management Plan 13 Funding and Resources Public School funding model 14 Funding and Resources Independent school funding model 15 Funding and Resources Capital 15 Funding and Resources Seismic 16 Funding and Resources Asset Sales 16 Corporate Government Policy Open Government 17 Corporate Government Policy Open Data 17 Accountability Framework Accountability Framework 18 Health and Safety Healthy Schools 18 Health and Safety ERASE 19 Public School Supports Student information system 21 Public School Supports Shared services (ERAC, LearnNow) 21 Independent School Funding Independent school DL 22 Independent School Funding Independent school funding 23 Independent School Funding Aboriginal independent schools 23 Independent School Funding Independent special education 24 International Education BC Global Education Program – OffShore Schools 24 International Education On-Shore 25 International Education International Distributed Learning 25 Governance, Regulation, Legal Teacher regulation and development 25 Governance, Regulation, Legal Governance and legislation (structure, board governance, school closures) 26 Labour Relations Bargaining structure 27 Labour Relations Teacher Bargaining 27 Labour Relations Support Staff bargaining 27 Community Public Library Funding 28 Community Community Literacy (DLPs) 28
Page 220 EDU-2013-00071 - PHASE 1
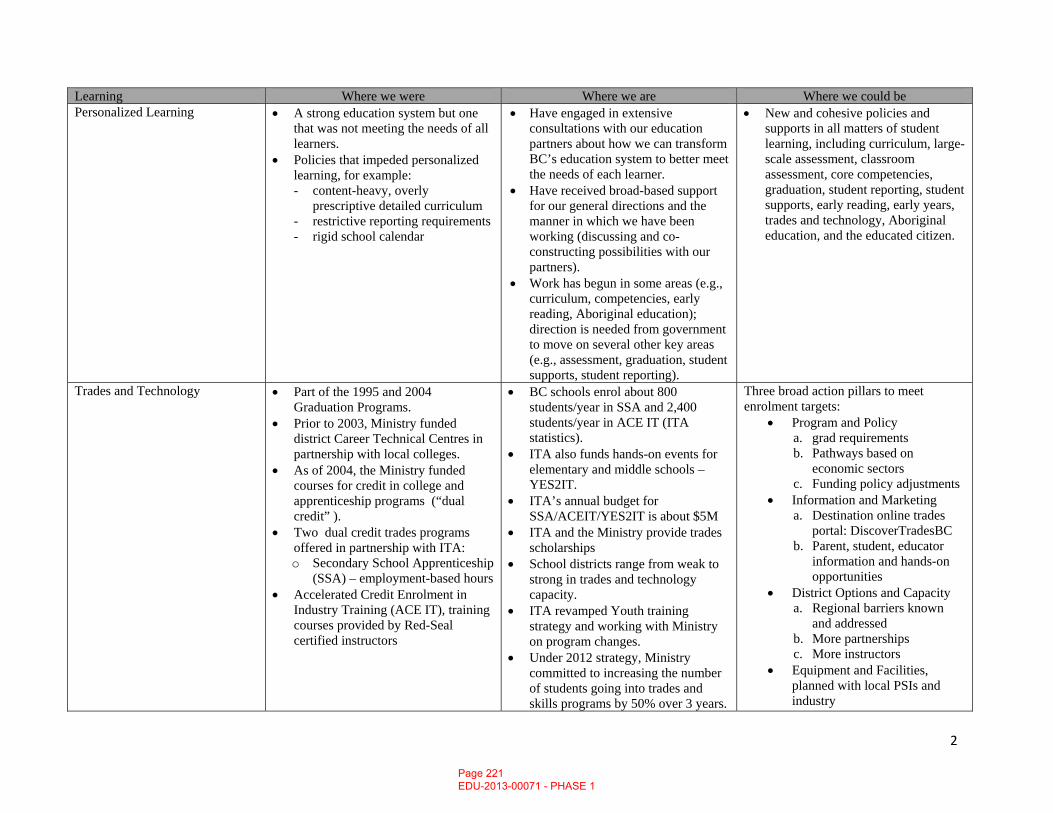
2
Learning Where we were Where we are Where we could be Personalized Learning • A strong education system but one
that was not meeting the needs of all learners.
• Policies that impeded personalized learning, for example: - content-heavy, overly
prescriptive detailed curriculum - restrictive reporting requirements - rigid school calendar
• Have engaged in extensive consultations with our education partners about how we can transform BC’s education system to better meet the needs of each learner.
• Have received broad-based support for our general directions and the manner in which we have been working (discussing and co-constructing possibilities with our partners).
• Work has begun in some areas (e.g., curriculum, competencies, early reading, Aboriginal education); direction is needed from government to move on several other key areas (e.g., assessment, graduation, student supports, student reporting).
• New and cohesive policies and supports in all matters of student learning, including curriculum, large-scale assessment, classroom assessment, core competencies, graduation, student reporting, student supports, early reading, early years, trades and technology, Aboriginal education, and the educated citizen.
Trades and Technology • Part of the 1995 and 2004 Graduation Programs.
• Prior to 2003, Ministry funded district Career Technical Centres in partnership with local colleges.
• As of 2004, the Ministry funded courses for credit in college and apprenticeship programs (“dual credit” ).
• Two dual credit trades programs offered in partnership with ITA: o Secondary School Apprenticeship
(SSA) – employment-based hours • Accelerated Credit Enrolment in
Industry Training (ACE IT), training courses provided by Red-Seal certified instructors
• BC schools enrol about 800 students/year in SSA and 2,400 students/year in ACE IT (ITA statistics).
• ITA also funds hands-on events for elementary and middle schools – YES2IT.
• ITA’s annual budget for SSA/ACEIT/YES2IT is about $5M
• ITA and the Ministry provide trades scholarships
• School districts range from weak to strong in trades and technology capacity.
• ITA revamped Youth training strategy and working with Ministry on program changes.
• Under 2012 strategy, Ministry committed to increasing the number of students going into trades and skills programs by 50% over 3 years.
Three broad action pillars to meet enrolment targets:
• Program and Policy a. grad requirements b. Pathways based on
economic sectors c. Funding policy adjustments
• Information and Marketing a. Destination online trades
portal: DiscoverTradesBC b. Parent, student, educator
information and hands-on opportunities
• District Options and Capacity a. Regional barriers known
and addressed b. More partnerships c. More instructors
• Equipment and Facilities, planned with local PSIs and industry
Page 221 EDU-2013-00071 - PHASE 1
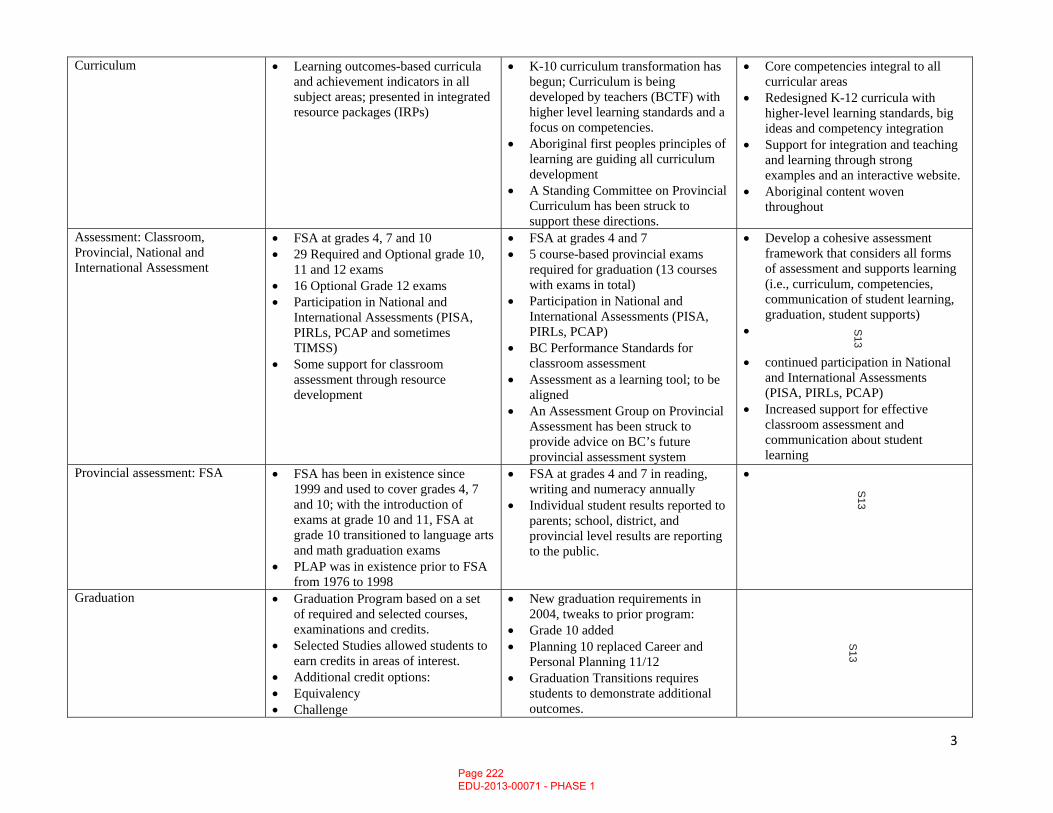
3
Curriculum • Learning outcomes-based curricula and achievement indicators in all subject areas; presented in integrated resource packages (IRPs)
• K-10 curriculum transformation has begun; Curriculum is being developed by teachers (BCTF) with higher level learning standards and a focus on competencies.
• Aboriginal first peoples principles of learning are guiding all curriculum development
• A Standing Committee on Provincial Curriculum has been struck to support these directions.
• Core competencies integral to all curricular areas
• Redesigned K-12 curricula with higher-level learning standards, big ideas and competency integration
• Support for integration and teaching and learning through strong examples and an interactive website.
• Aboriginal content woven throughout
Assessment: Classroom, Provincial, National and International Assessment
• FSA at grades 4, 7 and 10 • 29 Required and Optional grade 10,
11 and 12 exams • 16 Optional Grade 12 exams • Participation in National and
International Assessments (PISA, PIRLs, PCAP and sometimes TIMSS)
• Some support for classroom assessment through resource development
• FSA at grades 4 and 7 • 5 course-based provincial exams
required for graduation (13 courses with exams in total)
• Participation in National and International Assessments (PISA, PIRLs, PCAP)
• BC Performance Standards for classroom assessment
• Assessment as a learning tool; to be aligned
• An Assessment Group on Provincial Assessment has been struck to provide advice on BC’s future provincial assessment system
• Develop a cohesive assessment framework that considers all forms of assessment and supports learning (i.e., curriculum, competencies, communication of student learning, graduation, student supports)
•
• continued participation in National and International Assessments (PISA, PIRLs, PCAP)
• Increased support for effective classroom assessment and communication about student learning
Provincial assessment: FSA • FSA has been in existence since 1999 and used to cover grades 4, 7 and 10; with the introduction of exams at grade 10 and 11, FSA at grade 10 transitioned to language arts and math graduation exams
• PLAP was in existence prior to FSA from 1976 to 1998
• FSA at grades 4 and 7 in reading, writing and numeracy annually
• Individual student results reported to parents; school, district, and provincial level results are reporting to the public.
•
Graduation • Graduation Program based on a set of required and selected courses, examinations and credits.
• Selected Studies allowed students to earn credits in areas of interest.
• Additional credit options: • Equivalency • Challenge
• New graduation requirements in 2004, tweaks to prior program:
• Grade 10 added • Planning 10 replaced Career and
Personal Planning 11/12 • Graduation Transitions requires
students to demonstrate additional outcomes.
Page 222 EDU-2013-00071 - PHASE 1
S13
S13
S13
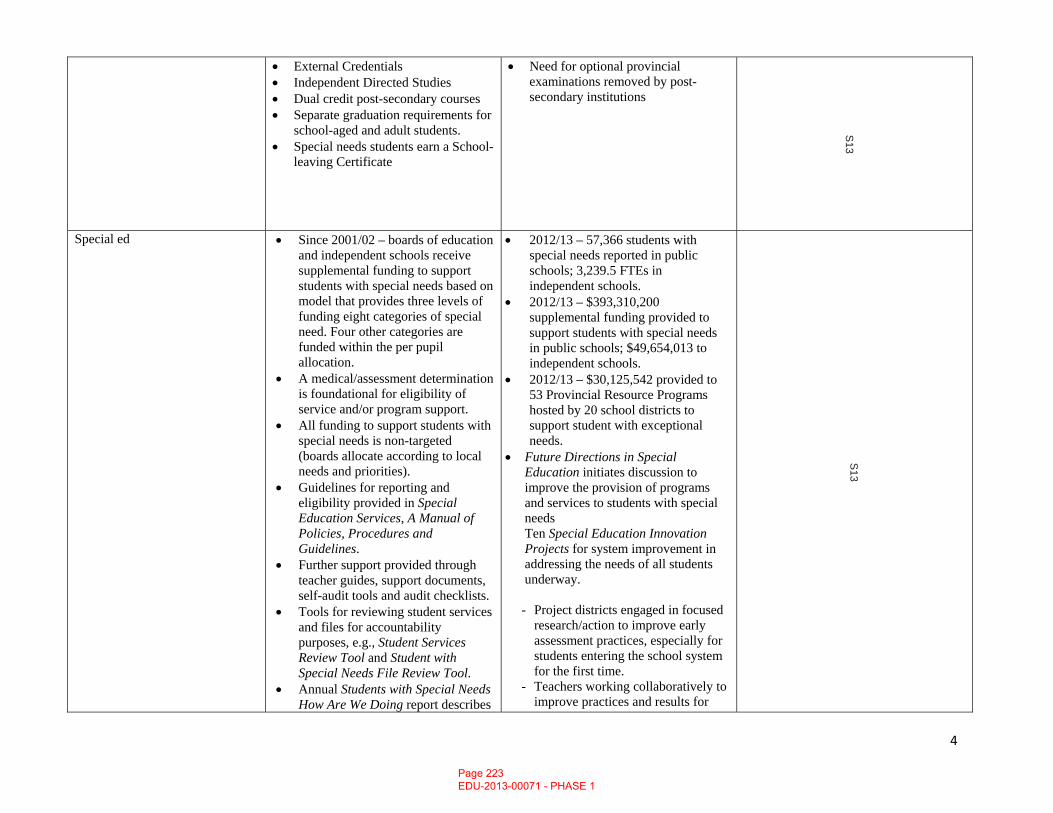
4
• External Credentials • Independent Directed Studies • Dual credit post-secondary courses • Separate graduation requirements for
school-aged and adult students. • Special needs students earn a School-
leaving Certificate
• Need for optional provincial examinations removed by post-secondary institutions
Special ed • Since 2001/02 – boards of education and independent schools receive supplemental funding to support students with special needs based on model that provides three levels of funding eight categories of special need. Four other categories are funded within the per pupil allocation.
• A medical/assessment determination is foundational for eligibility of service and/or program support.
• All funding to support students with special needs is non-targeted (boards allocate according to local needs and priorities).
• Guidelines for reporting and eligibility provided in Special Education Services, A Manual of Policies, Procedures and Guidelines.
• Further support provided through teacher guides, support documents, self-audit tools and audit checklists.
• Tools for reviewing student services and files for accountability purposes, e.g., Student Services Review Tool and Student with Special Needs File Review Tool.
• Annual Students with Special Needs How Are We Doing report describes
• 2012/13 – 57,366 students with special needs reported in public schools; 3,239.5 FTEs in independent schools.
• 2012/13 – $393,310,200 supplemental funding provided to support students with special needs in public schools; $49,654,013 to independent schools.
• 2012/13 – $30,125,542 provided to 53 Provincial Resource Programs hosted by 20 school districts to support student with exceptional needs.
• Future Directions in Special Education initiates discussion to improve the provision of programs and services to students with special needs
Ten Special Education Innovation Projects for system improvement in addressing the needs of all students underway.
- Project districts engaged in focused
research/action to improve early assessment practices, especially for students entering the school system for the first time.
- Teachers working collaboratively to improve practices and results for
Page 223 EDU-2013-00071 - PHASE 1
S13
S13
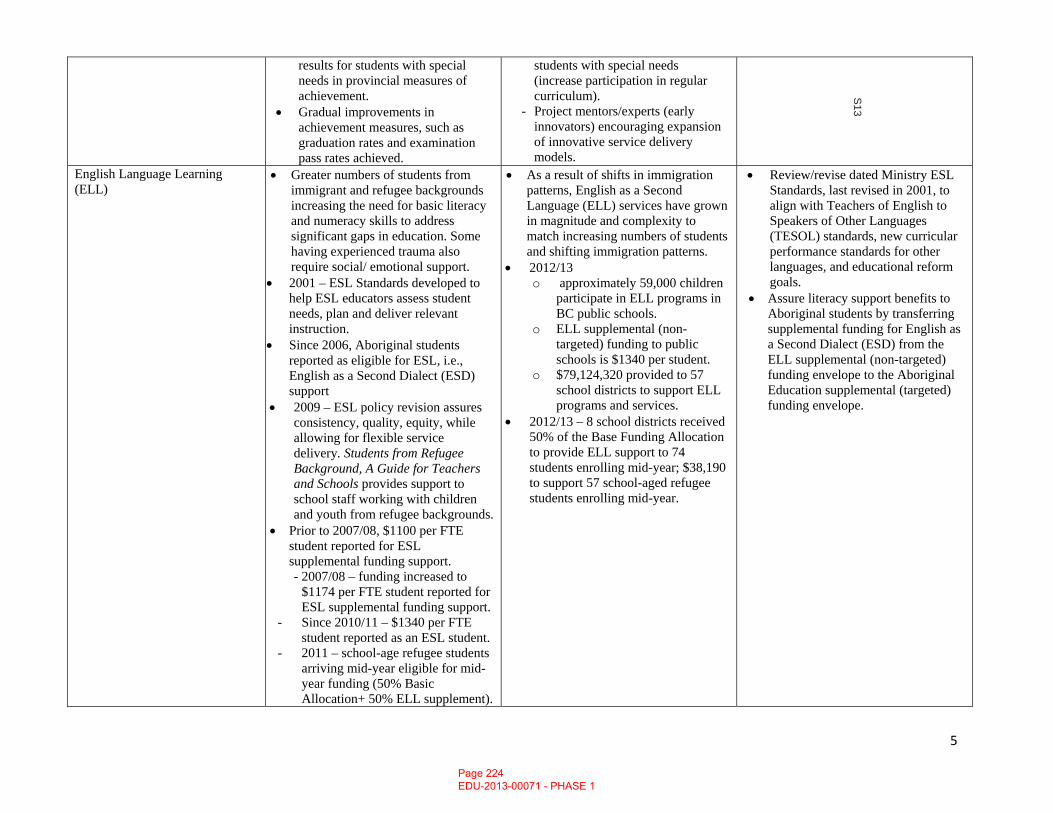
5
results for students with special needs in provincial measures of achievement.
• Gradual improvements in achievement measures, such as graduation rates and examination pass rates achieved.
students with special needs (increase participation in regular curriculum).
- Project mentors/experts (early innovators) encouraging expansion of innovative service delivery models.
English Language Learning (ELL)
• Greater numbers of students from immigrant and refugee backgrounds increasing the need for basic literacy and numeracy skills to address significant gaps in education. Some having experienced trauma also require social/ emotional support.
• 2001 – ESL Standards developed to help ESL educators assess student needs, plan and deliver relevant instruction.
• Since 2006, Aboriginal students reported as eligible for ESL, i.e., English as a Second Dialect (ESD) support
• 2009 – ESL policy revision assures consistency, quality, equity, while allowing for flexible service delivery. Students from Refugee Background, A Guide for Teachers and Schools provides support to school staff working with children and youth from refugee backgrounds.
• Prior to 2007/08, $1100 per FTE student reported for ESL supplemental funding support. - 2007/08 – funding increased to
$1174 per FTE student reported for ESL supplemental funding support.
- Since 2010/11 – $1340 per FTE student reported as an ESL student.
- 2011 – school-age refugee students arriving mid-year eligible for mid-year funding (50% Basic Allocation+ 50% ELL supplement).
• As a result of shifts in immigration patterns, English as a Second Language (ELL) services have grown in magnitude and complexity to match increasing numbers of students and shifting immigration patterns.
• 2012/13 o approximately 59,000 children
participate in ELL programs in BC public schools.
o ELL supplemental (non-targeted) funding to public schools is $1340 per student.
o $79,124,320 provided to 57 school districts to support ELL programs and services.
• 2012/13 – 8 school districts received 50% of the Base Funding Allocation to provide ELL support to 74 students enrolling mid-year; $38,190 to support 57 school-aged refugee students enrolling mid-year.
• Review/revise dated Ministry ESL Standards, last revised in 2001, to align with Teachers of English to Speakers of Other Languages (TESOL) standards, new curricular performance standards for other languages, and educational reform goals.
• Assure literacy support benefits to Aboriginal students by transferring supplemental funding for English as a Second Dialect (ESD) from the ELL supplemental (non-targeted) funding envelope to the Aboriginal Education supplemental (targeted) funding envelope.
Page 224 EDU-2013-00071 - PHASE 1
S13
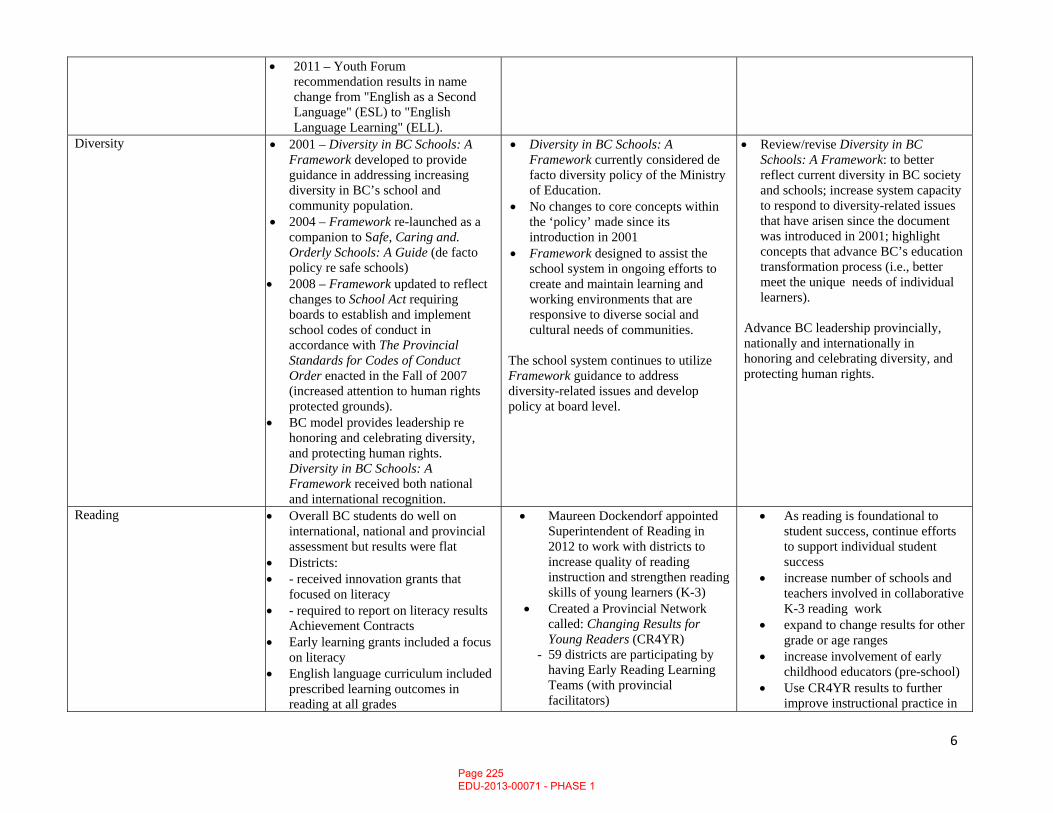
6
• 2011 – Youth Forum recommendation results in name change from "English as a Second Language" (ESL) to "English Language Learning" (ELL).
Diversity • 2001 – Diversity in BC Schools: A Framework developed to provide guidance in addressing increasing diversity in BC’s school and community population.
• 2004 – Framework re-launched as a companion to Safe, Caring and. Orderly Schools: A Guide (de facto policy re safe schools)
• 2008 – Framework updated to reflect changes to School Act requiring boards to establish and implement school codes of conduct in accordance with The Provincial Standards for Codes of Conduct Order enacted in the Fall of 2007 (increased attention to human rights protected grounds).
• BC model provides leadership re honoring and celebrating diversity, and protecting human rights. Diversity in BC Schools: A Framework received both national and international recognition.
• Diversity in BC Schools: A Framework currently considered de facto diversity policy of the Ministry of Education.
• No changes to core concepts within the ‘policy’ made since its introduction in 2001
• Framework designed to assist the school system in ongoing efforts to create and maintain learning and working environments that are responsive to diverse social and cultural needs of communities.
The school system continues to utilize Framework guidance to address diversity-related issues and develop policy at board level.
• Review/revise Diversity in BC Schools: A Framework: to better reflect current diversity in BC society and schools; increase system capacity to respond to diversity-related issues that have arisen since the document was introduced in 2001; highlight concepts that advance BC’s education transformation process (i.e., better meet the unique needs of individual learners).
Advance BC leadership provincially, nationally and internationally in honoring and celebrating diversity, and protecting human rights.
Reading • Overall BC students do well on international, national and provincial assessment but results were flat
• Districts: • - received innovation grants that
focused on literacy • - required to report on literacy results
Achievement Contracts • Early learning grants included a focus
on literacy • English language curriculum included
prescribed learning outcomes in reading at all grades
• Maureen Dockendorf appointed Superintendent of Reading in 2012 to work with districts to increase quality of reading instruction and strengthen reading skills of young learners (K-3)
• Created a Provincial Network called: Changing Results for Young Readers (CR4YR)
- 59 districts are participating by having Early Reading Learning Teams (with provincial facilitators)
• As reading is foundational to student success, continue efforts to support individual student success
• increase number of schools and teachers involved in collaborative K-3 reading work
• expand to change results for other grade or age ranges
• increase involvement of early childhood educators (pre-school)
• Use CR4YR results to further improve instructional practice in
Page 225 EDU-2013-00071 - PHASE 1
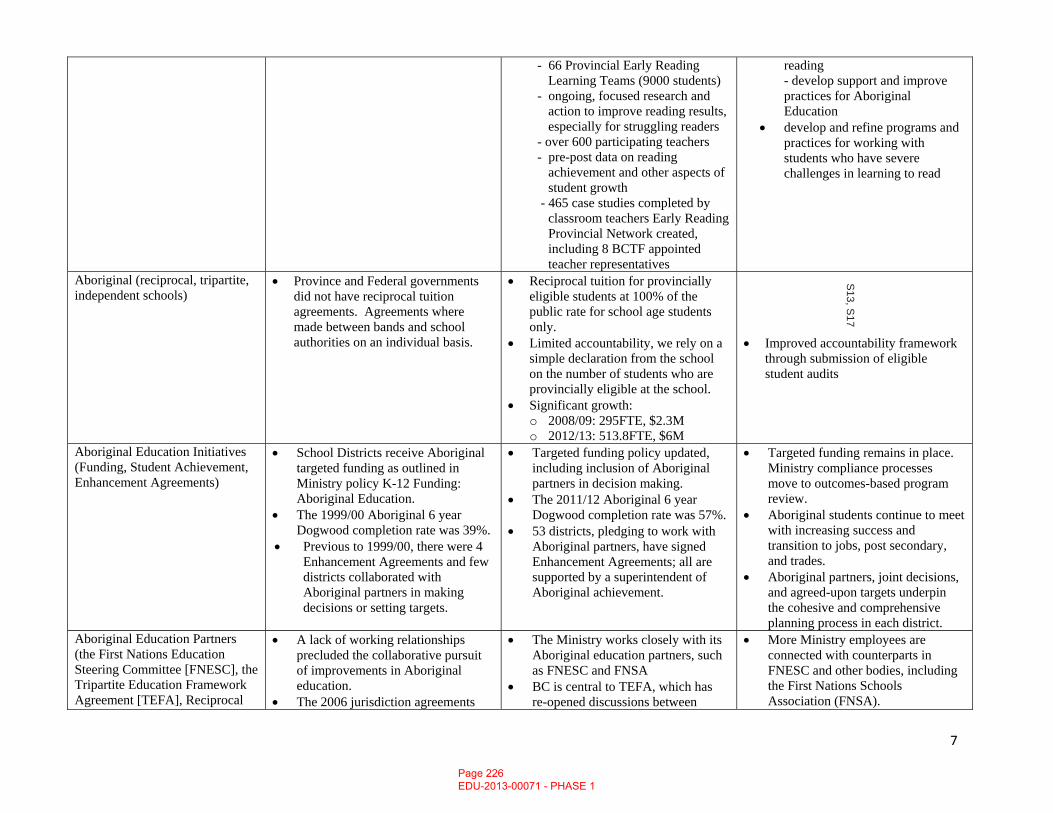
7
- 66 Provincial Early Reading Learning Teams (9000 students)
- ongoing, focused research and action to improve reading results, especially for struggling readers
- over 600 participating teachers - pre-post data on reading
achievement and other aspects of student growth
- 465 case studies completed by classroom teachers Early Reading Provincial Network created, including 8 BCTF appointed teacher representatives
reading - develop support and improve practices for Aboriginal Education
• develop and refine programs and practices for working with students who have severe challenges in learning to read
Aboriginal (reciprocal, tripartite, independent schools)
• Province and Federal governments did not have reciprocal tuition agreements. Agreements where made between bands and school authorities on an individual basis.
• Reciprocal tuition for provincially eligible students at 100% of the public rate for school age students only.
• Limited accountability, we rely on a simple declaration from the school on the number of students who are provincially eligible at the school.
• Significant growth: o 2008/09: 295FTE, $2.3M o 2012/13: 513.8FTE, $6M
• Improved accountability framework through submission of eligible student audits
Aboriginal Education Initiatives (Funding, Student Achievement, Enhancement Agreements)
• School Districts receive Aboriginal targeted funding as outlined in Ministry policy K-12 Funding: Aboriginal Education.
• The 1999/00 Aboriginal 6 year Dogwood completion rate was 39%.
• Previous to 1999/00, there were 4 Enhancement Agreements and few districts collaborated with Aboriginal partners in making decisions or setting targets.
• Targeted funding policy updated, including inclusion of Aboriginal partners in decision making.
• The 2011/12 Aboriginal 6 year Dogwood completion rate was 57%.
• 53 districts, pledging to work with Aboriginal partners, have signed Enhancement Agreements; all are supported by a superintendent of Aboriginal achievement.
• Targeted funding remains in place. Ministry compliance processes move to outcomes-based program review.
• Aboriginal students continue to meet with increasing success and transition to jobs, post secondary, and trades.
• Aboriginal partners, joint decisions, and agreed-upon targets underpin the cohesive and comprehensive planning process in each district.
Aboriginal Education Partners (the First Nations Education Steering Committee [FNESC], the Tripartite Education Framework Agreement [TEFA], Reciprocal
• A lack of working relationships precluded the collaborative pursuit of improvements in Aboriginal education.
• The 2006 jurisdiction agreements
• The Ministry works closely with its Aboriginal education partners, such as FNESC and FNSA
• BC is central to TEFA, which has re-opened discussions between
• More Ministry employees are connected with counterparts in FNESC and other bodies, including the First Nations Schools Association (FNSA).
Page 226 EDU-2013-00071 - PHASE 1
S13, S
17
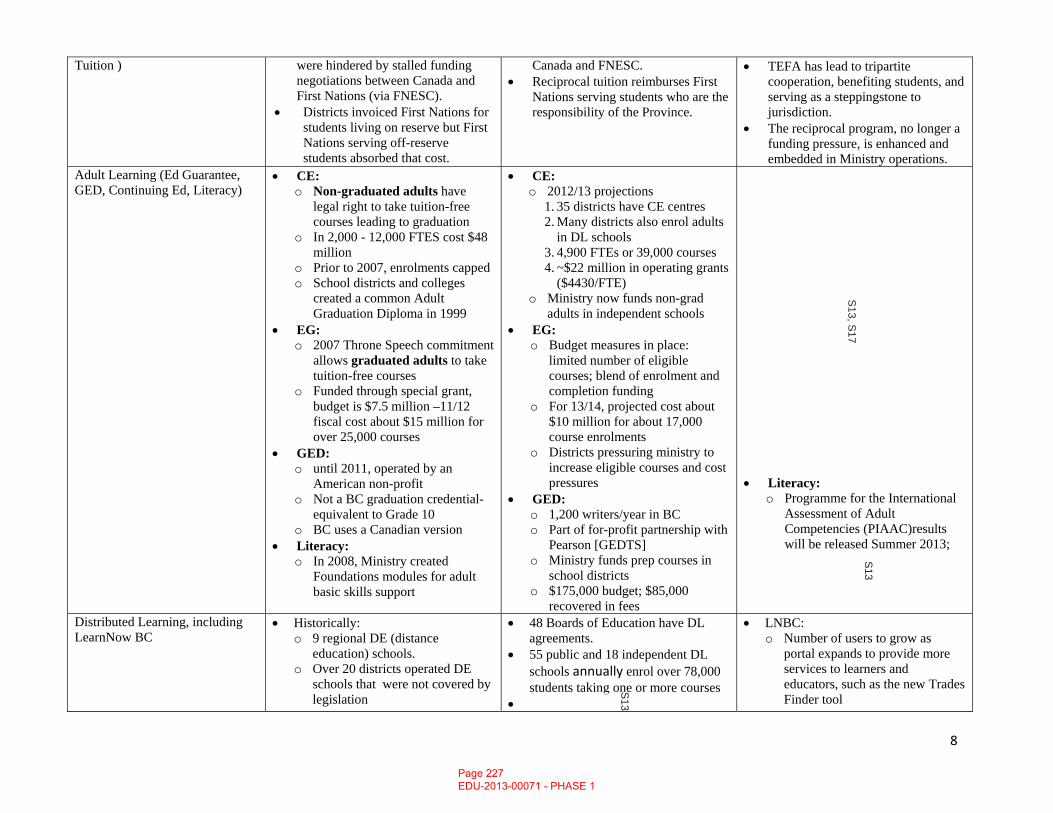
8
Tuition ) were hindered by stalled funding negotiations between Canada and First Nations (via FNESC).
• Districts invoiced First Nations for students living on reserve but First Nations serving off-reserve students absorbed that cost.
Canada and FNESC. • Reciprocal tuition reimburses First
Nations serving students who are the responsibility of the Province.
• TEFA has lead to tripartite cooperation, benefiting students, and serving as a steppingstone to jurisdiction.
• The reciprocal program, no longer a funding pressure, is enhanced and embedded in Ministry operations.
Adult Learning (Ed Guarantee, GED, Continuing Ed, Literacy)
• CE: o Non-graduated adults have
legal right to take tuition-free courses leading to graduation
o In 2,000 - 12,000 FTES cost $48 million
o Prior to 2007, enrolments capped o School districts and colleges
created a common Adult Graduation Diploma in 1999
• EG: o 2007 Throne Speech commitment
allows graduated adults to take tuition-free courses
o Funded through special grant, budget is $7.5 million –11/12 fiscal cost about $15 million for over 25,000 courses
• GED: o until 2011, operated by an
American non-profit o Not a BC graduation credential-
equivalent to Grade 10 o BC uses a Canadian version
• Literacy: o In 2008, Ministry created
Foundations modules for adult basic skills support
• CE: o 2012/13 projections
1. 35 districts have CE centres 2. Many districts also enrol adults
in DL schools 3. 4,900 FTEs or 39,000 courses 4. ~$22 million in operating grants
($4430/FTE) o Ministry now funds non-grad
adults in independent schools • EG:
o Budget measures in place: limited number of eligible courses; blend of enrolment and completion funding
o For 13/14, projected cost about $10 million for about 17,000 course enrolments
o Districts pressuring ministry to increase eligible courses and cost pressures
• GED: o 1,200 writers/year in BC o Part of for-profit partnership with
Pearson [GEDTS] o Ministry funds prep courses in
school districts o $175,000 budget; $85,000
recovered in fees
• Literacy: o Programme for the International
Assessment of Adult Competencies (PIAAC)results will be released Summer 2013;
Distributed Learning, including LearnNow BC
• Historically: o 9 regional DE (distance
education) schools. o Over 20 districts operated DE
schools that were not covered by legislation
• 48 Boards of Education have DL agreements.
• 55 public and 18 independent DL schools annually enrol over 78,000 students taking one or more courses
•
• LNBC: o Number of users to grow as
portal expands to provide more services to learners and educators, such as the new Trades Finder tool
Page 227 EDU-2013-00071 - PHASE 1
S13, S
17
S13
S13
9
o Very little data about DE collected
• 2006 - Legislation amended and policies implemented in to allowed students to access DL courses/programs.
• Districts and independent schools operate DL schools under specific agreements with the Ministry. Quality Assurance measures implemented.
• LearnNowBC (LNBC): The Ministry funded portal for digital services (such as web-conferencing and tutoring).
• Grade 10-12 students may enrol in courses from a combination of brick and mortar and DL schools
• Quality Review processes are in place to support continual improvements.
• Base funding for public DL students is $1049 lower than the rate for other school-age students.
• LNBC: now funded through an MOU/TUA between the Ministry and SD73 Business Company, expiring 2015. $2.1 million annually.
• Engage stakeholders in a broad policy dialogue about learning, including Distributed Learning, in support of education transformation.
Scholarships (various categories, bundle with PL, etc.)
• The Provincial Awards program has been in place since 1987, and comprises: o Provincial exam scholarships o District/authority awards o Passport to Education awards o Secondary School Apprenticeship
scholarship o Pathway to Teacher Education
scholarship (new this year) • The Provincial Awards Program is
closely aligned with the secondary school graduation program: as graduation policy revisions occur, so do revisions to the awards program
• Optional provincial examinations
•
• Ministry of Education staff consulted with education stakeholders in the winter and spring of 2012 regarding alignment of the Provincial Awards Program with new directions in personalized learning
• Feedback indicated that many schools and districts are in favour of discontinuing the Passport to Education scholarship, and diverting
• Phasing out the Passport to Education Program will manage the budget pressure in the short term and allow the ministry to be responsive to education stakeholders’ desire for a more personalized, locally-managed awards program in the long-term. This will give school districts more flexibility in applying provincial funding for scholarships and awards to encourage student participation in trades and technical training.
Page 228 EDU-2013-00071 - PHASE 1
S13
S13, S
17
S13
S13
10
were discontinued in August, 2011. With this change the criteria for provincial exam scholarships also changed; new criteria were based on achievement on the five required provincial exams in Grades 10 – 12
• Until September of 2012, the program was jointly managed by the Ministries of Education and Advanced Education. The budget was held by AEIT with the program administered by the Ministry of Education. In September, 2012, the awards budget was transferred to the Ministry of Education
most scholarship funds to local boards and authorities, such as allowing Boards to provide District Dogwood Awards for Trades beginning in 2012.
• The Ministry of Education and education leaders throughout the province, in consultation with stakeholder groups, began a review of graduation requirements, including scholarships, in 2012. Consultation sessions attended by thousands of participants were held in the fall of 2012. Feedback from these consultations supports the 2012 consultation – discontinue Passport to Education and divert scholarship funds to local boards and authorities.
• This renewed awards program could include: o transferring more scholarship
dollars to districts, where scholarships would be awarded based on community demographics
o Recognition of all forms of authentic student learning, including trades and technical training
o ensuring equitable access and support for all learning pathways
o recognizing student learning throughout K-12
BC Training and Education Savings Program
• The Children’s Education Fund (CEF) was set up in 2007 under the Special Accounts Appropriation and Control Act to enable government to invest $1000 for each child born on or after January 1, 2007 at the start of each fiscal year.
• The investment of $1000 was expected to double by the time the children graduated from high school.
• The investment was to be paid out as students entered a BC post-secondary institution between the ages of 17 and 26.
• No regulations exist for the CEF. • Since 2007, $300 million has been
invested.
• In late 2012, the Cabinet Working Group on Family Affordability recommended the creation of an annual entitlement program under a new structure.
• On February 19, 2013 the government announced the BC Training and Education Savings Program (BCTESP) in the Budget 2013 speech.
• The BCTESP provides a one-time $1,200 grant (statutory entitlement) to children born on or after Jan. 1, 2007 who are resident in the BC at age 6.
• The grant is paid out into Registered Education Savings Plans through financial institutions. The BCTESG is to be used for purposes consistent with the federal Registered Education Savings Plan program policies.
• The $1,200 grant represents the
• Transition the BCTESP from an investment fund (CEF) to a statutory entitlement program for government contributions into Registered Education Savings Plans.
• This will shift the focus of the Children’s Education Fund from an investment account held on behalf of children born in British Columbia to a $1,200 entitlement contribution paid to children resident in British Columbia at age six.
• Current legislation should be amended (or repealed and replaced with BCTESP-specific legislation) to more accurately reflect the intent and purpose of the BCTESP.
Page 229 EDU-2013-00071 - PHASE 1
11
initial $1,000 CEF investment plus projected investment returns accumulated from the year of birth to the child’s sixth birthday.
• The financial and administrative infrastructure will take 18 to 24 months to set up. The program should be fully operational by late 2014.
• New regulations, under section 9.4 of the Special Accounts Appropriation and Control Act, were approved by Order-In-Council on March 20, 2013. The regulations provide a legislative framework and establish the eligibility criteria for the BCTESG.
• CEF funds for 2013/14 have been placed in liquid short-term fixed income investments pending draw down for contributions to RESP accounts in 18 to 24 months.
Class size and composition Pre- 2002, class size and composition was addressed in collective agreements. In 2002, the Public Education Flexibility and Choice Act (Bill 28), removed class size and composition from the scope of bargaining, and maximum class size and maximum class averages were put in the School Act. Bill 19 removed class size and composition language from collective agreements. Further School Act amendments were made in 2006 to add a soft cap on the number of students with special needs per class and consultation requirements where a class exceeded maximum size or included more than 3 students with special needs. These provisions resulted in thousands of grievances.
Bill 22 simplified legislated class size requirements. Current class size provisions: • Establish hard caps of 22 students
for Kindergarten and 24 for Grades 1 to 3.
• Establish soft caps of 30 students for Grade 4 to 12 classes. The cap can be exceeded with the superintendent’s permission.
There is no cap on the number of students with special needs in a class, and there is no longer a narrow and specific duty to consult teachers on class size and composition. The School Regulation was amended to provide a more general duty to consult that should be more effective and draw fewer grievances.
Class size and composition issues are discussed at a newly established education policy council.
Page 230 EDU-2013-00071 - PHASE 1
12
French programs Protocol for Agreements for Minority-Language Education and Second-Language Instruction (2009/10 to 2012/13) Canada-British Columbia Agreement on Minority Language Education and Second Official Language Instruction, 2009/10 to 2012/13. Four-year agreement for total federal funding of $64,417,672. 2008-09 • 4,222 Francophone students in SD93
CSF • 42,474 French Immersion students
2012-13 • 4,744 Francophone students in SD93
CSF • 47,857 French Immersion students
Final Draft of Protocol for Agreements for Minority-Language Education and Second-Language Instruction (2013/14 to 2017/18) • sent to each jurisdiction for approval
on March 22, 2013. • BC approved on March 26, 2013 • 5-year agreement; total federal
funding of $80,522,090. • (funding envelop remain at same
level of previous Protocol) • Once the Protocol has been approved
by the Government of Canada and the Council of Ministers of Education, Canada (CMEC), the Province will start negotiations with the Department of Canadian Heritage for the renewal of its bilateral agreement.
Early Years • Prior to 2004 – little opportunity for schools to influence early development of children aged 0-5.
• Prior to 2010 – BC schools offered half school day kindergarten; some full day programs for specific groups (Aboriginal students, English language learners, Students with special needs).
• 2004 – Ready, Set, Learn (RSL) introduced to support young child’s early learning; parents/caregivers develop positive connections with school system and local community agencies.
• 2006 – StrongStart BC programs implemented to support development of children age 0-5.
• 2009, legislation enacted expanding Kindergarten to full school day programming for all five-year-olds;
• The British Columbia Early Learning Framework – vision, pedagogical principles, and key areas of learning for children from birth to five years.
• Understanding the British Columbia Early Learning Framework -From Theory to Practice – guide for early learning practitioners implementing the Framework.
• Full day kindergarten available across the province. 2012/13 – approximately 44,000 children participated in full day kindergarten in BC public schools.
• 2012/13 – base funding for public school kindergarten students is $6784; Independent schools – Level 1 schools funded at 50% ; Level 2 schools funded at 35%.
• 2012/13, $2,628,850 to 1,076 public
Page 231 EDU-2013-00071 - PHASE 1
S13
S13
13
committed $365M over three years to implement.
• 2010 – $144 million for implementation plan and capital construction of innovative modular classrooms.
schools and 99 independent schools to support Ready, Set, Learn events attended by 26,900 preschoolers and 26,500 parents.
• 2011/2012 – over 643,600 visits to StrongStart BC early learning programs; over 33,000 children attended StrongStart BC program during the school year.
• 2012/13 – $10,420,000 to operate 326 StrongStart BC programs.
• Reflecting on Quality: Program Reflection Tool for StrongStart BC resource to support continual implementation improvements.
Funding and Resources Where we were Where we are Where we could be Budget 2013/14 Management Plan
Page 232 EDU-2013-00071 - PHASE 1
S13, S
17S13, S
17
S13, S
17
14
Public School funding model Prior to 2002/03, public school funding was based upon a resource cost model. The model dictated to boards how much to spend in each area; the Ministry was the de facto decision maker. In 2000/01, seventeen school districts incurred operating fund deficits.
The current funding allocation formula distributes a fixed amount of money established as part of the Provincial budget each year. This amount is referred to as the “Block” and makes up approximately 92% of the Ministry of Education’s budget. Average per pupil funding will be $8,603 in 2013/14 which is an increase of 37.4% since 2000/01 Since the 1990’s, independent schools are funded at 50% or 35% of per-pupil funding of the public school district in which they are located. The proportional funding relationship means that independent school funding rises if public school enrolment drops. The funding allocation model is transparent and predictable, based largely on enrolment levels. Decisions on educational program offerings and spending levels are made locally by boards of education.
Page 233 EDU-2013-00071 - PHASE 1
S13, S
17
S13, S
17
15
There are 72,256 fewer FTE students forecasted for September 2013 than were enrolled in 2000/01, a decrease of 12.1%. In that time the Block has increased from $3.744B to $4.725B. Funding is protected at 98.5% of the previous September’s levels in case of enrolment decline. Excluding Unfunded Employee Future Benefits (EFB) and Vacation Pay Liabilities, the net balance of Operating Fund surpluses and deficits for all school districts totalled approximately $226 million as at June 30, 2012. Boards have internally restricted $197 million of the Operating Fund surpluses for specific purposes.
Independent school funding model
Capital Prior to 2006, the ministry had regular annual capital plans, with allocations for various capital programs, including maintenance.
Since 2006, no ministry capital plans have been approved by the Ministry of Finance.
Page 234 EDU-2013-00071 - PHASE 1
S13, S
17
S13, S
17
S13, S
17S
13
16
Once supported with funding, the ministry had the authority to manage the projects/programs within the capital plan. With the move to per pupil funding, and the trend of declining enrolment after 2001, many districts closed schools to deal with excess capacity.
Funding for capital programs has been uncertain and insufficient. All supported projects must be reviewed in detail and approved by Treasury Board staff (or full TB). With fewer project approvals in recent years, there has been an increase in deferred maintenance and schools in need of replacement. Funding is needed for the Building Envelope Program (BEP) as BEP-eligible projects continue to deteriorate and become more costly. Given recent Seismic Mitigation Program (SMP) announcements, there are many seismic projects in the planning or construction phase. Despite new school space projects announced in Oct 2011, there is still some pent up demand for new school space to accommodate increased enrolment in several districts.
Seismic 2004 - $1.5B commitment to upgrade over 700 schools in 15 years
131 Schools Completed 6 Under Construction 16 Proceeding to Construction 61 Supported, and 102 Remaining to be addressed. Since 2001 government has spent or committed $2.2 billion to seismically upgrade or replace 213 high-risk schools. It is anticipated it will cost a further $600 million to address the remaining 102 high-risk schools in the province.
Asset sales The amendment of the Disposal of Lands or Improvements Order in September 2008 reinstituted the need for boards of education to seek ministerial approval for the disposal of board-owned property
The Release of Assets for Economic Generation (RAEG) program was announced by Government as part of its February 2012 budget and is intended to generate revenue to balance the 2013/14
Page 235 EDU-2013-00071 - PHASE 1
S13
S13
S13
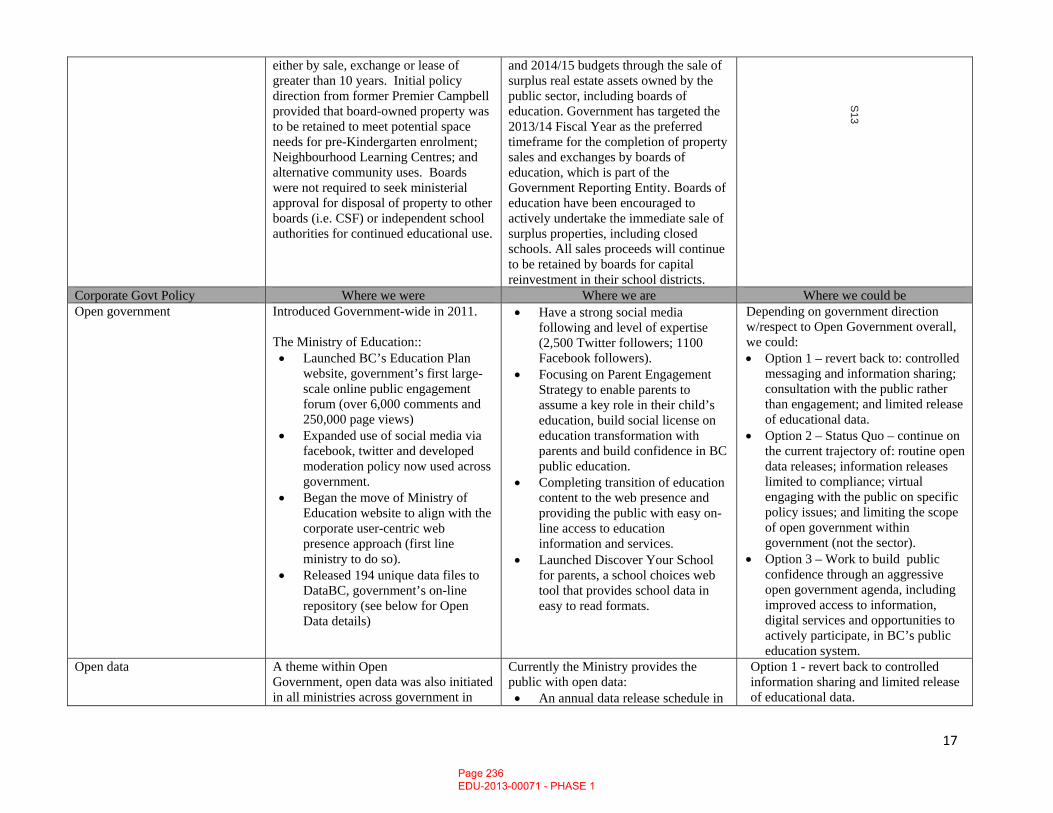
17
either by sale, exchange or lease of greater than 10 years. Initial policy direction from former Premier Campbell provided that board-owned property was to be retained to meet potential space needs for pre-Kindergarten enrolment; Neighbourhood Learning Centres; and alternative community uses. Boards were not required to seek ministerial approval for disposal of property to other boards (i.e. CSF) or independent school authorities for continued educational use.
and 2014/15 budgets through the sale of surplus real estate assets owned by the public sector, including boards of education. Government has targeted the 2013/14 Fiscal Year as the preferred timeframe for the completion of property sales and exchanges by boards of education, which is part of the Government Reporting Entity. Boards of education have been encouraged to actively undertake the immediate sale of surplus properties, including closed schools. All sales proceeds will continue to be retained by boards for capital reinvestment in their school districts.
Corporate Govt Policy Where we were Where we are Where we could be Open government Introduced Government-wide in 2011.
The Ministry of Education:: • Launched BC’s Education Plan
website, government’s first large-scale online public engagement forum (over 6,000 comments and 250,000 page views)
• Expanded use of social media via facebook, twitter and developed moderation policy now used across government.
• Began the move of Ministry of Education website to align with the corporate user-centric web presence approach (first line ministry to do so).
• Released 194 unique data files to DataBC, government’s on-line repository (see below for Open Data details)
• Have a strong social media following and level of expertise (2,500 Twitter followers; 1100 Facebook followers).
• Focusing on Parent Engagement Strategy to enable parents to assume a key role in their child’s education, build social license on education transformation with parents and build confidence in BC public education.
• Completing transition of education content to the web presence and providing the public with easy on-line access to education information and services.
• Launched Discover Your School for parents, a school choices web tool that provides school data in easy to read formats.
Depending on government direction w/respect to Open Government overall, we could: • Option 1 – revert back to: controlled
messaging and information sharing; consultation with the public rather than engagement; and limited release of educational data.
• Option 2 – Status Quo – continue on the current trajectory of: routine open data releases; information releases limited to compliance; virtual engaging with the public on specific policy issues; and limiting the scope of open government within government (not the sector).
• Option 3 – Work to build public confidence through an aggressive open government agenda, including improved access to information, digital services and opportunities to actively participate, in BC’s public education system.
Open data A theme within Open Government, open data was also initiated in all ministries across government in
Currently the Ministry provides the public with open data: • An annual data release schedule in
Option 1 - revert back to controlled information sharing and limited release of educational data.
Page 236 EDU-2013-00071 - PHASE 1
S13
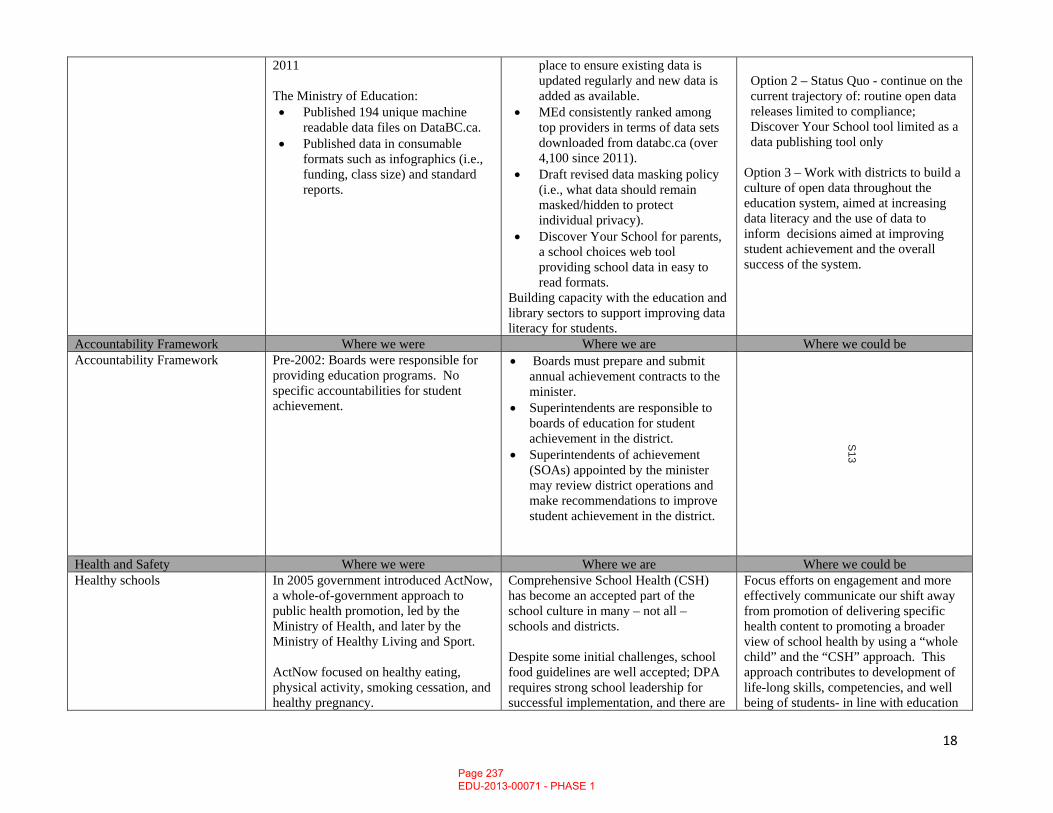
18
2011 The Ministry of Education: • Published 194 unique machine
readable data files on DataBC.ca. • Published data in consumable
formats such as infographics (i.e., funding, class size) and standard reports.
place to ensure existing data is updated regularly and new data is added as available.
• MEd consistently ranked among top providers in terms of data sets downloaded from databc.ca (over 4,100 since 2011).
• Draft revised data masking policy (i.e., what data should remain masked/hidden to protect individual privacy).
• Discover Your School for parents, a school choices web tool providing school data in easy to read formats.
Building capacity with the education and library sectors to support improving data literacy for students.
Option 2 – Status Quo - continue on the current trajectory of: routine open data releases limited to compliance; Discover Your School tool limited as a data publishing tool only
Option 3 – Work with districts to build a culture of open data throughout the education system, aimed at increasing data literacy and the use of data to inform decisions aimed at improving student achievement and the overall success of the system.
Accountability Framework Where we were Where we are Where we could be Accountability Framework Pre-2002: Boards were responsible for
providing education programs. No specific accountabilities for student achievement.
• Boards must prepare and submit annual achievement contracts to the minister.
• Superintendents are responsible to boards of education for student achievement in the district.
• Superintendents of achievement (SOAs) appointed by the minister may review district operations and make recommendations to improve student achievement in the district.
Health and Safety Where we were Where we are Where we could be Healthy schools In 2005 government introduced ActNow,
a whole-of-government approach to public health promotion, led by the Ministry of Health, and later by the Ministry of Healthy Living and Sport. ActNow focused on healthy eating, physical activity, smoking cessation, and healthy pregnancy.
Comprehensive School Health (CSH) has become an accepted part of the school culture in many – not all – schools and districts. Despite some initial challenges, school food guidelines are well accepted; DPA requires strong school leadership for successful implementation, and there are
Focus efforts on engagement and more effectively communicate our shift away from promotion of delivering specific health content to promoting a broader view of school health by using a “whole child” and the “CSH” approach. This approach contributes to development of life-long skills, competencies, and well being of students- in line with education
Page 237 EDU-2013-00071 - PHASE 1
S13
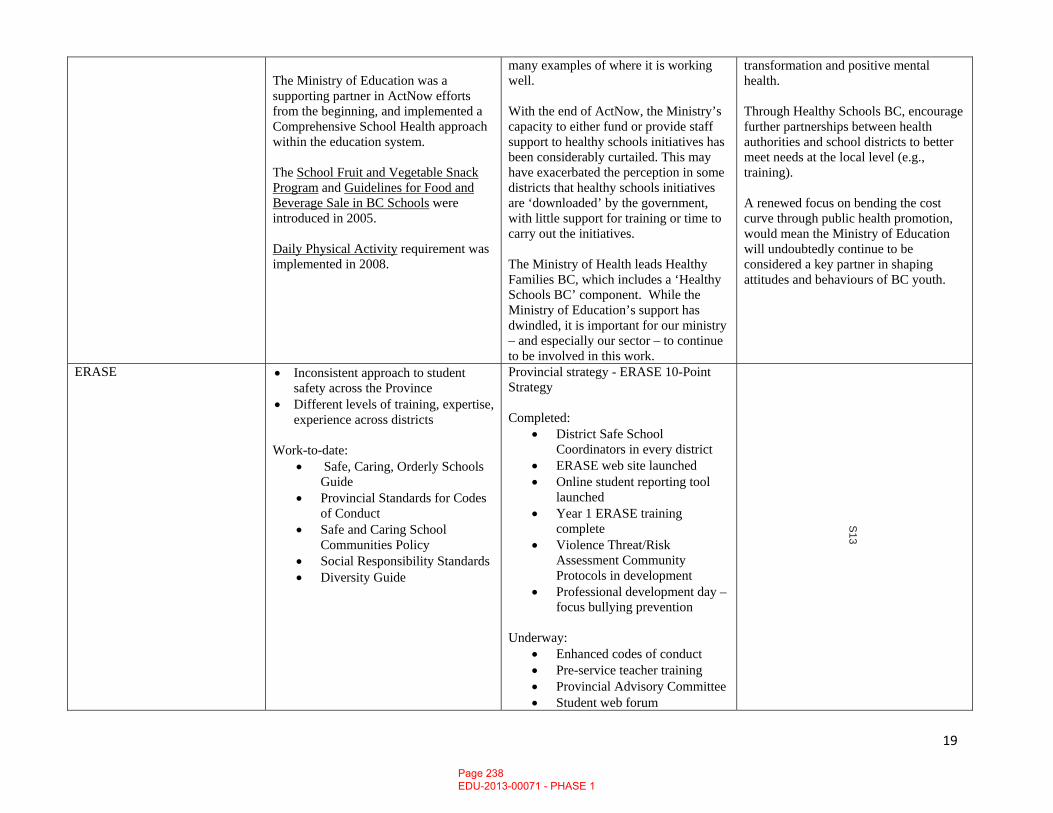
19
The Ministry of Education was a supporting partner in ActNow efforts from the beginning, and implemented a Comprehensive School Health approach within the education system. The School Fruit and Vegetable Snack Program and Guidelines for Food and Beverage Sale in BC Schools were introduced in 2005. Daily Physical Activity requirement was implemented in 2008.
many examples of where it is working well. With the end of ActNow, the Ministry’s capacity to either fund or provide staff support to healthy schools initiatives has been considerably curtailed. This may have exacerbated the perception in some districts that healthy schools initiatives are ‘downloaded’ by the government, with little support for training or time to carry out the initiatives. The Ministry of Health leads Healthy Families BC, which includes a ‘Healthy Schools BC’ component. While the Ministry of Education’s support has dwindled, it is important for our ministry – and especially our sector – to continue to be involved in this work.
transformation and positive mental health. Through Healthy Schools BC, encourage further partnerships between health authorities and school districts to better meet needs at the local level (e.g., training). A renewed focus on bending the cost curve through public health promotion, would mean the Ministry of Education will undoubtedly continue to be considered a key partner in shaping attitudes and behaviours of BC youth.
ERASE • Inconsistent approach to student safety across the Province
• Different levels of training, expertise, experience across districts
Work-to-date:
• Safe, Caring, Orderly Schools Guide
• Provincial Standards for Codes of Conduct
• Safe and Caring School Communities Policy
• Social Responsibility Standards • Diversity Guide
Provincial strategy - ERASE 10-Point Strategy Completed:
• District Safe School Coordinators in every district
• ERASE web site launched • Online student reporting tool
launched • Year 1 ERASE training
complete • Violence Threat/Risk
Assessment Community Protocols in development
• Professional development day – focus bullying prevention
Underway:
• Enhanced codes of conduct • Pre-service teacher training • Provincial Advisory Committee • Student web forum
Page 238 EDU-2013-00071 - PHASE 1
S13
20
Page 239 EDU-2013-00071 - PHASE 1
S13
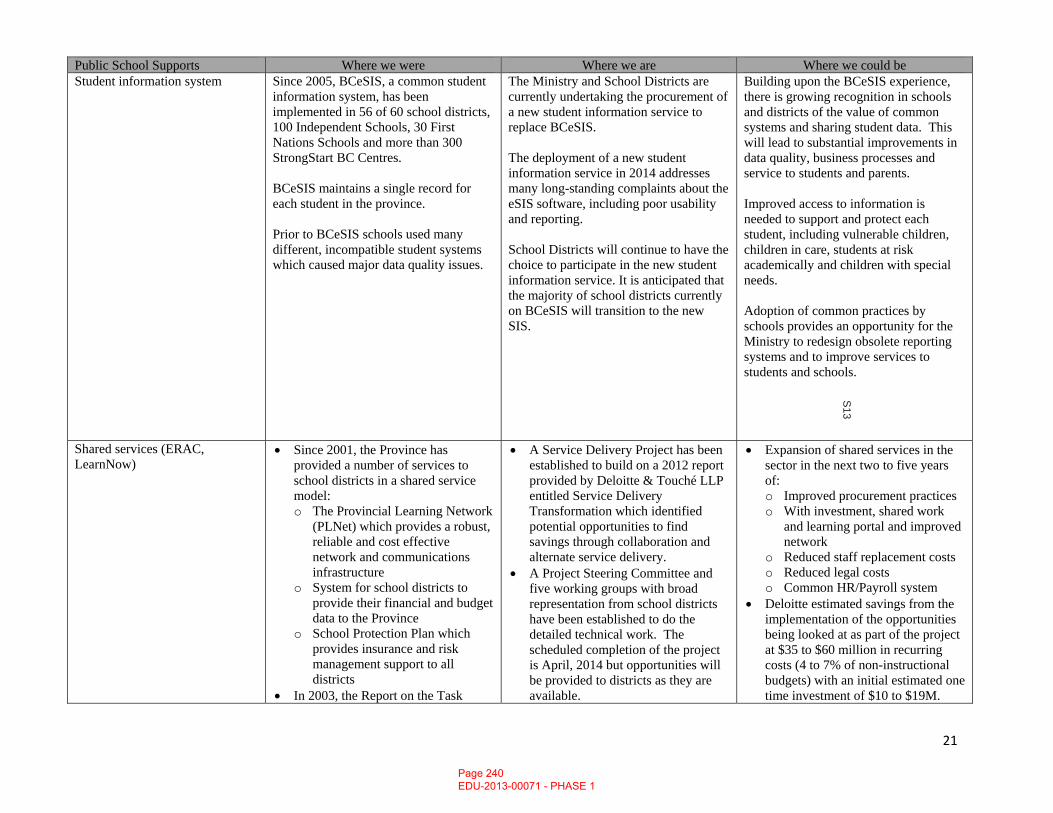
21
Public School Supports Where we were Where we are Where we could be Student information system Since 2005, BCeSIS, a common student
information system, has been implemented in 56 of 60 school districts, 100 Independent Schools, 30 First Nations Schools and more than 300 StrongStart BC Centres. BCeSIS maintains a single record for each student in the province. Prior to BCeSIS schools used many different, incompatible student systems which caused major data quality issues.
The Ministry and School Districts are currently undertaking the procurement of a new student information service to replace BCeSIS. The deployment of a new student information service in 2014 addresses many long-standing complaints about the eSIS software, including poor usability and reporting. School Districts will continue to have the choice to participate in the new student information service. It is anticipated that the majority of school districts currently on BCeSIS will transition to the new SIS.
Building upon the BCeSIS experience, there is growing recognition in schools and districts of the value of common systems and sharing student data. This will lead to substantial improvements in data quality, business processes and service to students and parents. Improved access to information is needed to support and protect each student, including vulnerable children, children in care, students at risk academically and children with special needs. Adoption of common practices by schools provides an opportunity for the Ministry to redesign obsolete reporting systems and to improve services to students and schools.
Shared services (ERAC, LearnNow)
• Since 2001, the Province has provided a number of services to school districts in a shared service model: o The Provincial Learning Network
(PLNet) which provides a robust, reliable and cost effective network and communications infrastructure
o System for school districts to provide their financial and budget data to the Province
o School Protection Plan which provides insurance and risk management support to all districts
• In 2003, the Report on the Task
• A Service Delivery Project has been established to build on a 2012 report provided by Deloitte & Touché LLP entitled Service Delivery Transformation which identified potential opportunities to find savings through collaboration and alternate service delivery.
• A Project Steering Committee and five working groups with broad representation from school districts have been established to do the detailed technical work. The scheduled completion of the project is April, 2014 but opportunities will be provided to districts as they are available.
• Expansion of shared services in the sector in the next two to five years of: o Improved procurement practices o With investment, shared work
and learning portal and improved network
o Reduced staff replacement costs o Reduced legal costs o Common HR/Payroll system
• Deloitte estimated savings from the implementation of the opportunities being looked at as part of the project at $35 to $60 million in recurring costs (4 to 7% of non-instructional budgets) with an initial estimated one time investment of $10 to $19M.
Page 240 EDU-2013-00071 - PHASE 1
S13
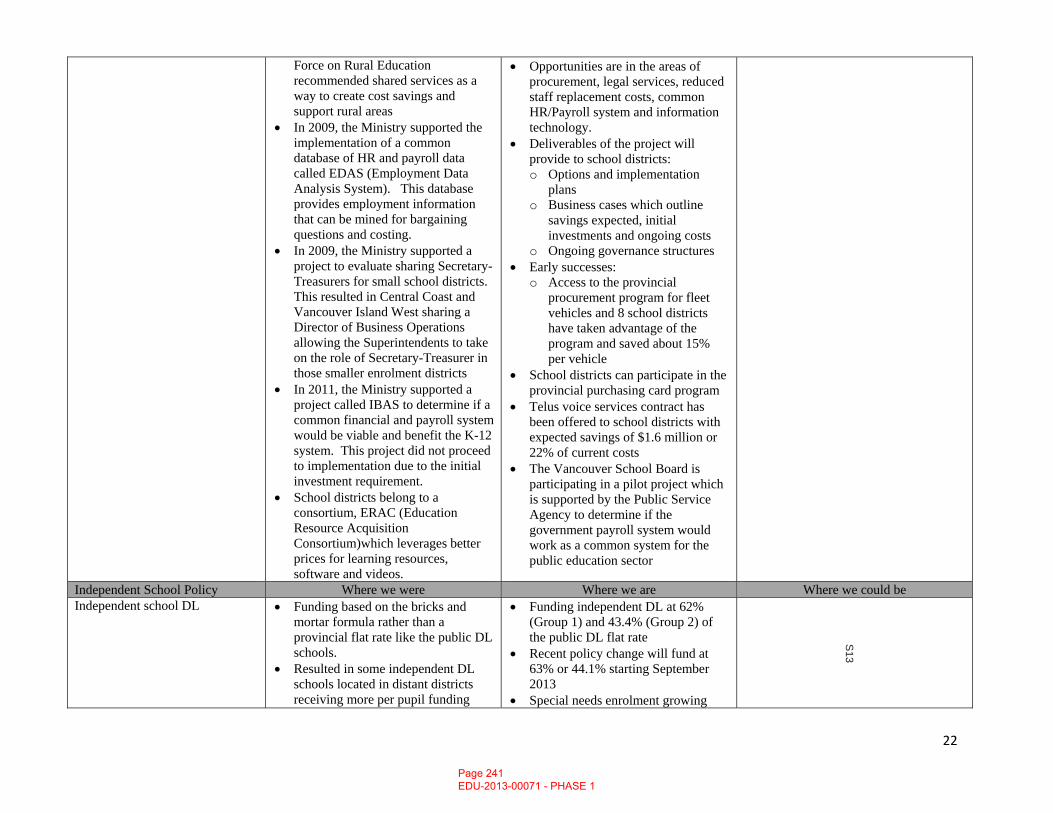
22
Force on Rural Education recommended shared services as a way to create cost savings and support rural areas
• In 2009, the Ministry supported the implementation of a common database of HR and payroll data called EDAS (Employment Data Analysis System). This database provides employment information that can be mined for bargaining questions and costing.
• In 2009, the Ministry supported a project to evaluate sharing Secretary-Treasurers for small school districts. This resulted in Central Coast and Vancouver Island West sharing a Director of Business Operations allowing the Superintendents to take on the role of Secretary-Treasurer in those smaller enrolment districts
• In 2011, the Ministry supported a project called IBAS to determine if a common financial and payroll system would be viable and benefit the K-12 system. This project did not proceed to implementation due to the initial investment requirement.
• School districts belong to a consortium, ERAC (Education Resource Acquisition Consortium)which leverages better prices for learning resources, software and videos.
• Opportunities are in the areas of procurement, legal services, reduced staff replacement costs, common HR/Payroll system and information technology.
• Deliverables of the project will provide to school districts: o Options and implementation
plans o Business cases which outline
savings expected, initial investments and ongoing costs
o Ongoing governance structures • Early successes:
o Access to the provincial procurement program for fleet vehicles and 8 school districts have taken advantage of the program and saved about 15% per vehicle
• School districts can participate in the provincial purchasing card program
• Telus voice services contract has been offered to school districts with expected savings of $1.6 million or 22% of current costs
• The Vancouver School Board is participating in a pilot project which is supported by the Public Service Agency to determine if the government payroll system would work as a common system for the public education sector
Independent School Policy Where we were Where we are Where we could be Independent school DL • Funding based on the bricks and
mortar formula rather than a provincial flat rate like the public DL schools.
• Resulted in some independent DL schools located in distant districts receiving more per pupil funding
• Funding independent DL at 62% (Group 1) and 43.4% (Group 2) of the public DL flat rate
• Recent policy change will fund at 63% or 44.1% starting September 2013
• Special needs enrolment growing
Page 241 EDU-2013-00071 - PHASE 1
S13
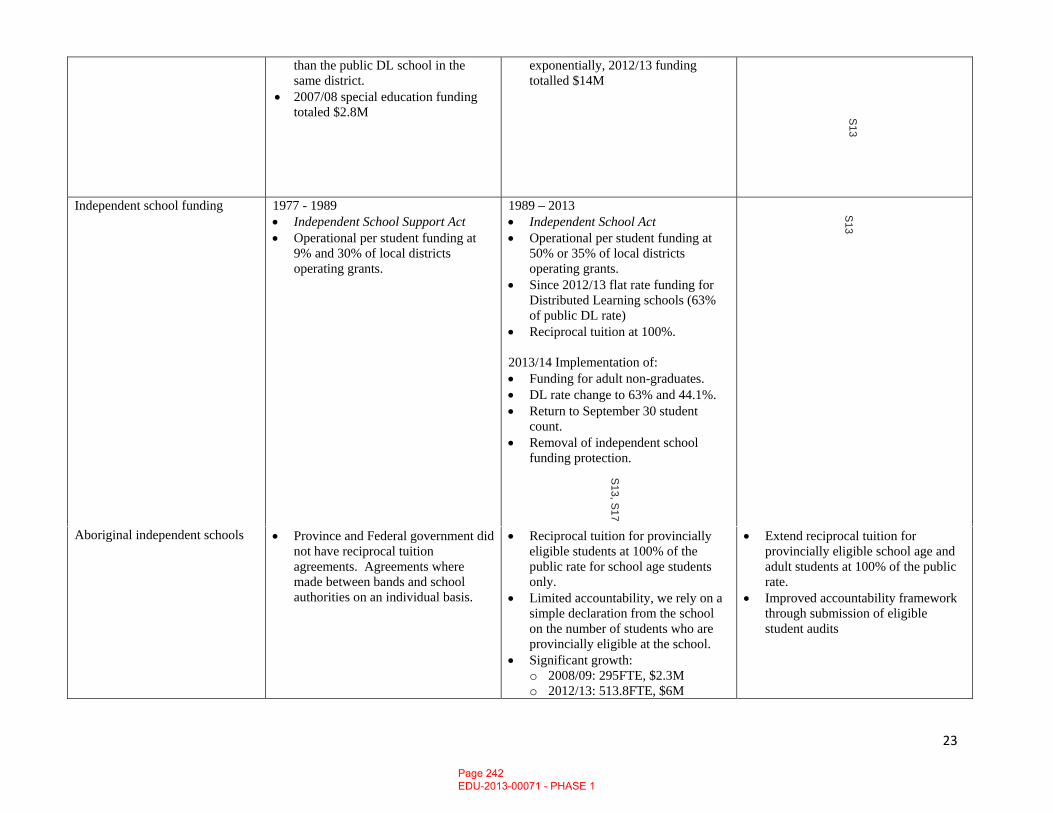
23
than the public DL school in the same district.
• 2007/08 special education funding totaled $2.8M
exponentially, 2012/13 funding totalled $14M
Independent school funding 1977 - 1989 • Independent School Support Act • Operational per student funding at
9% and 30% of local districts operating grants.
1989 – 2013 • Independent School Act • Operational per student funding at
50% or 35% of local districts operating grants.
• Since 2012/13 flat rate funding for Distributed Learning schools (63% of public DL rate)
• Reciprocal tuition at 100%.
2013/14 Implementation of: • Funding for adult non-graduates. • DL rate change to 63% and 44.1%. • Return to September 30 student
count. • Removal of independent school
funding protection.
Aboriginal independent schools • Province and Federal government did not have reciprocal tuition agreements. Agreements where made between bands and school authorities on an individual basis.
• Reciprocal tuition for provincially eligible students at 100% of the public rate for school age students only.
• Limited accountability, we rely on a simple declaration from the school on the number of students who are provincially eligible at the school.
• Significant growth: o 2008/09: 295FTE, $2.3M o 2012/13: 513.8FTE, $6M
• Extend reciprocal tuition for provincially eligible school age and adult students at 100% of the public rate.
• Improved accountability framework through submission of eligible student audits
Page 242 EDU-2013-00071 - PHASE 1
S13
S13, S
17
S13
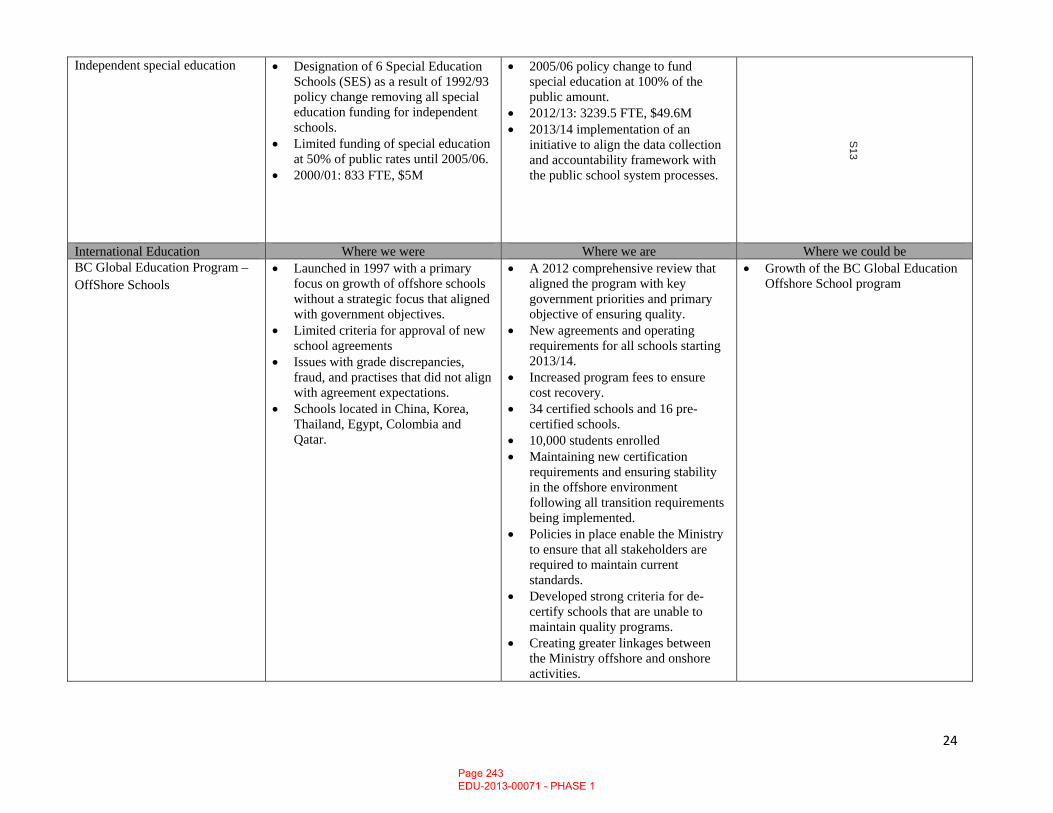
24
Independent special education • Designation of 6 Special Education Schools (SES) as a result of 1992/93 policy change removing all special education funding for independent schools.
• Limited funding of special education at 50% of public rates until 2005/06.
• 2000/01: 833 FTE, $5M
• 2005/06 policy change to fund special education at 100% of the public amount.
• 2012/13: 3239.5 FTE, $49.6M • 2013/14 implementation of an
initiative to align the data collection and accountability framework with the public school system processes.
International Education Where we were Where we are Where we could be BC Global Education Program – OffShore Schools
• Launched in 1997 with a primary focus on growth of offshore schools without a strategic focus that aligned with government objectives.
• Limited criteria for approval of new school agreements
• Issues with grade discrepancies, fraud, and practises that did not align with agreement expectations.
• Schools located in China, Korea, Thailand, Egypt, Colombia and Qatar.
• A 2012 comprehensive review that aligned the program with key government priorities and primary objective of ensuring quality.
• New agreements and operating requirements for all schools starting 2013/14.
• Increased program fees to ensure cost recovery.
• 34 certified schools and 16 pre-certified schools.
• 10,000 students enrolled • Maintaining new certification
requirements and ensuring stability in the offshore environment following all transition requirements being implemented.
• Policies in place enable the Ministry to ensure that all stakeholders are required to maintain current standards.
• Developed strong criteria for de-certify schools that are unable to maintain quality programs.
• Creating greater linkages between the Ministry offshore and onshore activities.
• Growth of the BC Global Education Offshore School program
Page 243 EDU-2013-00071 - PHASE 1
S13
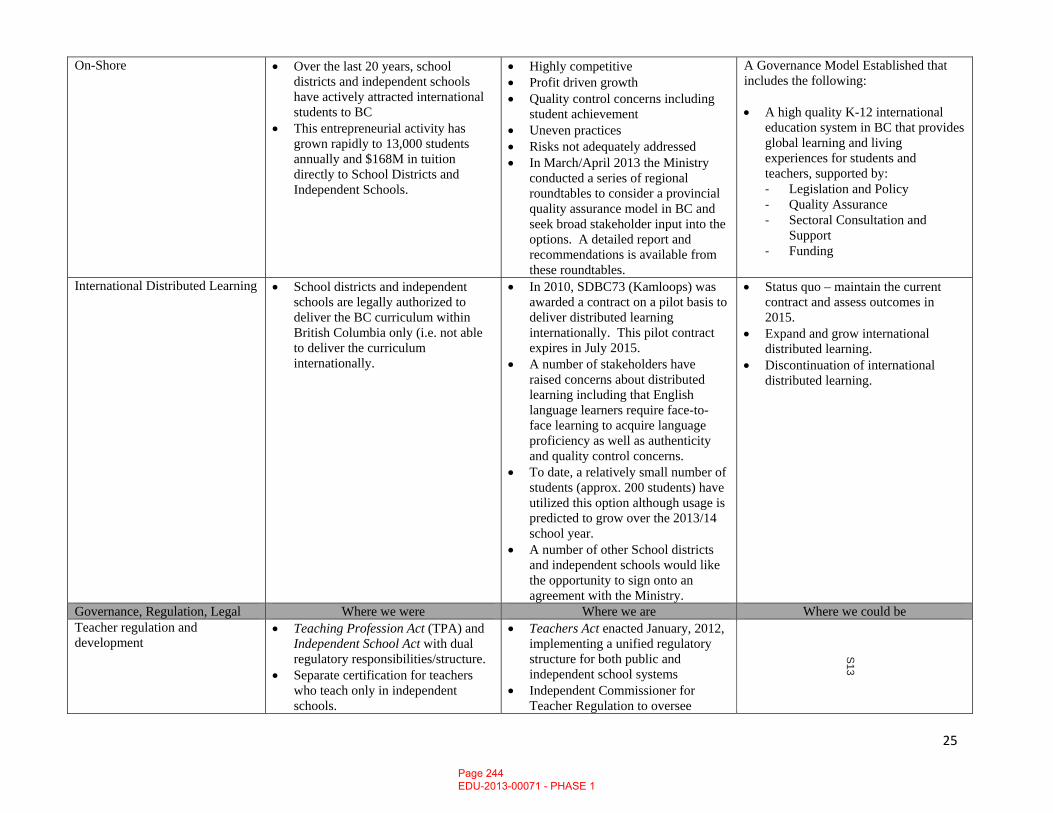
25
On-Shore • Over the last 20 years, school districts and independent schools have actively attracted international students to BC
• This entrepreneurial activity has grown rapidly to 13,000 students annually and $168M in tuition directly to School Districts and Independent Schools.
• Highly competitive • Profit driven growth • Quality control concerns including
student achievement • Uneven practices • Risks not adequately addressed • In March/April 2013 the Ministry
conducted a series of regional roundtables to consider a provincial quality assurance model in BC and seek broad stakeholder input into the options. A detailed report and recommendations is available from these roundtables.
A Governance Model Established that includes the following: • A high quality K-12 international
education system in BC that provides global learning and living experiences for students and teachers, supported by: ‐ Legislation and Policy ‐ Quality Assurance ‐ Sectoral Consultation and
Support ‐ Funding
International Distributed Learning • School districts and independent
schools are legally authorized to deliver the BC curriculum within British Columbia only (i.e. not able to deliver the curriculum internationally.
• In 2010, SDBC73 (Kamloops) was awarded a contract on a pilot basis to deliver distributed learning internationally. This pilot contract expires in July 2015.
• A number of stakeholders have raised concerns about distributed learning including that English language learners require face-to-face learning to acquire language proficiency as well as authenticity and quality control concerns.
• To date, a relatively small number of students (approx. 200 students) have utilized this option although usage is predicted to grow over the 2013/14 school year.
• A number of other School districts and independent schools would like the opportunity to sign onto an agreement with the Ministry.
• Status quo – maintain the current contract and assess outcomes in 2015.
• Expand and grow international distributed learning.
• Discontinuation of international distributed learning.
Governance, Regulation, Legal Where we were Where we are Where we could be Teacher regulation and development
• Teaching Profession Act (TPA) and Independent School Act with dual regulatory responsibilities/structure.
• Separate certification for teachers who teach only in independent schools.
• Teachers Act enacted January, 2012, implementing a unified regulatory structure for both public and independent school systems
• Independent Commissioner for Teacher Regulation to oversee
Page 244 EDU-2013-00071 - PHASE 1
S13
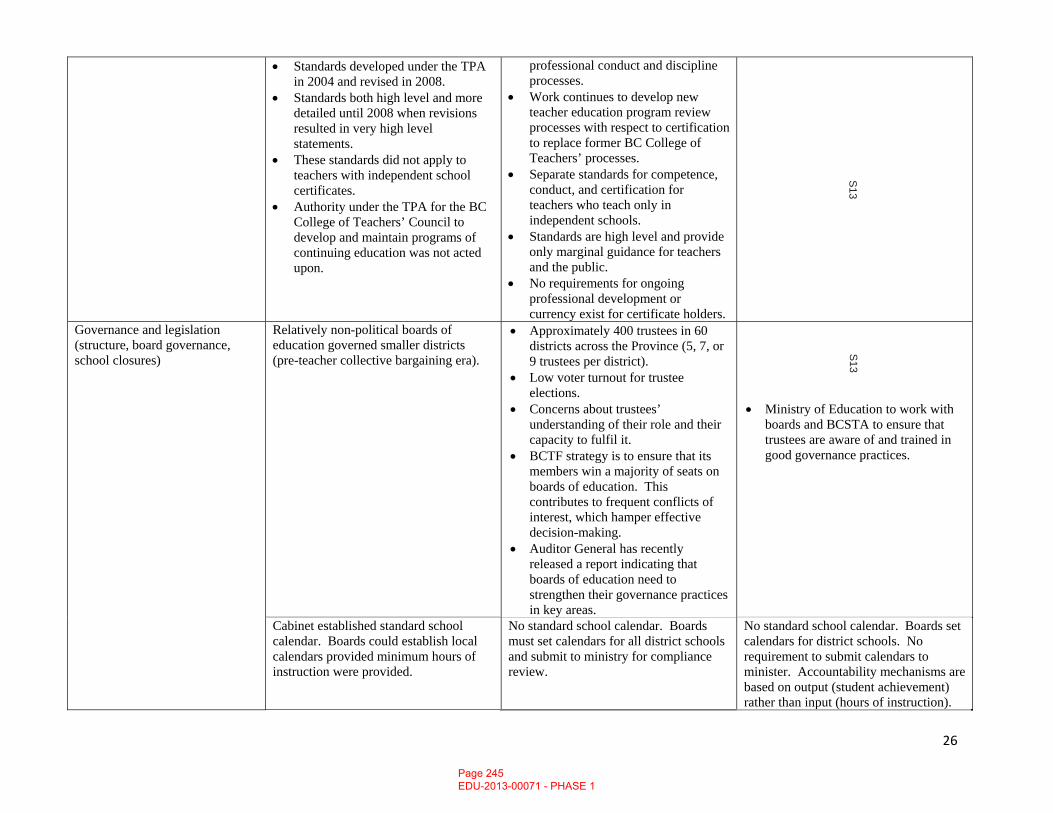
26
• Standards developed under the TPA in 2004 and revised in 2008.
• Standards both high level and more detailed until 2008 when revisions resulted in very high level statements.
• These standards did not apply to teachers with independent school certificates.
• Authority under the TPA for the BC College of Teachers’ Council to develop and maintain programs of continuing education was not acted upon.
professional conduct and discipline processes.
• Work continues to develop new teacher education program review processes with respect to certification to replace former BC College of Teachers’ processes.
• Separate standards for competence, conduct, and certification for teachers who teach only in independent schools.
• Standards are high level and provide only marginal guidance for teachers and the public.
• No requirements for ongoing professional development or currency exist for certificate holders.
Governance and legislation (structure, board governance, school closures)
Relatively non-political boards of education governed smaller districts (pre-teacher collective bargaining era).
• Approximately 400 trustees in 60 districts across the Province (5, 7, or 9 trustees per district).
• Low voter turnout for trustee elections.
• Concerns about trustees’ understanding of their role and their capacity to fulfil it.
• BCTF strategy is to ensure that its members win a majority of seats on boards of education. This contributes to frequent conflicts of interest, which hamper effective decision-making.
• Auditor General has recently released a report indicating that boards of education need to strengthen their governance practices in key areas.
• Ministry of Education to work with boards and BCSTA to ensure that trustees are aware of and trained in good governance practices.
Cabinet established standard school calendar. Boards could establish local calendars provided minimum hours of instruction were provided.
No standard school calendar. Boards must set calendars for all district schools and submit to ministry for compliance review.
No standard school calendar. Boards set calendars for district schools. No requirement to submit calendars to minister. Accountability mechanisms are based on output (student achievement) rather than input (hours of instruction).
Page 245 EDU-2013-00071 - PHASE 1
S13
S13
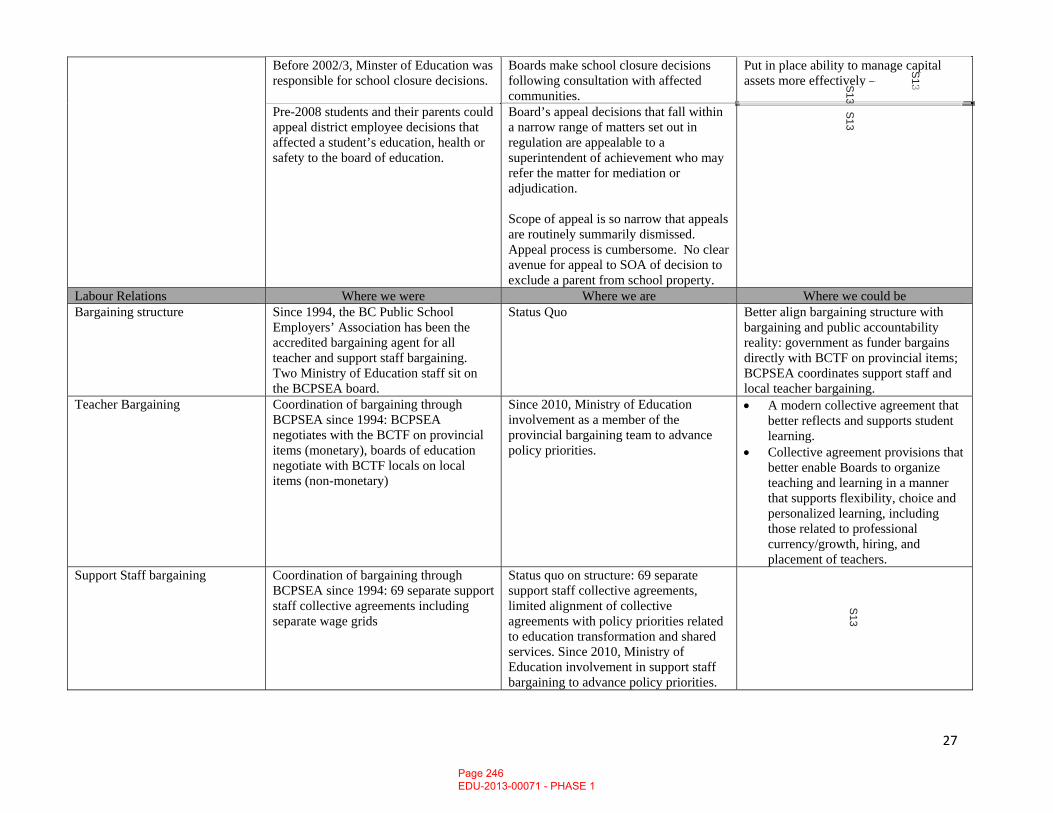
27
Before 2002/3, Minster of Education was responsible for school closure decisions.
Boards make school closure decisions following consultation with affected communities.
Put in place ability to manage capital assets more effectively –
Pre-2008 students and their parents could appeal district employee decisions that affected a student’s education, health or safety to the board of education.
Board’s appeal decisions that fall within a narrow range of matters set out in regulation are appealable to a superintendent of achievement who may refer the matter for mediation or adjudication. Scope of appeal is so narrow that appeals are routinely summarily dismissed. Appeal process is cumbersome. No clear avenue for appeal to SOA of decision to exclude a parent from school property.
Labour Relations Where we were Where we are Where we could be Bargaining structure Since 1994, the BC Public School
Employers’ Association has been the accredited bargaining agent for all teacher and support staff bargaining. Two Ministry of Education staff sit on the BCPSEA board.
Status Quo Better align bargaining structure with bargaining and public accountability reality: government as funder bargains directly with BCTF on provincial items; BCPSEA coordinates support staff and local teacher bargaining.
Teacher Bargaining Coordination of bargaining through BCPSEA since 1994: BCPSEA negotiates with the BCTF on provincial items (monetary), boards of education negotiate with BCTF locals on local items (non-monetary)
Since 2010, Ministry of Education involvement as a member of the provincial bargaining team to advance policy priorities.
• A modern collective agreement that better reflects and supports student learning.
• Collective agreement provisions that better enable Boards to organize teaching and learning in a manner that supports flexibility, choice and personalized learning, including those related to professional currency/growth, hiring, and placement of teachers.
Support Staff bargaining Coordination of bargaining through BCPSEA since 1994: 69 separate support staff collective agreements including separate wage grids
Status quo on structure: 69 separate support staff collective agreements, limited alignment of collective agreements with policy priorities related to education transformation and shared services. Since 2010, Ministry of Education involvement in support staff bargaining to advance policy priorities.
Page 246 EDU-2013-00071 - PHASE 1
S13S
13S
13S
13
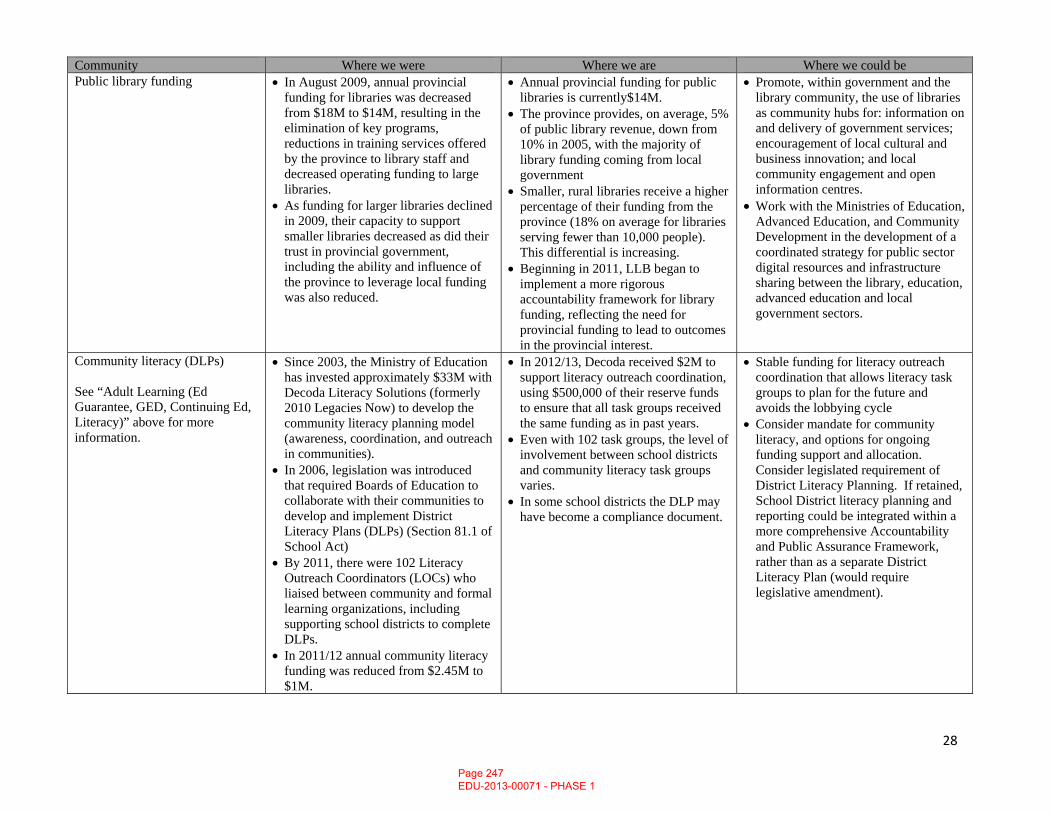
28
Community Where we were Where we are Where we could be Public library funding • In August 2009, annual provincial
funding for libraries was decreased from $18M to $14M, resulting in the elimination of key programs, reductions in training services offered by the province to library staff and decreased operating funding to large libraries.
• As funding for larger libraries declined in 2009, their capacity to support smaller libraries decreased as did their trust in provincial government, including the ability and influence of the province to leverage local funding was also reduced.
• Annual provincial funding for public libraries is currently$14M.
• The province provides, on average, 5% of public library revenue, down from 10% in 2005, with the majority of library funding coming from local government
• Smaller, rural libraries receive a higher percentage of their funding from the province (18% on average for libraries serving fewer than 10,000 people). This differential is increasing.
• Beginning in 2011, LLB began to implement a more rigorous accountability framework for library funding, reflecting the need for provincial funding to lead to outcomes in the provincial interest.
• Promote, within government and the library community, the use of libraries as community hubs for: information on and delivery of government services; encouragement of local cultural and business innovation; and local community engagement and open information centres.
• Work with the Ministries of Education, Advanced Education, and Community Development in the development of a coordinated strategy for public sector digital resources and infrastructure sharing between the library, education, advanced education and local government sectors.
Community literacy (DLPs) See “Adult Learning (Ed Guarantee, GED, Continuing Ed, Literacy)” above for more information.
• Since 2003, the Ministry of Education has invested approximately $33M with Decoda Literacy Solutions (formerly 2010 Legacies Now) to develop the community literacy planning model (awareness, coordination, and outreach in communities).
• In 2006, legislation was introduced that required Boards of Education to collaborate with their communities to develop and implement District Literacy Plans (DLPs) (Section 81.1 of School Act)
• By 2011, there were 102 Literacy Outreach Coordinators (LOCs) who liaised between community and formal learning organizations, including supporting school districts to complete DLPs.
• In 2011/12 annual community literacy funding was reduced from $2.45M to $1M.
• In 2012/13, Decoda received $2M to support literacy outreach coordination, using $500,000 of their reserve funds to ensure that all task groups received the same funding as in past years.
• Even with 102 task groups, the level of involvement between school districts and community literacy task groups varies.
• In some school districts the DLP may have become a compliance document.
• Stable funding for literacy outreach coordination that allows literacy task groups to plan for the future and avoids the lobbying cycle
• Consider mandate for community literacy, and options for ongoing funding support and allocation. Consider legislated requirement of District Literacy Planning. If retained, School District literacy planning and reporting could be integrated within a more comprehensive Accountability and Public Assurance Framework, rather than as a separate District Literacy Plan (would require legislative amendment).
Page 247 EDU-2013-00071 - PHASE 1
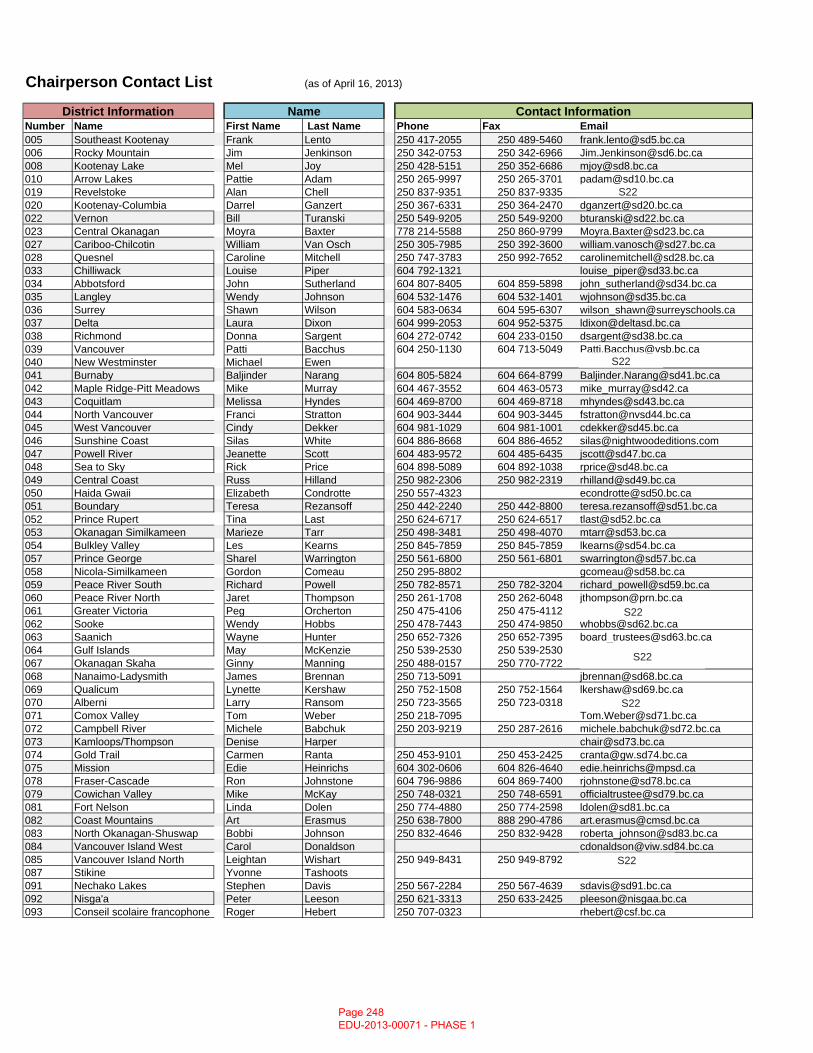
Chairperson Contact List (as of April 16, 2013)
Number Name First Name Last Name Phone Fax Email005 Southeast Kootenay Frank Lento 250 417-2055 250 489-5460 [email protected] Rocky Mountain Jim Jenkinson 250 342-0753 250 342-6966 [email protected] Kootenay Lake Mel Joy 250 428-5151 250 352-6686 [email protected] Arrow Lakes Pattie Adam 250 265-9997 250 265-3701 [email protected] Revelstoke Alan Chell 250 837-9351 250 837-9335020 Kootenay-Columbia Darrel Ganzert 250 367-6331 250 364-2470 [email protected] Vernon Bill Turanski 250 549-9205 250 549-9200 [email protected] Central Okanagan Moyra Baxter 778 214-5588 250 860-9799 [email protected] Cariboo-Chilcotin William Van Osch 250 305-7985 250 392-3600 [email protected] Quesnel Caroline Mitchell 250 747-3783 250 992-7652 [email protected] Chilliwack Louise Piper 604 792-1321 [email protected] Abbotsford John Sutherland 604 807-8405 604 859-5898 [email protected] Langley Wendy Johnson 604 532-1476 604 532-1401 [email protected] Surrey Shawn Wilson 604 583-0634 604 595-6307 [email protected] Delta Laura Dixon 604 999-2053 604 952-5375 [email protected] Richmond Donna Sargent 604 272-0742 604 233-0150 [email protected] Vancouver Patti Bacchus 604 250-1130 604 713-5049 [email protected] New Westminster Michael Ewen041 Burnaby Baljinder Narang 604 805-5824 604 664-8799 [email protected] Maple Ridge-Pitt Meadows Mike Murray 604 467-3552 604 463-0573 [email protected] Coquitlam Melissa Hyndes 604 469-8700 604 469-8718 [email protected] North Vancouver Franci Stratton 604 903-3444 604 903-3445 [email protected] West Vancouver Cindy Dekker 604 981-1029 604 981-1001 [email protected] Sunshine Coast Silas White 604 886-8668 604 886-4652 [email protected] Powell River Jeanette Scott 604 483-9572 604 485-6435 [email protected] Sea to Sky Rick Price 604 898-5089 604 892-1038 [email protected] Central Coast Russ Hilland 250 982-2306 250 982-2319 [email protected] Haida Gwaii Elizabeth Condrotte 250 557-4323 [email protected] Boundary Teresa Rezansoff 250 442-2240 250 442-8800 [email protected] Prince Rupert Tina Last 250 624-6717 250 624-6517 [email protected] Okanagan Similkameen Marieze Tarr 250 498-3481 250 498-4070 [email protected] Bulkley Valley Les Kearns 250 845-7859 250 845-7859 [email protected] Prince George Sharel Warrington 250 561-6800 250 561-6801 [email protected] Nicola-Similkameen Gordon Comeau 250 295-8802 [email protected] Peace River South Richard Powell 250 782-8571 250 782-3204 [email protected] Peace River North Jaret Thompson 250 261-1708 250 262-6048 [email protected] Greater Victoria Peg Orcherton 250 475-4106 250 475-4112062 Sooke Wendy Hobbs 250 478-7443 250 474-9850 [email protected] Saanich Wayne Hunter 250 652-7326 250 652-7395 [email protected] Gulf Islands May McKenzie 250 539-2530 250 539-2530067 Okanagan Skaha Ginny Manning 250 488-0157 250 770-7722068 Nanaimo-Ladysmith James Brennan 250 713-5091 [email protected] Qualicum Lynette Kershaw 250 752-1508 250 752-1564 [email protected] Alberni Larry Ransom 250 723-3565 250 723-0318071 Comox Valley Tom Weber 250 218-7095 [email protected] Campbell River Michele Babchuk 250 203-9219 250 287-2616 [email protected] Kamloops/Thompson Denise Harper [email protected] Gold Trail Carmen Ranta 250 453-9101 250 453-2425 [email protected] Mission Edie Heinrichs 604 302-0606 604 826-4640 [email protected] Fraser-Cascade Ron Johnstone 604 796-9886 604 869-7400 [email protected] Cowichan Valley Mike McKay 250 748-0321 250 748-6591 [email protected] Fort Nelson Linda Dolen 250 774-4880 250 774-2598 [email protected] Coast Mountains Art Erasmus 250 638-7800 888 290-4786 [email protected] North Okanagan-Shuswap Bobbi Johnson 250 832-4646 250 832-9428 [email protected] Vancouver Island West Carol Donaldson [email protected] Vancouver Island North Leightan Wishart 250 949-8431 250 949-8792087 Stikine Yvonne Tashoots091 Nechako Lakes Stephen Davis 250 567-2284 250 567-4639 [email protected] Nisga'a Peter Leeson 250 621-3313 250 633-2425 [email protected] Conseil scolaire francophone Roger Hebert 250 707-0323 [email protected]
District Information Name Contact Information
Page 248 EDU-2013-00071 - PHASE 1
S22
S22
S22
S22
S22
S22

2013 Executive Contact List
Name Title Cell Home James Gorman Deputy Minister Renate Butterfield ADM, Business,
Technology and Online Services
Claire Avison ADM, Governance, Legislation and Regulation
Rod Allen ADM, Learning Paige MacFarlane ADM, Open
Government and Community Partnerships
Doug Stewart A/ADM, Resource Management
Jennifer McCrea Director, CARE Team Rueben Bronee Executive Director,
Strategic Innovation Rick Davis Superintendent,
Achievement Mike Roberts Superintendent, Liaison Sherri Mohoruk Superintendent, Safe
Schools Robert Pauliszyn Director,
Communications Scott Sutherland Manager, Media
Relations and Issues Management
Brett Lowther Manager, Communications
Page 249 EDU-2013-00071 - PHASE 1
S17 S22
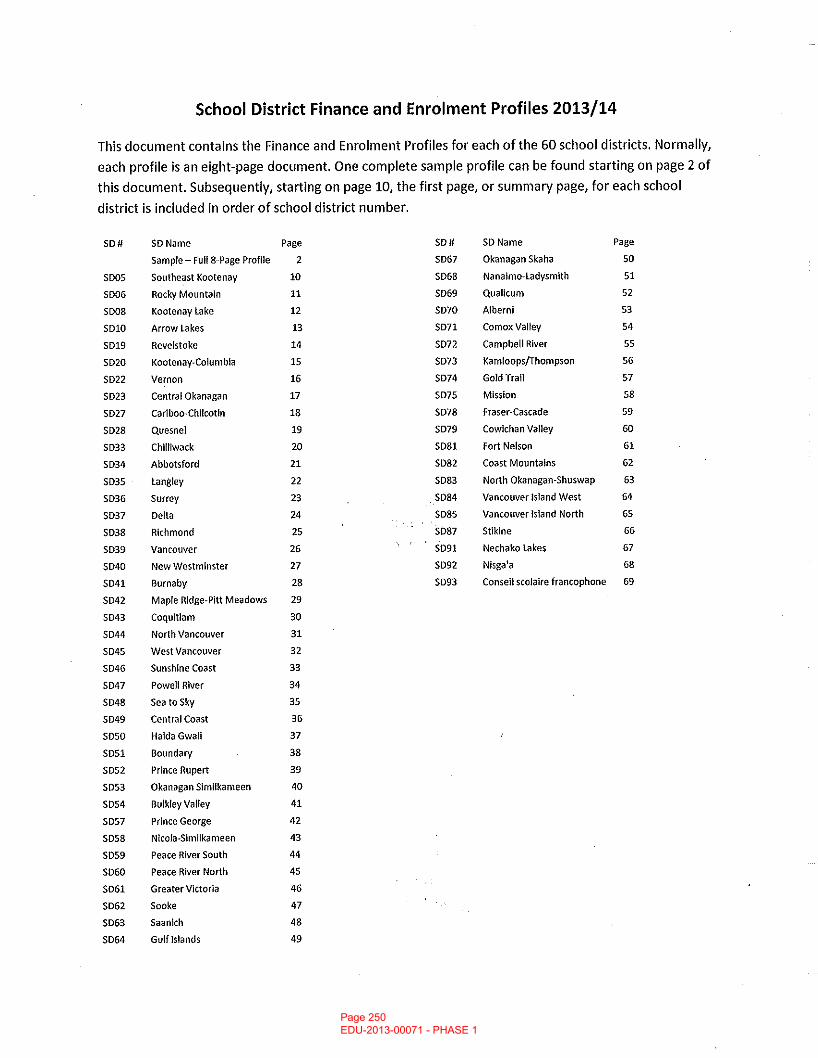
Page 250 EDU-2013-00071 - PHASE 1
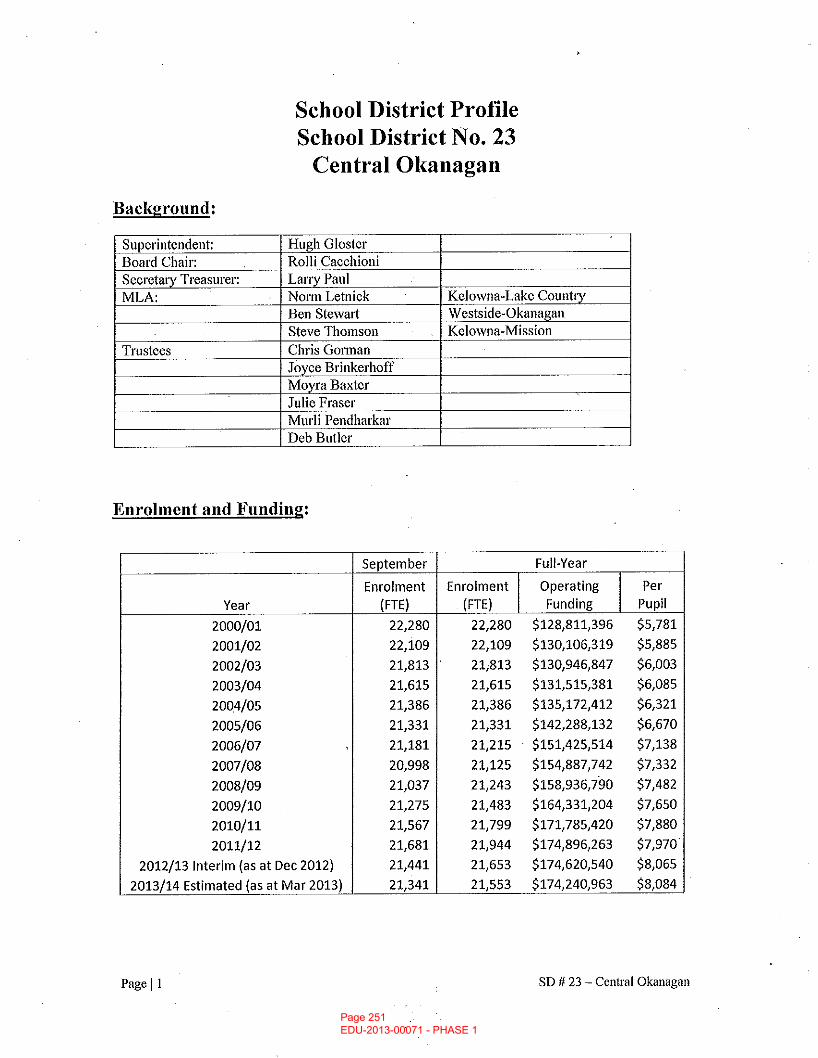
Page 251 EDU-2013-00071 - PHASE 1
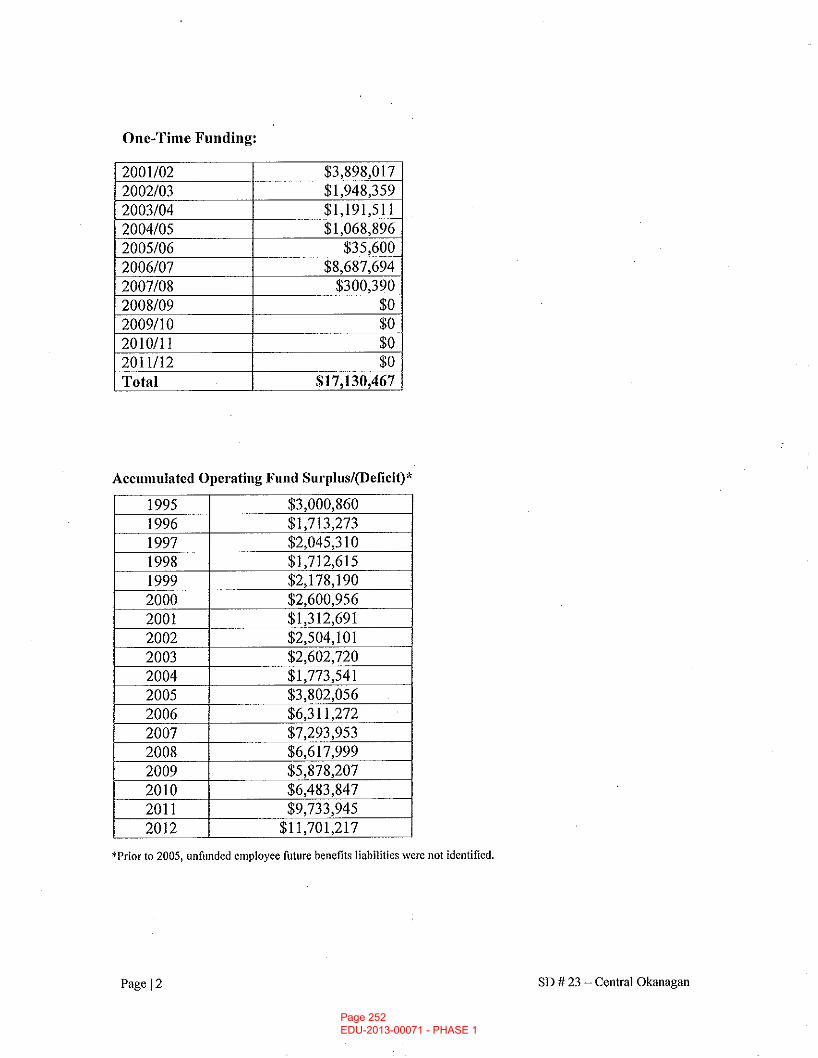
Page 252 EDU-2013-00071 - PHASE 1
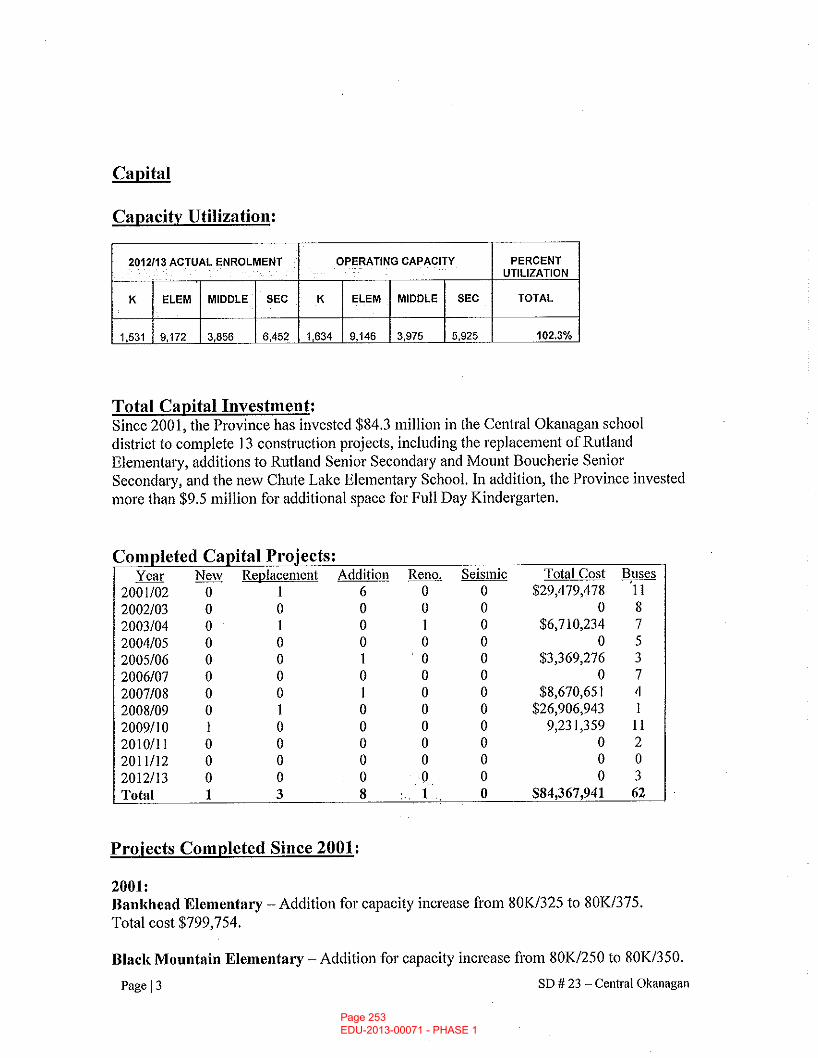
Page 253 EDU-2013-00071 - PHASE 1
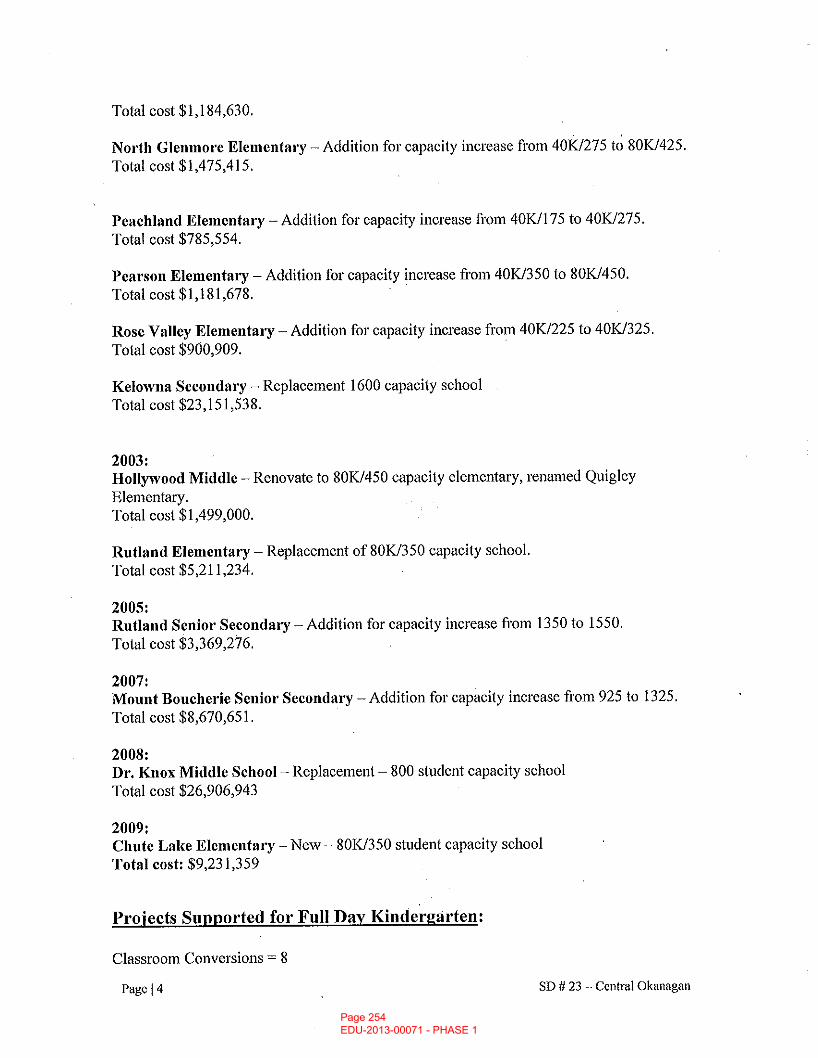
Page 254 EDU-2013-00071 - PHASE 1
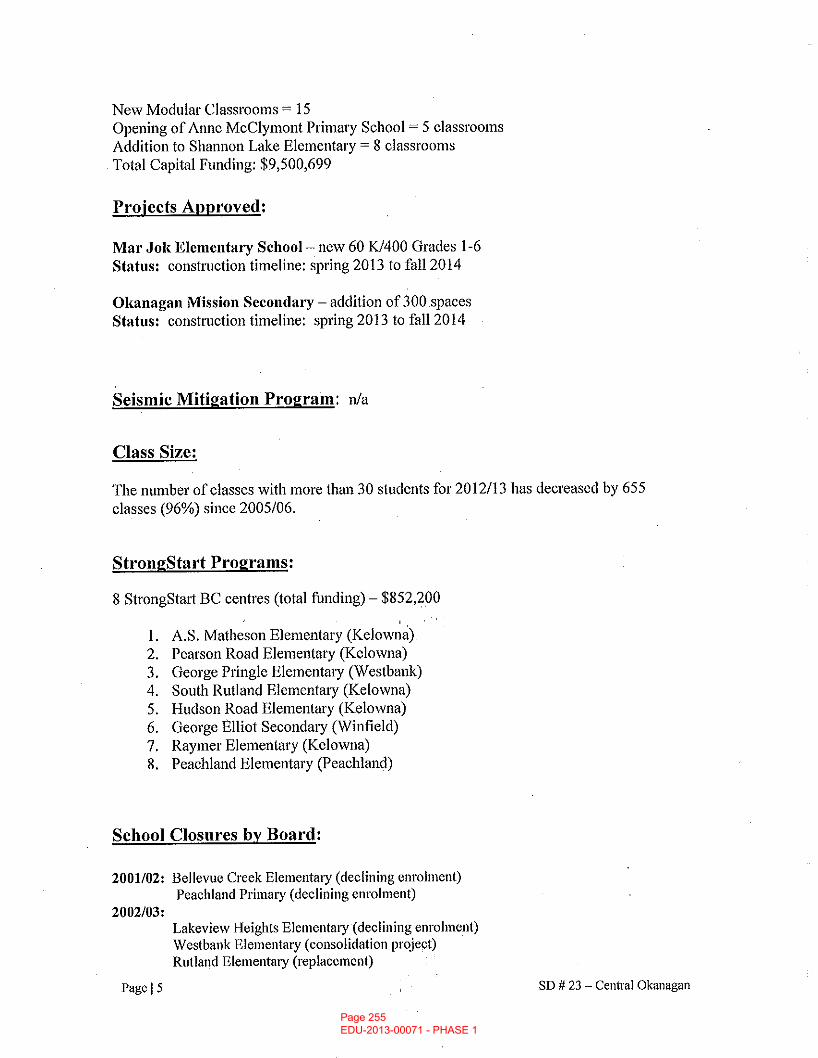
Page 255 EDU-2013-00071 - PHASE 1
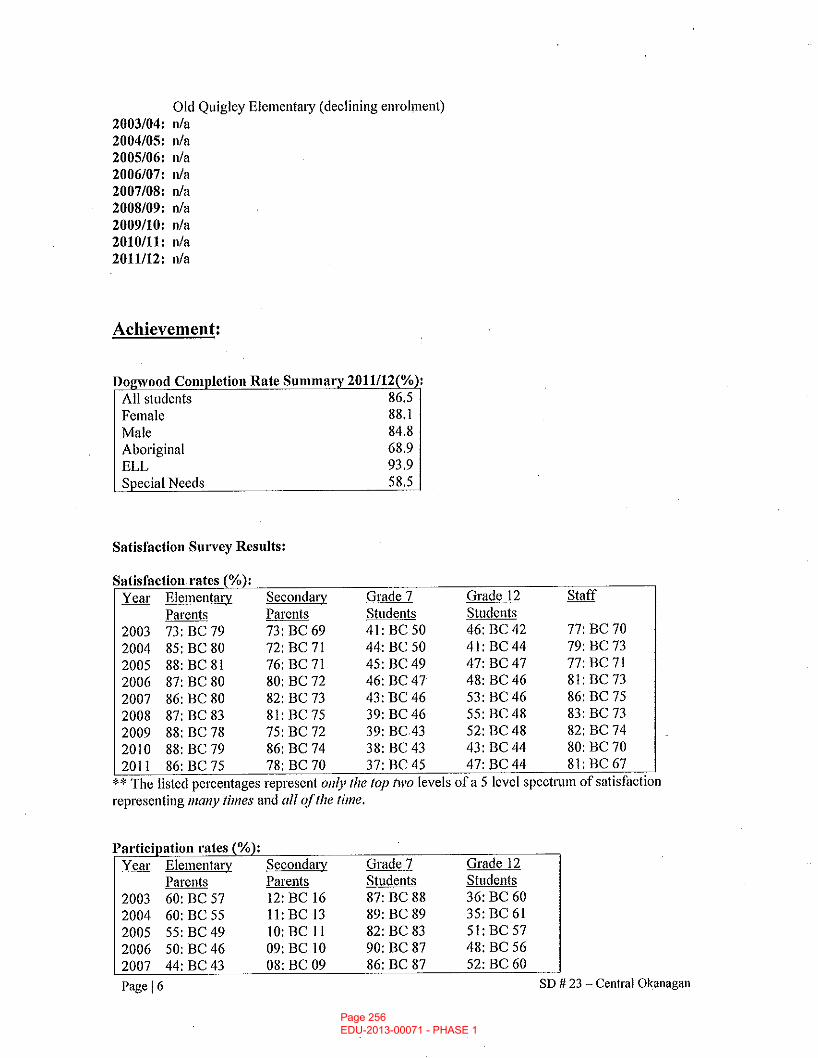
Page 256 EDU-2013-00071 - PHASE 1
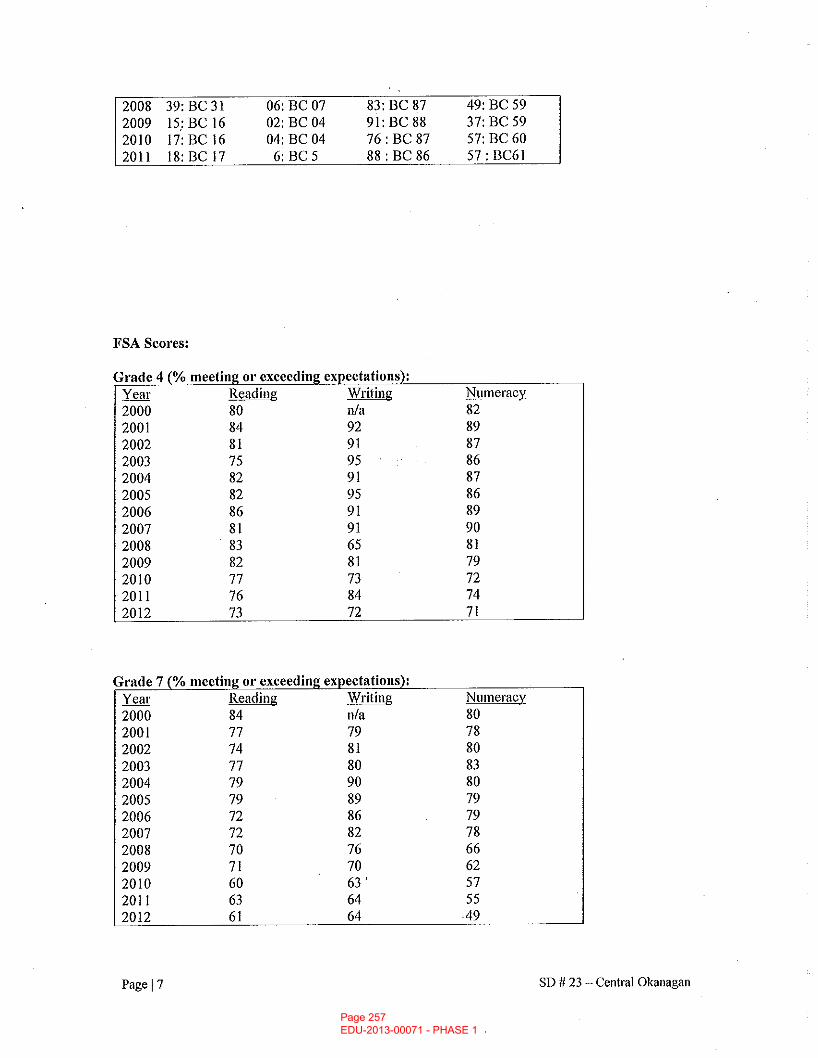
Page 257 EDU-2013-00071 - PHASE 1
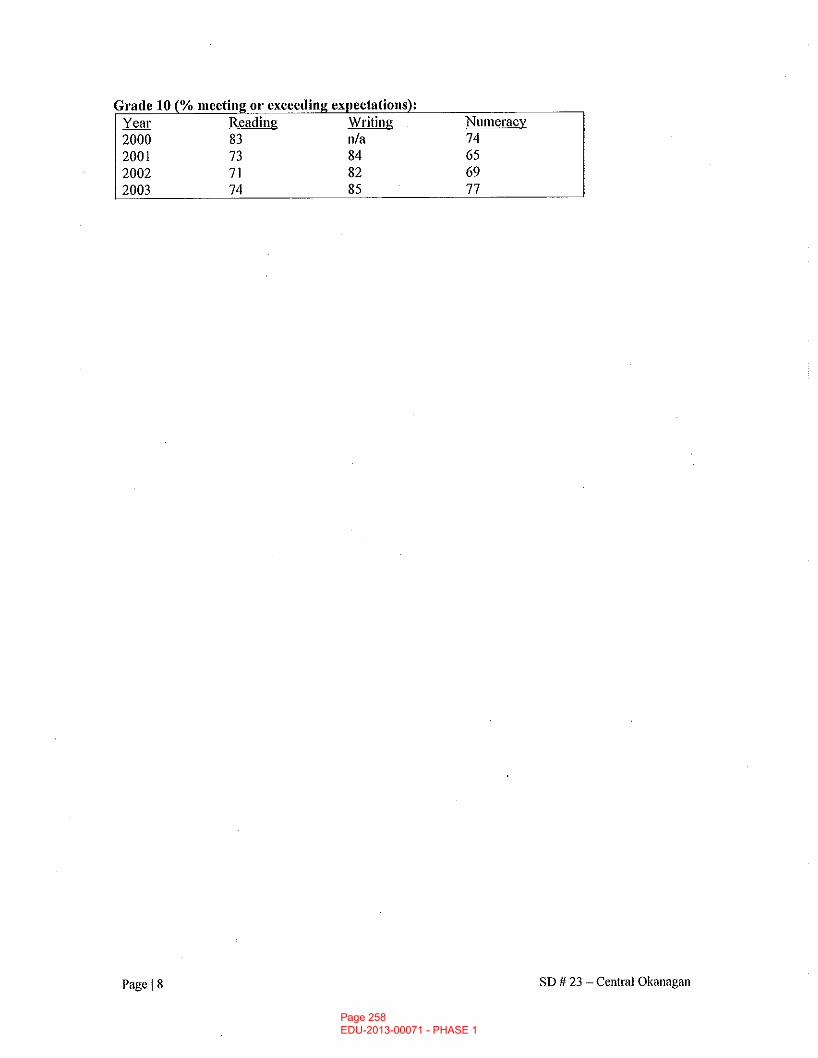
Page 258 EDU-2013-00071 - PHASE 1
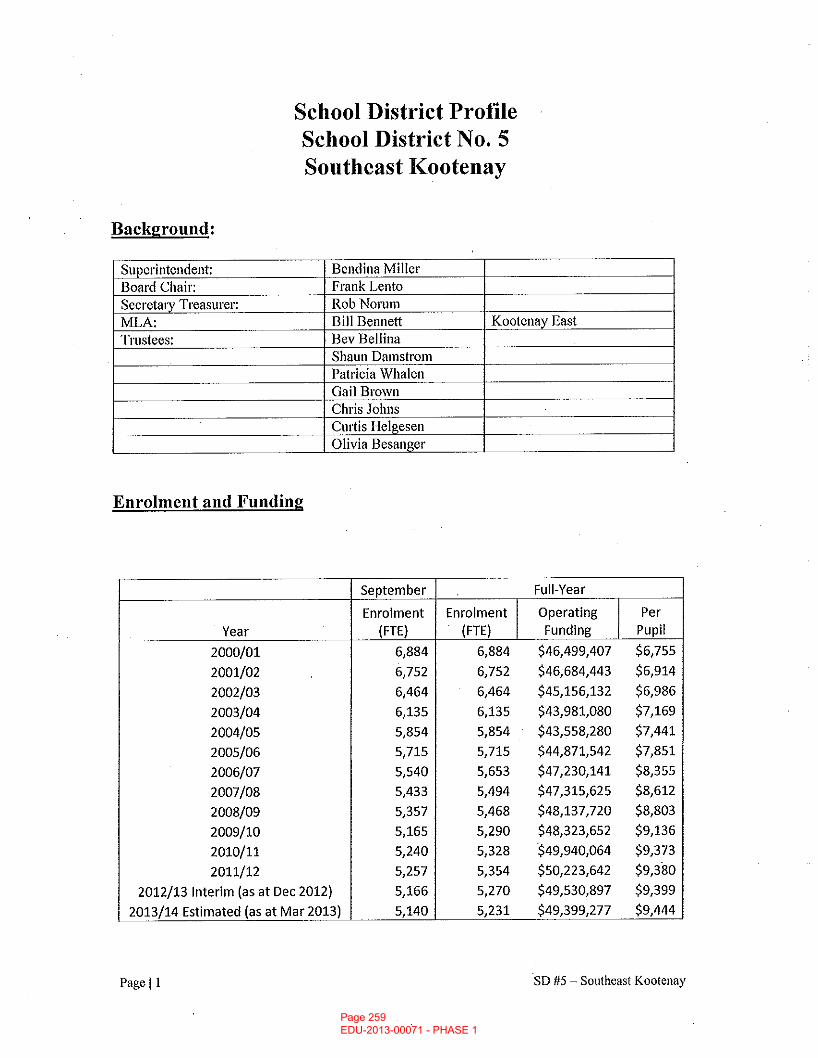
Page 259 EDU-2013-00071 - PHASE 1
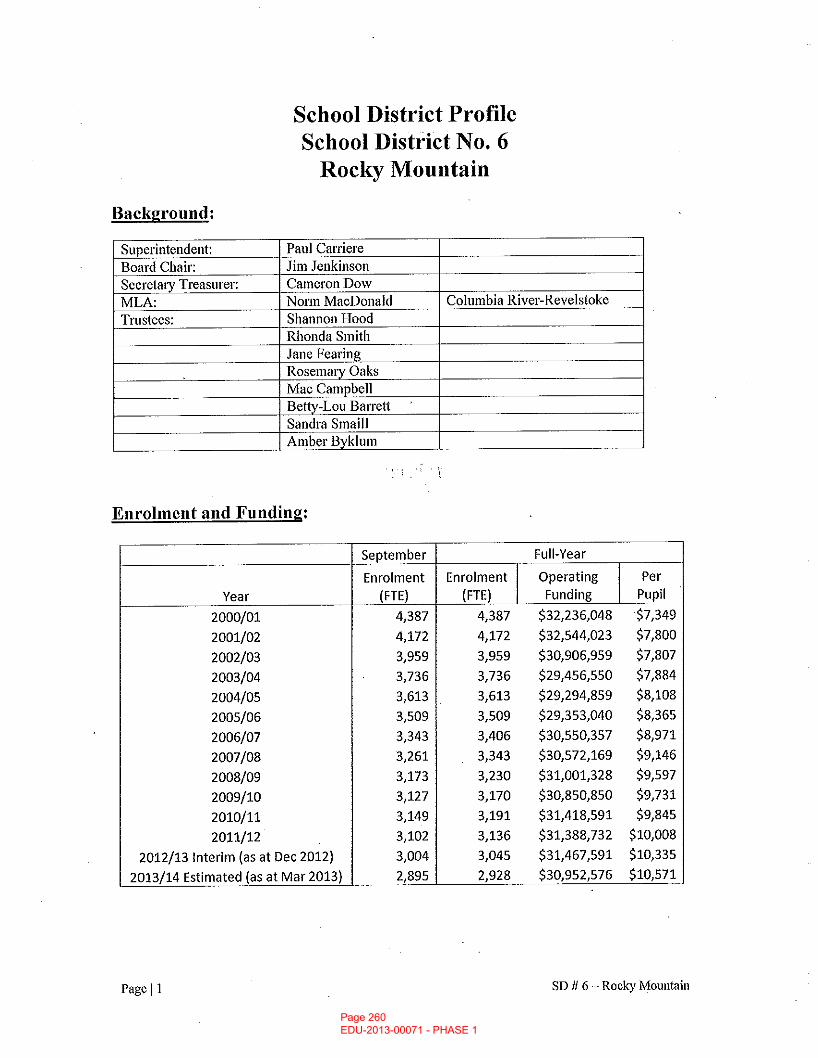
Page 260 EDU-2013-00071 - PHASE 1
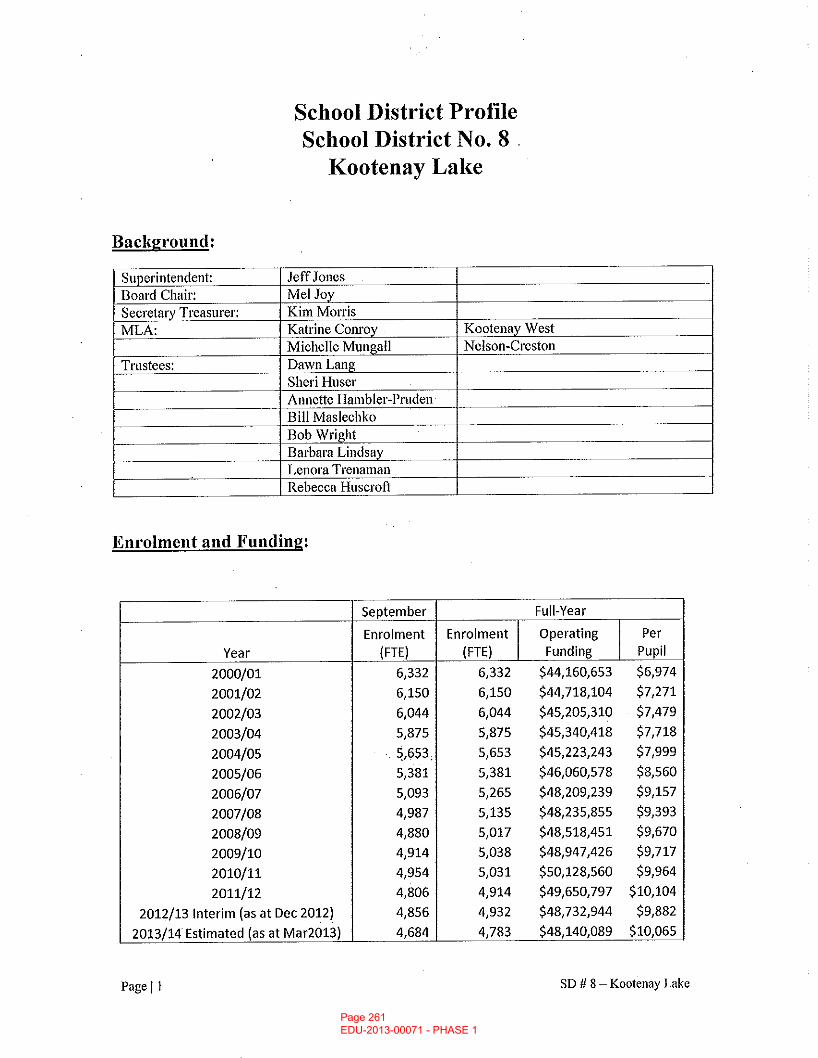
Page 261 EDU-2013-00071 - PHASE 1
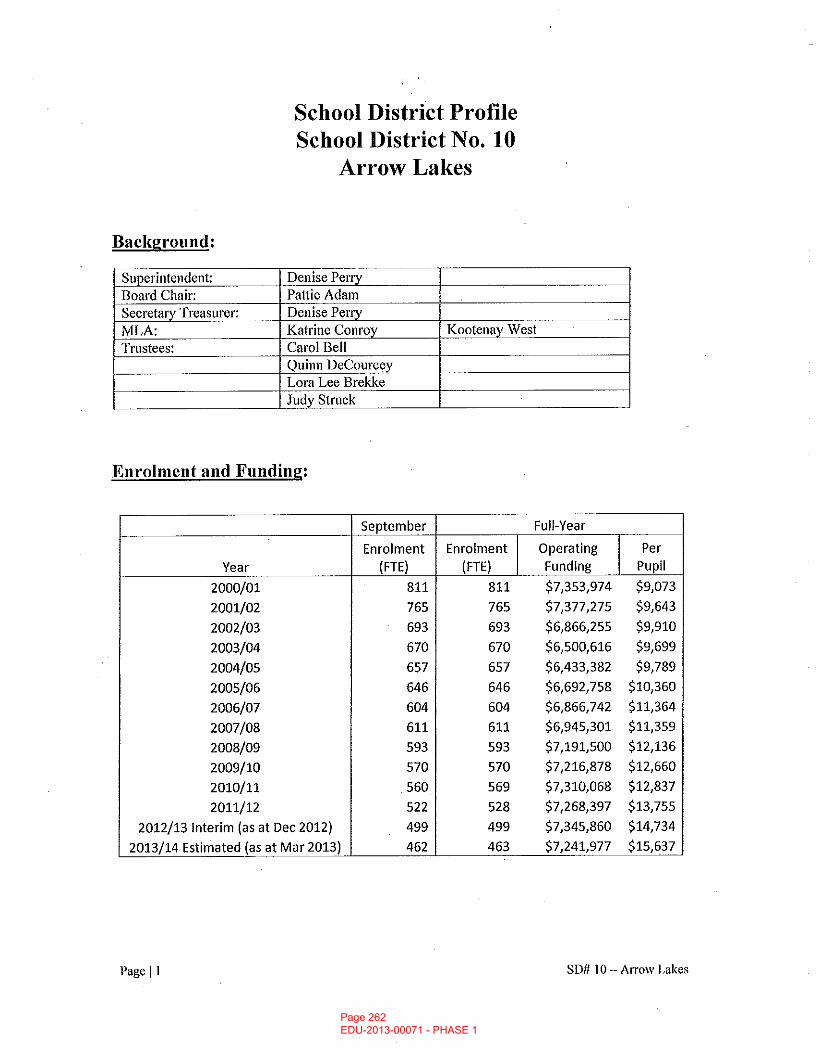
Page 262 EDU-2013-00071 - PHASE 1
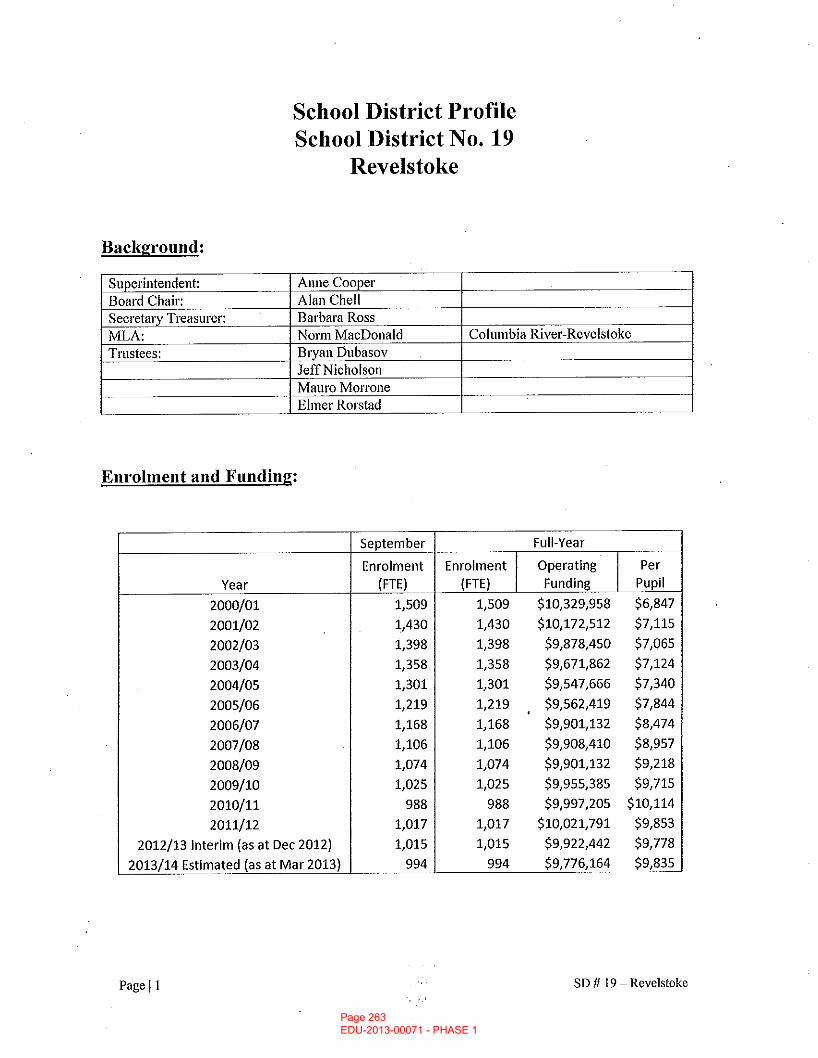
Page 263 EDU-2013-00071 - PHASE 1
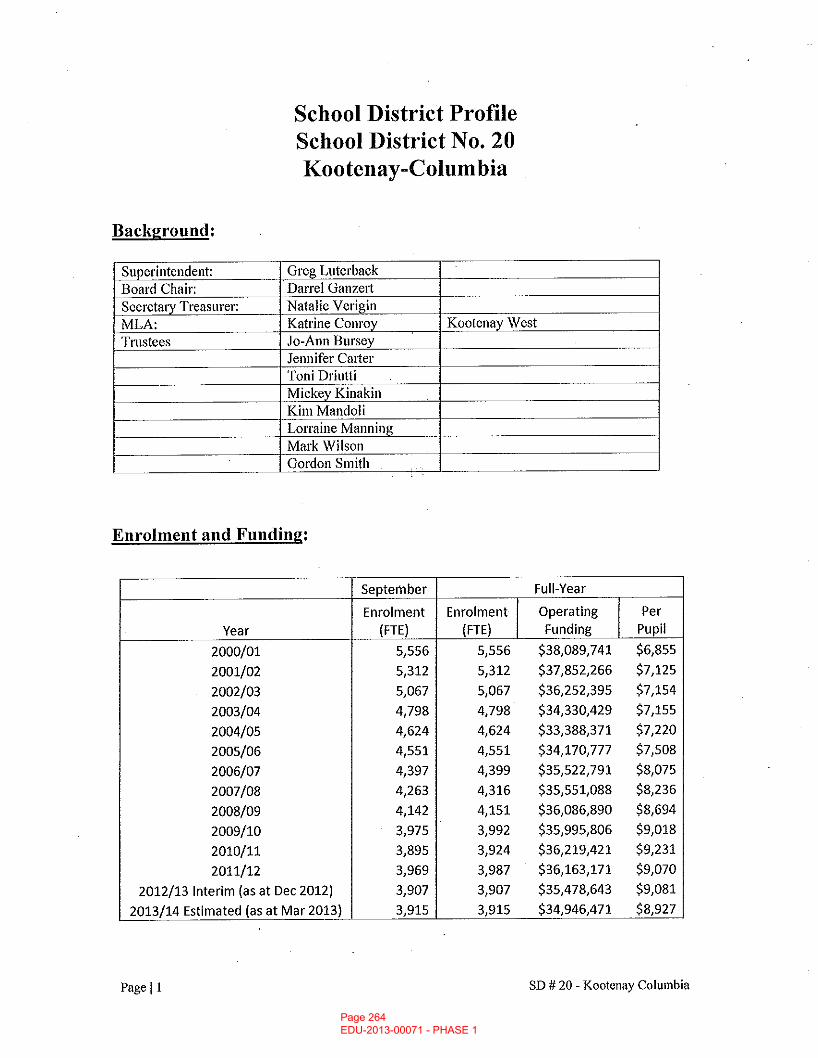
Page 264 EDU-2013-00071 - PHASE 1
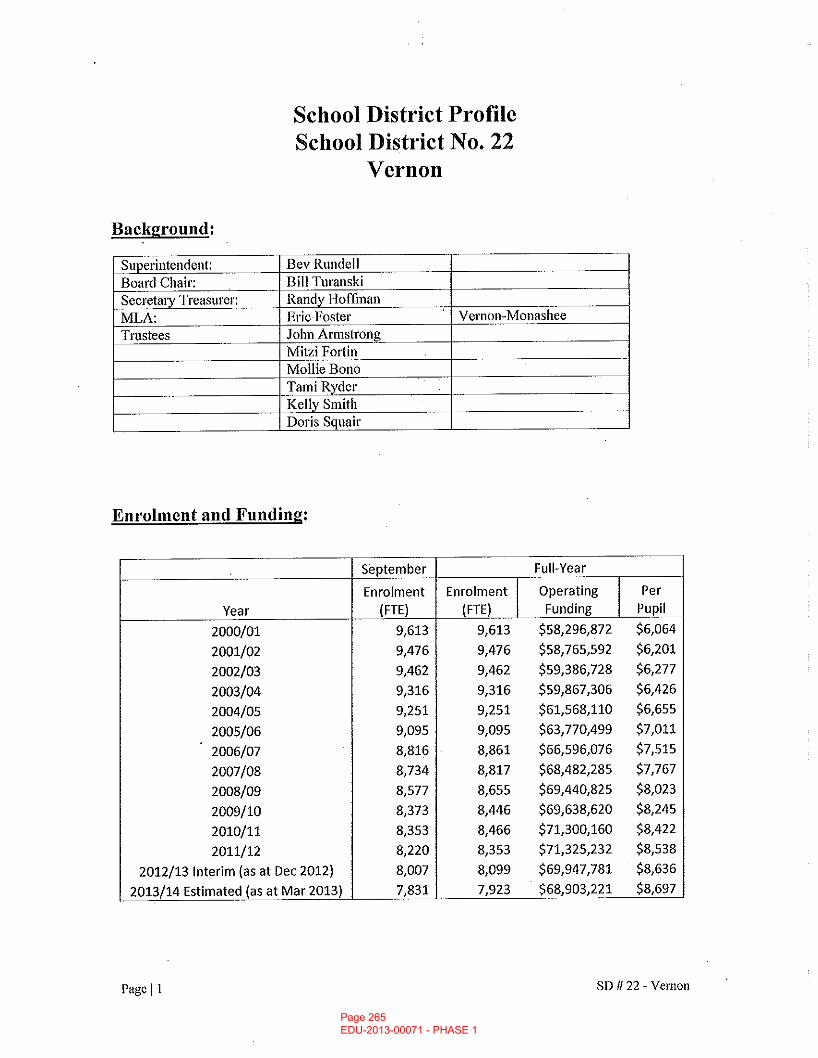
Page 265 EDU-2013-00071 - PHASE 1

Page 266 EDU-2013-00071 - PHASE 1
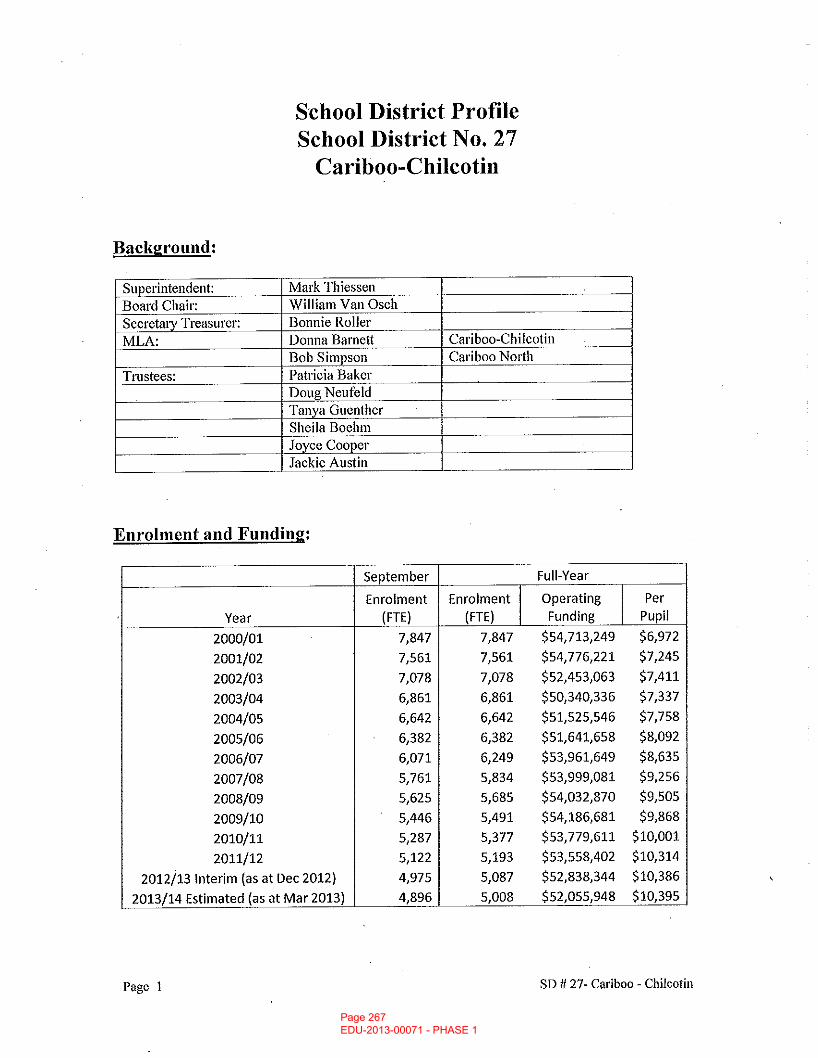
Page 267 EDU-2013-00071 - PHASE 1
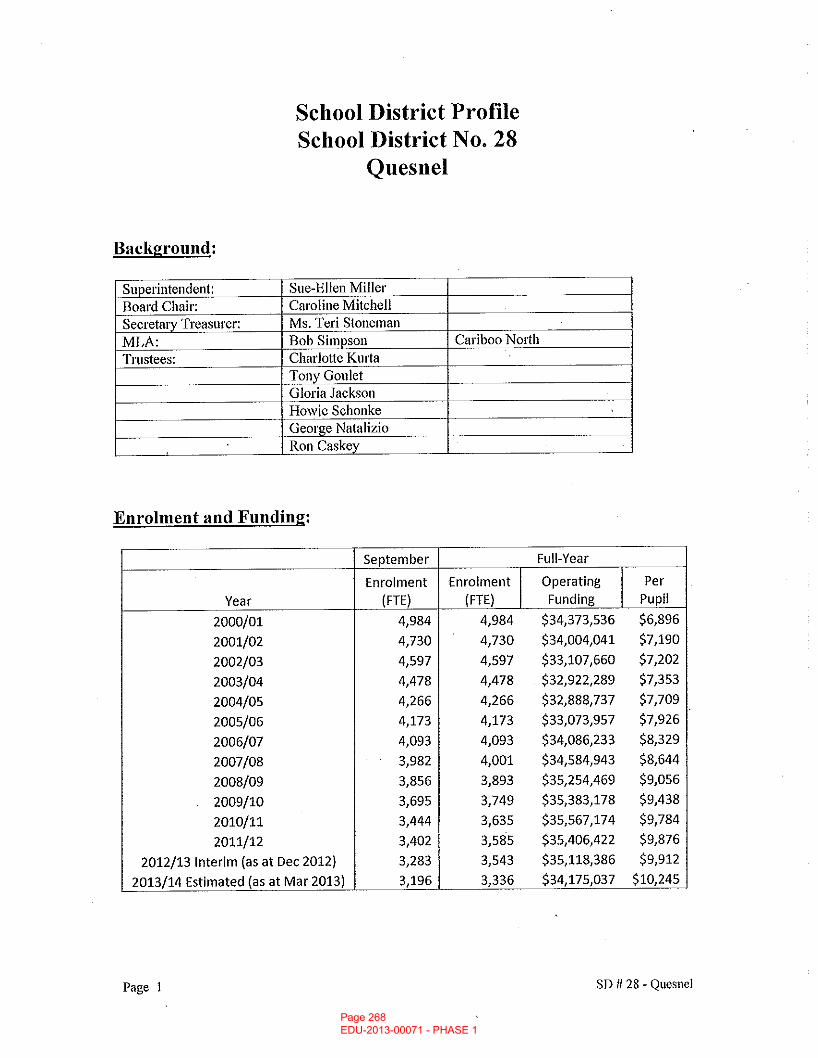
Page 268 EDU-2013-00071 - PHASE 1
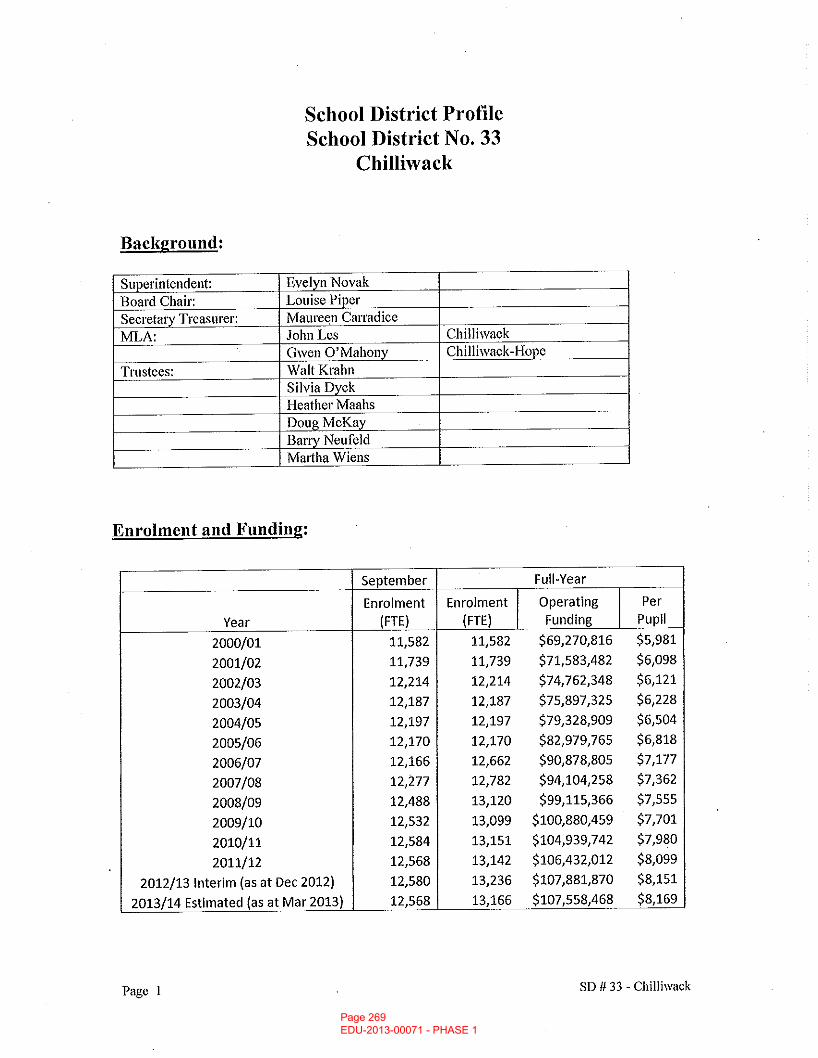
Page 269 EDU-2013-00071 - PHASE 1
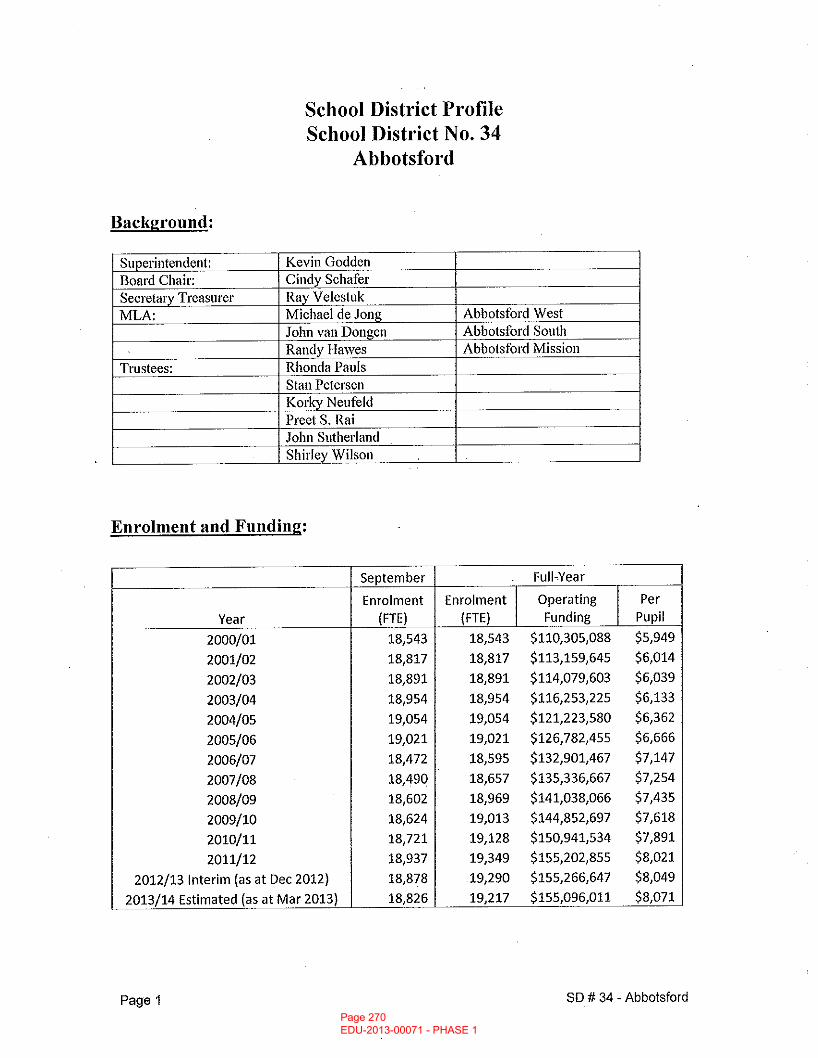
Page 270 EDU-2013-00071 - PHASE 1
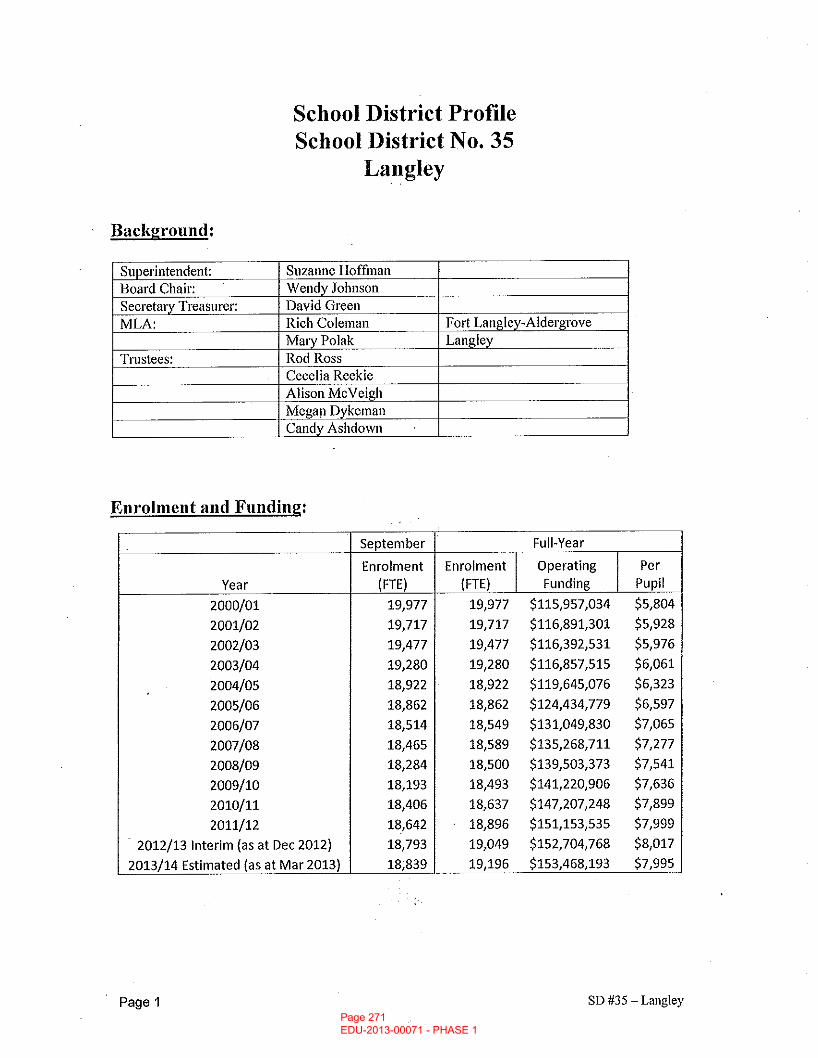
Page 271 EDU-2013-00071 - PHASE 1
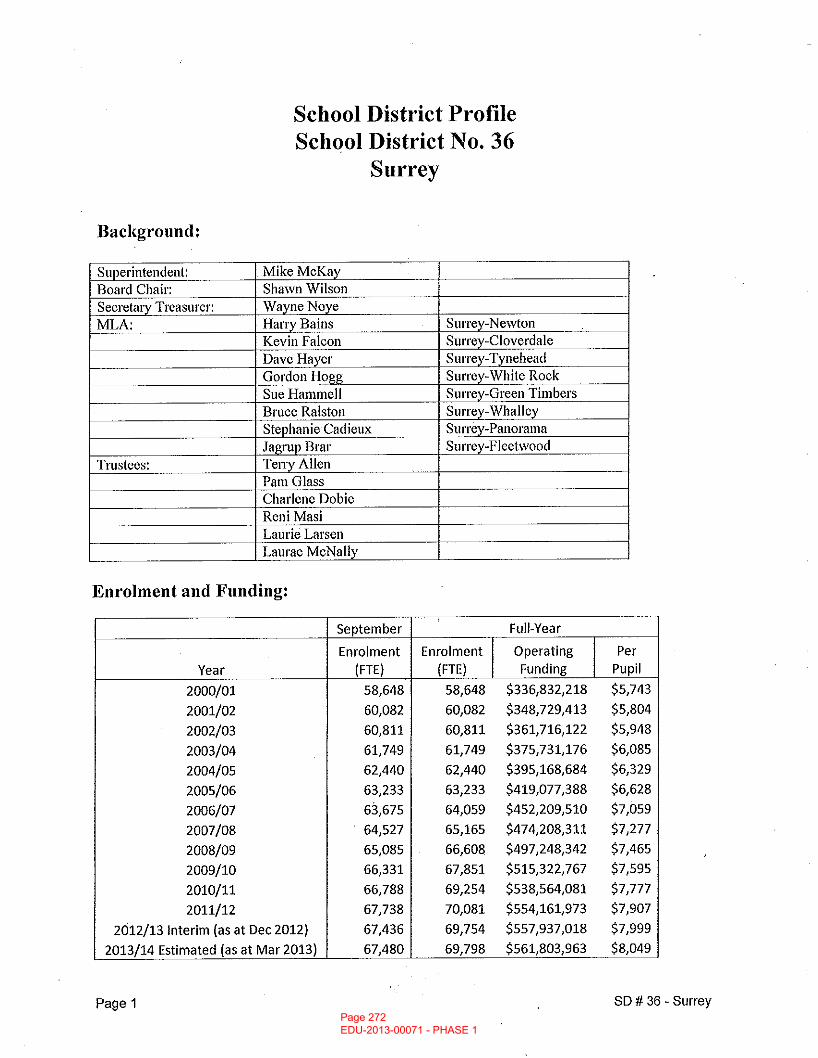
Page 272 EDU-2013-00071 - PHASE 1
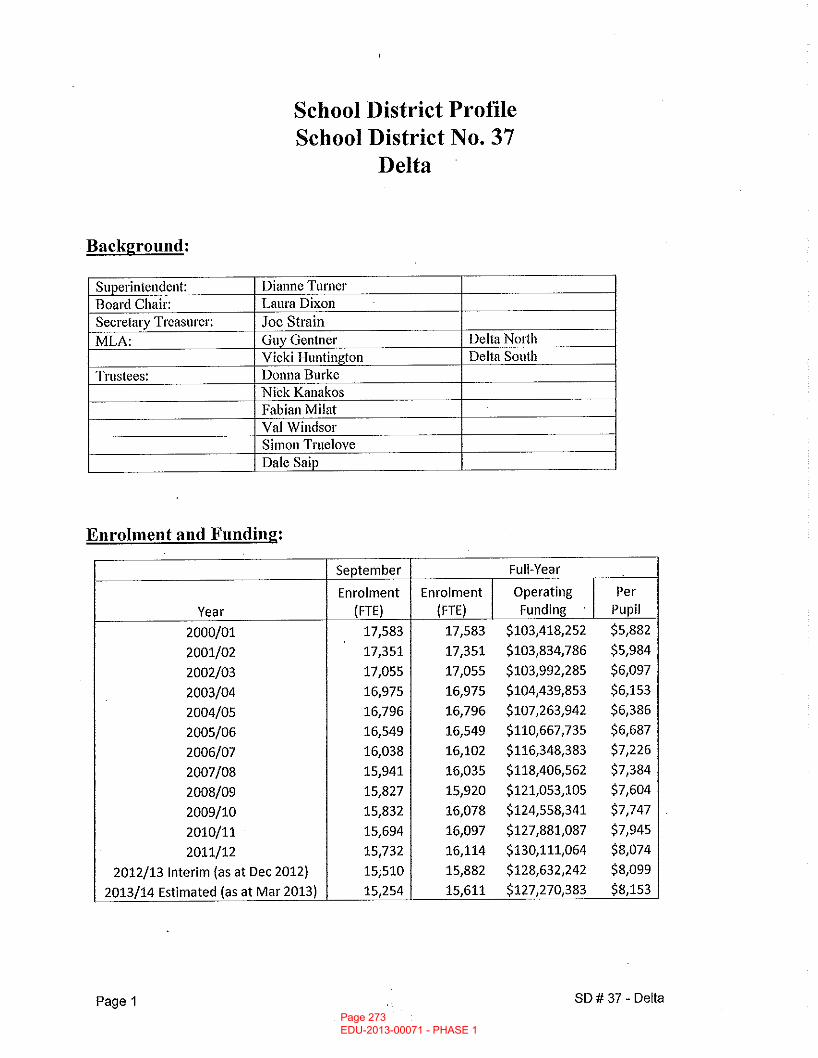
Page 273 EDU-2013-00071 - PHASE 1
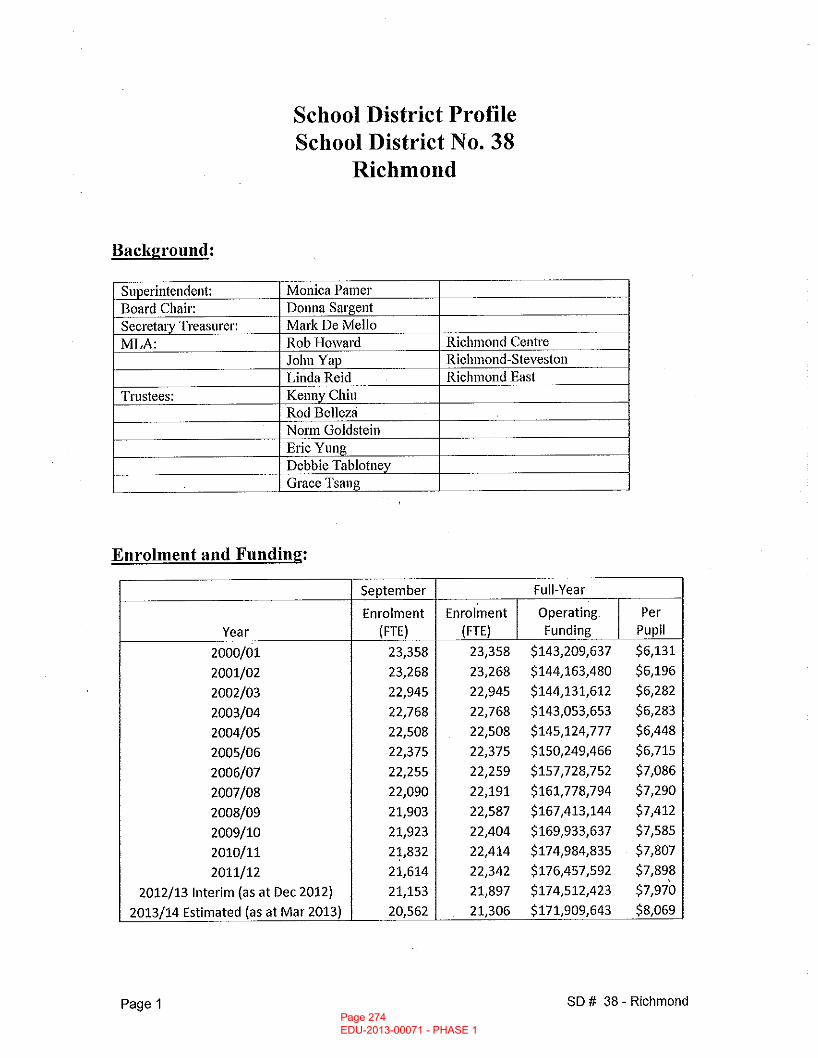
Page 274 EDU-2013-00071 - PHASE 1
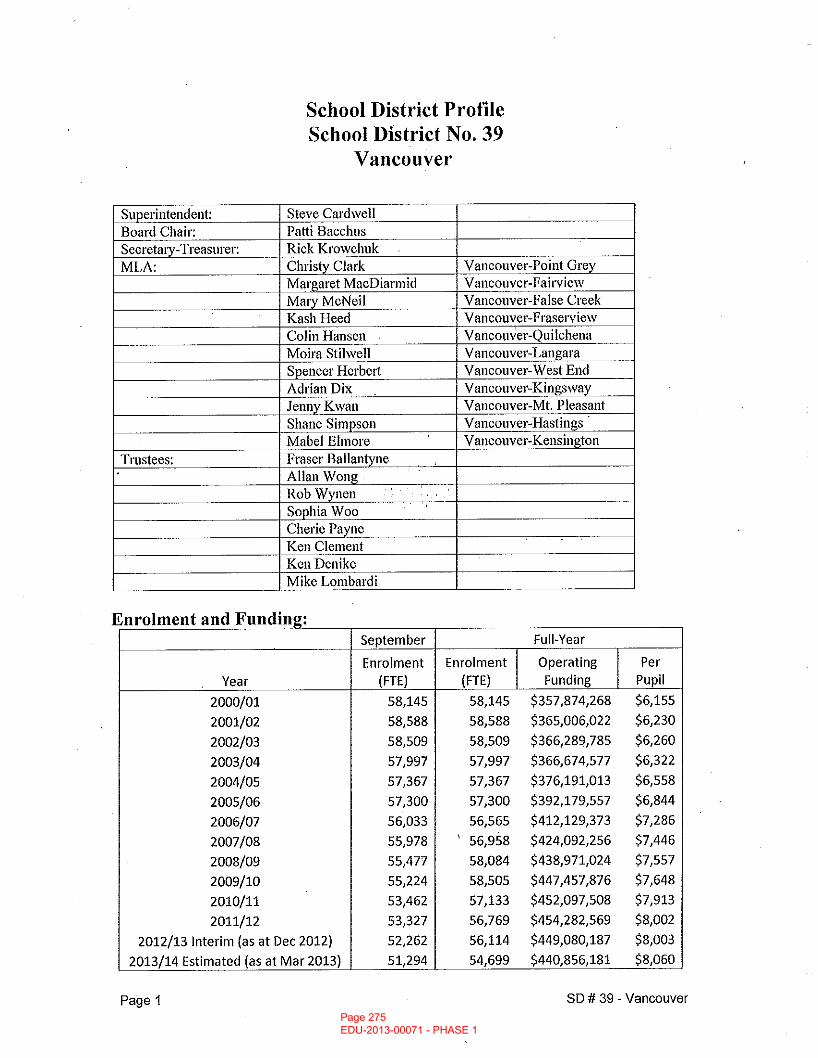
Page 275 EDU-2013-00071 - PHASE 1
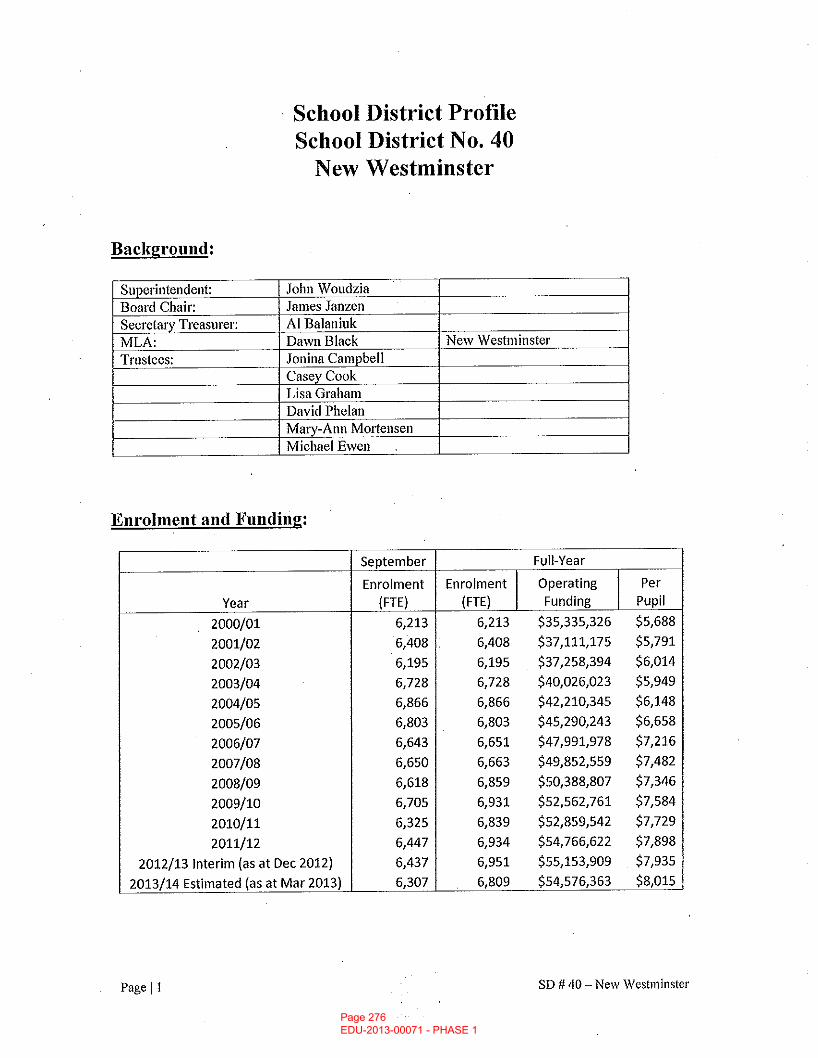
Page 276 EDU-2013-00071 - PHASE 1
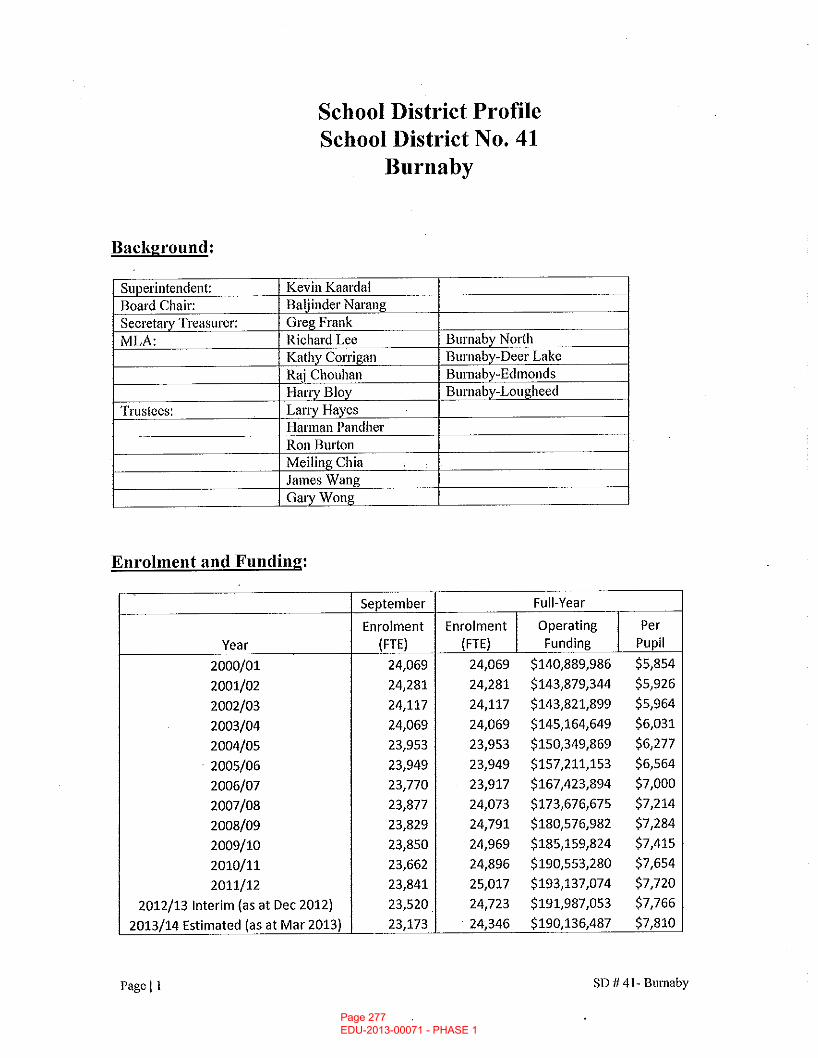
Page 277 EDU-2013-00071 - PHASE 1
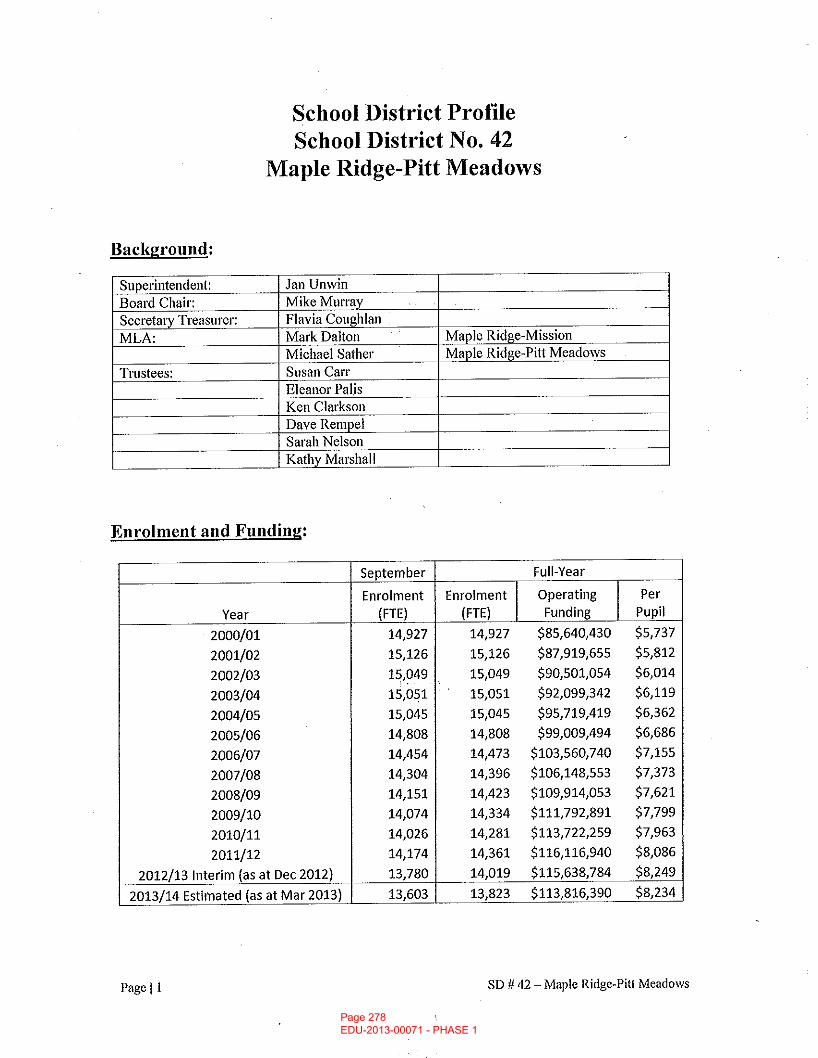
Page 278 EDU-2013-00071 - PHASE 1
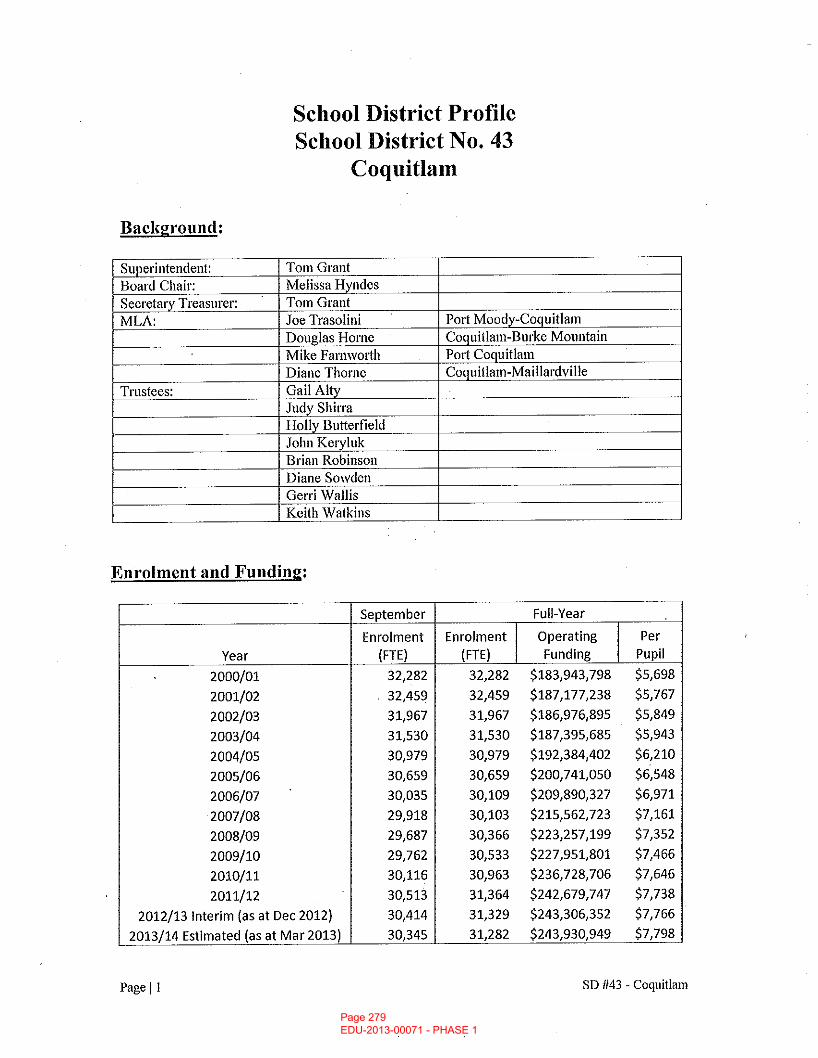
Page 279 EDU-2013-00071 - PHASE 1
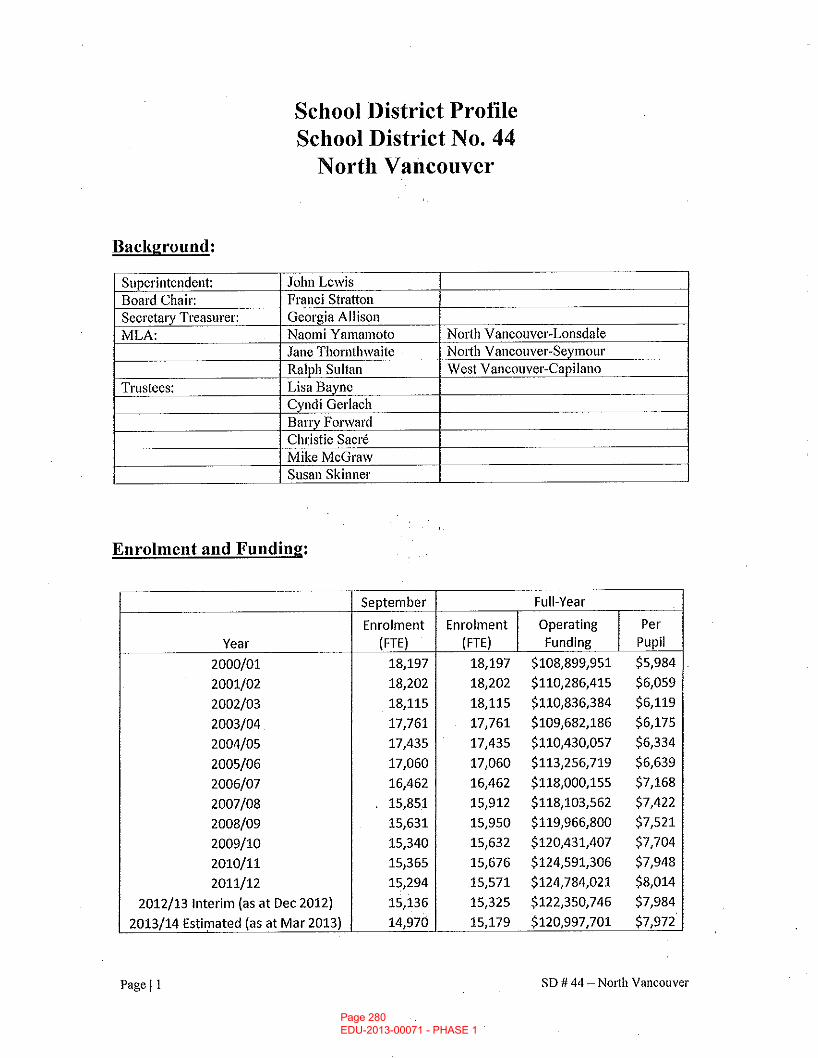
Page 280 EDU-2013-00071 - PHASE 1
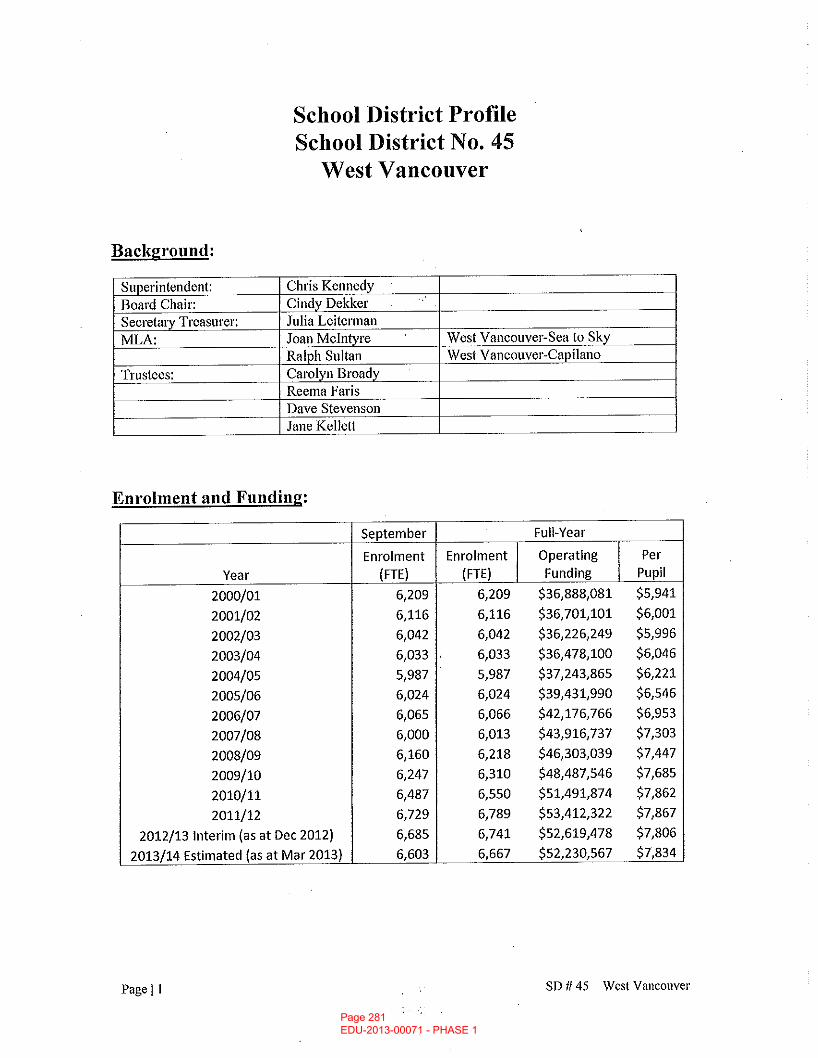
Page 281 EDU-2013-00071 - PHASE 1
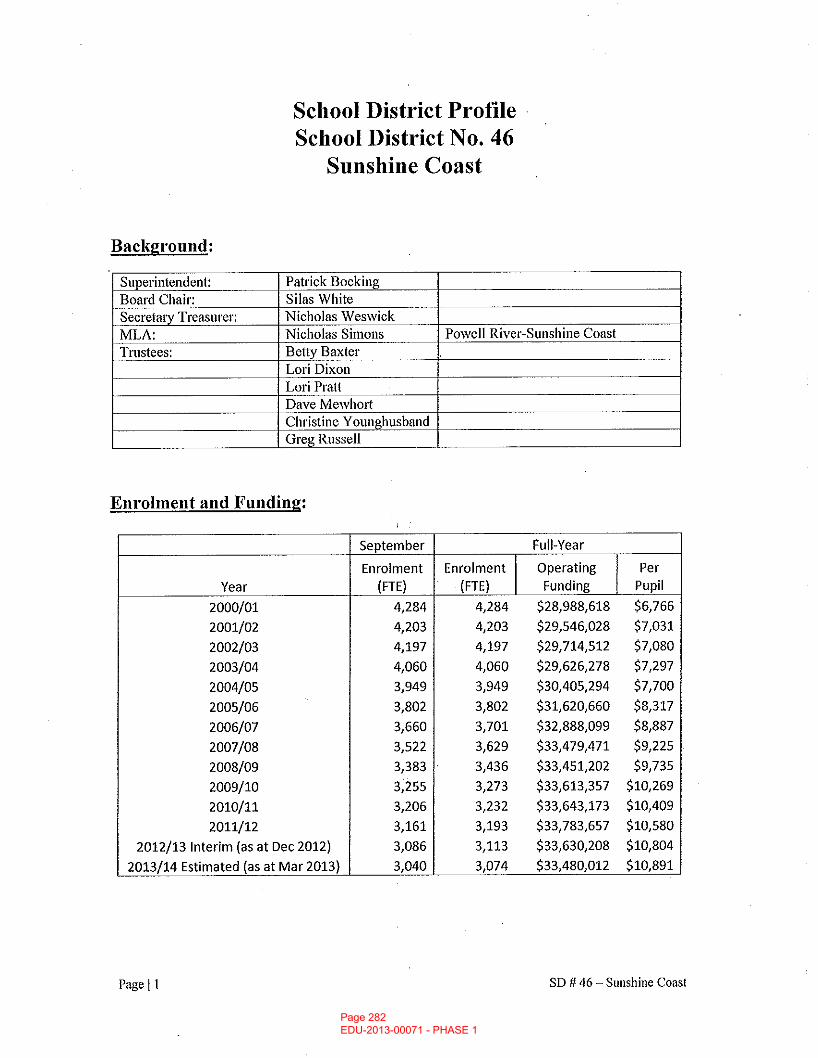
Page 282 EDU-2013-00071 - PHASE 1
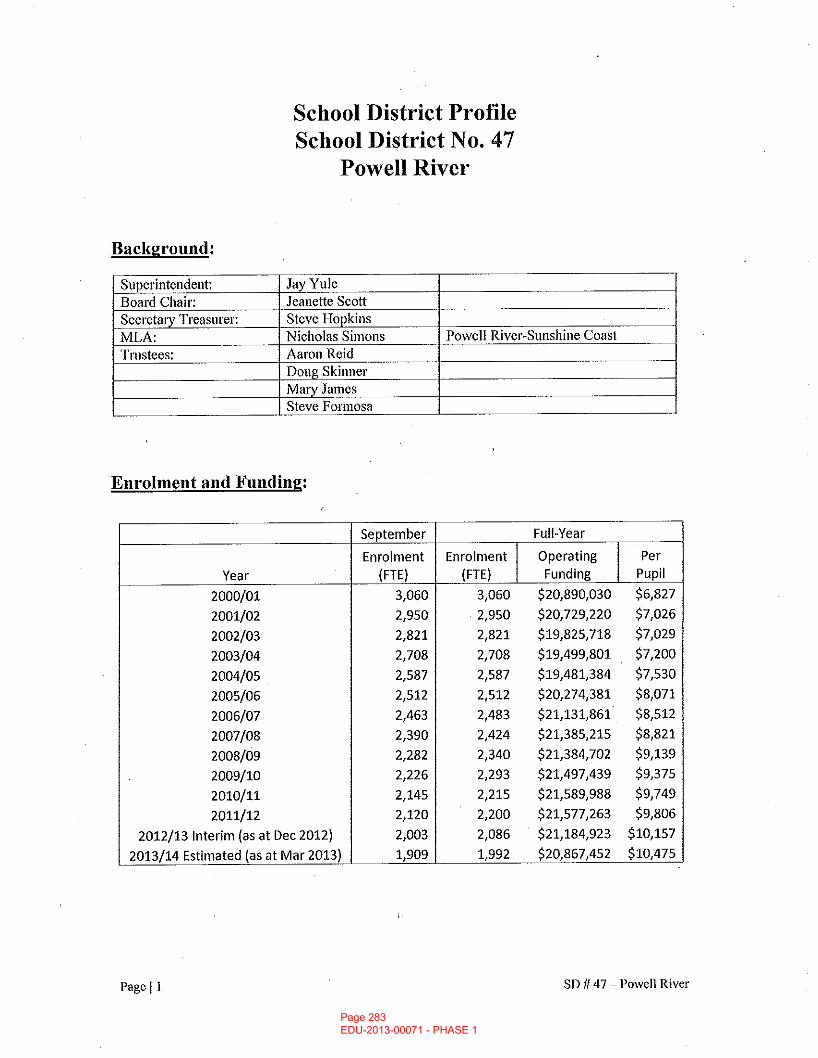
Page 283 EDU-2013-00071 - PHASE 1
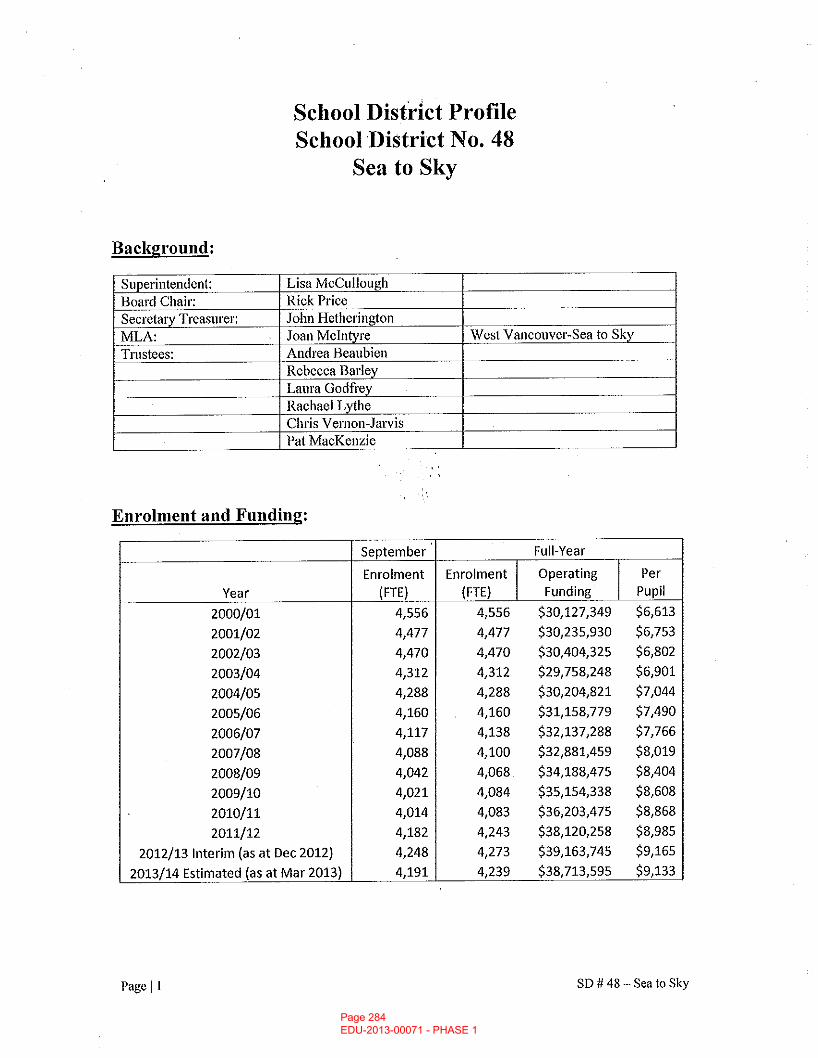
Page 284 EDU-2013-00071 - PHASE 1
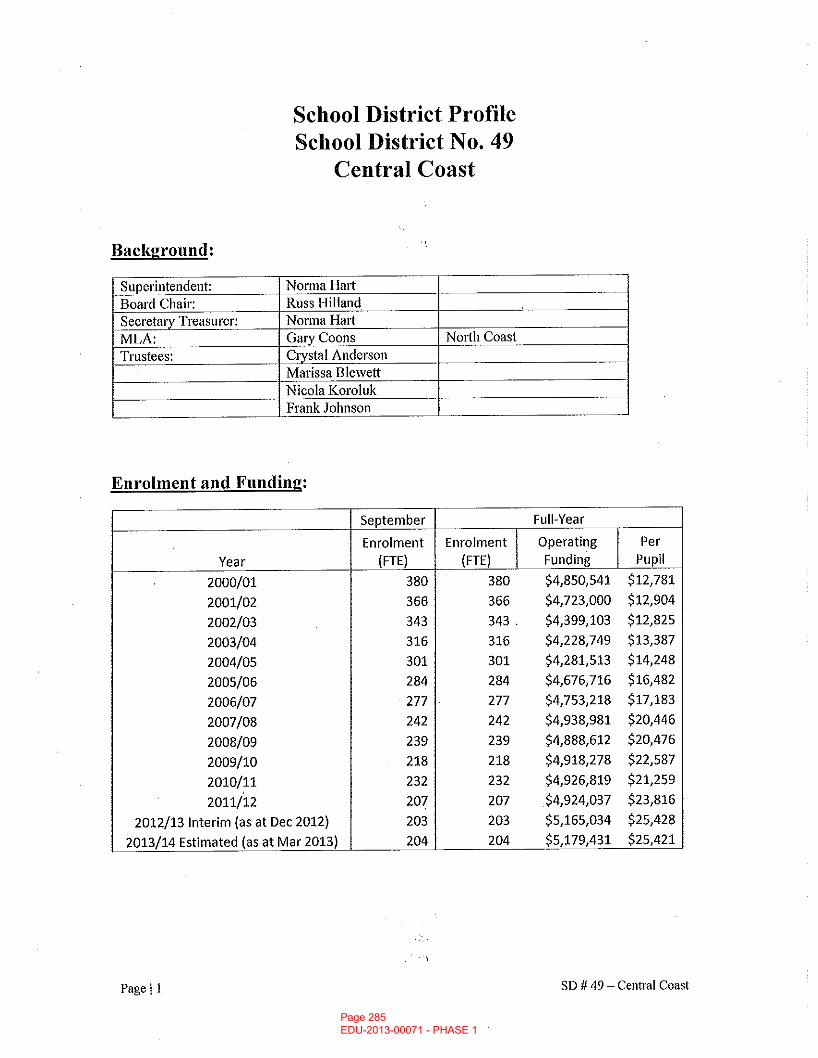
Page 285 EDU-2013-00071 - PHASE 1
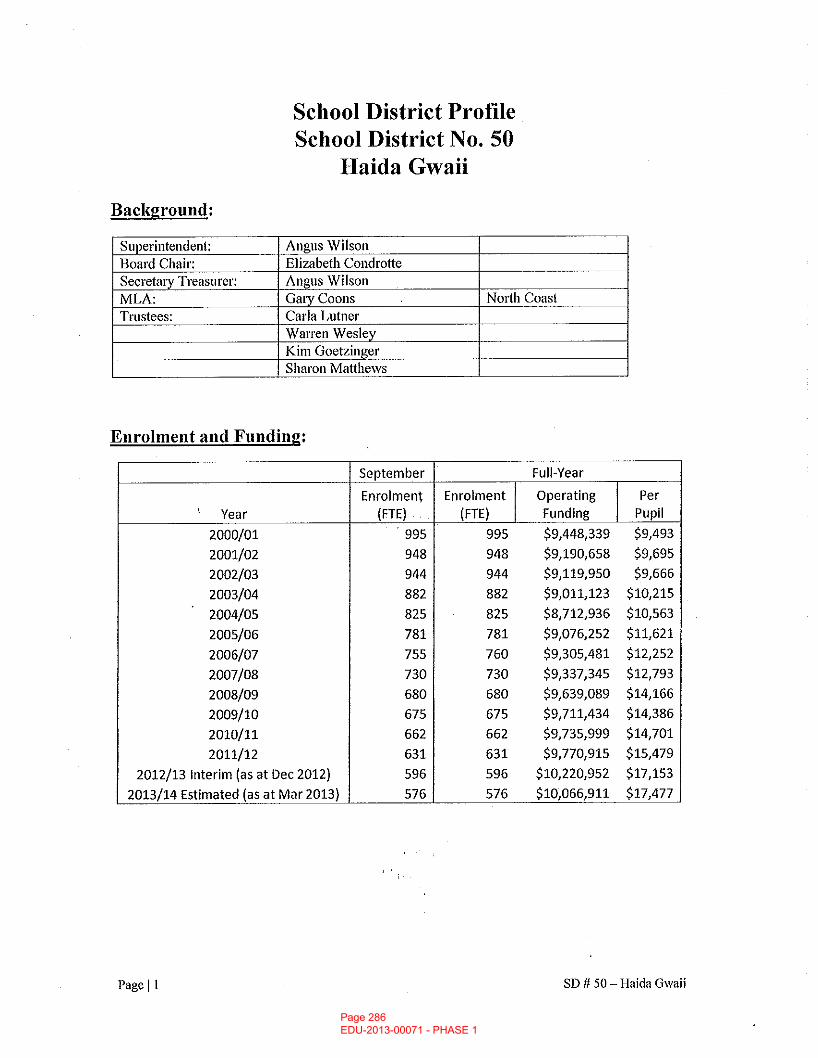
Page 286 EDU-2013-00071 - PHASE 1
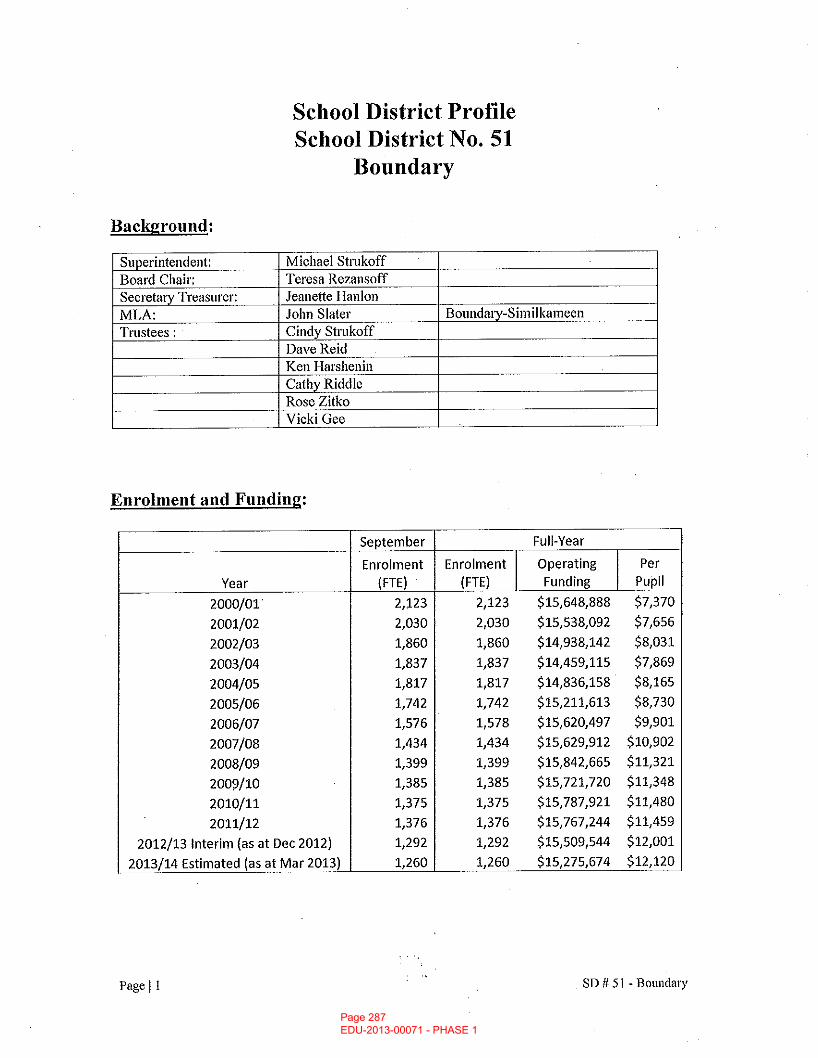
Page 287 EDU-2013-00071 - PHASE 1
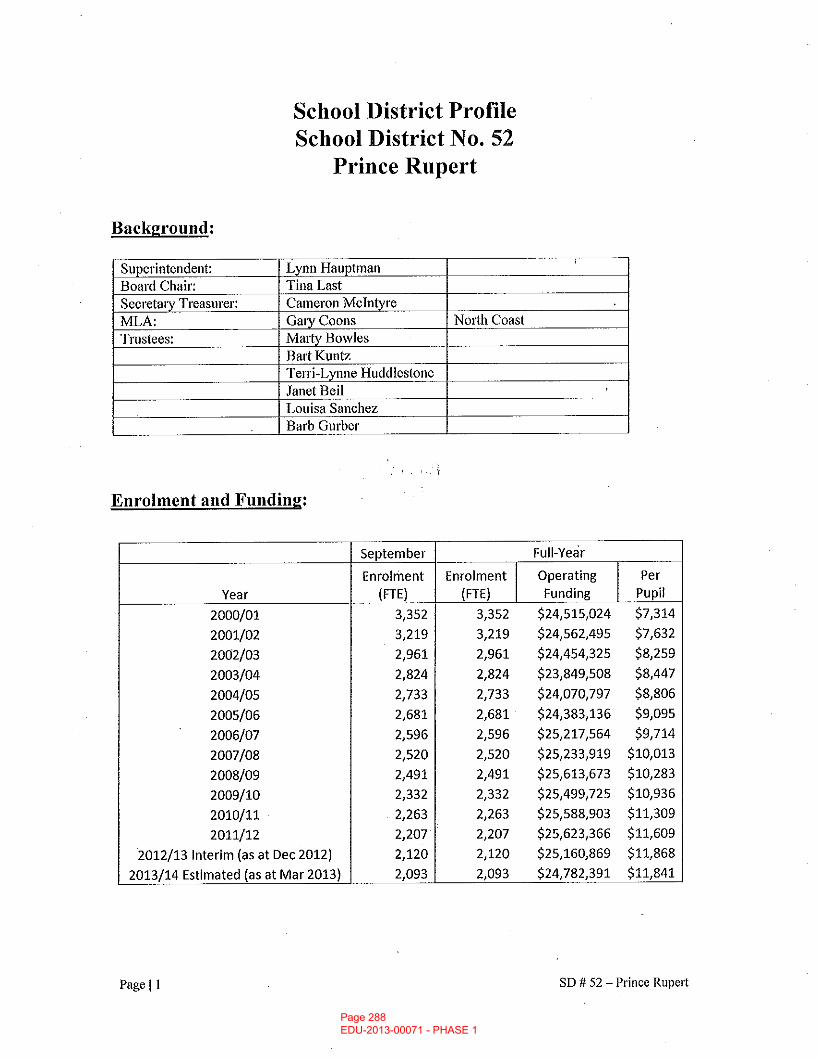
Page 288 EDU-2013-00071 - PHASE 1
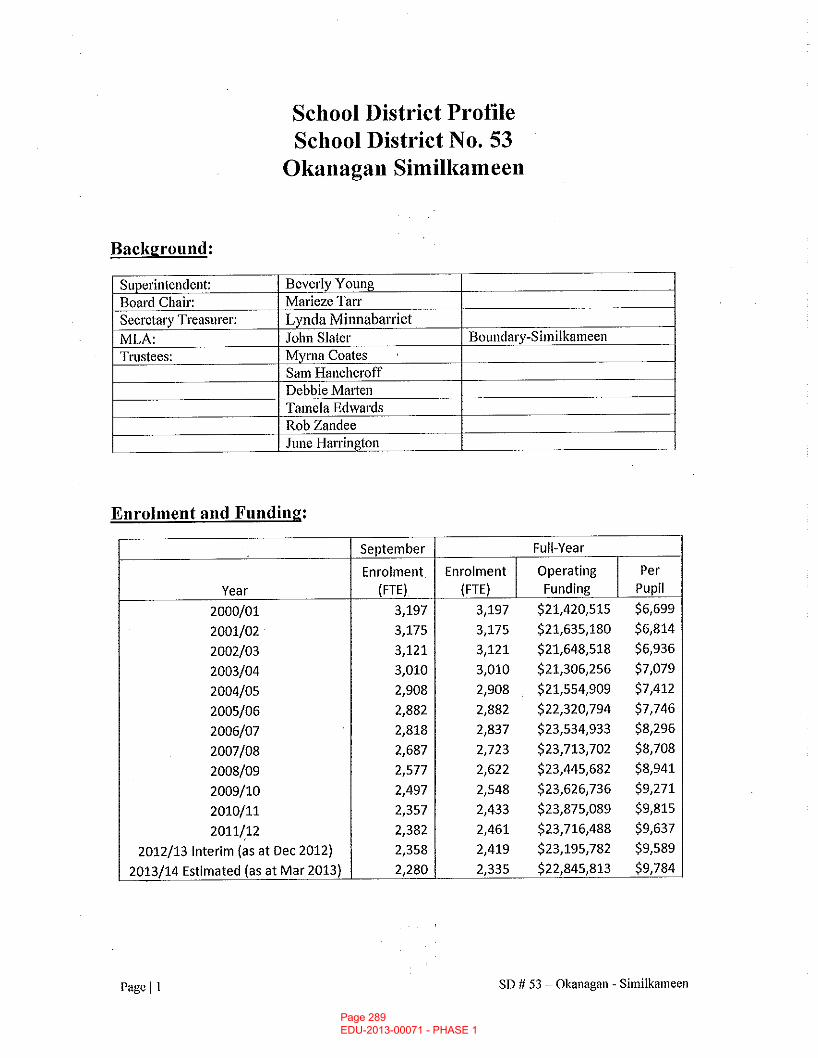
Page 289 EDU-2013-00071 - PHASE 1
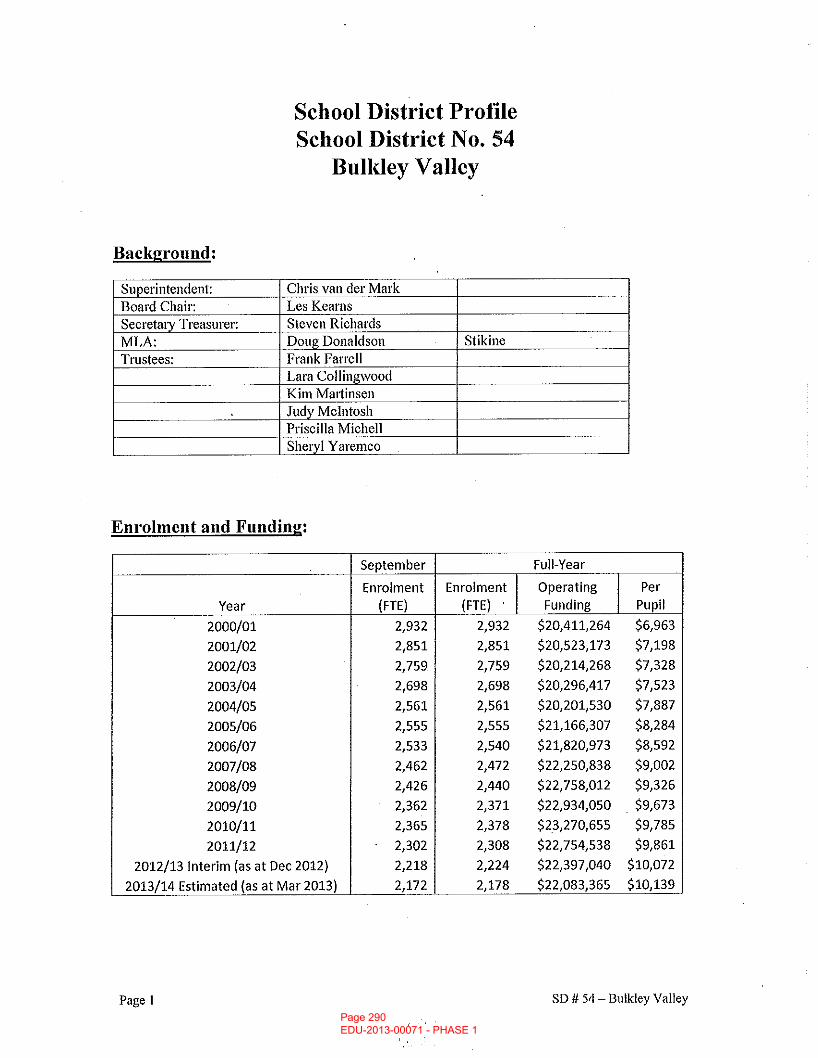
Page 290 EDU-2013-00071 - PHASE 1
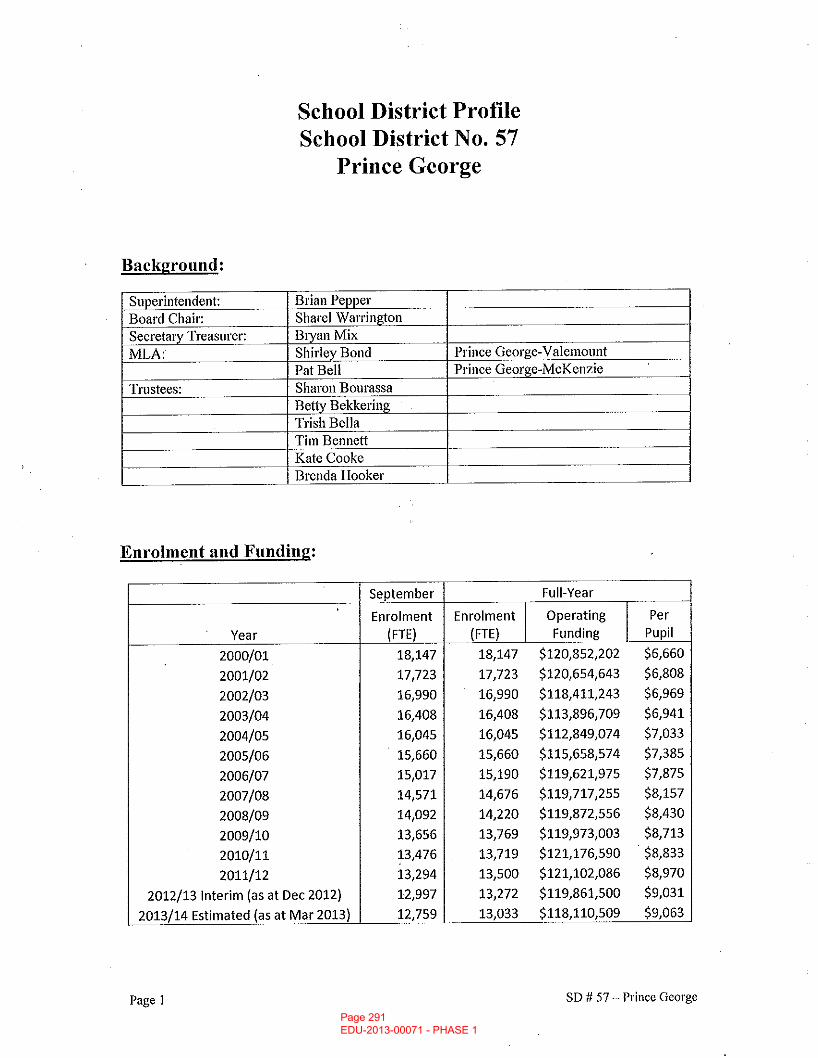
Page 291 EDU-2013-00071 - PHASE 1
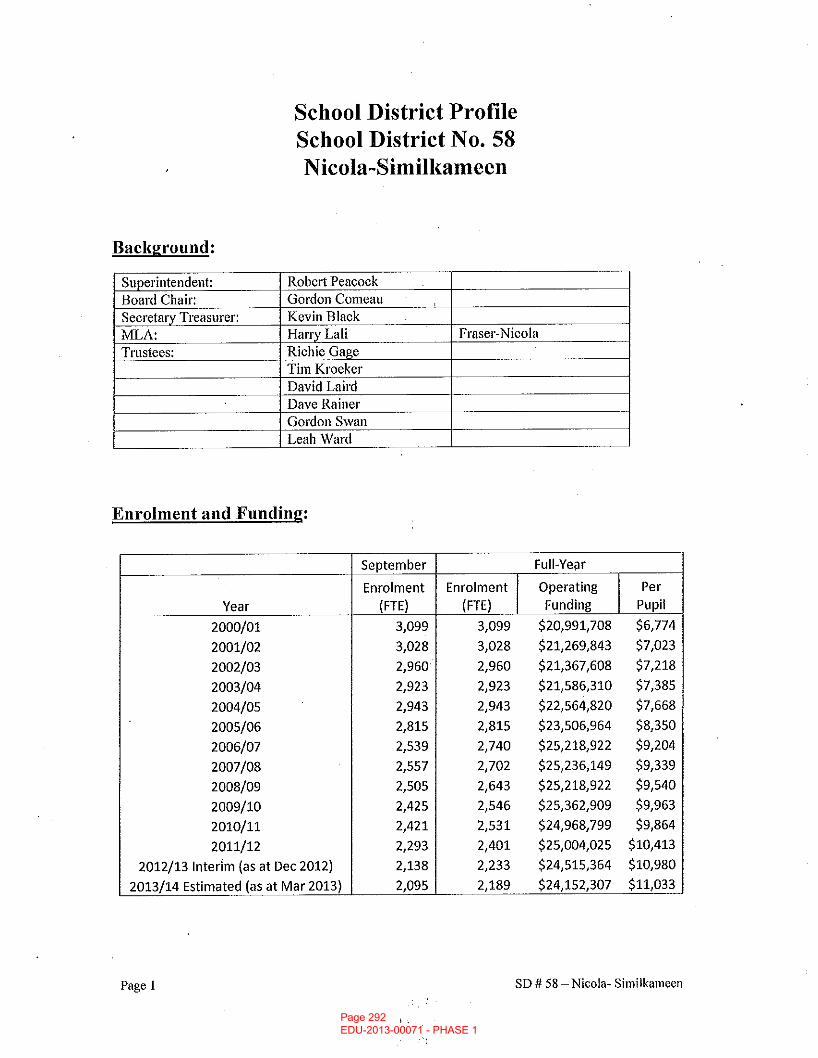
Page 292 EDU-2013-00071 - PHASE 1

Page 293 EDU-2013-00071 - PHASE 1
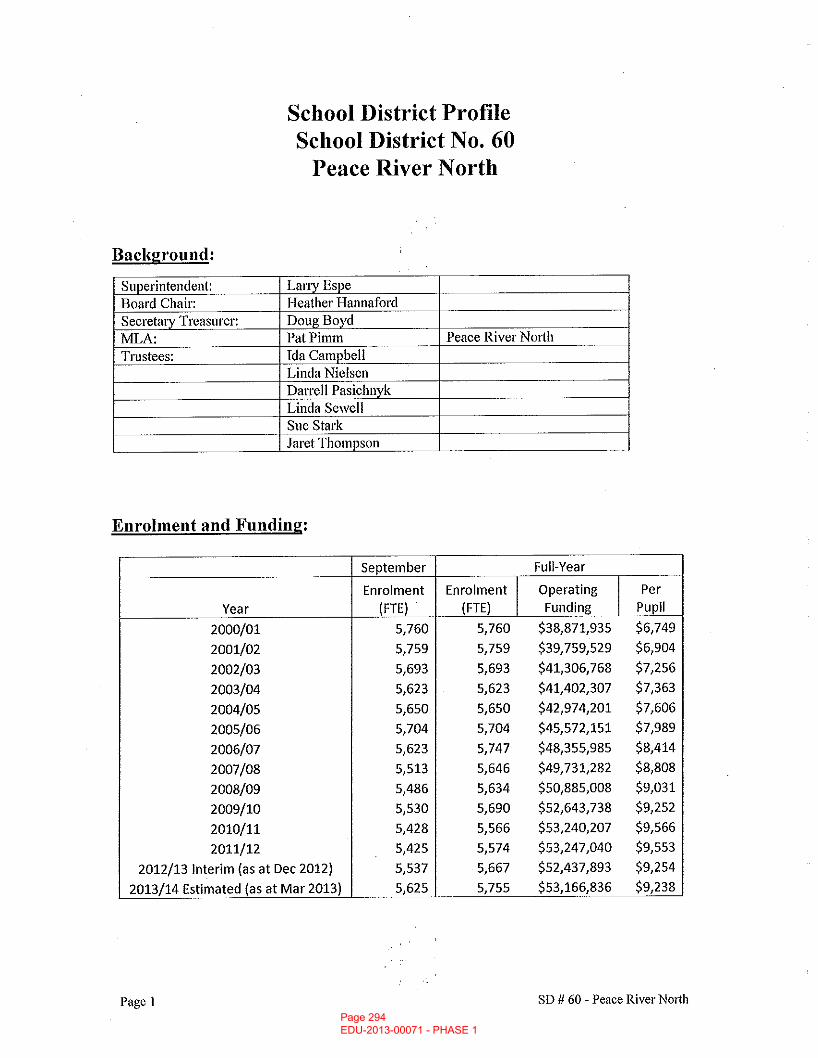
Page 294 EDU-2013-00071 - PHASE 1
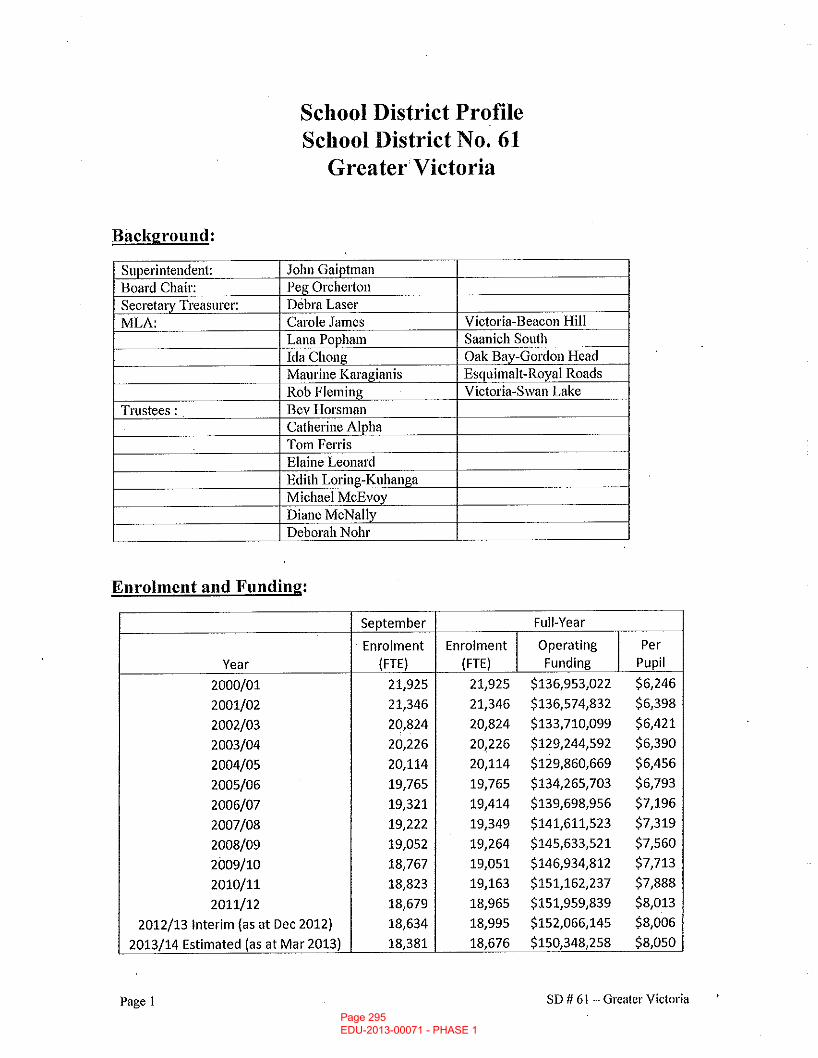
Page 295 EDU-2013-00071 - PHASE 1

Page 296 EDU-2013-00071 - PHASE 1
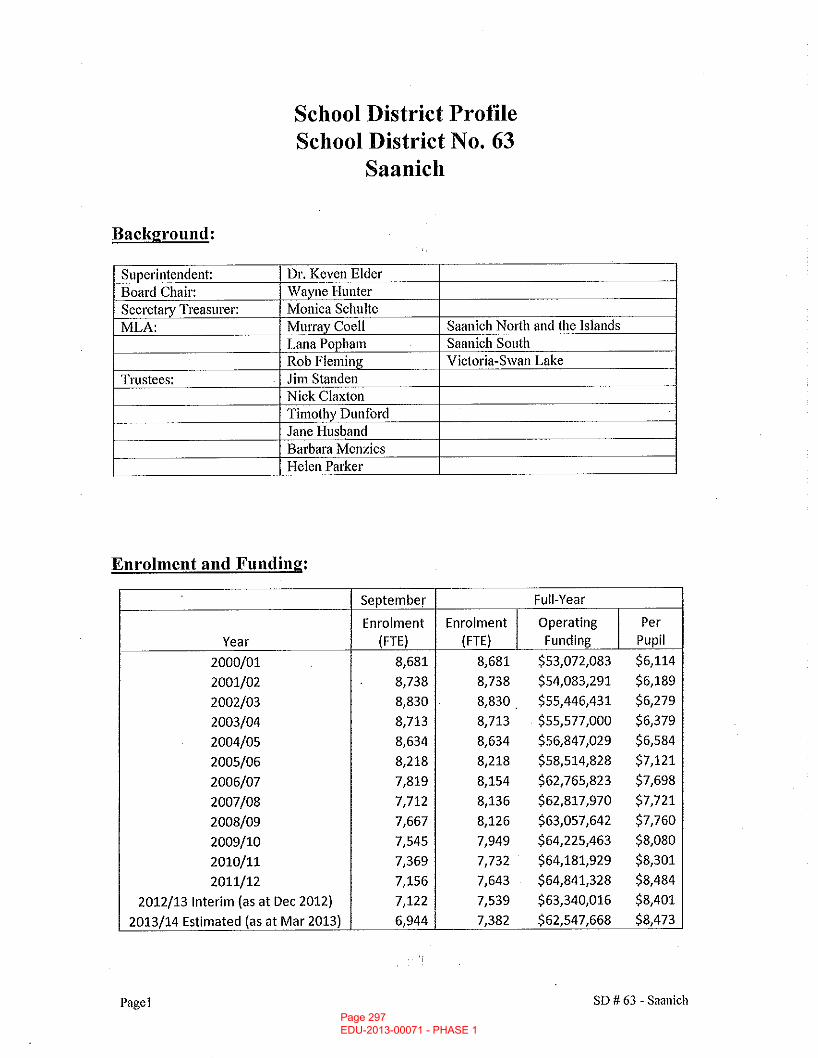
Page 297 EDU-2013-00071 - PHASE 1
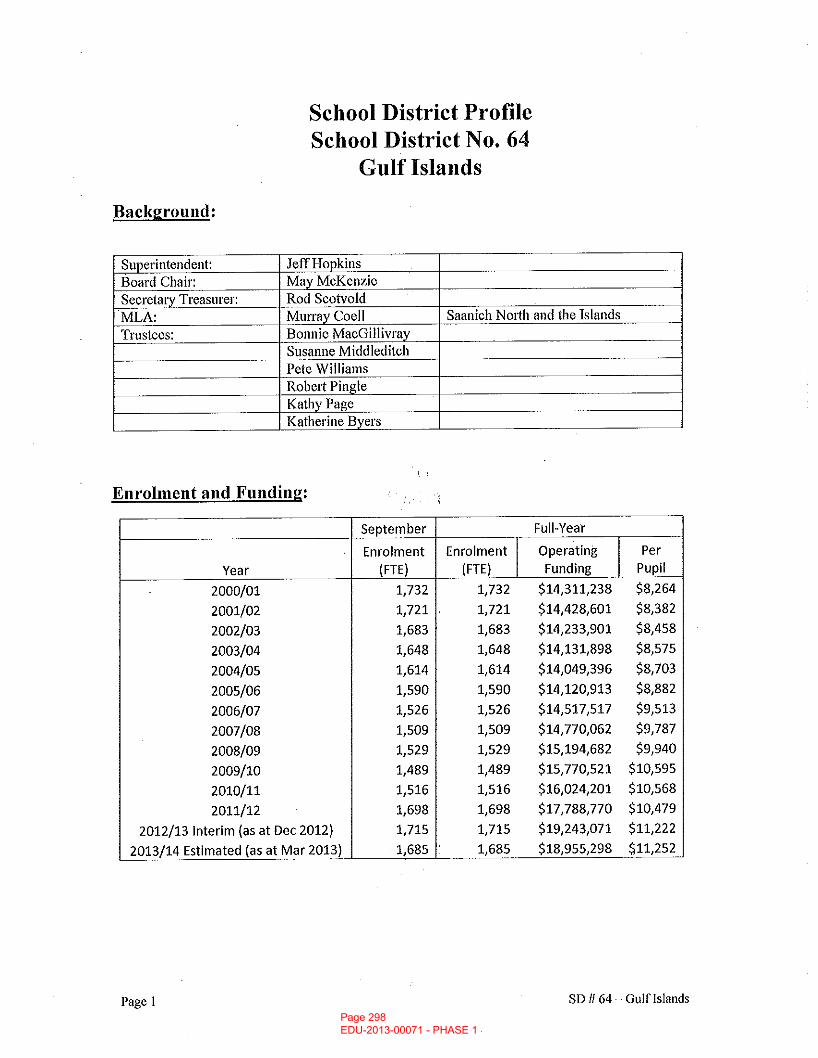
Page 298 EDU-2013-00071 - PHASE 1
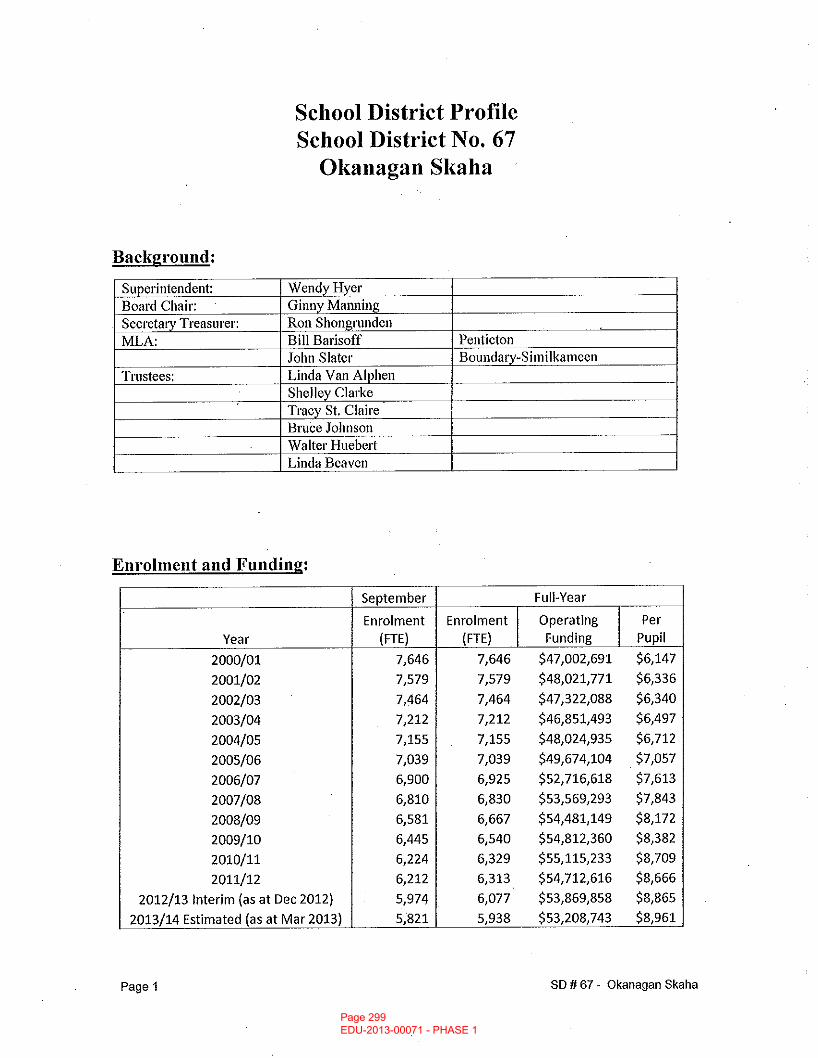
Page 299 EDU-2013-00071 - PHASE 1
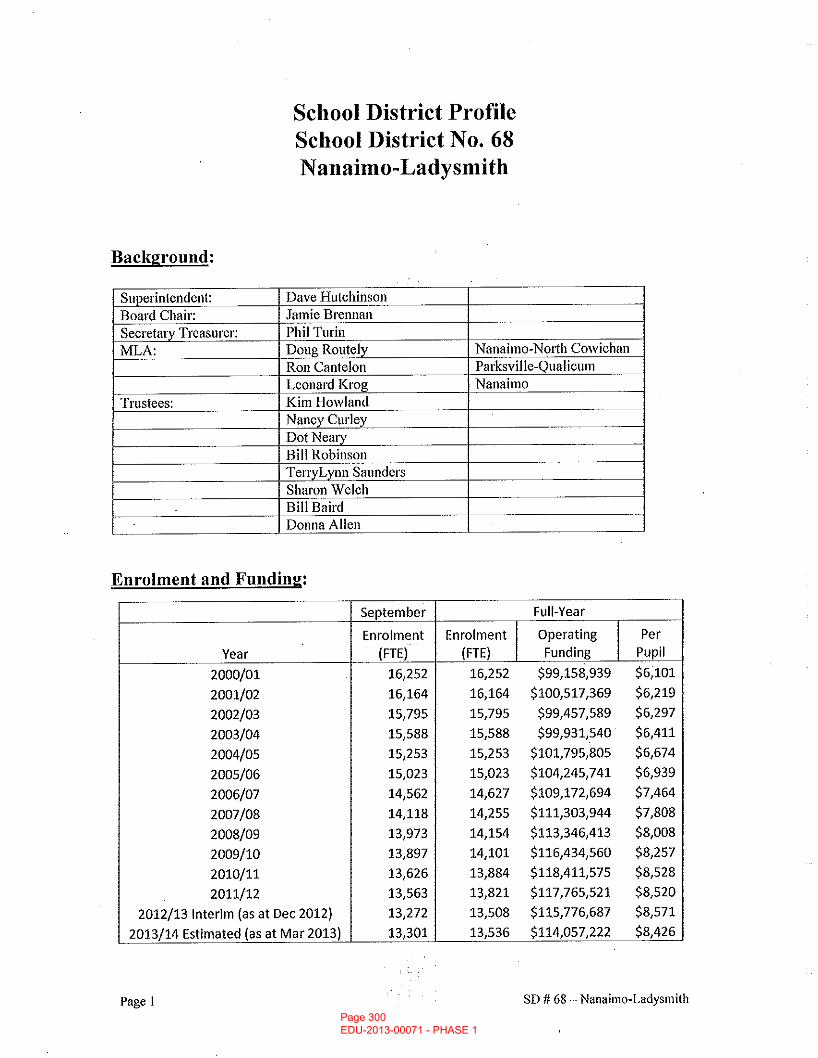
Page 300 EDU-2013-00071 - PHASE 1
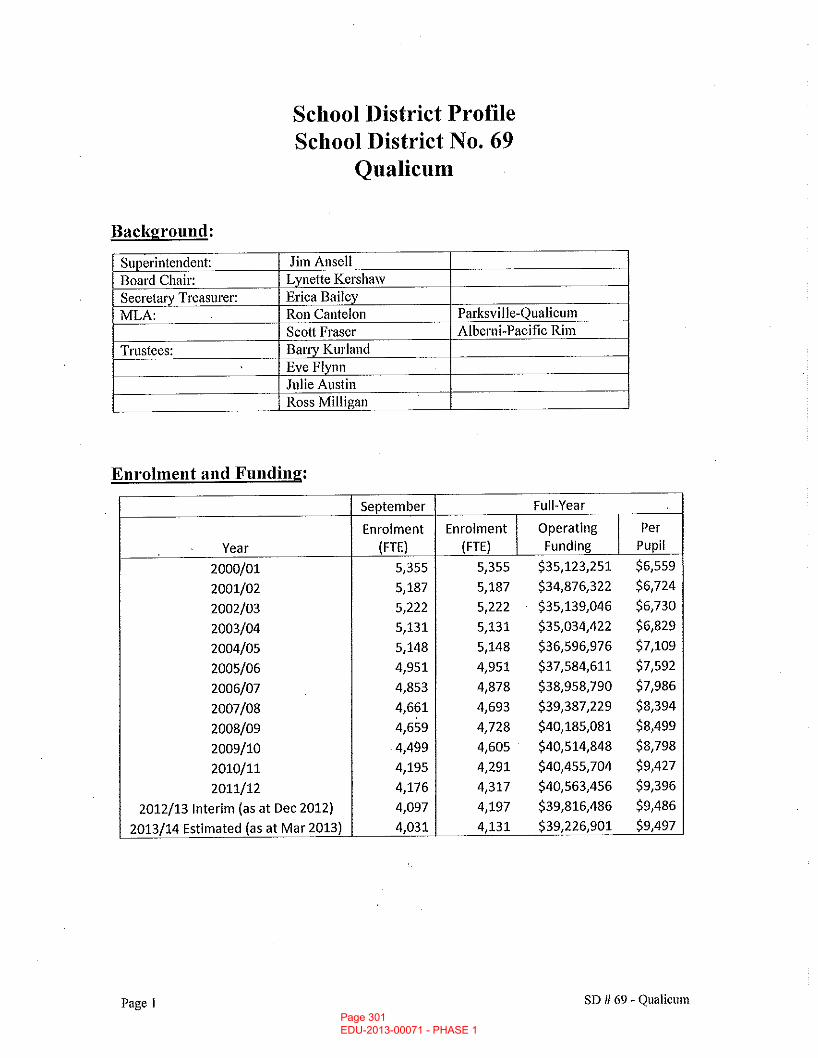
Page 301 EDU-2013-00071 - PHASE 1
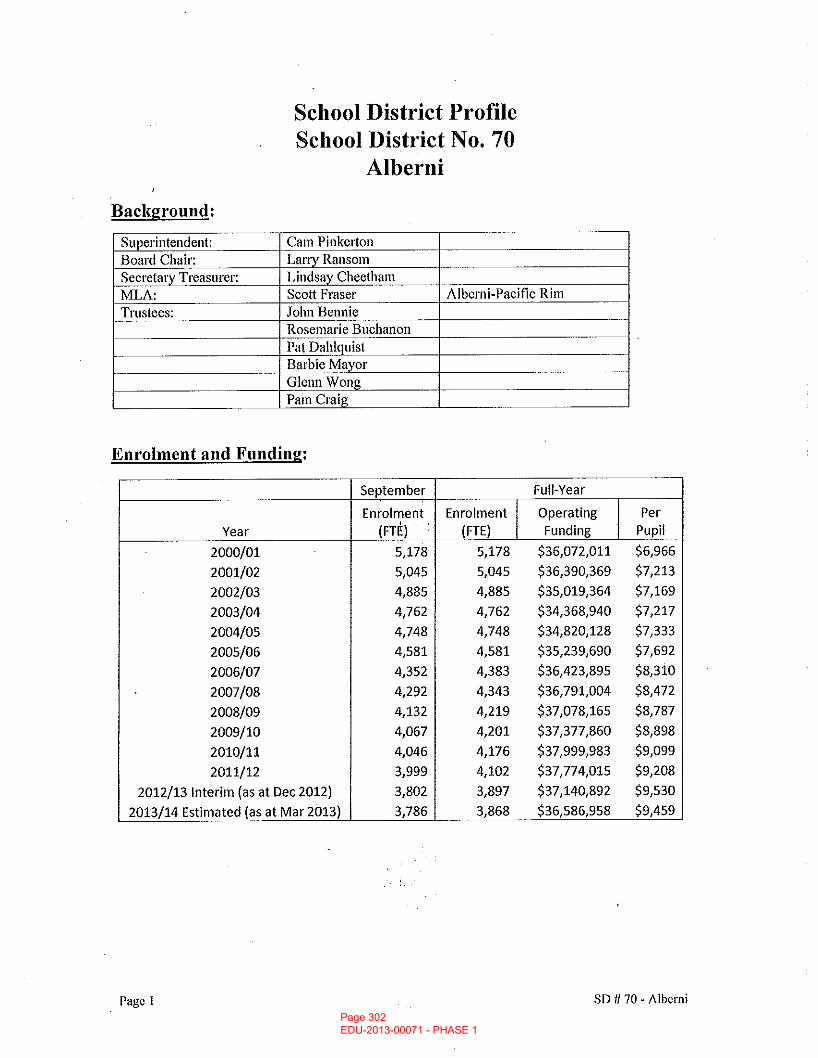
Page 302 EDU-2013-00071 - PHASE 1

Page 303 EDU-2013-00071 - PHASE 1
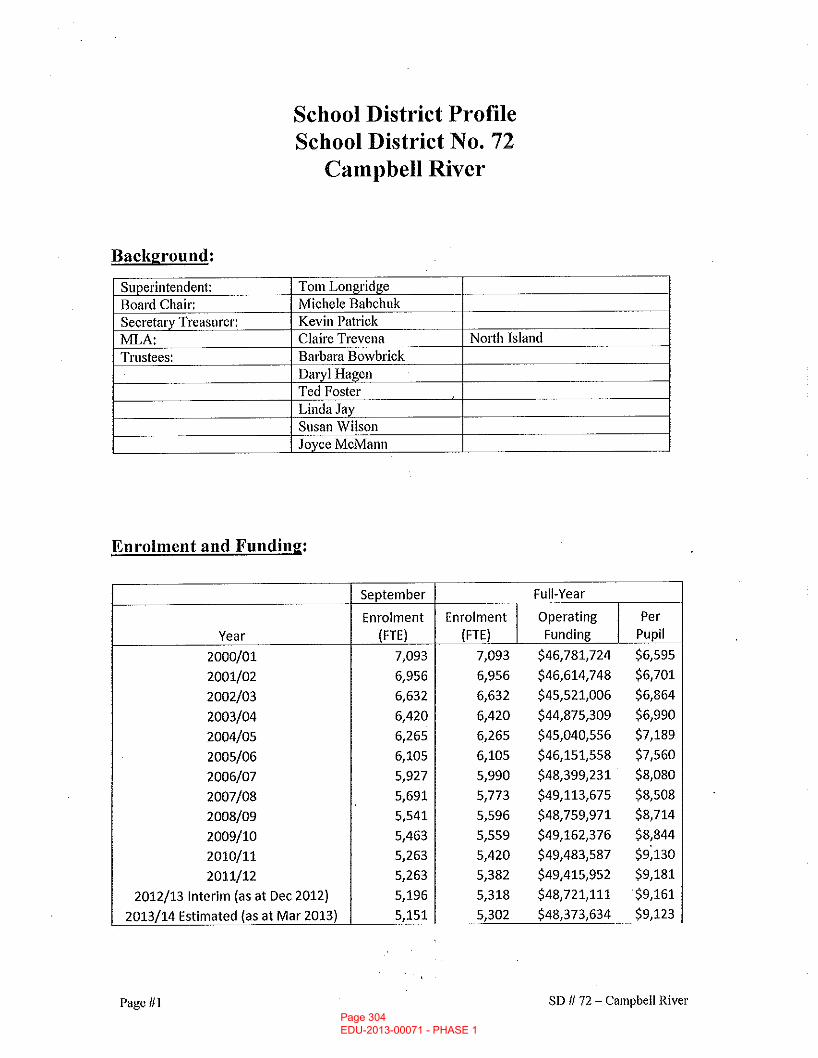
Page 304 EDU-2013-00071 - PHASE 1
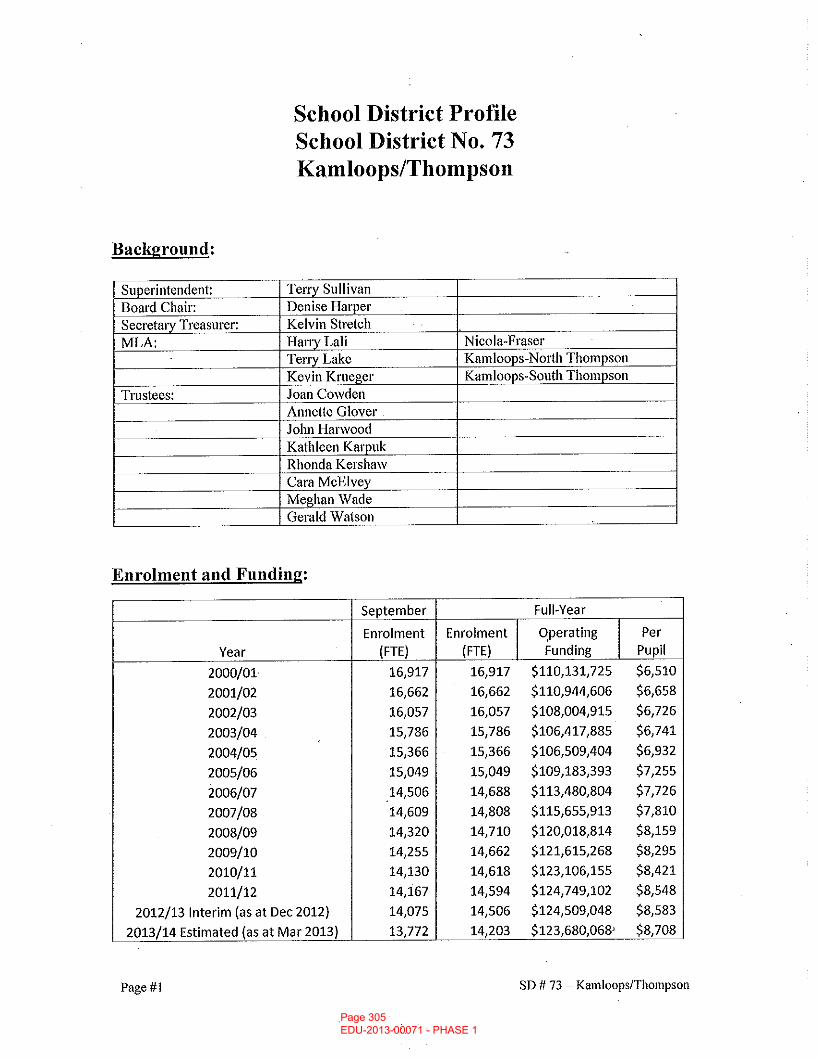
Page 305 EDU-2013-00071 - PHASE 1
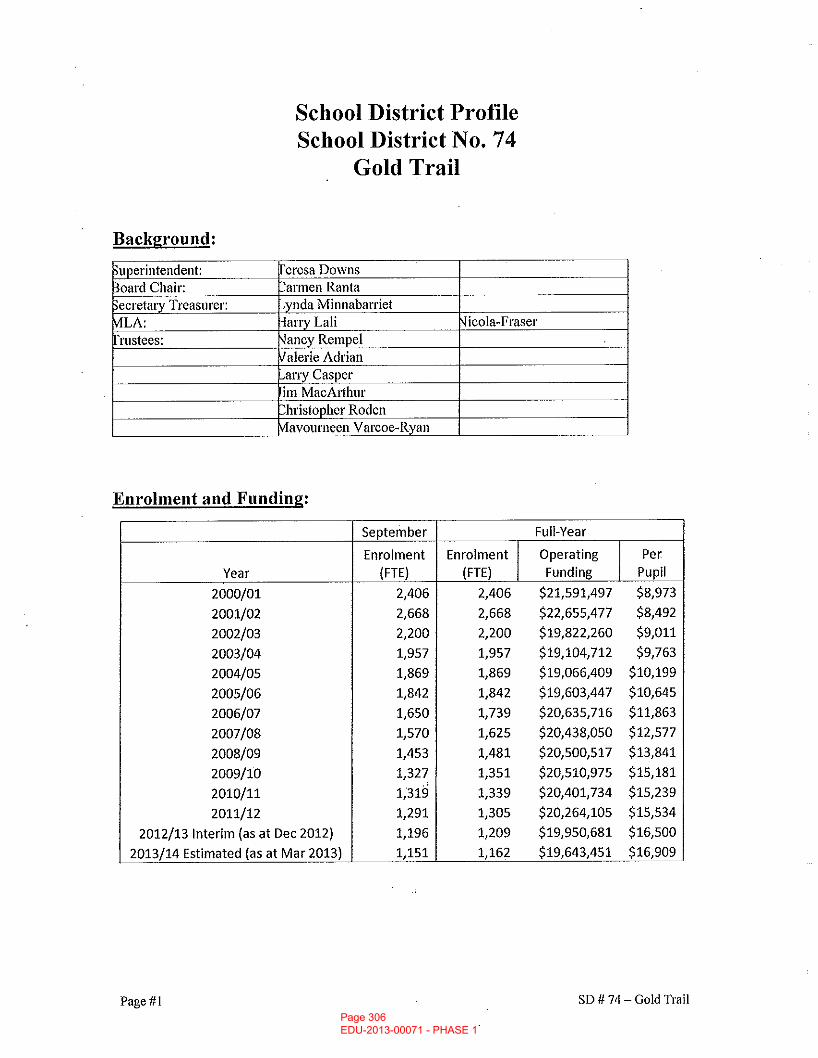
Page 306 EDU-2013-00071 - PHASE 1
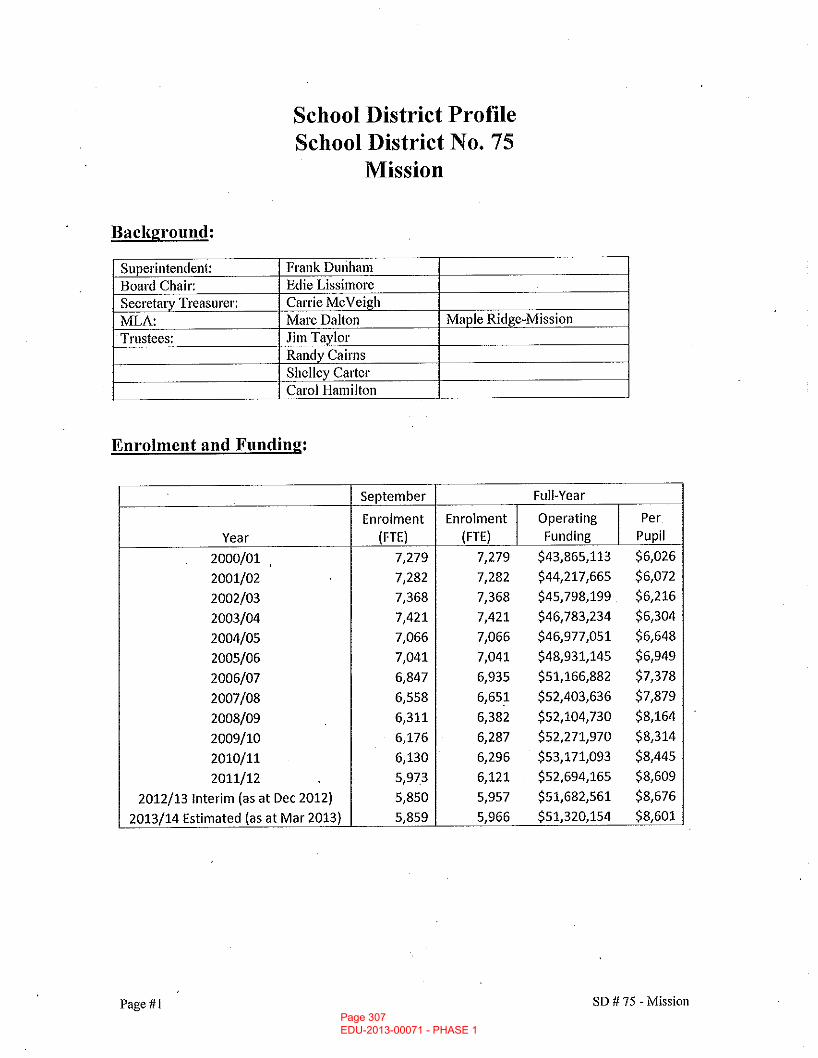
Page 307 EDU-2013-00071 - PHASE 1
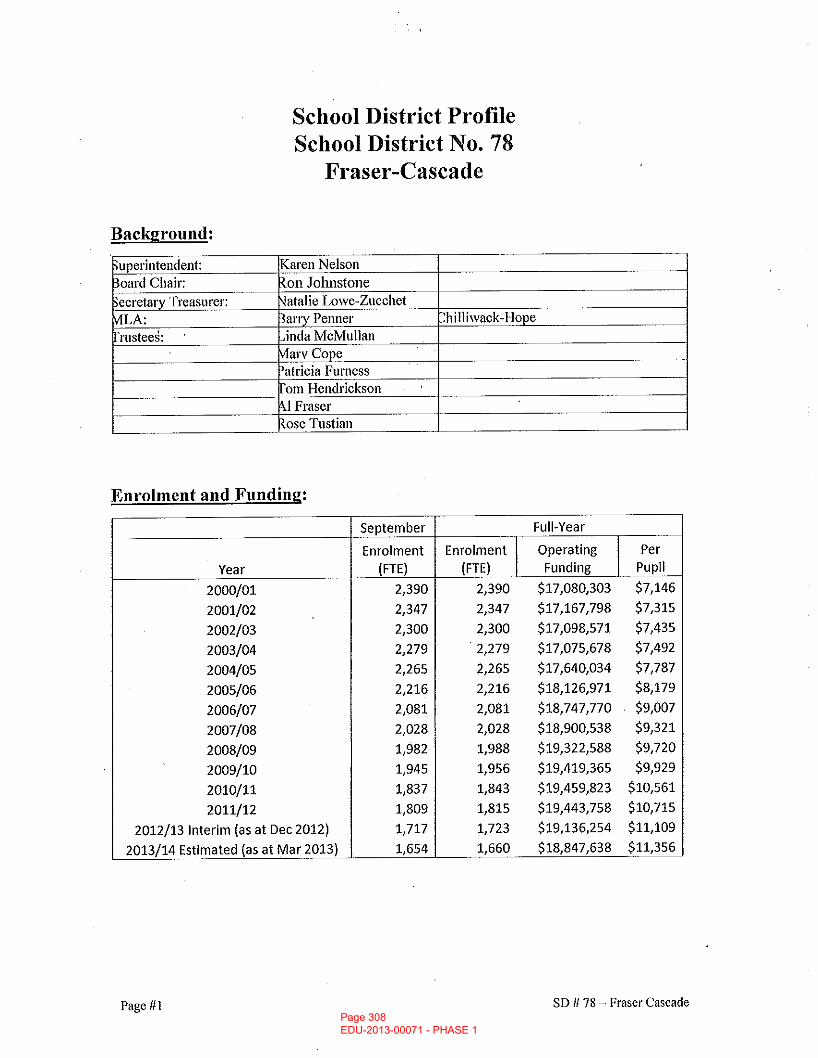
Page 308 EDU-2013-00071 - PHASE 1
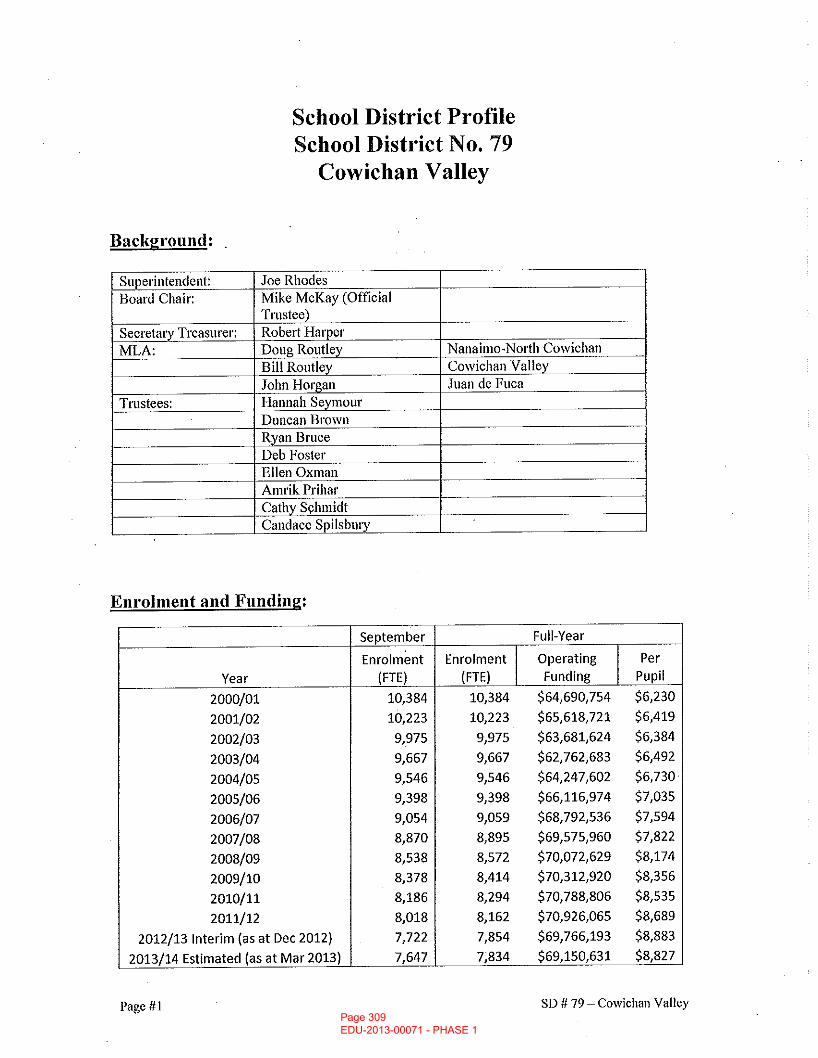
Page 309 EDU-2013-00071 - PHASE 1
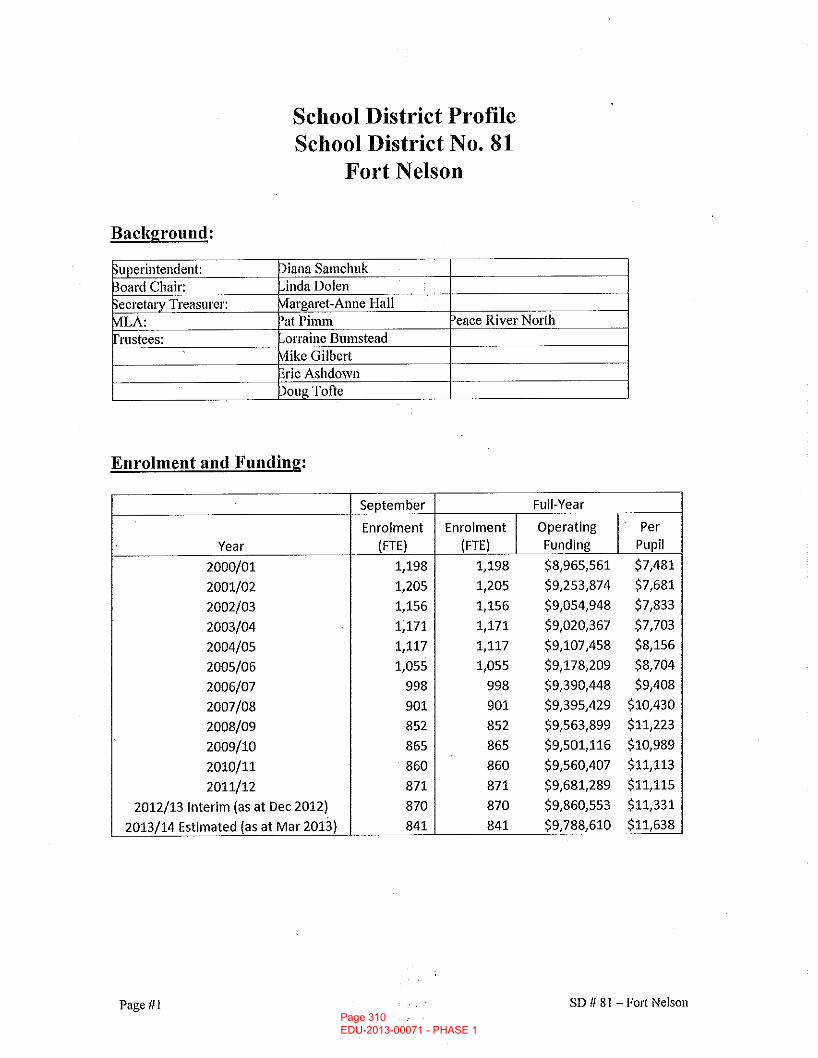
Page 310 EDU-2013-00071 - PHASE 1
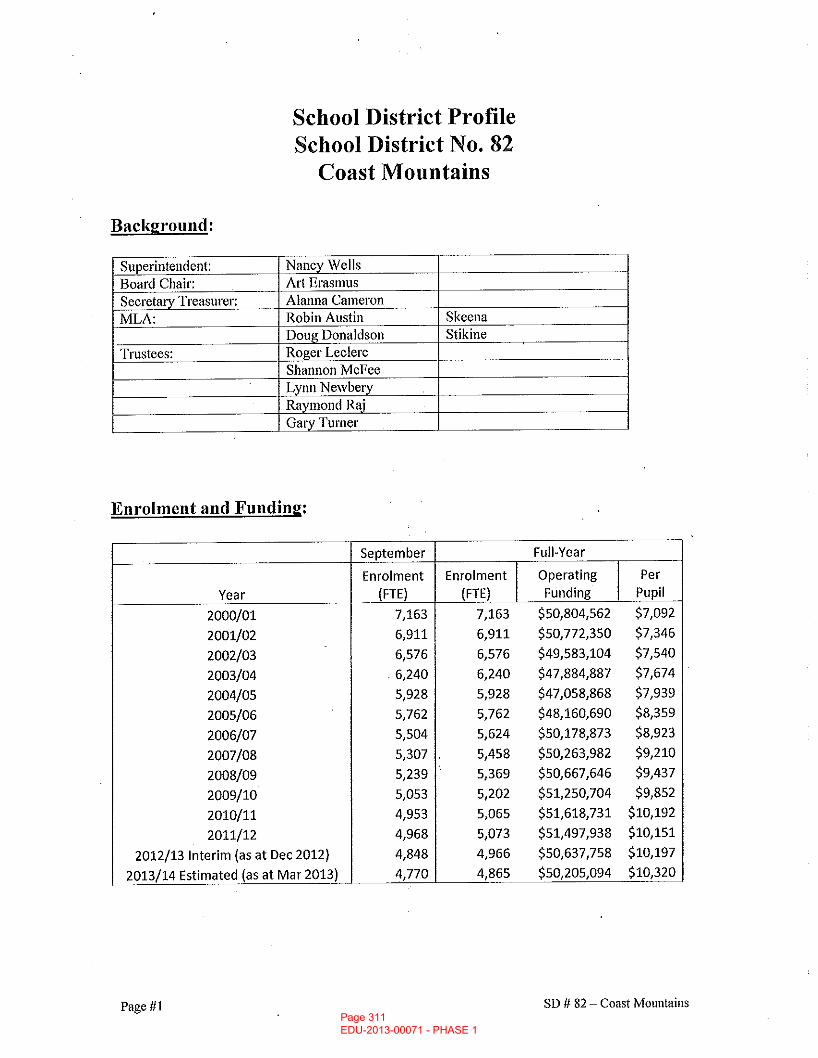
Page 311 EDU-2013-00071 - PHASE 1
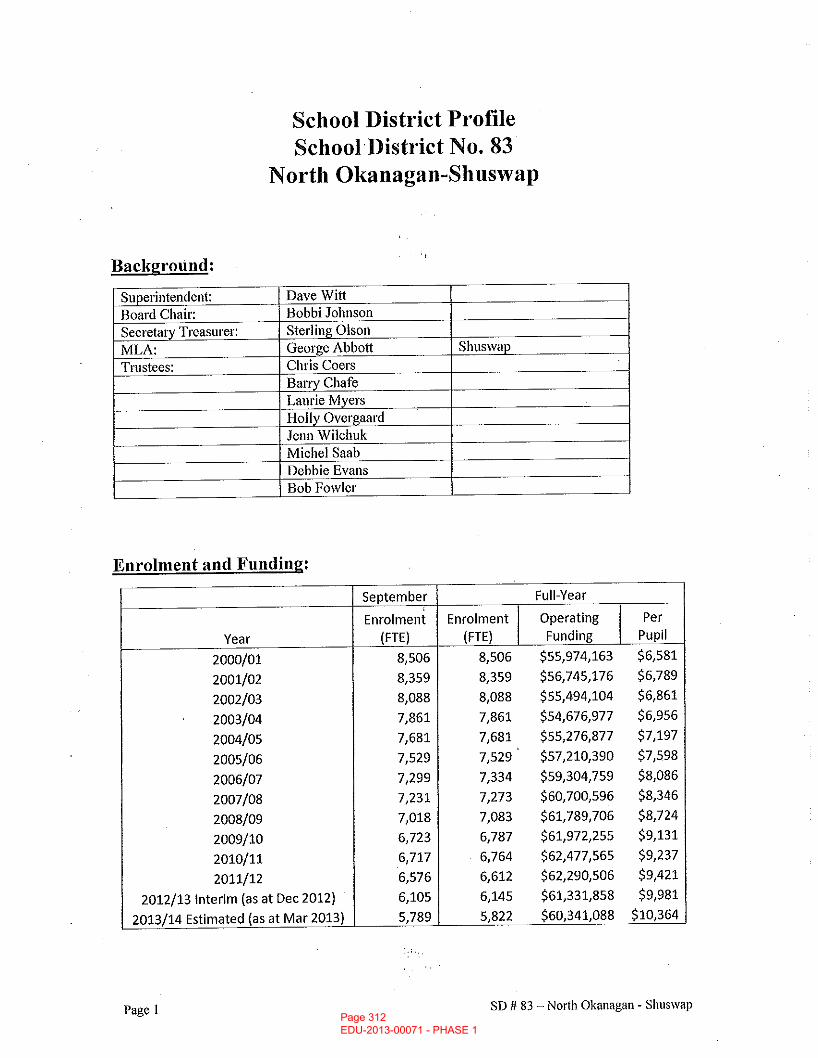
Page 312 EDU-2013-00071 - PHASE 1
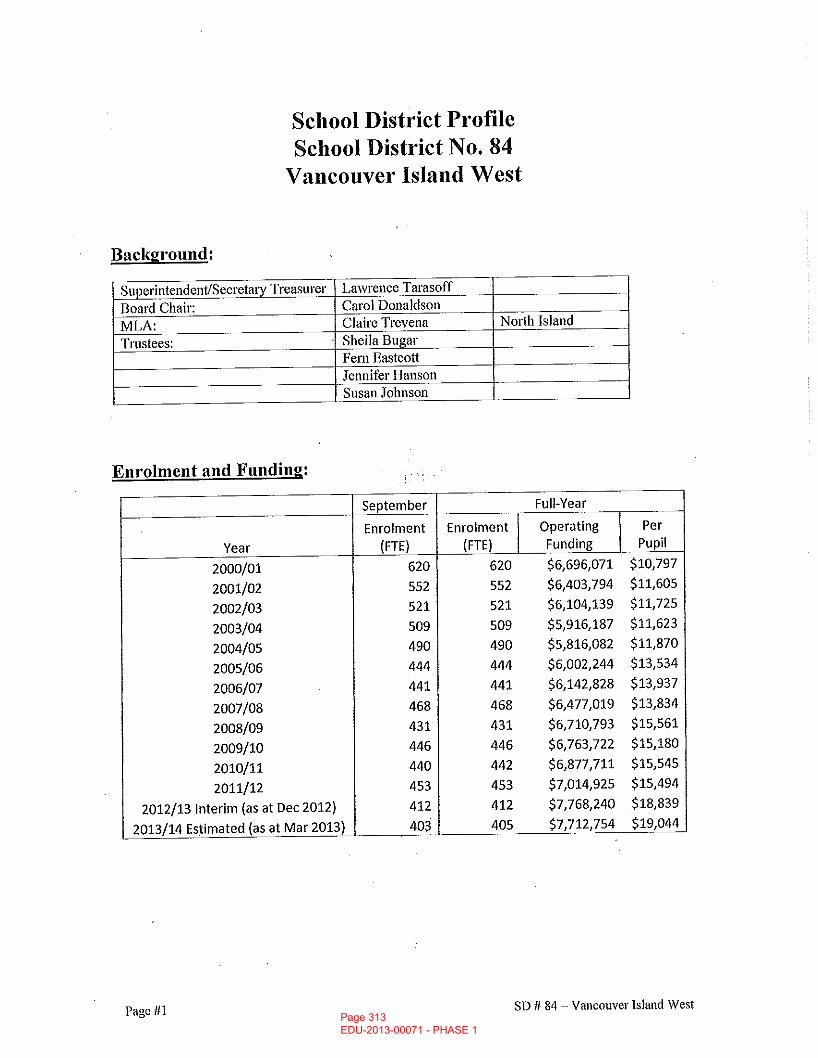
Page 313 EDU-2013-00071 - PHASE 1

Page 314 EDU-2013-00071 - PHASE 1
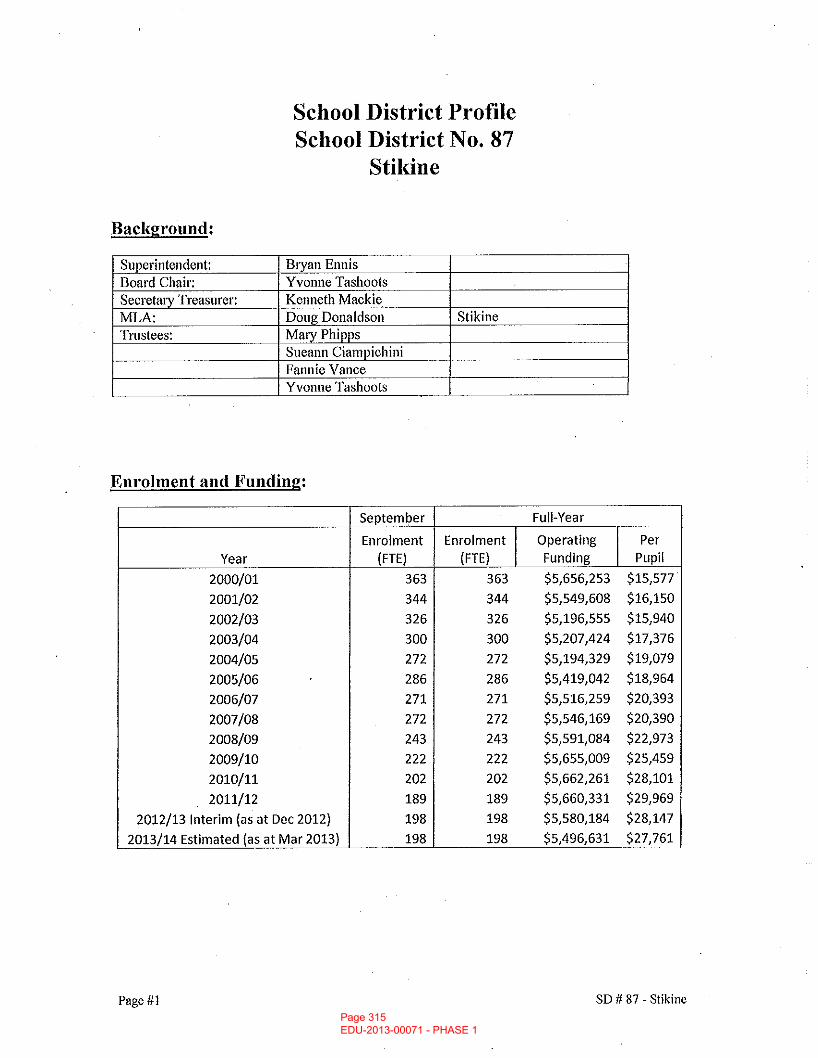
Page 315 EDU-2013-00071 - PHASE 1
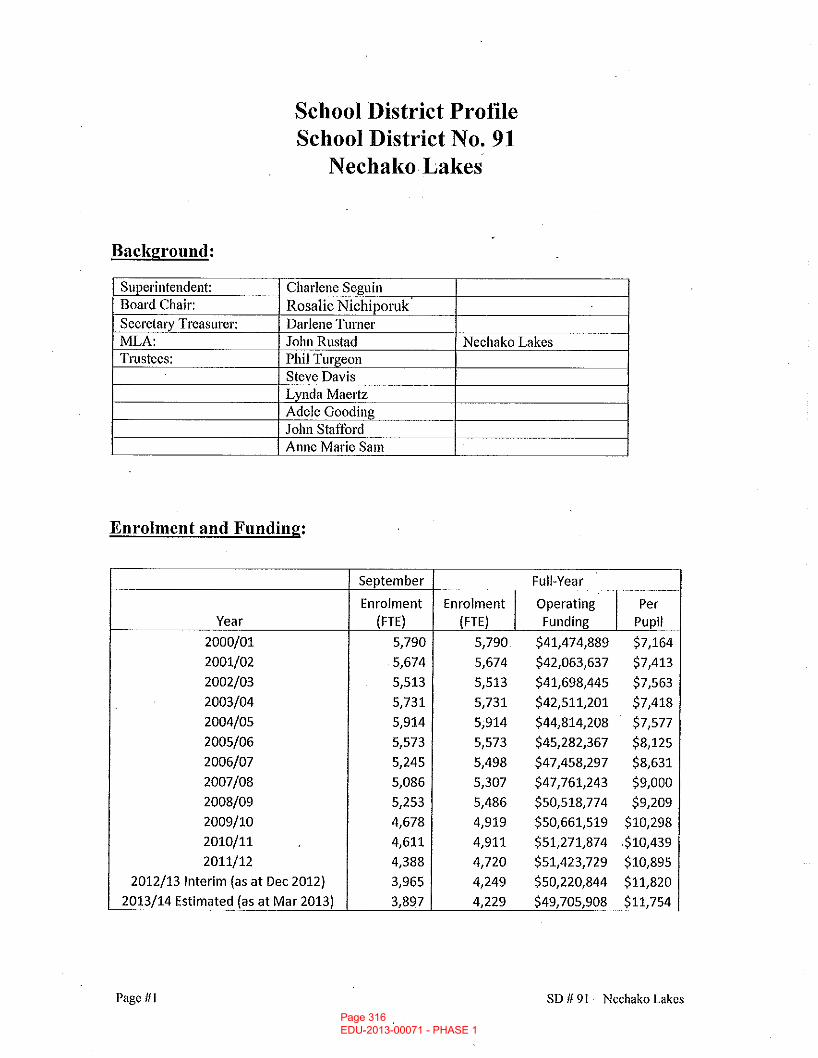
Page 316 EDU-2013-00071 - PHASE 1
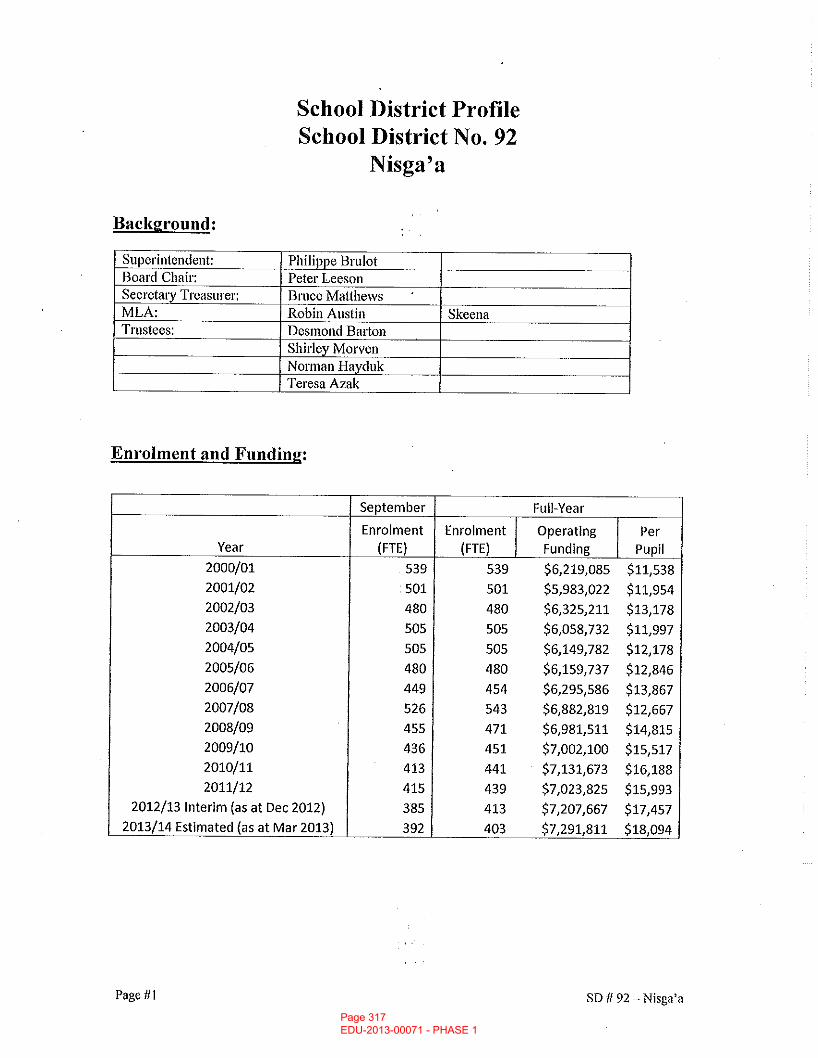
Page 317 EDU-2013-00071 - PHASE 1
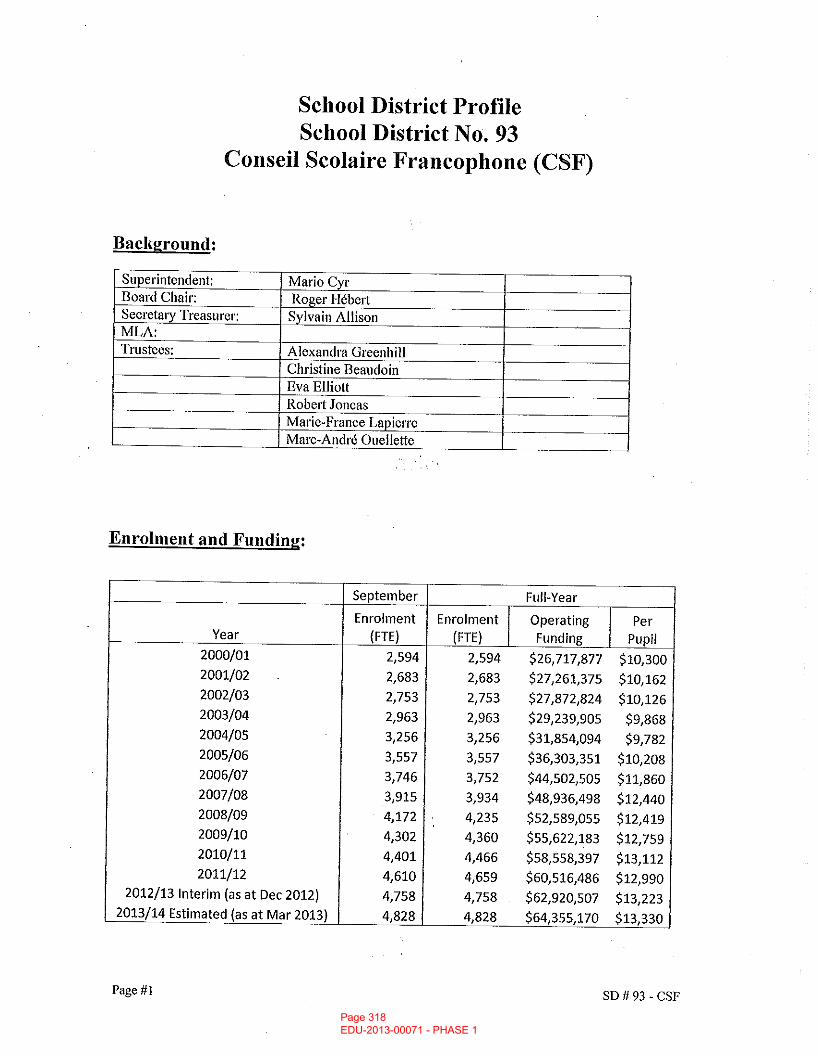
Page 318 EDU-2013-00071 - PHASE 1
2011/12SUMMARY OF KEY INFORMATION
Ministry of Education
April 2012Research and Data Analysis
Page 319 EDU-2013-00071 - PHASE 1
PLEASE NOTE:The Ministry of Education makes small and continuous improvements to the quality of its data.
Sometimes these changes result in differences from previously published reports. The data in this report are the most accurate data available at time of publication.
Ministry Reports are available at http://www.bced.gov.bc.ca/reporting/ Contact the Information Department at [email protected]
Page 320 EDU-2013-00071 - PHASE 1
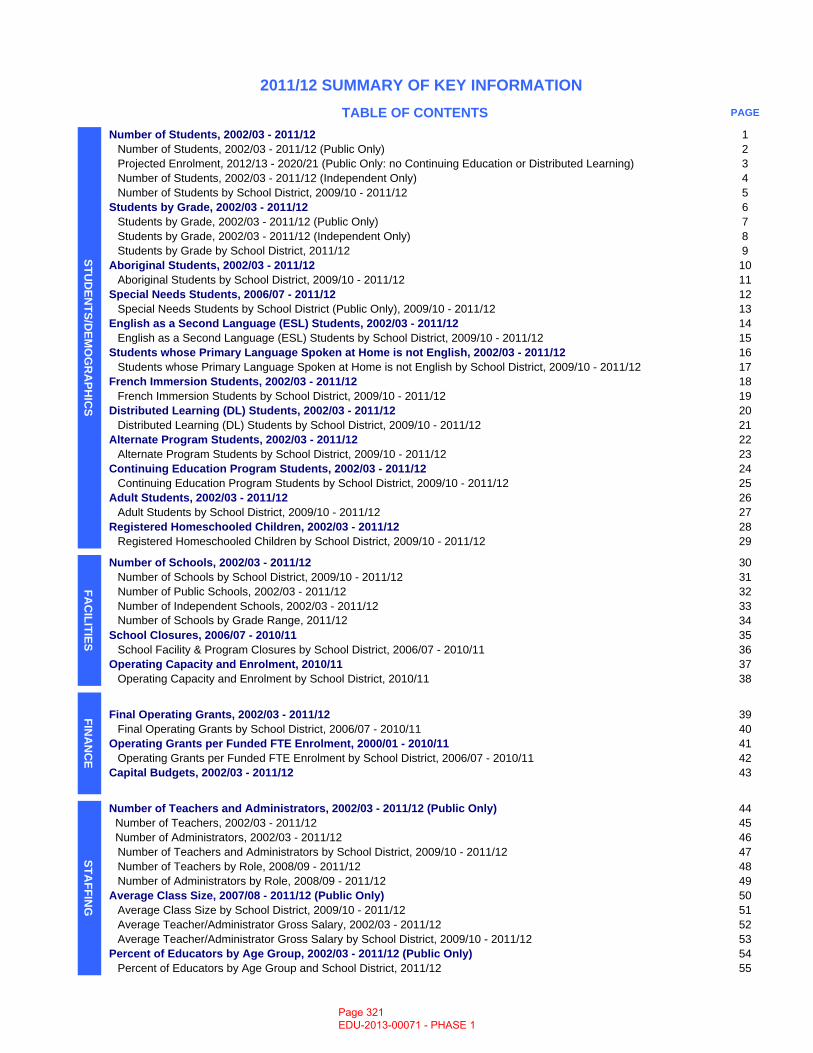
TABLE OF CONTENTS PAGE
Number of Students, 2002/03 - 2011/12 1Number of Students, 2002/03 - 2011/12 (Public Only) 2Projected Enrolment, 2012/13 - 2020/21 (Public Only: no Continuing Education or Distributed Learning) 3Number of Students, 2002/03 - 2011/12 (Independent Only) 4Number of Students by School District, 2009/10 - 2011/12 5
Students by Grade, 2002/03 - 2011/12 6Students by Grade, 2002/03 - 2011/12 (Public Only) 7Students by Grade, 2002/03 - 2011/12 (Independent Only) 8Students by Grade by School District, 2011/12 9
Aboriginal Students, 2002/03 - 2011/12 10Aboriginal Students by School District, 2009/10 - 2011/12 11
Special Needs Students, 2006/07 - 2011/12 12Special Needs Students by School District (Public Only), 2009/10 - 2011/12 13
English as a Second Language (ESL) Students, 2002/03 - 2011/12 14English as a Second Language (ESL) Students by School District, 2009/10 - 2011/12 15
Students whose Primary Language Spoken at Home is not English, 2002/03 - 2011/12 16Students whose Primary Language Spoken at Home is not English by School District, 2009/10 - 2011/12 17
French Immersion Students, 2002/03 - 2011/12 18French Immersion Students by School District, 2009/10 - 2011/12 19
Distributed Learning (DL) Students, 2002/03 - 2011/12 20Distributed Learning (DL) Students by School District, 2009/10 - 2011/12 21
Alternate Program Students, 2002/03 - 2011/12 22Alternate Program Students by School District, 2009/10 - 2011/12 23
Continuing Education Program Students, 2002/03 - 2011/12 24Continuing Education Program Students by School District, 2009/10 - 2011/12 25
Adult Students, 2002/03 - 2011/12 26Adult Students by School District, 2009/10 - 2011/12 27
Registered Homeschooled Children, 2002/03 - 2011/12 28Registered Homeschooled Children by School District, 2009/10 - 2011/12 29
Number of Schools, 2002/03 - 2011/12 30Number of Schools by School District, 2009/10 - 2011/12 31Number of Public Schools, 2002/03 - 2011/12 32Number of Independent Schools, 2002/03 - 2011/12 33Number of Schools by Grade Range, 2011/12 34
School Closures, 2006/07 - 2010/11 35School Facility & Program Closures by School District, 2006/07 - 2010/11 36
Operating Capacity and Enrolment, 2010/11 37Operating Capacity and Enrolment by School District, 2010/11 38
Final Operating Grants, 2002/03 - 2011/12 39Final Operating Grants by School District, 2006/07 - 2010/11 40
Operating Grants per Funded FTE Enrolment, 2000/01 - 2010/11 41Operating Grants per Funded FTE Enrolment by School District, 2006/07 - 2010/11 42
Capital Budgets, 2002/03 - 2011/12 43
Number of Teachers and Administrators, 2002/03 - 2011/12 (Public Only) 44 Number of Teachers, 2002/03 - 2011/12 45 Number of Administrators, 2002/03 - 2011/12 46
Number of Teachers and Administrators by School District, 2009/10 - 2011/12 47Number of Teachers by Role, 2008/09 - 2011/12 48Number of Administrators by Role, 2008/09 - 2011/12 49
Average Class Size, 2007/08 - 2011/12 (Public Only) 50Average Class Size by School District, 2009/10 - 2011/12 51Average Teacher/Administrator Gross Salary, 2002/03 - 2011/12 52Average Teacher/Administrator Gross Salary by School District, 2009/10 - 2011/12 53
Percent of Educators by Age Group, 2002/03 - 2011/12 (Public Only) 54Percent of Educators by Age Group and School District, 2011/12 55
STUD
ENTS/D
EMO
GR
APH
ICS
2011/12 SUMMARY OF KEY INFORMATION
FAC
ILITIESSTA
FFING
FINA
NC
E
Page 321 EDU-2013-00071 - PHASE 1
TABLE OF CONTENTS PAGE
2011/12 SUMMARY OF KEY INFORMATION
Six-Year Completion Rate - All Students, 2006/07 - 2010/11 56Six-Year Completion Rate by School District - All Students, 2008/09 - 2010/11 57Six-Year Completion Rate - Aboriginal Students, 2006/07 - 2010/11 58Six-Year Completion Rate by School District - Aboriginal Students, 2008/09 - 2010/11 59Six-Year Completion Rate - ESL Students, 2006/07 - 2010/11 60Six-Year Completion Rate by School District - ESL Students, 2008/09 - 2010/11 61Six-Year Completion Rate - French Immersion Students, 2006/07 - 2010/11 62Six-Year Completion Rate by School District - French Immersion Students, 2006/07 - 2010/11 63Six-Year Completion Rate - Special Needs Students, 2008/09 - 2010/11 64Six-Year Completion Rate by School District - Special Needs Students, 2006/07 - 2010/11 65
Grade 4 - Foundation Skills Assessments, 2007/08 - 2010/11 66FSA - Grade 4 - Reading Comprehension by School District, 2007/08 - 2010/11 67FSA - Grade 4 - Writing by School District, 2007/08 - 2010/11 68FSA - Grade 4 - Numeracy by School District, 2007/08 - 2010/11 69
Grade 7 - Foundation Skills Assessments, 2007/08 - 2010/11 70FSA - Grade 7 - Reading Comprehension by School District, 2007/08 - 2010/11 71FSA - Grade 7 - Writing by School District, 2007/08 - 2010/11 72FSA - Grade 7 - Numeracy by School District, 2007/08 - 2010/11 73
Grade 10 Provincial Exams Pass Rate, 2006/07 - 2010/11 74Grade 10 Exams Pass Rates (%) by School District, 2010/11 76
Grade 11 - Provincial Exams Pass Rates, 2006/07 - 2010/11 77Grade 11 Exams Pass Rates (%) by School District, 2010/11 78
Grade 12 - Provincial Exams Pass Rates, 2006/07 - 2010/11 79Grade 12 - Provincial Exams Pass Rates by School District 2010/11 80
Grade 12 Graduation Program Examinations Scholarships, 2004/05 - 2008/09 81Grade 12 Graduation Program Examinations Scholarships by School District, 2006/07 - 2008/09 82
Satisfaction - Learning, 2006/07 - 2010/11 83Satisfaction - Learning by School District, 2010/11 84Satisfaction - School Safety, 2006/07 - 2010/11 85Satisfaction - School Safety by School District, 2010/11 86Satisfaction - Physical Activity, 2006/07 - 2010/11 87Satisfaction - Physical Activity by School District, 2010/11 88Satisfaction - Participation, 2006/07 - 2010/11 89Satisfaction - Participation by School District, 2010/11 90
BC Standing: 2006 Programme for International Student Assessment (PISA) 91PISA 2006 Levels of Science Proficiency 92
BC Standing: 2006 Progress in International Reading Literacy Study (PIRLS) 93PIRLS 2006 International Benchmarks of Reading Achievement 94
GLOSSARY 95R
ESULTS
Page 322 EDU-2013-00071 - PHASE 1
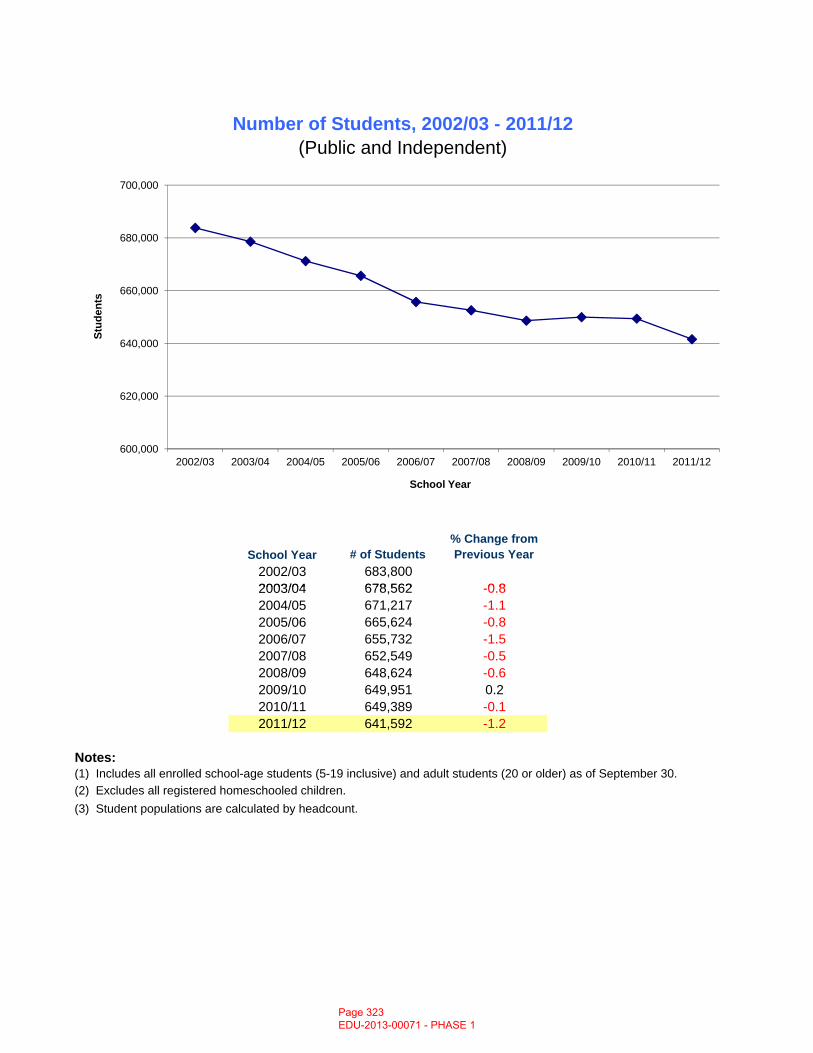
School Year # of Students% Change from Previous Year
2002/03 683,8002003/04 678 562 0 8
Number of Students, 2002/03 - 2011/12(Public and Independent)
600,000
620,000
640,000
660,000
680,000
700,000
2002/03 2003/04 2004/05 2005/06 2006/07 2007/08 2008/09 2009/10 2010/11 2011/12
Stud
ents
School Year
2003/04 678,562 -0.82004/05 671,217 -1.12005/06 665,624 -0.82006/07 655,732 -1.52007/08 652,549 -0.52008/09 648,624 -0.62009/10 649,951 0.22010/11 649,389 -0.12011/12 641,592 -1.2
Notes:
(2) Excludes all registered homeschooled children.(3) Student populations are calculated by headcount.
(1) Includes all enrolled school-age students (5-19 inclusive) and adult students (20 or older) as of September 30.
Page 323 EDU-2013-00071 - PHASE 1
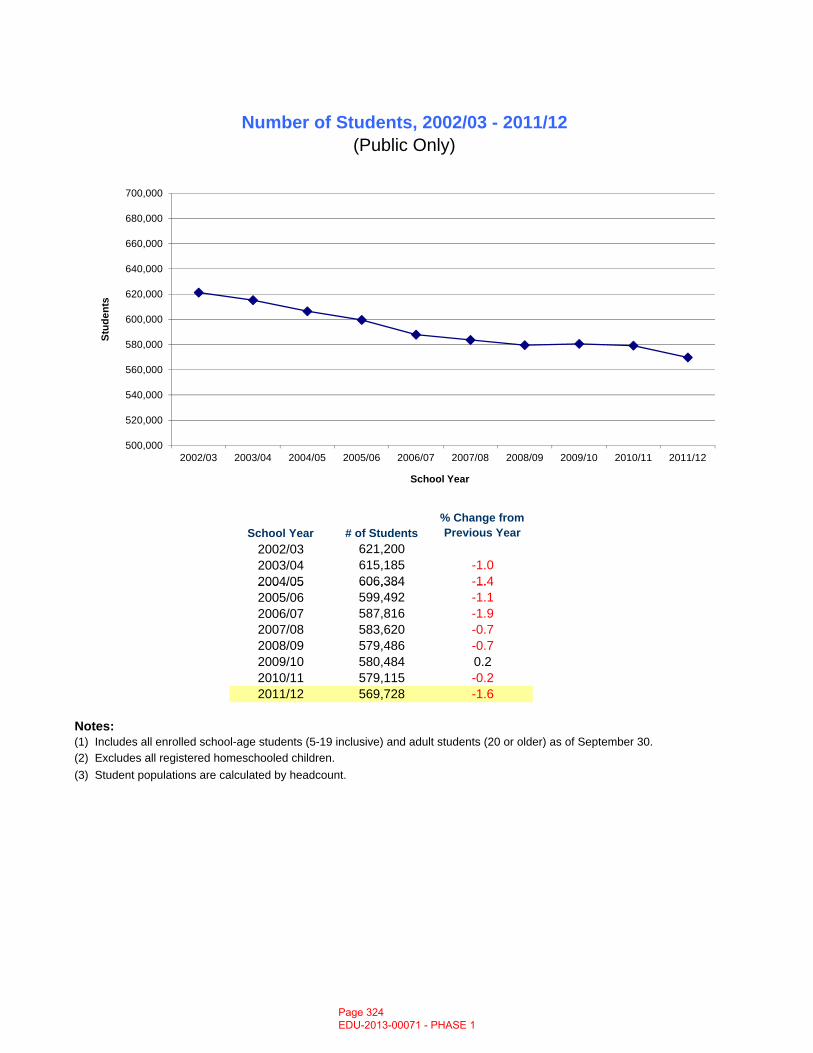
School Year # of Students% Change from Previous Year
2002/03 621,2002003/04 615,185 -1.02004/05 606,384 -1.4
Number of Students, 2002/03 - 2011/12(Public Only)
500,000
520,000
540,000
560,000
580,000
600,000
620,000
640,000
660,000
680,000
700,000
2002/03 2003/04 2004/05 2005/06 2006/07 2007/08 2008/09 2009/10 2010/11 2011/12
Stud
ents
School Year
2004/05 606,384 1.42005/06 599,492 -1.12006/07 587,816 -1.92007/08 583,620 -0.72008/09 579,486 -0.72009/10 580,484 0.22010/11 579,115 -0.22011/12 569,728 -1.6
Notes:
(2) Excludes all registered homeschooled children.(3) Student populations are calculated by headcount.
(1) Includes all enrolled school-age students (5-19 inclusive) and adult students (20 or older) as of September 30.
Page 324 EDU-2013-00071 - PHASE 1
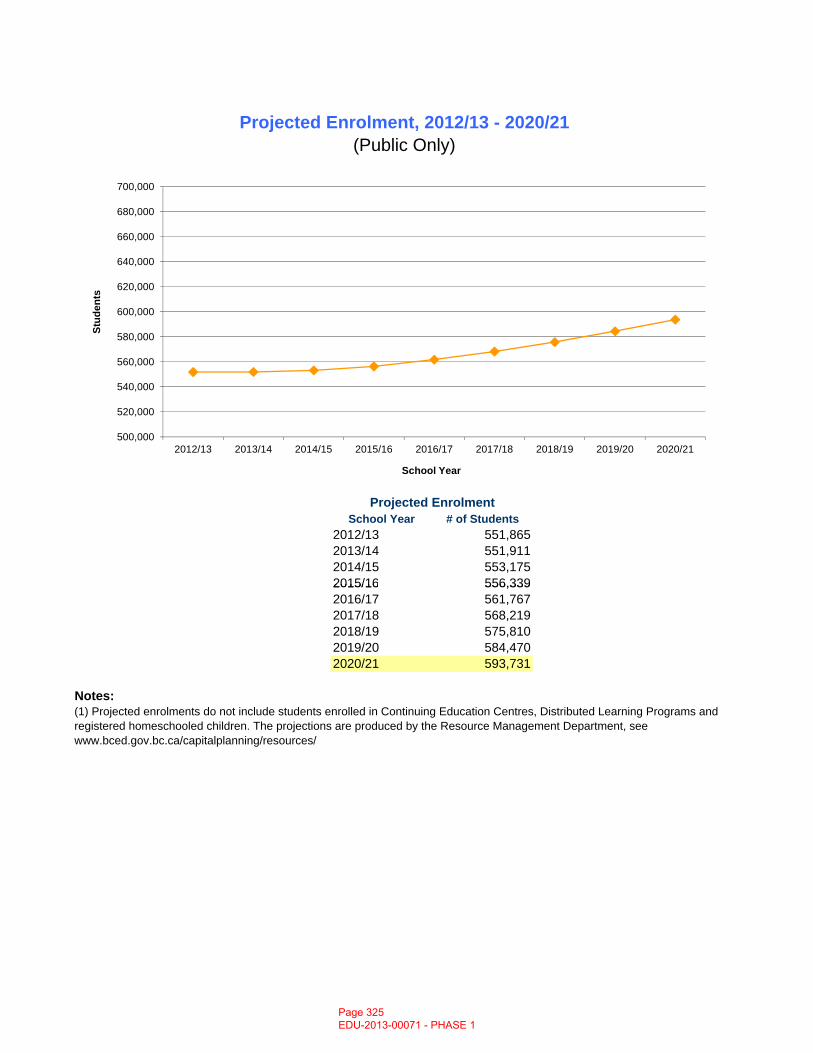
School Year # of Students2012/13 551,8652013/14 551,9112014/15 553,1752015/16 556,339
Projected Enrolment
Projected Enrolment, 2012/13 - 2020/21(Public Only)
500,000
520,000
540,000
560,000
580,000
600,000
620,000
640,000
660,000
680,000
700,000
2012/13 2013/14 2014/15 2015/16 2016/17 2017/18 2018/19 2019/20 2020/21
Stud
ents
School Year
2015/16 556,3392016/17 561,7672017/18 568,2192018/19 575,8102019/20 584,4702020/21 593,731
Notes:(1) Projected enrolments do not include students enrolled in Continuing Education Centres, Distributed Learning Programs and registered homeschooled children. The projections are produced by the Resource Management Department, see www.bced.gov.bc.ca/capitalplanning/resources/
Page 325 EDU-2013-00071 - PHASE 1
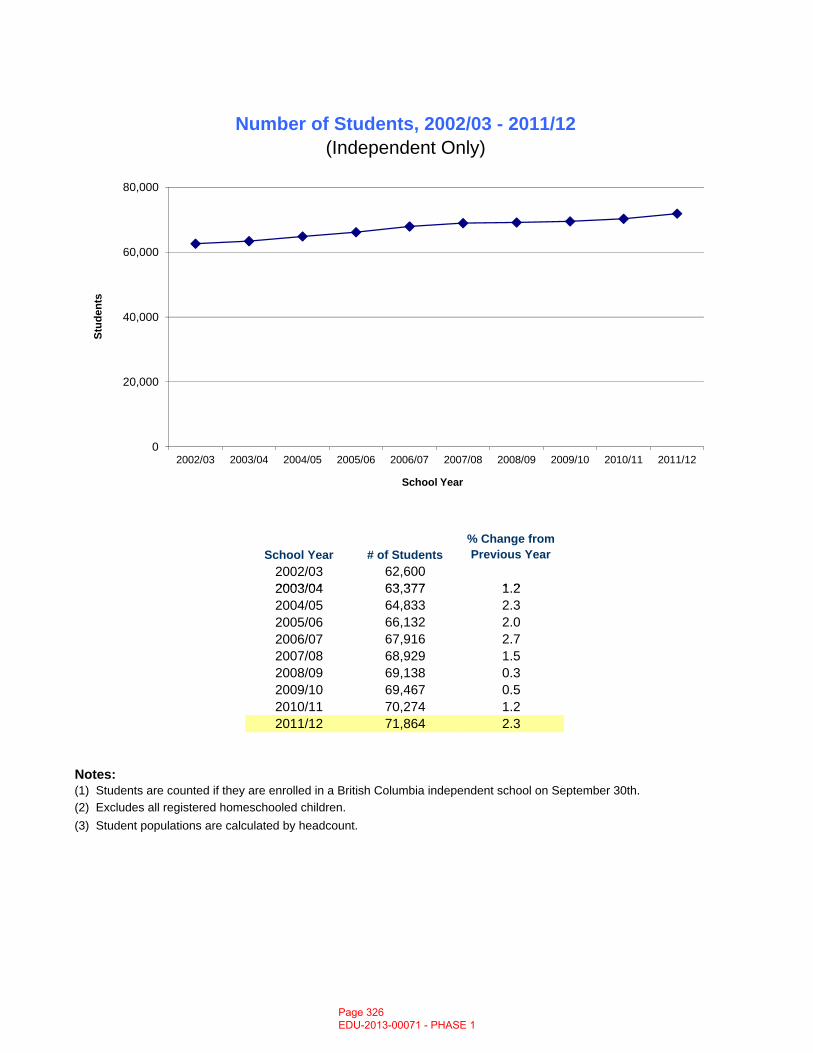
School Year # of Students% Change from Previous Year
2002/03 62,6002003/04 63 377 1 2
(Independent Only)Number of Students, 2002/03 - 2011/12
0
20,000
40,000
60,000
80,000
2002/03 2003/04 2004/05 2005/06 2006/07 2007/08 2008/09 2009/10 2010/11 2011/12
Stud
ents
School Year
2003/04 63,377 1.22004/05 64,833 2.32005/06 66,132 2.02006/07 67,916 2.72007/08 68,929 1.52008/09 69,138 0.32009/10 69,467 0.52010/11 70,274 1.22011/12 71,864 2.3
Notes:
(2) Excludes all registered homeschooled children.(3) Student populations are calculated by headcount.
(1) Students are counted if they are enrolled in a British Columbia independent school on September 30th.
Page 326 EDU-2013-00071 - PHASE 1
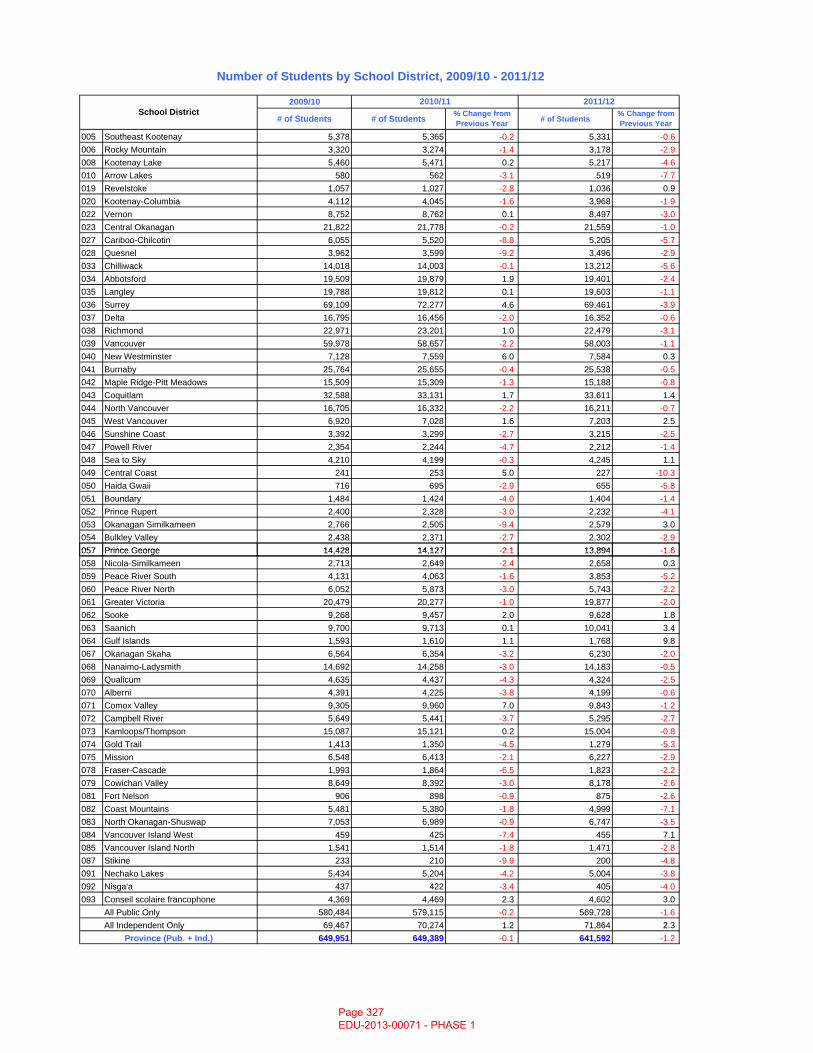
2009/10
# of Students # of Students % Change from Previous Year # of Students
% Change from Previous Year
005 Southeast Kootenay 5,378 5,365 -0.2 5,331 -0.6 006 Rocky Mountain 3,320 3,274 -1.4 3,178 -2.9 008 Kootenay Lake 5,460 5,471 0.2 5,217 -4.6 010 Arrow Lakes 580 562 -3.1 519 -7.7 019 Revelstoke 1,057 1,027 -2.8 1,036 0.9020 Kootenay-Columbia 4,112 4,045 -1.6 3,968 -1.9 022 Vernon 8,752 8,762 0.1 8,497 -3.0 023 Central Okanagan 21,822 21,778 -0.2 21,559 -1.0 027 Cariboo-Chilcotin 6,055 5,520 -8.8 5,205 -5.7 028 Quesnel 3,962 3,599 -9.2 3,496 -2.9 033 Chilliwack 14,018 14,003 -0.1 13,212 -5.6 034 Abbotsford 19,509 19,879 1.9 19,401 -2.4 035 Langley 19,788 19,812 0.1 19,603 -1.1 036 Surrey 69,109 72,277 4.6 69,461 -3.9 037 Delta 16,795 16,456 -2.0 16,352 -0.6 038 Richmond 22,971 23,201 1.0 22,479 -3.1 039 Vancouver 59,978 58,657 -2.2 58,003 -1.1 040 New Westminster 7,128 7,559 6.0 7,584 0.3041 Burnaby 25,764 25,655 -0.4 25,538 -0.5 042 Maple Ridge-Pitt Meadows 15,509 15,309 -1.3 15,188 -0.8 043 Coquitlam 32,588 33,131 1.7 33,611 1.4044 North Vancouver 16,705 16,332 -2.2 16,211 -0.7 045 West Vancouver 6,920 7,028 1.6 7,203 2.5046 Sunshine Coast 3,392 3,299 -2.7 3,215 -2.5 047 Powell River 2,354 2,244 -4.7 2,212 -1.4 048 Sea to Sky 4,210 4,199 -0.3 4,245 1.1049 Central Coast 241 253 5.0 227 -10.3 050 Haida Gwaii 716 695 -2.9 655 -5.8 051 Boundary 1,484 1,424 -4.0 1,404 -1.4 052 Prince Rupert 2,400 2,328 -3.0 2,232 -4.1 053 Okanagan Similkameen 2,766 2,505 -9.4 2,579 3.0054 Bulkley Valley 2,438 2,371 -2.7 2,302 -2.9 057 Prince George 14 428 14 127 2 1 13 894 1 6
Number of Students by School District, 2009/10 - 2011/12
School District2010/11 2011/12
057 Prince George 14,428 14,127 -2.1 13,894 -1.6 058 Nicola-Similkameen 2,713 2,649 -2.4 2,658 0.3059 Peace River South 4,131 4,063 -1.6 3,853 -5.2 060 Peace River North 6,052 5,873 -3.0 5,743 -2.2 061 Greater Victoria 20,479 20,277 -1.0 19,877 -2.0 062 Sooke 9,268 9,457 2.0 9,628 1.8063 Saanich 9,700 9,713 0.1 10,041 3.4064 Gulf Islands 1,593 1,610 1.1 1,768 9.8067 Okanagan Skaha 6,564 6,354 -3.2 6,230 -2.0 068 Nanaimo-Ladysmith 14,692 14,258 -3.0 14,183 -0.5 069 Qualicum 4,635 4,437 -4.3 4,324 -2.5 070 Alberni 4,391 4,225 -3.8 4,199 -0.6 071 Comox Valley 9,305 9,960 7.0 9,843 -1.2 072 Campbell River 5,649 5,441 -3.7 5,295 -2.7 073 Kamloops/Thompson 15,087 15,121 0.2 15,004 -0.8 074 Gold Trail 1,413 1,350 -4.5 1,279 -5.3 075 Mission 6,548 6,413 -2.1 6,227 -2.9 078 Fraser-Cascade 1,993 1,864 -6.5 1,823 -2.2 079 Cowichan Valley 8,649 8,392 -3.0 8,178 -2.6 081 Fort Nelson 906 898 -0.9 875 -2.6 082 Coast Mountains 5,481 5,380 -1.8 4,999 -7.1 083 North Okanagan-Shuswap 7,053 6,989 -0.9 6,747 -3.5 084 Vancouver Island West 459 425 -7.4 455 7.1085 Vancouver Island North 1,541 1,514 -1.8 1,471 -2.8 087 Stikine 233 210 -9.9 200 -4.8 091 Nechako Lakes 5,434 5,204 -4.2 5,004 -3.8 092 Nisga'a 437 422 -3.4 405 -4.0 093 Conseil scolaire francophone 4,369 4,469 2.3 4,602 3.0
All Public Only 580,484 579,115 -0.2 569,728 -1.6 All Independent Only 69,467 70,274 1.2 71,864 2.3
649,951 649,389 -0.1 641,592 -1.2 Province (Pub. + Ind.)
Page 327 EDU-2013-00071 - PHASE 1
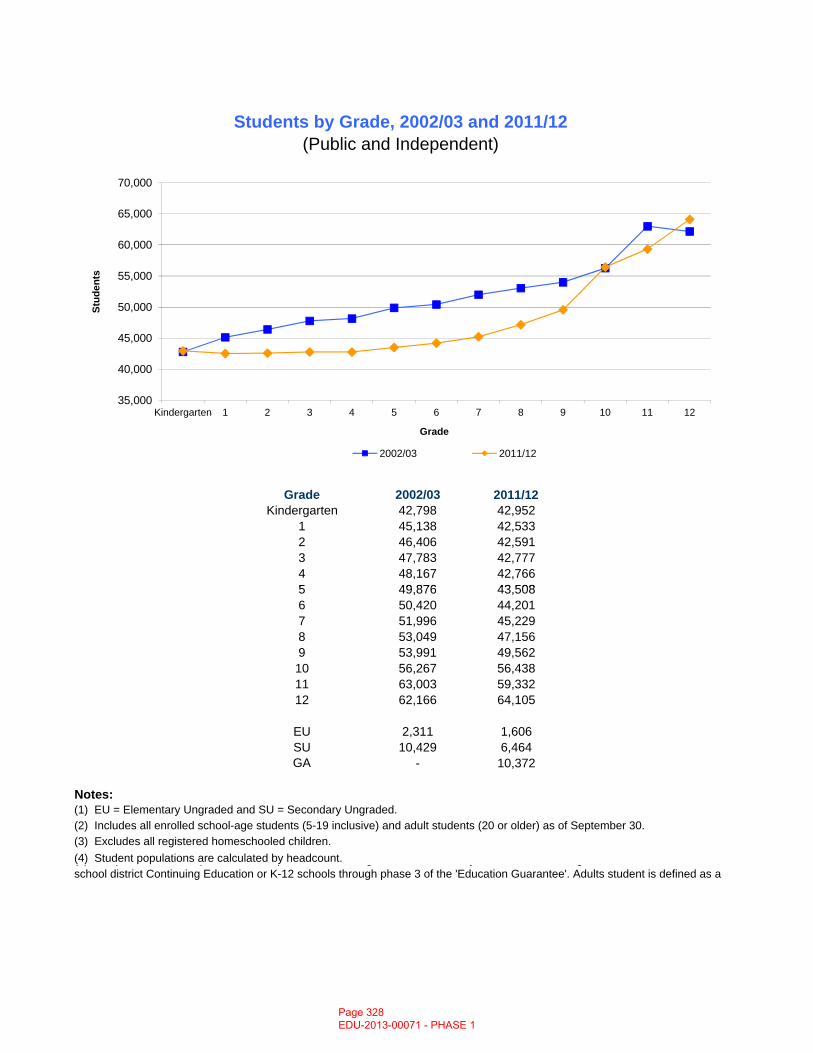
Grade 2002/03 2011/12Kindergarten 42,798 42,952
1 45,138 42,5332 46,406 42,5913 47,783 42,7774 48,167 42,7665 49 876 43 508
Students by Grade, 2002/03 and 2011/12(Public and Independent)
35,000
40,000
45,000
50,000
55,000
60,000
65,000
70,000
Kindergarten 1 2 3 4 5 6 7 8 9 10 11 12
Stud
ents
Grade
2002/03 2011/12
5 49,876 43,5086 50,420 44,2017 51,996 45,2298 53,049 47,1569 53,991 49,56210 56,267 56,43811 63,003 59,33212 62,166 64,105
EU 2,311 1,606SU 10,429 6,464GA - 10,372
Notes:(1) EU = Elementary Ungraded and SU = Secondary Ungraded.
(3) Excludes all registered homeschooled children.(4) Student populations are calculated by headcount.
(2) Includes all enrolled school-age students (5-19 inclusive) and adult students (20 or older) as of September 30.
( ) ( ) p g y gschool district Continuing Education or K-12 schools through phase 3 of the 'Education Guarantee'. Adults student is defined as a
Page 328 EDU-2013-00071 - PHASE 1
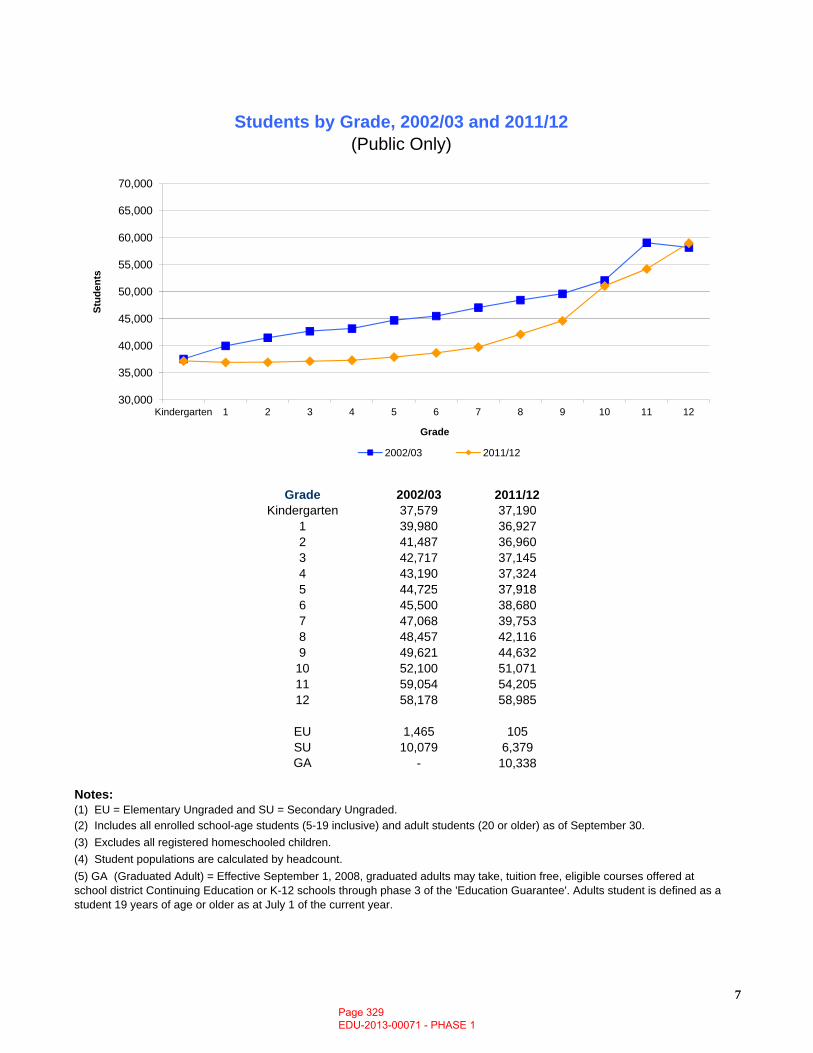
Grade 2002/03 2011/12Kindergarten 37,579 37,190
1 39,980 36,9272 41,487 36,9603 42,717 37,1454 43,190 37,3245 44 725 37 918
Students by Grade, 2002/03 and 2011/12(Public Only)
30,000
35,000
40,000
45,000
50,000
55,000
60,000
65,000
70,000
Kindergarten 1 2 3 4 5 6 7 8 9 10 11 12
Stud
ents
Grade
2002/03 2011/12
7
5 44,725 37,9186 45,500 38,6807 47,068 39,7538 48,457 42,1169 49,621 44,632
10 52,100 51,07111 59,054 54,20512 58,178 58,985
EU 1,465 105SU 10,079 6,379GA - 10,338
Notes:(1) EU = Elementary Ungraded and SU = Secondary Ungraded.
(3) Excludes all registered homeschooled children.(4) Student populations are calculated by headcount.
(2) Includes all enrolled school-age students (5-19 inclusive) and adult students (20 or older) as of September 30.
(5) GA (Graduated Adult) = Effective September 1, 2008, graduated adults may take, tuition free, eligible courses offered at school district Continuing Education or K-12 schools through phase 3 of the 'Education Guarantee'. Adults student is defined as a student 19 years of age or older as at July 1 of the current year.
7Page 329 EDU-2013-00071 - PHASE 1
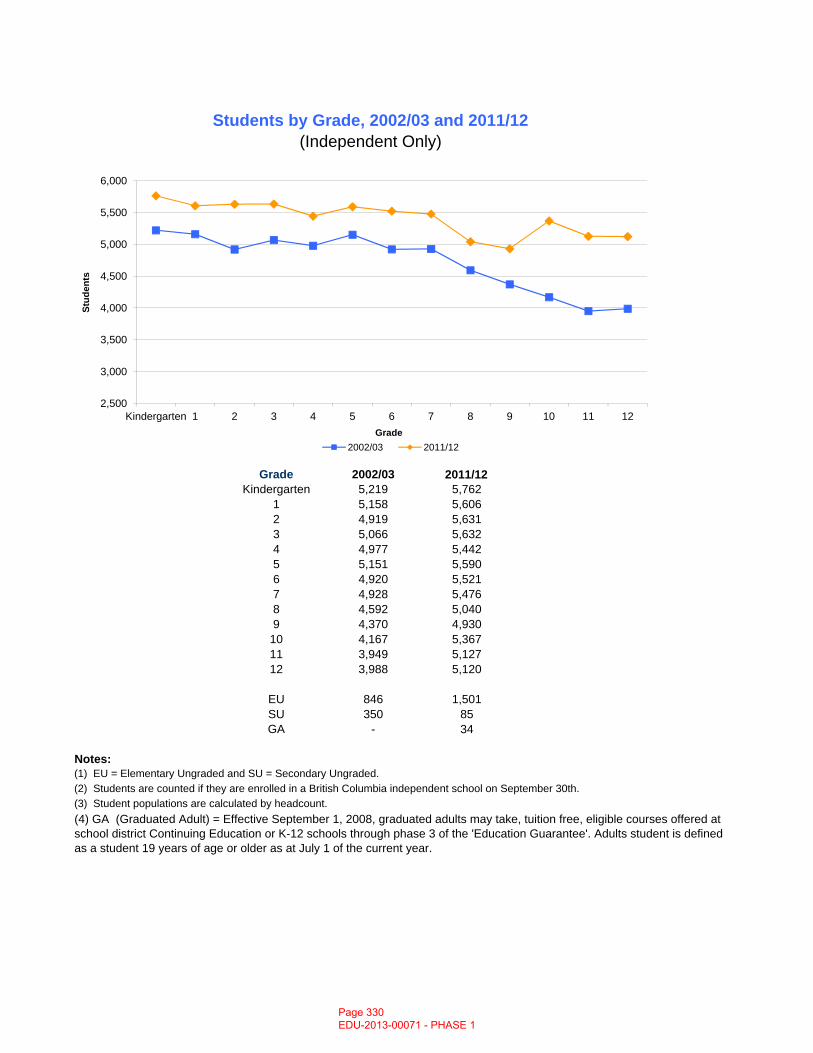
.
Grade 2002/03 2011/12Kindergarten 5,219 5,762
1 5,158 5,6062 4,919 5,6313 5,066 5,6324 4,977 5,4425 5,151 5,5906 4,920 5,521
Students by Grade, 2002/03 and 2011/12(Independent Only)
2,500
3,000
3,500
4,000
4,500
5,000
5,500
6,000
Kindergarten 1 2 3 4 5 6 7 8 9 10 11 12
Stud
ents
Grade2002/03 2011/12
7 4,928 5,4768 4,592 5,0409 4,370 4,930
10 4,167 5,36711 3,949 5,12712 3,988 5,120
EU 846 1,501SU 350 85GA - 34
Notes:(1) EU = Elementary Ungraded and SU = Secondary Ungraded.(2) Students are counted if they are enrolled in a British Columbia independent school on September 30th.(3) Student populations are calculated by headcount.(4) GA (Graduated Adult) = Effective September 1, 2008, graduated adults may take, tuition free, eligible courses offered at school district Continuing Education or K-12 schools through phase 3 of the 'Education Guarantee'. Adults student is defined as a student 19 years of age or older as at July 1 of the current year.
Page 330 EDU-2013-00071 - PHASE 1
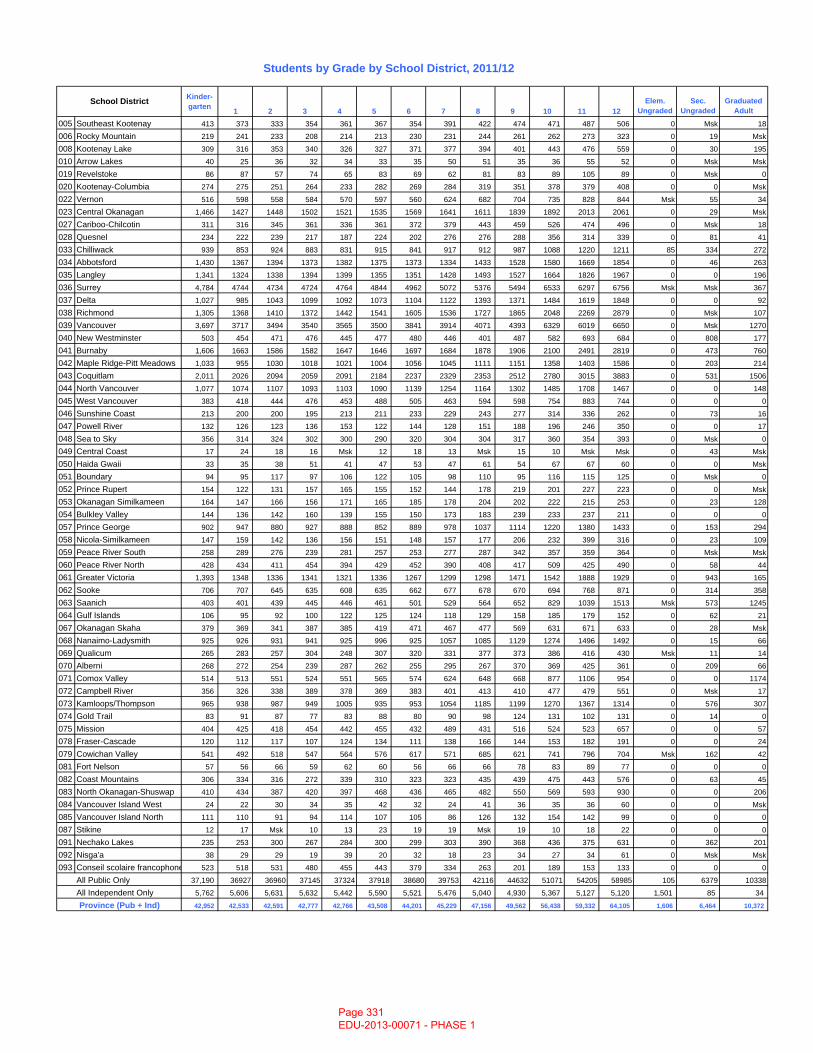
Kinder-garten 1 2 3 4 5 6 7 8 9 10 11 12
Elem. Ungraded
Sec. Ungraded
Graduated Adult
005 Southeast Kootenay 413 373 333 354 361 367 354 391 422 474 471 487 506 0 Msk 18
006 Rocky Mountain 219 241 233 208 214 213 230 231 244 261 262 273 323 0 19 Msk
008 Kootenay Lake 309 316 353 340 326 327 371 377 394 401 443 476 559 0 30 195
010 Arrow Lakes 40 25 36 32 34 33 35 50 51 35 36 55 52 0 Msk Msk
019 Revelstoke 86 87 57 74 65 83 69 62 81 83 89 105 89 0 Msk 0
020 Kootenay-Columbia 274 275 251 264 233 282 269 284 319 351 378 379 408 0 0 Msk
022 Vernon 516 598 558 584 570 597 560 624 682 704 735 828 844 Msk 55 34
023 Central Okanagan 1,466 1427 1448 1502 1521 1535 1569 1641 1611 1839 1892 2013 2061 0 29 Msk
027 Cariboo-Chilcotin 311 316 345 361 336 361 372 379 443 459 526 474 496 0 Msk 18
028 Quesnel 234 222 239 217 187 224 202 276 276 288 356 314 339 0 81 41
033 Chilliwack 939 853 924 883 831 915 841 917 912 987 1088 1220 1211 85 334 272
034 Abbotsford 1,430 1367 1394 1373 1382 1375 1373 1334 1433 1528 1580 1669 1854 0 46 263
035 Langley 1,341 1324 1338 1394 1399 1355 1351 1428 1493 1527 1664 1826 1967 0 0 196
036 Surrey 4,784 4744 4734 4724 4764 4844 4962 5072 5376 5494 6533 6297 6756 Msk Msk 367
037 Delta 1,027 985 1043 1099 1092 1073 1104 1122 1393 1371 1484 1619 1848 0 0 92
038 Richmond 1,305 1368 1410 1372 1442 1541 1605 1536 1727 1865 2048 2269 2879 0 Msk 107
039 Vancouver 3,697 3717 3494 3540 3565 3500 3841 3914 4071 4393 6329 6019 6650 0 Msk 1270
040 New Westminster 503 454 471 476 445 477 480 446 401 487 582 693 684 0 808 177
041 Burnaby 1,606 1663 1586 1582 1647 1646 1697 1684 1878 1906 2100 2491 2819 0 473 760
042 Maple Ridge-Pitt Meadows 1,033 955 1030 1018 1021 1004 1056 1045 1111 1151 1358 1403 1586 0 203 214
043 Coquitlam 2,011 2026 2094 2059 2091 2184 2237 2329 2353 2512 2780 3015 3883 0 531 1506
044 North Vancouver 1,077 1074 1107 1093 1103 1090 1139 1254 1164 1302 1485 1708 1467 0 0 148
045 West Vancouver 383 418 444 476 453 488 505 463 594 598 754 883 744 0 0 0
046 Sunshine Coast 213 200 200 195 213 211 233 229 243 277 314 336 262 0 73 16
047 Powell River 132 126 123 136 153 122 144 128 151 188 196 246 350 0 0 17
048 Sea to Sky 356 314 324 302 300 290 320 304 304 317 360 354 393 0 Msk 0
049 Central Coast 17 24 18 16 Msk 12 18 13 Msk 15 10 Msk Msk 0 43 Msk
050 Haida Gwaii 33 35 38 51 41 47 53 47 61 54 67 67 60 0 0 Msk
051 Boundary 94 95 117 97 106 122 105 98 110 95 116 115 125 0 Msk 0
052 Prince Rupert 154 122 131 157 165 155 152 144 178 219 201 227 223 0 0 Msk
053 Okanagan Similkameen 164 147 166 156 171 165 185 178 204 202 222 215 253 0 23 128
054 Bulkley Valley 144 136 142 160 139 155 150 173 183 239 233 237 211 0 0 0
057 Prince George 902 947 880 927 888 852 889 978 1037 1114 1220 1380 1433 0 153 294
058 Nicola-Similkameen 147 159 142 136 156 151 148 157 177 206 232 399 316 0 23 109
059 Peace River South 258 289 276 239 281 257 253 277 287 342 357 359 364 0 Msk Msk
060 Peace River North 428 434 411 454 394 429 452 390 408 417 509 425 490 0 58 44
061 Greater Victoria 1,393 1348 1336 1341 1321 1336 1267 1299 1298 1471 1542 1888 1929 0 943 165
062 Sooke 706 707 645 635 608 635 662 677 678 670 694 768 871 0 314 358
063 Saanich 403 401 439 445 446 461 501 529 564 652 829 1039 1513 Msk 573 1245
064 Gulf Islands 106 95 92 100 122 125 124 118 129 158 185 179 152 0 62 21
067 Okanagan Skaha 379 369 341 387 385 419 471 467 477 569 631 671 633 0 28 Msk
068 Nanaimo-Ladysmith 925 926 931 941 925 996 925 1057 1085 1129 1274 1496 1492 0 15 66
069 Qualicum 265 283 257 304 248 307 320 331 377 373 386 416 430 Msk 11 14
070 Alberni 268 272 254 239 287 262 255 295 267 370 369 425 361 0 209 66
071 Comox Valley 514 513 551 524 551 565 574 624 648 668 877 1106 954 0 0 1174
072 Campbell River 356 326 338 389 378 369 383 401 413 410 477 479 551 0 Msk 17
073 Kamloops/Thompson 965 938 987 949 1005 935 953 1054 1185 1199 1270 1367 1314 0 576 307
074 Gold Trail 83 91 87 77 83 88 80 90 98 124 131 102 131 0 14 0
075 Mission 404 425 418 454 442 455 432 489 431 516 524 523 657 0 0 57
078 Fraser-Cascade 120 112 117 107 124 134 111 138 166 144 153 182 191 0 0 24
079 Cowichan Valley 541 492 518 547 564 576 617 571 685 621 741 796 704 Msk 162 42
081 Fort Nelson 57 56 66 59 62 60 56 66 66 78 83 89 77 0 0 0
082 Coast Mountains 306 334 316 272 339 310 323 323 435 439 475 443 576 0 63 45
083 North Okanagan-Shuswap 410 434 387 420 397 468 436 465 482 550 569 593 930 0 0 206
084 Vancouver Island West 24 22 30 34 35 42 32 24 41 36 35 36 60 0 0 Msk
085 Vancouver Island North 111 110 91 94 114 107 105 86 126 132 154 142 99 0 0 0
087 Stikine 12 17 Msk 10 13 23 19 19 Msk 19 10 18 22 0 0 0
091 Nechako Lakes 235 253 300 267 284 300 299 303 390 368 436 375 631 0 362 201
092 Nisga'a 38 29 29 19 39 20 32 18 23 34 27 34 61 0 Msk Msk
093 Conseil scolaire francophone 523 518 531 480 455 443 379 334 263 201 189 153 133 0 0 0
All Public Only 37,190 36927 36960 37145 37324 37918 38680 39753 42116 44632 51071 54205 58985 105 6379 10338
All Independent Only 5,762 5,606 5,631 5,632 5,442 5,590 5,521 5,476 5,040 4,930 5,367 5,127 5,120 1,501 85 34
42,952 42,533 42,591 42,777 42,766 43,508 44,201 45,229 47,156 49,562 56,438 59,332 64,105 1,606 6,464 10,372
Students by Grade by School District, 2011/12
Province (Pub + Ind)
School District
Page 331 EDU-2013-00071 - PHASE 1
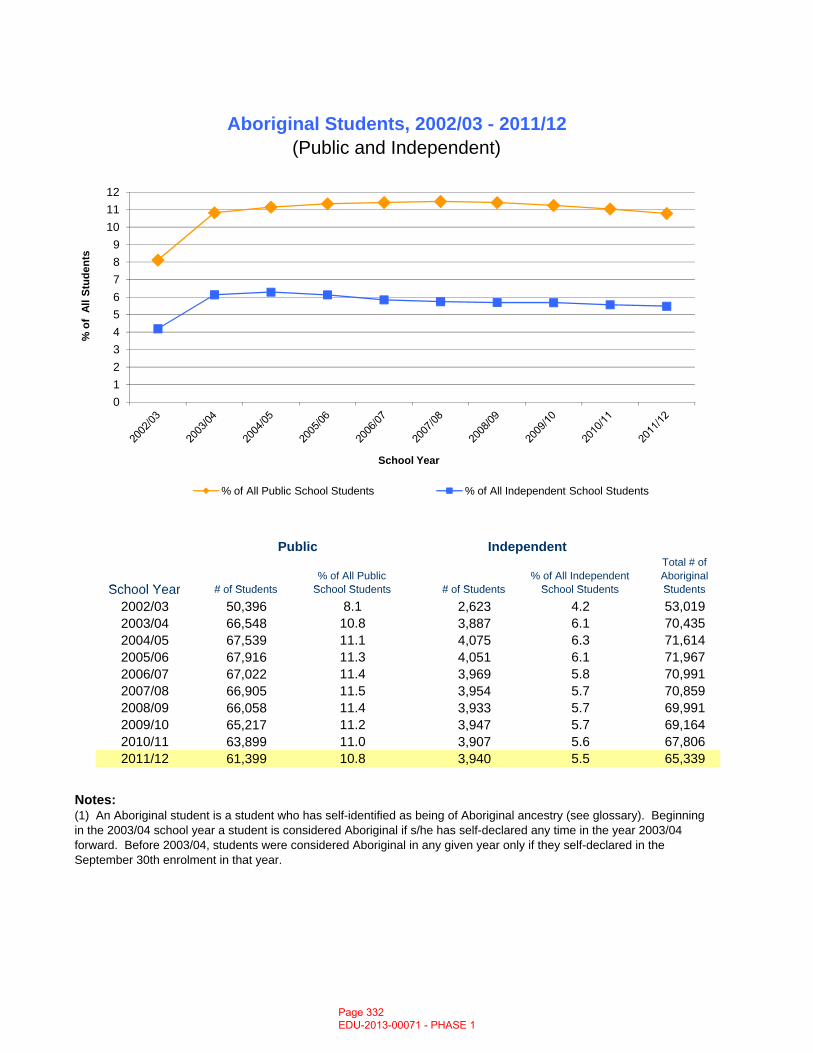
# of St dents% of All Public
School St dents # of St dents% of All Independent
School St dents
Total # of Aboriginal St dents
Aboriginal Students, 2002/03 - 2011/12(Public and Independent)
School Year
Public Independent
0123456789
101112
% o
f Al
l Stu
dent
s
School Year
% of All Public School Students % of All Independent School Students
# of Students School Students # of Students School Students Students
2002/03 50,396 8.1 2,623 4.2 53,0192003/04 66,548 10.8 3,887 6.1 70,4352004/05 67,539 11.1 4,075 6.3 71,6142005/06 67,916 11.3 4,051 6.1 71,9672006/07 67,022 11.4 3,969 5.8 70,9912007/08 66,905 11.5 3,954 5.7 70,8592008/09 66,058 11.4 3,933 5.7 69,9912009/10 65,217 11.2 3,947 5.7 69,1642010/11 63,899 11.0 3,907 5.6 67,8062011/12 61,399 10.8 3,940 5.5 65,339
Notes:(1) An Aboriginal student is a student who has self-identified as being of Aboriginal ancestry (see glossary). Beginning in the 2003/04 school year a student is considered Aboriginal if s/he has self-declared any time in the year 2003/04 forward. Before 2003/04, students were considered Aboriginal in any given year only if they self-declared in the September 30th enrolment in that year.
School Year
Page 332 EDU-2013-00071 - PHASE 1
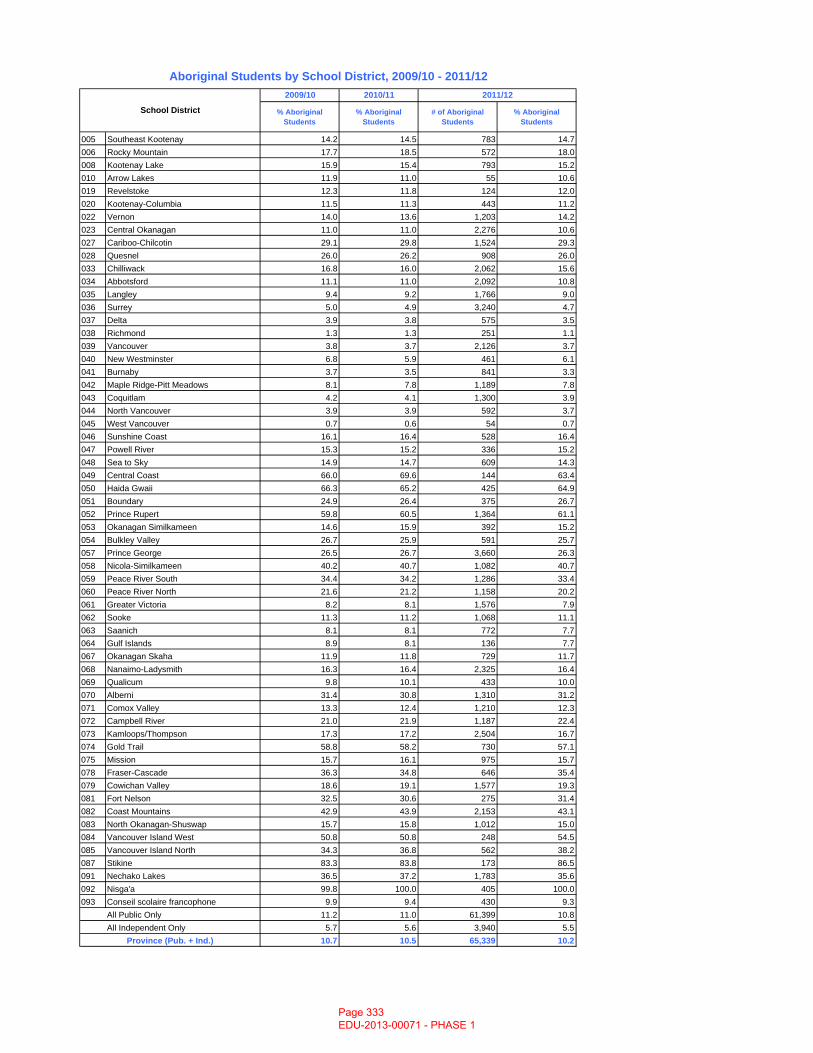
% Aboriginal Students
% Aboriginal Students
# of Aboriginal Students
% Aboriginal Students
005 Southeast Kootenay 14.2 14.5 783 14.7006 Rocky Mountain 17.7 18.5 572 18.0008 Kootenay Lake 15.9 15.4 793 15.2010 Arrow Lakes 11.9 11.0 55 10.6019 Revelstoke 12.3 11.8 124 12.0020 Kootenay-Columbia 11.5 11.3 443 11.2022 Vernon 14.0 13.6 1,203 14.2023 Central Okanagan 11.0 11.0 2,276 10.6027 Cariboo-Chilcotin 29.1 29.8 1,524 29.3028 Quesnel 26.0 26.2 908 26.0033 Chilliwack 16.8 16.0 2,062 15.6034 Abbotsford 11.1 11.0 2,092 10.8035 Langley 9.4 9.2 1,766 9.0036 Surrey 5.0 4.9 3,240 4.7037 Delta 3.9 3.8 575 3.5038 Richmond 1.3 1.3 251 1.1039 Vancouver 3.8 3.7 2,126 3.7040 New Westminster 6.8 5.9 461 6.1041 Burnaby 3.7 3.5 841 3.3042 Maple Ridge-Pitt Meadows 8.1 7.8 1,189 7.8043 Coquitlam 4.2 4.1 1,300 3.9044 North Vancouver 3.9 3.9 592 3.7045 West Vancouver 0.7 0.6 54 0.7046 Sunshine Coast 16.1 16.4 528 16.4047 Powell River 15.3 15.2 336 15.2048 Sea to Sky 14.9 14.7 609 14.3049 Central Coast 66.0 69.6 144 63.4050 Haida Gwaii 66.3 65.2 425 64.9051 Boundary 24.9 26.4 375 26.7052 Prince Rupert 59.8 60.5 1,364 61.1053 Okanagan Similkameen 14.6 15.9 392 15.2054 Bulkley Valley 26.7 25.9 591 25.7057 Prince George 26.5 26.7 3,660 26.3058 Nicola-Similkameen 40.2 40.7 1,082 40.7059 Peace River South 34.4 34.2 1,286 33.4060 Peace River North 21.6 21.2 1,158 20.2061 Greater Victoria 8.2 8.1 1,576 7.9062 Sooke 11.3 11.2 1,068 11.1063 Saanich 8.1 8.1 772 7.7064 Gulf Islands 8.9 8.1 136 7.7067 Okanagan Skaha 11.9 11.8 729 11.7068 Nanaimo-Ladysmith 16.3 16.4 2,325 16.4069 Qualicum 9.8 10.1 433 10.0070 Alberni 31.4 30.8 1,310 31.2071 Comox Valley 13.3 12.4 1,210 12.3072 Campbell River 21.0 21.9 1,187 22.4073 Kamloops/Thompson 17.3 17.2 2,504 16.7074 Gold Trail 58.8 58.2 730 57.1075 Mission 15.7 16.1 975 15.7078 Fraser-Cascade 36.3 34.8 646 35.4079 Cowichan Valley 18.6 19.1 1,577 19.3081 Fort Nelson 32.5 30.6 275 31.4082 Coast Mountains 42.9 43.9 2,153 43.1083 North Okanagan-Shuswap 15.7 15.8 1,012 15.0084 Vancouver Island West 50.8 50.8 248 54.5085 Vancouver Island North 34.3 36.8 562 38.2087 Stikine 83.3 83.8 173 86.5091 Nechako Lakes 36.5 37.2 1,783 35.6092 Nisga'a 99.8 100.0 405 100.0093 Conseil scolaire francophone 9.9 9.4 430 9.3
All Public Only 11.2 11.0 61,399 10.8All Independent Only 5.7 5.6 3,940 5.5
10.7 10.5 65,339 10.2Province (Pub. + Ind.)
Aboriginal Students by School District, 2009/10 - 2011/122009/10 2010/11
School District
2011/12
Page 333 EDU-2013-00071 - PHASE 1
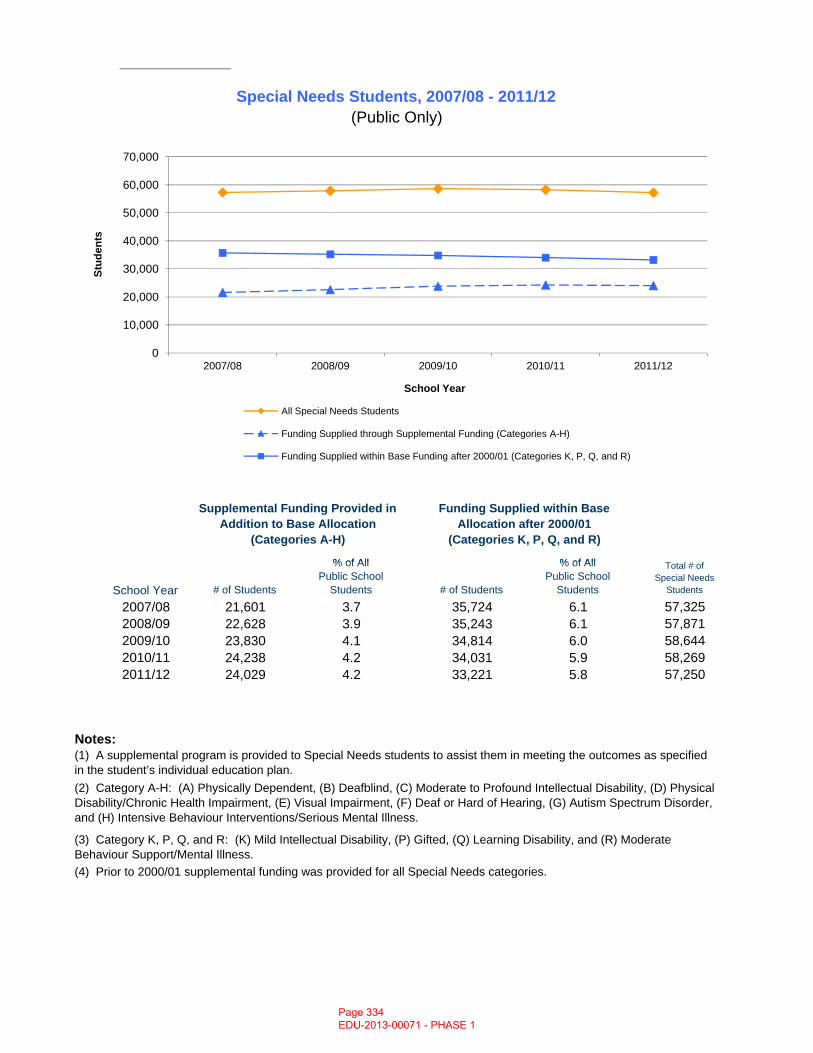
% of All % of All
Special Needs Students, 2007/08 - 2011/12(Public Only)
Supplemental Funding Provided in Addition to Base Allocation
(Categories A-H)
Funding Supplied within Base Allocation after 2000/01
(Categories K, P, Q, and R)
0
10,000
20,000
30,000
40,000
50,000
60,000
70,000
2007/08 2008/09 2009/10 2010/11 2011/12
Stud
ents
School Year
All Special Needs Students
Funding Supplied through Supplemental Funding (Categories A-H)
Funding Supplied within Base Funding after 2000/01 (Categories K, P, Q, and R)
# of Students
% of All Public School
Students # of Students
% of AllPublic School
Students
Total # of Special Needs
Students
2007/08 21,601 3.7 35,724 6.1 57,3252008/09 22,628 3.9 35,243 6.1 57,8712009/10 23,830 4.1 34,814 6.0 58,6442010/11 24,238 4.2 34,031 5.9 58,2692011/12 24,029 4.2 33,221 5.8 57,250
Notes:
(4) Prior to 2000/01 supplemental funding was provided for all Special Needs categories.
(3) Category K, P, Q, and R: (K) Mild Intellectual Disability, (P) Gifted, (Q) Learning Disability, and (R) Moderate Behaviour Support/Mental Illness.
School Year
(1) A supplemental program is provided to Special Needs students to assist them in meeting the outcomes as specified in the student’s individual education plan.(2) Category A-H: (A) Physically Dependent, (B) Deafblind, (C) Moderate to Profound Intellectual Disability, (D) Physical Disability/Chronic Health Impairment, (E) Visual Impairment, (F) Deaf or Hard of Hearing, (G) Autism Spectrum Disorder, and (H) Intensive Behaviour Interventions/Serious Mental Illness.
Page 334 EDU-2013-00071 - PHASE 1
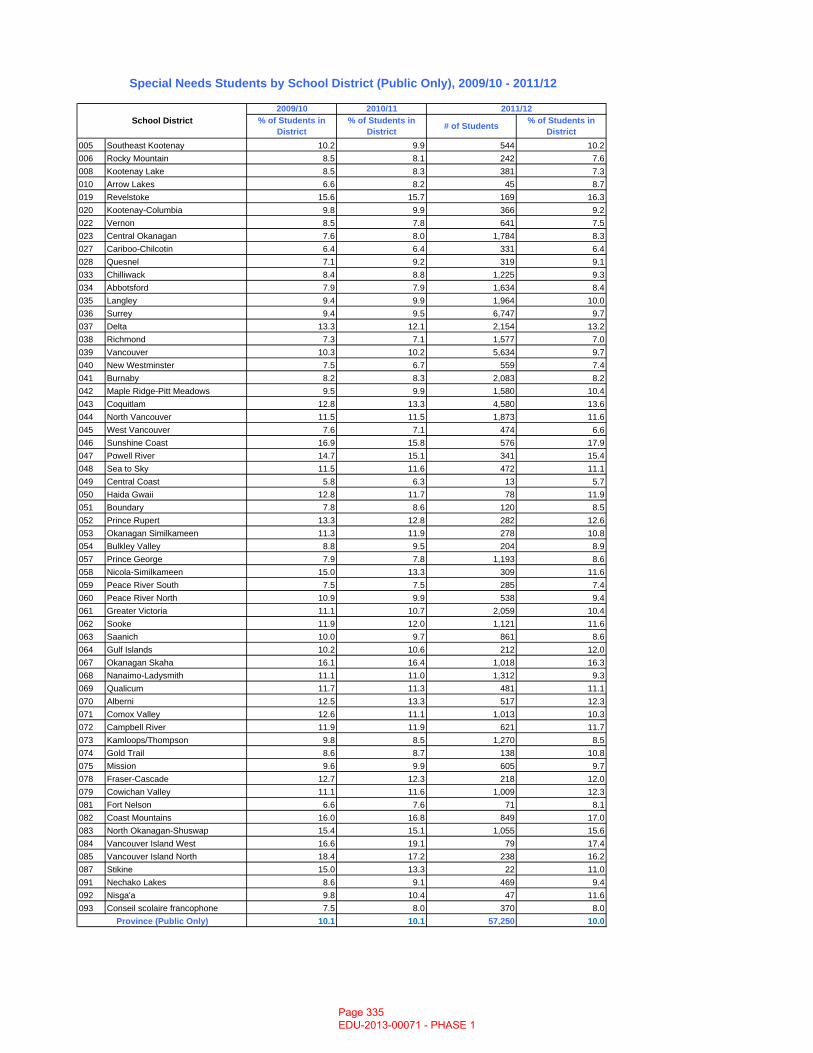
005 Southeast Kootenay 10.2 9.9 544 10.2006 Rocky Mountain 8.5 8.1 242 7.6008 Kootenay Lake 8.5 8.3 381 7.3010 Arrow Lakes 6.6 8.2 45 8.7019 Revelstoke 15.6 15.7 169 16.3020 Kootenay-Columbia 9.8 9.9 366 9.2022 Vernon 8.5 7.8 641 7.5023 Central Okanagan 7.6 8.0 1,784 8.3027 Cariboo-Chilcotin 6.4 6.4 331 6.4028 Quesnel 7.1 9.2 319 9.1033 Chilliwack 8.4 8.8 1,225 9.3034 Abbotsford 7.9 7.9 1,634 8.4035 Langley 9.4 9.9 1,964 10.0036 Surrey 9.4 9.5 6,747 9.7037 Delta 13.3 12.1 2,154 13.2038 Richmond 7.3 7.1 1,577 7.0039 Vancouver 10.3 10.2 5,634 9.7040 New Westminster 7.5 6.7 559 7.4041 Burnaby 8.2 8.3 2,083 8.2042 Maple Ridge-Pitt Meadows 9.5 9.9 1,580 10.4043 Coquitlam 12.8 13.3 4,580 13.6044 North Vancouver 11.5 11.5 1,873 11.6045 West Vancouver 7.6 7.1 474 6.6046 Sunshine Coast 16.9 15.8 576 17.9047 Powell River 14.7 15.1 341 15.4048 Sea to Sky 11.5 11.6 472 11.1049 Central Coast 5.8 6.3 13 5.7050 Haida Gwaii 12.8 11.7 78 11.9051 Boundary 7.8 8.6 120 8.5052 Prince Rupert 13.3 12.8 282 12.6053 Okanagan Similkameen 11.3 11.9 278 10.8054 Bulkley Valley 8.8 9.5 204 8.9057 Prince George 7.9 7.8 1,193 8.6058 Nicola-Similkameen 15.0 13.3 309 11.6059 Peace River South 7.5 7.5 285 7.4060 Peace River North 10.9 9.9 538 9.4061 Greater Victoria 11.1 10.7 2,059 10.4062 Sooke 11.9 12.0 1,121 11.6063 Saanich 10.0 9.7 861 8.6064 Gulf Islands 10.2 10.6 212 12.0067 Okanagan Skaha 16.1 16.4 1,018 16.3068 Nanaimo-Ladysmith 11.1 11.0 1,312 9.3069 Qualicum 11.7 11.3 481 11.1070 Alberni 12.5 13.3 517 12.3071 Comox Valley 12.6 11.1 1,013 10.3072 Campbell River 11.9 11.9 621 11.7073 Kamloops/Thompson 9.8 8.5 1,270 8.5074 Gold Trail 8.6 8.7 138 10.8075 Mission 9.6 9.9 605 9.7078 Fraser-Cascade 12.7 12.3 218 12.0079 Cowichan Valley 11.1 11.6 1,009 12.3081 Fort Nelson 6.6 7.6 71 8.1082 Coast Mountains 16.0 16.8 849 17.0083 North Okanagan-Shuswap 15.4 15.1 1,055 15.6084 Vancouver Island West 16.6 19.1 79 17.4085 Vancouver Island North 18.4 17.2 238 16.2087 Stikine 15.0 13.3 22 11.0091 Nechako Lakes 8.6 9.1 469 9.4092 Nisga'a 9.8 10.4 47 11.6093 Conseil scolaire francophone 7.5 8.0 370 8.0
10.1 10.1 57,250 10.0
Special Needs Students by School District (Public Only), 2009/10 - 2011/12
2009/10 2010/11 2011/12
Province (Public Only)
School District % of Students in District
% of Students in District # of Students % of Students in
District
Page 335 EDU-2013-00071 - PHASE 1
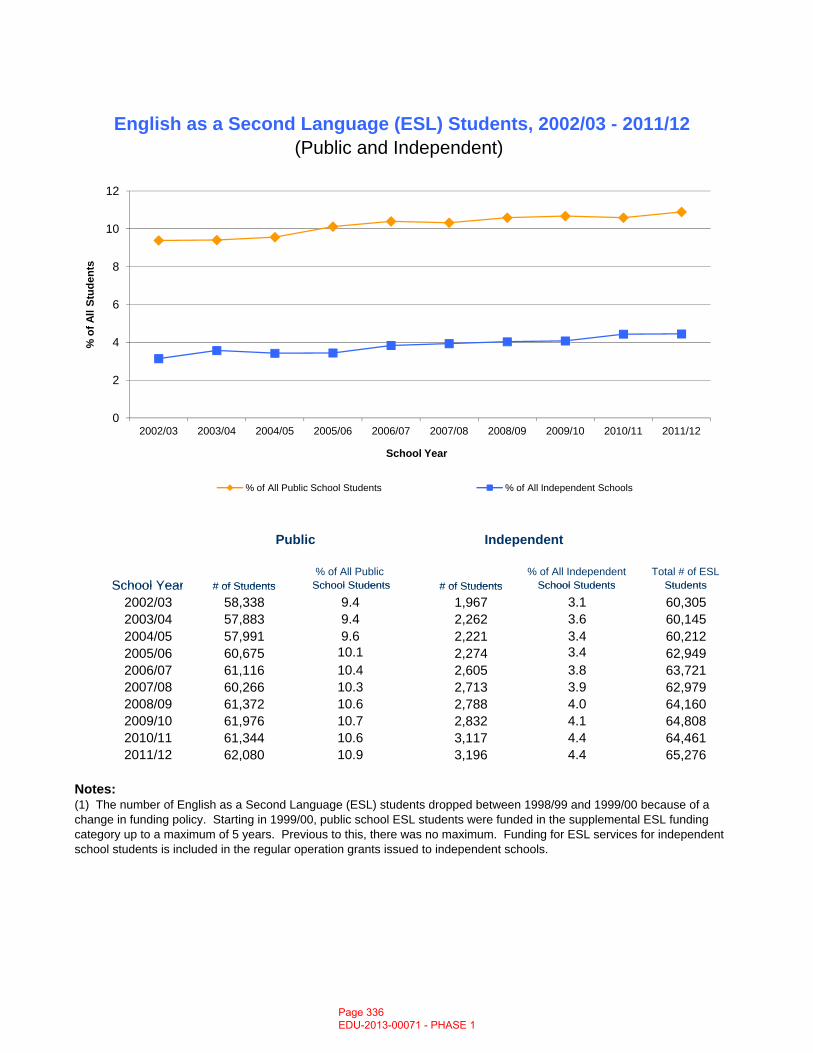
# of Students% of All Public
School Students # of Students% of All Independent
School StudentsTotal # of ESL
Students
English as a Second Language (ESL) Students, 2002/03 - 2011/12(Public and Independent)
Public Independent
School Year
0
2
4
6
8
10
12
2002/03 2003/04 2004/05 2005/06 2006/07 2007/08 2008/09 2009/10 2010/11 2011/12
% o
f All
Stud
ents
School Year
% of All Public School Students % of All Independent Schools
# of Students School Students # of Students School Students Students
2002/03 58,338 9.4 1,967 3.1 60,3052003/04 57,883 9.4 2,262 3.6 60,1452004/05 57,991 9.6 2,221 3.4 60,2122005/06 60,675 10.1 2,274 3.4 62,9492006/07 61,116 10.4 2,605 3.8 63,7212007/08 60,266 10.3 2,713 3.9 62,9792008/09 61,372 10.6 2,788 4.0 64,1602009/10 61,976 10.7 2,832 4.1 64,8082010/11 61,344 10.6 3,117 4.4 64,4612011/12 62,080 10.9 3,196 4.4 65,276
Notes:(1) The number of English as a Second Language (ESL) students dropped between 1998/99 and 1999/00 because of a change in funding policy. Starting in 1999/00, public school ESL students were funded in the supplemental ESL funding category up to a maximum of 5 years. Previous to this, there was no maximum. Funding for ESL services for independent school students is included in the regular operation grants issued to independent schools.
School Year
Page 336 EDU-2013-00071 - PHASE 1

% of Students in District
% of Students in District
# of Students % of Students in District
005 Southeast Kootenay 0.2 0.3 24 0.5006 Rocky Mountain 1.8 1.6 49 1.5008 Kootenay Lake 1.6 1.6 39 0.7010 Arrow Lakes Msk - - -019 Revelstoke Msk Msk Msk Msk020 Kootenay-Columbia 0.6 0.5 25 0.6022 Vernon 0.6 0.5 53 0.6023 Central Okanagan 1.6 1.7 378 1.8027 Cariboo-Chilcotin 6.7 6.5 367 7.1028 Quesnel 5.4 5.0 150 4.3033 Chilliwack 3.0 3.9 502 3.8034 Abbotsford 10.2 10.1 2,094 10.8035 Langley 4.0 3.8 803 4.1036 Surrey 21.7 20.8 15,322 22.1037 Delta 8.6 9.4 1,738 10.6038 Richmond 28.4 27.8 6,249 27.8039 Vancouver 21.9 21.5 12,238 21.1040 New Westminster 9.9 8.3 761 10.0041 Burnaby 18.1 18.8 4,885 19.1042 Maple Ridge-Pitt Meadows 1.7 2.0 320 2.1043 Coquitlam 13.0 12.0 4,333 12.9044 North Vancouver 5.8 5.1 845 5.2045 West Vancouver 6.5 8.3 705 9.8046 Sunshine Coast 3.7 3.2 117 3.6047 Powell River Msk Msk Msk Msk048 Sea to Sky 8.4 9.0 456 10.7049 Central Coast Msk Msk - -050 Haida Gwaii 5.7 4.7 36 5.5051 Boundary - - - -052 Prince Rupert 10.3 9.4 206 9.2053 Okanagan Similkameen 5.9 5.4 130 5.0
English as a Second Language (ESL) Students by School District, 2009/10 - 2011/12
2009/10School District
2010/11 2011/12
053 Okanagan Similkameen 5.9 5.4 130 5.0054 Bulkley Valley 1.6 0.8 Msk Msk057 Prince George 8.1 8.7 1,293 9.3058 Nicola-Similkameen 3.1 3.7 90 3.4059 Peace River South 2.4 2.2 77 2.0060 Peace River North 5.0 4.5 266 4.6061 Greater Victoria 7.2 8.0 1,559 7.8062 Sooke 2.1 3.1 437 4.5063 Saanich 2.3 2.4 224 2.2064 Gulf Islands 1.0 1.4 22 1.2067 Okanagan Skaha 1.5 1.9 101 1.6068 Nanaimo-Ladysmith 3.5 3.7 591 4.2069 Qualicum 1.5 1.3 57 1.3070 Alberni 12.0 11.7 454 10.8071 Comox Valley 1.6 0.8 77 0.8072 Campbell River 4.6 4.4 246 4.6073 Kamloops/Thompson 0.9 1.0 162 1.1074 Gold Trail 22.3 17.4 169 13.2075 Mission 4.6 4.5 289 4.6078 Fraser-Cascade 3.9 3.3 68 3.7079 Cowichan Valley 4.8 4.7 376 4.6081 Fort Nelson 2.0 2.1 20 2.3082 Coast Mountains 8.0 7.9 363 7.3083 North Okanagan-Shuswap 0.9 1.2 117 1.7084 Vancouver Island West 25.3 21.9 82 18.0085 Vancouver Island North 9.0 6.9 134 9.1087 Stikine 17.6 21.0 49 24.5091 Nechako Lakes 6.1 6.0 266 5.3092 Nisga'a 46.0 50.2 231 57.0093 Conseil scolaire francophone 32.6 31.3 1,413 30.7
All Public Only 10.7 10.6 62,080 10.9All Independent Only 4.1 4.4 3,196 4.4
10.0 9.9 65,276 10.2Province (Pub. + Ind.)
Page 337 EDU-2013-00071 - PHASE 1
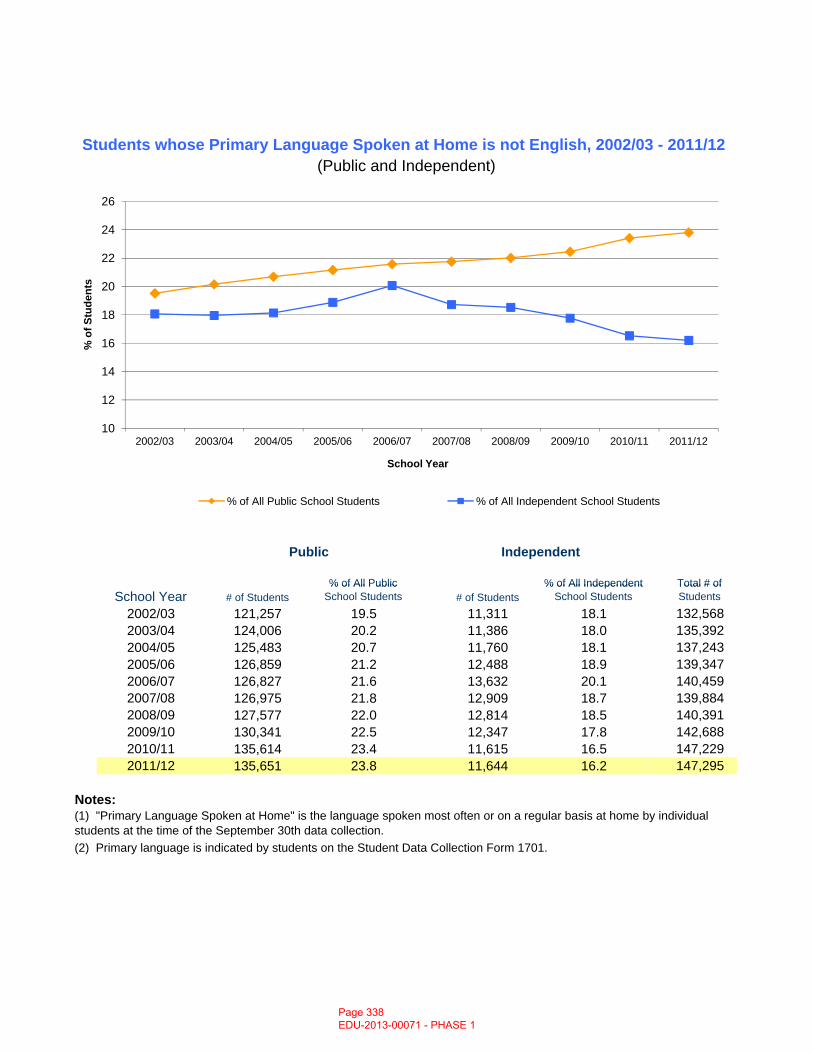
% of All Public % of All Independent Total # of
Students whose Primary Language Spoken at Home is not English, 2002/03 - 2011/12 (Public and Independent)
Public Independent
10
12
14
16
18
20
22
24
26
2002/03 2003/04 2004/05 2005/06 2006/07 2007/08 2008/09 2009/10 2010/11 2011/12
% o
f Stu
dent
s
School Year
% of All Public School Students % of All Independent School Students
# of Students% of All Public
School Students # of Students% of All Independent
School StudentsTotal # of Students
2002/03 121,257 19.5 11,311 18.1 132,5682003/04 124,006 20.2 11,386 18.0 135,3922004/05 125,483 20.7 11,760 18.1 137,2432005/06 126,859 21.2 12,488 18.9 139,3472006/07 126,827 21.6 13,632 20.1 140,4592007/08 126,975 21.8 12,909 18.7 139,8842008/09 127,577 22.0 12,814 18.5 140,3912009/10 130,341 22.5 12,347 17.8 142,6882010/11 135,614 23.4 11,615 16.5 147,2292011/12 135,651 23.8 11,644 16.2 147,295
Notes:
(2) Primary language is indicated by students on the Student Data Collection Form 1701.
(1) "Primary Language Spoken at Home" is the language spoken most often or on a regular basis at home by individual students at the time of the September 30th data collection.
School Year
Page 338 EDU-2013-00071 - PHASE 1
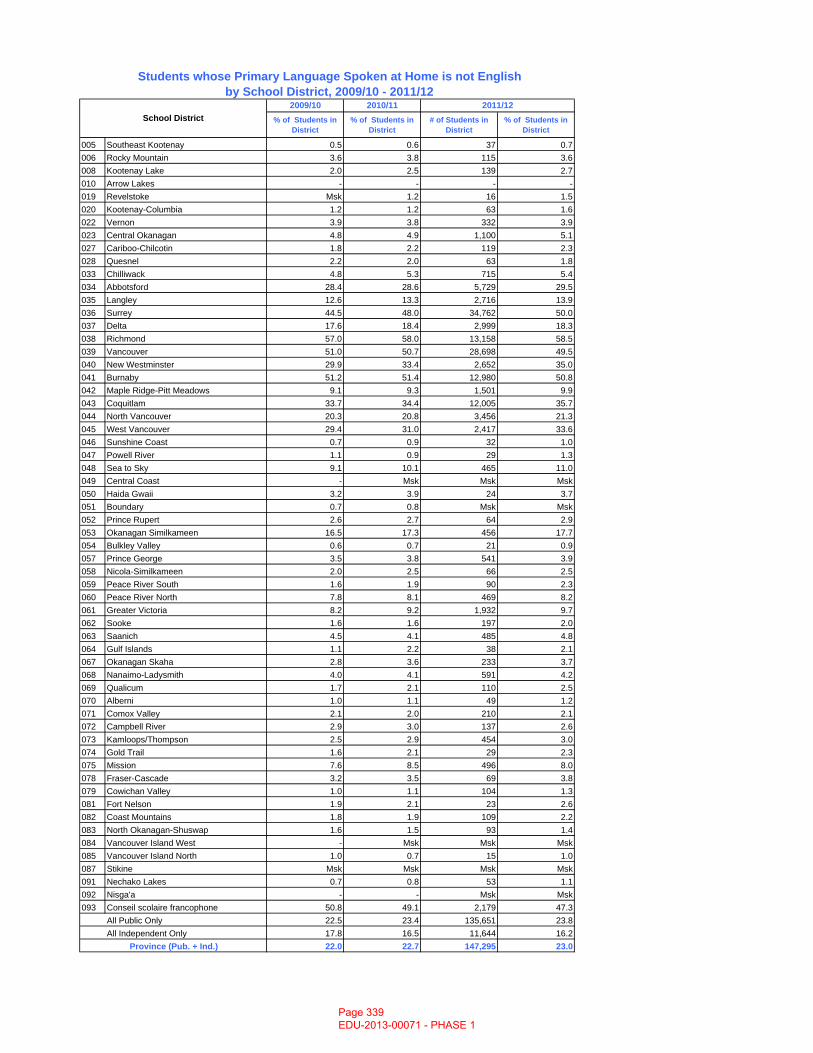
% of Students in District
% of Students in District
# of Students in District
% of Students in District
005 Southeast Kootenay 0.5 0.6 37 0.7006 Rocky Mountain 3.6 3.8 115 3.6008 Kootenay Lake 2.0 2.5 139 2.7010 Arrow Lakes - - - -019 Revelstoke Msk 1.2 16 1.5020 Kootenay-Columbia 1.2 1.2 63 1.6022 Vernon 3.9 3.8 332 3.9023 Central Okanagan 4.8 4.9 1,100 5.1027 Cariboo-Chilcotin 1.8 2.2 119 2.3028 Quesnel 2.2 2.0 63 1.8033 Chilliwack 4.8 5.3 715 5.4034 Abbotsford 28.4 28.6 5,729 29.5035 Langley 12.6 13.3 2,716 13.9036 Surrey 44.5 48.0 34,762 50.0037 Delta 17.6 18.4 2,999 18.3038 Richmond 57.0 58.0 13,158 58.5039 Vancouver 51.0 50.7 28,698 49.5040 New Westminster 29.9 33.4 2,652 35.0041 Burnaby 51.2 51.4 12,980 50.8042 Maple Ridge-Pitt Meadows 9.1 9.3 1,501 9.9043 Coquitlam 33.7 34.4 12,005 35.7044 North Vancouver 20.3 20.8 3,456 21.3045 West Vancouver 29.4 31.0 2,417 33.6046 Sunshine Coast 0.7 0.9 32 1.0047 Powell River 1.1 0.9 29 1.3048 Sea to Sky 9.1 10.1 465 11.0049 Central Coast - Msk Msk Msk050 Haida Gwaii 3.2 3.9 24 3.7051 Boundary 0.7 0.8 Msk Msk052 Prince Rupert 2.6 2.7 64 2.9053 Okanagan Similkameen 16.5 17.3 456 17.7054 Bulkley Valley 0.6 0.7 21 0.9057 Prince George 3.5 3.8 541 3.9058 Nicola-Similkameen 2.0 2.5 66 2.5059 Peace River South 1.6 1.9 90 2.3060 Peace River North 7.8 8.1 469 8.2061 Greater Victoria 8.2 9.2 1,932 9.7062 Sooke 1.6 1.6 197 2.0063 Saanich 4.5 4.1 485 4.8064 Gulf Islands 1.1 2.2 38 2.1067 Okanagan Skaha 2.8 3.6 233 3.7068 Nanaimo-Ladysmith 4.0 4.1 591 4.2069 Qualicum 1.7 2.1 110 2.5070 Alberni 1.0 1.1 49 1.2071 Comox Valley 2.1 2.0 210 2.1072 Campbell River 2.9 3.0 137 2.6073 Kamloops/Thompson 2.5 2.9 454 3.0074 Gold Trail 1.6 2.1 29 2.3075 Mission 7.6 8.5 496 8.0078 Fraser-Cascade 3.2 3.5 69 3.8079 Cowichan Valley 1.0 1.1 104 1.3081 Fort Nelson 1.9 2.1 23 2.6082 Coast Mountains 1.8 1.9 109 2.2083 North Okanagan-Shuswap 1.6 1.5 93 1.4084 Vancouver Island West - Msk Msk Msk085 Vancouver Island North 1.0 0.7 15 1.0087 Stikine Msk Msk Msk Msk091 Nechako Lakes 0.7 0.8 53 1.1092 Nisga'a - - Msk Msk093 Conseil scolaire francophone 50.8 49.1 2,179 47.3
All Public Only 22.5 23.4 135,651 23.8All Independent Only 17.8 16.5 11,644 16.2
22.0 22.7 147,295 23.0Province (Pub. + Ind.)
Students whose Primary Language Spoken at Home is not English
2009/10 2010/11 2011/12School District
by School District, 2009/10 - 2011/12
Page 339 EDU-2013-00071 - PHASE 1
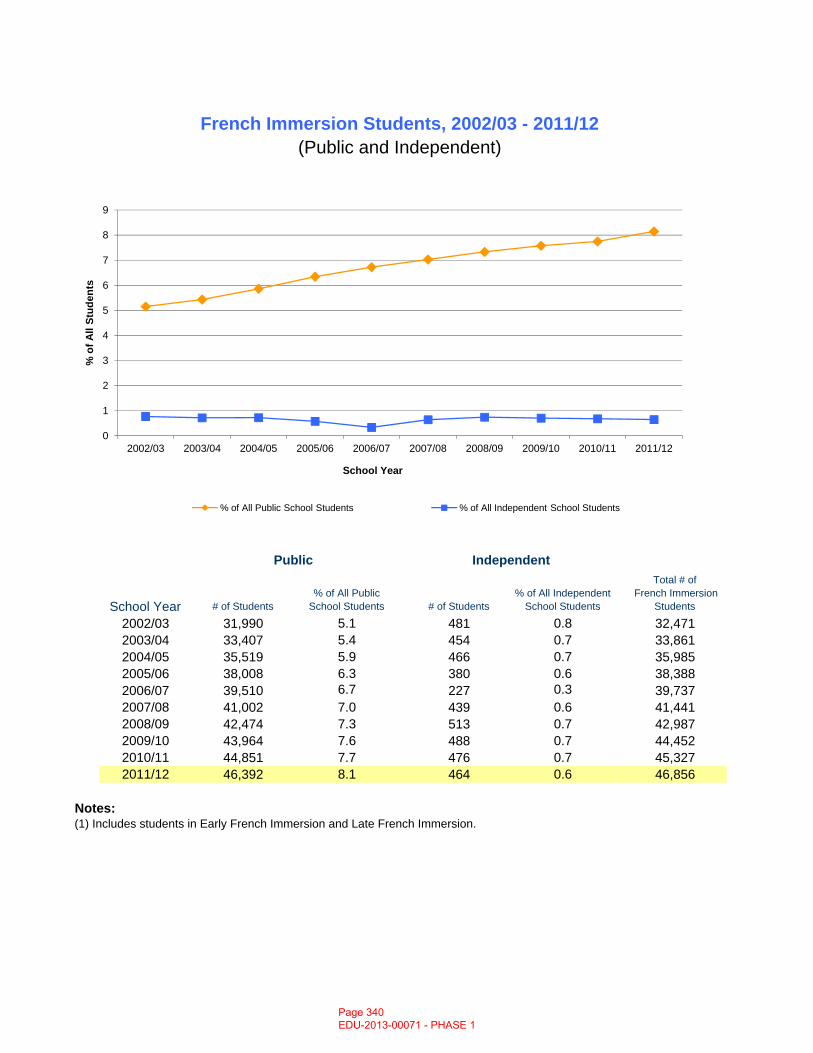
Total # of
French Immersion Students, 2002/03 - 2011/12
Public Independent
(Public and Independent)
0
1
2
3
4
5
6
7
8
9
2002/03 2003/04 2004/05 2005/06 2006/07 2007/08 2008/09 2009/10 2010/11 2011/12
% o
f All
Stud
ents
School Year
% of All Public School Students % of All Independent School Students
# of Students% of All Public
School Students # of Students% of All Independent
School Students French Immersion
Students
2002/03 31,990 5.1 481 0.8 32,4712003/04 33,407 5.4 454 0.7 33,8612004/05 35,519 5.9 466 0.7 35,9852005/06 38,008 6.3 380 0.6 38,3882006/07 39,510 6.7 227 0.3 39,7372007/08 41,002 7.0 439 0.6 41,4412008/09 42,474 7.3 513 0.7 42,9872009/10 43,964 7.6 488 0.7 44,4522010/11 44,851 7.7 476 0.7 45,3272011/12 46,392 8.1 464 0.6 46,856
Notes:(1) Includes students in Early French Immersion and Late French Immersion.
School Year
Page 340 EDU-2013-00071 - PHASE 1
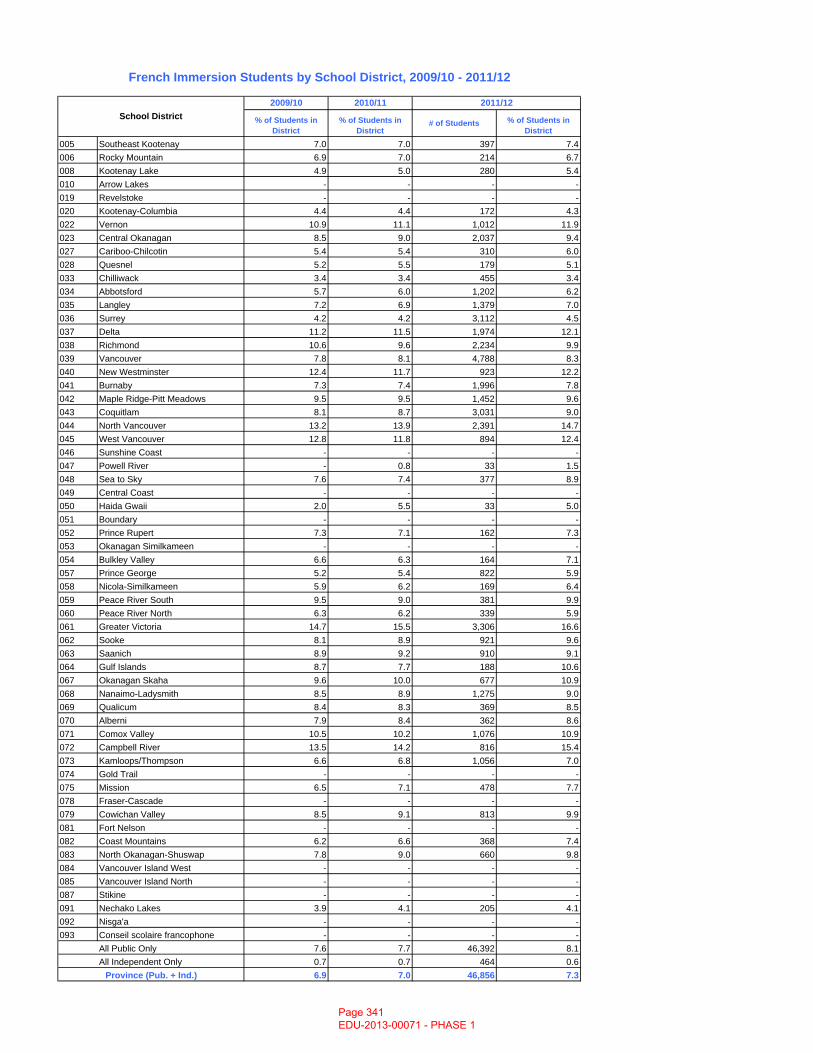
% of Students in District
% of Students in District
# of Students % of Students in District
005 Southeast Kootenay 7.0 7.0 397 7.4006 Rocky Mountain 6.9 7.0 214 6.7008 Kootenay Lake 4.9 5.0 280 5.4010 Arrow Lakes - - - -019 Revelstoke - - - -020 Kootenay-Columbia 4.4 4.4 172 4.3022 Vernon 10.9 11.1 1,012 11.9023 Central Okanagan 8.5 9.0 2,037 9.4027 Cariboo-Chilcotin 5.4 5.4 310 6.0028 Quesnel 5.2 5.5 179 5.1033 Chilliwack 3.4 3.4 455 3.4034 Abbotsford 5.7 6.0 1,202 6.2035 Langley 7.2 6.9 1,379 7.0036 Surrey 4.2 4.2 3,112 4.5037 Delta 11.2 11.5 1,974 12.1038 Richmond 10.6 9.6 2,234 9.9039 Vancouver 7.8 8.1 4,788 8.3040 New Westminster 12.4 11.7 923 12.2041 Burnaby 7.3 7.4 1,996 7.8042 Maple Ridge-Pitt Meadows 9.5 9.5 1,452 9.6043 Coquitlam 8.1 8.7 3,031 9.0044 North Vancouver 13.2 13.9 2,391 14.7045 West Vancouver 12.8 11.8 894 12.4046 Sunshine Coast - - - -047 Powell River - 0.8 33 1.5048 Sea to Sky 7.6 7.4 377 8.9049 Central Coast - - - -050 Haida Gwaii 2.0 5.5 33 5.0051 Boundary - - - -052 Prince Rupert 7.3 7.1 162 7.3053 Okanagan Similkameen - - - -054 Bulkley Valley 6.6 6.3 164 7.1057 Prince George 5.2 5.4 822 5.9058 Nicola-Similkameen 5.9 6.2 169 6.4059 Peace River South 9.5 9.0 381 9.9060 Peace River North 6.3 6.2 339 5.9061 Greater Victoria 14.7 15.5 3,306 16.6062 Sooke 8.1 8.9 921 9.6063 Saanich 8.9 9.2 910 9.1064 Gulf Islands 8.7 7.7 188 10.6067 Okanagan Skaha 9.6 10.0 677 10.9068 Nanaimo-Ladysmith 8.5 8.9 1,275 9.0069 Qualicum 8.4 8.3 369 8.5070 Alberni 7.9 8.4 362 8.6071 Comox Valley 10.5 10.2 1,076 10.9072 Campbell River 13.5 14.2 816 15.4073 Kamloops/Thompson 6.6 6.8 1,056 7.0074 Gold Trail - - - -075 Mission 6.5 7.1 478 7.7078 Fraser-Cascade - - - -079 Cowichan Valley 8.5 9.1 813 9.9081 Fort Nelson - - - -082 Coast Mountains 6.2 6.6 368 7.4083 North Okanagan-Shuswap 7.8 9.0 660 9.8084 Vancouver Island West - - - -085 Vancouver Island North - - - -087 Stikine - - - -091 Nechako Lakes 3.9 4.1 205 4.1092 Nisga'a - - - -093 Conseil scolaire francophone - - - -
All Public Only 7.6 7.7 46,392 8.1All Independent Only 0.7 0.7 464 0.6
6.9 7.0 46,856 7.3Province (Pub. + Ind.)
French Immersion Students by School District, 2009/10 - 2011/12
2009/10 2010/11School District
2011/12
Page 341 EDU-2013-00071 - PHASE 1
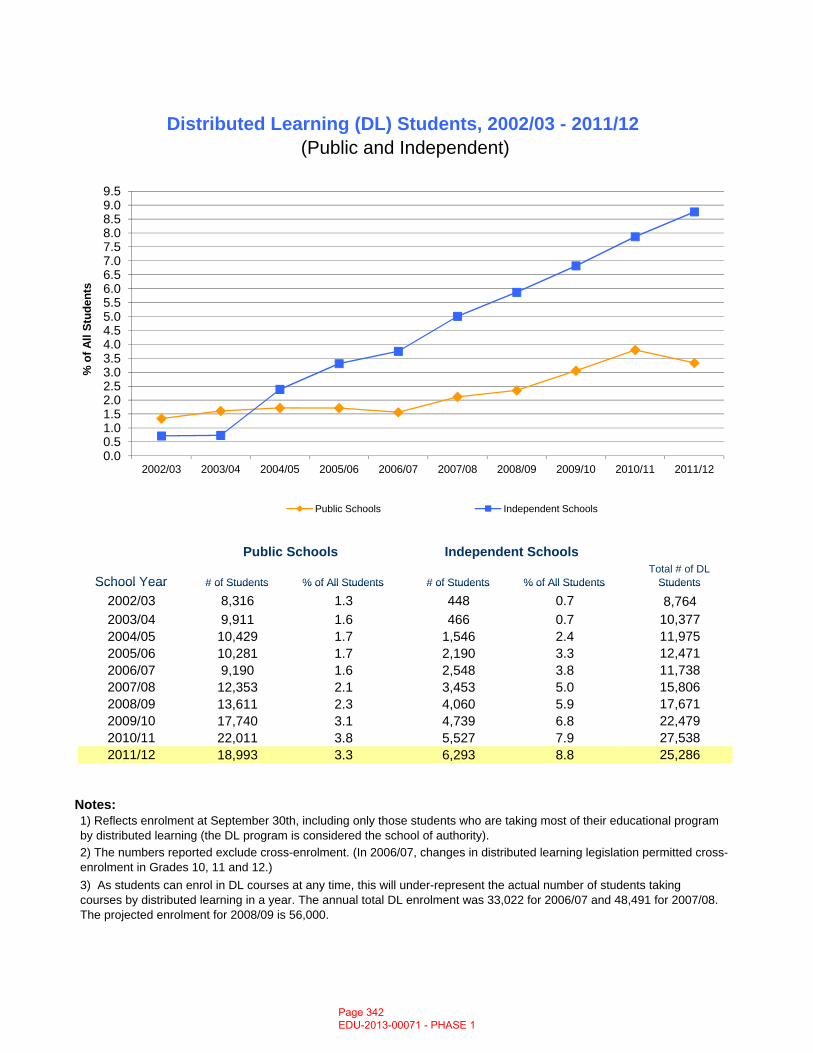
Distributed Learning (DL) Students, 2002/03 - 2011/12
School Year # of Students % of All Students
(Public and Independent)
Public Schools Independent SchoolsTotal # of DL
Students# of Students % of All Students
0.00.51.01.52.02.53.03.54.04.55.05.56.06.57.07.58.08.59.09.5
2002/03 2003/04 2004/05 2005/06 2006/07 2007/08 2008/09 2009/10 2010/11 2011/12
% o
f All
Stud
ents
Public Schools Independent Schools
2002/03 8,316 1.3 448 0.7 8,7642003/04 9,911 1.6 466 0.7 10,3772004/05 10,429 1.7 1,546 2.4 11,9752005/06 10,281 1.7 2,190 3.3 12,4712006/07 9,190 1.6 2,548 3.8 11,7382007/08 12,353 2.1 3,453 5.0 15,8062008/09 13,611 2.3 4,060 5.9 17,6712009/10 17,740 3.1 4,739 6.8 22,4792010/11 22,011 3.8 5,527 7.9 27,5382011/12 18,993 3.3 6,293 8.8 25,286
Notes:1) Reflects enrolment at September 30th, including only those students who are taking most of their educational program by distributed learning (the DL program is considered the school of authority).2) The numbers reported exclude cross-enrolment. (In 2006/07, changes in distributed learning legislation permitted cross-enrolment in Grades 10, 11 and 12.)3) As students can enrol in DL courses at any time, this will under-represent the actual number of students taking courses by distributed learning in a year. The annual total DL enrolment was 33,022 for 2006/07 and 48,491 for 2007/08. The projected enrolment for 2008/09 is 56,000.
School Year # of Students % of All Students Students# of Students % of All Students
Page 342 EDU-2013-00071 - PHASE 1
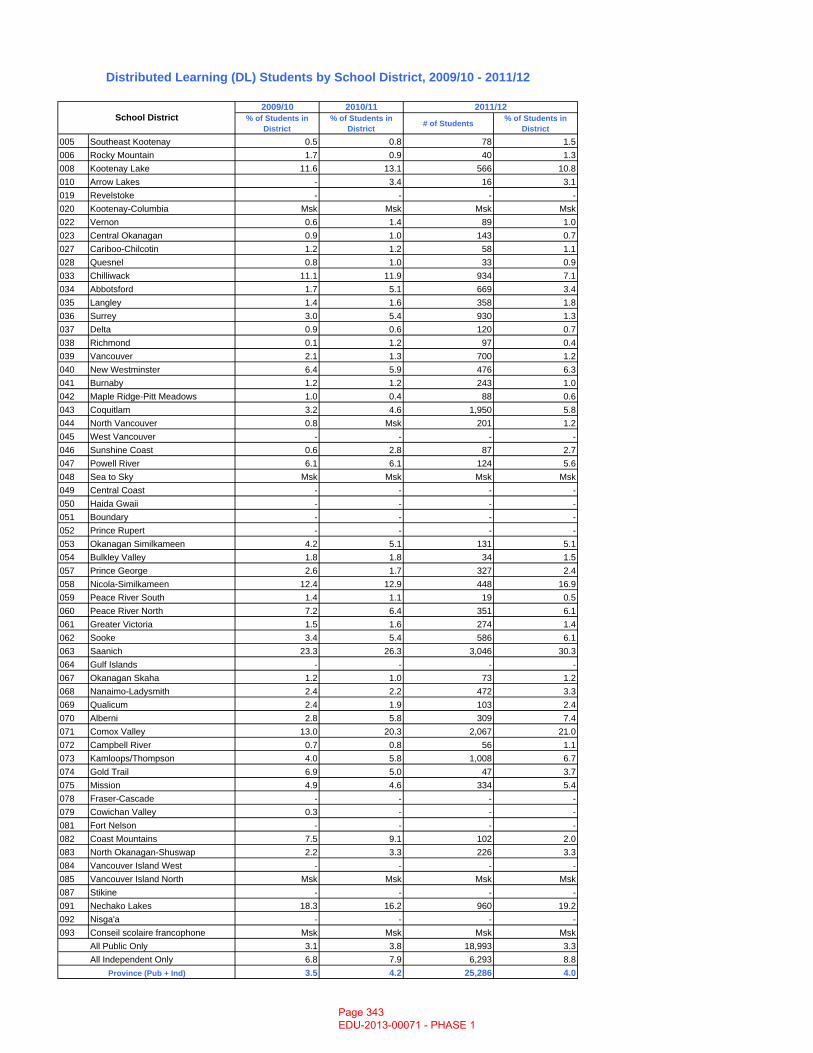
% of Students in District
% of Students in District # of Students % of Students in
District005 Southeast Kootenay 0.5 0.8 78 1.5006 Rocky Mountain 1.7 0.9 40 1.3008 Kootenay Lake 11.6 13.1 566 10.8010 Arrow Lakes - 3.4 16 3.1019 Revelstoke - - - -020 Kootenay-Columbia Msk Msk Msk Msk022 Vernon 0.6 1.4 89 1.0023 Central Okanagan 0.9 1.0 143 0.7027 Cariboo-Chilcotin 1.2 1.2 58 1.1028 Quesnel 0.8 1.0 33 0.9033 Chilliwack 11.1 11.9 934 7.1034 Abbotsford 1.7 5.1 669 3.4035 Langley 1.4 1.6 358 1.8036 Surrey 3.0 5.4 930 1.3037 Delta 0.9 0.6 120 0.7038 Richmond 0.1 1.2 97 0.4039 Vancouver 2.1 1.3 700 1.2040 New Westminster 6.4 5.9 476 6.3041 Burnaby 1.2 1.2 243 1.0042 Maple Ridge-Pitt Meadows 1.0 0.4 88 0.6043 Coquitlam 3.2 4.6 1,950 5.8044 North Vancouver 0.8 Msk 201 1.2045 West Vancouver - - - -046 Sunshine Coast 0.6 2.8 87 2.7047 Powell River 6.1 6.1 124 5.6048 Sea to Sky Msk Msk Msk Msk049 Central Coast - - - -050 Haida Gwaii - - - -051 Boundary - - - -052 Prince Rupert - - - -053 Okanagan Similkameen 4.2 5.1 131 5.1054 Bulkley Valley 1.8 1.8 34 1.5057 Prince George 2.6 1.7 327 2.4058 Nicola-Similkameen 12.4 12.9 448 16.9059 Peace River South 1.4 1.1 19 0.5060 Peace River North 7.2 6.4 351 6.1061 Greater Victoria 1.5 1.6 274 1.4062 Sooke 3.4 5.4 586 6.1063 Saanich 23.3 26.3 3,046 30.3064 Gulf Islands - - - -067 Okanagan Skaha 1.2 1.0 73 1.2068 Nanaimo-Ladysmith 2.4 2.2 472 3.3069 Qualicum 2.4 1.9 103 2.4070 Alberni 2.8 5.8 309 7.4071 Comox Valley 13.0 20.3 2,067 21.0072 Campbell River 0.7 0.8 56 1.1073 Kamloops/Thompson 4.0 5.8 1,008 6.7074 Gold Trail 6.9 5.0 47 3.7075 Mission 4.9 4.6 334 5.4078 Fraser-Cascade - - - -079 Cowichan Valley 0.3 - - -081 Fort Nelson - - - -082 Coast Mountains 7.5 9.1 102 2.0083 North Okanagan-Shuswap 2.2 3.3 226 3.3084 Vancouver Island West - - - -085 Vancouver Island North Msk Msk Msk Msk087 Stikine - - - -091 Nechako Lakes 18.3 16.2 960 19.2092 Nisga'a - - - -093 Conseil scolaire francophone Msk Msk Msk Msk
All Public Only 3.1 3.8 18,993 3.3All Independent Only 6.8 7.9 6,293 8.8
3.5 4.2 25,286 4.0Province (Pub + Ind)
Distributed Learning (DL) Students by School District, 2009/10 - 2011/12
2009/10 2010/11 2011/12School District
Page 343 EDU-2013-00071 - PHASE 1
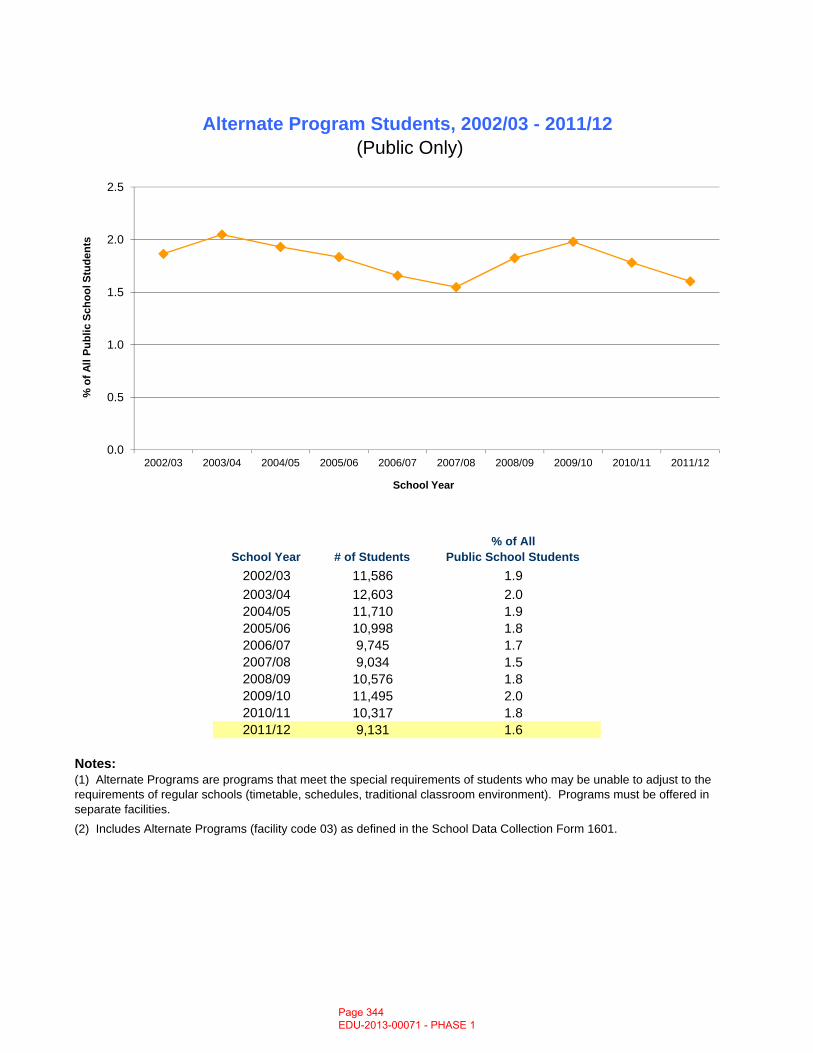
2002/03 11,586 1.9
Alternate Program Students, 2002/03 - 2011/12 (Public Only)
School Year # of Students% of All
Public School Students
0.0
0.5
1.0
1.5
2.0
2.5
2002/03 2003/04 2004/05 2005/06 2006/07 2007/08 2008/09 2009/10 2010/11 2011/12
% o
f All
Publ
ic S
choo
l Stu
dent
s
School Year
2003/04 12,603 2.02004/05 11,710 1.92005/06 10,998 1.82006/07 9,745 1.72007/08 9,034 1.52008/09 10,576 1.82009/10 11,495 2.02010/11 10,317 1.82011/12 9,131 1.6
Notes:
(2) Includes Alternate Programs (facility code 03) as defined in the School Data Collection Form 1601.
(1) Alternate Programs are programs that meet the special requirements of students who may be unable to adjust to the requirements of regular schools (timetable, schedules, traditional classroom environment). Programs must be offered in separate facilities.
Page 344 EDU-2013-00071 - PHASE 1
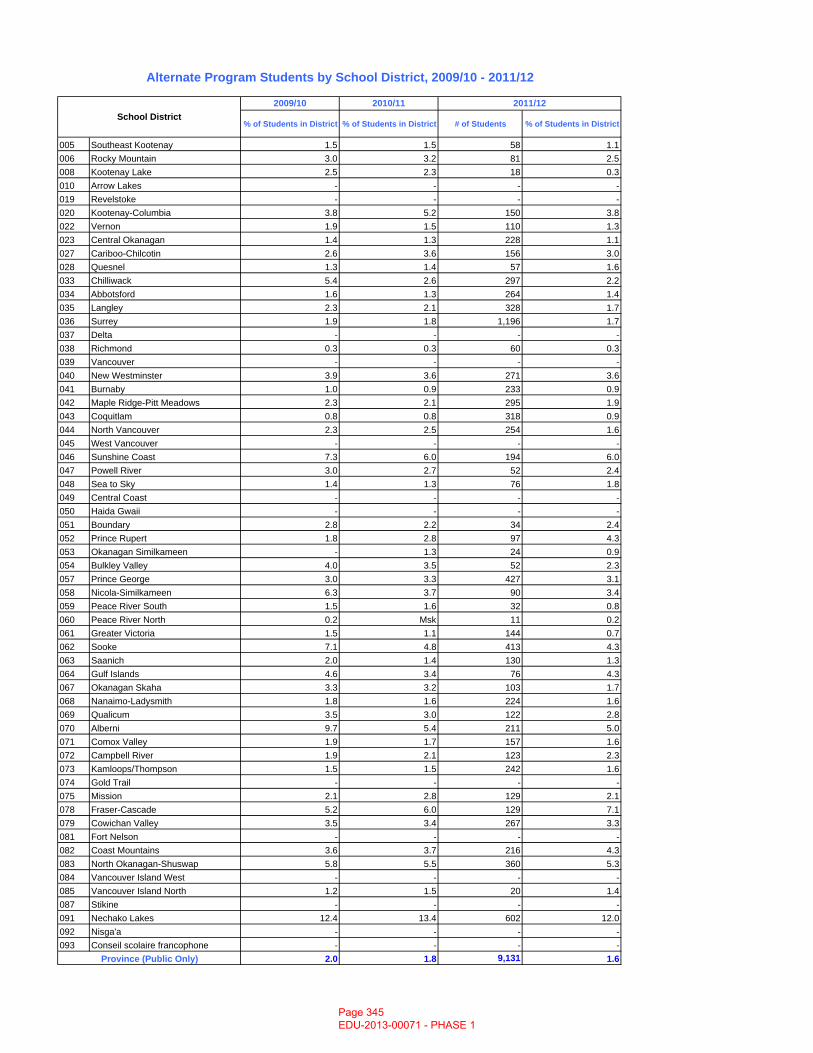
% of Students in District % of Students in District # of Students % of Students in District
005 Southeast Kootenay 1.5 1.5 58 1.1006 Rocky Mountain 3.0 3.2 81 2.5008 Kootenay Lake 2.5 2.3 18 0.3010 Arrow Lakes - - - -019 Revelstoke - - - -020 Kootenay-Columbia 3.8 5.2 150 3.8022 Vernon 1.9 1.5 110 1.3023 Central Okanagan 1.4 1.3 228 1.1027 Cariboo-Chilcotin 2.6 3.6 156 3.0028 Quesnel 1.3 1.4 57 1.6033 Chilliwack 5.4 2.6 297 2.2034 Abbotsford 1.6 1.3 264 1.4035 Langley 2.3 2.1 328 1.7036 Surrey 1.9 1.8 1,196 1.7037 Delta - - - -038 Richmond 0.3 0.3 60 0.3039 Vancouver - - - -040 New Westminster 3.9 3.6 271 3.6041 Burnaby 1.0 0.9 233 0.9042 Maple Ridge-Pitt Meadows 2.3 2.1 295 1.9043 Coquitlam 0.8 0.8 318 0.9044 North Vancouver 2.3 2.5 254 1.6045 West Vancouver - - - -046 Sunshine Coast 7.3 6.0 194 6.0047 Powell River 3.0 2.7 52 2.4048 Sea to Sky 1.4 1.3 76 1.8049 Central Coast - - - -050 Haida Gwaii - - - -051 Boundary 2.8 2.2 34 2.4052 Prince Rupert 1.8 2.8 97 4.3053 Okanagan Similkameen - 1.3 24 0.9054 Bulkley Valley 4.0 3.5 52 2.3057 Prince George 3.0 3.3 427 3.1058 Nicola-Similkameen 6.3 3.7 90 3.4059 Peace River South 1.5 1.6 32 0.8060 Peace River North 0.2 Msk 11 0.2061 Greater Victoria 1.5 1.1 144 0.7062 Sooke 7.1 4.8 413 4.3063 Saanich 2.0 1.4 130 1.3064 Gulf Islands 4.6 3.4 76 4.3067 Okanagan Skaha 3.3 3.2 103 1.7068 Nanaimo-Ladysmith 1.8 1.6 224 1.6069 Qualicum 3.5 3.0 122 2.8070 Alberni 9.7 5.4 211 5.0071 Comox Valley 1.9 1.7 157 1.6072 Campbell River 1.9 2.1 123 2.3073 Kamloops/Thompson 1.5 1.5 242 1.6074 Gold Trail - - - -075 Mission 2.1 2.8 129 2.1078 Fraser-Cascade 5.2 6.0 129 7.1079 Cowichan Valley 3.5 3.4 267 3.3081 Fort Nelson - - - -082 Coast Mountains 3.6 3.7 216 4.3083 North Okanagan-Shuswap 5.8 5.5 360 5.3084 Vancouver Island West - - - -085 Vancouver Island North 1.2 1.5 20 1.4087 Stikine - - - -091 Nechako Lakes 12.4 13.4 602 12.0092 Nisga'a - - - -093 Conseil scolaire francophone - - - -
2.0 1.8 9,131 1.6Province (Public Only)
Alternate Program Students by School District, 2009/10 - 2011/12
School District2009/10 2010/11 2011/12
Page 345 EDU-2013-00071 - PHASE 1
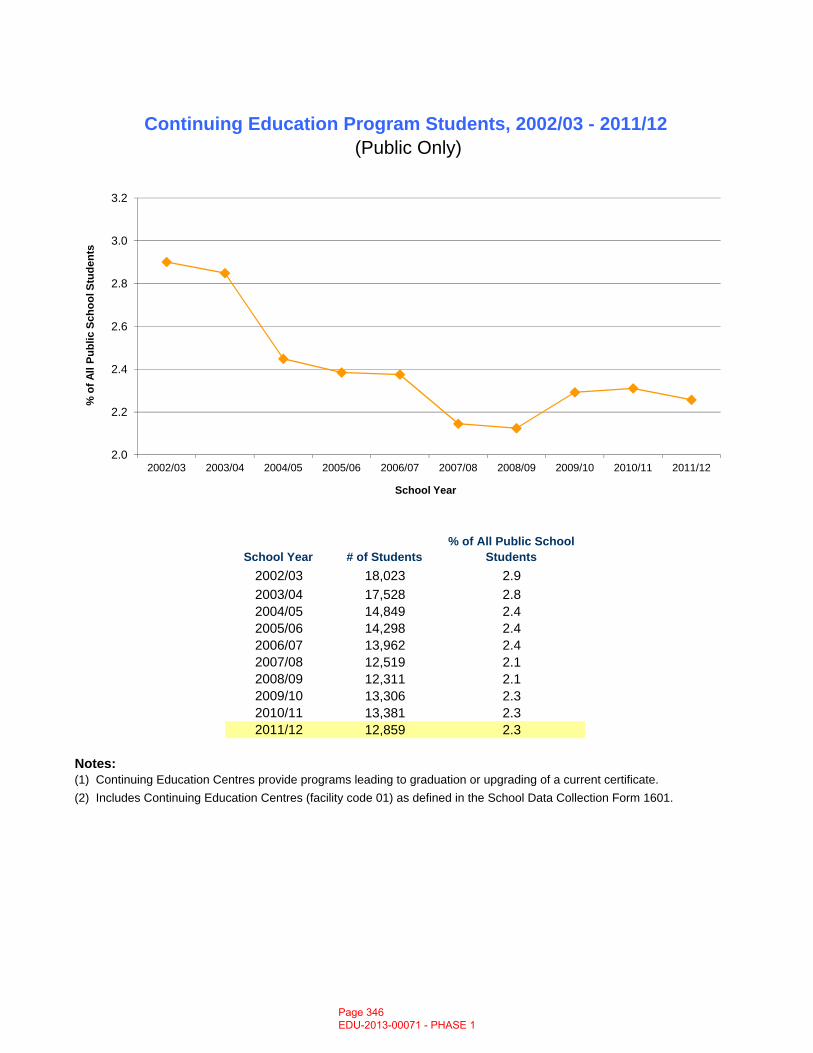
2002/03 18,023 2.9
Continuing Education Program Students, 2002/03 - 2011/12 (Public Only)
School Year # of Students% of All Public School
Students
2.0
2.2
2.4
2.6
2.8
3.0
3.2
2002/03 2003/04 2004/05 2005/06 2006/07 2007/08 2008/09 2009/10 2010/11 2011/12
% o
f All
Publ
ic S
choo
l Stu
dent
s
School Year
2003/04 17,528 2.82004/05 14,849 2.42005/06 14,298 2.42006/07 13,962 2.42007/08 12,519 2.12008/09 12,311 2.12009/10 13,306 2.32010/11 13,381 2.32011/12 12,859 2.3
Notes:(1) Continuing Education Centres provide programs leading to graduation or upgrading of a current certificate.(2) Includes Continuing Education Centres (facility code 01) as defined in the School Data Collection Form 1601.
Page 346 EDU-2013-00071 - PHASE 1
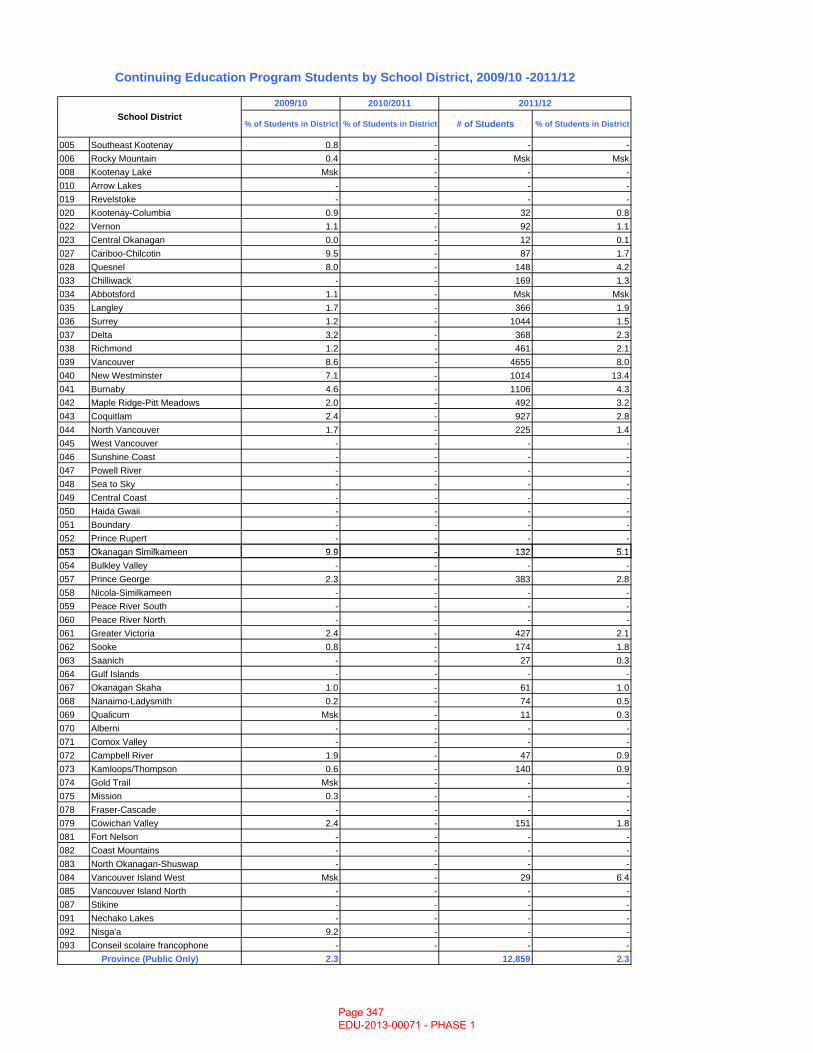
% of Students in District % of Students in District # of Students % of Students in District
005 Southeast Kootenay 0.8 - - -006 Rocky Mountain 0.4 - Msk Msk008 Kootenay Lake Msk - - -010 Arrow Lakes - - - -019 Revelstoke - - - -020 Kootenay-Columbia 0.9 - 32 0.8022 Vernon 1.1 - 92 1.1023 Central Okanagan 0.0 - 12 0.1027 Cariboo-Chilcotin 9.5 - 87 1.7028 Quesnel 8.0 - 148 4.2033 Chilliwack - - 169 1.3034 Abbotsford 1.1 - Msk Msk035 Langley 1.7 - 366 1.9036 Surrey 1.2 - 1044 1.5037 Delta 3.2 - 368 2.3038 Richmond 1.2 - 461 2.1039 Vancouver 8.6 - 4655 8.0040 New Westminster 7.1 - 1014 13.4041 Burnaby 4.6 - 1106 4.3042 Maple Ridge-Pitt Meadows 2.0 - 492 3.2043 Coquitlam 2.4 - 927 2.8044 North Vancouver 1.7 - 225 1.4045 West Vancouver - - - -046 Sunshine Coast - - - -047 Powell River - - - -048 Sea to Sky - - - -049 Central Coast - - - -050 Haida Gwaii - - - -051 Boundary - - - -052 Prince Rupert - - - -053 Ok Si ilk 9 9 132 5 1
Continuing Education Program Students by School District, 2009/10 -2011/12
School District2009/10 2010/2011 2011/12
053 Okanagan Similkameen 9.9 - 132 5.1054 Bulkley Valley - - - -057 Prince George 2.3 - 383 2.8058 Nicola-Similkameen - - - -059 Peace River South - - - -060 Peace River North - - - -061 Greater Victoria 2.4 - 427 2.1062 Sooke 0.8 - 174 1.8063 Saanich - - 27 0.3064 Gulf Islands - - - -067 Okanagan Skaha 1.0 - 61 1.0068 Nanaimo-Ladysmith 0.2 - 74 0.5069 Qualicum Msk - 11 0.3070 Alberni - - - -071 Comox Valley - - - -072 Campbell River 1.9 - 47 0.9073 Kamloops/Thompson 0.6 - 140 0.9074 Gold Trail Msk - - -075 Mission 0.3 - - -078 Fraser-Cascade - - - -079 Cowichan Valley 2.4 - 151 1.8081 Fort Nelson - - - -082 Coast Mountains - - - -083 North Okanagan-Shuswap - - - -084 Vancouver Island West Msk - 29 6.4085 Vancouver Island North - - - -087 Stikine - - - -091 Nechako Lakes - - - -092 Nisga'a 9.2 - - -093 Conseil scolaire francophone - - - -
2.3 #N/A 12,859 2.3Province (Public Only)
Page 347 EDU-2013-00071 - PHASE 1
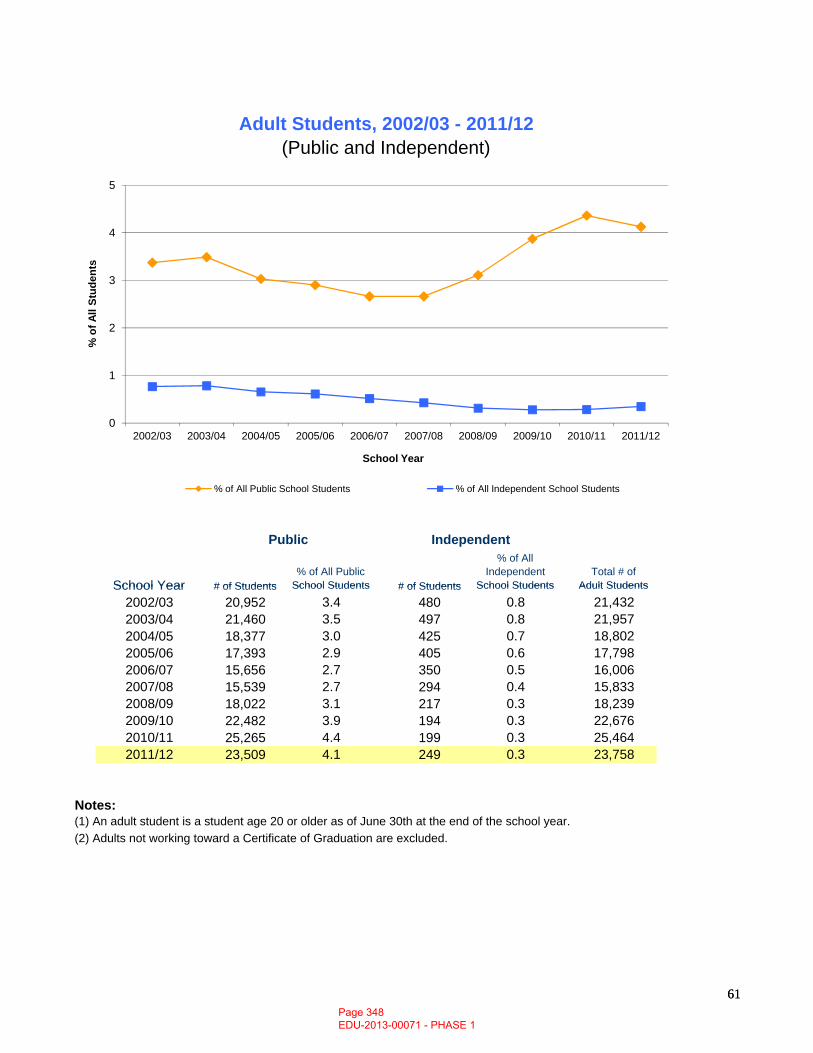
# of Students% of All Public
School Students # of Students
% of All Independent
School StudentsTotal # of
Adult Students
Adult Students, 2002/03 - 2011/12(Public and Independent)
Public Independent
School Year
0
1
2
3
4
5
2002/03 2003/04 2004/05 2005/06 2006/07 2007/08 2008/09 2009/10 2010/11 2011/12
% o
f All
Stud
ents
School Year
% of All Public School Students % of All Independent School Students
61
# of Students School Students # of Students School Students Adult Students
2002/03 20,952 3.4 480 0.8 21,4322003/04 21,460 3.5 497 0.8 21,9572004/05 18,377 3.0 425 0.7 18,8022005/06 17,393 2.9 405 0.6 17,7982006/07 15,656 2.7 350 0.5 16,0062007/08 15,539 2.7 294 0.4 15,8332008/09 18,022 3.1 217 0.3 18,2392009/10 22,482 3.9 194 0.3 22,6762010/11 25,265 4.4 199 0.3 25,4642011/12 23,509 4.1 249 0.3 23,758
Notes:(1) An adult student is a student age 20 or older as of June 30th at the end of the school year. (2) Adults not working toward a Certificate of Graduation are excluded.
School Year
61Page 348 EDU-2013-00071 - PHASE 1
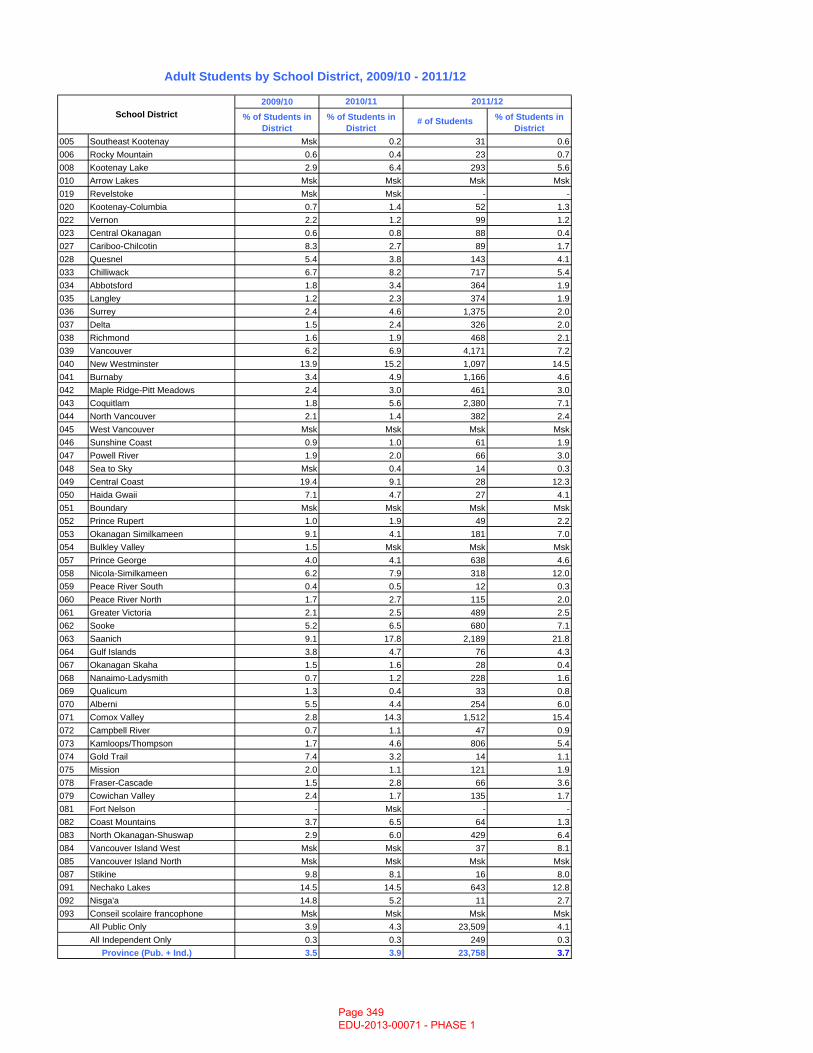
2009/10% of Students in
District% of Students in
District# of Students % of Students in
District005 Southeast Kootenay Msk 0.2 31 0.6006 Rocky Mountain 0.6 0.4 23 0.7008 Kootenay Lake 2.9 6.4 293 5.6010 Arrow Lakes Msk Msk Msk Msk019 Revelstoke Msk Msk - -020 Kootenay-Columbia 0.7 1.4 52 1.3022 Vernon 2.2 1.2 99 1.2023 Central Okanagan 0.6 0.8 88 0.4027 Cariboo-Chilcotin 8.3 2.7 89 1.7028 Quesnel 5.4 3.8 143 4.1033 Chilliwack 6.7 8.2 717 5.4034 Abbotsford 1.8 3.4 364 1.9035 Langley 1.2 2.3 374 1.9036 Surrey 2.4 4.6 1,375 2.0037 Delta 1.5 2.4 326 2.0038 Richmond 1.6 1.9 468 2.1039 Vancouver 6.2 6.9 4,171 7.2040 New Westminster 13.9 15.2 1,097 14.5041 Burnaby 3.4 4.9 1,166 4.6042 Maple Ridge-Pitt Meadows 2.4 3.0 461 3.0043 Coquitlam 1.8 5.6 2,380 7.1044 North Vancouver 2.1 1.4 382 2.4045 West Vancouver Msk Msk Msk Msk046 Sunshine Coast 0.9 1.0 61 1.9047 Powell River 1.9 2.0 66 3.0048 Sea to Sky Msk 0.4 14 0.3049 Central Coast 19.4 9.1 28 12.3050 Haida Gwaii 7.1 4.7 27 4.1051 Boundary Msk Msk Msk Msk052 Prince Rupert 1.0 1.9 49 2.2053 Okanagan Similkameen 9.1 4.1 181 7.0054 Bulkley Valley 1.5 Msk Msk Msk057 Prince George 4.0 4.1 638 4.6058 Nicola-Similkameen 6.2 7.9 318 12.0059 Peace River South 0.4 0.5 12 0.3060 Peace River North 1.7 2.7 115 2.0061 Greater Victoria 2.1 2.5 489 2.5062 Sooke 5.2 6.5 680 7.1063 Saanich 9.1 17.8 2,189 21.8064 Gulf Islands 3.8 4.7 76 4.3067 Okanagan Skaha 1.5 1.6 28 0.4068 Nanaimo-Ladysmith 0.7 1.2 228 1.6069 Qualicum 1.3 0.4 33 0.8070 Alberni 5.5 4.4 254 6.0071 Comox Valley 2.8 14.3 1,512 15.4072 Campbell River 0.7 1.1 47 0.9073 Kamloops/Thompson 1.7 4.6 806 5.4074 Gold Trail 7.4 3.2 14 1.1075 Mission 2.0 1.1 121 1.9078 Fraser-Cascade 1.5 2.8 66 3.6079 Cowichan Valley 2.4 1.7 135 1.7081 Fort Nelson - Msk - -082 Coast Mountains 3.7 6.5 64 1.3083 North Okanagan-Shuswap 2.9 6.0 429 6.4084 Vancouver Island West Msk Msk 37 8.1085 Vancouver Island North Msk Msk Msk Msk087 Stikine 9.8 8.1 16 8.0091 Nechako Lakes 14.5 14.5 643 12.8092 Nisga'a 14.8 5.2 11 2.7093 Conseil scolaire francophone Msk Msk Msk Msk
All Public Only 3.9 4.3 23,509 4.1All Independent Only 0.3 0.3 249 0.3
3.5 3.9 23,758 3.7Province (Pub. + Ind.)
School District
Adult Students by School District, 2009/10 - 2011/12
2010/11 2011/12
Page 349 EDU-2013-00071 - PHASE 1
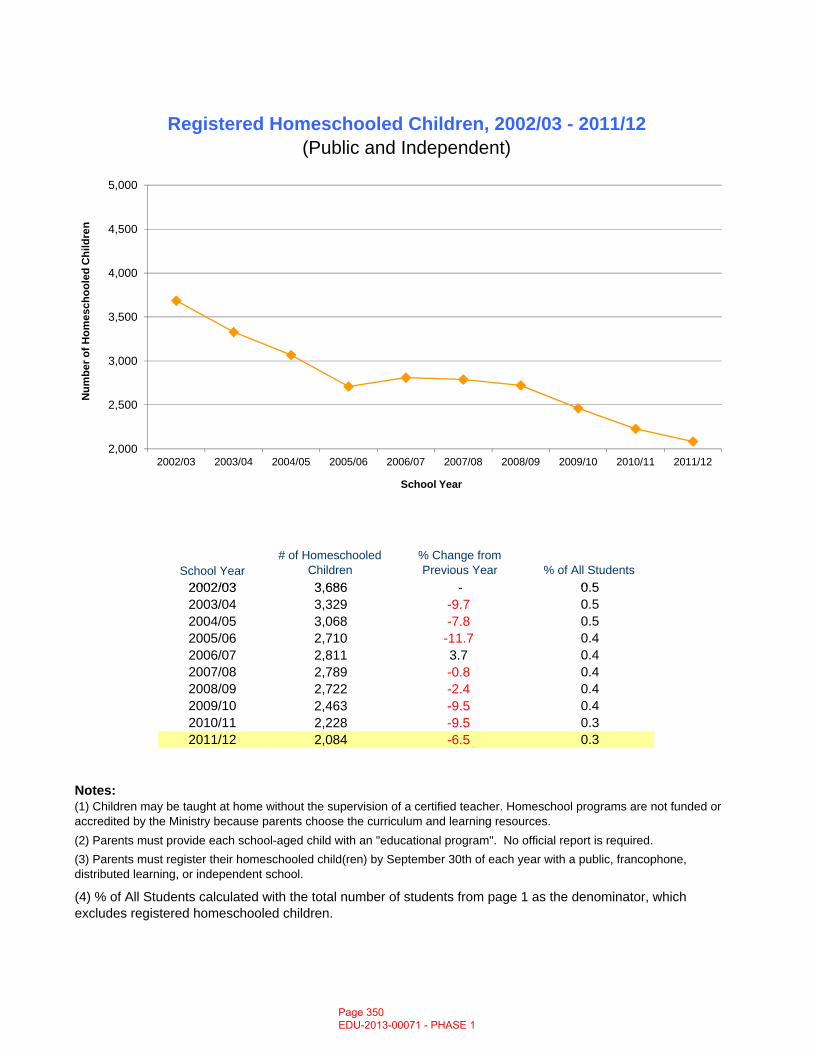
School Year# of Homeschooled
Children% Change from Previous Year % of All Students
2002/03 3 686 0 5
Registered Homeschooled Children, 2002/03 - 2011/12(Public and Independent)
2,000
2,500
3,000
3,500
4,000
4,500
5,000
2002/03 2003/04 2004/05 2005/06 2006/07 2007/08 2008/09 2009/10 2010/11 2011/12
Num
ber o
f Hom
esch
oole
d C
hild
ren
School Year
2002/03 3,686 - 0.52003/04 3,329 -9.7 0.52004/05 3,068 -7.8 0.52005/06 2,710 -11.7 0.42006/07 2,811 3.7 0.42007/08 2,789 -0.8 0.42008/09 2,722 -2.4 0.42009/10 2,463 -9.5 0.42010/11 2,228 -9.5 0.32011/12 2,084 -6.5 0.3
Notes:
(4) % of All Students calculated with the total number of students from page 1 as the denominator, which excludes registered homeschooled children.
(3) Parents must register their homeschooled child(ren) by September 30th of each year with a public, francophone, distributed learning, or independent school.
(1) Children may be taught at home without the supervision of a certified teacher. Homeschool programs are not funded or accredited by the Ministry because parents choose the curriculum and learning resources.(2) Parents must provide each school-aged child with an "educational program". No official report is required.
Page 350 EDU-2013-00071 - PHASE 1
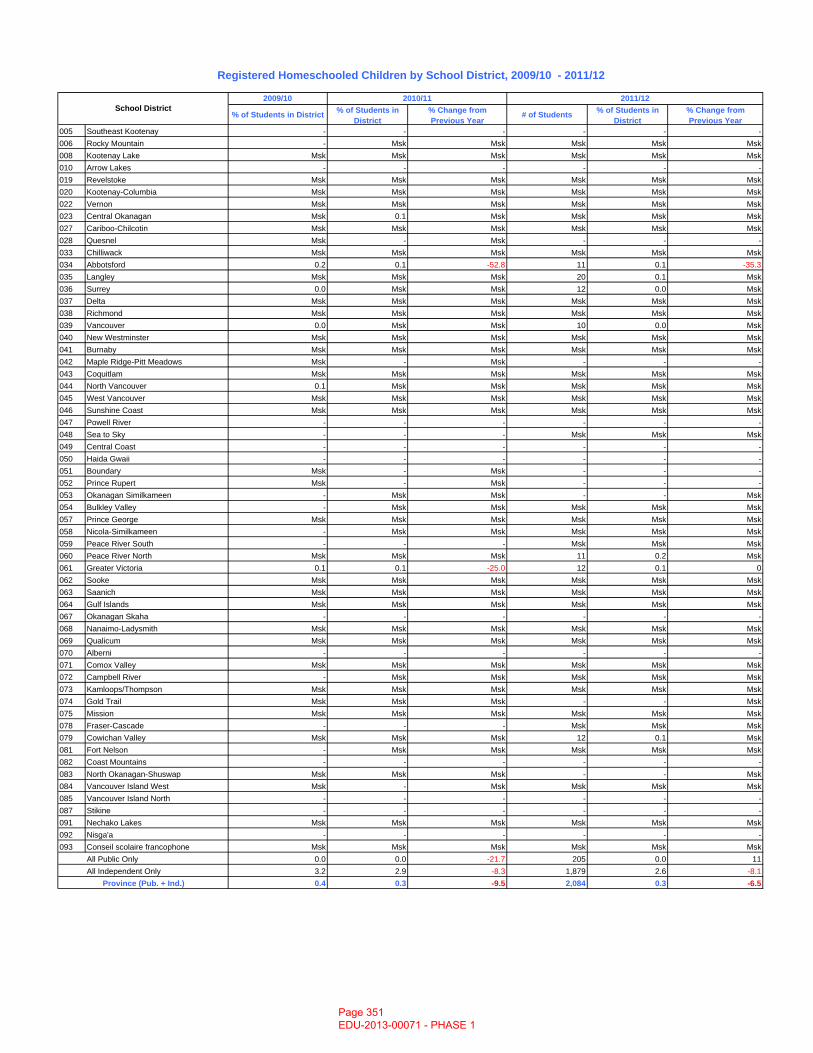
% of Students in District % of Students in District
% Change fromPrevious Year
# of Students % of Students in District
% Change fromPrevious Year
005 Southeast Kootenay - - - - - -006 Rocky Mountain - Msk Msk Msk Msk Msk008 Kootenay Lake Msk Msk Msk Msk Msk Msk010 Arrow Lakes - - - - - -019 Revelstoke Msk Msk Msk Msk Msk Msk020 Kootenay-Columbia Msk Msk Msk Msk Msk Msk022 Vernon Msk Msk Msk Msk Msk Msk023 Central Okanagan Msk 0.1 Msk Msk Msk Msk027 Cariboo-Chilcotin Msk Msk Msk Msk Msk Msk028 Quesnel Msk - Msk - - -033 Chilliwack Msk Msk Msk Msk Msk Msk034 Abbotsford 0.2 0.1 -52.8 11 0.1 -35.3035 Langley Msk Msk Msk 20 0.1 Msk036 Surrey 0.0 Msk Msk 12 0.0 Msk037 Delta Msk Msk Msk Msk Msk Msk038 Richmond Msk Msk Msk Msk Msk Msk039 Vancouver 0.0 Msk Msk 10 0.0 Msk040 New Westminster Msk Msk Msk Msk Msk Msk041 Burnaby Msk Msk Msk Msk Msk Msk042 Maple Ridge-Pitt Meadows Msk - Msk - - -043 Coquitlam Msk Msk Msk Msk Msk Msk044 North Vancouver 0.1 Msk Msk Msk Msk Msk045 West Vancouver Msk Msk Msk Msk Msk Msk046 Sunshine Coast Msk Msk Msk Msk Msk Msk047 Powell River - - - - - -048 Sea to Sky - - - Msk Msk Msk049 Central Coast - - - - - -050 Haida Gwaii - - - - - -051 Boundary Msk - Msk - - -052 Prince Rupert Msk - Msk - - -053 Okanagan Similkameen - Msk Msk - - Msk054 Bulkley Valley - Msk Msk Msk Msk Msk057 Prince George Msk Msk Msk Msk Msk Msk058 Nicola-Similkameen - Msk Msk Msk Msk Msk059 Peace River South - - - Msk Msk Msk060 Peace River North Msk Msk Msk 11 0.2 Msk061 Greater Victoria 0.1 0.1 -25.0 12 0.1 0062 Sooke Msk Msk Msk Msk Msk Msk063 Saanich Msk Msk Msk Msk Msk Msk064 Gulf Islands Msk Msk Msk Msk Msk Msk067 Okanagan Skaha - - - - - -068 Nanaimo-Ladysmith Msk Msk Msk Msk Msk Msk069 Qualicum Msk Msk Msk Msk Msk Msk070 Alberni - - - - - -071 Comox Valley Msk Msk Msk Msk Msk Msk072 Campbell River - Msk Msk Msk Msk Msk073 Kamloops/Thompson Msk Msk Msk Msk Msk Msk074 Gold Trail Msk Msk Msk - - Msk075 Mission Msk Msk Msk Msk Msk Msk078 Fraser-Cascade - - - Msk Msk Msk079 Cowichan Valley Msk Msk Msk 12 0.1 Msk081 Fort Nelson - Msk Msk Msk Msk Msk082 Coast Mountains - - - - - -083 North Okanagan-Shuswap Msk Msk Msk - - Msk084 Vancouver Island West Msk - Msk Msk Msk Msk085 Vancouver Island North - - - - - -087 Stikine - - - - - -091 Nechako Lakes Msk Msk Msk Msk Msk Msk092 Nisga'a - - - - - -093 Conseil scolaire francophone Msk Msk Msk Msk Msk Msk
All Public Only 0.0 0.0 -21.7 205 0.0 11All Independent Only 3.2 2.9 -8.3 1,879 2.6 -8.1
0.4 0.3 -9.5 2,084 0.3 -6.5Province (Pub. + Ind.)
Registered Homeschooled Children by School District, 2009/10 - 2011/12
2010/11School District
2011/122009/10
Page 351 EDU-2013-00071 - PHASE 1
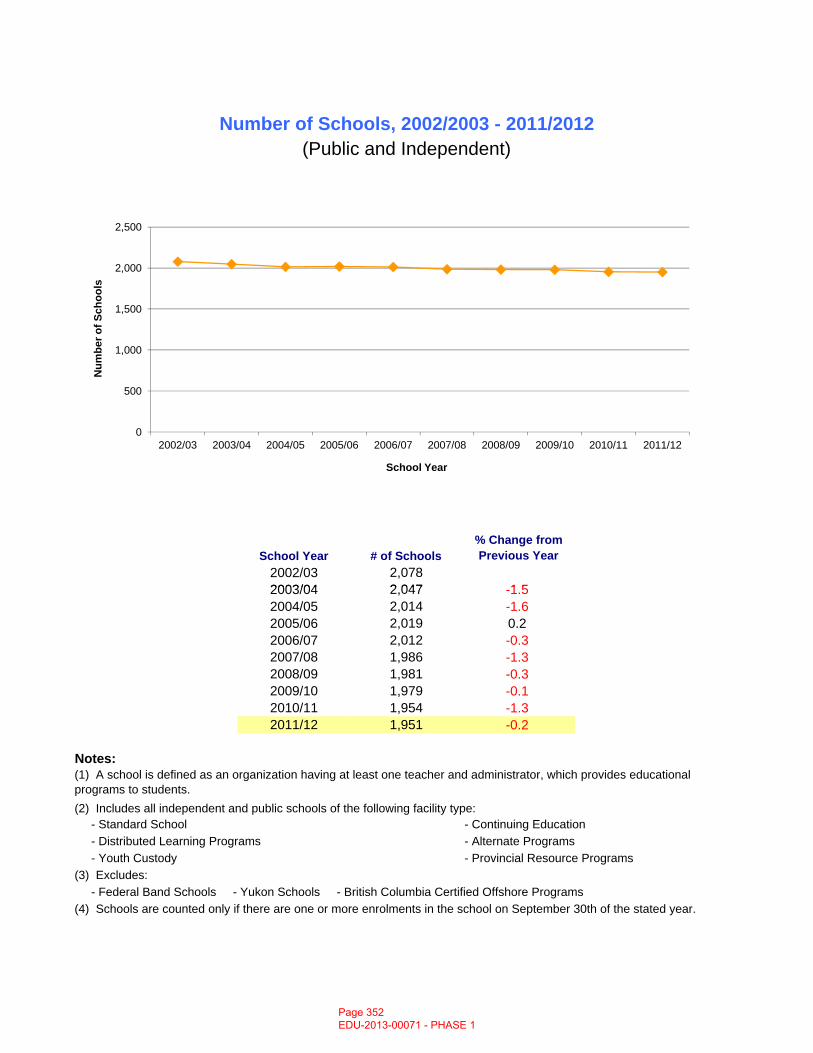
School Year # of Schools% Change from Previous Year
2002/03 2,0782003/04 2 047 1 5
Number of Schools, 2002/2003 - 2011/2012(Public and Independent)
0
500
1,000
1,500
2,000
2,500
2002/03 2003/04 2004/05 2005/06 2006/07 2007/08 2008/09 2009/10 2010/11 2011/12
Num
ber o
f Sch
ools
School Year
2003/04 2,047 -1.5 2004/05 2,014 -1.6 2005/06 2,019 0.22006/07 2,012 -0.3 2007/08 1,986 -1.3 2008/09 1,981 -0.3 2009/10 1,979 -0.1 2010/11 1,954 -1.3 2011/12 1,951 -0.2
Notes:
(2) Includes all independent and public schools of the following facility type: - Standard School - Continuing Education - Distributed Learning Programs - Alternate Programs - Youth Custody - Provincial Resource Programs(3) Excludes: - Federal Band Schools - Yukon Schools - British Columbia Certified Offshore Programs(4) Schools are counted only if there are one or more enrolments in the school on September 30th of the stated year.
(1) A school is defined as an organization having at least one teacher and administrator, which provides educational programs to students.
Page 352 EDU-2013-00071 - PHASE 1
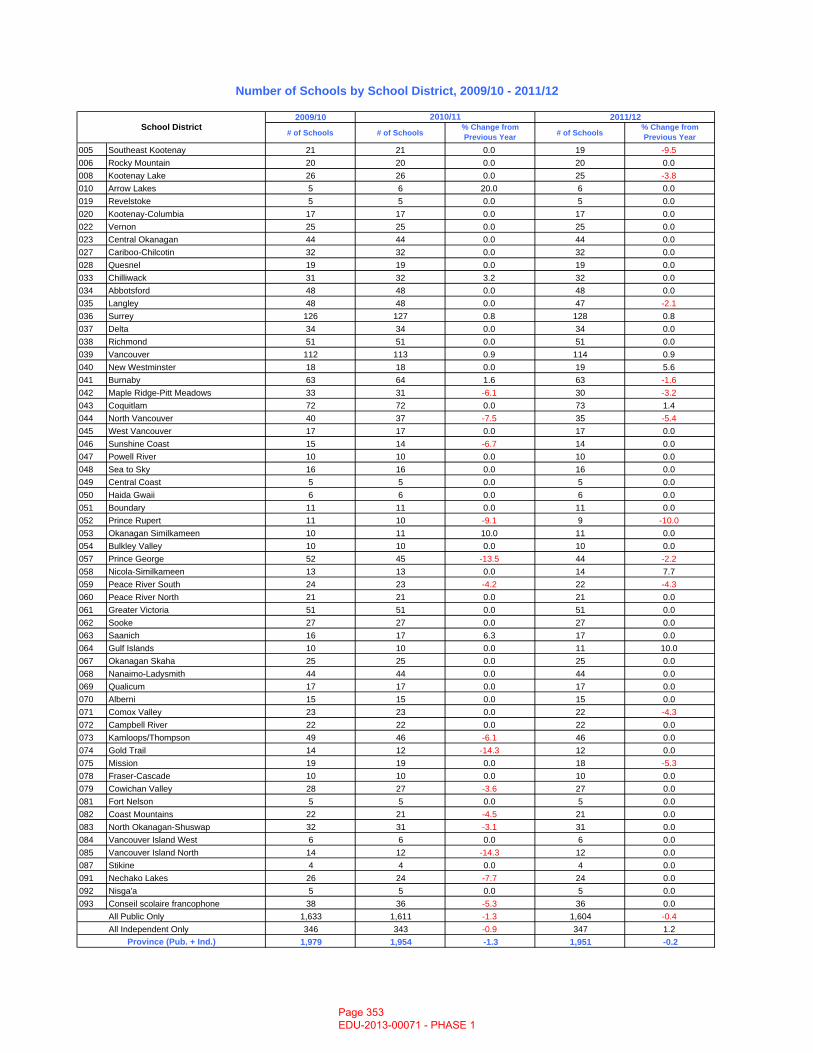
2009/10
# of Schools # of Schools% Change from Previous Year # of Schools
% Change from Previous Year
005 Southeast Kootenay 21 21 0.0 19 -9.5 006 Rocky Mountain 20 20 0.0 20 0.0008 Kootenay Lake 26 26 0.0 25 -3.8 010 Arrow Lakes 5 6 20.0 6 0.0019 Revelstoke 5 5 0.0 5 0.0020 Kootenay-Columbia 17 17 0.0 17 0.0022 Vernon 25 25 0.0 25 0.0023 Central Okanagan 44 44 0.0 44 0.0027 Cariboo-Chilcotin 32 32 0.0 32 0.0028 Quesnel 19 19 0.0 19 0.0033 Chilliwack 31 32 3.2 32 0.0034 Abbotsford 48 48 0.0 48 0.0035 Langley 48 48 0.0 47 -2.1 036 Surrey 126 127 0.8 128 0.8037 Delta 34 34 0.0 34 0.0038 Richmond 51 51 0.0 51 0.0039 Vancouver 112 113 0.9 114 0.9040 New Westminster 18 18 0.0 19 5.6041 Burnaby 63 64 1.6 63 -1.6 042 Maple Ridge-Pitt Meadows 33 31 -6.1 30 -3.2 043 Coquitlam 72 72 0.0 73 1.4044 North Vancouver 40 37 -7.5 35 -5.4 045 West Vancouver 17 17 0.0 17 0.0046 Sunshine Coast 15 14 -6.7 14 0.0047 Powell River 10 10 0.0 10 0.0048 Sea to Sky 16 16 0.0 16 0.0049 Central Coast 5 5 0.0 5 0.0050 Haida Gwaii 6 6 0.0 6 0.0051 Boundary 11 11 0.0 11 0.0052 Prince Rupert 11 10 -9.1 9 -10.0 053 Okanagan Similkameen 10 11 10.0 11 0.0054 Bulkley Valley 10 10 0.0 10 0.0057 Prince George 52 45 -13.5 44 -2.2 058 Nicola-Similkameen 13 13 0.0 14 7.7059 Peace River South 24 23 -4.2 22 -4.3 060 Peace River North 21 21 0.0 21 0.0061 Greater Victoria 51 51 0.0 51 0.0062 Sooke 27 27 0.0 27 0.0063 Saanich 16 17 6.3 17 0.0064 Gulf Islands 10 10 0.0 11 10.0067 Okanagan Skaha 25 25 0.0 25 0.0068 Nanaimo-Ladysmith 44 44 0.0 44 0.0069 Qualicum 17 17 0.0 17 0.0070 Alberni 15 15 0.0 15 0.0071 Comox Valley 23 23 0.0 22 -4.3 072 Campbell River 22 22 0.0 22 0.0073 Kamloops/Thompson 49 46 -6.1 46 0.0074 Gold Trail 14 12 -14.3 12 0.0075 Mission 19 19 0.0 18 -5.3 078 Fraser-Cascade 10 10 0.0 10 0.0079 Cowichan Valley 28 27 -3.6 27 0.0081 Fort Nelson 5 5 0.0 5 0.0082 Coast Mountains 22 21 -4.5 21 0.0083 North Okanagan-Shuswap 32 31 -3.1 31 0.0084 Vancouver Island West 6 6 0.0 6 0.0085 Vancouver Island North 14 12 -14.3 12 0.0087 Stikine 4 4 0.0 4 0.0091 Nechako Lakes 26 24 -7.7 24 0.0092 Nisga'a 5 5 0.0 5 0.0093 Conseil scolaire francophone 38 36 -5.3 36 0.0
All Public Only 1,633 1,611 -1.3 1,604 -0.4 All Independent Only 346 343 -0.9 347 1.2
1,979 1,954 -1.3 1,951 -0.2
2011/12
Number of Schools by School District, 2009/10 - 2011/12
Province (Pub. + Ind.)
2010/11School District
Page 353 EDU-2013-00071 - PHASE 1
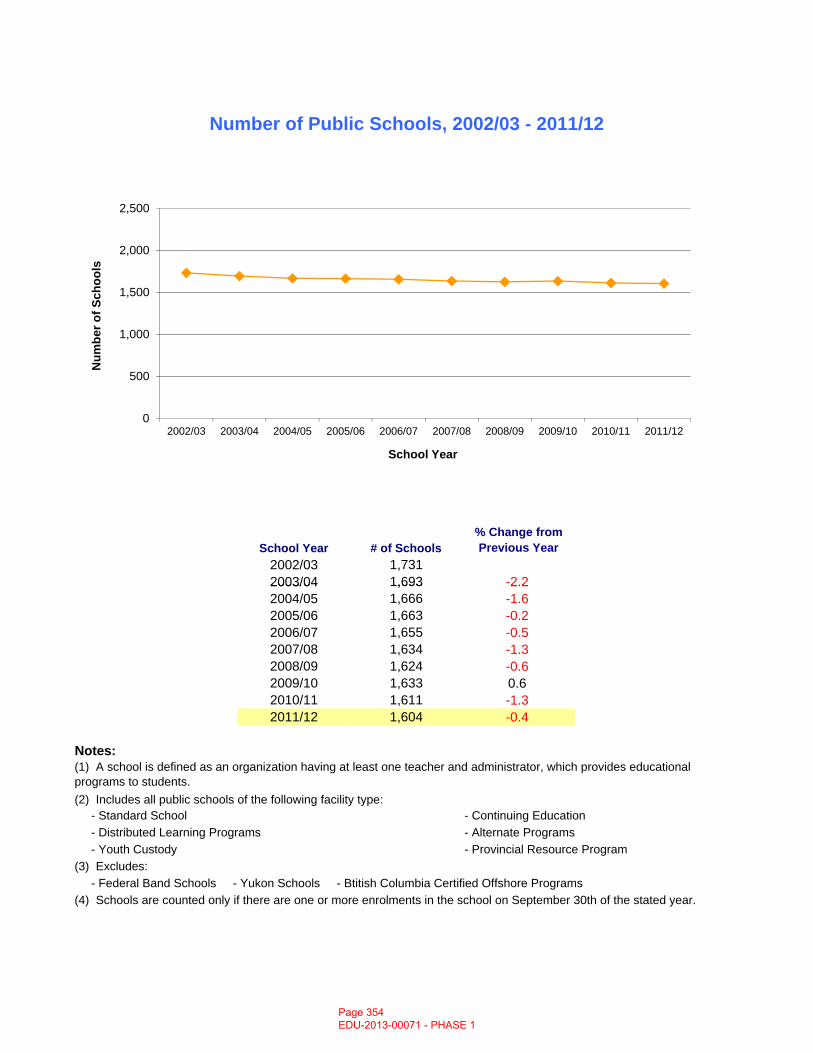
School Year # of Schools% Change from Previous Year
2002/03 1,7312003/04 1,693 -2.2
Number of Public Schools, 2002/03 - 2011/12
0
500
1,000
1,500
2,000
2,500
2002/03 2003/04 2004/05 2005/06 2006/07 2007/08 2008/09 2009/10 2010/11 2011/12
Num
ber o
f Sch
ools
School Year
2003/04 1,693 2.2 2004/05 1,666 -1.6 2005/06 1,663 -0.2 2006/07 1,655 -0.5 2007/08 1,634 -1.3 2008/09 1,624 -0.6 2009/10 1,633 0.62010/11 1,611 -1.3 2011/12 1,604 -0.4
Notes:
(2) Includes all public schools of the following facility type: - Standard School - Continuing Education - Distributed Learning Programs - Alternate Programs - Youth Custody - Provincial Resource Program(3) Excludes: - Federal Band Schools - Yukon Schools - Btitish Columbia Certified Offshore Programs(4) Schools are counted only if there are one or more enrolments in the school on September 30th of the stated year.
(1) A school is defined as an organization having at least one teacher and administrator, which provides educational programs to students.
Page 354 EDU-2013-00071 - PHASE 1
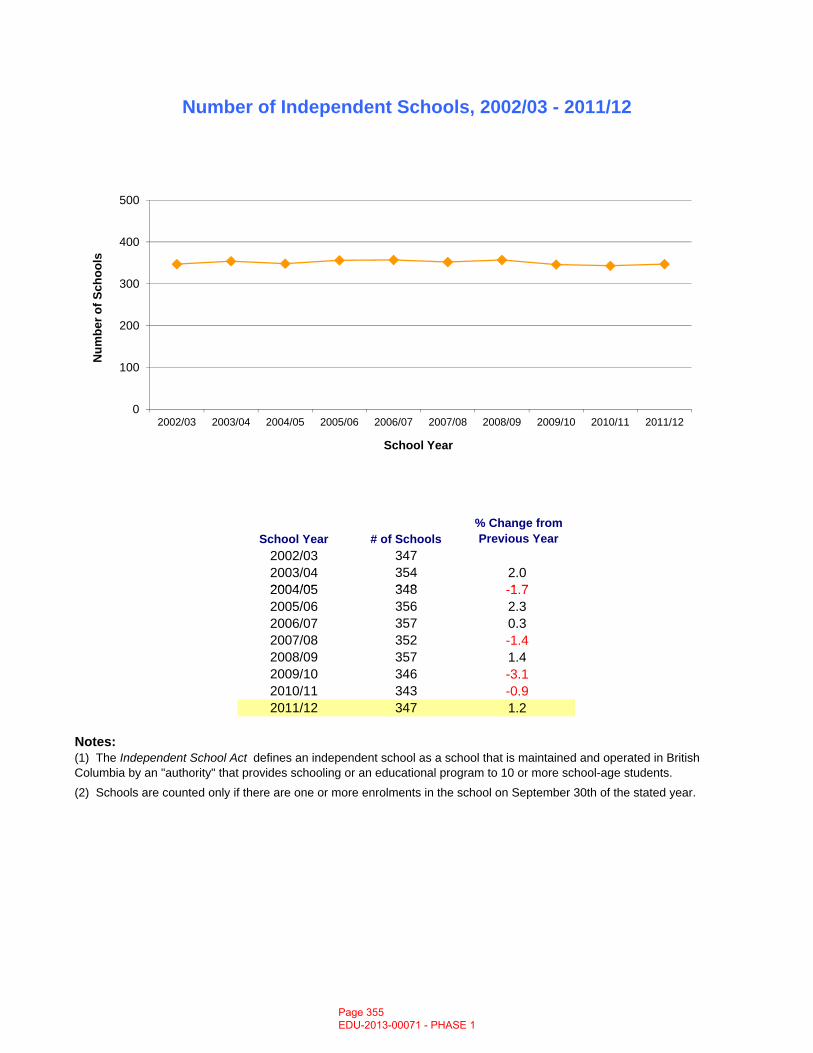
School Year # of Schools% Change from Previous Year
2002/03 3472003/04 354 2.02004/05 348 1 7
Number of Independent Schools, 2002/03 - 2011/12
0
100
200
300
400
500
2002/03 2003/04 2004/05 2005/06 2006/07 2007/08 2008/09 2009/10 2010/11 2011/12
Num
ber o
f Sch
ools
School Year
2004/05 348 -1.7 2005/06 356 2.32006/07 357 0.32007/08 352 -1.4 2008/09 357 1.42009/10 346 -3.1 2010/11 343 -0.9 2011/12 347 1.2
Notes:
(2) Schools are counted only if there are one or more enrolments in the school on September 30th of the stated year.
(1) The Independent School Act defines an independent school as a school that is maintained and operated in British Columbia by an "authority" that provides schooling or an educational program to 10 or more school-age students.
Page 355 EDU-2013-00071 - PHASE 1
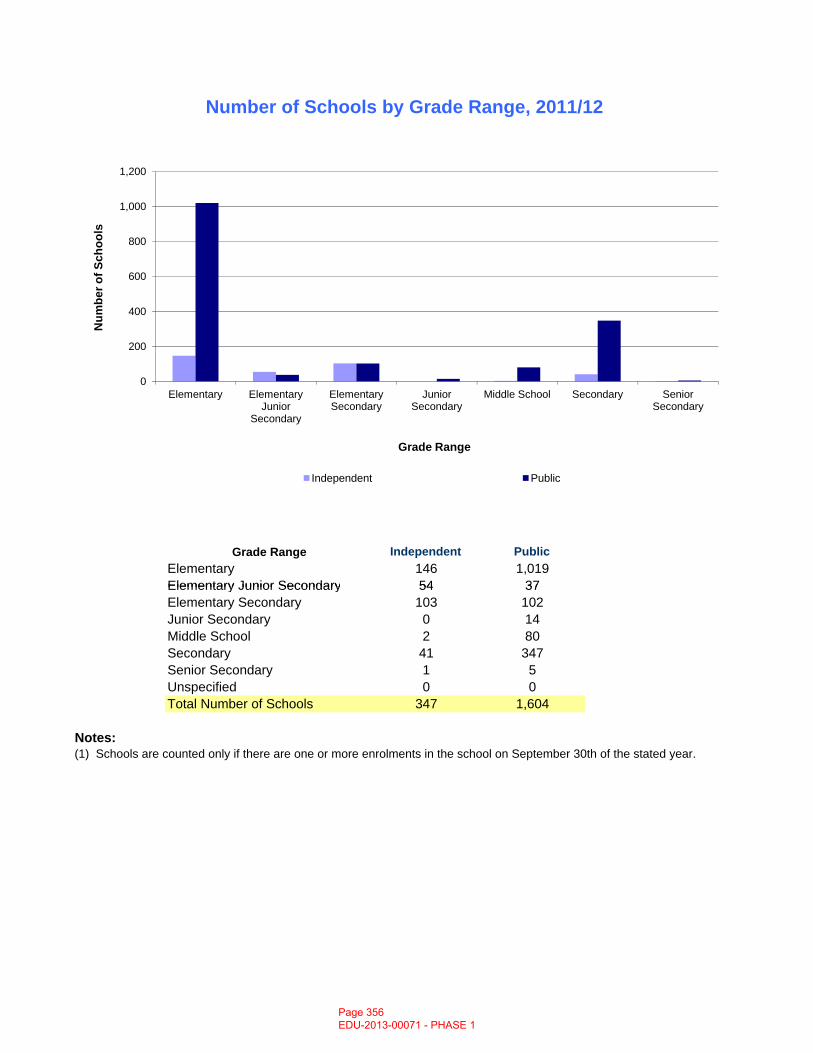
Grade Range Independent PublicElementary 146 1,019Elementary Junior Secondary 54 37
Number of Schools by Grade Range, 2011/12
0
200
400
600
800
1,000
1,200
Elementary Elementary Junior
Secondary
Elementary Secondary
Junior Secondary
Middle School Secondary Senior Secondary
Num
ber o
f Sch
ools
Grade Range
Independent Public
Elementary Junior Secondary 54 37Elementary Secondary 103 102Junior Secondary 0 14Middle School 2 80Secondary 41 347Senior Secondary 1 5Unspecified 0 0Total Number of Schools 347 1,604
Notes:(1) Schools are counted only if there are one or more enrolments in the school on September 30th of the stated year.
Page 356 EDU-2013-00071 - PHASE 1
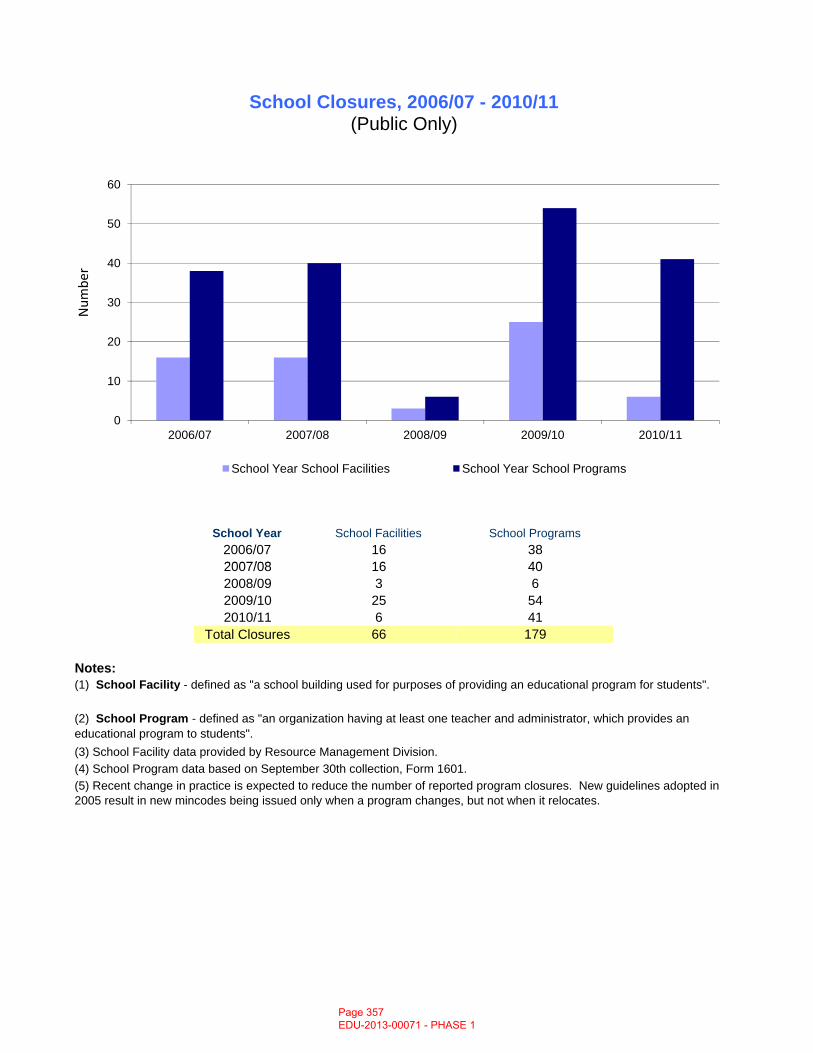
School Facilities School Programs2006/07 16 382007/08 16 40
School Closures, 2006/07 - 2010/11(Public Only)
School Year
0
10
20
30
40
50
60
2006/07 2007/08 2008/09 2009/10 2010/11
School Year School Facilities School Year School Programs
Num
ber
2007/08 16 402008/09 3 62009/10 25 542010/11 6 41
Total Closures 66 179
Notes:
(5) Recent change in practice is expected to reduce the number of reported program closures. New guidelines adopted in 2005 result in new mincodes being issued only when a program changes, but not when it relocates.
(2) School Program - defined as "an organization having at least one teacher and administrator, which provides an educational program to students".
(1) School Facility - defined as "a school building used for purposes of providing an educational program for students".
(4) School Program data based on September 30th collection, Form 1601.(3) School Facility data provided by Resource Management Division.
Page 357 EDU-2013-00071 - PHASE 1
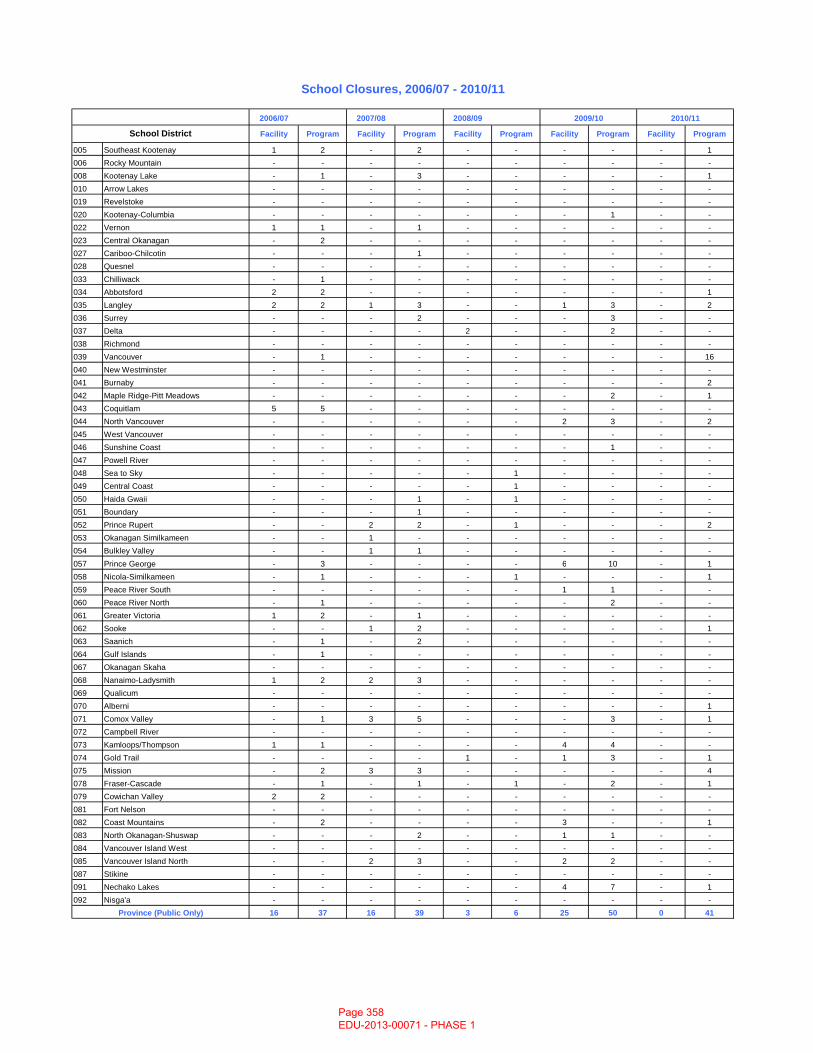
2006/07 2007/08 2008/09
Facility Program Facility Program Facility Program Facility Program Facility Program
005 Southeast Kootenay 1 2 - 2 - - - - - 1006 Rocky Mountain - - - - - - - - - -008 Kootenay Lake - 1 - 3 - - - - - 1010 Arrow Lakes - - - - - - - - - -019 Revelstoke - - - - - - - - - -020 Kootenay-Columbia - - - - - - - 1 - -022 Vernon 1 1 - 1 - - - - - -023 Central Okanagan - 2 - - - - - - - -027 Cariboo-Chilcotin - - - 1 - - - - - -028 Quesnel - - - - - - - - - -033 Chilliwack - 1 - - - - - - - -034 Abbotsford 2 2 - - - - - - - 1035 Langley 2 2 1 3 - - 1 3 - 2036 Surrey - - - 2 - - - 3 - -037 Delta - - - - 2 - - 2 - -038 Richmond - - - - - - - - - -039 Vancouver - 1 - - - - - - - 16040 New Westminster - - - - - - - - - -041 Burnaby - - - - - - - - - 2042 Maple Ridge-Pitt Meadows - - - - - - - 2 - 1043 Coquitlam 5 5 - - - - - - - -044 North Vancouver - - - - - - 2 3 - 2045 West Vancouver - - - - - - - - - -046 Sunshine Coast - - - - - - - 1 - -047 Powell River - - - - - - - - - -048 Sea to Sky - - - - - 1 - - - -049 Central Coast - - - - - 1 - - - -050 Haida Gwaii - - - 1 - 1 - - - -051 Boundary - - - 1 - - - - - -052 Prince Rupert - - 2 2 - 1 - - - 2053 Okanagan Similkameen - - 1 - - - - - - -054 Bulkley Valley - - 1 1 - - - - - -057 P i G 3 6 10 1
2010/11
School Closures, 2006/07 - 2010/11
2009/10
School District
057 Prince George - 3 - - - - 6 10 - 1058 Nicola-Similkameen - 1 - - - 1 - - - 1059 Peace River South - - - - - - 1 1 - -060 Peace River North - 1 - - - - - 2 - -061 Greater Victoria 1 2 - 1 - - - - - -062 Sooke - - 1 2 - - - - - 1063 Saanich - 1 - 2 - - - - - -064 Gulf Islands - 1 - - - - - - - -067 Okanagan Skaha - - - - - - - - - -068 Nanaimo-Ladysmith 1 2 2 3 - - - - - -069 Qualicum - - - - - - - - - -070 Alberni - - - - - - - - - 1071 Comox Valley - 1 3 5 - - - 3 - 1072 Campbell River - - - - - - - - - -073 Kamloops/Thompson 1 1 - - - - 4 4 - -074 Gold Trail - - - - 1 - 1 3 - 1075 Mission - 2 3 3 - - - - - 4078 Fraser-Cascade - 1 - 1 - 1 - 2 - 1079 Cowichan Valley 2 2 - - - - - - - -081 Fort Nelson - - - - - - - - - -082 Coast Mountains - 2 - - - - 3 - - 1083 North Okanagan-Shuswap - - - 2 - - 1 1 - -084 Vancouver Island West - - - - - - - - - -085 Vancouver Island North - - 2 3 - - 2 2 - -087 Stikine - - - - - - - - - -091 Nechako Lakes - - - - - - 4 7 - 1092 Nisga'a - - - - - - - - - -
16 37 16 39 3 6 25 50 0 41Province (Public Only)
Page 358 EDU-2013-00071 - PHASE 1
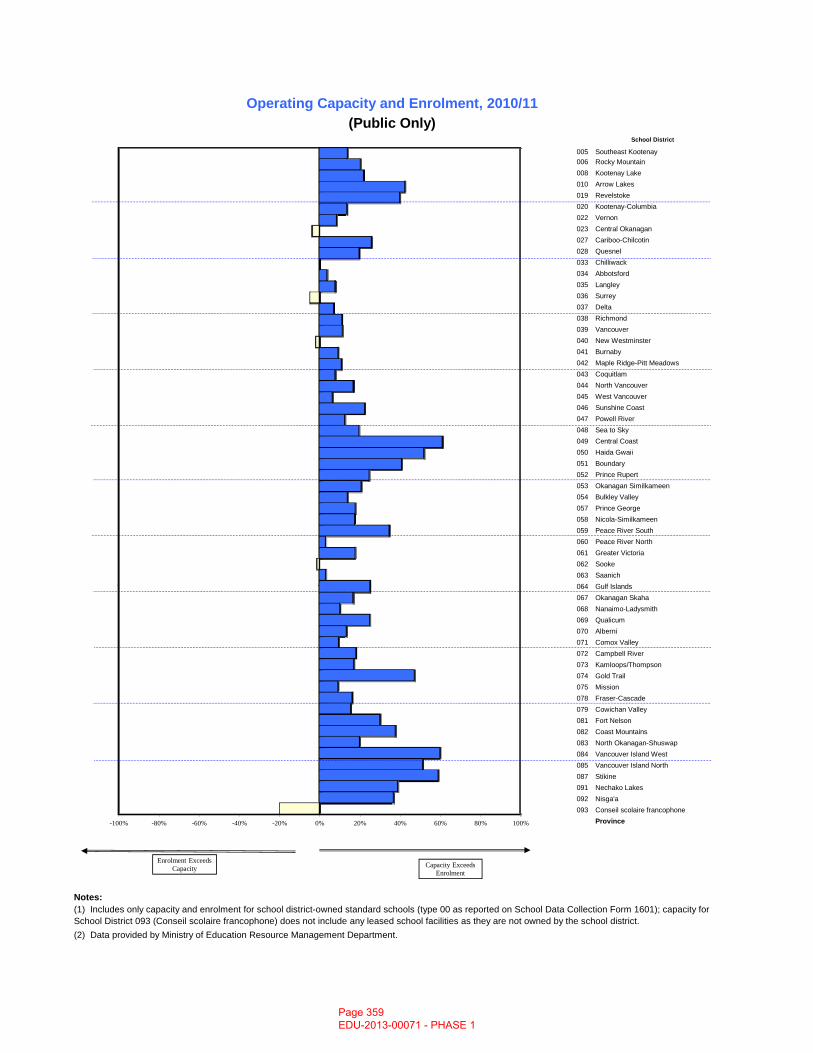
School District
005 Southeast Kootenay006 Rocky Mountain008 Kootenay Lake010 Arrow Lakes019 Revelstoke020 Kootenay-Columbia022 Vernon023 Central Okanagan027 Cariboo-Chilcotin028 Quesnel033 Chilliwack034 Abbotsford035 Langley036 Surrey037 Delta038 Richmond039 Vancouver040 New Westminster041 Burnaby042 Maple Ridge-Pitt Meadows043 Coquitlam044 North Vancouver045 West Vancouver046 Sunshine Coast047 Powell River048 Sea to Sky049 Central Coast050 Haida Gwaii051 Boundary052 Prince Rupert053 Okanagan Similkameen054 Bulkley Valley057 Prince George058 Nicola-Similkameen059 Peace River South060 Peace River North061 Greater Victoria062 Sooke063 Saanich064 Gulf Islands
Operating Capacity and Enrolment, 2010/11(Public Only)
064 Gulf Islands067 Okanagan Skaha068 Nanaimo-Ladysmith069 Qualicum070 Alberni071 Comox Valley072 Campbell River073 Kamloops/Thompson074 Gold Trail075 Mission078 Fraser-Cascade079 Cowichan Valley081 Fort Nelson082 Coast Mountains083 North Okanagan-Shuswap084 Vancouver Island West085 Vancouver Island North087 Stikine091 Nechako Lakes092 Nisga'a093 Conseil scolaire francophone
Province
Notes:
(2) Data provided by Ministry of Education Resource Management Department.
(1) Includes only capacity and enrolment for school district-owned standard schools (type 00 as reported on School Data Collection Form 1601); capacity for School District 093 (Conseil scolaire francophone) does not include any leased school facilities as they are not owned by the school district.
-100% -80% -60% -40% -20% 0% 20% 40% 60% 80% 100%
Enrolment Exceeds Capacity Capacity Exceeds
Enrolment
Page 359 EDU-2013-00071 - PHASE 1
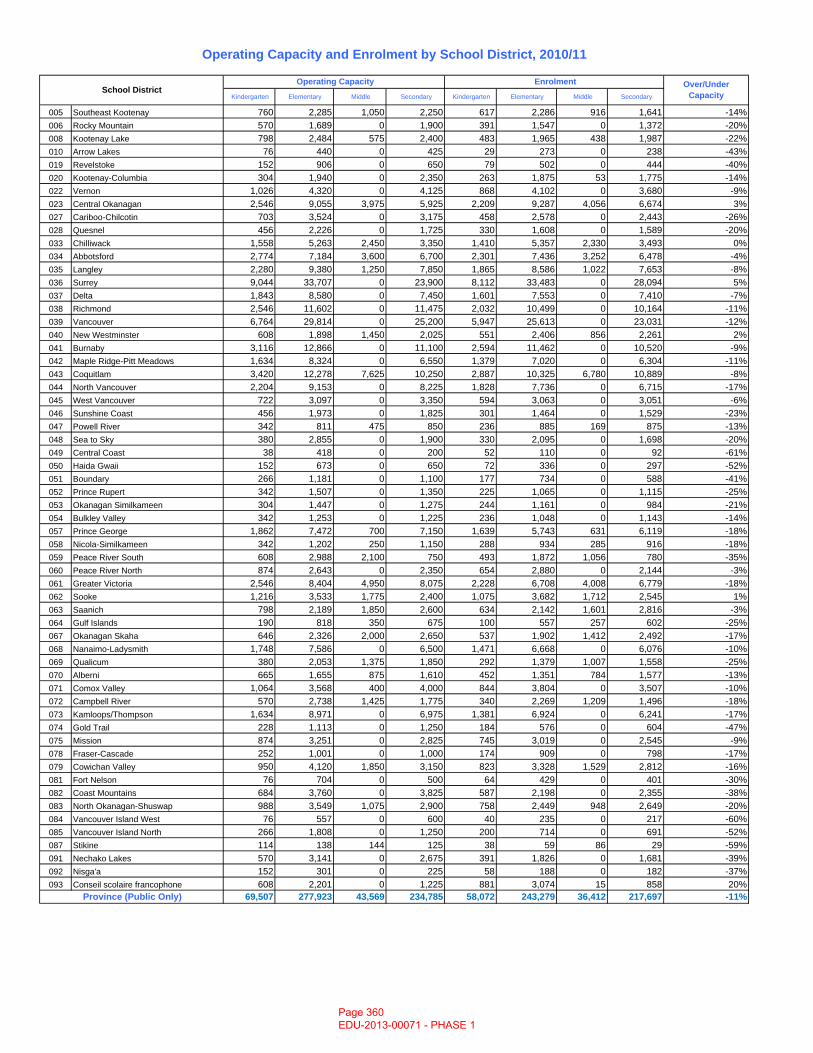
Kindergarten Elementary Middle Secondary Kindergarten Elementary Middle Secondary
005 Southeast Kootenay 760 2,285 1,050 2,250 617 2,286 916 1,641 -14%006 Rocky Mountain 570 1,689 0 1,900 391 1,547 0 1,372 -20%008 Kootenay Lake 798 2,484 575 2,400 483 1,965 438 1,987 -22%010 Arrow Lakes 76 440 0 425 29 273 0 238 -43%019 Revelstoke 152 906 0 650 79 502 0 444 -40%020 Kootenay-Columbia 304 1,940 0 2,350 263 1,875 53 1,775 -14%022 Vernon 1,026 4,320 0 4,125 868 4,102 0 3,680 -9%023 Central Okanagan 2,546 9,055 3,975 5,925 2,209 9,287 4,056 6,674 3%027 Cariboo-Chilcotin 703 3,524 0 3,175 458 2,578 0 2,443 -26%028 Quesnel 456 2,226 0 1,725 330 1,608 0 1,589 -20%033 Chilliwack 1,558 5,263 2,450 3,350 1,410 5,357 2,330 3,493 0%034 Abbotsford 2,774 7,184 3,600 6,700 2,301 7,436 3,252 6,478 -4%035 Langley 2,280 9,380 1,250 7,850 1,865 8,586 1,022 7,653 -8%036 Surrey 9,044 33,707 0 23,900 8,112 33,483 0 28,094 5%037 Delta 1,843 8,580 0 7,450 1,601 7,553 0 7,410 -7%038 Richmond 2,546 11,602 0 11,475 2,032 10,499 0 10,164 -11%039 Vancouver 6,764 29,814 0 25,200 5,947 25,613 0 23,031 -12%040 New Westminster 608 1,898 1,450 2,025 551 2,406 856 2,261 2%041 Burnaby 3,116 12,866 0 11,100 2,594 11,462 0 10,520 -9%042 Maple Ridge-Pitt Meadows 1,634 8,324 0 6,550 1,379 7,020 0 6,304 -11%043 Coquitlam 3,420 12,278 7,625 10,250 2,887 10,325 6,780 10,889 -8%044 North Vancouver 2,204 9,153 0 8,225 1,828 7,736 0 6,715 -17%045 West Vancouver 722 3,097 0 3,350 594 3,063 0 3,051 -6%046 Sunshine Coast 456 1,973 0 1,825 301 1,464 0 1,529 -23%047 Powell River 342 811 475 850 236 885 169 875 -13%048 Sea to Sky 380 2,855 0 1,900 330 2,095 0 1,698 -20%049 Central Coast 38 418 0 200 52 110 0 92 -61%050 Haida Gwaii 152 673 0 650 72 336 0 297 -52%051 Boundary 266 1,181 0 1,100 177 734 0 588 -41%052 Prince Rupert 342 1,507 0 1,350 225 1,065 0 1,115 -25%053 Okanagan Similkameen 304 1,447 0 1,275 244 1,161 0 984 -21%054 Bulkley Valley 342 1,253 0 1,225 236 1,048 0 1,143 -14%057 Prince George 1,862 7,472 700 7,150 1,639 5,743 631 6,119 -18%058 Nicola-Similkameen 342 1,202 250 1,150 288 934 285 916 -18%059 Peace River South 608 2,988 2,100 750 493 1,872 1,056 780 -35%060 Peace River North 874 2,643 0 2,350 654 2,880 0 2,144 -3%061 Greater Victoria 2,546 8,404 4,950 8,075 2,228 6,708 4,008 6,779 -18%062 Sooke 1,216 3,533 1,775 2,400 1,075 3,682 1,712 2,545 1%063 Saanich 798 2,189 1,850 2,600 634 2,142 1,601 2,816 -3%064 Gulf Islands 190 818 350 675 100 557 257 602 -25%067 Okanagan Skaha 646 2,326 2,000 2,650 537 1,902 1,412 2,492 -17%068 Nanaimo-Ladysmith 1,748 7,586 0 6,500 1,471 6,668 0 6,076 -10%069 Qualicum 380 2,053 1,375 1,850 292 1,379 1,007 1,558 -25%070 Alberni 665 1,655 875 1,610 452 1,351 784 1,577 -13%071 Comox Valley 1,064 3,568 400 4,000 844 3,804 0 3,507 -10%072 Campbell River 570 2,738 1,425 1,775 340 2,269 1,209 1,496 -18%073 Kamloops/Thompson 1,634 8,971 0 6,975 1,381 6,924 0 6,241 -17%074 Gold Trail 228 1,113 0 1,250 184 576 0 604 -47%075 Mission 874 3,251 0 2,825 745 3,019 0 2,545 -9%078 Fraser-Cascade 252 1,001 0 1,000 174 909 0 798 -17%079 Cowichan Valley 950 4,120 1,850 3,150 823 3,328 1,529 2,812 -16%081 Fort Nelson 76 704 0 500 64 429 0 401 -30%082 Coast Mountains 684 3,760 0 3,825 587 2,198 0 2,355 -38%083 North Okanagan-Shuswap 988 3,549 1,075 2,900 758 2,449 948 2,649 -20%084 Vancouver Island West 76 557 0 600 40 235 0 217 -60%085 Vancouver Island North 266 1,808 0 1,250 200 714 0 691 -52%087 Stikine 114 138 144 125 38 59 86 29 -59%091 Nechako Lakes 570 3,141 0 2,675 391 1,826 0 1,681 -39%092 Nisga'a 152 301 0 225 58 188 0 182 -37%093 Conseil scolaire francophone 608 2,201 0 1,225 881 3,074 15 858 20%
69,507 277,923 43,569 234,785 58,072 243,279 36,412 217,697 -11%
Over/Under Capacity
Operating Capacity and Enrolment by School District, 2010/11
Province (Public Only)
School District Operating Capacity Enrolment
Page 360 EDU-2013-00071 - PHASE 1
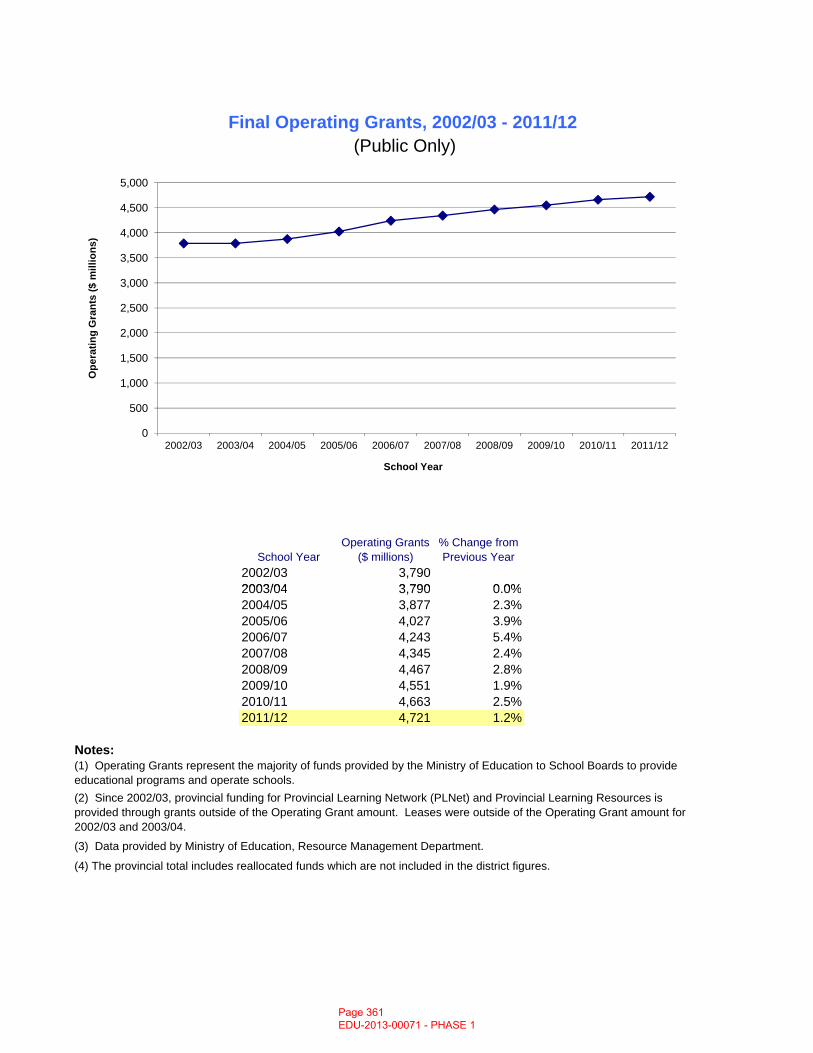
2002/03 3,7902003/04 3 790 0 0%
Final Operating Grants, 2002/03 - 2011/12 (Public Only)
School YearOperating Grants
($ millions)% Change from Previous Year
0
500
1,000
1,500
2,000
2,500
3,000
3,500
4,000
4,500
5,000
2002/03 2003/04 2004/05 2005/06 2006/07 2007/08 2008/09 2009/10 2010/11 2011/12
Ope
ratin
g G
rant
s ($
mill
ions
)
School Year
2003/04 3,790 0.0%2004/05 3,877 2.3%2005/06 4,027 3.9%2006/07 4,243 5.4%2007/08 4,345 2.4%2008/09 4,467 2.8%2009/10 4,551 1.9%2010/11 4,663 2.5%2011/12 4,721 1.2%
Notes:
(3) Data provided by Ministry of Education, Resource Management Department.
(4) The provincial total includes reallocated funds which are not included in the district figures.
(1) Operating Grants represent the majority of funds provided by the Ministry of Education to School Boards to provide educational programs and operate schools.(2) Since 2002/03, provincial funding for Provincial Learning Network (PLNet) and Provincial Learning Resources is provided through grants outside of the Operating Grant amount. Leases were outside of the Operating Grant amount for 2002/03 and 2003/04.
Page 361 EDU-2013-00071 - PHASE 1
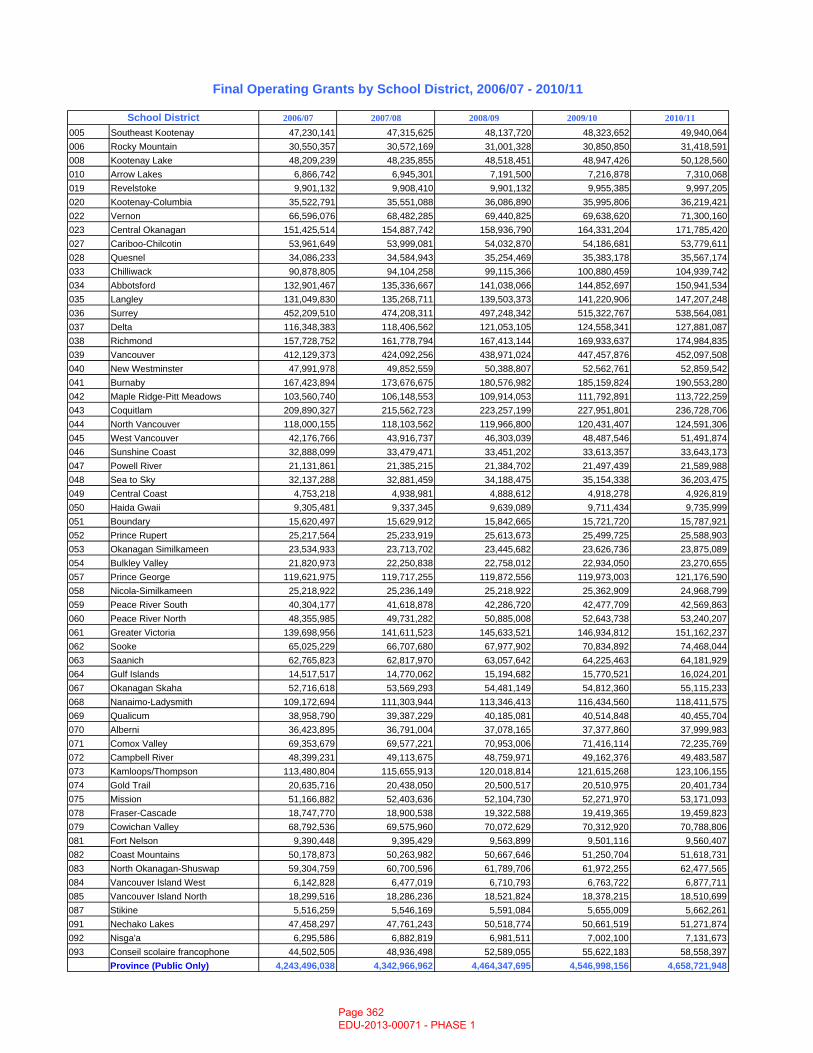
2006/07 2007/08 2008/09 2009/10 2010/11005 Southeast Kootenay 47,230,141 47,315,625 48,137,720 48,323,652 49,940,064006 Rocky Mountain 30,550,357 30,572,169 31,001,328 30,850,850 31,418,591008 Kootenay Lake 48,209,239 48,235,855 48,518,451 48,947,426 50,128,560010 Arrow Lakes 6,866,742 6,945,301 7,191,500 7,216,878 7,310,068019 Revelstoke 9,901,132 9,908,410 9,901,132 9,955,385 9,997,205020 Kootenay-Columbia 35,522,791 35,551,088 36,086,890 35,995,806 36,219,421022 Vernon 66,596,076 68,482,285 69,440,825 69,638,620 71,300,160023 Central Okanagan 151,425,514 154,887,742 158,936,790 164,331,204 171,785,420027 Cariboo-Chilcotin 53,961,649 53,999,081 54,032,870 54,186,681 53,779,611028 Quesnel 34,086,233 34,584,943 35,254,469 35,383,178 35,567,174033 Chilliwack 90,878,805 94,104,258 99,115,366 100,880,459 104,939,742034 Abbotsford 132,901,467 135,336,667 141,038,066 144,852,697 150,941,534035 Langley 131,049,830 135,268,711 139,503,373 141,220,906 147,207,248036 Surrey 452,209,510 474,208,311 497,248,342 515,322,767 538,564,081037 Delta 116,348,383 118,406,562 121,053,105 124,558,341 127,881,087038 Richmond 157,728,752 161,778,794 167,413,144 169,933,637 174,984,835039 Vancouver 412,129,373 424,092,256 438,971,024 447,457,876 452,097,508040 New Westminster 47,991,978 49,852,559 50,388,807 52,562,761 52,859,542041 Burnaby 167,423,894 173,676,675 180,576,982 185,159,824 190,553,280042 Maple Ridge-Pitt Meadows 103,560,740 106,148,553 109,914,053 111,792,891 113,722,259043 Coquitlam 209,890,327 215,562,723 223,257,199 227,951,801 236,728,706044 North Vancouver 118,000,155 118,103,562 119,966,800 120,431,407 124,591,306045 West Vancouver 42,176,766 43,916,737 46,303,039 48,487,546 51,491,874046 Sunshine Coast 32,888,099 33,479,471 33,451,202 33,613,357 33,643,173047 Powell River 21,131,861 21,385,215 21,384,702 21,497,439 21,589,988048 Sea to Sky 32,137,288 32,881,459 34,188,475 35,154,338 36,203,475049 Central Coast 4,753,218 4,938,981 4,888,612 4,918,278 4,926,819050 Haida Gwaii 9,305,481 9,337,345 9,639,089 9,711,434 9,735,999051 Boundary 15,620,497 15,629,912 15,842,665 15,721,720 15,787,921052 Prince Rupert 25,217,564 25,233,919 25,613,673 25,499,725 25,588,903053 Okanagan Similkameen 23,534,933 23,713,702 23,445,682 23,626,736 23,875,089054 Bulkley Valley 21,820,973 22,250,838 22,758,012 22,934,050 23,270,655057 Prince George 119,621,975 119,717,255 119,872,556 119,973,003 121,176,590058 Nicola-Similkameen 25,218,922 25,236,149 25,218,922 25,362,909 24,968,799059 Peace River South 40,304,177 41,618,878 42,286,720 42,477,709 42,569,863060 Peace River North 48,355,985 49,731,282 50,885,008 52,643,738 53,240,207061 Greater Victoria 139,698,956 141,611,523 145,633,521 146,934,812 151,162,237062 Sooke 65,025,229 66,707,680 67,977,902 70,834,892 74,468,044063 Saanich 62,765,823 62,817,970 63,057,642 64,225,463 64,181,929064 Gulf Islands 14,517,517 14,770,062 15,194,682 15,770,521 16,024,201067 Okanagan Skaha 52,716,618 53,569,293 54,481,149 54,812,360 55,115,233068 Nanaimo-Ladysmith 109,172,694 111,303,944 113,346,413 116,434,560 118,411,575069 Qualicum 38,958,790 39,387,229 40,185,081 40,514,848 40,455,704070 Alberni 36,423,895 36,791,004 37,078,165 37,377,860 37,999,983071 Comox Valley 69,353,679 69,577,221 70,953,006 71,416,114 72,235,769072 Campbell River 48,399,231 49,113,675 48,759,971 49,162,376 49,483,587073 Kamloops/Thompson 113,480,804 115,655,913 120,018,814 121,615,268 123,106,155074 Gold Trail 20,635,716 20,438,050 20,500,517 20,510,975 20,401,734075 Mission 51,166,882 52,403,636 52,104,730 52,271,970 53,171,093078 Fraser-Cascade 18,747,770 18,900,538 19,322,588 19,419,365 19,459,823079 Cowichan Valley 68,792,536 69,575,960 70,072,629 70,312,920 70,788,806081 Fort Nelson 9,390,448 9,395,429 9,563,899 9,501,116 9,560,407082 Coast Mountains 50,178,873 50,263,982 50,667,646 51,250,704 51,618,731083 North Okanagan-Shuswap 59,304,759 60,700,596 61,789,706 61,972,255 62,477,565084 Vancouver Island West 6,142,828 6,477,019 6,710,793 6,763,722 6,877,711085 Vancouver Island North 18,299,516 18,286,236 18,521,824 18,378,215 18,510,699087 Stikine 5,516,259 5,546,169 5,591,084 5,655,009 5,662,261091 Nechako Lakes 47,458,297 47,761,243 50,518,774 50,661,519 51,271,874092 Nisga'a 6,295,586 6,882,819 6,981,511 7,002,100 7,131,673093 Conseil scolaire francophone 44,502,505 48,936,498 52,589,055 55,622,183 58,558,397
Province (Public Only) 4,243,496,038 4,342,966,962 4,464,347,695 4,546,998,156 4,658,721,948
Final Operating Grants by School District, 2006/07 - 2010/11
School District
Page 362 EDU-2013-00071 - PHASE 1
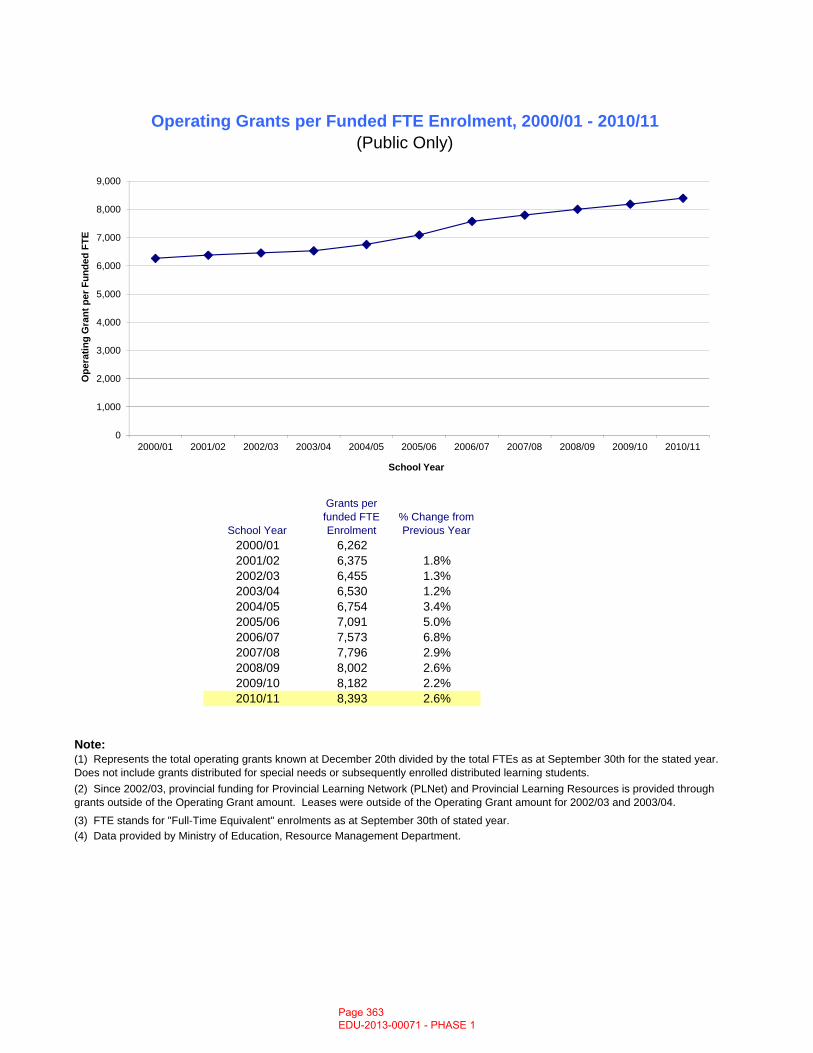
2000/01 6,2622001/02 6,375 1.8%2002/03 6,455 1.3%2003/04 6 530 1 2%
Operating Grants per Funded FTE Enrolment, 2000/01 - 2010/11
% Change from Previous Year
(Public Only)
School Year
Grants per funded FTE Enrolment
0
1,000
2,000
3,000
4,000
5,000
6,000
7,000
8,000
9,000
2000/01 2001/02 2002/03 2003/04 2004/05 2005/06 2006/07 2007/08 2008/09 2009/10 2010/11
Ope
ratin
g G
rant
per
Fun
ded
FTE
School Year
2003/04 6,530 1.2%2004/05 6,754 3.4%2005/06 7,091 5.0%2006/07 7,573 6.8%2007/08 7,796 2.9%2008/09 8,002 2.6%2009/10 8,182 2.2%2010/11 8,393 2.6%
Note:
(3) FTE stands for "Full-Time Equivalent" enrolments as at September 30th of stated year.(4) Data provided by Ministry of Education, Resource Management Department.
(1) Represents the total operating grants known at December 20th divided by the total FTEs as at September 30th for the stated year. Does not include grants distributed for special needs or subsequently enrolled distributed learning students.(2) Since 2002/03, provincial funding for Provincial Learning Network (PLNet) and Provincial Learning Resources is provided through grants outside of the Operating Grant amount. Leases were outside of the Operating Grant amount for 2002/03 and 2003/04.
Page 363 EDU-2013-00071 - PHASE 1
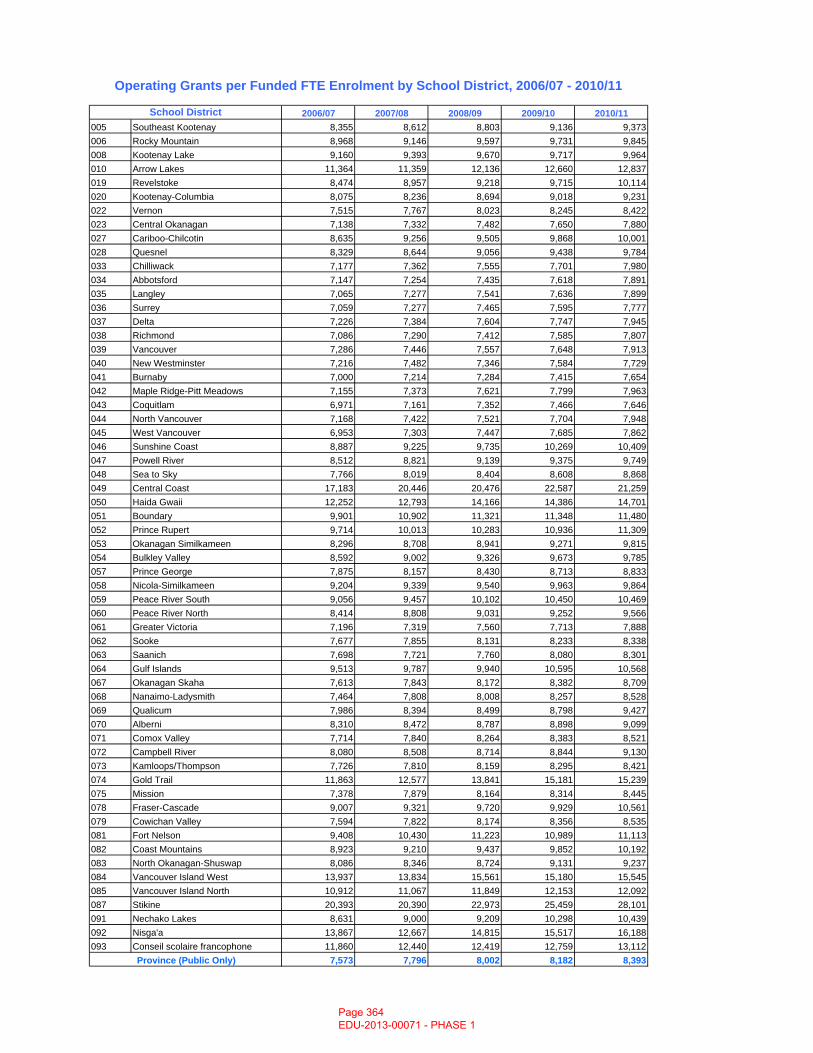
2006/07 2007/08 2008/09 2009/10 2010/11005 Southeast Kootenay 8,355 8,612 8,803 9,136 9,373006 Rocky Mountain 8,968 9,146 9,597 9,731 9,845008 Kootenay Lake 9,160 9,393 9,670 9,717 9,964010 Arrow Lakes 11,364 11,359 12,136 12,660 12,837019 Revelstoke 8,474 8,957 9,218 9,715 10,114020 Kootenay-Columbia 8,075 8,236 8,694 9,018 9,231022 Vernon 7,515 7,767 8,023 8,245 8,422023 Central Okanagan 7,138 7,332 7,482 7,650 7,880027 Cariboo-Chilcotin 8,635 9,256 9,505 9,868 10,001028 Quesnel 8,329 8,644 9,056 9,438 9,784033 Chilliwack 7,177 7,362 7,555 7,701 7,980034 Abbotsford 7,147 7,254 7,435 7,618 7,891035 Langley 7,065 7,277 7,541 7,636 7,899036 Surrey 7,059 7,277 7,465 7,595 7,777037 Delta 7,226 7,384 7,604 7,747 7,945038 Richmond 7,086 7,290 7,412 7,585 7,807039 Vancouver 7,286 7,446 7,557 7,648 7,913040 New Westminster 7,216 7,482 7,346 7,584 7,729041 Burnaby 7,000 7,214 7,284 7,415 7,654042 Maple Ridge-Pitt Meadows 7,155 7,373 7,621 7,799 7,963043 Coquitlam 6,971 7,161 7,352 7,466 7,646044 North Vancouver 7,168 7,422 7,521 7,704 7,948045 West Vancouver 6,953 7,303 7,447 7,685 7,862046 Sunshine Coast 8,887 9,225 9,735 10,269 10,409047 Powell River 8,512 8,821 9,139 9,375 9,749048 Sea to Sky 7,766 8,019 8,404 8,608 8,868049 Central Coast 17,183 20,446 20,476 22,587 21,259050 Haida Gwaii 12,252 12,793 14,166 14,386 14,701051 Boundary 9,901 10,902 11,321 11,348 11,480052 Prince Rupert 9,714 10,013 10,283 10,936 11,309053 Okanagan Similkameen 8,296 8,708 8,941 9,271 9,815054 Bulkley Valley 8,592 9,002 9,326 9,673 9,785057 Prince George 7,875 8,157 8,430 8,713 8,833058 Nicola-Similkameen 9,204 9,339 9,540 9,963 9,864059 Peace River South 9,056 9,457 10,102 10,450 10,469060 Peace River North 8,414 8,808 9,031 9,252 9,566061 Greater Victoria 7,196 7,319 7,560 7,713 7,888062 Sooke 7,677 7,855 8,131 8,233 8,338063 Saanich 7,698 7,721 7,760 8,080 8,301064 Gulf Islands 9,513 9,787 9,940 10,595 10,568067 Okanagan Skaha 7,613 7,843 8,172 8,382 8,709068 Nanaimo-Ladysmith 7,464 7,808 8,008 8,257 8,528069 Qualicum 7,986 8,394 8,499 8,798 9,427070 Alberni 8,310 8,472 8,787 8,898 9,099071 Comox Valley 7,714 7,840 8,264 8,383 8,521072 Campbell River 8,080 8,508 8,714 8,844 9,130073 Kamloops/Thompson 7,726 7,810 8,159 8,295 8,421074 Gold Trail 11,863 12,577 13,841 15,181 15,239075 Mission 7,378 7,879 8,164 8,314 8,445078 Fraser-Cascade 9,007 9,321 9,720 9,929 10,561079 Cowichan Valley 7,594 7,822 8,174 8,356 8,535081 Fort Nelson 9,408 10,430 11,223 10,989 11,113082 Coast Mountains 8,923 9,210 9,437 9,852 10,192083 North Okanagan-Shuswap 8,086 8,346 8,724 9,131 9,237084 Vancouver Island West 13,937 13,834 15,561 15,180 15,545085 Vancouver Island North 10,912 11,067 11,849 12,153 12,092087 Stikine 20,393 20,390 22,973 25,459 28,101091 Nechako Lakes 8,631 9,000 9,209 10,298 10,439092 Nisga'a 13,867 12,667 14,815 15,517 16,188093 Conseil scolaire francophone 11,860 12,440 12,419 12,759 13,112
7,573 7,796 8,002 8,182 8,393
Operating Grants per Funded FTE Enrolment by School District, 2006/07 - 2010/11
Province (Public Only)
School District
Page 364 EDU-2013-00071 - PHASE 1
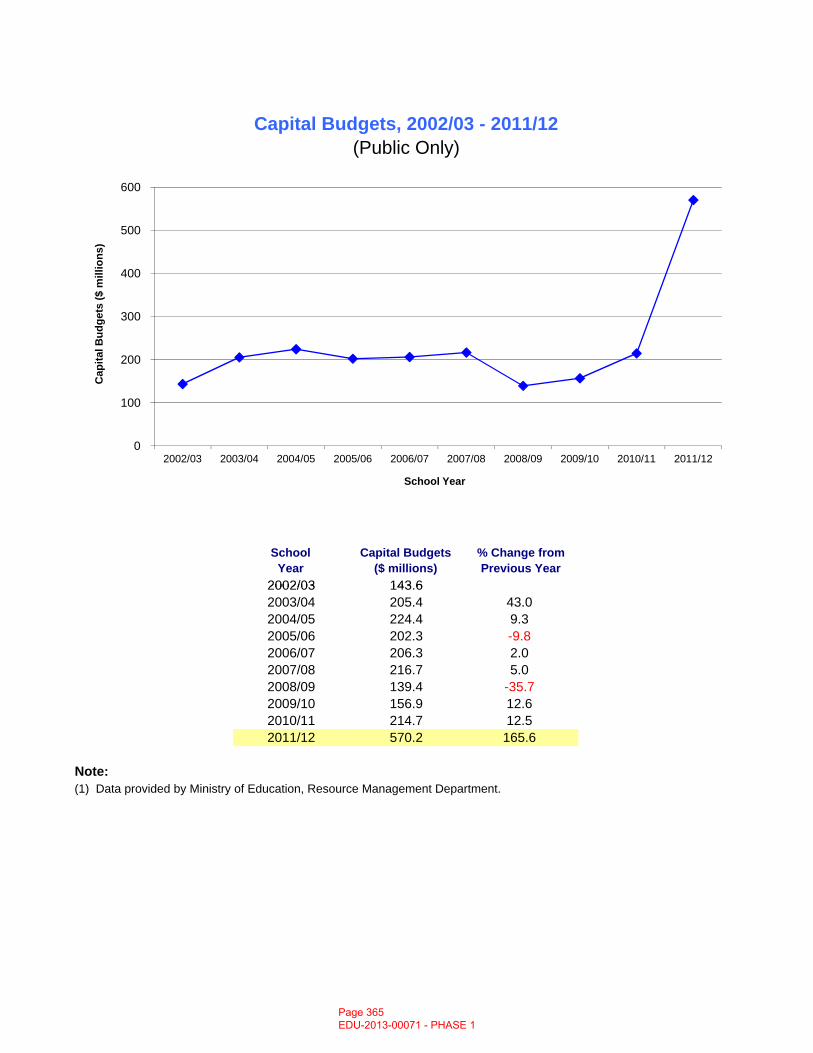
School Year
Capital Budgets($ millions)
% Change from Previous Year
2002/03 143 6
Capital Budgets, 2002/03 - 2011/12(Public Only)
0
100
200
300
400
500
600
2002/03 2003/04 2004/05 2005/06 2006/07 2007/08 2008/09 2009/10 2010/11 2011/12
Cap
ital B
udge
ts ($
mill
ions
)
School Year
2002/03 143.62003/04 205.4 43.02004/05 224.4 9.32005/06 202.3 -9.8 2006/07 206.3 2.02007/08 216.7 5.02008/09 139.4 -35.7 2009/10 156.9 12.62010/11 214.7 12.52011/12 570.2 165.6
Note:(1) Data provided by Ministry of Education, Resource Management Department.
Page 365 EDU-2013-00071 - PHASE 1
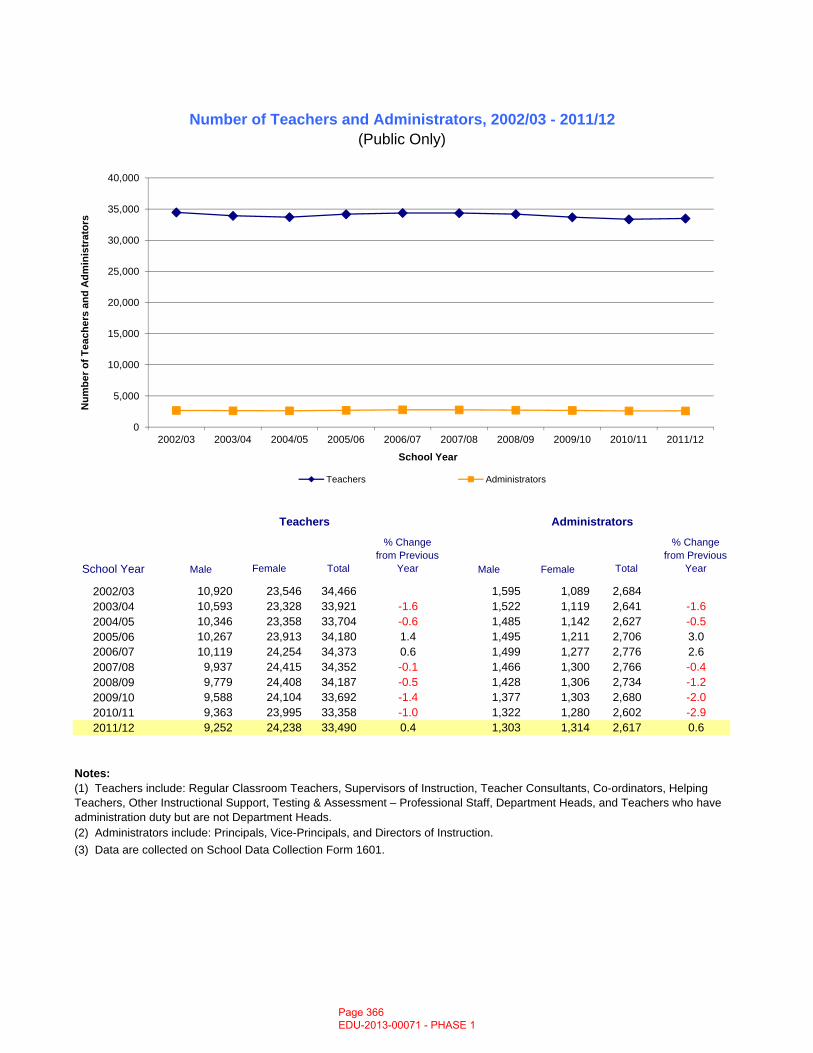
Male Female Total
% Change from Previous
Year Male Female Total
% Change from Previous
Year
2002/03 10 920 23 546 34 466 1 595 1 089 2 684
Number of Teachers and Administrators, 2002/03 - 2011/12(Public Only)
School Year
Teachers Administrators
0
5,000
10,000
15,000
20,000
25,000
30,000
35,000
40,000
2002/03 2003/04 2004/05 2005/06 2006/07 2007/08 2008/09 2009/10 2010/11 2011/12
Num
ber o
f Tea
cher
s an
d A
dmin
istr
ator
s
School Year
Teachers Administrators
2002/03 10,920 23,546 34,466 1,595 1,089 2,6842003/04 10,593 23,328 33,921 -1.6 1,522 1,119 2,641 -1.62004/05 10,346 23,358 33,704 -0.6 1,485 1,142 2,627 -0.52005/06 10,267 23,913 34,180 1.4 1,495 1,211 2,706 3.02006/07 10,119 24,254 34,373 0.6 1,499 1,277 2,776 2.62007/08 9,937 24,415 34,352 -0.1 1,466 1,300 2,766 -0.42008/09 9,779 24,408 34,187 -0.5 1,428 1,306 2,734 -1.22009/10 9,588 24,104 33,692 -1.4 1,377 1,303 2,680 -2.02010/11 9,363 23,995 33,358 -1.0 1,322 1,280 2,602 -2.92011/12 9,252 24,238 33,490 0.4 1,303 1,314 2,617 0.6
Notes:
(3) Data are collected on School Data Collection Form 1601.(2) Administrators include: Principals, Vice-Principals, and Directors of Instruction.
(1) Teachers include: Regular Classroom Teachers, Supervisors of Instruction, Teacher Consultants, Co-ordinators, Helping Teachers, Other Instructional Support, Testing & Assessment – Professional Staff, Department Heads, and Teachers who have administration duty but are not Department Heads.
Page 366 EDU-2013-00071 - PHASE 1
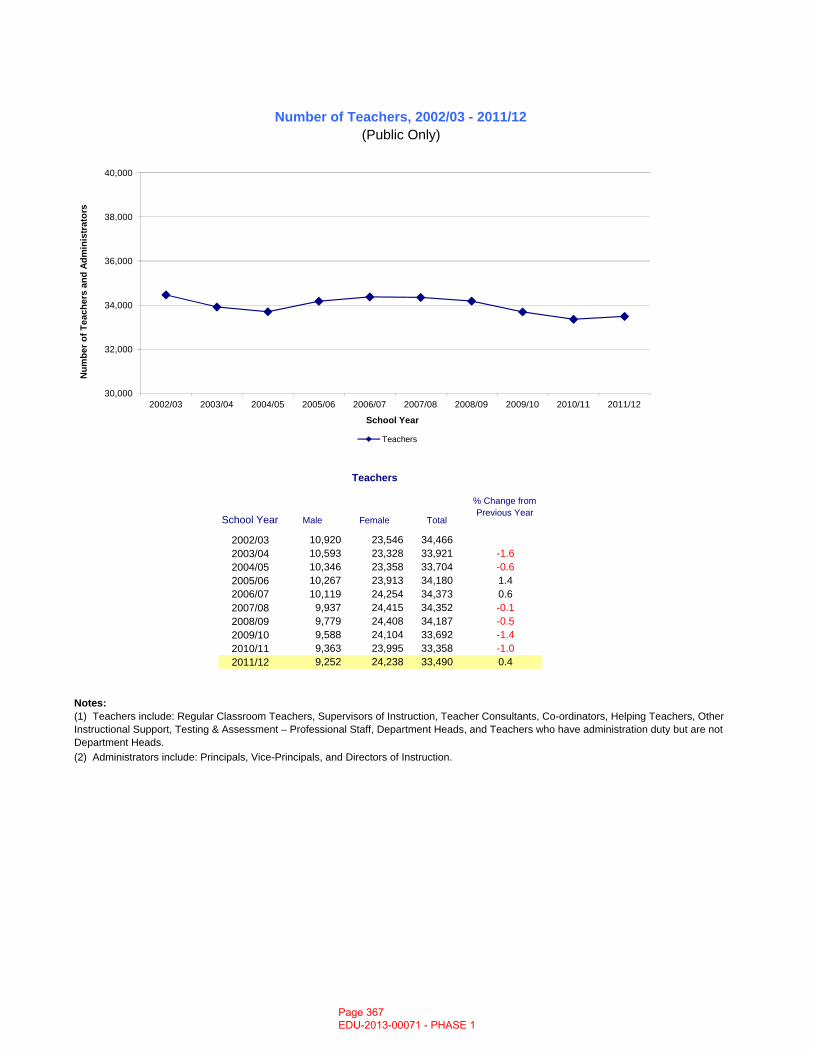
Teachers
Male Female Total
% Change from Previous Year
2002/03 10,920 23,546 34,4662003/04 10,593 23,328 33,921 -1.62004/05 10,346 23,358 33,704 -0.62005/06 10,267 23,913 34,180 1.4
School Year
Number of Teachers, 2002/03 - 2011/12(Public Only)
30,000
32,000
34,000
36,000
38,000
40,000
2002/03 2003/04 2004/05 2005/06 2006/07 2007/08 2008/09 2009/10 2010/11 2011/12
Num
ber o
f Tea
cher
s an
d Ad
min
istr
ator
s
School Year
Teachers
, , ,2006/07 10,119 24,254 34,373 0.62007/08 9,937 24,415 34,352 -0.12008/09 9,779 24,408 34,187 -0.52009/10 9,588 24,104 33,692 -1.42010/11 9,363 23,995 33,358 -1.02011/12 9,252 24,238 33,490 0.4
Notes:
(2) Administrators include: Principals, Vice-Principals, and Directors of Instruction.
(1) Teachers include: Regular Classroom Teachers, Supervisors of Instruction, Teacher Consultants, Co-ordinators, Helping Teachers, Other Instructional Support, Testing & Assessment – Professional Staff, Department Heads, and Teachers who have administration duty but are not Department Heads.
Page 367 EDU-2013-00071 - PHASE 1
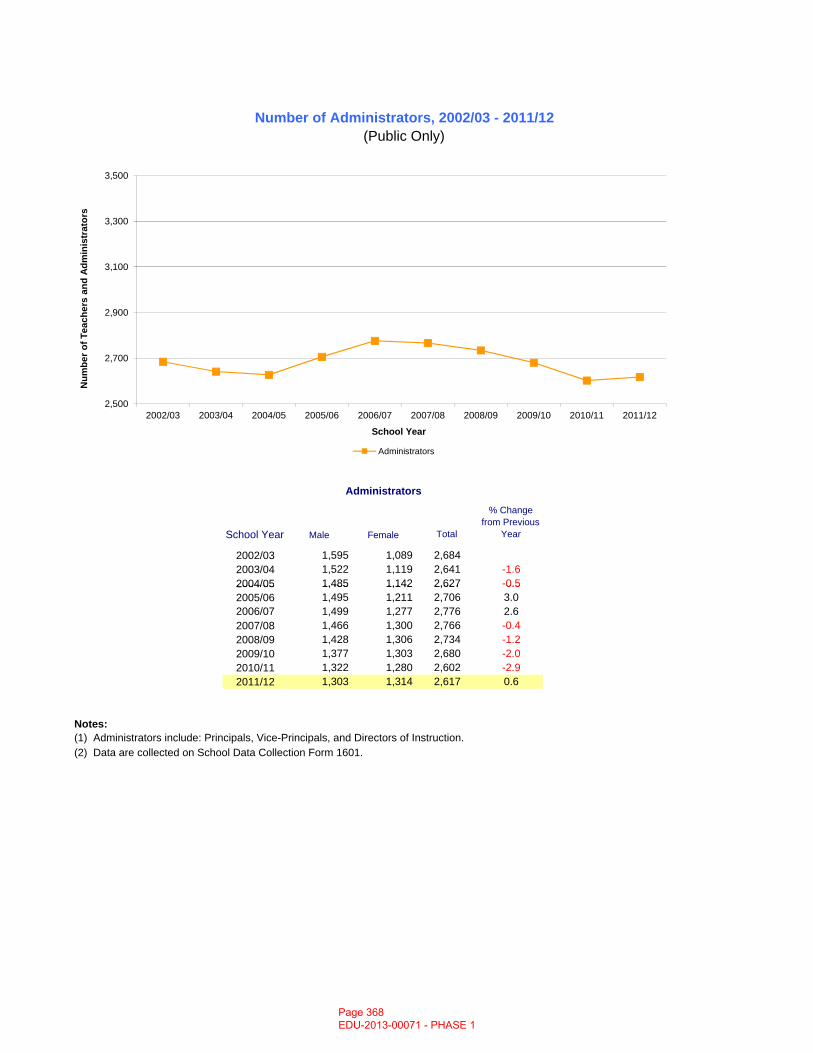
Administrators
Male Female Total
% Change from Previous
Year
2002/03 1,595 1,089 2,6842003/04 1,522 1,119 2,641 -1.62004/05 1,485 1,142 2,627 -0.5
Number of Administrators, 2002/03 - 2011/12(Public Only)
School Year
2,500
2,700
2,900
3,100
3,300
3,500
2002/03 2003/04 2004/05 2005/06 2006/07 2007/08 2008/09 2009/10 2010/11 2011/12
Num
ber o
f Tea
cher
s an
d A
dmin
istr
ator
s
School Year
Administrators
2004/05 1,485 1,142 2,627 0.52005/06 1,495 1,211 2,706 3.02006/07 1,499 1,277 2,776 2.62007/08 1,466 1,300 2,766 -0.42008/09 1,428 1,306 2,734 -1.22009/10 1,377 1,303 2,680 -2.02010/11 1,322 1,280 2,602 -2.92011/12 1,303 1,314 2,617 0.6
Notes:
(2) Data are collected on School Data Collection Form 1601.(1) Administrators include: Principals, Vice-Principals, and Directors of Instruction.
Page 368 EDU-2013-00071 - PHASE 1
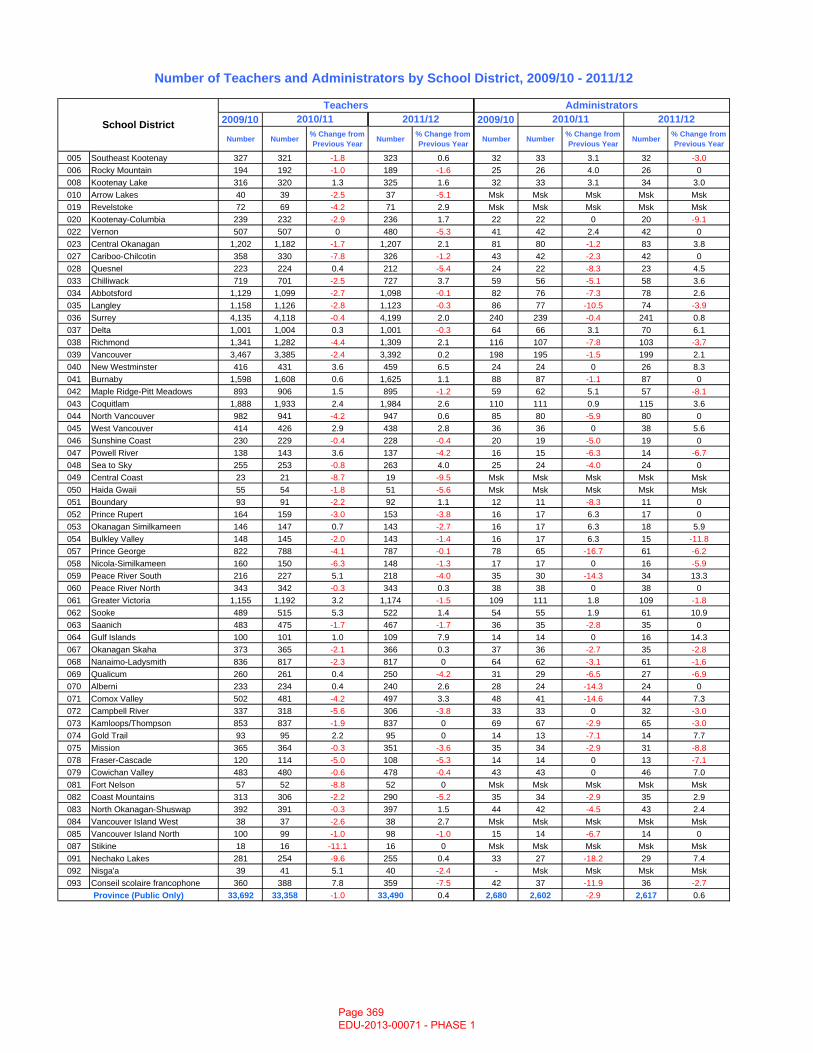
2009/10 2009/10
Number Number % Change from Previous Year Number % Change from
Previous Year Number Number % Change from Previous Year Number % Change from
Previous Year
005 Southeast Kootenay 327 321 -1.8 323 0.6 32 33 3.1 32 -3.0006 Rocky Mountain 194 192 -1.0 189 -1.6 25 26 4.0 26 0008 Kootenay Lake 316 320 1.3 325 1.6 32 33 3.1 34 3.0010 Arrow Lakes 40 39 -2.5 37 -5.1 Msk Msk Msk Msk Msk019 Revelstoke 72 69 -4.2 71 2.9 Msk Msk Msk Msk Msk020 Kootenay-Columbia 239 232 -2.9 236 1.7 22 22 0 20 -9.1022 Vernon 507 507 0 480 -5.3 41 42 2.4 42 0023 Central Okanagan 1,202 1,182 -1.7 1,207 2.1 81 80 -1.2 83 3.8027 Cariboo-Chilcotin 358 330 -7.8 326 -1.2 43 42 -2.3 42 0028 Quesnel 223 224 0.4 212 -5.4 24 22 -8.3 23 4.5033 Chilliwack 719 701 -2.5 727 3.7 59 56 -5.1 58 3.6034 Abbotsford 1,129 1,099 -2.7 1,098 -0.1 82 76 -7.3 78 2.6035 Langley 1,158 1,126 -2.8 1,123 -0.3 86 77 -10.5 74 -3.9036 Surrey 4,135 4,118 -0.4 4,199 2.0 240 239 -0.4 241 0.8037 Delta 1,001 1,004 0.3 1,001 -0.3 64 66 3.1 70 6.1038 Richmond 1,341 1,282 -4.4 1,309 2.1 116 107 -7.8 103 -3.7039 Vancouver 3,467 3,385 -2.4 3,392 0.2 198 195 -1.5 199 2.1040 New Westminster 416 431 3.6 459 6.5 24 24 0 26 8.3041 Burnaby 1,598 1,608 0.6 1,625 1.1 88 87 -1.1 87 0042 Maple Ridge-Pitt Meadows 893 906 1.5 895 -1.2 59 62 5.1 57 -8.1043 Coquitlam 1,888 1,933 2.4 1,984 2.6 110 111 0.9 115 3.6044 North Vancouver 982 941 -4.2 947 0.6 85 80 -5.9 80 0045 West Vancouver 414 426 2.9 438 2.8 36 36 0 38 5.6046 Sunshine Coast 230 229 -0.4 228 -0.4 20 19 -5.0 19 0047 Powell River 138 143 3.6 137 -4.2 16 15 -6.3 14 -6.7048 Sea to Sky 255 253 -0.8 263 4.0 25 24 -4.0 24 0049 Central Coast 23 21 -8.7 19 -9.5 Msk Msk Msk Msk Msk050 Haida Gwaii 55 54 -1.8 51 -5.6 Msk Msk Msk Msk Msk051 Boundary 93 91 -2.2 92 1.1 12 11 -8.3 11 0052 Prince Rupert 164 159 -3.0 153 -3.8 16 17 6.3 17 0053 Okanagan Similkameen 146 147 0.7 143 -2.7 16 17 6.3 18 5.9054 Bulkley Valley 148 145 -2.0 143 -1.4 16 17 6.3 15 -11.8057 Prince George 822 788 -4.1 787 -0.1 78 65 -16.7 61 -6.2058 Nicola-Similkameen 160 150 -6.3 148 -1.3 17 17 0 16 -5.9059 Peace River South 216 227 5.1 218 -4.0 35 30 -14.3 34 13.3060 Peace River North 343 342 -0.3 343 0.3 38 38 0 38 0061 Greater Victoria 1,155 1,192 3.2 1,174 -1.5 109 111 1.8 109 -1.8062 Sooke 489 515 5.3 522 1.4 54 55 1.9 61 10.9063 Saanich 483 475 -1.7 467 -1.7 36 35 -2.8 35 0064 Gulf Islands 100 101 1.0 109 7.9 14 14 0 16 14.3067 Okanagan Skaha 373 365 -2.1 366 0.3 37 36 -2.7 35 -2.8068 Nanaimo-Ladysmith 836 817 -2.3 817 0 64 62 -3.1 61 -1.6069 Qualicum 260 261 0.4 250 -4.2 31 29 -6.5 27 -6.9070 Alberni 233 234 0.4 240 2.6 28 24 -14.3 24 0071 Comox Valley 502 481 -4.2 497 3.3 48 41 -14.6 44 7.3072 Campbell River 337 318 -5.6 306 -3.8 33 33 0 32 -3.0073 Kamloops/Thompson 853 837 -1.9 837 0 69 67 -2.9 65 -3.0074 Gold Trail 93 95 2.2 95 0 14 13 -7.1 14 7.7075 Mission 365 364 -0.3 351 -3.6 35 34 -2.9 31 -8.8078 Fraser-Cascade 120 114 -5.0 108 -5.3 14 14 0 13 -7.1079 Cowichan Valley 483 480 -0.6 478 -0.4 43 43 0 46 7.0081 Fort Nelson 57 52 -8.8 52 0 Msk Msk Msk Msk Msk082 Coast Mountains 313 306 -2.2 290 -5.2 35 34 -2.9 35 2.9083 North Okanagan-Shuswap 392 391 -0.3 397 1.5 44 42 -4.5 43 2.4084 Vancouver Island West 38 37 -2.6 38 2.7 Msk Msk Msk Msk Msk085 Vancouver Island North 100 99 -1.0 98 -1.0 15 14 -6.7 14 0087 Stikine 18 16 -11.1 16 0 Msk Msk Msk Msk Msk091 Nechako Lakes 281 254 -9.6 255 0.4 33 27 -18.2 29 7.4092 Nisga'a 39 41 5.1 40 -2.4 - Msk Msk Msk Msk093 Conseil scolaire francophone 360 388 7.8 359 -7.5 42 37 -11.9 36 -2.7
33,692 33,358 -1.0 33,490 0.4 2,680 2,602 -2.9 2,617 0.6Province (Public Only)
Number of Teachers and Administrators by School District, 2009/10 - 2011/12
School District
Teachers Administrators2010/11 2011/12 2010/11 2011/12
Page 369 EDU-2013-00071 - PHASE 1
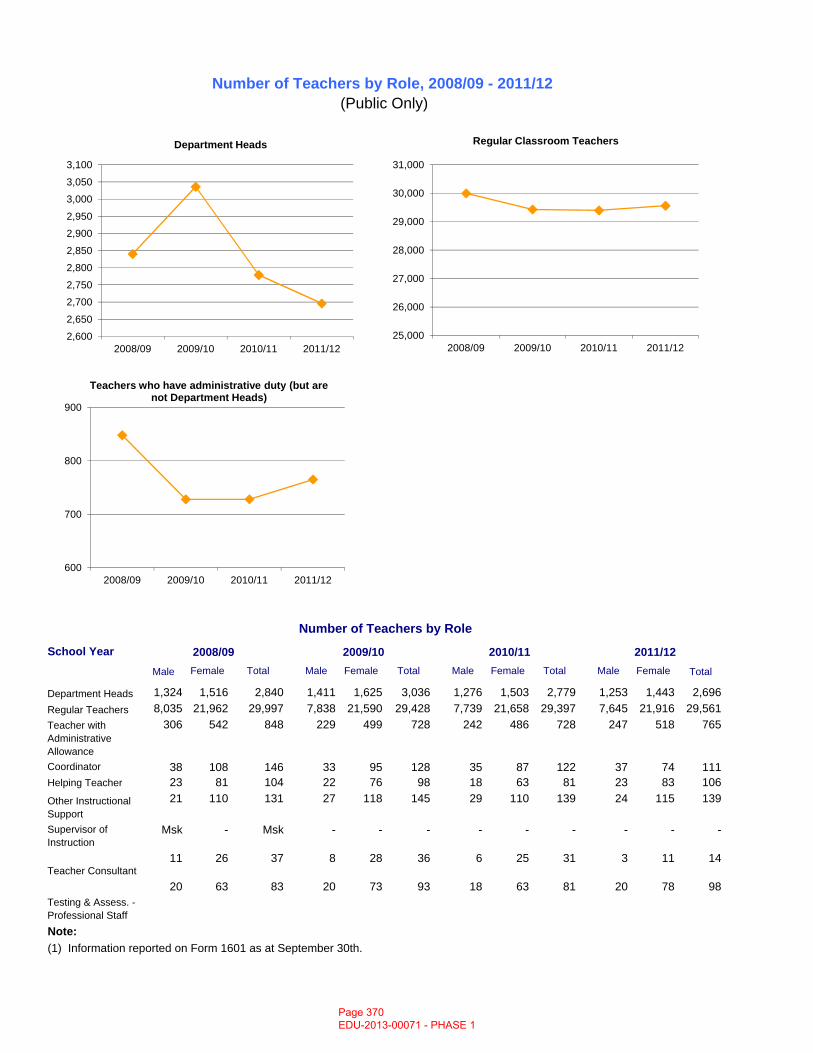
Number of Teachers by Role, 2008/09 - 2011/12 (Public Only)
25,000
26,000
27,000
28,000
29,000
30,000
31,000
2008/09 2009/10 2010/11 2011/12
Regular Classroom Teachers
700
800
900
Teachers who have administrative duty (but are not Department Heads)
2,600
2,650
2,700
2,750
2,800
2,850
2,900
2,950
3,000
3,050
3,100
2008/09 2009/10 2010/11 2011/12
Department Heads
Male Female Total Male Female Total Male Female Total Male Female Total
Department Heads 1,324 1,516 2,840 1,411 1,625 3,036 1,276 1,503 2,779 1,253 1,443 2,696Regular Teachers 8,035 21,962 29,997 7,838 21,590 29,428 7,739 21,658 29,397 7,645 21,916 29,561Teacher withAdministrative Allowance
306 542 848 229 499 728 242 486 728 247 518 765
Coordinator 38 108 146 33 95 128 35 87 122 37 74 111Helping Teacher 23 81 104 22 76 98 18 63 81 23 83 106Other Instructional Support
21 110 131 27 118 145 29 110 139 24 115 139
Supervisor of Instruction
Msk - Msk - - - - - - - - -
Teacher Consultant11 26 37 8 28 36 6 25 31 3 11 14
Testing & Assess. - Professional Staff
20 63 83 20 73 93 18 63 81 20 78 98
Note:(1) Information reported on Form 1601 as at September 30th.
Number of Teachers by Role
School Year 2008/09 2009/10 2010/11 2011/12
6002008/09 2009/10 2010/11 2011/12
Page 370 EDU-2013-00071 - PHASE 1
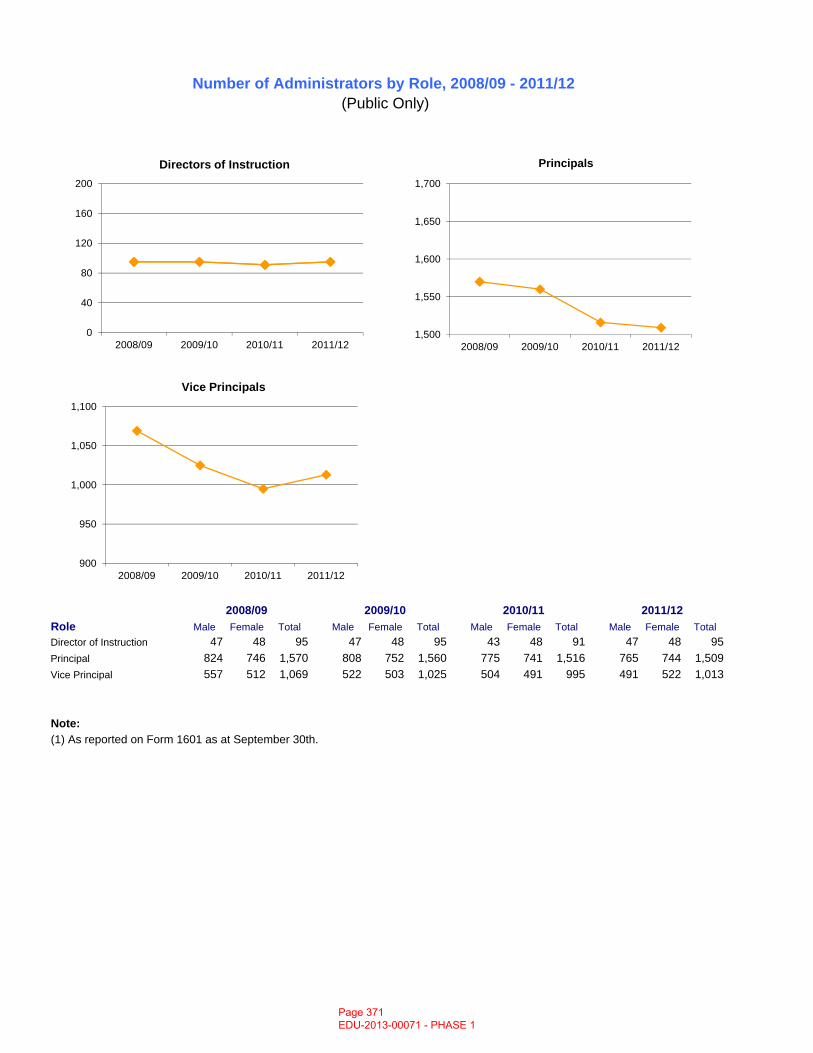
Number of Administrators by Role, 2008/09 - 2011/12 (Public Only)
1,500
1,550
1,600
1,650
1,700
2008/09 2009/10 2010/11 2011/12
Principals
900
950
1,000
1,050
1,100
2008/09 2009/10 2010/11 2011/12
Vice Principals
0
40
80
120
160
200
2008/09 2009/10 2010/11 2011/12
Directors of Instruction
Male Female Total Male Female Total Male Female Total Male Female TotalDirector of Instruction 47 48 95 47 48 95 43 48 91 47 48 95Principal 824 746 1,570 808 752 1,560 775 741 1,516 765 744 1,509Vice Principal 557 512 1,069 522 503 1,025 504 491 995 491 522 1,013
Note:(1) As reported on Form 1601 as at September 30th.
2011/12Role
2008/09 2009/10 2010/11
9002008/09 2009/10 2010/11 2011/12
Page 371 EDU-2013-00071 - PHASE 1
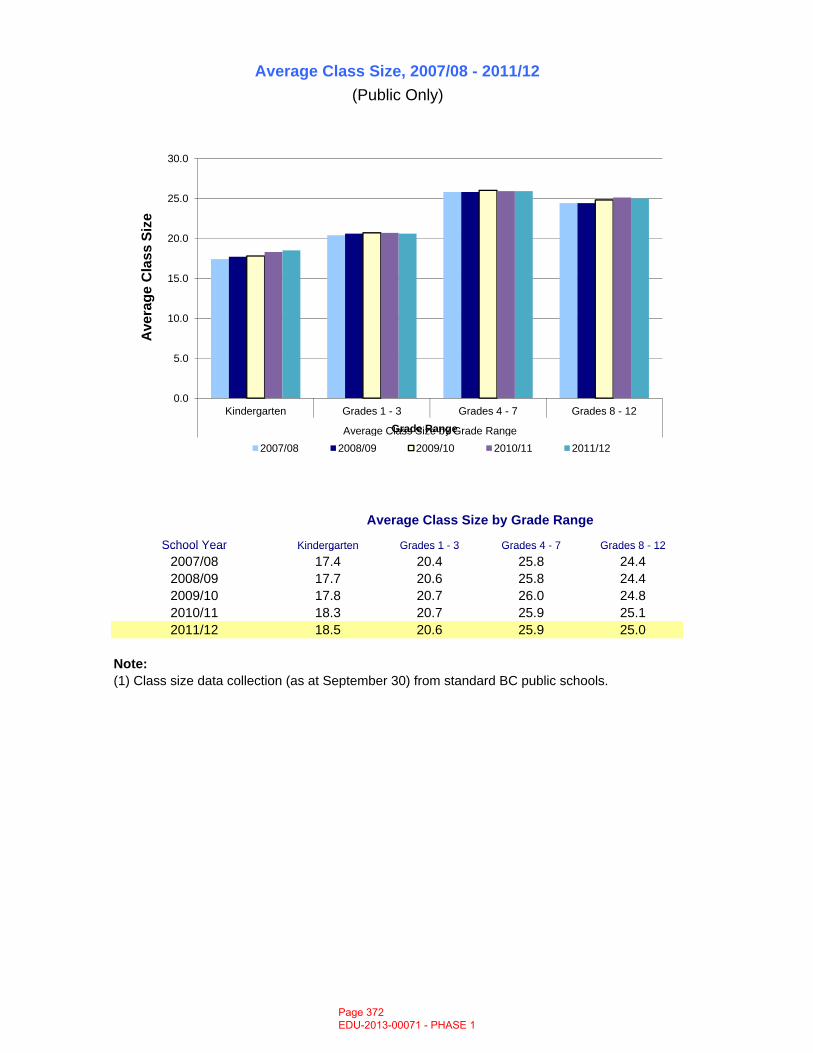
Kindergarten Grades 1 - 3 Grades 4 - 7 Grades 8 - 12
Average Class Size, 2007/08 - 2011/12(Public Only)
Average Class Size by Grade Range
School Year
0.0
5.0
10.0
15.0
20.0
25.0
30.0
Kindergarten Grades 1 - 3 Grades 4 - 7 Grades 8 - 12
Average Class Size by Grade Range
Ave
rage
Cla
ss S
ize
Grade Range
2007/08 2008/09 2009/10 2010/11 2011/12
Kindergarten Grades 1 3 Grades 4 7 Grades 8 122007/08 17.4 20.4 25.8 24.42008/09 17.7 20.6 25.8 24.42009/10 17.8 20.7 26.0 24.82010/11 18.3 20.7 25.9 25.12011/12 18.5 20.6 25.9 25.0
Note:(1) Class size data collection (as at September 30) from standard BC public schools.
School Year
Page 372 EDU-2013-00071 - PHASE 1
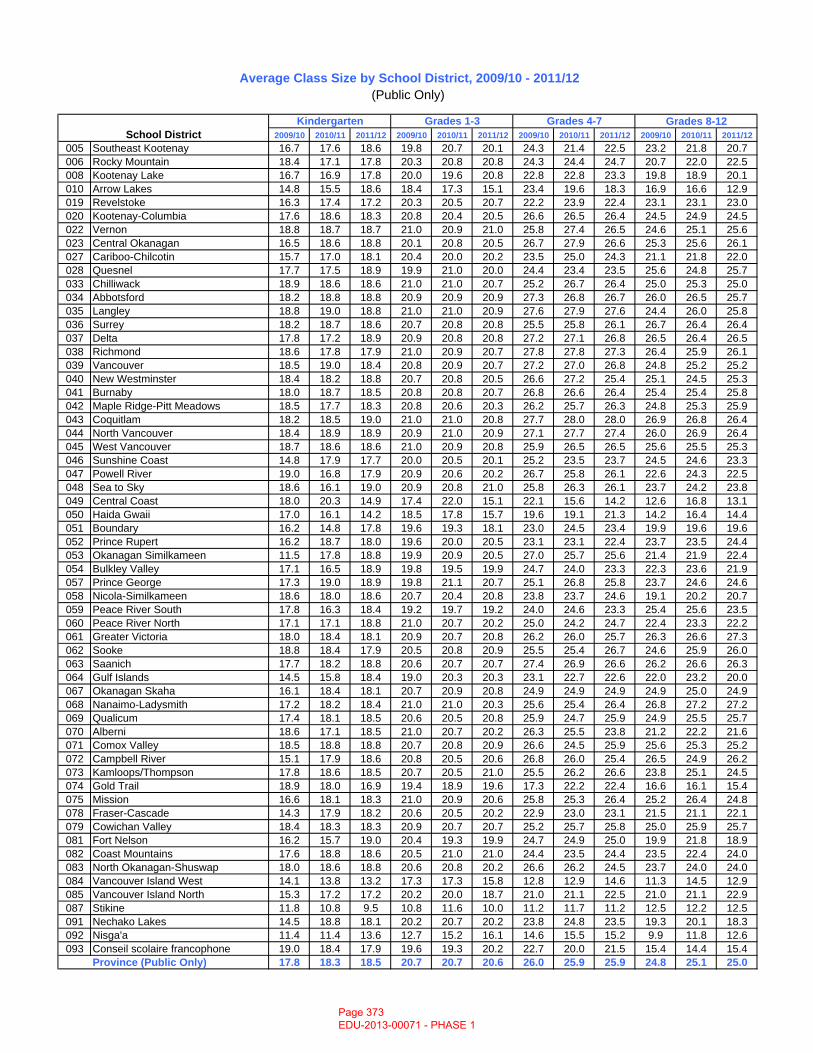
2009/10 2010/11 2011/12 2009/10 2010/11 2011/12 2009/10 2010/11 2011/12 2009/10 2010/11 2011/12005 Southeast Kootenay 16.7 17.6 18.6 19.8 20.7 20.1 24.3 21.4 22.5 23.2 21.8 20.7006 Rocky Mountain 18.4 17.1 17.8 20.3 20.8 20.8 24.3 24.4 24.7 20.7 22.0 22.5008 Kootenay Lake 16.7 16.9 17.8 20.0 19.6 20.8 22.8 22.8 23.3 19.8 18.9 20.1010 Arrow Lakes 14.8 15.5 18.6 18.4 17.3 15.1 23.4 19.6 18.3 16.9 16.6 12.9019 Revelstoke 16.3 17.4 17.2 20.3 20.5 20.7 22.2 23.9 22.4 23.1 23.1 23.0020 Kootenay-Columbia 17.6 18.6 18.3 20.8 20.4 20.5 26.6 26.5 26.4 24.5 24.9 24.5022 Vernon 18.8 18.7 18.7 21.0 20.9 21.0 25.8 27.4 26.5 24.6 25.1 25.6023 Central Okanagan 16.5 18.6 18.8 20.1 20.8 20.5 26.7 27.9 26.6 25.3 25.6 26.1027 Cariboo-Chilcotin 15.7 17.0 18.1 20.4 20.0 20.2 23.5 25.0 24.3 21.1 21.8 22.0028 Quesnel 17.7 17.5 18.9 19.9 21.0 20.0 24.4 23.4 23.5 25.6 24.8 25.7033 Chilliwack 18.9 18.6 18.6 21.0 21.0 20.7 25.2 26.7 26.4 25.0 25.3 25.0034 Abbotsford 18.2 18.8 18.8 20.9 20.9 20.9 27.3 26.8 26.7 26.0 26.5 25.7035 Langley 18.8 19.0 18.8 21.0 21.0 20.9 27.6 27.9 27.6 24.4 26.0 25.8036 Surrey 18.2 18.7 18.6 20.7 20.8 20.8 25.5 25.8 26.1 26.7 26.4 26.4037 Delta 17.8 17.2 18.9 20.9 20.8 20.8 27.2 27.1 26.8 26.5 26.4 26.5038 Richmond 18.6 17.8 17.9 21.0 20.9 20.7 27.8 27.8 27.3 26.4 25.9 26.1039 Vancouver 18.5 19.0 18.4 20.8 20.9 20.7 27.2 27.0 26.8 24.8 25.2 25.2040 New Westminster 18.4 18.2 18.8 20.7 20.8 20.5 26.6 27.2 25.4 25.1 24.5 25.3041 Burnaby 18.0 18.7 18.5 20.8 20.8 20.7 26.8 26.6 26.4 25.4 25.4 25.8042 Maple Ridge-Pitt Meadows 18.5 17.7 18.3 20.8 20.6 20.3 26.2 25.7 26.3 24.8 25.3 25.9043 Coquitlam 18.2 18.5 19.0 21.0 21.0 20.8 27.7 28.0 28.0 26.9 26.8 26.4044 North Vancouver 18.4 18.9 18.9 20.9 21.0 20.9 27.1 27.7 27.4 26.0 26.9 26.4045 West Vancouver 18.7 18.6 18.6 21.0 20.9 20.8 25.9 26.5 26.5 25.6 25.5 25.3046 Sunshine Coast 14.8 17.9 17.7 20.0 20.5 20.1 25.2 23.5 23.7 24.5 24.6 23.3047 Powell River 19.0 16.8 17.9 20.9 20.6 20.2 26.7 25.8 26.1 22.6 24.3 22.5048 Sea to Sky 18.6 16.1 19.0 20.9 20.8 21.0 25.8 26.3 26.1 23.7 24.2 23.8049 Central Coast 18.0 20.3 14.9 17.4 22.0 15.1 22.1 15.6 14.2 12.6 16.8 13.1050 Haida Gwaii 17.0 16.1 14.2 18.5 17.8 15.7 19.6 19.1 21.3 14.2 16.4 14.4051 Boundary 16.2 14.8 17.8 19.6 19.3 18.1 23.0 24.5 23.4 19.9 19.6 19.6052 Prince Rupert 16.2 18.7 18.0 19.6 20.0 20.5 23.1 23.1 22.4 23.7 23.5 24.4053 Okanagan Similkameen 11.5 17.8 18.8 19.9 20.9 20.5 27.0 25.7 25.6 21.4 21.9 22.4054 Bulkley Valley 17.1 16.5 18.9 19.8 19.5 19.9 24.7 24.0 23.3 22.3 23.6 21.9057 Prince George 17.3 19.0 18.9 19.8 21.1 20.7 25.1 26.8 25.8 23.7 24.6 24.6058 Nicola-Similkameen 18.6 18.0 18.6 20.7 20.4 20.8 23.8 23.7 24.6 19.1 20.2 20.7059 Peace River South 17.8 16.3 18.4 19.2 19.7 19.2 24.0 24.6 23.3 25.4 25.6 23.5060 Peace River North 17.1 17.1 18.8 21.0 20.7 20.2 25.0 24.2 24.7 22.4 23.3 22.2061 Greater Victoria 18.0 18.4 18.1 20.9 20.7 20.8 26.2 26.0 25.7 26.3 26.6 27.3062 Sooke 18.8 18.4 17.9 20.5 20.8 20.9 25.5 25.4 26.7 24.6 25.9 26.0063 Saanich 17.7 18.2 18.8 20.6 20.7 20.7 27.4 26.9 26.6 26.2 26.6 26.3064 Gulf Islands 14.5 15.8 18.4 19.0 20.3 20.3 23.1 22.7 22.6 22.0 23.2 20.0067 Okanagan Skaha 16.1 18.4 18.1 20.7 20.9 20.8 24.9 24.9 24.9 24.9 25.0 24.9068 Nanaimo-Ladysmith 17.2 18.2 18.4 21.0 21.0 20.3 25.6 25.4 26.4 26.8 27.2 27.2069 Qualicum 17.4 18.1 18.5 20.6 20.5 20.8 25.9 24.7 25.9 24.9 25.5 25.7070 Alberni 18.6 17.1 18.5 21.0 20.7 20.2 26.3 25.5 23.8 21.2 22.2 21.6071 Comox Valley 18.5 18.8 18.8 20.7 20.8 20.9 26.6 24.5 25.9 25.6 25.3 25.2072 Campbell River 15.1 17.9 18.6 20.8 20.5 20.6 26.8 26.0 25.4 26.5 24.9 26.2073 Kamloops/Thompson 17.8 18.6 18.5 20.7 20.5 21.0 25.5 26.2 26.6 23.8 25.1 24.5074 Gold Trail 18.9 18.0 16.9 19.4 18.9 19.6 17.3 22.2 22.4 16.6 16.1 15.4075 Mission 16.6 18.1 18.3 21.0 20.9 20.6 25.8 25.3 26.4 25.2 26.4 24.8078 Fraser-Cascade 14.3 17.9 18.2 20.6 20.5 20.2 22.9 23.0 23.1 21.5 21.1 22.1079 Cowichan Valley 18.4 18.3 18.3 20.9 20.7 20.7 25.2 25.7 25.8 25.0 25.9 25.7081 Fort Nelson 16.2 15.7 19.0 20.4 19.3 19.9 24.7 24.9 25.0 19.9 21.8 18.9082 Coast Mountains 17.6 18.8 18.6 20.5 21.0 21.0 24.4 23.5 24.4 23.5 22.4 24.0083 North Okanagan-Shuswap 18.0 18.6 18.8 20.6 20.8 20.2 26.6 26.2 24.5 23.7 24.0 24.0084 Vancouver Island West 14.1 13.8 13.2 17.3 17.3 15.8 12.8 12.9 14.6 11.3 14.5 12.9085 Vancouver Island North 15.3 17.2 17.2 20.2 20.0 18.7 21.0 21.1 22.5 21.0 21.1 22.9087 Stikine 11.8 10.8 9.5 10.8 11.6 10.0 11.2 11.7 11.2 12.5 12.2 12.5091 Nechako Lakes 14.5 18.8 18.1 20.2 20.7 20.2 23.8 24.8 23.5 19.3 20.1 18.3092 Nisga'a 11.4 11.4 13.6 12.7 15.2 16.1 14.6 15.5 15.2 9.9 11.8 12.6093 Conseil scolaire francophone 19.0 18.4 17.9 19.6 19.3 20.2 22.7 20.0 21.5 15.4 14.4 15.4
Province (Public Only) 17.8 18.3 18.5 20.7 20.7 20.6 26.0 25.9 25.9 24.8 25.1 25.0
Grades 8-12
Average Class Size by School District, 2009/10 - 2011/12
School DistrictKindergarten Grades 1-3 Grades 4-7
(Public Only)
Page 373 EDU-2013-00071 - PHASE 1
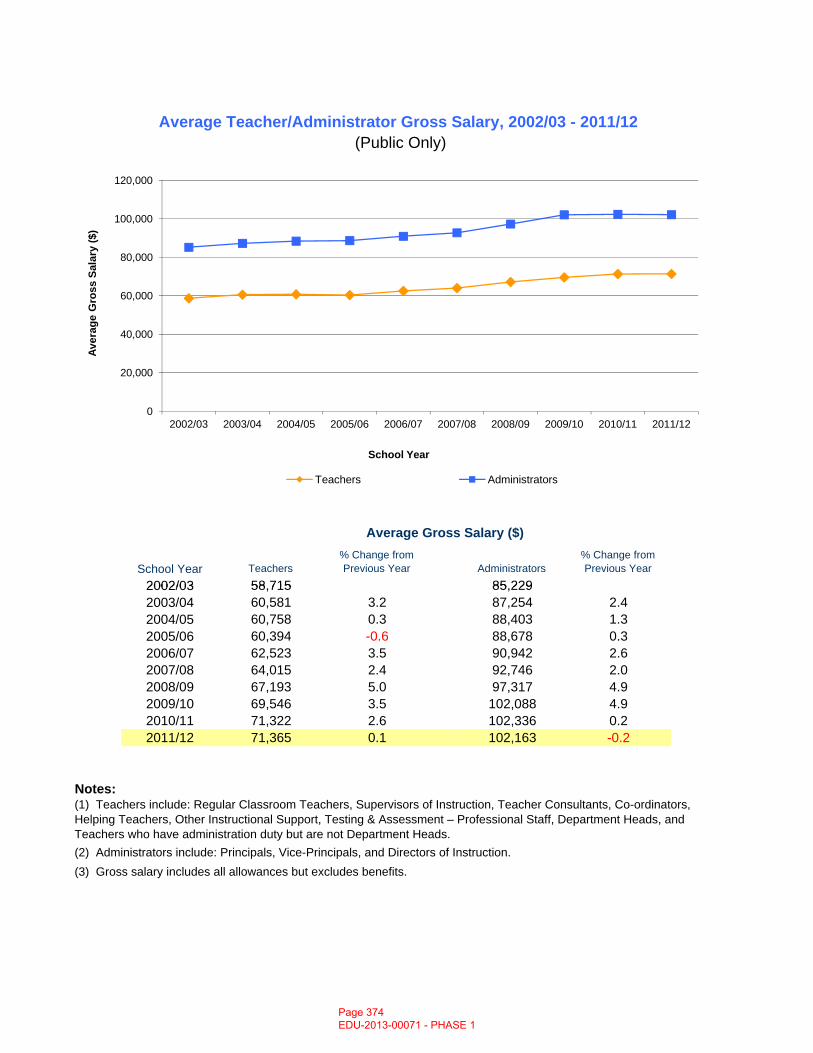
Teachers% Change from Previous Year Administrators
% Change from Previous Year
2002/03 58 715 85 229
Average Teacher/Administrator Gross Salary, 2002/03 - 2011/12 (Public Only)
School Year
Average Gross Salary ($)
0
20,000
40,000
60,000
80,000
100,000
120,000
2002/03 2003/04 2004/05 2005/06 2006/07 2007/08 2008/09 2009/10 2010/11 2011/12
Aver
age
Gro
ss S
alar
y ($
)
School Year
Teachers Administrators
2002/03 58,715 85,2292003/04 60,581 3.2 87,254 2.42004/05 60,758 0.3 88,403 1.32005/06 60,394 -0.6 88,678 0.32006/07 62,523 3.5 90,942 2.62007/08 64,015 2.4 92,746 2.02008/09 67,193 5.0 97,317 4.92009/10 69,546 3.5 102,088 4.92010/11 71,322 2.6 102,336 0.22011/12 71,365 0.1 102,163 -0.2
Notes:
(3) Gross salary includes all allowances but excludes benefits.(2) Administrators include: Principals, Vice-Principals, and Directors of Instruction.
(1) Teachers include: Regular Classroom Teachers, Supervisors of Instruction, Teacher Consultants, Co-ordinators, Helping Teachers, Other Instructional Support, Testing & Assessment – Professional Staff, Department Heads, and Teachers who have administration duty but are not Department Heads.
Page 374 EDU-2013-00071 - PHASE 1
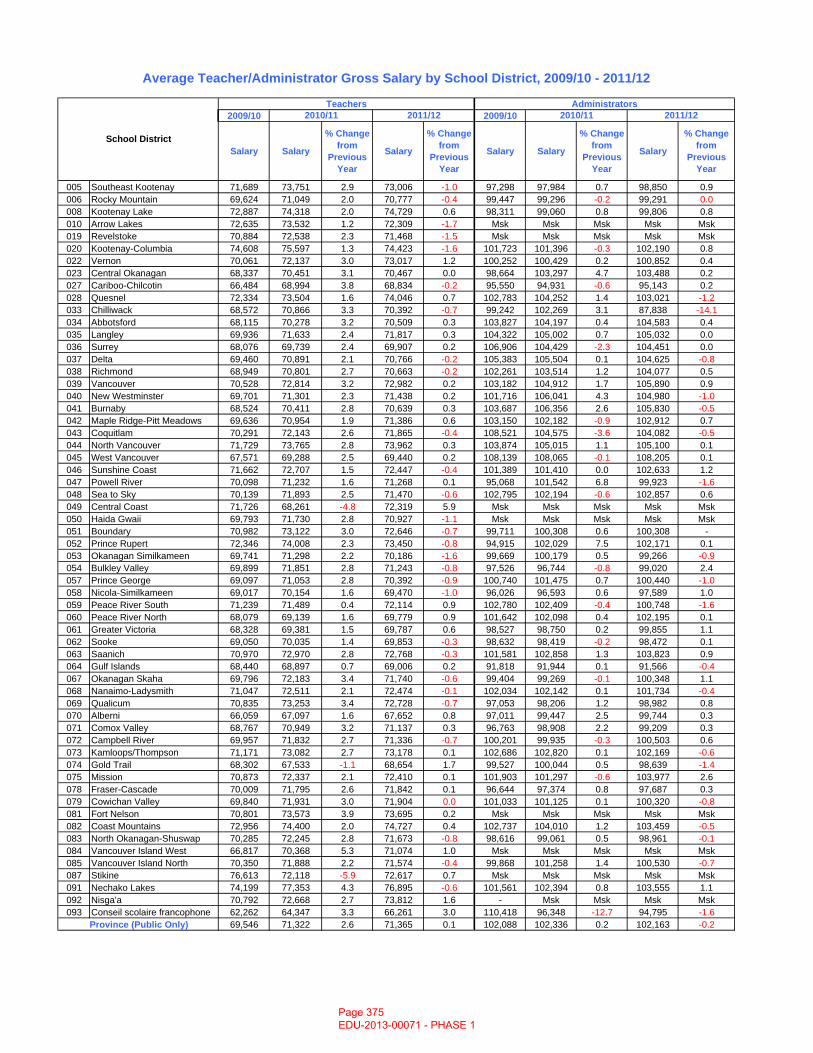
2009/10 2009/10
Salary Salary
% Change from
Previous Year
Salary
% Change from
Previous Year
Salary Salary
% Change from
Previous Year
Salary
% Change from
Previous Year
005 Southeast Kootenay 71,689 73,751 2.9 73,006 -1.0 97,298 97,984 0.7 98,850 0.9006 Rocky Mountain 69,624 71,049 2.0 70,777 -0.4 99,447 99,296 -0.2 99,291 0.0008 Kootenay Lake 72,887 74,318 2.0 74,729 0.6 98,311 99,060 0.8 99,806 0.8010 Arrow Lakes 72,635 73,532 1.2 72,309 -1.7 Msk Msk Msk Msk Msk019 Revelstoke 70,884 72,538 2.3 71,468 -1.5 Msk Msk Msk Msk Msk020 Kootenay-Columbia 74,608 75,597 1.3 74,423 -1.6 101,723 101,396 -0.3 102,190 0.8022 Vernon 70,061 72,137 3.0 73,017 1.2 100,252 100,429 0.2 100,852 0.4023 Central Okanagan 68,337 70,451 3.1 70,467 0.0 98,664 103,297 4.7 103,488 0.2027 Cariboo-Chilcotin 66,484 68,994 3.8 68,834 -0.2 95,550 94,931 -0.6 95,143 0.2028 Quesnel 72,334 73,504 1.6 74,046 0.7 102,783 104,252 1.4 103,021 -1.2033 Chilliwack 68,572 70,866 3.3 70,392 -0.7 99,242 102,269 3.1 87,838 -14.1034 Abbotsford 68,115 70,278 3.2 70,509 0.3 103,827 104,197 0.4 104,583 0.4035 Langley 69,936 71,633 2.4 71,817 0.3 104,322 105,002 0.7 105,032 0.0036 Surrey 68,076 69,739 2.4 69,907 0.2 106,906 104,429 -2.3 104,451 0.0037 Delta 69,460 70,891 2.1 70,766 -0.2 105,383 105,504 0.1 104,625 -0.8038 Richmond 68,949 70,801 2.7 70,663 -0.2 102,261 103,514 1.2 104,077 0.5039 Vancouver 70,528 72,814 3.2 72,982 0.2 103,182 104,912 1.7 105,890 0.9040 New Westminster 69,701 71,301 2.3 71,438 0.2 101,716 106,041 4.3 104,980 -1.0041 Burnaby 68,524 70,411 2.8 70,639 0.3 103,687 106,356 2.6 105,830 -0.5042 Maple Ridge-Pitt Meadows 69,636 70,954 1.9 71,386 0.6 103,150 102,182 -0.9 102,912 0.7043 Coquitlam 70,291 72,143 2.6 71,865 -0.4 108,521 104,575 -3.6 104,082 -0.5044 North Vancouver 71,729 73,765 2.8 73,962 0.3 103,874 105,015 1.1 105,100 0.1045 West Vancouver 67,571 69,288 2.5 69,440 0.2 108,139 108,065 -0.1 108,205 0.1046 Sunshine Coast 71,662 72,707 1.5 72,447 -0.4 101,389 101,410 0.0 102,633 1.2047 Powell River 70,098 71,232 1.6 71,268 0.1 95,068 101,542 6.8 99,923 -1.6048 Sea to Sky 70,139 71,893 2.5 71,470 -0.6 102,795 102,194 -0.6 102,857 0.6049 Central Coast 71,726 68,261 -4.8 72,319 5.9 Msk Msk Msk Msk Msk050 Haida Gwaii 69,793 71,730 2.8 70,927 -1.1 Msk Msk Msk Msk Msk051 Boundary 70,982 73,122 3.0 72,646 -0.7 99,711 100,308 0.6 100,308 -052 Prince Rupert 72,346 74,008 2.3 73,450 -0.8 94,915 102,029 7.5 102,171 0.1053 Okanagan Similkameen 69,741 71,298 2.2 70,186 -1.6 99,669 100,179 0.5 99,266 -0.9054 Bulkley Valley 69,899 71,851 2.8 71,243 -0.8 97,526 96,744 -0.8 99,020 2.4057 Prince George 69,097 71,053 2.8 70,392 -0.9 100,740 101,475 0.7 100,440 -1.0058 Nicola-Similkameen 69,017 70,154 1.6 69,470 -1.0 96,026 96,593 0.6 97,589 1.0059 Peace River South 71,239 71,489 0.4 72,114 0.9 102,780 102,409 -0.4 100,748 -1.6060 Peace River North 68,079 69,139 1.6 69,779 0.9 101,642 102,098 0.4 102,195 0.1061 Greater Victoria 68,328 69,381 1.5 69,787 0.6 98,527 98,750 0.2 99,855 1.1062 Sooke 69,050 70,035 1.4 69,853 -0.3 98,632 98,419 -0.2 98,472 0.1063 Saanich 70,970 72,970 2.8 72,768 -0.3 101,581 102,858 1.3 103,823 0.9064 Gulf Islands 68,440 68,897 0.7 69,006 0.2 91,818 91,944 0.1 91,566 -0.4067 Okanagan Skaha 69,796 72,183 3.4 71,740 -0.6 99,404 99,269 -0.1 100,348 1.1068 Nanaimo-Ladysmith 71,047 72,511 2.1 72,474 -0.1 102,034 102,142 0.1 101,734 -0.4069 Qualicum 70,835 73,253 3.4 72,728 -0.7 97,053 98,206 1.2 98,982 0.8070 Alberni 66,059 67,097 1.6 67,652 0.8 97,011 99,447 2.5 99,744 0.3071 Comox Valley 68,767 70,949 3.2 71,137 0.3 96,763 98,908 2.2 99,209 0.3072 Campbell River 69,957 71,832 2.7 71,336 -0.7 100,201 99,935 -0.3 100,503 0.6073 Kamloops/Thompson 71,171 73,082 2.7 73,178 0.1 102,686 102,820 0.1 102,169 -0.6074 Gold Trail 68,302 67,533 -1.1 68,654 1.7 99,527 100,044 0.5 98,639 -1.4075 Mission 70,873 72,337 2.1 72,410 0.1 101,903 101,297 -0.6 103,977 2.6078 Fraser-Cascade 70,009 71,795 2.6 71,842 0.1 96,644 97,374 0.8 97,687 0.3079 Cowichan Valley 69,840 71,931 3.0 71,904 0.0 101,033 101,125 0.1 100,320 -0.8081 Fort Nelson 70,801 73,573 3.9 73,695 0.2 Msk Msk Msk Msk Msk082 Coast Mountains 72,956 74,400 2.0 74,727 0.4 102,737 104,010 1.2 103,459 -0.5083 North Okanagan-Shuswap 70,285 72,245 2.8 71,673 -0.8 98,616 99,061 0.5 98,961 -0.1084 Vancouver Island West 66,817 70,368 5.3 71,074 1.0 Msk Msk Msk Msk Msk085 Vancouver Island North 70,350 71,888 2.2 71,574 -0.4 99,868 101,258 1.4 100,530 -0.7087 Stikine 76,613 72,118 -5.9 72,617 0.7 Msk Msk Msk Msk Msk091 Nechako Lakes 74,199 77,353 4.3 76,895 -0.6 101,561 102,394 0.8 103,555 1.1092 Nisga'a 70,792 72,668 2.7 73,812 1.6 - Msk Msk Msk Msk093 Conseil scolaire francophone 62,262 64,347 3.3 66,261 3.0 110,418 96,348 -12.7 94,795 -1.6
69,546 71,322 2.6 71,365 0.1 102,088 102,336 0.2 102,163 -0.2Province (Public Only)
Average Teacher/Administrator Gross Salary by School District, 2009/10 - 2011/12
School District
Teachers Administrators2010/11 2011/12 2010/11 2011/12
Page 375 EDU-2013-00071 - PHASE 1
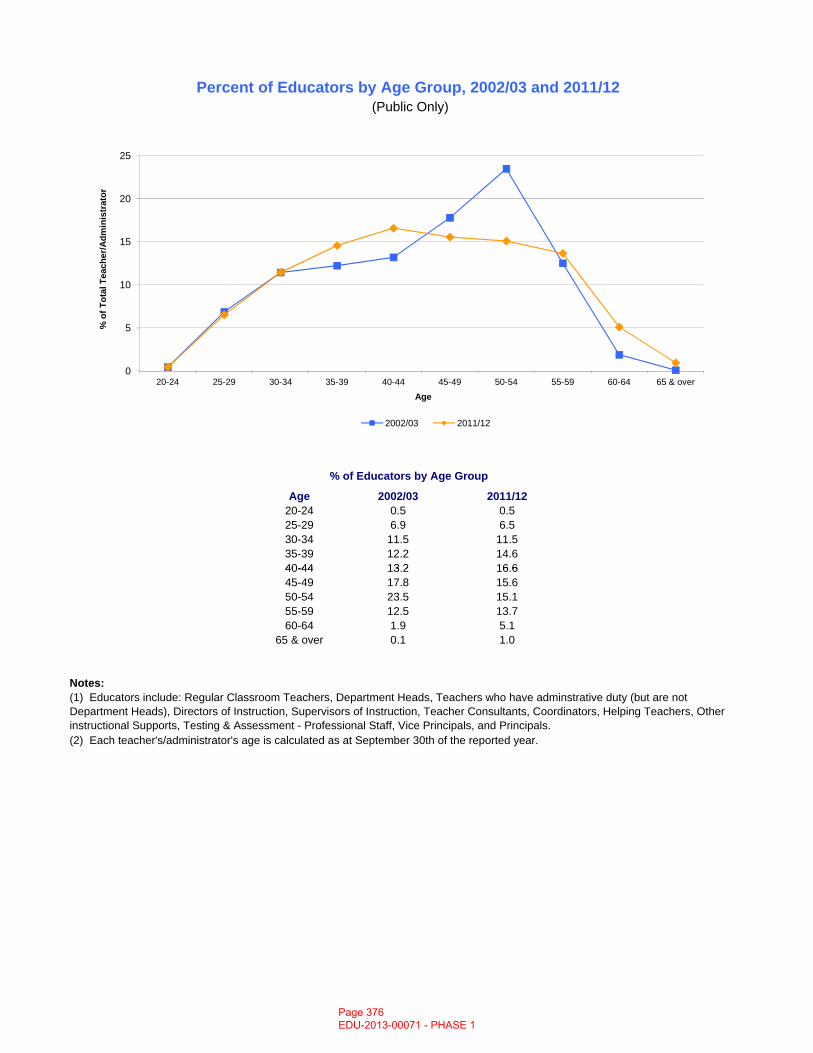
Age 2002/03 2011/1220-24 0.5 0.525-29 6.9 6.530-34 11.5 11.535-39 12.2 14.640-44 13 2 16 6
Percent of Educators by Age Group, 2002/03 and 2011/12 (Public Only)
% of Educators by Age Group
0
5
10
15
20
25
20-24 25-29 30-34 35-39 40-44 45-49 50-54 55-59 60-64 65 & over
% o
f Tot
al T
each
er/A
dmin
istr
ator
Age
2002/03 2011/12
40-44 13.2 16.645-49 17.8 15.650-54 23.5 15.155-59 12.5 13.760-64 1.9 5.1
65 & over 0.1 1.0
Notes:
(2) Each teacher's/administrator's age is calculated as at September 30th of the reported year.
(1) Educators include: Regular Classroom Teachers, Department Heads, Teachers who have adminstrative duty (but are not Department Heads), Directors of Instruction, Supervisors of Instruction, Teacher Consultants, Coordinators, Helping Teachers, Other instructional Supports, Testing & Assessment - Professional Staff, Vice Principals, and Principals.
Page 376 EDU-2013-00071 - PHASE 1
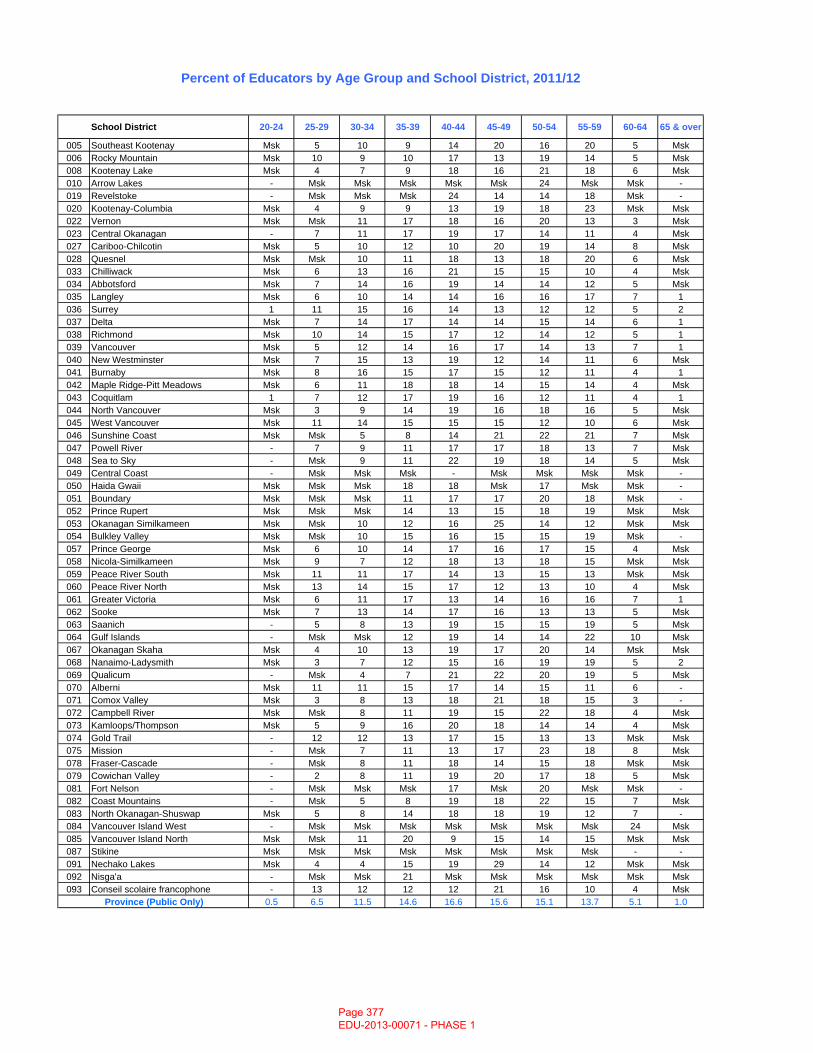
School District 20-24 25-29 30-34 35-39 40-44 45-49 50-54 55-59 60-64 65 & over
005 Southeast Kootenay Msk 5 10 9 14 20 16 20 5 Msk006 Rocky Mountain Msk 10 9 10 17 13 19 14 5 Msk008 Kootenay Lake Msk 4 7 9 18 16 21 18 6 Msk010 Arrow Lakes - Msk Msk Msk Msk Msk 24 Msk Msk -019 Revelstoke - Msk Msk Msk 24 14 14 18 Msk -020 Kootenay-Columbia Msk 4 9 9 13 19 18 23 Msk Msk022 Vernon Msk Msk 11 17 18 16 20 13 3 Msk023 Central Okanagan - 7 11 17 19 17 14 11 4 Msk027 Cariboo-Chilcotin Msk 5 10 12 10 20 19 14 8 Msk028 Quesnel Msk Msk 10 11 18 13 18 20 6 Msk033 Chilliwack Msk 6 13 16 21 15 15 10 4 Msk034 Abbotsford Msk 7 14 16 19 14 14 12 5 Msk035 Langley Msk 6 10 14 14 16 16 17 7 1036 Surrey 1 11 15 16 14 13 12 12 5 2037 Delta Msk 7 14 17 14 14 15 14 6 1038 Richmond Msk 10 14 15 17 12 14 12 5 1039 Vancouver Msk 5 12 14 16 17 14 13 7 1040 New Westminster Msk 7 15 13 19 12 14 11 6 Msk041 Burnaby Msk 8 16 15 17 15 12 11 4 1042 Maple Ridge-Pitt Meadows Msk 6 11 18 18 14 15 14 4 Msk043 Coquitlam 1 7 12 17 19 16 12 11 4 1044 North Vancouver Msk 3 9 14 19 16 18 16 5 Msk045 West Vancouver Msk 11 14 15 15 15 12 10 6 Msk046 Sunshine Coast Msk Msk 5 8 14 21 22 21 7 Msk047 Powell River - 7 9 11 17 17 18 13 7 Msk048 Sea to Sky - Msk 9 11 22 19 18 14 5 Msk049 Central Coast - Msk Msk Msk - Msk Msk Msk Msk -050 Haida Gwaii Msk Msk Msk 18 18 Msk 17 Msk Msk -051 Boundary Msk Msk Msk 11 17 17 20 18 Msk -052 Prince Rupert Msk Msk Msk 14 13 15 18 19 Msk Msk053 Okanagan Similkameen Msk Msk 10 12 16 25 14 12 Msk Msk054 Bulkley Valley Msk Msk 10 15 16 15 15 19 Msk -057 Prince George Msk 6 10 14 17 16 17 15 4 Msk058 Nicola-Similkameen Msk 9 7 12 18 13 18 15 Msk Msk059 Peace River South Msk 11 11 17 14 13 15 13 Msk Msk060 Peace River North Msk 13 14 15 17 12 13 10 4 Msk061 Greater Victoria Msk 6 11 17 13 14 16 16 7 1062 Sooke Msk 7 13 14 17 16 13 13 5 Msk063 Saanich - 5 8 13 19 15 15 19 5 Msk064 Gulf Islands - Msk Msk 12 19 14 14 22 10 Msk067 Okanagan Skaha Msk 4 10 13 19 17 20 14 Msk Msk068 Nanaimo-Ladysmith Msk 3 7 12 15 16 19 19 5 2069 Qualicum - Msk 4 7 21 22 20 19 5 Msk070 Alberni Msk 11 11 15 17 14 15 11 6 -071 Comox Valley Msk 3 8 13 18 21 18 15 3 -072 Campbell River Msk Msk 8 11 19 15 22 18 4 Msk073 Kamloops/Thompson Msk 5 9 16 20 18 14 14 4 Msk074 Gold Trail - 12 12 13 17 15 13 13 Msk Msk075 Mission - Msk 7 11 13 17 23 18 8 Msk078 Fraser-Cascade - Msk 8 11 18 14 15 18 Msk Msk079 Cowichan Valley - 2 8 11 19 20 17 18 5 Msk081 Fort Nelson - Msk Msk Msk 17 Msk 20 Msk Msk -082 Coast Mountains - Msk 5 8 19 18 22 15 7 Msk083 North Okanagan-Shuswap Msk 5 8 14 18 18 19 12 7 -084 Vancouver Island West - Msk Msk Msk Msk Msk Msk Msk 24 Msk085 Vancouver Island North Msk Msk 11 20 9 15 14 15 Msk Msk087 Stikine Msk Msk Msk Msk Msk Msk Msk Msk - -091 Nechako Lakes Msk 4 4 15 19 29 14 12 Msk Msk092 Nisga'a - Msk Msk 21 Msk Msk Msk Msk Msk Msk093 Conseil scolaire francophone - 13 12 12 12 21 16 10 4 Msk
0.5 6.5 11.5 14.6 16.6 15.6 15.1 13.7 5.1 1.0
Percent of Educators by Age Group and School District, 2011/12
Province (Public Only)
Page 377 EDU-2013-00071 - PHASE 1
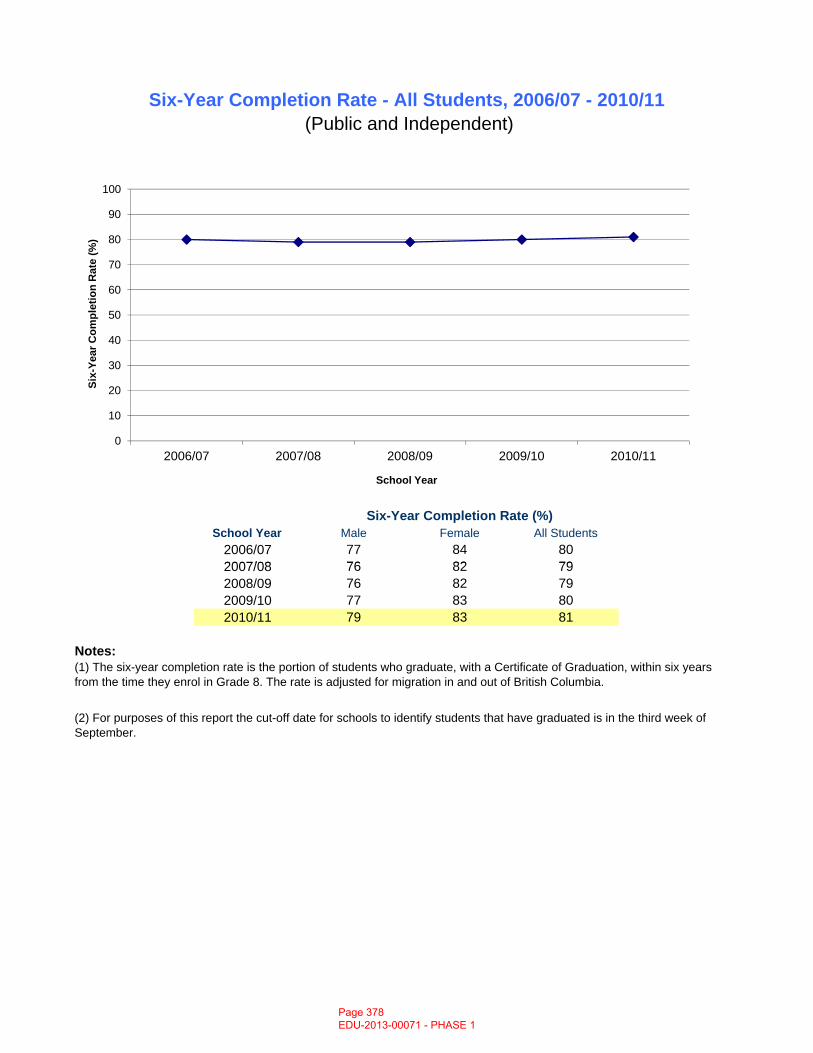
Male Female All Students2006/07 77 84 802007/08 76 82 79
Six-Year Completion Rate - All Students, 2006/07 - 2010/11 (Public and Independent)
Six-Year Completion Rate (%)School Year
0
10
20
30
40
50
60
70
80
90
100
2006/07 2007/08 2008/09 2009/10 2010/11
Six-
Year
Com
plet
ion
Rat
e (%
)
School Year
2007/08 76 82 792008/09 76 82 792009/10 77 83 802010/11 79 83 81
Notes:
(2) For purposes of this report the cut-off date for schools to identify students that have graduated is in the third week of September.
(1) The six-year completion rate is the portion of students who graduate, with a Certificate of Graduation, within six years from the time they enrol in Grade 8. The rate is adjusted for migration in and out of British Columbia.
Page 378 EDU-2013-00071 - PHASE 1
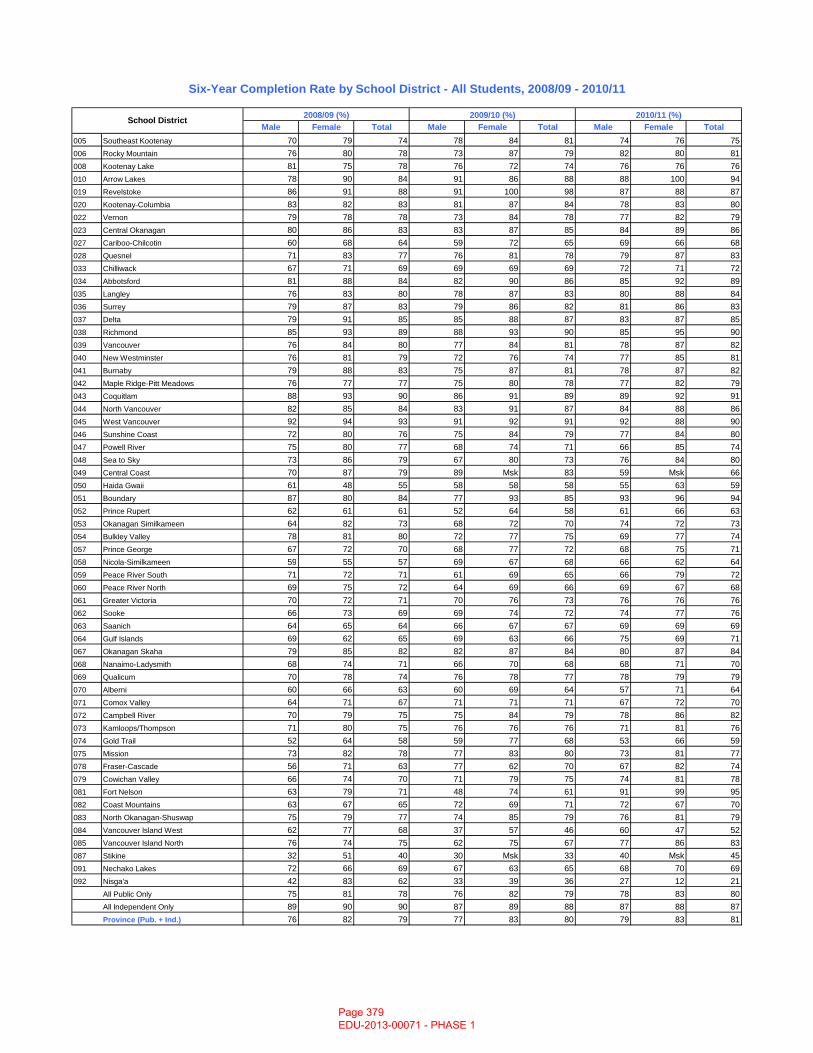
Male Female Total Male Female Total Male Female Total005 Southeast Kootenay 70 79 74 78 84 81 74 76 75006 Rocky Mountain 76 80 78 73 87 79 82 80 81008 Kootenay Lake 81 75 78 76 72 74 76 76 76010 Arrow Lakes 78 90 84 91 86 88 88 100 94019 Revelstoke 86 91 88 91 100 98 87 88 87020 Kootenay-Columbia 83 82 83 81 87 84 78 83 80022 Vernon 79 78 78 73 84 78 77 82 79023 Central Okanagan 80 86 83 83 87 85 84 89 86027 Cariboo-Chilcotin 60 68 64 59 72 65 69 66 68028 Quesnel 71 83 77 76 81 78 79 87 83033 Chilliwack 67 71 69 69 69 69 72 71 72034 Abbotsford 81 88 84 82 90 86 85 92 89035 Langley 76 83 80 78 87 83 80 88 84036 Surrey 79 87 83 79 86 82 81 86 83037 Delta 79 91 85 85 88 87 83 87 85038 Richmond 85 93 89 88 93 90 85 95 90039 Vancouver 76 84 80 77 84 81 78 87 82040 New Westminster 76 81 79 72 76 74 77 85 81041 Burnaby 79 88 83 75 87 81 78 87 82042 Maple Ridge-Pitt Meadows 76 77 77 75 80 78 77 82 79043 Coquitlam 88 93 90 86 91 89 89 92 91044 North Vancouver 82 85 84 83 91 87 84 88 86045 West Vancouver 92 94 93 91 92 91 92 88 90046 Sunshine Coast 72 80 76 75 84 79 77 84 80047 Powell River 75 80 77 68 74 71 66 85 74048 Sea to Sky 73 86 79 67 80 73 76 84 80049 Central Coast 70 87 79 89 Msk 83 59 Msk 66050 Haida Gwaii 61 48 55 58 58 58 55 63 59051 Boundary 87 80 84 77 93 85 93 96 94052 Prince Rupert 62 61 61 52 64 58 61 66 63053 Okanagan Similkameen 64 82 73 68 72 70 74 72 73054 Bulkley Valley 78 81 80 72 77 75 69 77 74057 Prince George 67 72 70 68 77 72 68 75 71058 Nicola Similkameen 59 55 57 69 67 68 66 62 64
2009/10 (%)
Six-Year Completion Rate by School District - All Students, 2008/09 - 2010/11
2008/09 (%)School District 2010/11 (%)
058 Nicola-Similkameen 59 55 57 69 67 68 66 62 64059 Peace River South 71 72 71 61 69 65 66 79 72060 Peace River North 69 75 72 64 69 66 69 67 68061 Greater Victoria 70 72 71 70 76 73 76 76 76062 Sooke 66 73 69 69 74 72 74 77 76063 Saanich 64 65 64 66 67 67 69 69 69064 Gulf Islands 69 62 65 69 63 66 75 69 71067 Okanagan Skaha 79 85 82 82 87 84 80 87 84068 Nanaimo-Ladysmith 68 74 71 66 70 68 68 71 70069 Qualicum 70 78 74 76 78 77 78 79 79070 Alberni 60 66 63 60 69 64 57 71 64071 Comox Valley 64 71 67 71 71 71 67 72 70072 Campbell River 70 79 75 75 84 79 78 86 82073 Kamloops/Thompson 71 80 75 76 76 76 71 81 76074 Gold Trail 52 64 58 59 77 68 53 66 59075 Mission 73 82 78 77 83 80 73 81 77078 Fraser-Cascade 56 71 63 77 62 70 67 82 74079 Cowichan Valley 66 74 70 71 79 75 74 81 78081 Fort Nelson 63 79 71 48 74 61 91 99 95082 Coast Mountains 63 67 65 72 69 71 72 67 70083 North Okanagan-Shuswap 75 79 77 74 85 79 76 81 79084 Vancouver Island West 62 77 68 37 57 46 60 47 52085 Vancouver Island North 76 74 75 62 75 67 77 86 83087 Stikine 32 51 40 30 Msk 33 40 Msk 45091 Nechako Lakes 72 66 69 67 63 65 68 70 69092 Nisga'a 42 83 62 33 39 36 27 12 21
All Public Only 75 81 78 76 82 79 78 83 80All Independent Only 89 90 90 87 89 88 87 88 87Province (Pub. + Ind.) 76 82 79 77 83 80 79 83 81
Page 379 EDU-2013-00071 - PHASE 1
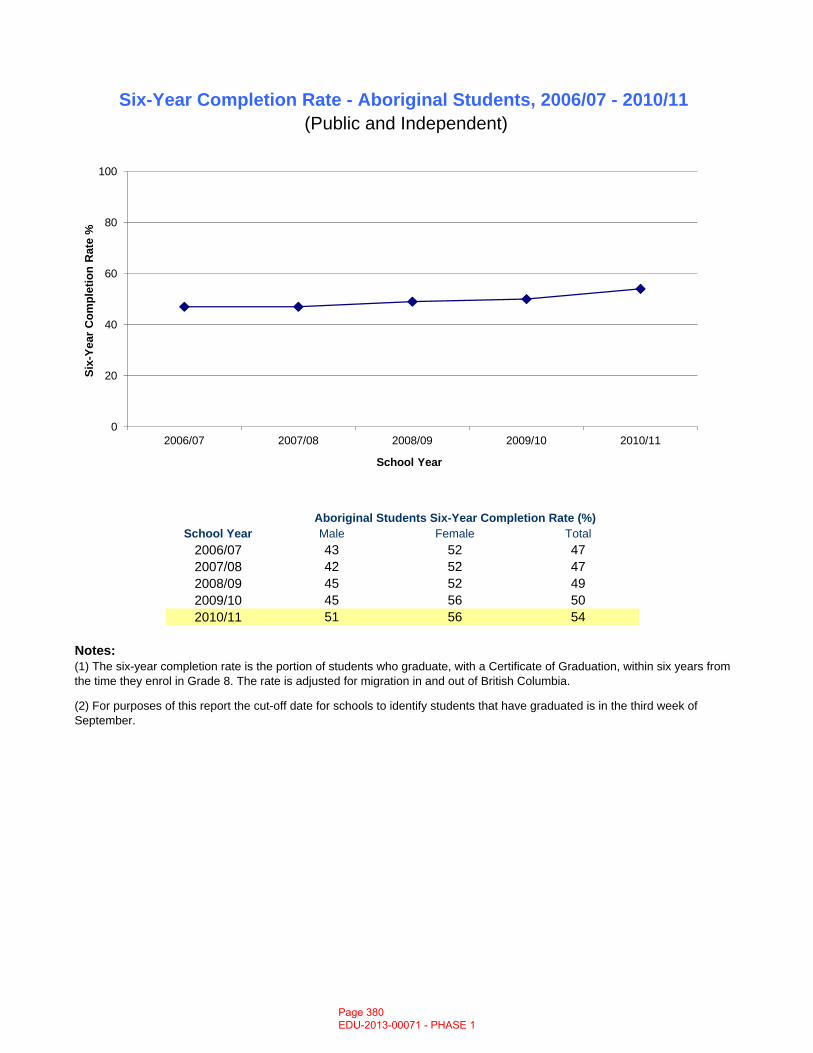
Male Female Total2006/07 43 52 472007/08 42 52 47
Six-Year Completion Rate - Aboriginal Students, 2006/07 - 2010/11 (Public and Independent)
School YearAboriginal Students Six-Year Completion Rate (%)
0
20
40
60
80
100
2006/07 2007/08 2008/09 2009/10 2010/11
Six-
Year
Com
plet
ion
Rat
e %
School Year
2007/08 42 52 472008/09 45 52 492009/10 45 56 502010/11 51 56 54
Notes:
(2) For purposes of this report the cut-off date for schools to identify students that have graduated is in the third week of September.
(1) The six-year completion rate is the portion of students who graduate, with a Certificate of Graduation, within six years from the time they enrol in Grade 8. The rate is adjusted for migration in and out of British Columbia.
Page 380 EDU-2013-00071 - PHASE 1
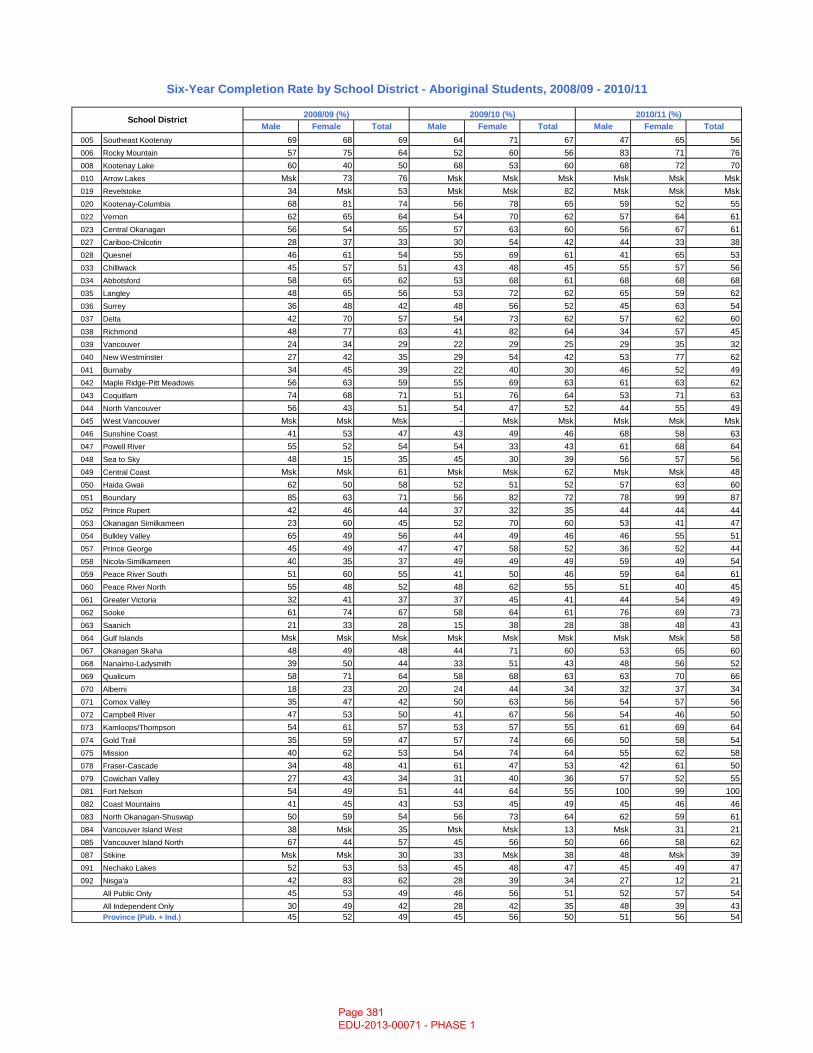
Male Female Total Male Female Total Male Female Total005 Southeast Kootenay 69 68 69 64 71 67 47 65 56006 Rocky Mountain 57 75 64 52 60 56 83 71 76008 Kootenay Lake 60 40 50 68 53 60 68 72 70010 Arrow Lakes Msk 73 76 Msk Msk Msk Msk Msk Msk019 Revelstoke 34 Msk 53 Msk Msk 82 Msk Msk Msk020 Kootenay-Columbia 68 81 74 56 78 65 59 52 55022 Vernon 62 65 64 54 70 62 57 64 61023 Central Okanagan 56 54 55 57 63 60 56 67 61027 Cariboo-Chilcotin 28 37 33 30 54 42 44 33 38028 Quesnel 46 61 54 55 69 61 41 65 53033 Chilliwack 45 57 51 43 48 45 55 57 56034 Abbotsford 58 65 62 53 68 61 68 68 68035 Langley 48 65 56 53 72 62 65 59 62036 Surrey 36 48 42 48 56 52 45 63 54037 Delta 42 70 57 54 73 62 57 62 60038 Richmond 48 77 63 41 82 64 34 57 45039 Vancouver 24 34 29 22 29 25 29 35 32040 New Westminster 27 42 35 29 54 42 53 77 62041 Burnaby 34 45 39 22 40 30 46 52 49042 Maple Ridge-Pitt Meadows 56 63 59 55 69 63 61 63 62043 Coquitlam 74 68 71 51 76 64 53 71 63044 North Vancouver 56 43 51 54 47 52 44 55 49045 West Vancouver Msk Msk Msk - Msk Msk Msk Msk Msk046 Sunshine Coast 41 53 47 43 49 46 68 58 63047 Powell River 55 52 54 54 33 43 61 68 64048 Sea to Sky 48 15 35 45 30 39 56 57 56049 Central Coast Msk Msk 61 Msk Msk 62 Msk Msk 48050 Haida Gwaii 62 50 58 52 51 52 57 63 60051 Boundary 85 63 71 56 82 72 78 99 87052 Prince Rupert 42 46 44 37 32 35 44 44 44053 Okanagan Similkameen 23 60 45 52 70 60 53 41 47054 Bulkley Valley 65 49 56 44 49 46 46 55 51057 Prince George 45 49 47 47 58 52 36 52 44058 Nicola-Similkameen 40 35 37 49 49 49 59 49 54
Six-Year Completion Rate by School District - Aboriginal Students, 2008/09 - 2010/11
2008/09 (%) 2009/10 (%) 2010/11 (%)School District
058 Nicola-Similkameen 40 35 37 49 49 49 59 49 54059 Peace River South 51 60 55 41 50 46 59 64 61060 Peace River North 55 48 52 48 62 55 51 40 45061 Greater Victoria 32 41 37 37 45 41 44 54 49062 Sooke 61 74 67 58 64 61 76 69 73063 Saanich 21 33 28 15 38 28 38 48 43064 Gulf Islands Msk Msk Msk Msk Msk Msk Msk Msk 58067 Okanagan Skaha 48 49 48 44 71 60 53 65 60068 Nanaimo-Ladysmith 39 50 44 33 51 43 48 56 52069 Qualicum 58 71 64 58 68 63 63 70 66070 Alberni 18 23 20 24 44 34 32 37 34071 Comox Valley 35 47 42 50 63 56 54 57 56072 Campbell River 47 53 50 41 67 56 54 46 50073 Kamloops/Thompson 54 61 57 53 57 55 61 69 64074 Gold Trail 35 59 47 57 74 66 50 58 54075 Mission 40 62 53 54 74 64 55 62 58078 Fraser-Cascade 34 48 41 61 47 53 42 61 50079 Cowichan Valley 27 43 34 31 40 36 57 52 55081 Fort Nelson 54 49 51 44 64 55 100 99 100082 Coast Mountains 41 45 43 53 45 49 45 46 46083 North Okanagan-Shuswap 50 59 54 56 73 64 62 59 61084 Vancouver Island West 38 Msk 35 Msk Msk 13 Msk 31 21085 Vancouver Island North 67 44 57 45 56 50 66 58 62087 Stikine Msk Msk 30 33 Msk 38 48 Msk 39091 Nechako Lakes 52 53 53 45 48 47 45 49 47092 Nisga'a 42 83 62 28 39 34 27 12 21
All Public Only 45 53 49 46 56 51 52 57 54All Independent Only 30 49 42 28 42 35 48 39 43Province (Pub. + Ind.) 45 52 49 45 56 50 51 56 54
Page 381 EDU-2013-00071 - PHASE 1
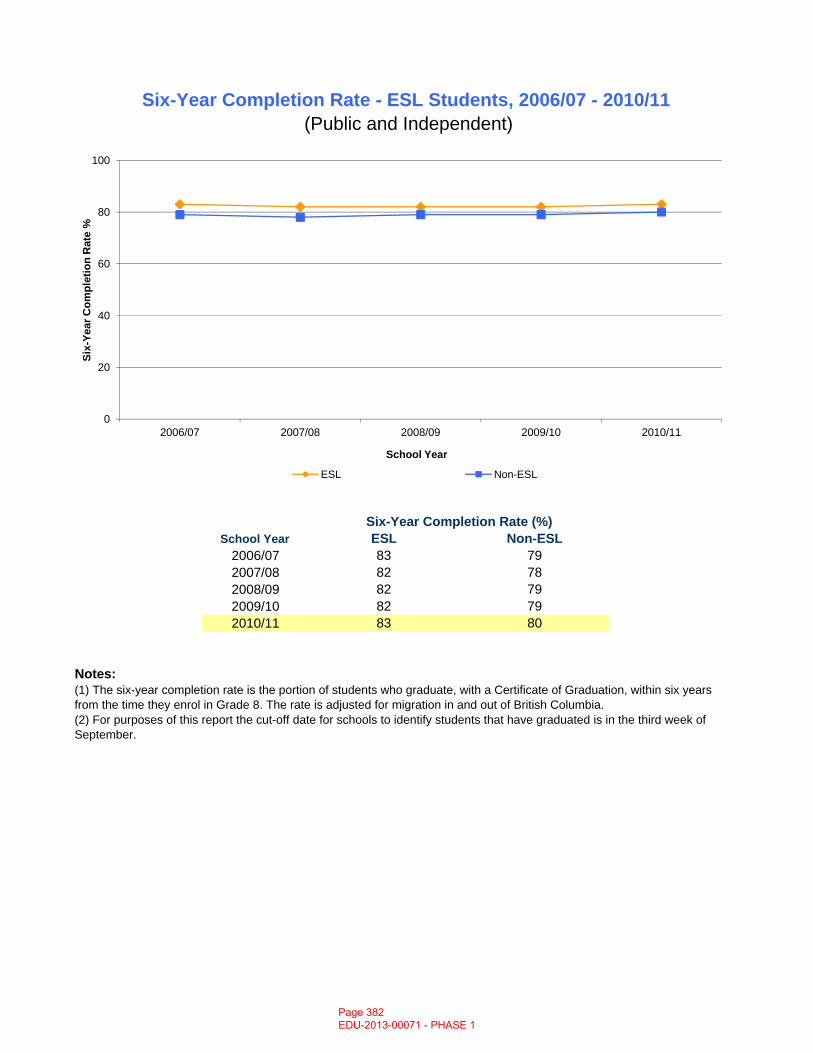
ESL Non-ESL2006/07 83 79
Six-Year Completion Rate - ESL Students, 2006/07 - 2010/11 (Public and Independent)
School YearSix-Year Completion Rate (%)
0
20
40
60
80
100
2006/07 2007/08 2008/09 2009/10 2010/11
Six-
Year
Com
plet
ion
Rat
e %
School Year
ESL Non-ESL
2007/08 82 782008/09 82 792009/10 82 792010/11 83 80
Notes:(1) The six-year completion rate is the portion of students who graduate, with a Certificate of Graduation, within six years from the time they enrol in Grade 8. The rate is adjusted for migration in and out of British Columbia.(2) For purposes of this report the cut-off date for schools to identify students that have graduated is in the third week of September.
Page 382 EDU-2013-00071 - PHASE 1
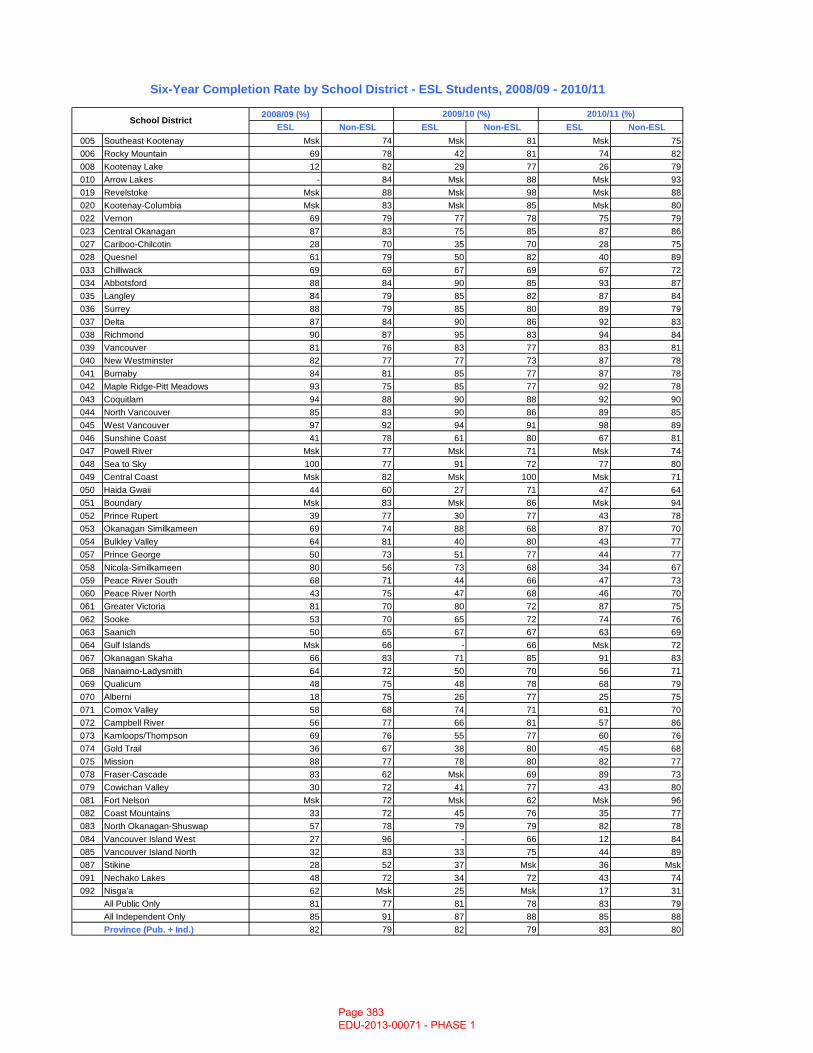
2008/09 (%)ESL Non-ESL ESL Non-ESL ESL Non-ESL
005 Southeast Kootenay Msk 74 Msk 81 Msk 75006 Rocky Mountain 69 78 42 81 74 82008 Kootenay Lake 12 82 29 77 26 79010 Arrow Lakes - 84 Msk 88 Msk 93019 Revelstoke Msk 88 Msk 98 Msk 88020 Kootenay-Columbia Msk 83 Msk 85 Msk 80022 Vernon 69 79 77 78 75 79023 Central Okanagan 87 83 75 85 87 86027 Cariboo-Chilcotin 28 70 35 70 28 75028 Quesnel 61 79 50 82 40 89033 Chilliwack 69 69 67 69 67 72034 Abbotsford 88 84 90 85 93 87035 Langley 84 79 85 82 87 84036 Surrey 88 79 85 80 89 79037 Delta 87 84 90 86 92 83038 Richmond 90 87 95 83 94 84039 Vancouver 81 76 83 77 83 81040 New Westminster 82 77 77 73 87 78041 Burnaby 84 81 85 77 87 78042 Maple Ridge-Pitt Meadows 93 75 85 77 92 78043 Coquitlam 94 88 90 88 92 90044 North Vancouver 85 83 90 86 89 85045 West Vancouver 97 92 94 91 98 89046 Sunshine Coast 41 78 61 80 67 81047 Powell River Msk 77 Msk 71 Msk 74048 Sea to Sky 100 77 91 72 77 80049 Central Coast Msk 82 Msk 100 Msk 71050 Haida Gwaii 44 60 27 71 47 64051 Boundary Msk 83 Msk 86 Msk 94052 Prince Rupert 39 77 30 77 43 78053 Okanagan Similkameen 69 74 88 68 87 70054 Bulkley Valley 64 81 40 80 43 77057 Prince George 50 73 51 77 44 77
Six-Year Completion Rate by School District - ESL Students, 2008/09 - 2010/11
2009/10 (%) 2010/11 (%)School District
058 Nicola-Similkameen 80 56 73 68 34 67059 Peace River South 68 71 44 66 47 73060 Peace River North 43 75 47 68 46 70061 Greater Victoria 81 70 80 72 87 75062 Sooke 53 70 65 72 74 76063 Saanich 50 65 67 67 63 69064 Gulf Islands Msk 66 - 66 Msk 72067 Okanagan Skaha 66 83 71 85 91 83068 Nanaimo-Ladysmith 64 72 50 70 56 71069 Qualicum 48 75 48 78 68 79070 Alberni 18 75 26 77 25 75071 Comox Valley 58 68 74 71 61 70072 Campbell River 56 77 66 81 57 86073 Kamloops/Thompson 69 76 55 77 60 76074 Gold Trail 36 67 38 80 45 68075 Mission 88 77 78 80 82 77078 Fraser-Cascade 83 62 Msk 69 89 73079 Cowichan Valley 30 72 41 77 43 80081 Fort Nelson Msk 72 Msk 62 Msk 96082 Coast Mountains 33 72 45 76 35 77083 North Okanagan-Shuswap 57 78 79 79 82 78084 Vancouver Island West 27 96 - 66 12 84085 Vancouver Island North 32 83 33 75 44 89087 Stikine 28 52 37 Msk 36 Msk091 Nechako Lakes 48 72 34 72 43 74092 Nisga'a 62 Msk 25 Msk 17 31
All Public Only 81 77 81 78 83 79All Independent Only 85 91 87 88 85 88Province (Pub. + Ind.) 82 79 82 79 83 80
Page 383 EDU-2013-00071 - PHASE 1
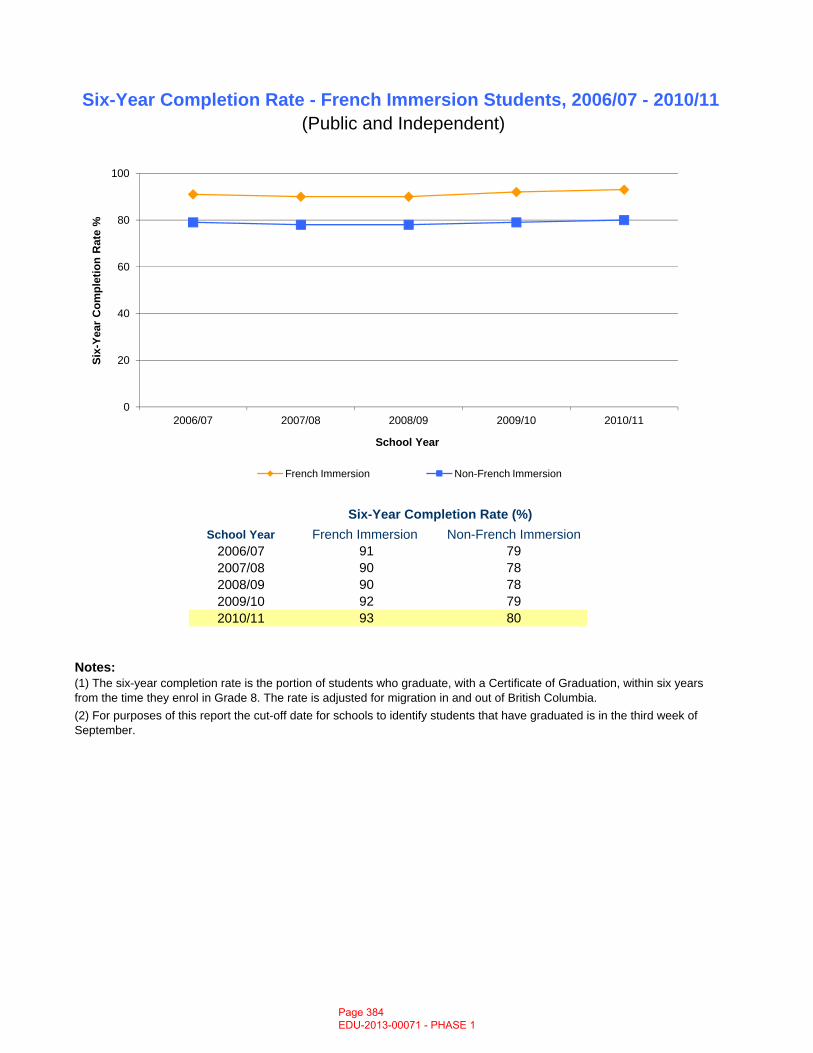
French Immersion Non-French Immersion2006/07 91 792007/08 90 78
School Year
Six-Year Completion Rate - French Immersion Students, 2006/07 - 2010/11 (Public and Independent)
Six-Year Completion Rate (%)
0
20
40
60
80
100
2006/07 2007/08 2008/09 2009/10 2010/11
Six-
Year
Com
plet
ion
Rat
e %
School Year
French Immersion Non-French Immersion
2007/08 90 782008/09 90 782009/10 92 792010/11 93 80
Notes:(1) The six-year completion rate is the portion of students who graduate, with a Certificate of Graduation, within six years from the time they enrol in Grade 8. The rate is adjusted for migration in and out of British Columbia.(2) For purposes of this report the cut-off date for schools to identify students that have graduated is in the third week of September.
Page 384 EDU-2013-00071 - PHASE 1
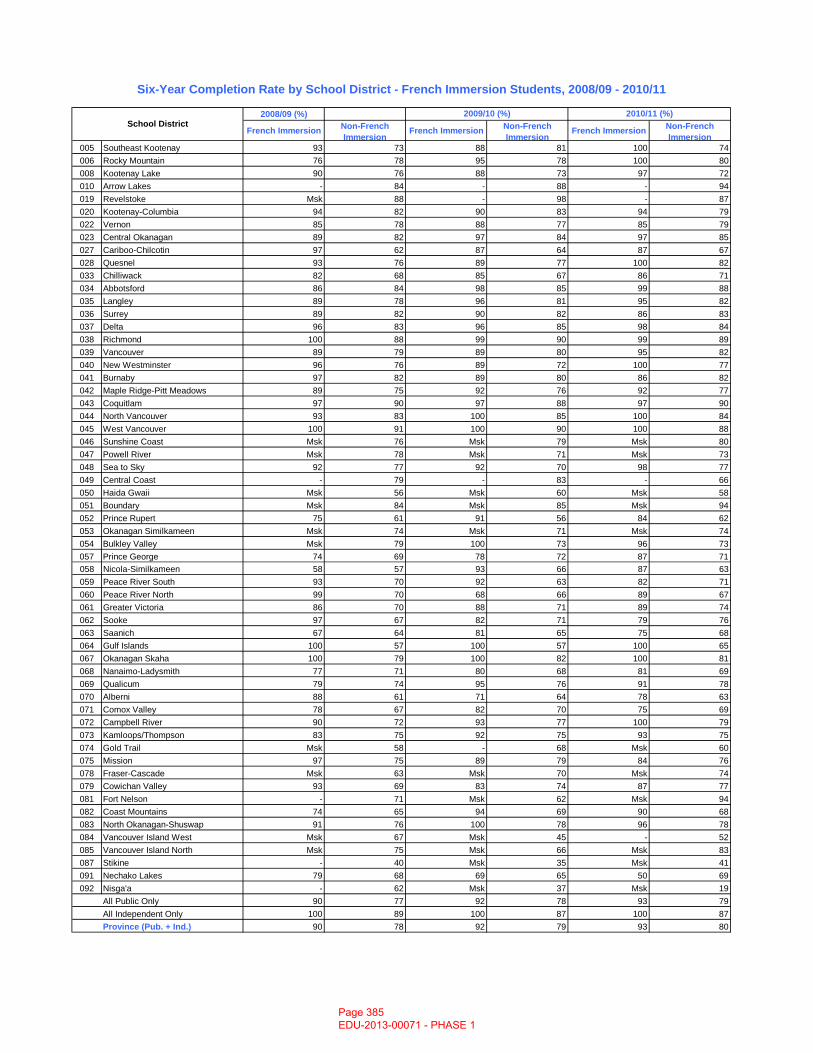
2008/09 (%)
French Immersion Non-French Immersion
French Immersion Non-French Immersion
French Immersion Non-French Immersion
005 Southeast Kootenay 93 73 88 81 100 74006 Rocky Mountain 76 78 95 78 100 80008 Kootenay Lake 90 76 88 73 97 72010 Arrow Lakes - 84 - 88 - 94019 Revelstoke Msk 88 - 98 - 87020 Kootenay-Columbia 94 82 90 83 94 79022 Vernon 85 78 88 77 85 79023 Central Okanagan 89 82 97 84 97 85027 Cariboo-Chilcotin 97 62 87 64 87 67028 Quesnel 93 76 89 77 100 82033 Chilliwack 82 68 85 67 86 71034 Abbotsford 86 84 98 85 99 88035 Langley 89 78 96 81 95 82036 Surrey 89 82 90 82 86 83037 Delta 96 83 96 85 98 84038 Richmond 100 88 99 90 99 89039 Vancouver 89 79 89 80 95 82040 New Westminster 96 76 89 72 100 77041 Burnaby 97 82 89 80 86 82042 Maple Ridge-Pitt Meadows 89 75 92 76 92 77043 Coquitlam 97 90 97 88 97 90044 North Vancouver 93 83 100 85 100 84045 West Vancouver 100 91 100 90 100 88046 Sunshine Coast Msk 76 Msk 79 Msk 80047 Powell River Msk 78 Msk 71 Msk 73048 Sea to Sky 92 77 92 70 98 77049 Central Coast - 79 - 83 - 66050 Haida Gwaii Msk 56 Msk 60 Msk 58051 Boundary Msk 84 Msk 85 Msk 94052 Prince Rupert 75 61 91 56 84 62053 Okanagan Similkameen Msk 74 Msk 71 Msk 74054 Bulkley Valley Msk 79 100 73 96 73057 Prince George 74 69 78 72 87 71
Six-Year Completion Rate by School District - French Immersion Students, 2008/09 - 2010/11
2009/10 (%) 2010/11 (%)School District
058 Nicola-Similkameen 58 57 93 66 87 63059 Peace River South 93 70 92 63 82 71060 Peace River North 99 70 68 66 89 67061 Greater Victoria 86 70 88 71 89 74062 Sooke 97 67 82 71 79 76063 Saanich 67 64 81 65 75 68064 Gulf Islands 100 57 100 57 100 65067 Okanagan Skaha 100 79 100 82 100 81068 Nanaimo-Ladysmith 77 71 80 68 81 69069 Qualicum 79 74 95 76 91 78070 Alberni 88 61 71 64 78 63071 Comox Valley 78 67 82 70 75 69072 Campbell River 90 72 93 77 100 79073 Kamloops/Thompson 83 75 92 75 93 75074 Gold Trail Msk 58 - 68 Msk 60075 Mission 97 75 89 79 84 76078 Fraser-Cascade Msk 63 Msk 70 Msk 74079 Cowichan Valley 93 69 83 74 87 77081 Fort Nelson - 71 Msk 62 Msk 94082 Coast Mountains 74 65 94 69 90 68083 North Okanagan-Shuswap 91 76 100 78 96 78084 Vancouver Island West Msk 67 Msk 45 - 52085 Vancouver Island North Msk 75 Msk 66 Msk 83087 Stikine - 40 Msk 35 Msk 41091 Nechako Lakes 79 68 69 65 50 69092 Nisga'a - 62 Msk 37 Msk 19
All Public Only 90 77 92 78 93 79All Independent Only 100 89 100 87 100 87Province (Pub. + Ind.) 90 78 92 79 93 80
Page 385 EDU-2013-00071 - PHASE 1
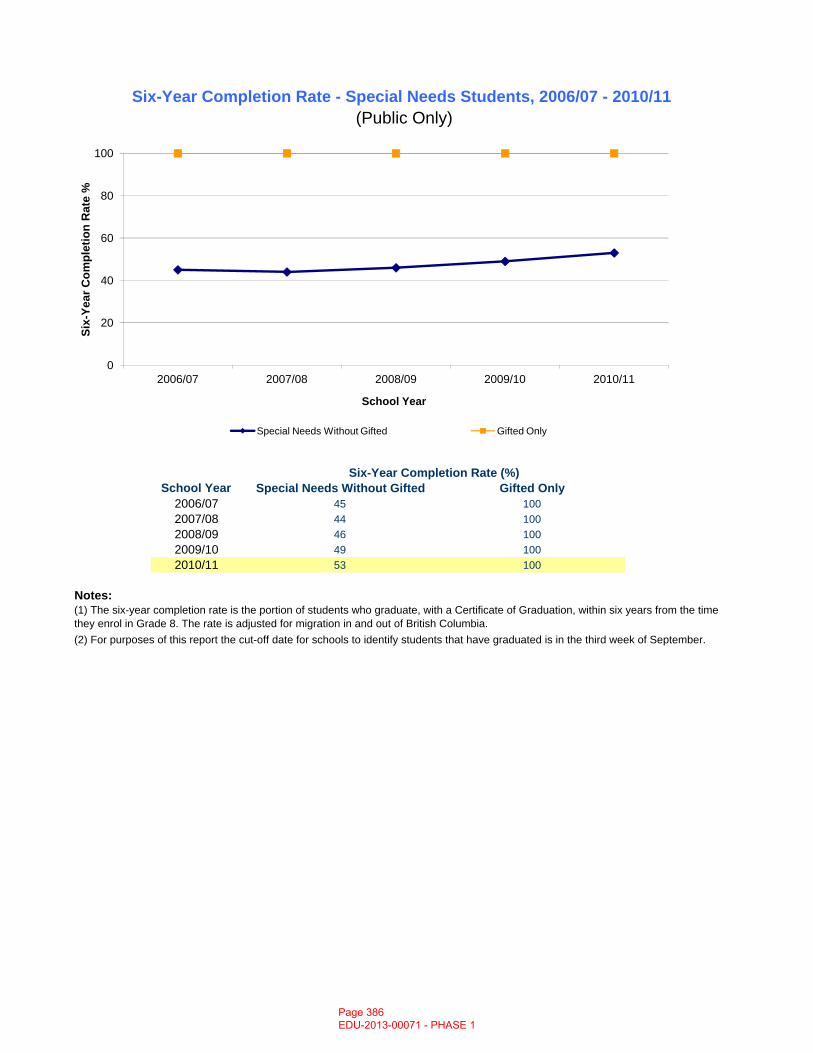
School Year Special Needs Without Gifted Gifted Only2006/07 45 1002007/08 44 1002008/09 46 1002009/10 49 1002010/11 53 100
Six-Year Completion Rate - Special Needs Students, 2006/07 - 2010/11 (Public Only)
Six-Year Completion Rate (%)
0
20
40
60
80
100
2006/07 2007/08 2008/09 2009/10 2010/11
Six-
Year
Com
plet
ion
Rat
e %
School Year
Special Needs Without Gifted Gifted Only
2010/11 53 100
Notes:(1) The six-year completion rate is the portion of students who graduate, with a Certificate of Graduation, within six years from the time they enrol in Grade 8. The rate is adjusted for migration in and out of British Columbia.(2) For purposes of this report the cut-off date for schools to identify students that have graduated is in the third week of September.
Page 386 EDU-2013-00071 - PHASE 1
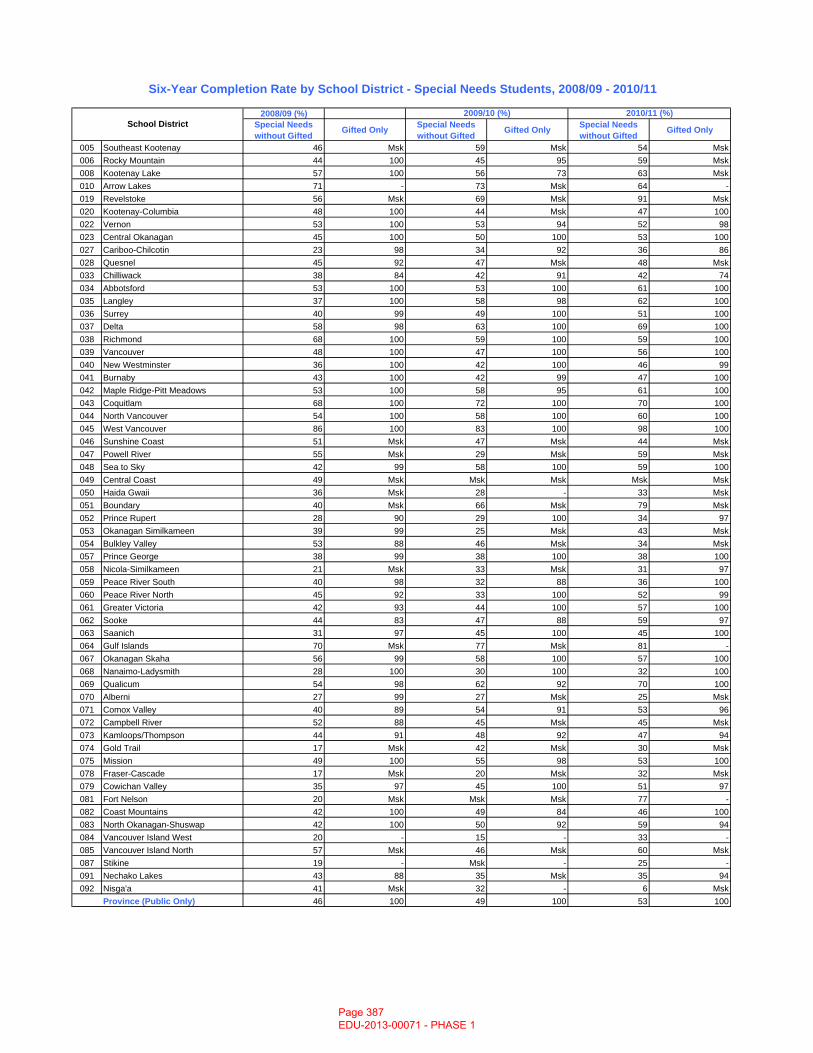
2008/09 (%)Special Needs without Gifted Gifted Only Special Needs
without Gifted Gifted Only Special Needs without Gifted Gifted Only
005 Southeast Kootenay 46 Msk 59 Msk 54 Msk006 Rocky Mountain 44 100 45 95 59 Msk008 Kootenay Lake 57 100 56 73 63 Msk010 Arrow Lakes 71 - 73 Msk 64 -019 Revelstoke 56 Msk 69 Msk 91 Msk020 Kootenay-Columbia 48 100 44 Msk 47 100022 Vernon 53 100 53 94 52 98023 Central Okanagan 45 100 50 100 53 100027 Cariboo-Chilcotin 23 98 34 92 36 86028 Quesnel 45 92 47 Msk 48 Msk033 Chilliwack 38 84 42 91 42 74034 Abbotsford 53 100 53 100 61 100035 Langley 37 100 58 98 62 100036 Surrey 40 99 49 100 51 100037 Delta 58 98 63 100 69 100038 Richmond 68 100 59 100 59 100039 Vancouver 48 100 47 100 56 100040 New Westminster 36 100 42 100 46 99041 Burnaby 43 100 42 99 47 100042 Maple Ridge-Pitt Meadows 53 100 58 95 61 100043 Coquitlam 68 100 72 100 70 100044 North Vancouver 54 100 58 100 60 100045 West Vancouver 86 100 83 100 98 100046 Sunshine Coast 51 Msk 47 Msk 44 Msk047 Powell River 55 Msk 29 Msk 59 Msk048 Sea to Sky 42 99 58 100 59 100049 Central Coast 49 Msk Msk Msk Msk Msk050 Haida Gwaii 36 Msk 28 - 33 Msk051 Boundary 40 Msk 66 Msk 79 Msk052 Prince Rupert 28 90 29 100 34 97053 Okanagan Similkameen 39 99 25 Msk 43 Msk054 Bulkley Valley 53 88 46 Msk 34 Msk057 Prince George 38 99 38 100 38 100058 Nicola-Similkameen 21 Msk 33 Msk 31 97059 Peace River South 40 98 32 88 36 100060 Peace River North 45 92 33 100 52 99061 Greater Victoria 42 93 44 100 57 100062 Sooke 44 83 47 88 59 97063 Saanich 31 97 45 100 45 100064 Gulf Islands 70 Msk 77 Msk 81 -067 Okanagan Skaha 56 99 58 100 57 100068 Nanaimo-Ladysmith 28 100 30 100 32 100069 Qualicum 54 98 62 92 70 100070 Alberni 27 99 27 Msk 25 Msk071 Comox Valley 40 89 54 91 53 96072 Campbell River 52 88 45 Msk 45 Msk073 Kamloops/Thompson 44 91 48 92 47 94074 Gold Trail 17 Msk 42 Msk 30 Msk075 Mission 49 100 55 98 53 100078 Fraser-Cascade 17 Msk 20 Msk 32 Msk079 Cowichan Valley 35 97 45 100 51 97081 Fort Nelson 20 Msk Msk Msk 77 -082 Coast Mountains 42 100 49 84 46 100083 North Okanagan-Shuswap 42 100 50 92 59 94084 Vancouver Island West 20 - 15 - 33 -085 Vancouver Island North 57 Msk 46 Msk 60 Msk087 Stikine 19 - Msk - 25 -091 Nechako Lakes 43 88 35 Msk 35 94092 Nisga'a 41 Msk 32 - 6 Msk
Province (Public Only) 46 100 49 100 53 100
Six-Year Completion Rate by School District - Special Needs Students, 2008/09 - 2010/11
School District2009/10 (%) 2010/11 (%)
Page 387 EDU-2013-00071 - PHASE 1
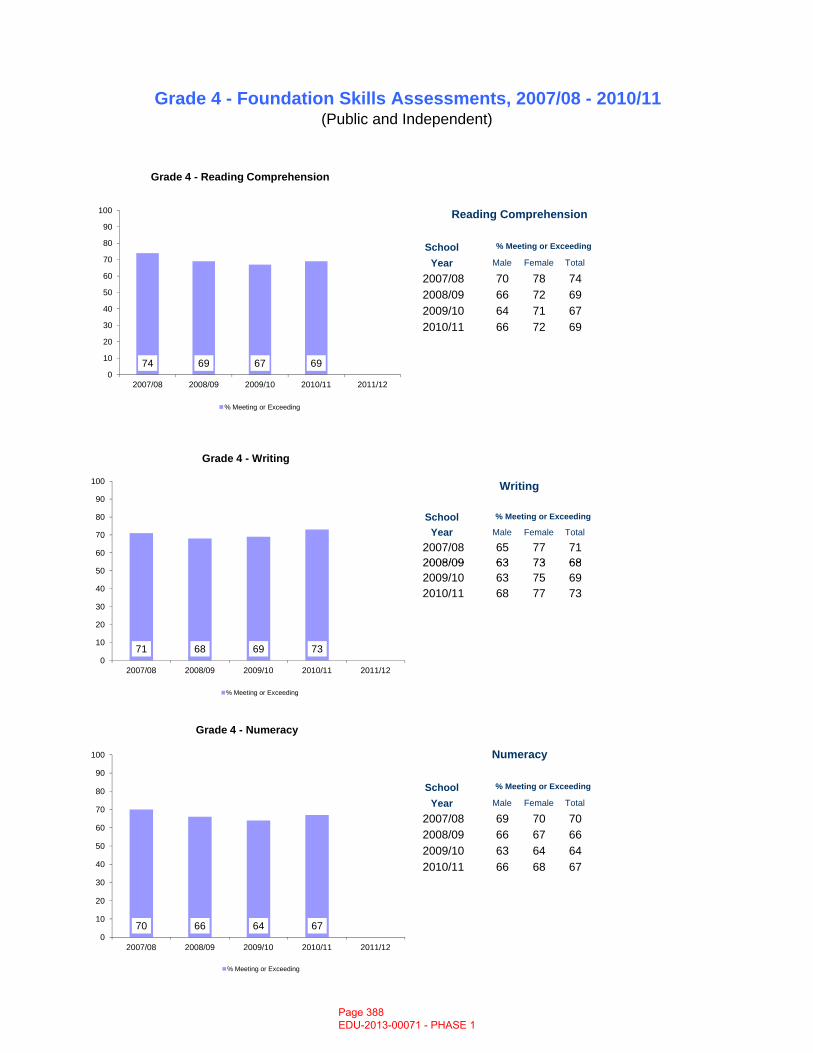
School Year Male Female Total
2007/08 70 78 742008/09 66 72 692009/10 64 71 672010/11 66 72 69
School Year Male Female Total
2007/08 65 77 712008/09 63 73 68
Grade 4 - Foundation Skills Assessments, 2007/08 - 2010/11(Public and Independent)
Reading Comprehension
% Meeting or Exceeding
% Meeting or Exceeding
Writing
50
60
70
80
90
100
Grade 4 - Writing
74 69 67 690
10
20
30
40
50
60
70
80
90
100
2007/08 2008/09 2009/10 2010/11 2011/12
Grade 4 - Reading Comprehension
% Meeting or Exceeding
2008/09 63 73 682009/10 63 75 692010/11 68 77 73
School Year Male Female Total
2007/08 69 70 702008/09 66 67 662009/10 63 64 642010/11 66 68 67
% Meeting or Exceeding
Numeracy
71 68 69 730
10
20
30
40
50
60
0
2007/08 2008/09 2009/10 2010/11 2011/12
% Meeting or Exceeding
70 66 64 670
10
20
30
40
50
60
70
80
90
100
2007/08 2008/09 2009/10 2010/11 2011/12
Grade 4 - Numeracy
% Meeting or Exceeding
Page 388 EDU-2013-00071 - PHASE 1
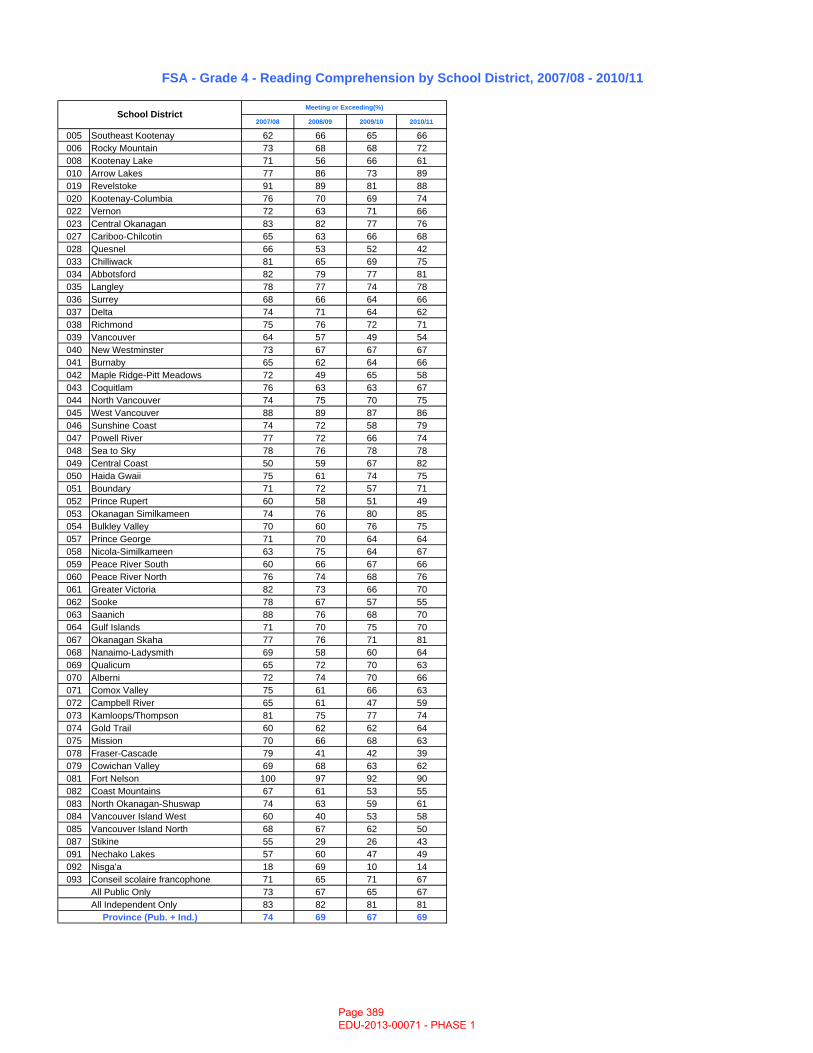
2007/08 2008/09 2009/10 2010/11
005 Southeast Kootenay 62 66 65 66006 Rocky Mountain 73 68 68 72008 Kootenay Lake 71 56 66 61010 Arrow Lakes 77 86 73 89019 Revelstoke 91 89 81 88020 Kootenay-Columbia 76 70 69 74022 Vernon 72 63 71 66023 Central Okanagan 83 82 77 76027 Cariboo-Chilcotin 65 63 66 68028 Quesnel 66 53 52 42033 Chilliwack 81 65 69 75034 Abbotsford 82 79 77 81035 Langley 78 77 74 78036 Surrey 68 66 64 66037 Delta 74 71 64 62038 Richmond 75 76 72 71039 Vancouver 64 57 49 54040 New Westminster 73 67 67 67041 Burnaby 65 62 64 66042 Maple Ridge-Pitt Meadows 72 49 65 58043 Coquitlam 76 63 63 67044 North Vancouver 74 75 70 75045 West Vancouver 88 89 87 86046 Sunshine Coast 74 72 58 79047 Powell River 77 72 66 74048 Sea to Sky 78 76 78 78049 Central Coast 50 59 67 82050 Haida Gwaii 75 61 74 75051 Boundary 71 72 57 71052 Prince Rupert 60 58 51 49053 Okanagan Similkameen 74 76 80 85054 Bulkley Valley 70 60 76 75057 Prince George 71 70 64 64058 Nicola-Similkameen 63 75 64 67059 Peace River South 60 66 67 66060 Peace River North 76 74 68 76061 Greater Victoria 82 73 66 70062 Sooke 78 67 57 55063 Saanich 88 76 68 70064 Gulf Islands 71 70 75 70067 Okanagan Skaha 77 76 71 81068 Nanaimo-Ladysmith 69 58 60 64069 Qualicum 65 72 70 63070 Alberni 72 74 70 66071 Comox Valley 75 61 66 63072 Campbell River 65 61 47 59073 Kamloops/Thompson 81 75 77 74074 Gold Trail 60 62 62 64075 Mission 70 66 68 63078 Fraser-Cascade 79 41 42 39079 Cowichan Valley 69 68 63 62081 Fort Nelson 100 97 92 90082 Coast Mountains 67 61 53 55083 North Okanagan-Shuswap 74 63 59 61084 Vancouver Island West 60 40 53 58085 Vancouver Island North 68 67 62 50087 Stikine 55 29 26 43091 Nechako Lakes 57 60 47 49092 Nisga'a 18 69 10 14093 Conseil scolaire francophone 71 65 71 67
All Public Only 73 67 65 67All Independent Only 83 82 81 81
74 69 67 69
School District
FSA - Grade 4 - Reading Comprehension by School District, 2007/08 - 2010/11
Province (Pub. + Ind.)
Meeting or Exceeding(%)
Page 389 EDU-2013-00071 - PHASE 1
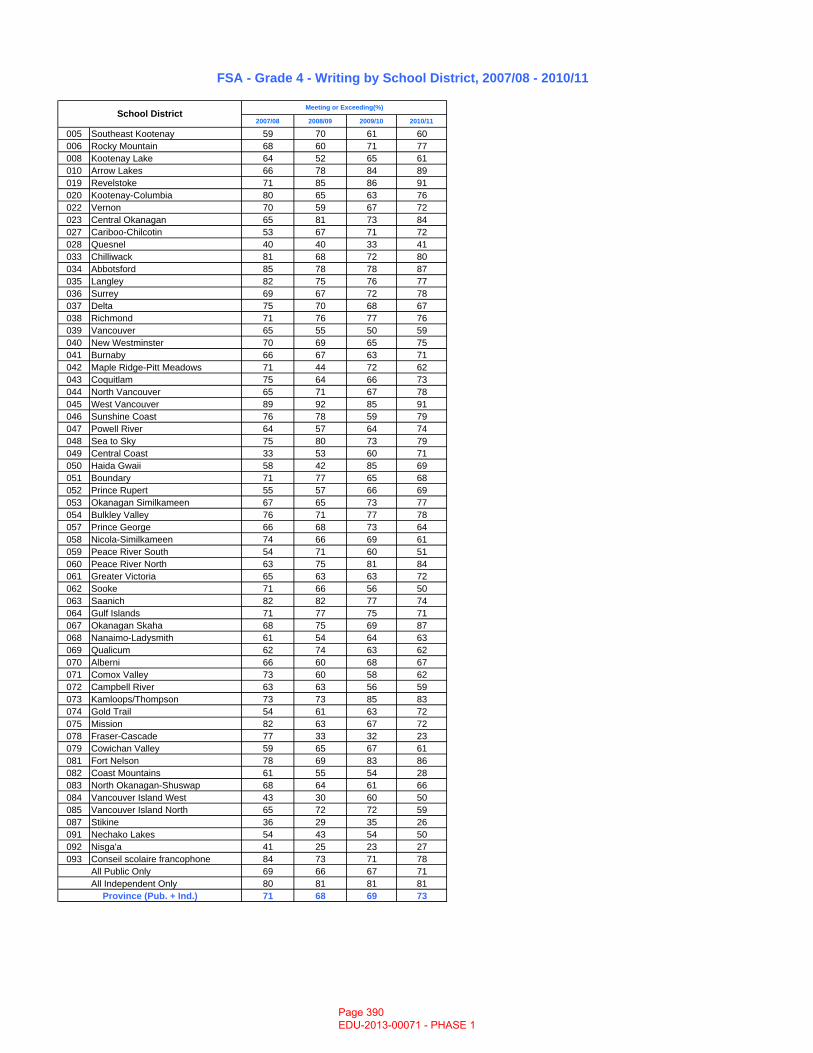
2007/08 2008/09 2009/10 2010/11
005 Southeast Kootenay 59 70 61 60006 Rocky Mountain 68 60 71 77008 Kootenay Lake 64 52 65 61010 Arrow Lakes 66 78 84 89019 Revelstoke 71 85 86 91020 Kootenay-Columbia 80 65 63 76022 Vernon 70 59 67 72023 Central Okanagan 65 81 73 84027 Cariboo-Chilcotin 53 67 71 72028 Quesnel 40 40 33 41033 Chilliwack 81 68 72 80034 Abbotsford 85 78 78 87035 Langley 82 75 76 77036 Surrey 69 67 72 78037 Delta 75 70 68 67038 Richmond 71 76 77 76039 Vancouver 65 55 50 59040 New Westminster 70 69 65 75041 Burnaby 66 67 63 71042 Maple Ridge-Pitt Meadows 71 44 72 62043 Coquitlam 75 64 66 73044 North Vancouver 65 71 67 78045 West Vancouver 89 92 85 91046 Sunshine Coast 76 78 59 79047 Powell River 64 57 64 74048 Sea to Sky 75 80 73 79049 Central Coast 33 53 60 71050 Haida Gwaii 58 42 85 69051 Boundary 71 77 65 68052 Prince Rupert 55 57 66 69053 Okanagan Similkameen 67 65 73 77054 Bulkley Valley 76 71 77 78057 Prince George 66 68 73 64058 Nicola-Similkameen 74 66 69 61059 Peace River South 54 71 60 51060 Peace River North 63 75 81 84061 Greater Victoria 65 63 63 72062 Sooke 71 66 56 50063 Saanich 82 82 77 74064 Gulf Islands 71 77 75 71067 Okanagan Skaha 68 75 69 87068 Nanaimo-Ladysmith 61 54 64 63069 Qualicum 62 74 63 62070 Alberni 66 60 68 67071 Comox Valley 73 60 58 62072 Campbell River 63 63 56 59073 Kamloops/Thompson 73 73 85 83074 Gold Trail 54 61 63 72075 Mission 82 63 67 72078 Fraser-Cascade 77 33 32 23079 Cowichan Valley 59 65 67 61081 Fort Nelson 78 69 83 86082 Coast Mountains 61 55 54 28083 North Okanagan-Shuswap 68 64 61 66084 Vancouver Island West 43 30 60 50085 Vancouver Island North 65 72 72 59087 Stikine 36 29 35 26091 Nechako Lakes 54 43 54 50092 Nisga'a 41 25 23 27093 Conseil scolaire francophone 84 73 71 78
All Public Only 69 66 67 71All Independent Only 80 81 81 81
71 68 69 73Province (Pub. + Ind.)
FSA - Grade 4 - Writing by School District, 2007/08 - 2010/11
School DistrictMeeting or Exceeding(%)
Page 390 EDU-2013-00071 - PHASE 1

2007/08 2008/09 2009/10 2010/11
005 Southeast Kootenay 59 69 63 66006 Rocky Mountain 64 66 71 72008 Kootenay Lake 65 56 62 60010 Arrow Lakes 70 80 70 68019 Revelstoke 87 81 81 77020 Kootenay-Columbia 68 67 59 69022 Vernon 67 61 61 59023 Central Okanagan 81 79 72 74027 Cariboo-Chilcotin 55 54 60 66028 Quesnel 50 48 41 27033 Chilliwack 72 61 65 73034 Abbotsford 79 77 77 81035 Langley 75 74 67 75036 Surrey 64 60 59 62037 Delta 70 65 59 58038 Richmond 77 77 72 71039 Vancouver 61 56 49 54040 New Westminster 71 65 66 68041 Burnaby 66 66 66 68042 Maple Ridge-Pitt Meadows 66 45 58 52043 Coquitlam 73 61 62 68044 North Vancouver 67 71 65 71045 West Vancouver 86 89 87 90046 Sunshine Coast 74 73 54 79047 Powell River 61 62 65 62048 Sea to Sky 68 69 66 80049 Central Coast 8 65 60 82050 Haida Gwaii 62 42 66 69051 Boundary 65 74 61 72052 Prince Rupert 47 51 41 46053 Okanagan Similkameen 72 74 80 87054 Bulkley Valley 72 62 73 70057 Prince George 61 59 57 54058 Nicola-Similkameen 53 60 58 66059 Peace River South 58 62 54 62060 Peace River North 73 71 66 73061 Greater Victoria 74 69 61 65062 Sooke 71 61 53 51063 Saanich 84 78 70 69064 Gulf Islands 62 64 75 67067 Okanagan Skaha 72 76 67 76068 Nanaimo-Ladysmith 61 54 57 62069 Qualicum 63 67 63 66070 Alberni 66 66 59 59071 Comox Valley 71 60 59 62072 Campbell River 55 61 48 56073 Kamloops/Thompson 74 72 74 72074 Gold Trail 56 51 49 57075 Mission 64 61 64 65078 Fraser-Cascade 59 33 35 32079 Cowichan Valley 60 59 54 54081 Fort Nelson 96 92 92 90082 Coast Mountains 57 45 43 44083 North Okanagan-Shuswap 66 63 56 62084 Vancouver Island West 54 27 50 39085 Vancouver Island North 62 66 61 50087 Stikine 41 12 0 9091 Nechako Lakes 49 55 40 44092 Nisga'a 18 38 26 14093 Conseil scolaire francophone 71 68 68 69
All Public Only 68 64 61 65All Independent Only 81 81 79 81
70 66 64 67
FSA - Grade 4 - Numeracy by School District, 2007/08 - 2010/11
School District
Province (Pub. + Ind.)
Meeting or Exceeding(%)
Page 391 EDU-2013-00071 - PHASE 1
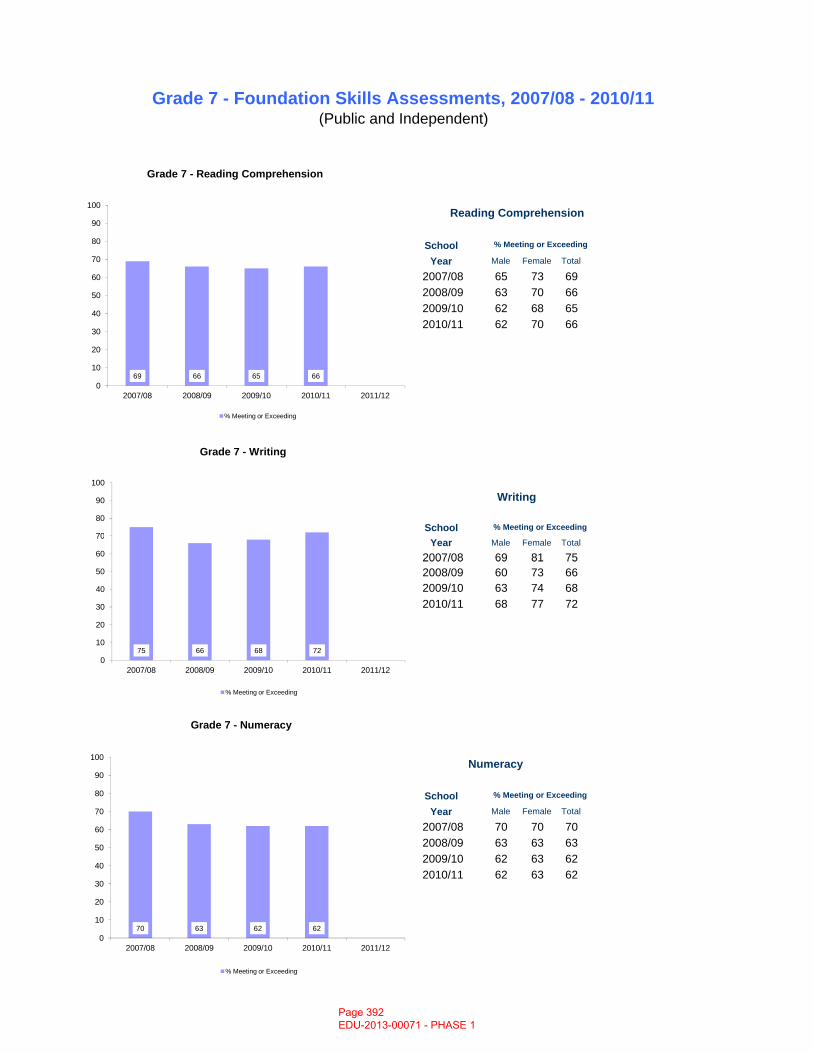
School Year Male Female Total
2007/08 65 73 692008/09 63 70 662009/10 62 68 652010/11 62 70 66
School Year Male Female Total
2007/08 69 81 75
Writing
Reading Comprehension
Grade 7 - Foundation Skills Assessments, 2007/08 - 2010/11(Public and Independent)
% Meeting or Exceeding
% Meeting or Exceeding
69 66 65 660
10
20
30
40
50
60
70
80
90
100
2007/08 2008/09 2009/10 2010/11 2011/12
Grade 7 - Reading Comprehension
% Meeting or Exceeding
60
70
80
90
100
Grade 7 - Writing
2007/08 69 81 752008/09 60 73 662009/10 63 74 682010/11 68 77 72
Numeracy
School Year Male Female Total
2007/08 70 70 702008/09 63 63 632009/10 62 63 622010/11 62 63 62
% Meeting or Exceeding
75 66 68 720
10
20
30
40
50
60
70
2007/08 2008/09 2009/10 2010/11 2011/12
% Meeting or Exceeding
70 63 62 620
10
20
30
40
50
60
70
80
90
100
2007/08 2008/09 2009/10 2010/11 2011/12
Grade 7 - Numeracy
% Meeting or Exceeding
Page 392 EDU-2013-00071 - PHASE 1
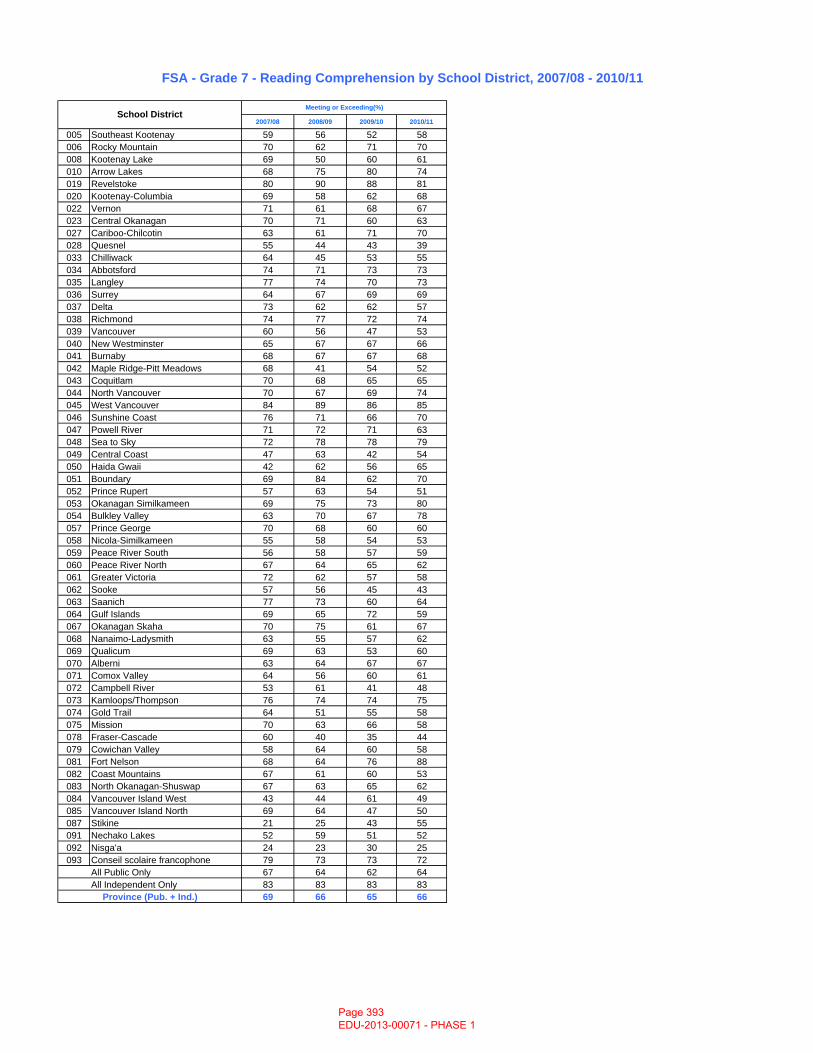
2007/08 2008/09 2009/10 2010/11
005 Southeast Kootenay 59 56 52 58006 Rocky Mountain 70 62 71 70008 Kootenay Lake 69 50 60 61010 Arrow Lakes 68 75 80 74019 Revelstoke 80 90 88 81020 Kootenay-Columbia 69 58 62 68022 Vernon 71 61 68 67023 Central Okanagan 70 71 60 63027 Cariboo-Chilcotin 63 61 71 70028 Quesnel 55 44 43 39033 Chilliwack 64 45 53 55034 Abbotsford 74 71 73 73035 Langley 77 74 70 73036 Surrey 64 67 69 69037 Delta 73 62 62 57038 Richmond 74 77 72 74039 Vancouver 60 56 47 53040 New Westminster 65 67 67 66041 Burnaby 68 67 67 68042 Maple Ridge-Pitt Meadows 68 41 54 52043 Coquitlam 70 68 65 65044 North Vancouver 70 67 69 74045 West Vancouver 84 89 86 85046 Sunshine Coast 76 71 66 70047 Powell River 71 72 71 63048 Sea to Sky 72 78 78 79049 Central Coast 47 63 42 54050 Haida Gwaii 42 62 56 65051 Boundary 69 84 62 70052 Prince Rupert 57 63 54 51053 Okanagan Similkameen 69 75 73 80054 Bulkley Valley 63 70 67 78057 Prince George 70 68 60 60058 Nicola-Similkameen 55 58 54 53059 Peace River South 56 58 57 59060 Peace River North 67 64 65 62061 Greater Victoria 72 62 57 58062 Sooke 57 56 45 43063 Saanich 77 73 60 64064 Gulf Islands 69 65 72 59067 Okanagan Skaha 70 75 61 67068 Nanaimo-Ladysmith 63 55 57 62069 Qualicum 69 63 53 60070 Alberni 63 64 67 67071 Comox Valley 64 56 60 61072 Campbell River 53 61 41 48073 Kamloops/Thompson 76 74 74 75074 Gold Trail 64 51 55 58075 Mission 70 63 66 58078 Fraser-Cascade 60 40 35 44079 Cowichan Valley 58 64 60 58081 Fort Nelson 68 64 76 88082 Coast Mountains 67 61 60 53083 North Okanagan-Shuswap 67 63 65 62084 Vancouver Island West 43 44 61 49085 Vancouver Island North 69 64 47 50087 Stikine 21 25 43 55091 Nechako Lakes 52 59 51 52092 Nisga'a 24 23 30 25093 Conseil scolaire francophone 79 73 73 72
All Public Only 67 64 62 64All Independent Only 83 83 83 83
69 66 65 66Province (Pub. + Ind.)
FSA - Grade 7 - Reading Comprehension by School District, 2007/08 - 2010/11
School DistrictMeeting or Exceeding(%)
Page 393 EDU-2013-00071 - PHASE 1
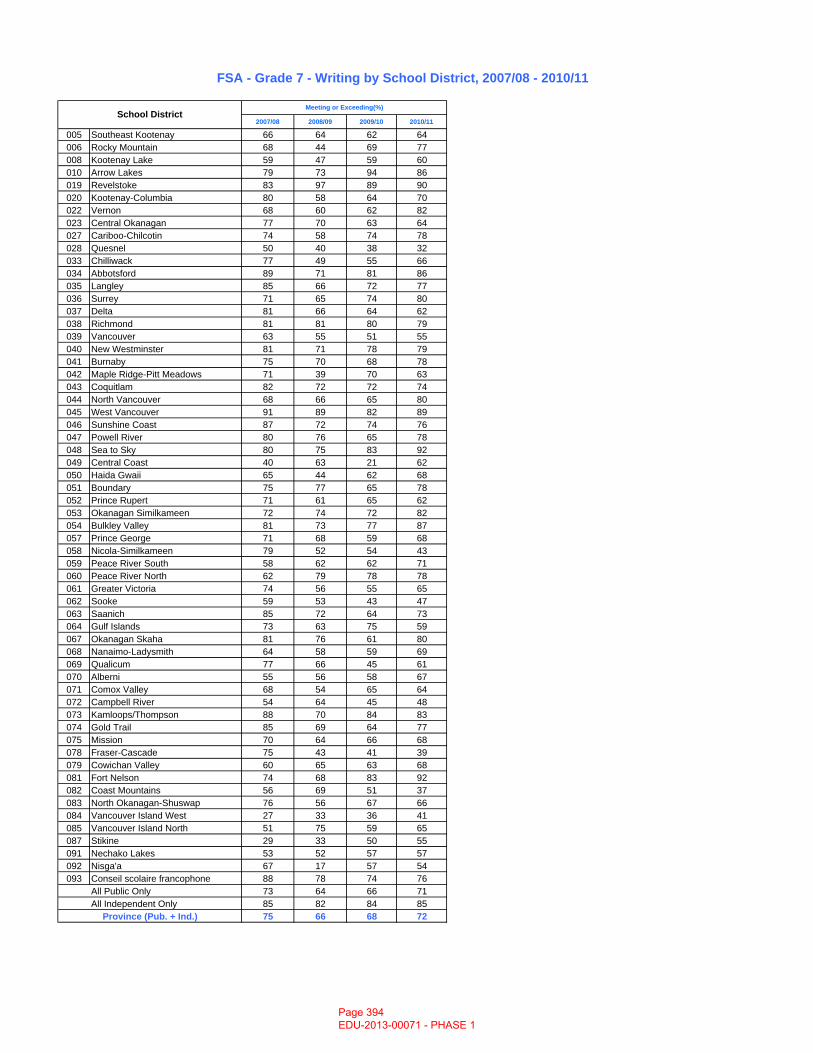
2007/08 2008/09 2009/10 2010/11
005 Southeast Kootenay 66 64 62 64006 Rocky Mountain 68 44 69 77008 Kootenay Lake 59 47 59 60010 Arrow Lakes 79 73 94 86019 Revelstoke 83 97 89 90020 Kootenay-Columbia 80 58 64 70022 Vernon 68 60 62 82023 Central Okanagan 77 70 63 64027 Cariboo-Chilcotin 74 58 74 78028 Quesnel 50 40 38 32033 Chilliwack 77 49 55 66034 Abbotsford 89 71 81 86035 Langley 85 66 72 77036 Surrey 71 65 74 80037 Delta 81 66 64 62038 Richmond 81 81 80 79039 Vancouver 63 55 51 55040 New Westminster 81 71 78 79041 Burnaby 75 70 68 78042 Maple Ridge-Pitt Meadows 71 39 70 63043 Coquitlam 82 72 72 74044 North Vancouver 68 66 65 80045 West Vancouver 91 89 82 89046 Sunshine Coast 87 72 74 76047 Powell River 80 76 65 78048 Sea to Sky 80 75 83 92049 Central Coast 40 63 21 62050 Haida Gwaii 65 44 62 68051 Boundary 75 77 65 78052 Prince Rupert 71 61 65 62053 Okanagan Similkameen 72 74 72 82054 Bulkley Valley 81 73 77 87057 Prince George 71 68 59 68058 Nicola-Similkameen 79 52 54 43059 Peace River South 58 62 62 71060 Peace River North 62 79 78 78061 Greater Victoria 74 56 55 65062 Sooke 59 53 43 47063 Saanich 85 72 64 73064 Gulf Islands 73 63 75 59067 Okanagan Skaha 81 76 61 80068 Nanaimo-Ladysmith 64 58 59 69069 Qualicum 77 66 45 61070 Alberni 55 56 58 67071 Comox Valley 68 54 65 64072 Campbell River 54 64 45 48073 Kamloops/Thompson 88 70 84 83074 Gold Trail 85 69 64 77075 Mission 70 64 66 68078 Fraser-Cascade 75 43 41 39079 Cowichan Valley 60 65 63 68081 Fort Nelson 74 68 83 92082 Coast Mountains 56 69 51 37083 North Okanagan-Shuswap 76 56 67 66084 Vancouver Island West 27 33 36 41085 Vancouver Island North 51 75 59 65087 Stikine 29 33 50 55091 Nechako Lakes 53 52 57 57092 Nisga'a 67 17 57 54093 Conseil scolaire francophone 88 78 74 76
All Public Only 73 64 66 71All Independent Only 85 82 84 85
75 66 68 72
FSA - Grade 7 - Writing by School District, 2007/08 - 2010/11
School District
Province (Pub. + Ind.)
Meeting or Exceeding(%)
Page 394 EDU-2013-00071 - PHASE 1
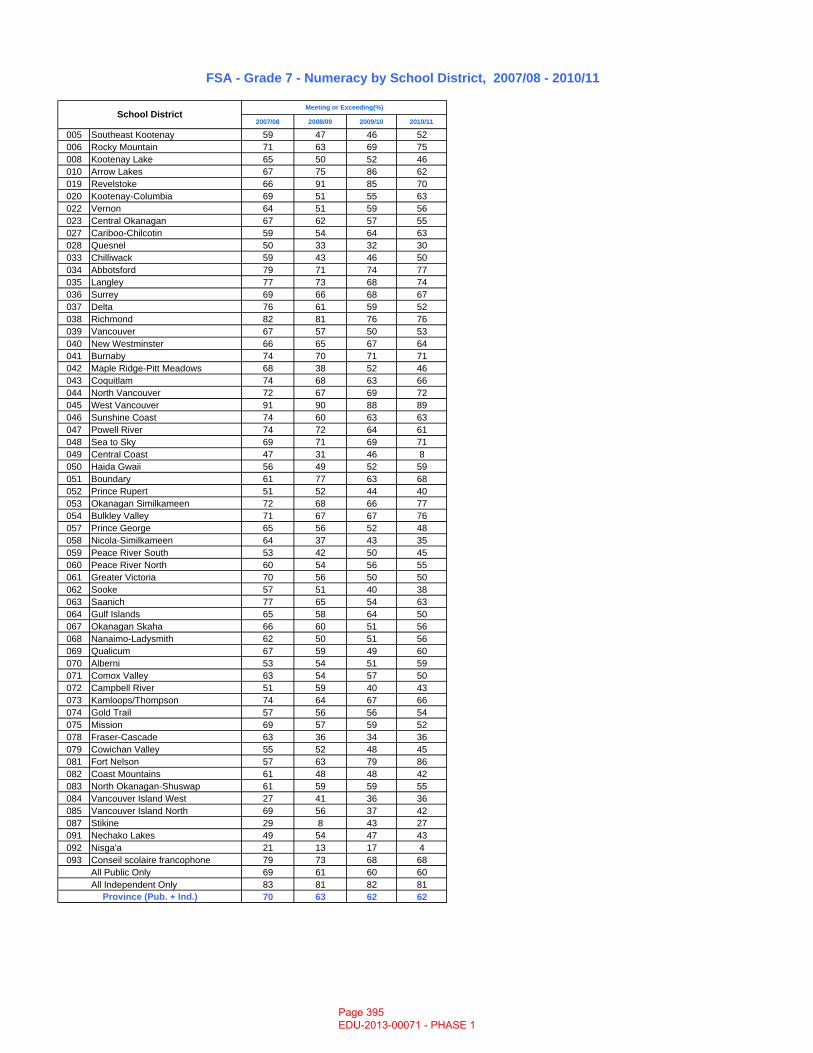
2007/08 2008/09 2009/10 2010/11
005 Southeast Kootenay 59 47 46 52006 Rocky Mountain 71 63 69 75008 Kootenay Lake 65 50 52 46010 Arrow Lakes 67 75 86 62019 Revelstoke 66 91 85 70020 Kootenay-Columbia 69 51 55 63022 Vernon 64 51 59 56023 Central Okanagan 67 62 57 55027 Cariboo-Chilcotin 59 54 64 63028 Quesnel 50 33 32 30033 Chilliwack 59 43 46 50034 Abbotsford 79 71 74 77035 Langley 77 73 68 74036 Surrey 69 66 68 67037 Delta 76 61 59 52038 Richmond 82 81 76 76039 Vancouver 67 57 50 53040 New Westminster 66 65 67 64041 Burnaby 74 70 71 71042 Maple Ridge-Pitt Meadows 68 38 52 46043 Coquitlam 74 68 63 66044 North Vancouver 72 67 69 72045 West Vancouver 91 90 88 89046 Sunshine Coast 74 60 63 63047 Powell River 74 72 64 61048 Sea to Sky 69 71 69 71049 Central Coast 47 31 46 8050 Haida Gwaii 56 49 52 59051 Boundary 61 77 63 68052 Prince Rupert 51 52 44 40053 Okanagan Similkameen 72 68 66 77054 Bulkley Valley 71 67 67 76057 Prince George 65 56 52 48058 Nicola-Similkameen 64 37 43 35059 Peace River South 53 42 50 45060 Peace River North 60 54 56 55061 Greater Victoria 70 56 50 50062 Sooke 57 51 40 38063 Saanich 77 65 54 63064 Gulf Islands 65 58 64 50067 Okanagan Skaha 66 60 51 56068 Nanaimo-Ladysmith 62 50 51 56069 Qualicum 67 59 49 60070 Alberni 53 54 51 59071 Comox Valley 63 54 57 50072 Campbell River 51 59 40 43073 Kamloops/Thompson 74 64 67 66074 Gold Trail 57 56 56 54075 Mission 69 57 59 52078 Fraser-Cascade 63 36 34 36079 Cowichan Valley 55 52 48 45081 Fort Nelson 57 63 79 86082 Coast Mountains 61 48 48 42083 North Okanagan-Shuswap 61 59 59 55084 Vancouver Island West 27 41 36 36085 Vancouver Island North 69 56 37 42087 Stikine 29 8 43 27091 Nechako Lakes 49 54 47 43092 Nisga'a 21 13 17 4093 Conseil scolaire francophone 79 73 68 68
All Public Only 69 61 60 60All Independent Only 83 81 82 81
70 63 62 62
FSA - Grade 7 - Numeracy by School District, 2007/08 - 2010/11
School District
Province (Pub. + Ind.)
Meeting or Exceeding(%)
Page 395 EDU-2013-00071 - PHASE 1
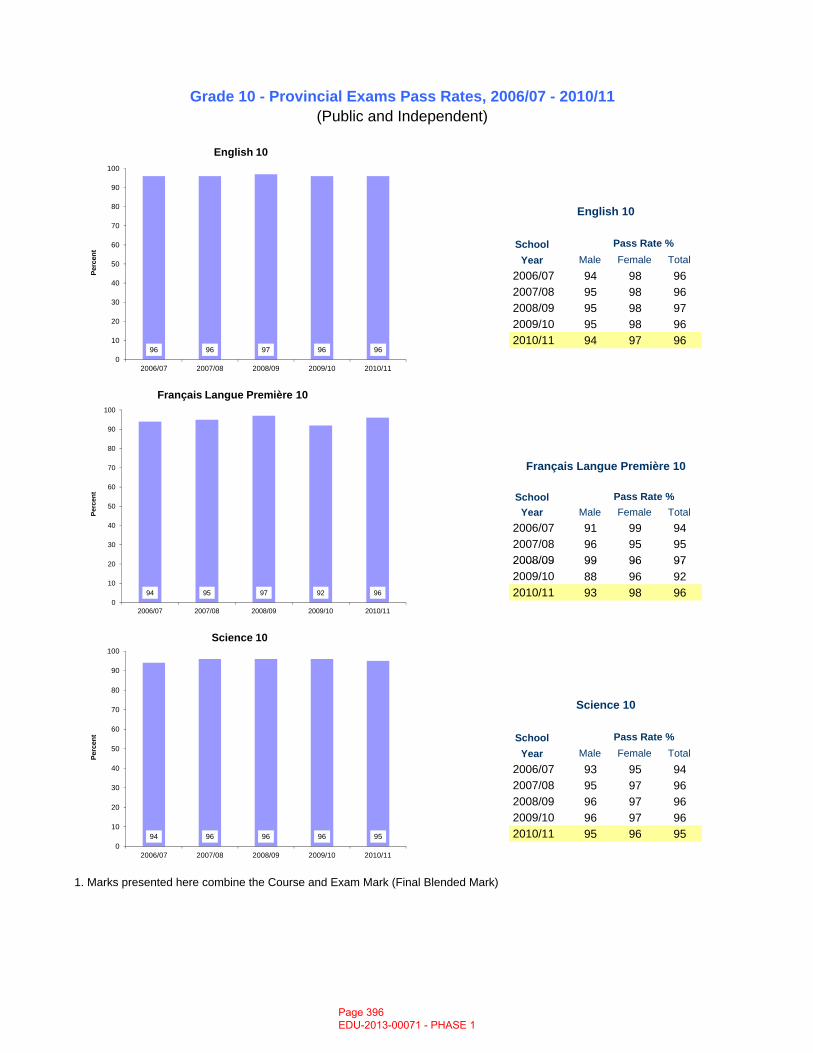
School Year Male Female Total
2006/07 94 98 962007/08 95 98 962008/09 95 98 972009/10 95 98 962010/11 94 97 96
School Year Male Female Total
2006/07 91 99 942007/08 96 95 952008/09 99 96 97
Pass Rate %
Français Langue Première 10
Grade 10 - Provincial Exams Pass Rates, 2006/07 - 2010/11(Public and Independent)
English 10
Pass Rate %
96 96 97 96 960
10
20
30
40
50
60
70
80
90
100
2006/07 2007/08 2008/09 2009/10 2010/11
Perc
ent
English 10
20
30
40
50
60
70
80
90
100
Perc
ent
Français Langue Première 10
2008/09 99 96 972009/10 88 96 922010/11 93 98 96
School Year Male Female Total
2006/07 93 95 942007/08 95 97 962008/09 96 97 962009/10 96 97 962010/11 95 96 95
1. Marks presented here combine the Course and Exam Mark (Final Blended Mark)
Pass Rate %
Science 10
94 95 97 92 960
10
20
30
2006/07 2007/08 2008/09 2009/10 2010/11
94 96 96 96 950
10
20
30
40
50
60
70
80
90
100
2006/07 2007/08 2008/09 2009/10 2010/11
Perc
ent
Science 10
Page 396 EDU-2013-00071 - PHASE 1
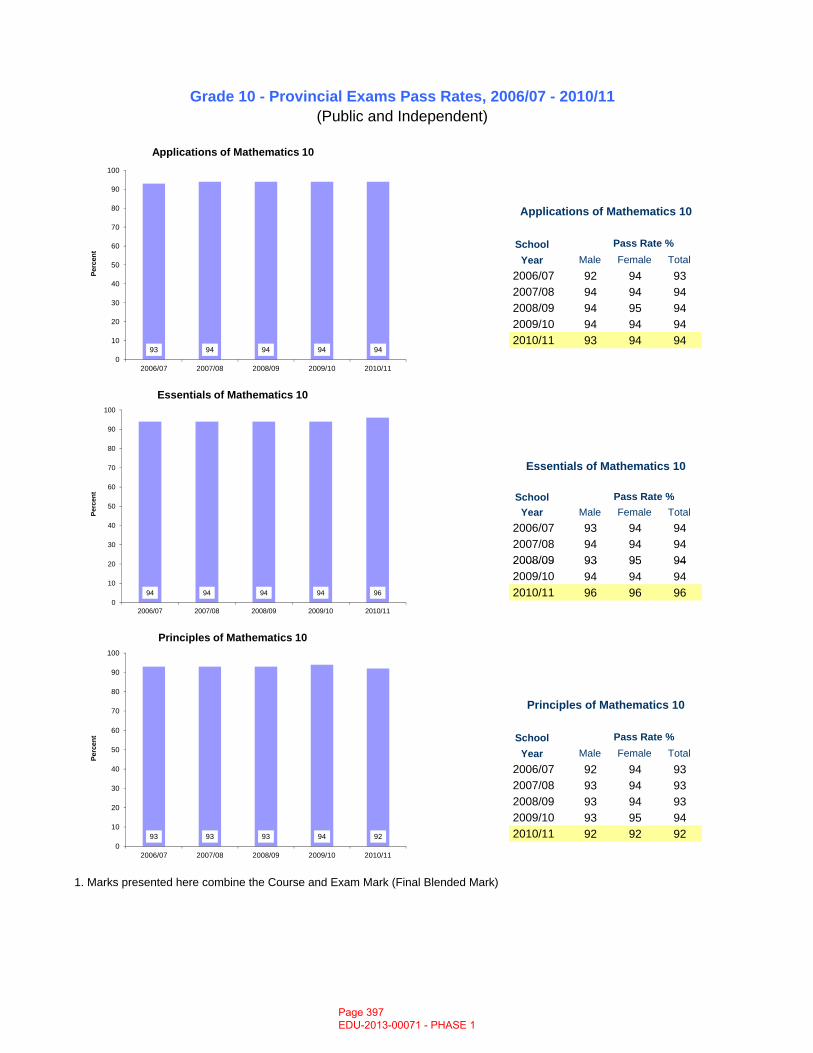
School Year Male Female Total
2006/07 92 94 932007/08 94 94 942008/09 94 95 942009/10 94 94 942010/11 93 94 94
School Year Male Female Total
2006/07 93 94 942007/08 94 94 942008/09 93 95 94
Essentials of Mathematics 10
Grade 10 - Provincial Exams Pass Rates, 2006/07 - 2010/11(Public and Independent)
Applications of Mathematics 10
Pass Rate %
Pass Rate %
93 94 94 94 940
10
20
30
40
50
60
70
80
90
100
2006/07 2007/08 2008/09 2009/10 2010/11
Perc
ent
Applications of Mathematics 10
20
30
40
50
60
70
80
90
100
Perc
ent
Essentials of Mathematics 10
2008/09 93 95 942009/10 94 94 942010/11 96 96 96
School Year Male Female Total
2006/07 92 94 932007/08 93 94 932008/09 93 94 932009/10 93 95 942010/11 92 92 92
1. Marks presented here combine the Course and Exam Mark (Final Blended Mark)
Pass Rate %
Principles of Mathematics 10
94 94 94 94 960
10
20
30
2006/07 2007/08 2008/09 2009/10 2010/11
93 93 93 94 920
10
20
30
40
50
60
70
80
90
100
2006/07 2007/08 2008/09 2009/10 2010/11
Perc
ent
Principles of Mathematics 10
Page 397 EDU-2013-00071 - PHASE 1
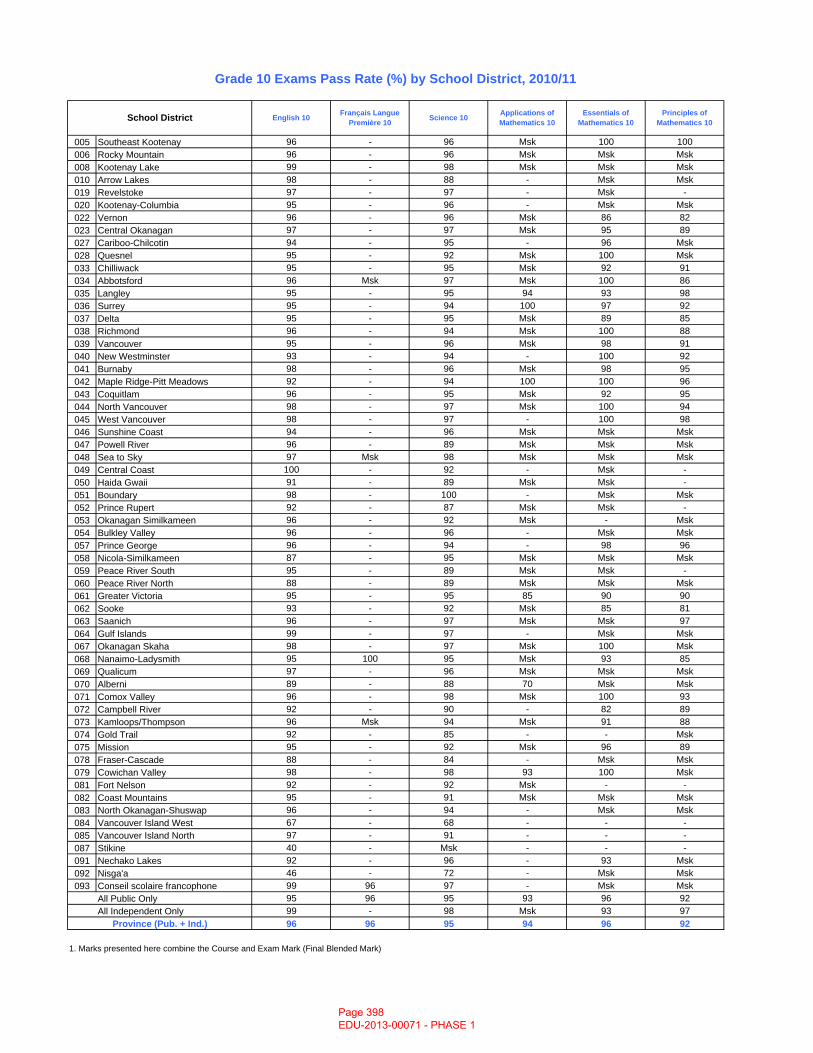
005 Southeast Kootenay 96 - 96 Msk 100 100006 Rocky Mountain 96 - 96 Msk Msk Msk008 Kootenay Lake 99 - 98 Msk Msk Msk010 Arrow Lakes 98 - 88 - Msk Msk019 Revelstoke 97 - 97 - Msk -020 Kootenay-Columbia 95 - 96 - Msk Msk022 Vernon 96 - 96 Msk 86 82023 Central Okanagan 97 - 97 Msk 95 89027 Cariboo-Chilcotin 94 - 95 - 96 Msk028 Quesnel 95 - 92 Msk 100 Msk033 Chilliwack 95 - 95 Msk 92 91034 Abbotsford 96 Msk 97 Msk 100 86035 Langley 95 - 95 94 93 98036 Surrey 95 - 94 100 97 92037 Delta 95 - 95 Msk 89 85038 Richmond 96 - 94 Msk 100 88039 Vancouver 95 - 96 Msk 98 91040 New Westminster 93 - 94 - 100 92041 Burnaby 98 - 96 Msk 98 95042 Maple Ridge-Pitt Meadows 92 - 94 100 100 96043 Coquitlam 96 - 95 Msk 92 95044 North Vancouver 98 - 97 Msk 100 94045 West Vancouver 98 - 97 - 100 98046 Sunshine Coast 94 - 96 Msk Msk Msk047 Powell River 96 - 89 Msk Msk Msk048 Sea to Sky 97 Msk 98 Msk Msk Msk049 Central Coast 100 - 92 - Msk -050 Haida Gwaii 91 - 89 Msk Msk -051 Boundary 98 - 100 - Msk Msk052 Prince Rupert 92 - 87 Msk Msk -053 Okanagan Similkameen 96 - 92 Msk - Msk054 Bulkley Valley 96 - 96 - Msk Msk057 Prince George 96 - 94 - 98 96058 Nicola-Similkameen 87 - 95 Msk Msk Msk059 Peace River South 95 - 89 Msk Msk -060 Peace River North 88 - 89 Msk Msk Msk061 Greater Victoria 95 - 95 85 90 90062 Sooke 93 - 92 Msk 85 81063 Saanich 96 - 97 Msk Msk 97064 Gulf Islands 99 - 97 - Msk Msk067 Okanagan Skaha 98 - 97 Msk 100 Msk068 Nanaimo-Ladysmith 95 100 95 Msk 93 85069 Qualicum 97 - 96 Msk Msk Msk070 Alberni 89 - 88 70 Msk Msk071 Comox Valley 96 - 98 Msk 100 93072 Campbell River 92 - 90 - 82 89073 Kamloops/Thompson 96 Msk 94 Msk 91 88074 Gold Trail 92 - 85 - - Msk075 Mission 95 - 92 Msk 96 89078 Fraser-Cascade 88 - 84 - Msk Msk079 Cowichan Valley 98 - 98 93 100 Msk081 Fort Nelson 92 - 92 Msk - -082 Coast Mountains 95 - 91 Msk Msk Msk083 North Okanagan-Shuswap 96 - 94 - Msk Msk084 Vancouver Island West 67 - 68 - - -085 Vancouver Island North 97 - 91 - - -087 Stikine 40 - Msk - - -091 Nechako Lakes 92 - 96 - 93 Msk092 Nisga'a 46 - 72 - Msk Msk093 Conseil scolaire francophone 99 96 97 - Msk Msk
All Public Only 95 96 95 93 96 92All Independent Only 99 - 98 Msk 93 97
96 96 95 94 96 92
1. Marks presented here combine the Course and Exam Mark (Final Blended Mark)
School District
Province (Pub. + Ind.)
Grade 10 Exams Pass Rate (%) by School District, 2010/11
English 10 Français Langue Première 10 Science 10 Applications of
Mathematics 10Essentials of
Mathematics 10Principles of
Mathematics 10
Page 398 EDU-2013-00071 - PHASE 1
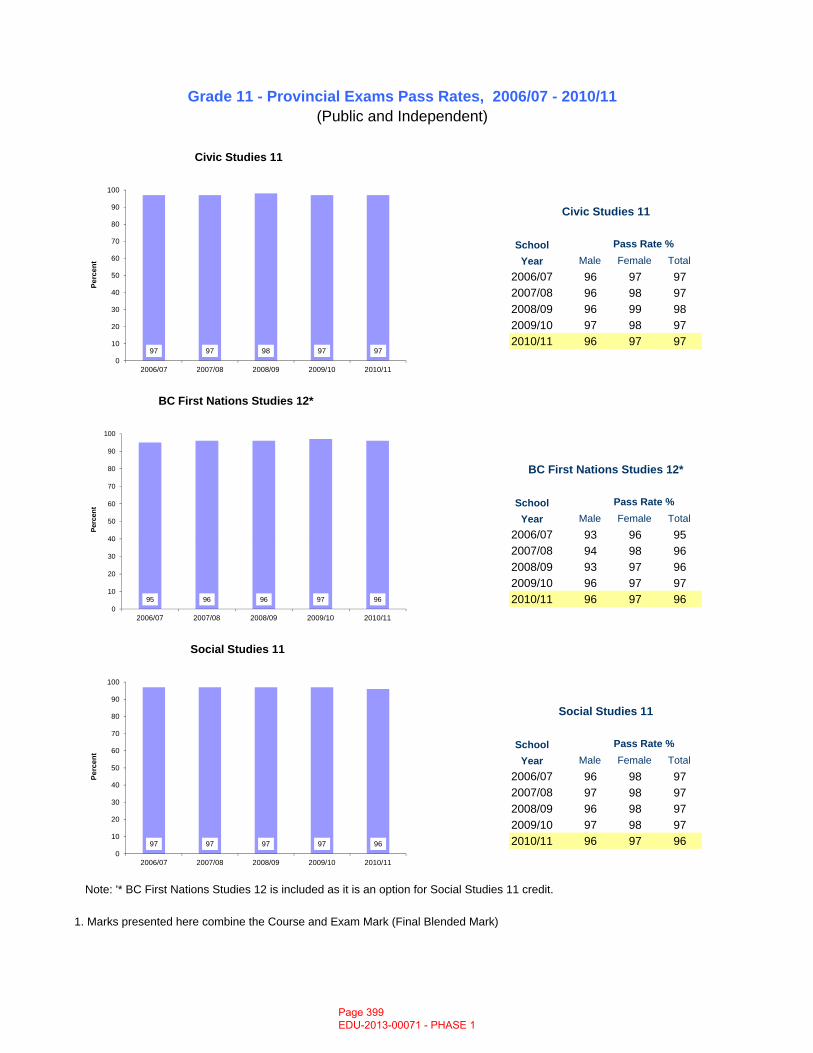
School Year Male Female Total
2006/07 96 97 972007/08 96 98 972008/09 96 99 982009/10 97 98 972010/11 96 97 97
School Year Male Female Total
2006/07 93 96 952007/08 94 98 962008/09 93 97 96
Pass Rate %
BC First Nations Studies 12*
Grade 11 - Provincial Exams Pass Rates, 2006/07 - 2010/11(Public and Independent)
Civic Studies 11
Pass Rate %
97 97 98 97 970
10
20
30
40
50
60
70
80
90
100
2006/07 2007/08 2008/09 2009/10 2010/11
Perc
ent
Civic Studies 11
20
30
40
50
60
70
80
90
100
Perc
ent
BC First Nations Studies 12*
2008/09 93 97 962009/10 96 97 972010/11 96 97 96
School Year Male Female Total
2006/07 96 98 972007/08 97 98 972008/09 96 98 972009/10 97 98 972010/11 96 97 96
Note: '* BC First Nations Studies 12 is included as it is an option for Social Studies 11 credit.
1. Marks presented here combine the Course and Exam Mark (Final Blended Mark)
Pass Rate %
Social Studies 11
95 96 96 97 960
10
20
30
40
2006/07 2007/08 2008/09 2009/10 2010/11
97 97 97 97 960
10
20
30
40
50
60
70
80
90
100
2006/07 2007/08 2008/09 2009/10 2010/11
Perc
ent
Social Studies 11
Page 399 EDU-2013-00071 - PHASE 1
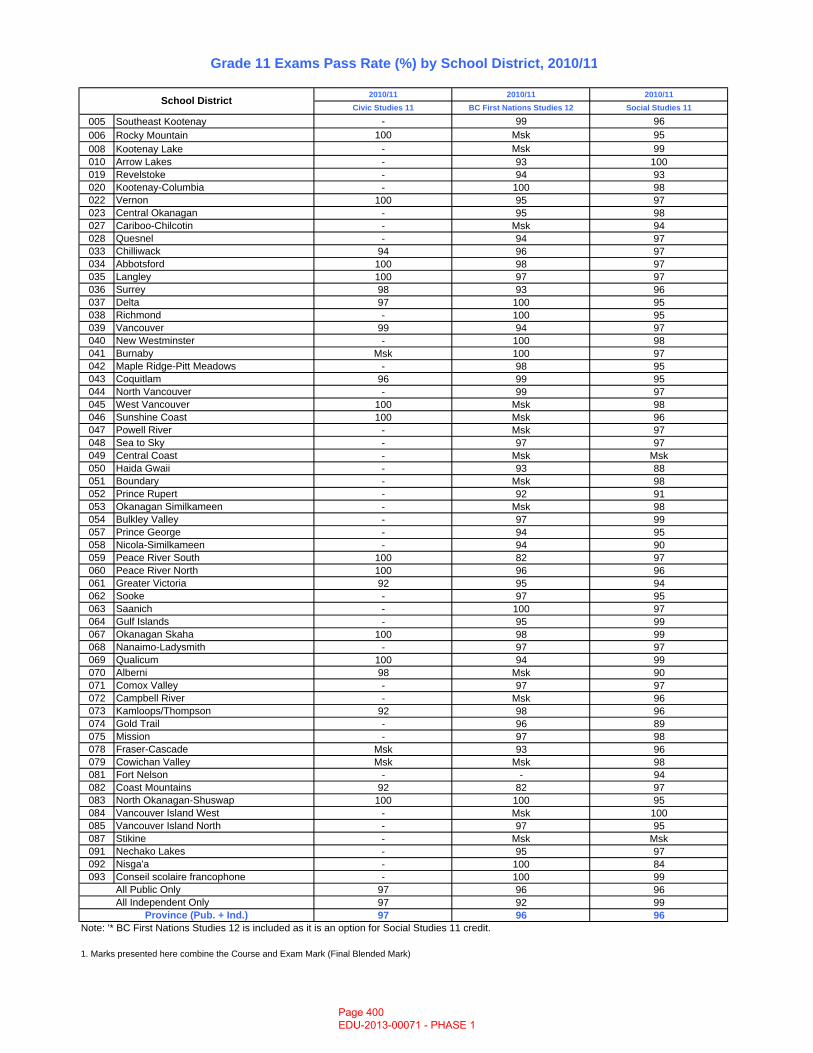
2010/11 2010/11 2010/11Civic Studies 11 BC First Nations Studies 12 Social Studies 11
005 Southeast Kootenay - 99 96006 Rocky Mountain 100 Msk 95008 Kootenay Lake - Msk 99010 Arrow Lakes - 93 100019 Revelstoke - 94 93020 Kootenay-Columbia - 100 98022 Vernon 100 95 97023 Central Okanagan - 95 98027 Cariboo-Chilcotin - Msk 94028 Quesnel - 94 97033 Chilliwack 94 96 97034 Abbotsford 100 98 97035 Langley 100 97 97036 Surrey 98 93 96037 Delta 97 100 95038 Richmond - 100 95039 Vancouver 99 94 97040 New Westminster - 100 98041 Burnaby Msk 100 97042 Maple Ridge-Pitt Meadows - 98 95043 Coquitlam 96 99 95044 North Vancouver - 99 97045 West Vancouver 100 Msk 98046 Sunshine Coast 100 Msk 96047 Powell River - Msk 97048 Sea to Sky - 97 97049 Central Coast - Msk Msk050 Haida Gwaii - 93 88051 Boundary - Msk 98052 Prince Rupert - 92 91053 Okanagan Similkameen - Msk 98054 Bulkley Valley - 97 99057 Prince George - 94 95058 Nicola-Similkameen - 94 90059 Peace River South 100 82 97060 Peace River North 100 96 96061 Greater Victoria 92 95 94062 Sooke - 97 95063 Saanich - 100 97064 Gulf Islands - 95 99067 Okanagan Skaha 100 98 99068 Nanaimo-Ladysmith - 97 97069 Qualicum 100 94 99070 Alberni 98 Msk 90071 Comox Valley - 97 97072 Campbell River - Msk 96073 Kamloops/Thompson 92 98 96074 Gold Trail - 96 89075 Mission - 97 98078 Fraser-Cascade Msk 93 96079 Cowichan Valley Msk Msk 98081 Fort Nelson - - 94082 Coast Mountains 92 82 97083 North Okanagan-Shuswap 100 100 95084 Vancouver Island West - Msk 100085 Vancouver Island North - 97 95087 Stikine - Msk Msk091 Nechako Lakes - 95 97092 Nisga'a - 100 84093 Conseil scolaire francophone - 100 99
All Public Only 97 96 96All Independent Only 97 92 99
97 96 96Note: '* BC First Nations Studies 12 is included as it is an option for Social Studies 11 credit.
1. Marks presented here combine the Course and Exam Mark (Final Blended Mark)
Grade 11 Exams Pass Rate (%) by School District, 2010/11
School District
Province (Pub. + Ind.)
Page 400 EDU-2013-00071 - PHASE 1
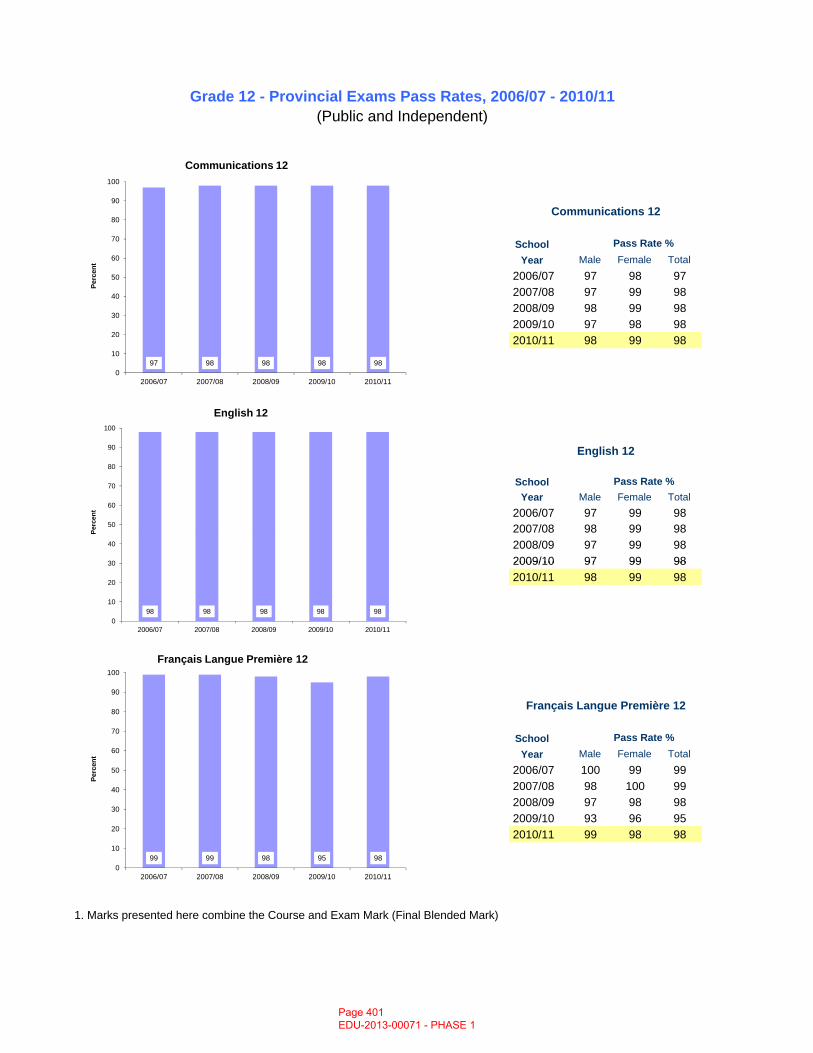
School Year Male Female Total
2006/07 97 98 972007/08 97 99 982008/09 98 99 982009/10 97 98 982010/11 98 99 98
School Year Male Female Total
2006/07 97 99 982007/08 98 99 982008/09 97 99 982009/10 97 99 98
Pass Rate %
Grade 12 - Provincial Exams Pass Rates, 2006/07 - 2010/11(Public and Independent)
Communications 12
Pass Rate %
English 12
97 98 98 98 980
10
20
30
40
50
60
70
80
90
100
2006/07 2007/08 2008/09 2009/10 2010/11
Perc
ent
Communications 12
30
40
50
60
70
80
90
100
Perc
ent
English 12
2009/10 97 99 982010/11 98 99 98
School Year Male Female Total
2006/07 100 99 992007/08 98 100 992008/09 97 98 982009/10 93 96 952010/11 99 98 98
1. Marks presented here combine the Course and Exam Mark (Final Blended Mark)
Pass Rate %
Français Langue Première 12
98 98 98 98 980
10
20
30
40
2006/07 2007/08 2008/09 2009/10 2010/11
99 99 98 95 980
10
20
30
40
50
60
70
80
90
100
2006/07 2007/08 2008/09 2009/10 2010/11
Perc
ent
Français Langue Première 12
Page 401 EDU-2013-00071 - PHASE 1
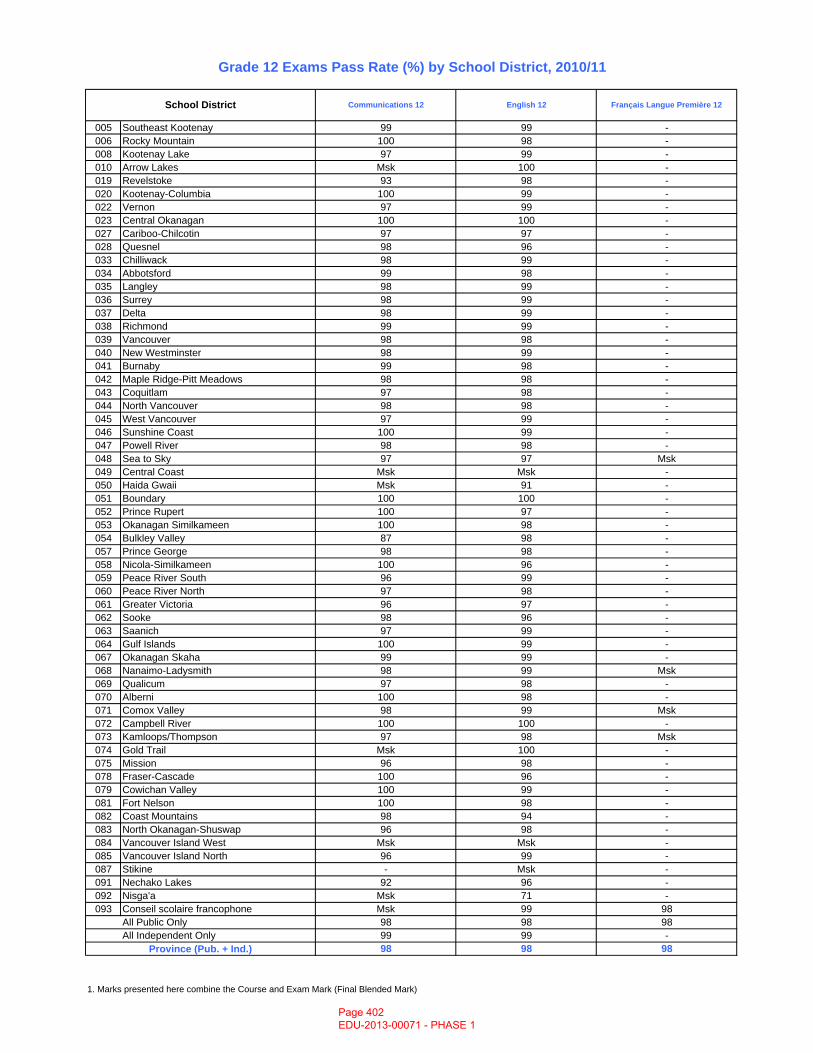
005 Southeast Kootenay 99 99 -006 Rocky Mountain 100 98 -008 Kootenay Lake 97 99 -010 Arrow Lakes Msk 100 -019 Revelstoke 93 98 -020 Kootenay-Columbia 100 99 -022 Vernon 97 99 -023 Central Okanagan 100 100 -027 Cariboo-Chilcotin 97 97 -028 Quesnel 98 96 -033 Chilliwack 98 99 -034 Abbotsford 99 98 -035 Langley 98 99 -036 Surrey 98 99 -037 Delta 98 99 -038 Richmond 99 99 -039 Vancouver 98 98 -040 New Westminster 98 99 -041 Burnaby 99 98 -042 Maple Ridge-Pitt Meadows 98 98 -043 Coquitlam 97 98 -044 North Vancouver 98 98 -045 West Vancouver 97 99 -046 Sunshine Coast 100 99 -047 Powell River 98 98 -048 Sea to Sky 97 97 Msk049 Central Coast Msk Msk -050 Haida Gwaii Msk 91 -051 Boundary 100 100 -052 Prince Rupert 100 97 -053 Okanagan Similkameen 100 98 -054 Bulkley Valley 87 98 -057 Prince George 98 98 -058 Nicola-Similkameen 100 96 -059 Peace River South 96 99 -060 Peace River North 97 98 -061 Greater Victoria 96 97 -062 Sooke 98 96 -063 Saanich 97 99 -064 Gulf Islands 100 99 -067 Okanagan Skaha 99 99 -068 Nanaimo-Ladysmith 98 99 Msk069 Qualicum 97 98 -070 Alberni 100 98 -071 Comox Valley 98 99 Msk072 Campbell River 100 100 -073 Kamloops/Thompson 97 98 Msk074 Gold Trail Msk 100 -075 Mission 96 98 -078 Fraser-Cascade 100 96 -079 Cowichan Valley 100 99 -081 Fort Nelson 100 98 -082 Coast Mountains 98 94 -083 North Okanagan-Shuswap 96 98 -084 Vancouver Island West Msk Msk -085 Vancouver Island North 96 99 -087 Stikine - Msk -091 Nechako Lakes 92 96 -092 Nisga'a Msk 71 -093 Conseil scolaire francophone Msk 99 98
All Public Only 98 98 98All Independent Only 99 99 -
98 98 98
1. Marks presented here combine the Course and Exam Mark (Final Blended Mark)
School District
Province (Pub. + Ind.)
Grade 12 Exams Pass Rate (%) by School District, 2010/11
Communications 12 English 12 Français Langue Première 12
Page 402 EDU-2013-00071 - PHASE 1
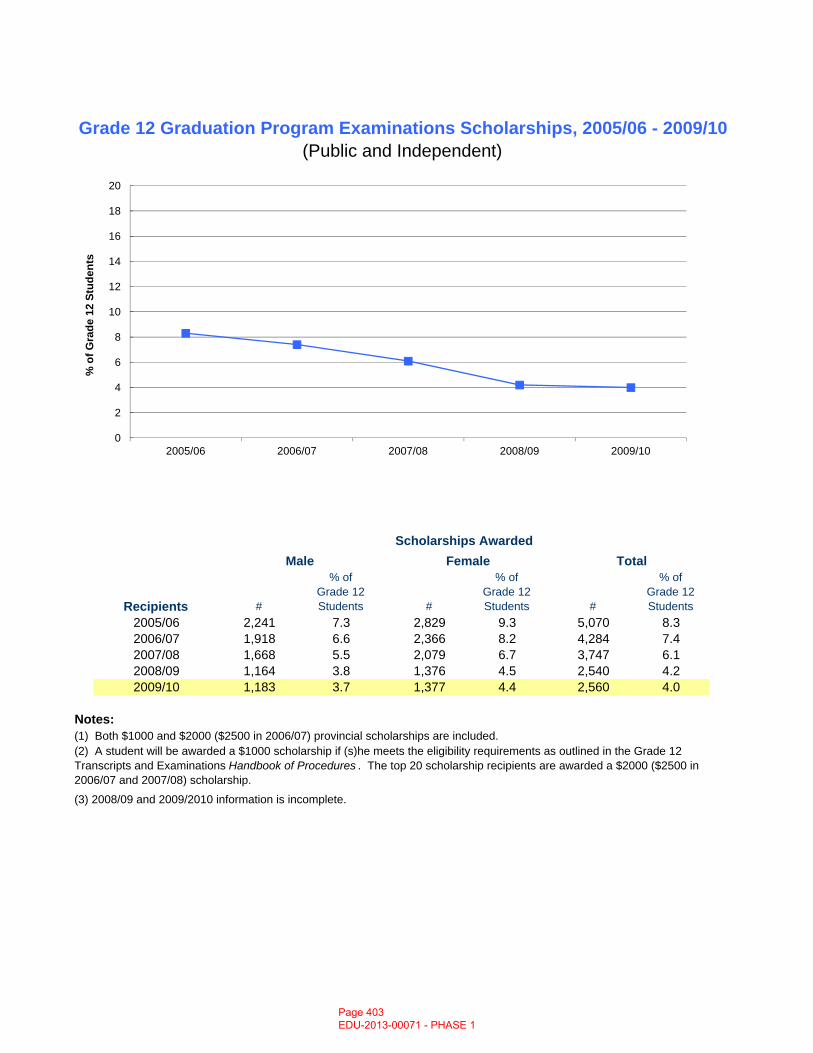
% of G
% of G
% of G
Grade 12 Graduation Program Examinations Scholarships, 2005/06 - 2009/10(Public and Independent)
Scholarships AwardedMale TotalFemale
0
2
4
6
8
10
12
14
16
18
20
2005/06 2006/07 2007/08 2008/09 2009/10
% o
f Gra
de 1
2 St
uden
ts
#Grade 12 Students #
Grade 12 Students #
Grade 12 Students
2005/06 2,241 7.3 2,829 9.3 5,070 8.32006/07 1,918 6.6 2,366 8.2 4,284 7.42007/08 1,668 5.5 2,079 6.7 3,747 6.12008/09 1,164 3.8 1,376 4.5 2,540 4.22009/10 1,183 3.7 1,377 4.4 2,560 4.0
Notes:(1) Both $1000 and $2000 ($2500 in 2006/07) provincial scholarships are included.
(3) 2008/09 and 2009/2010 information is incomplete.
(2) A student will be awarded a $1000 scholarship if (s)he meets the eligibility requirements as outlined in the Grade 12 Transcripts and Examinations Handbook of Procedures . The top 20 scholarship recipients are awarded a $2000 ($2500 in 2006/07 and 2007/08) scholarship.
Recipients
Page 403 EDU-2013-00071 - PHASE 1
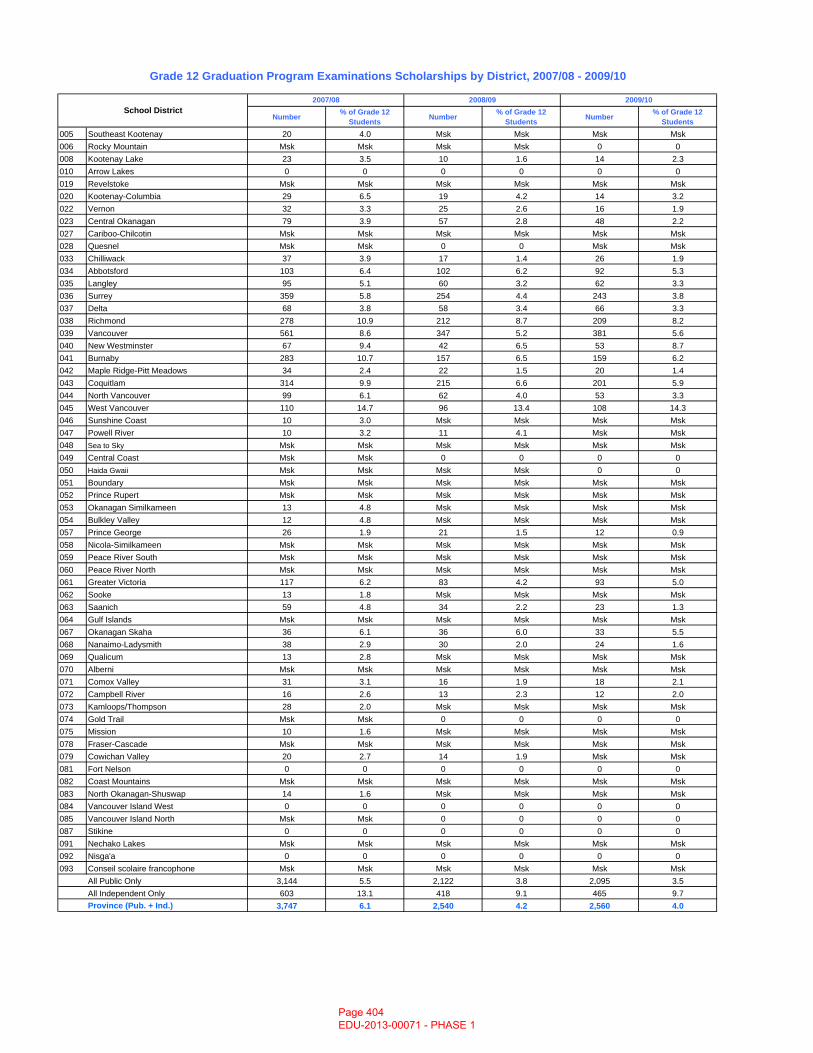
Number % of Grade 12 Students Number % of Grade 12
Students Number % of Grade 12 Students
005 Southeast Kootenay 20 4.0 Msk Msk Msk Msk006 Rocky Mountain Msk Msk Msk Msk 0 0008 Kootenay Lake 23 3.5 10 1.6 14 2.3010 Arrow Lakes 0 0 0 0 0 0019 Revelstoke Msk Msk Msk Msk Msk Msk020 Kootenay-Columbia 29 6.5 19 4.2 14 3.2022 Vernon 32 3.3 25 2.6 16 1.9023 Central Okanagan 79 3.9 57 2.8 48 2.2027 Cariboo-Chilcotin Msk Msk Msk Msk Msk Msk028 Quesnel Msk Msk 0 0 Msk Msk033 Chilliwack 37 3.9 17 1.4 26 1.9034 Abbotsford 103 6.4 102 6.2 92 5.3035 Langley 95 5.1 60 3.2 62 3.3036 Surrey 359 5.8 254 4.4 243 3.8037 Delta 68 3.8 58 3.4 66 3.3038 Richmond 278 10.9 212 8.7 209 8.2039 Vancouver 561 8.6 347 5.2 381 5.6040 New Westminster 67 9.4 42 6.5 53 8.7041 Burnaby 283 10.7 157 6.5 159 6.2042 Maple Ridge-Pitt Meadows 34 2.4 22 1.5 20 1.4043 Coquitlam 314 9.9 215 6.6 201 5.9044 North Vancouver 99 6.1 62 4.0 53 3.3045 West Vancouver 110 14.7 96 13.4 108 14.3046 Sunshine Coast 10 3.0 Msk Msk Msk Msk047 Powell River 10 3.2 11 4.1 Msk Msk048 Sea to Sky Msk Msk Msk Msk Msk Msk049 Central Coast Msk Msk 0 0 0 0050 Haida Gwaii Msk Msk Msk Msk 0 0051 Boundary Msk Msk Msk Msk Msk Msk052 Prince Rupert Msk Msk Msk Msk Msk Msk053 Okanagan Similkameen 13 4.8 Msk Msk Msk Msk054 Bulkley Valley 12 4.8 Msk Msk Msk Msk057 Prince George 26 1.9 21 1.5 12 0.9058 Nicola-Similkameen Msk Msk Msk Msk Msk Msk059 Peace River South Msk Msk Msk Msk Msk Msk060 Peace River North Msk Msk Msk Msk Msk Msk061 Greater Victoria 117 6.2 83 4.2 93 5.0062 Sooke 13 1.8 Msk Msk Msk Msk063 Saanich 59 4.8 34 2.2 23 1.3064 Gulf Islands Msk Msk Msk Msk Msk Msk067 Okanagan Skaha 36 6.1 36 6.0 33 5.5068 Nanaimo-Ladysmith 38 2.9 30 2.0 24 1.6069 Qualicum 13 2.8 Msk Msk Msk Msk070 Alberni Msk Msk Msk Msk Msk Msk071 Comox Valley 31 3.1 16 1.9 18 2.1072 Campbell River 16 2.6 13 2.3 12 2.0073 Kamloops/Thompson 28 2.0 Msk Msk Msk Msk074 Gold Trail Msk Msk 0 0 0 0075 Mission 10 1.6 Msk Msk Msk Msk078 Fraser-Cascade Msk Msk Msk Msk Msk Msk079 Cowichan Valley 20 2.7 14 1.9 Msk Msk081 Fort Nelson 0 0 0 0 0 0082 Coast Mountains Msk Msk Msk Msk Msk Msk083 North Okanagan-Shuswap 14 1.6 Msk Msk Msk Msk084 Vancouver Island West 0 0 0 0 0 0085 Vancouver Island North Msk Msk 0 0 0 0087 Stikine 0 0 0 0 0 0091 Nechako Lakes Msk Msk Msk Msk Msk Msk092 Nisga'a 0 0 0 0 0 0093 Conseil scolaire francophone Msk Msk Msk Msk Msk Msk
All Public Only 3,144 5.5 2,122 3.8 2,095 3.5All Independent Only 603 13.1 418 9.1 465 9.7Province (Pub. + Ind.) 3,747 6.1 2,540 4.2 2,560 4.0
Grade 12 Graduation Program Examinations Scholarships by District, 2007/08 - 2009/10
School District2007/08 2009/102008/09
Page 404 EDU-2013-00071 - PHASE 1
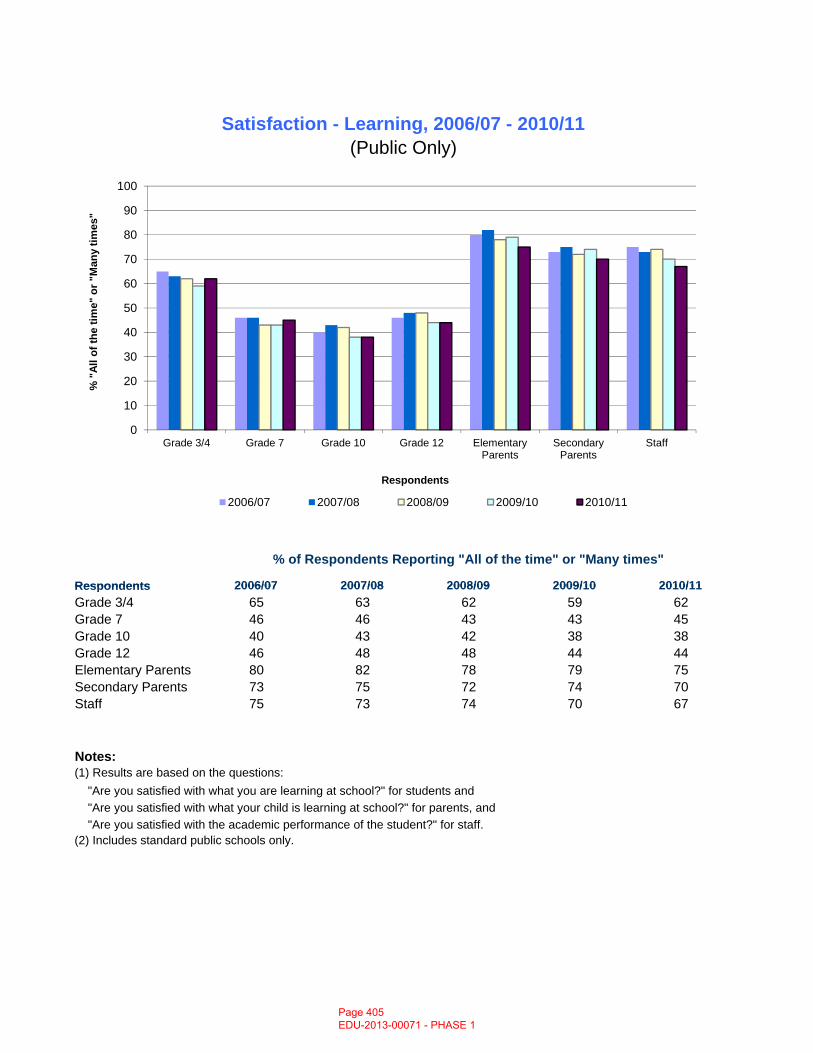
2006/07 2007/08 2008/09 2009/10 2010/11
Satisfaction - Learning, 2006/07 - 2010/11
Respondents
(Public Only)
% of Respondents Reporting "All of the time" or "Many times"
0
10
20
30
40
50
60
70
80
90
100
Grade 3/4 Grade 7 Grade 10 Grade 12 Elementary Parents
Secondary Parents
Staff
% "
All o
f the
tim
e" o
r "M
any
times
"
Respondents
2006/07 2007/08 2008/09 2009/10 2010/11
2006/07 2007/08 2008/09 2009/10 2010/11Grade 3/4 65 63 62 59 62Grade 7 46 46 43 43 45Grade 10 40 43 42 38 38Grade 12 46 48 48 44 44Elementary Parents 80 82 78 79 75Secondary Parents 73 75 72 74 70Staff 75 73 74 70 67
Notes:
"Are you satisfied with what you are learning at school?" for students and "Are you satisfied with what your child is learning at school?" for parents, and "Are you satisfied with the academic performance of the student?" for staff.(2) Includes standard public schools only.
(1) Results are based on the questions:
Respondents
Page 405 EDU-2013-00071 - PHASE 1
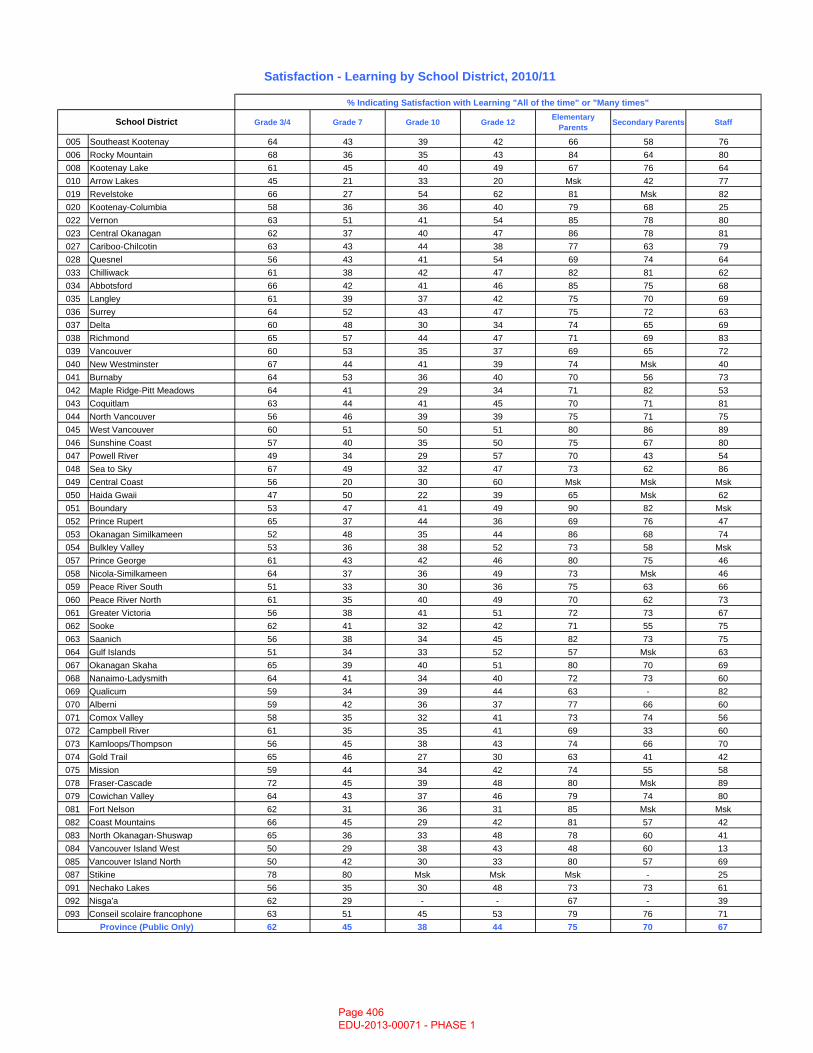
Grade 3/4 Grade 7 Grade 10 Grade 12 Elementary Parents Secondary Parents Staff
005 Southeast Kootenay 64 43 39 42 66 58 76006 Rocky Mountain 68 36 35 43 84 64 80008 Kootenay Lake 61 45 40 49 67 76 64010 Arrow Lakes 45 21 33 20 Msk 42 77019 Revelstoke 66 27 54 62 81 Msk 82020 Kootenay-Columbia 58 36 36 40 79 68 25022 Vernon 63 51 41 54 85 78 80023 Central Okanagan 62 37 40 47 86 78 81027 Cariboo-Chilcotin 63 43 44 38 77 63 79028 Quesnel 56 43 41 54 69 74 64033 Chilliwack 61 38 42 47 82 81 62034 Abbotsford 66 42 41 46 85 75 68035 Langley 61 39 37 42 75 70 69036 Surrey 64 52 43 47 75 72 63037 Delta 60 48 30 34 74 65 69038 Richmond 65 57 44 47 71 69 83039 Vancouver 60 53 35 37 69 65 72040 New Westminster 67 44 41 39 74 Msk 40041 Burnaby 64 53 36 40 70 56 73042 Maple Ridge-Pitt Meadows 64 41 29 34 71 82 53043 Coquitlam 63 44 41 45 70 71 81044 North Vancouver 56 46 39 39 75 71 75045 West Vancouver 60 51 50 51 80 86 89046 Sunshine Coast 57 40 35 50 75 67 80047 Powell River 49 34 29 57 70 43 54048 Sea to Sky 67 49 32 47 73 62 86049 Central Coast 56 20 30 60 Msk Msk Msk050 Haida Gwaii 47 50 22 39 65 Msk 62051 Boundary 53 47 41 49 90 82 Msk052 Prince Rupert 65 37 44 36 69 76 47053 Okanagan Similkameen 52 48 35 44 86 68 74054 Bulkley Valley 53 36 38 52 73 58 Msk057 Prince George 61 43 42 46 80 75 46058 Nicola-Similkameen 64 37 36 49 73 Msk 46059 Peace River South 51 33 30 36 75 63 66060 Peace River North 61 35 40 49 70 62 73061 Greater Victoria 56 38 41 51 72 73 67062 Sooke 62 41 32 42 71 55 75063 Saanich 56 38 34 45 82 73 75064 Gulf Islands 51 34 33 52 57 Msk 63067 Okanagan Skaha 65 39 40 51 80 70 69068 Nanaimo-Ladysmith 64 41 34 40 72 73 60069 Qualicum 59 34 39 44 63 - 82070 Alberni 59 42 36 37 77 66 60071 Comox Valley 58 35 32 41 73 74 56072 Campbell River 61 35 35 41 69 33 60073 Kamloops/Thompson 56 45 38 43 74 66 70074 Gold Trail 65 46 27 30 63 41 42075 Mission 59 44 34 42 74 55 58078 Fraser-Cascade 72 45 39 48 80 Msk 89079 Cowichan Valley 64 43 37 46 79 74 80081 Fort Nelson 62 31 36 31 85 Msk Msk082 Coast Mountains 66 45 29 42 81 57 42083 North Okanagan-Shuswap 65 36 33 48 78 60 41084 Vancouver Island West 50 29 38 43 48 60 13085 Vancouver Island North 50 42 30 33 80 57 69087 Stikine 78 80 Msk Msk Msk - 25091 Nechako Lakes 56 35 30 48 73 73 61092 Nisga'a 62 29 - - 67 - 39093 Conseil scolaire francophone 63 51 45 53 79 76 71
62 45 38 44 75 70 67
% Indicating Satisfaction with Learning "All of the time" or "Many times"
Satisfaction - Learning by School District, 2010/11
Province (Public Only)
School District
Page 406 EDU-2013-00071 - PHASE 1
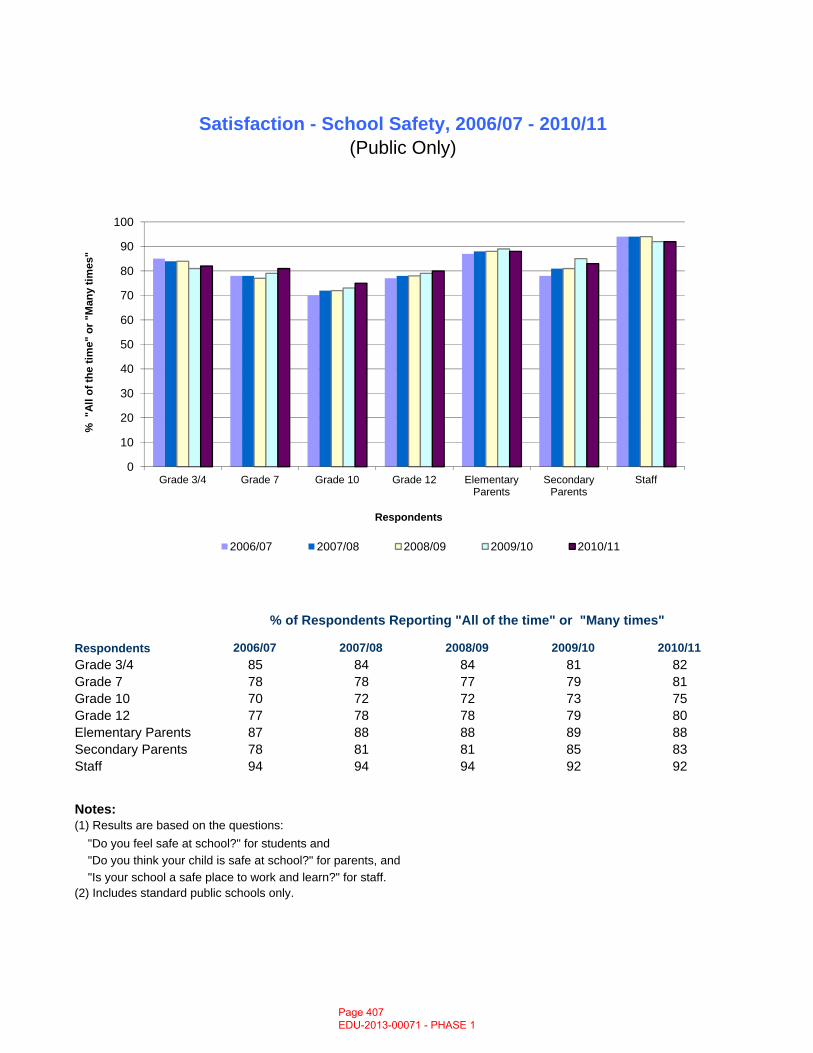
Satisfaction - School Safety, 2006/07 - 2010/11(Public Only)
0
10
20
30
40
50
60
70
80
90
100
Grade 3/4 Grade 7 Grade 10 Grade 12 Elementary Parents
Secondary Parents
Staff
% "
All o
f the
tim
e" o
r "M
any
times
"
Respondents
2006/07 2007/08 2008/09 2009/10 2010/11
2006/07 2007/08 2008/09 2009/10 2010/11Grade 3/4 85 84 84 81 82Grade 7 78 78 77 79 81Grade 10 70 72 72 73 75Grade 12 77 78 78 79 80Elementary Parents 87 88 88 89 88Secondary Parents 78 81 81 85 83Staff 94 94 94 92 92
Notes:
"Do you feel safe at school?" for students and "Do you think your child is safe at school?" for parents, and "Is your school a safe place to work and learn?" for staff.(2) Includes standard public schools only.
(1) Results are based on the questions:
Respondents
% of Respondents Reporting "All of the time" or "Many times"
Page 407 EDU-2013-00071 - PHASE 1
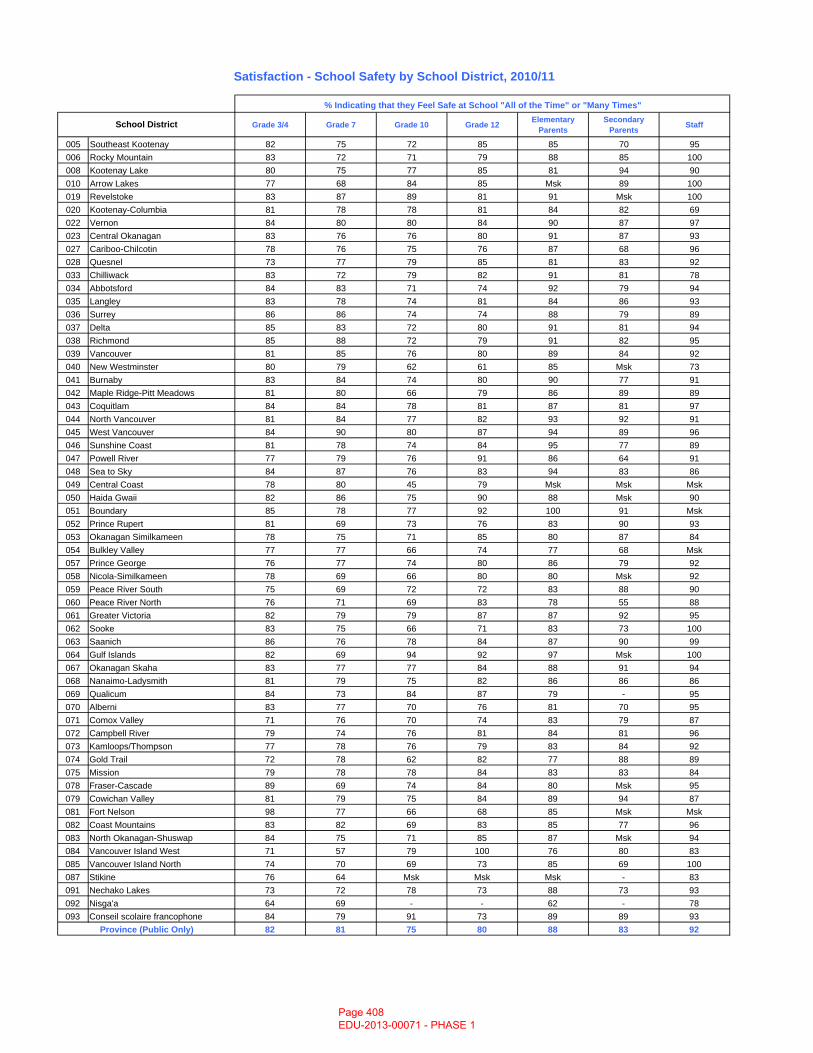
Grade 3/4 Grade 7 Grade 10 Grade 12 Elementary Parents
Secondary Parents Staff
005 Southeast Kootenay 82 75 72 85 85 70 95006 Rocky Mountain 83 72 71 79 88 85 100008 Kootenay Lake 80 75 77 85 81 94 90010 Arrow Lakes 77 68 84 85 Msk 89 100019 Revelstoke 83 87 89 81 91 Msk 100020 Kootenay-Columbia 81 78 78 81 84 82 69022 Vernon 84 80 80 84 90 87 97023 Central Okanagan 83 76 76 80 91 87 93027 Cariboo-Chilcotin 78 76 75 76 87 68 96028 Quesnel 73 77 79 85 81 83 92033 Chilliwack 83 72 79 82 91 81 78034 Abbotsford 84 83 71 74 92 79 94035 Langley 83 78 74 81 84 86 93036 Surrey 86 86 74 74 88 79 89037 Delta 85 83 72 80 91 81 94038 Richmond 85 88 72 79 91 82 95039 Vancouver 81 85 76 80 89 84 92040 New Westminster 80 79 62 61 85 Msk 73041 Burnaby 83 84 74 80 90 77 91042 Maple Ridge-Pitt Meadows 81 80 66 79 86 89 89043 Coquitlam 84 84 78 81 87 81 97044 North Vancouver 81 84 77 82 93 92 91045 West Vancouver 84 90 80 87 94 89 96046 Sunshine Coast 81 78 74 84 95 77 89047 Powell River 77 79 76 91 86 64 91048 Sea to Sky 84 87 76 83 94 83 86049 Central Coast 78 80 45 79 Msk Msk Msk050 Haida Gwaii 82 86 75 90 88 Msk 90051 Boundary 85 78 77 92 100 91 Msk052 Prince Rupert 81 69 73 76 83 90 93053 Okanagan Similkameen 78 75 71 85 80 87 84054 Bulkley Valley 77 77 66 74 77 68 Msk057 Prince George 76 77 74 80 86 79 92058 Nicola-Similkameen 78 69 66 80 80 Msk 92059 Peace River South 75 69 72 72 83 88 90060 Peace River North 76 71 69 83 78 55 88061 Greater Victoria 82 79 79 87 87 92 95062 Sooke 83 75 66 71 83 73 100063 Saanich 86 76 78 84 87 90 99064 Gulf Islands 82 69 94 92 97 Msk 100067 Okanagan Skaha 83 77 77 84 88 91 94068 Nanaimo-Ladysmith 81 79 75 82 86 86 86069 Qualicum 84 73 84 87 79 - 95070 Alberni 83 77 70 76 81 70 95071 Comox Valley 71 76 70 74 83 79 87072 Campbell River 79 74 76 81 84 81 96073 Kamloops/Thompson 77 78 76 79 83 84 92074 Gold Trail 72 78 62 82 77 88 89075 Mission 79 78 78 84 83 83 84078 Fraser-Cascade 89 69 74 84 80 Msk 95079 Cowichan Valley 81 79 75 84 89 94 87081 Fort Nelson 98 77 66 68 85 Msk Msk082 Coast Mountains 83 82 69 83 85 77 96083 North Okanagan-Shuswap 84 75 71 85 87 Msk 94084 Vancouver Island West 71 57 79 100 76 80 83085 Vancouver Island North 74 70 69 73 85 69 100087 Stikine 76 64 Msk Msk Msk - 83091 Nechako Lakes 73 72 78 73 88 73 93092 Nisga'a 64 69 - - 62 - 78093 Conseil scolaire francophone 84 79 91 73 89 89 93
82 81 75 80 88 83 92
Satisfaction - School Safety by School District, 2010/11
Province (Public Only)
% Indicating that they Feel Safe at School "All of the Time" or "Many Times"
School District
Page 408 EDU-2013-00071 - PHASE 1
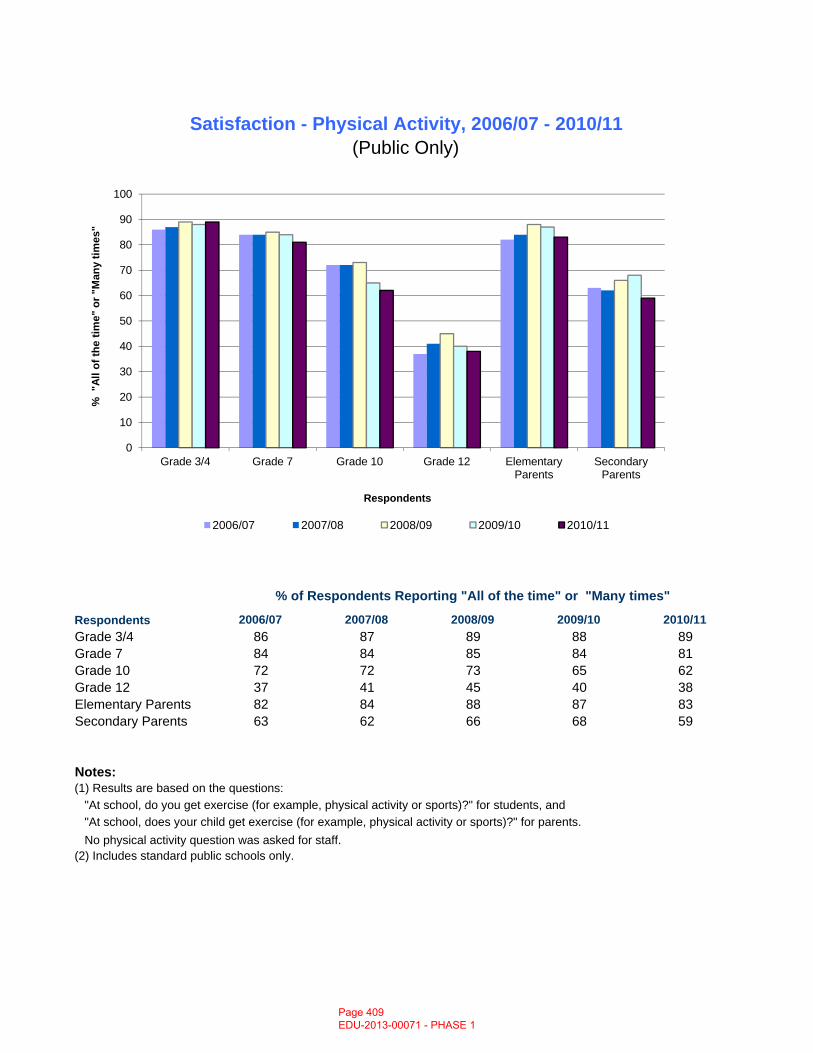
Satisfaction - Physical Activity, 2006/07 - 2010/11(Public Only)
0
10
20
30
40
50
60
70
80
90
100
Grade 3/4 Grade 7 Grade 10 Grade 12 Elementary Parents
Secondary Parents
% "
All o
f the
tim
e" o
r "M
any
times
"
Respondents
2006/07 2007/08 2008/09 2009/10 2010/11
2006/07 2007/08 2008/09 2009/10 2010/11Grade 3/4 86 87 89 88 89Grade 7 84 84 85 84 81Grade 10 72 72 73 65 62Grade 12 37 41 45 40 38Elementary Parents 82 84 88 87 83Secondary Parents 63 62 66 68 59
Notes:
No physical activity question was asked for staff.(2) Includes standard public schools only.
"At school, does your child get exercise (for example, physical activity or sports)?" for parents.
Respondents
% of Respondents Reporting "All of the time" or "Many times"
(1) Results are based on the questions: "At school, do you get exercise (for example, physical activity or sports)?" for students, and
Page 409 EDU-2013-00071 - PHASE 1
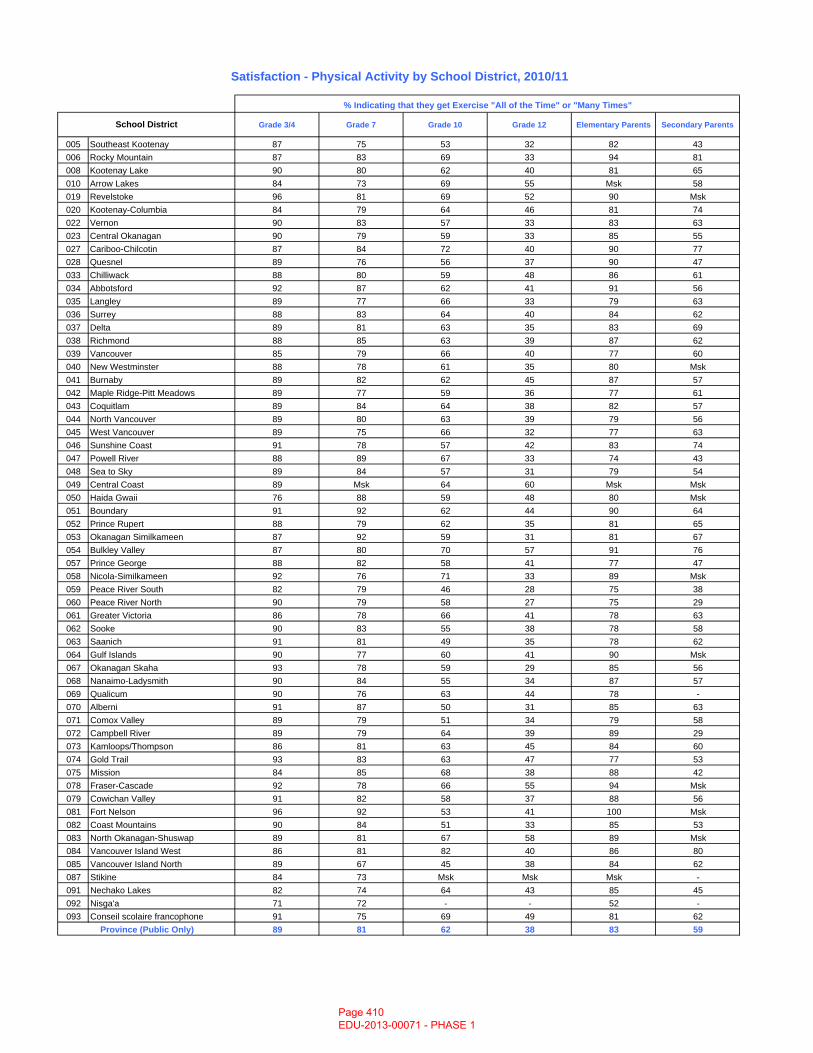
Grade 3/4 Grade 7 Grade 10 Grade 12 Elementary Parents Secondary Parents
005 Southeast Kootenay 87 75 53 32 82 43006 Rocky Mountain 87 83 69 33 94 81008 Kootenay Lake 90 80 62 40 81 65010 Arrow Lakes 84 73 69 55 Msk 58019 Revelstoke 96 81 69 52 90 Msk020 Kootenay-Columbia 84 79 64 46 81 74022 Vernon 90 83 57 33 83 63023 Central Okanagan 90 79 59 33 85 55027 Cariboo-Chilcotin 87 84 72 40 90 77028 Quesnel 89 76 56 37 90 47033 Chilliwack 88 80 59 48 86 61034 Abbotsford 92 87 62 41 91 56035 Langley 89 77 66 33 79 63036 Surrey 88 83 64 40 84 62037 Delta 89 81 63 35 83 69038 Richmond 88 85 63 39 87 62039 Vancouver 85 79 66 40 77 60040 New Westminster 88 78 61 35 80 Msk041 Burnaby 89 82 62 45 87 57042 Maple Ridge-Pitt Meadows 89 77 59 36 77 61043 Coquitlam 89 84 64 38 82 57044 North Vancouver 89 80 63 39 79 56045 West Vancouver 89 75 66 32 77 63046 Sunshine Coast 91 78 57 42 83 74047 Powell River 88 89 67 33 74 43048 Sea to Sky 89 84 57 31 79 54049 Central Coast 89 Msk 64 60 Msk Msk050 Haida Gwaii 76 88 59 48 80 Msk051 Boundary 91 92 62 44 90 64052 Prince Rupert 88 79 62 35 81 65053 Okanagan Similkameen 87 92 59 31 81 67054 Bulkley Valley 87 80 70 57 91 76057 Prince George 88 82 58 41 77 47058 Nicola-Similkameen 92 76 71 33 89 Msk059 Peace River South 82 79 46 28 75 38060 Peace River North 90 79 58 27 75 29061 Greater Victoria 86 78 66 41 78 63062 Sooke 90 83 55 38 78 58063 Saanich 91 81 49 35 78 62064 Gulf Islands 90 77 60 41 90 Msk067 Okanagan Skaha 93 78 59 29 85 56068 Nanaimo-Ladysmith 90 84 55 34 87 57069 Qualicum 90 76 63 44 78 -070 Alberni 91 87 50 31 85 63071 Comox Valley 89 79 51 34 79 58072 Campbell River 89 79 64 39 89 29073 Kamloops/Thompson 86 81 63 45 84 60074 Gold Trail 93 83 63 47 77 53075 Mission 84 85 68 38 88 42078 Fraser-Cascade 92 78 66 55 94 Msk079 Cowichan Valley 91 82 58 37 88 56081 Fort Nelson 96 92 53 41 100 Msk082 Coast Mountains 90 84 51 33 85 53083 North Okanagan-Shuswap 89 81 67 58 89 Msk084 Vancouver Island West 86 81 82 40 86 80085 Vancouver Island North 89 67 45 38 84 62087 Stikine 84 73 Msk Msk Msk -091 Nechako Lakes 82 74 64 43 85 45092 Nisga'a 71 72 - - 52 -093 Conseil scolaire francophone 91 75 69 49 81 62
89 81 62 38 83 59Province (Public Only)
Satisfaction - Physical Activity by School District, 2010/11
School District
% Indicating that they get Exercise "All of the Time" or "Many Times"
Page 410 EDU-2013-00071 - PHASE 1
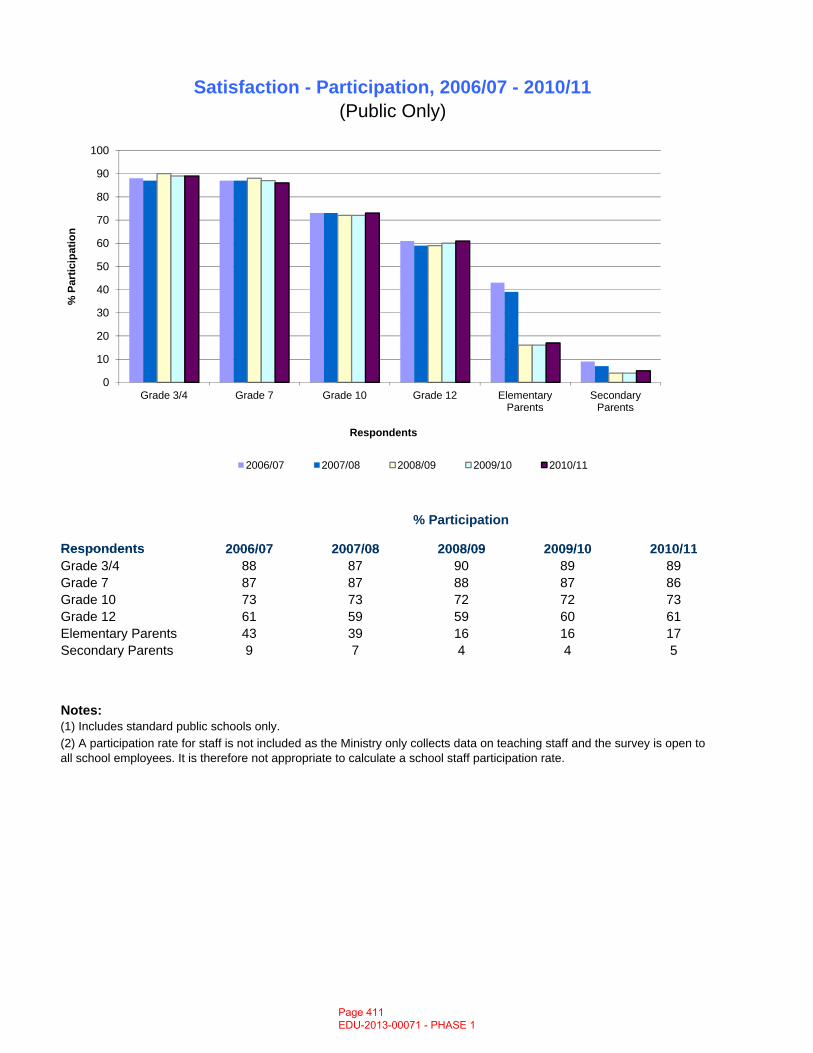
Respondents 2006/07 2007/08 2008/09 2009/10 2010/11
Satisfaction - Participation, 2006/07 - 2010/11(Public Only)
% Participation
0
10
20
30
40
50
60
70
80
90
100
Grade 3/4 Grade 7 Grade 10 Grade 12 Elementary Parents
Secondary Parents
% P
artic
ipat
ion
Respondents
2006/07 2007/08 2008/09 2009/10 2010/11
Respondents 2006/07 2007/08 2008/09 2009/10 2010/11Grade 3/4 88 87 90 89 89Grade 7 87 87 88 87 86Grade 10 73 73 72 72 73Grade 12 61 59 59 60 61Elementary Parents 43 39 16 16 17Secondary Parents 9 7 4 4 5
Notes:(1) Includes standard public schools only.(2) A participation rate for staff is not included as the Ministry only collects data on teaching staff and the survey is open to all school employees. It is therefore not appropriate to calculate a school staff participation rate.
Page 411 EDU-2013-00071 - PHASE 1
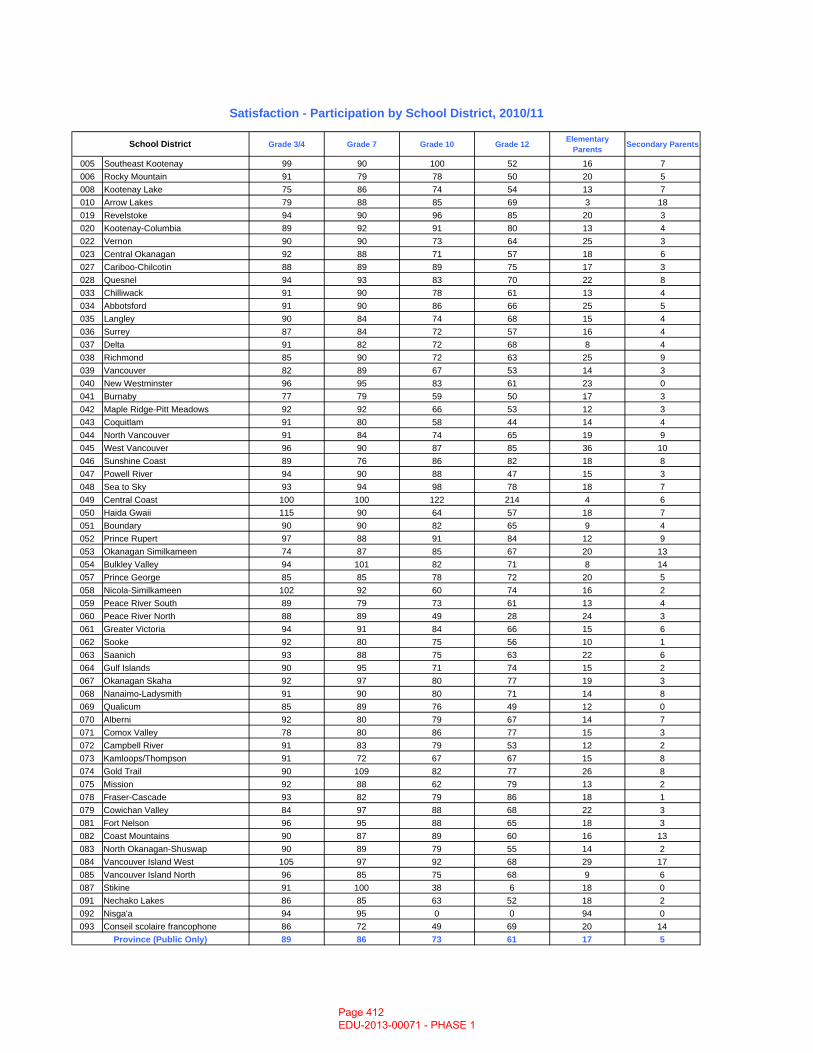
Grade 3/4 Grade 7 Grade 10 Grade 12 Elementary Parents Secondary Parents
005 Southeast Kootenay 99 90 100 52 16 7006 Rocky Mountain 91 79 78 50 20 5008 Kootenay Lake 75 86 74 54 13 7010 Arrow Lakes 79 88 85 69 3 18019 Revelstoke 94 90 96 85 20 3020 Kootenay-Columbia 89 92 91 80 13 4022 Vernon 90 90 73 64 25 3023 Central Okanagan 92 88 71 57 18 6027 Cariboo-Chilcotin 88 89 89 75 17 3028 Quesnel 94 93 83 70 22 8033 Chilliwack 91 90 78 61 13 4034 Abbotsford 91 90 86 66 25 5035 Langley 90 84 74 68 15 4036 Surrey 87 84 72 57 16 4037 Delta 91 82 72 68 8 4038 Richmond 85 90 72 63 25 9039 Vancouver 82 89 67 53 14 3040 New Westminster 96 95 83 61 23 0041 Burnaby 77 79 59 50 17 3042 Maple Ridge-Pitt Meadows 92 92 66 53 12 3043 Coquitlam 91 80 58 44 14 4044 North Vancouver 91 84 74 65 19 9045 West Vancouver 96 90 87 85 36 10046 Sunshine Coast 89 76 86 82 18 8047 Powell River 94 90 88 47 15 3048 Sea to Sky 93 94 98 78 18 7049 Central Coast 100 100 122 214 4 6050 Haida Gwaii 115 90 64 57 18 7051 Boundary 90 90 82 65 9 4052 Prince Rupert 97 88 91 84 12 9053 Okanagan Similkameen 74 87 85 67 20 13054 Bulkley Valley 94 101 82 71 8 14057 Prince George 85 85 78 72 20 5058 Nicola-Similkameen 102 92 60 74 16 2059 Peace River South 89 79 73 61 13 4060 Peace River North 88 89 49 28 24 3061 Greater Victoria 94 91 84 66 15 6062 Sooke 92 80 75 56 10 1063 Saanich 93 88 75 63 22 6064 Gulf Islands 90 95 71 74 15 2067 Okanagan Skaha 92 97 80 77 19 3068 Nanaimo-Ladysmith 91 90 80 71 14 8069 Qualicum 85 89 76 49 12 0070 Alberni 92 80 79 67 14 7071 Comox Valley 78 80 86 77 15 3072 Campbell River 91 83 79 53 12 2073 Kamloops/Thompson 91 72 67 67 15 8074 Gold Trail 90 109 82 77 26 8075 Mission 92 88 62 79 13 2078 Fraser-Cascade 93 82 79 86 18 1079 Cowichan Valley 84 97 88 68 22 3081 Fort Nelson 96 95 88 65 18 3082 Coast Mountains 90 87 89 60 16 13083 North Okanagan-Shuswap 90 89 79 55 14 2084 Vancouver Island West 105 97 92 68 29 17085 Vancouver Island North 96 85 75 68 9 6087 Stikine 91 100 38 6 18 0091 Nechako Lakes 86 85 63 52 18 2092 Nisga'a 94 95 0 0 94 0093 Conseil scolaire francophone 86 72 49 69 20 14
89 86 73 61 17 5Province (Public Only)
School District
Satisfaction - Participation by School District, 2010/11
Page 412 EDU-2013-00071 - PHASE 1
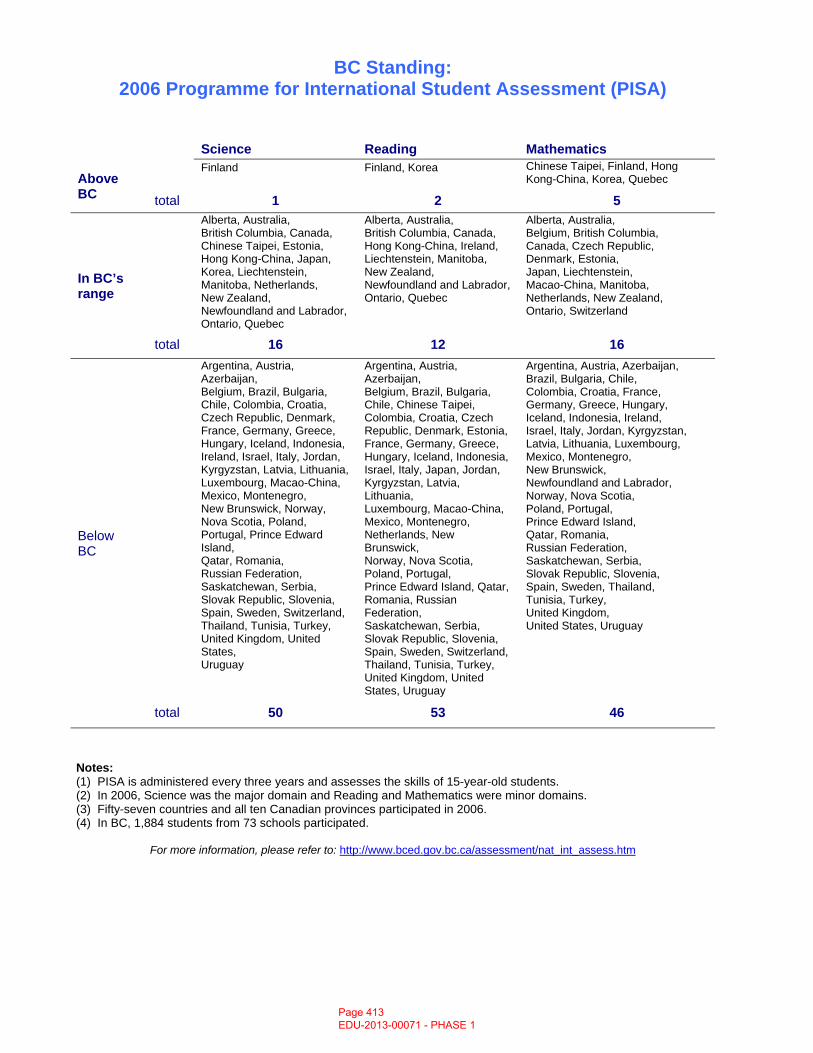
BC Standing: 2006 Programme for International Student Assessment (PISA)
Science Reading Mathematics
Above BC
Finland
Finland, Korea
Chinese Taipei, Finland, Hong Kong-China, Korea, Quebec
total 1 2 5
In BC’s range
Alberta, Australia, British Columbia, Canada, Chinese Taipei, Estonia, Hong Kong-China, Japan, Korea, Liechtenstein, Manitoba, Netherlands, New Zealand, Newfoundland and Labrador, Ontario, Quebec
Alberta, Australia, British Columbia, Canada, Hong Kong-China, Ireland, Liechtenstein, Manitoba, New Zealand, Newfoundland and Labrador, Ontario, Quebec
Alberta, Australia, Belgium, British Columbia, Canada, Czech Republic, Denmark, Estonia, Japan, Liechtenstein, Macao-China, Manitoba, Netherlands, New Zealand, Ontario, Switzerland
total 16 12 16
Below BC
Argentina, Austria, Azerbaijan, Belgium, Brazil, Bulgaria, Chile, Colombia, Croatia, Czech Republic, Denmark, France, Germany, Greece, Hungary, Iceland, Indonesia, Ireland, Israel, Italy, Jordan, Kyrgyzstan, Latvia, Lithuania, Luxembourg, Macao-China, Mexico, Montenegro, New Brunswick, Norway, Nova Scotia, Poland, Portugal, Prince Edward Island, Qatar, Romania, Russian Federation, Saskatchewan, Serbia, Slovak Republic, Slovenia, Spain, Sweden, Switzerland, Thailand, Tunisia, Turkey, United Kingdom, United States, Uruguay
Argentina, Austria, Azerbaijan, Belgium, Brazil, Bulgaria, Chile, Chinese Taipei, Colombia, Croatia, Czech Republic, Denmark, Estonia, France, Germany, Greece, Hungary, Iceland, Indonesia, Israel, Italy, Japan, Jordan, Kyrgyzstan, Latvia, Lithuania, Luxembourg, Macao-China, Mexico, Montenegro, Netherlands, New Brunswick, Norway, Nova Scotia, Poland, Portugal, Prince Edward Island, Qatar, Romania, Russian Federation, Saskatchewan, Serbia, Slovak Republic, Slovenia, Spain, Sweden, Switzerland, Thailand, Tunisia, Turkey, United Kingdom, United States, Uruguay
Argentina, Austria, Azerbaijan, Brazil, Bulgaria, Chile, Colombia, Croatia, France, Germany, Greece, Hungary, Iceland, Indonesia, Ireland, Israel, Italy, Jordan, Kyrgyzstan, Latvia, Lithuania, Luxembourg, Mexico, Montenegro, New Brunswick, Newfoundland and Labrador, Norway, Nova Scotia, Poland, Portugal, Prince Edward Island, Qatar, Romania, Russian Federation, Saskatchewan, Serbia, Slovak Republic, Slovenia, Spain, Sweden, Thailand, Tunisia, Turkey, United Kingdom, United States, Uruguay
total 50 53 46
Notes: (1) PISA is administered every three years and assesses the skills of 15-year-old students. (2) In 2006, Science was the major domain and Reading and Mathematics were minor domains. (3) Fifty-seven countries and all ten Canadian provinces participated in 2006. (4) In BC, 1,884 students from 73 schools participated.
For more information, please refer to: http://www.bced.gov.bc.ca/assessment/nat_int_assess.htm
Page 413 EDU-2013-00071 - PHASE 1
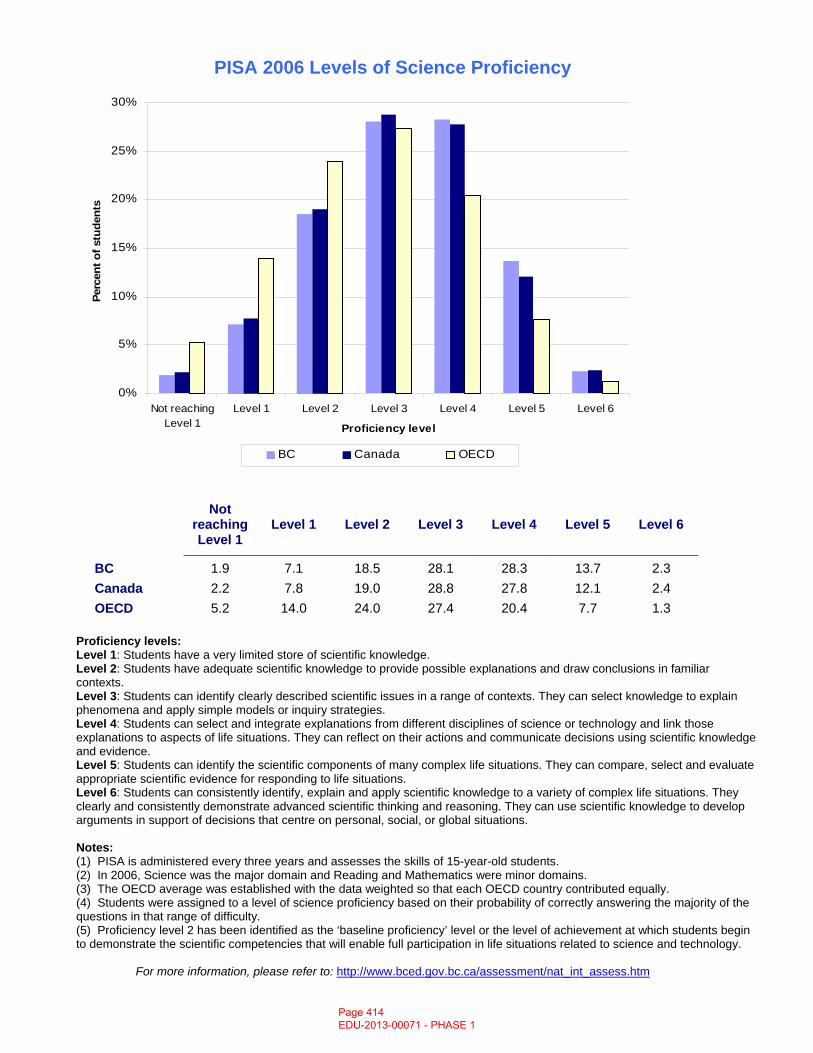
PISA 2006 Levels of Science Proficiency
0%
5%
10%
15%
20%
25%
30%
Not reachingLevel 1
Level 1 Level 2 Level 3 Level 4 Level 5 Level 6
Proficiency level
Perc
ent o
f stu
dent
s
BC Canada OECD
Not
reaching Level 1
Level 1 Level 2 Level 3 Level 4 Level 5 Level 6
BC 1.9 7.1 18.5 28.1 28.3 13.7 2.3 Canada 2.2 7.8 19.0 28.8 27.8 12.1 2.4 OECD 5.2 14.0 24.0 27.4 20.4 7.7 1.3
Proficiency levels: Level 1: Students have a very limited store of scientific knowledge. Level 2: Students have adequate scientific knowledge to provide possible explanations and draw conclusions in familiar contexts. Level 3: Students can identify clearly described scientific issues in a range of contexts. They can select knowledge to explain phenomena and apply simple models or inquiry strategies. Level 4: Students can select and integrate explanations from different disciplines of science or technology and link those explanations to aspects of life situations. They can reflect on their actions and communicate decisions using scientific knowledge and evidence. Level 5: Students can identify the scientific components of many complex life situations. They can compare, select and evaluate appropriate scientific evidence for responding to life situations. Level 6: Students can consistently identify, explain and apply scientific knowledge to a variety of complex life situations. They clearly and consistently demonstrate advanced scientific thinking and reasoning. They can use scientific knowledge to develop arguments in support of decisions that centre on personal, social, or global situations. Notes: (1) PISA is administered every three years and assesses the skills of 15-year-old students. (2) In 2006, Science was the major domain and Reading and Mathematics were minor domains. (3) The OECD average was established with the data weighted so that each OECD country contributed equally. (4) Students were assigned to a level of science proficiency based on their probability of correctly answering the majority of the questions in that range of difficulty. (5) Proficiency level 2 has been identified as the ‘baseline proficiency’ level or the level of achievement at which students begin to demonstrate the scientific competencies that will enable full participation in life situations related to science and technology.
For more information, please refer to: http://www.bced.gov.bc.ca/assessment/nat_int_assess.htm
Page 414 EDU-2013-00071 - PHASE 1
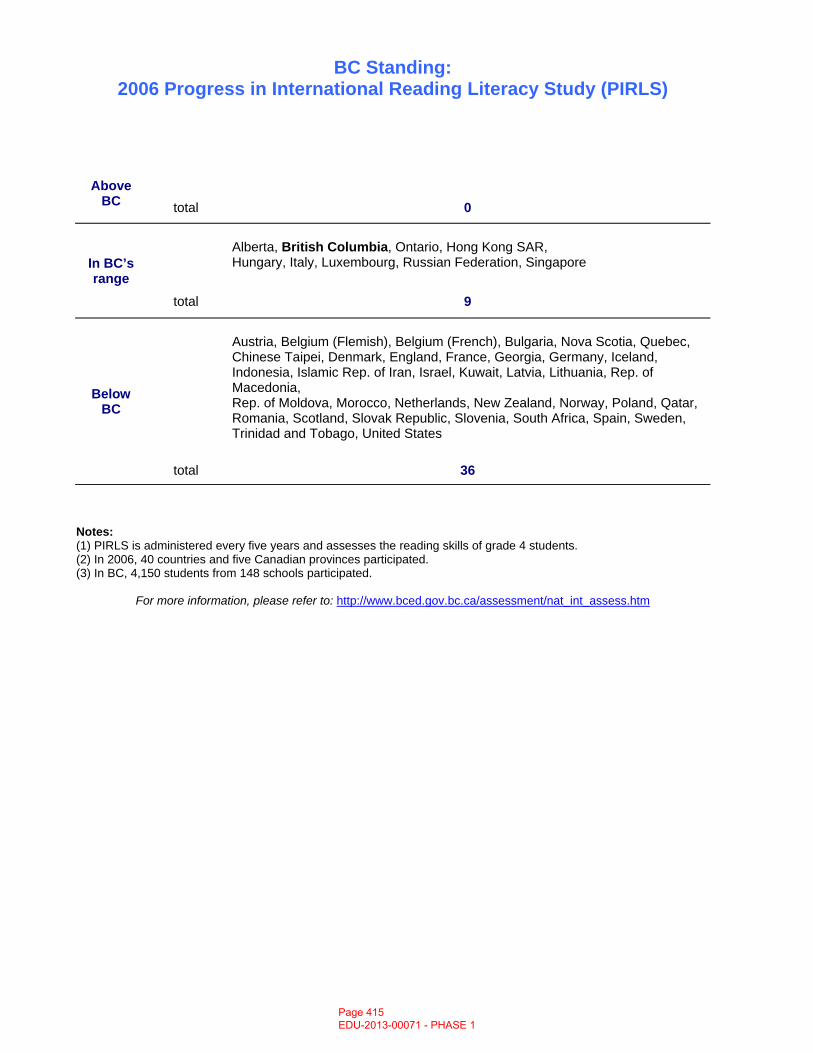
BC Standing: 2006 Progress in International Reading Literacy Study (PIRLS)
Above BC
total 0
In BC’s range
Alberta, British Columbia, Ontario, Hong Kong SAR, Hungary, Italy, Luxembourg, Russian Federation, Singapore
total 9
Below BC
Austria, Belgium (Flemish), Belgium (French), Bulgaria, Nova Scotia, Quebec, Chinese Taipei, Denmark, England, France, Georgia, Germany, Iceland, Indonesia, Islamic Rep. of Iran, Israel, Kuwait, Latvia, Lithuania, Rep. of Macedonia, Rep. of Moldova, Morocco, Netherlands, New Zealand, Norway, Poland, Qatar, Romania, Scotland, Slovak Republic, Slovenia, South Africa, Spain, Sweden, Trinidad and Tobago, United States
total 36
Notes: (1) PIRLS is administered every five years and assesses the reading skills of grade 4 students. (2) In 2006, 40 countries and five Canadian provinces participated. (3) In BC, 4,150 students from 148 schools participated.
For more information, please refer to: http://www.bced.gov.bc.ca/assessment/nat_int_assess.htm
Page 415 EDU-2013-00071 - PHASE 1
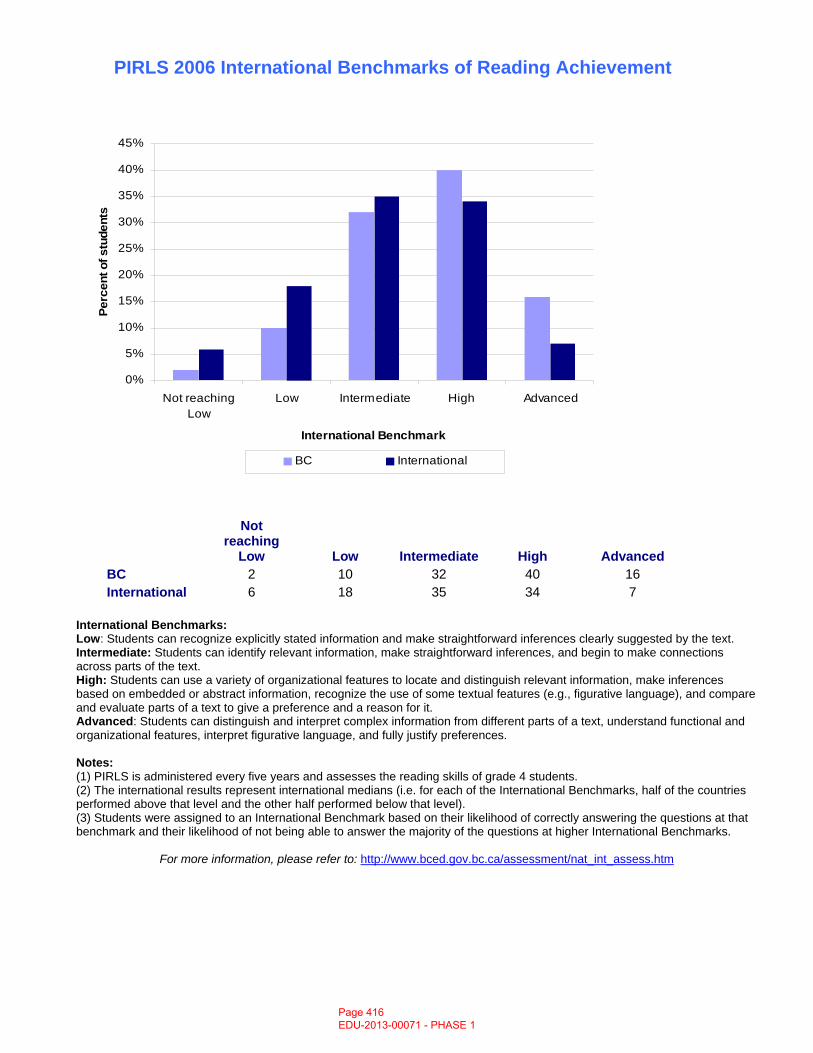
PIRLS 2006 International Benchmarks of Reading Achievement
0%
5%
10%
15%
20%
25%
30%
35%
40%
45%
Not reachingLow
Low Intermediate High Advanced
International Benchmark
Perc
ent o
f stu
dent
s
BC International
Not reaching
Low Low Intermediate High Advanced BC 2 10 32 40 16 International 6 18 35 34 7
International Benchmarks: Low: Students can recognize explicitly stated information and make straightforward inferences clearly suggested by the text. Intermediate: Students can identify relevant information, make straightforward inferences, and begin to make connections across parts of the text. High: Students can use a variety of organizational features to locate and distinguish relevant information, make inferences based on embedded or abstract information, recognize the use of some textual features (e.g., figurative language), and compare and evaluate parts of a text to give a preference and a reason for it. Advanced: Students can distinguish and interpret complex information from different parts of a text, understand functional and organizational features, interpret figurative language, and fully justify preferences. Notes: (1) PIRLS is administered every five years and assesses the reading skills of grade 4 students. (2) The international results represent international medians (i.e. for each of the International Benchmarks, half of the countries performed above that level and the other half performed below that level). (3) Students were assigned to an International Benchmark based on their likelihood of correctly answering the questions at that benchmark and their likelihood of not being able to answer the majority of the questions at higher International Benchmarks.
For more information, please refer to: http://www.bced.gov.bc.ca/assessment/nat_int_assess.htm
Page 416 EDU-2013-00071 - PHASE 1
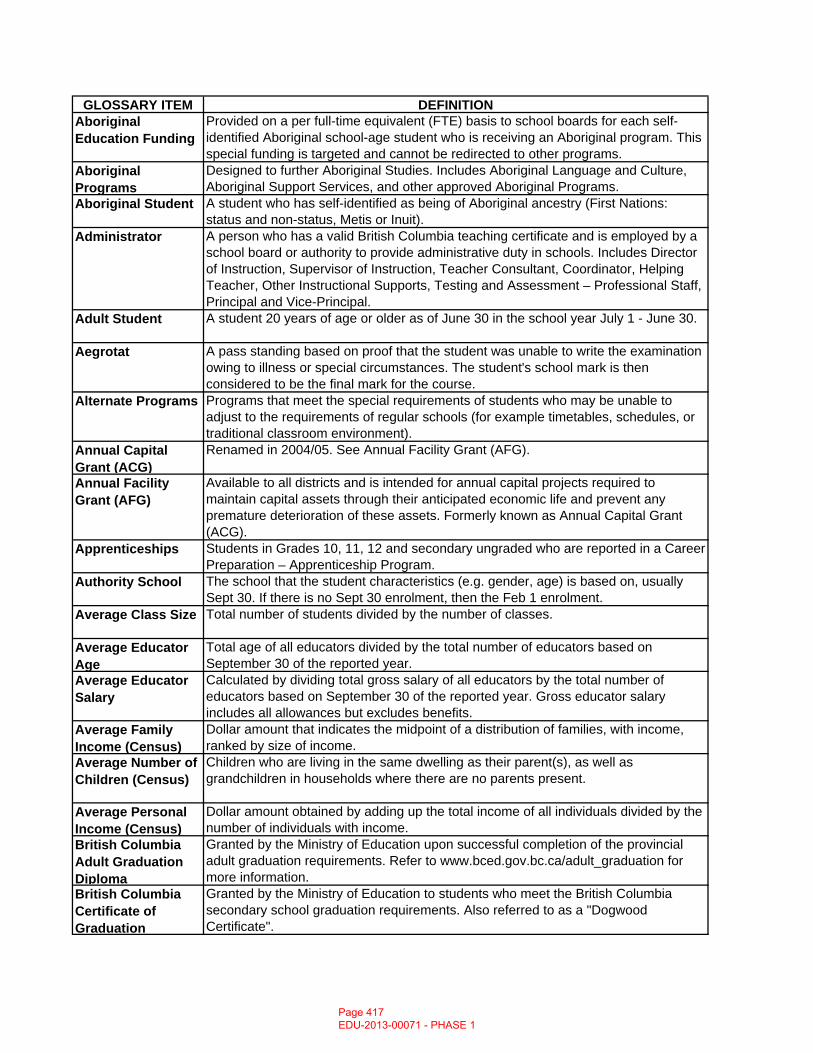
GLOSSARY ITEM DEFINITIONAboriginal Education Funding
Provided on a per full-time equivalent (FTE) basis to school boards for each self-identified Aboriginal school-age student who is receiving an Aboriginal program. This special funding is targeted and cannot be redirected to other programs.
Aboriginal Programs
Designed to further Aboriginal Studies. Includes Aboriginal Language and Culture, Aboriginal Support Services, and other approved Aboriginal Programs.
Aboriginal Student A student who has self-identified as being of Aboriginal ancestry (First Nations: status and non-status, Metis or Inuit).
Administrator A person who has a valid British Columbia teaching certificate and is employed by a school board or authority to provide administrative duty in schools. Includes Director of Instruction, Supervisor of Instruction, Teacher Consultant, Coordinator, Helping Teacher, Other Instructional Supports, Testing and Assessment – Professional Staff, Principal and Vice-Principal.
Adult Student A student 20 years of age or older as of June 30 in the school year July 1 - June 30.
Aegrotat A pass standing based on proof that the student was unable to write the examination owing to illness or special circumstances. The student's school mark is then considered to be the final mark for the course.
Alternate Programs Programs that meet the special requirements of students who may be unable to adjust to the requirements of regular schools (for example timetables, schedules, or traditional classroom environment).
Annual Capital Grant (ACG)
Renamed in 2004/05. See Annual Facility Grant (AFG).
Annual Facility Grant (AFG)
Available to all districts and is intended for annual capital projects required to maintain capital assets through their anticipated economic life and prevent any premature deterioration of these assets. Formerly known as Annual Capital Grant (ACG).
Apprenticeships Students in Grades 10, 11, 12 and secondary ungraded who are reported in a Career Preparation – Apprenticeship Program.
Authority School The school that the student characteristics (e.g. gender, age) is based on, usually Sept 30. If there is no Sept 30 enrolment, then the Feb 1 enrolment.
Average Class Size Total number of students divided by the number of classes.
Average Educator Age
Total age of all educators divided by the total number of educators based on September 30 of the reported year.
Average Educator Salary
Calculated by dividing total gross salary of all educators by the total number of educators based on September 30 of the reported year. Gross educator salary includes all allowances but excludes benefits.
Average Family Income (Census)
Dollar amount that indicates the midpoint of a distribution of families, with income, ranked by size of income.
Average Number of Children (Census)
Children who are living in the same dwelling as their parent(s), as well as grandchildren in households where there are no parents present.
Average Personal Income (Census)
Dollar amount obtained by adding up the total income of all individuals divided by the number of individuals with income.
British Columbia Adult Graduation Diploma
Granted by the Ministry of Education upon successful completion of the provincial adult graduation requirements. Refer to www.bced.gov.bc.ca/adult_graduation for more information.
British Columbia Certificate of Graduation
Granted by the Ministry of Education to students who meet the British Columbia secondary school graduation requirements. Also referred to as a "Dogwood Certificate".
Page 417 EDU-2013-00071 - PHASE 1
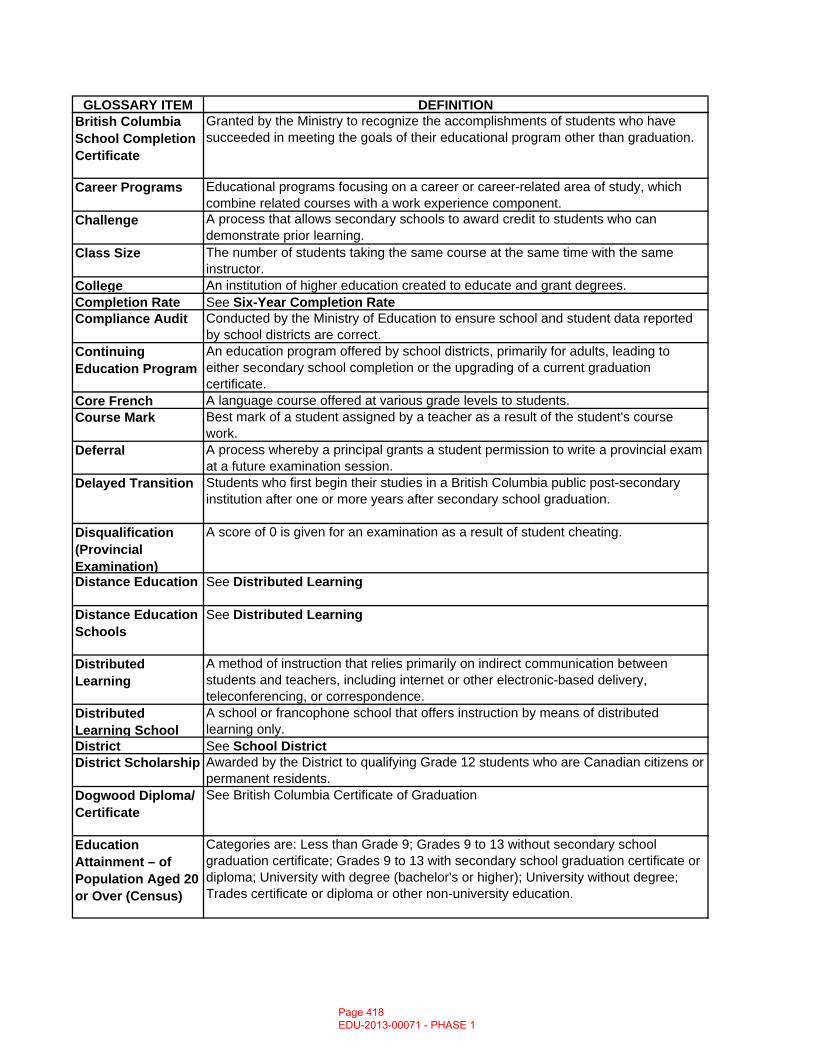
GLOSSARY ITEM DEFINITIONBritish Columbia School Completion Certificate
Granted by the Ministry to recognize the accomplishments of students who have succeeded in meeting the goals of their educational program other than graduation.
Career Programs Educational programs focusing on a career or career-related area of study, which combine related courses with a work experience component.
Challenge A process that allows secondary schools to award credit to students who can demonstrate prior learning.
Class Size The number of students taking the same course at the same time with the same instructor.
College An institution of higher education created to educate and grant degrees.Completion Rate See Six-Year Completion RateCompliance Audit Conducted by the Ministry of Education to ensure school and student data reported
by school districts are correct.Continuing Education Program
An education program offered by school districts, primarily for adults, leading to either secondary school completion or the upgrading of a current graduation certificate.
Core French A language course offered at various grade levels to students.Course Mark Best mark of a student assigned by a teacher as a result of the student's course
work.Deferral A process whereby a principal grants a student permission to write a provincial exam
at a future examination session.Delayed Transition Students who first begin their studies in a British Columbia public post-secondary
institution after one or more years after secondary school graduation.
Disqualification (Provincial Examination)
A score of 0 is given for an examination as a result of student cheating.
Distance Education See Distributed Learning
Distance Education Schools
See Distributed Learning
Distributed Learning
A method of instruction that relies primarily on indirect communication between students and teachers, including internet or other electronic-based delivery, teleconferencing, or correspondence.
Distributed Learning School
A school or francophone school that offers instruction by means of distributed learning only.
District See School DistrictDistrict Scholarship Awarded by the District to qualifying Grade 12 students who are Canadian citizens or
permanent residents.Dogwood Diploma/ Certificate
See British Columbia Certificate of Graduation
Education Attainment – of Population Aged 20 or Over (Census)
Categories are: Less than Grade 9; Grades 9 to 13 without secondary school graduation certificate; Grades 9 to 13 with secondary school graduation certificate or diploma; University with degree (bachelor's or higher); University without degree; Trades certificate or diploma or other non-university education.
Page 418 EDU-2013-00071 - PHASE 1
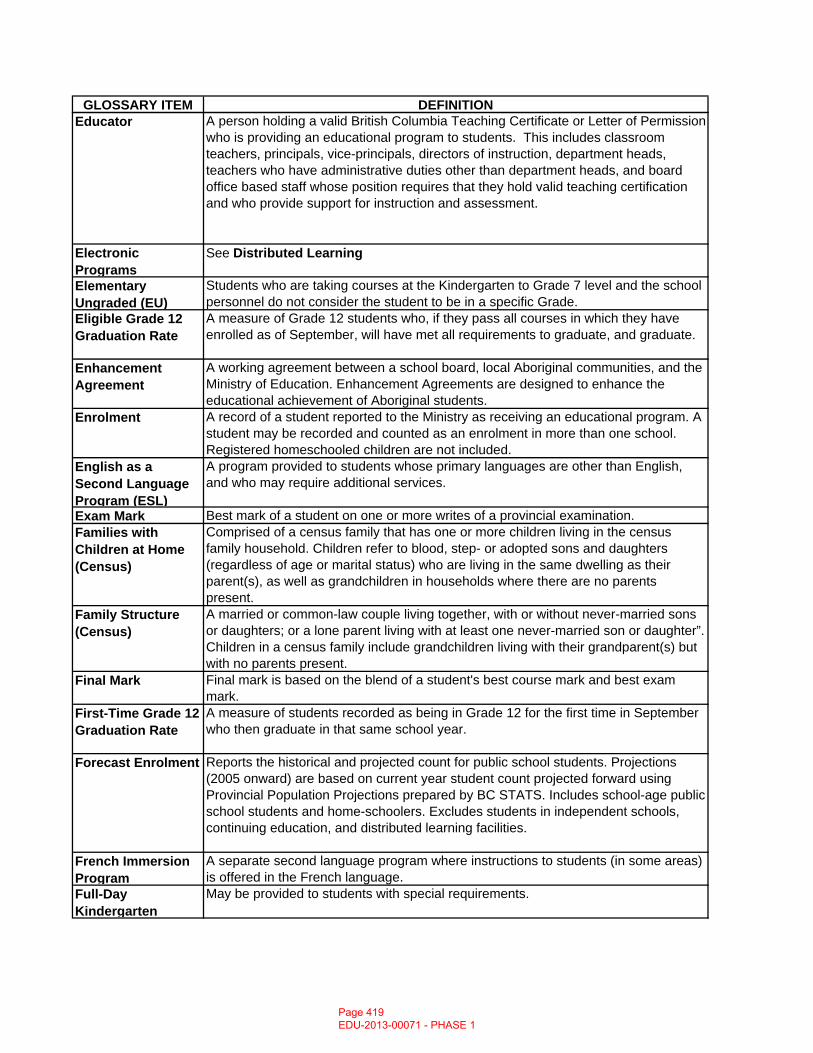
GLOSSARY ITEM DEFINITIONEducator A person holding a valid British Columbia Teaching Certificate or Letter of Permission
who is providing an educational program to students. This includes classroom teachers, principals, vice-principals, directors of instruction, department heads, teachers who have administrative duties other than department heads, and board office based staff whose position requires that they hold valid teaching certification and who provide support for instruction and assessment.
Electronic Programs
See Distributed Learning
Elementary Ungraded (EU)
Students who are taking courses at the Kindergarten to Grade 7 level and the school personnel do not consider the student to be in a specific Grade.
Eligible Grade 12 Graduation Rate
A measure of Grade 12 students who, if they pass all courses in which they have enrolled as of September, will have met all requirements to graduate, and graduate.
Enhancement Agreement
A working agreement between a school board, local Aboriginal communities, and the Ministry of Education. Enhancement Agreements are designed to enhance the educational achievement of Aboriginal students.
Enrolment A record of a student reported to the Ministry as receiving an educational program. A student may be recorded and counted as an enrolment in more than one school. Registered homeschooled children are not included.
English as a Second Language Program (ESL)
A program provided to students whose primary languages are other than English, and who may require additional services.
Exam Mark Best mark of a student on one or more writes of a provincial examination.Families with Children at Home (Census)
Comprised of a census family that has one or more children living in the census family household. Children refer to blood, step- or adopted sons and daughters (regardless of age or marital status) who are living in the same dwelling as their parent(s), as well as grandchildren in households where there are no parents present.
Family Structure (Census)
A married or common-law couple living together, with or without never-married sons or daughters; or a lone parent living with at least one never-married son or daughter”. Children in a census family include grandchildren living with their grandparent(s) but with no parents present.
Final Mark Final mark is based on the blend of a student's best course mark and best exam mark.
First-Time Grade 12 Graduation Rate
A measure of students recorded as being in Grade 12 for the first time in September who then graduate in that same school year.
Forecast Enrolment Reports the historical and projected count for public school students. Projections (2005 onward) are based on current year student count projected forward using Provincial Population Projections prepared by BC STATS. Includes school-age public school students and home-schoolers. Excludes students in independent schools, continuing education, and distributed learning facilities.
French Immersion Program
A separate second language program where instructions to students (in some areas) is offered in the French language.
Full-Day Kindergarten
May be provided to students with special requirements.
Page 419 EDU-2013-00071 - PHASE 1
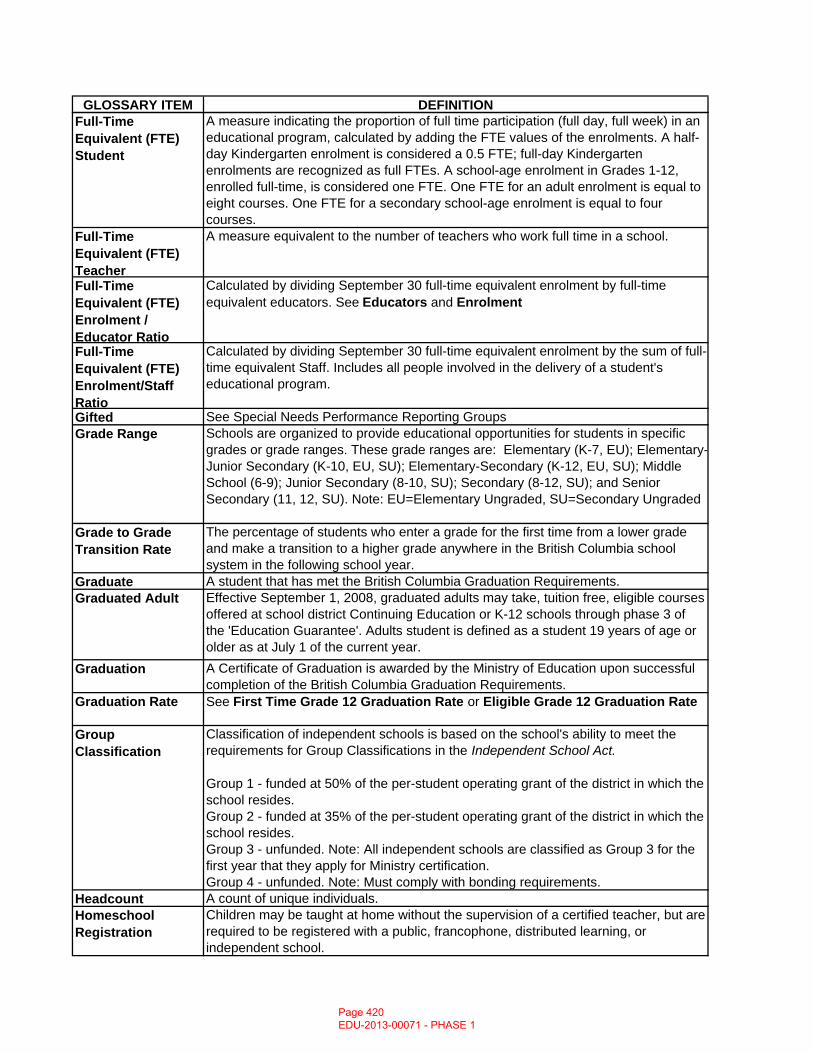
GLOSSARY ITEM DEFINITIONFull-Time Equivalent (FTE) Student
A measure indicating the proportion of full time participation (full day, full week) in an educational program, calculated by adding the FTE values of the enrolments. A half-day Kindergarten enrolment is considered a 0.5 FTE; full-day Kindergarten enrolments are recognized as full FTEs. A school-age enrolment in Grades 1-12, enrolled full-time, is considered one FTE. One FTE for an adult enrolment is equal to eight courses. One FTE for a secondary school-age enrolment is equal to four courses.
Full-Time Equivalent (FTE) Teacher
A measure equivalent to the number of teachers who work full time in a school.
Full-Time Equivalent (FTE) Enrolment / Educator Ratio
Calculated by dividing September 30 full-time equivalent enrolment by full-time equivalent educators. See Educators and Enrolment
Full-Time Equivalent (FTE) Enrolment/Staff Ratio
Calculated by dividing September 30 full-time equivalent enrolment by the sum of full-time equivalent Staff. Includes all people involved in the delivery of a student's educational program.
Gifted See Special Needs Performance Reporting GroupsGrade Range Schools are organized to provide educational opportunities for students in specific
grades or grade ranges. These grade ranges are: Elementary (K-7, EU); Elementary-Junior Secondary (K-10, EU, SU); Elementary-Secondary (K-12, EU, SU); Middle School (6-9); Junior Secondary (8-10, SU); Secondary (8-12, SU); and Senior Secondary (11, 12, SU). Note: EU=Elementary Ungraded, SU=Secondary Ungraded
Grade to Grade Transition Rate
The percentage of students who enter a grade for the first time from a lower grade and make a transition to a higher grade anywhere in the British Columbia school system in the following school year.
Graduate A student that has met the British Columbia Graduation Requirements.Graduated Adult Effective September 1, 2008, graduated adults may take, tuition free, eligible courses
offered at school district Continuing Education or K-12 schools through phase 3 of the 'Education Guarantee'. Adults student is defined as a student 19 years of age or older as at July 1 of the current year.
Graduation A Certificate of Graduation is awarded by the Ministry of Education upon successful completion of the British Columbia Graduation Requirements.
Graduation Rate See First Time Grade 12 Graduation Rate or Eligible Grade 12 Graduation Rate
Group Classification
Classification of independent schools is based on the school's ability to meet the requirements for Group Classifications in the Independent School Act.
Group 1 - funded at 50% of the per-student operating grant of the district in which the school resides.Group 2 - funded at 35% of the per-student operating grant of the district in which the school resides.Group 3 - unfunded. Note: All independent schools are classified as Group 3 for the first year that they apply for Ministry certification.Group 4 - unfunded. Note: Must comply with bonding requirements.
Headcount A count of unique individuals.Homeschool Registration
Children may be taught at home without the supervision of a certified teacher, but are required to be registered with a public, francophone, distributed learning, or independent school.
Page 420 EDU-2013-00071 - PHASE 1
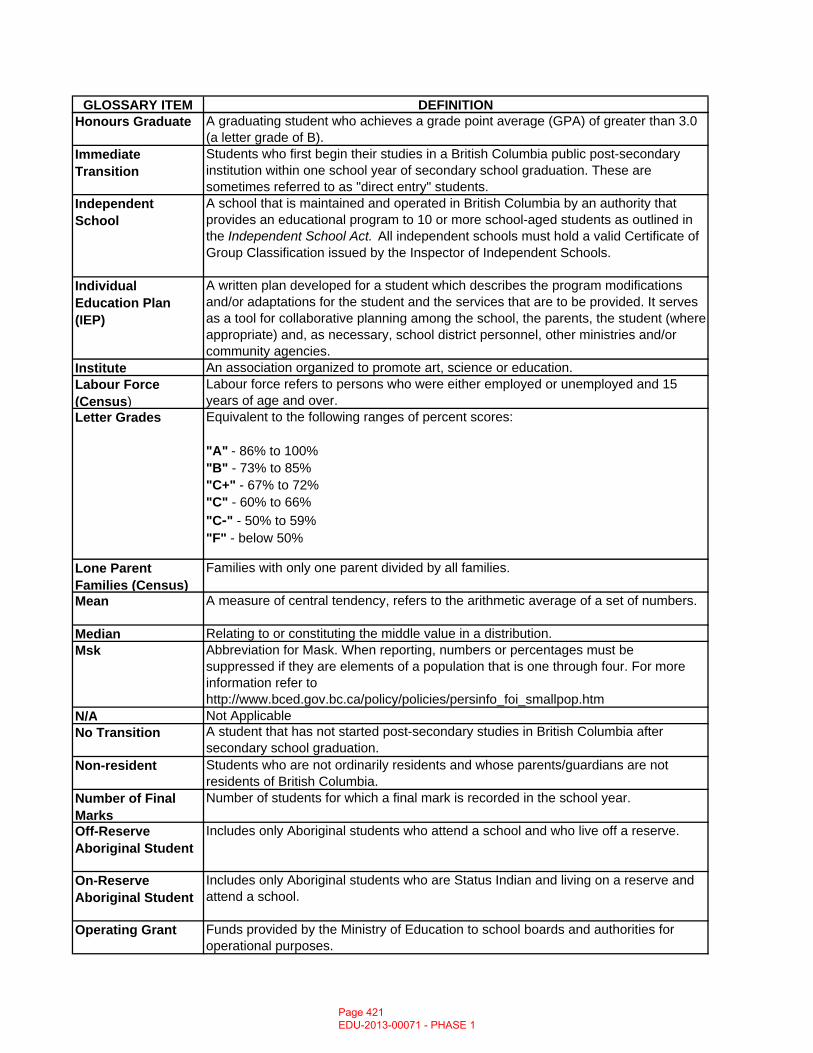
GLOSSARY ITEM DEFINITIONHonours Graduate A graduating student who achieves a grade point average (GPA) of greater than 3.0
(a letter grade of B).Immediate Transition
Students who first begin their studies in a British Columbia public post-secondary institution within one school year of secondary school graduation. These are sometimes referred to as "direct entry" students.
Independent School
A school that is maintained and operated in British Columbia by an authority that provides an educational program to 10 or more school-aged students as outlined in the Independent School Act. All independent schools must hold a valid Certificate of Group Classification issued by the Inspector of Independent Schools.
Individual Education Plan (IEP)
A written plan developed for a student which describes the program modifications and/or adaptations for the student and the services that are to be provided. It serves as a tool for collaborative planning among the school, the parents, the student (where appropriate) and, as necessary, school district personnel, other ministries and/or community agencies.
Institute An association organized to promote art, science or education.Labour Force (Census)
Labour force refers to persons who were either employed or unemployed and 15 years of age and over.
Letter Grades Equivalent to the following ranges of percent scores:
"A" - 86% to 100%"B" - 73% to 85%"C+" - 67% to 72%"C" - 60% to 66%"C-" - 50% to 59%"F" - below 50%
Lone Parent Families (Census)
Families with only one parent divided by all families.
Mean A measure of central tendency, refers to the arithmetic average of a set of numbers.
Median Relating to or constituting the middle value in a distribution.Msk Abbreviation for Mask. When reporting, numbers or percentages must be
suppressed if they are elements of a population that is one through four. For more information refer to http://www.bced.gov.bc.ca/policy/policies/persinfo_foi_smallpop.htm
N/A Not ApplicableNo Transition A student that has not started post-secondary studies in British Columbia after
secondary school graduation.Non-resident Students who are not ordinarily residents and whose parents/guardians are not
residents of British Columbia.Number of Final Marks
Number of students for which a final mark is recorded in the school year.
Off-Reserve Aboriginal Student
Includes only Aboriginal students who attend a school and who live off a reserve.
On-Reserve Aboriginal Student
Includes only Aboriginal students who are Status Indian and living on a reserve and attend a school.
Operating Grant Funds provided by the Ministry of Education to school boards and authorities for operational purposes.
Page 421 EDU-2013-00071 - PHASE 1
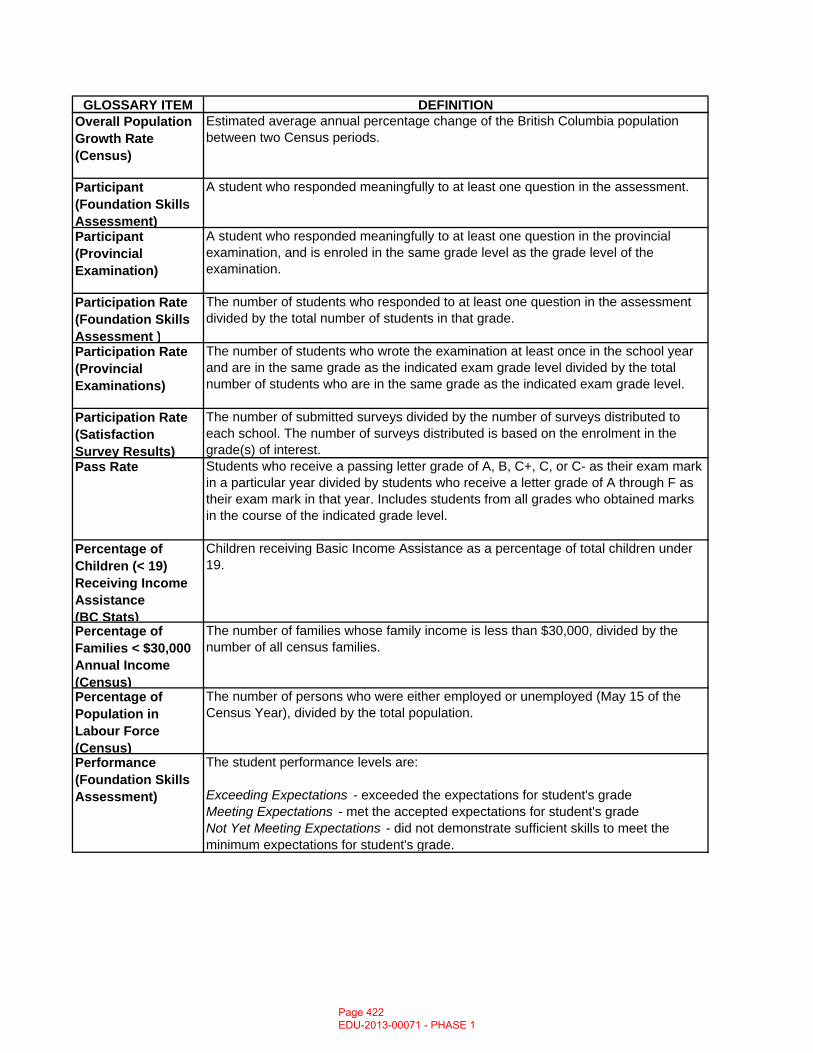
GLOSSARY ITEM DEFINITIONOverall Population Growth Rate (Census)
Estimated average annual percentage change of the British Columbia population between two Census periods.
Participant(Foundation Skills Assessment)
A student who responded meaningfully to at least one question in the assessment.
Participant (Provincial Examination)
A student who responded meaningfully to at least one question in the provincial examination, and is enroled in the same grade level as the grade level of the examination.
Participation Rate (Foundation Skills Assessment )
The number of students who responded to at least one question in the assessment divided by the total number of students in that grade.
Participation Rate (Provincial Examinations)
The number of students who wrote the examination at least once in the school year and are in the same grade as the indicated exam grade level divided by the total number of students who are in the same grade as the indicated exam grade level.
Participation Rate (Satisfaction Survey Results)
The number of submitted surveys divided by the number of surveys distributed to each school. The number of surveys distributed is based on the enrolment in the grade(s) of interest.
Pass Rate Students who receive a passing letter grade of A, B, C+, C, or C- as their exam mark in a particular year divided by students who receive a letter grade of A through F as their exam mark in that year. Includes students from all grades who obtained marks in the course of the indicated grade level.
Percentage of Children (< 19) Receiving Income Assistance (BC Stats)
Children receiving Basic Income Assistance as a percentage of total children under 19.
Percentage of Families < $30,000 Annual Income (Census)
The number of families whose family income is less than $30,000, divided by the number of all census families.
Percentage of Population in Labour Force (Census)
The number of persons who were either employed or unemployed (May 15 of the Census Year), divided by the total population.
Performance (Foundation Skills Assessment)
The student performance levels are:
Exceeding Expectations - exceeded the expectations for student's gradeMeeting Expectations - met the accepted expectations for student's gradeNot Yet Meeting Expectations - did not demonstrate sufficient skills to meet the minimum expectations for student's grade.
Page 422 EDU-2013-00071 - PHASE 1
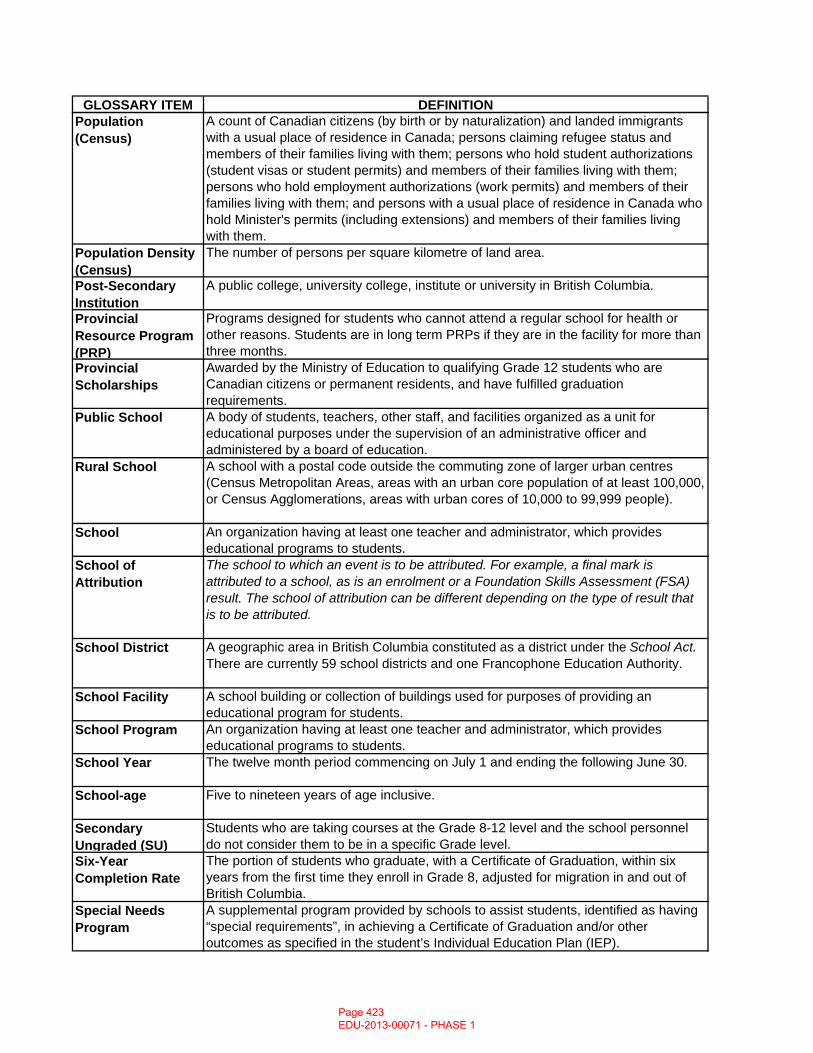
GLOSSARY ITEM DEFINITIONPopulation (Census)
A count of Canadian citizens (by birth or by naturalization) and landed immigrants with a usual place of residence in Canada; persons claiming refugee status and members of their families living with them; persons who hold student authorizations (student visas or student permits) and members of their families living with them; persons who hold employment authorizations (work permits) and members of their families living with them; and persons with a usual place of residence in Canada who hold Minister's permits (including extensions) and members of their families living with them.
Population Density (Census)
The number of persons per square kilometre of land area.
Post-Secondary Institution
A public college, university college, institute or university in British Columbia.
Provincial Resource Program (PRP)
Programs designed for students who cannot attend a regular school for health or other reasons. Students are in long term PRPs if they are in the facility for more than three months.
Provincial Scholarships
Awarded by the Ministry of Education to qualifying Grade 12 students who are Canadian citizens or permanent residents, and have fulfilled graduation requirements.
Public School A body of students, teachers, other staff, and facilities organized as a unit for educational purposes under the supervision of an administrative officer and administered by a board of education.
Rural School A school with a postal code outside the commuting zone of larger urban centres (Census Metropolitan Areas, areas with an urban core population of at least 100,000, or Census Agglomerations, areas with urban cores of 10,000 to 99,999 people).
School An organization having at least one teacher and administrator, which provides educational programs to students.
School of Attribution
The school to which an event is to be attributed. For example, a final mark is attributed to a school, as is an enrolment or a Foundation Skills Assessment (FSA) result. The school of attribution can be different depending on the type of result that is to be attributed.
School District A geographic area in British Columbia constituted as a district under the School Act. There are currently 59 school districts and one Francophone Education Authority.
School Facility A school building or collection of buildings used for purposes of providing an educational program for students.
School Program An organization having at least one teacher and administrator, which provides educational programs to students.
School Year The twelve month period commencing on July 1 and ending the following June 30.
School-age Five to nineteen years of age inclusive.
Secondary Ungraded (SU)
Students who are taking courses at the Grade 8-12 level and the school personnel do not consider them to be in a specific Grade level.
Six-Year Completion Rate
The portion of students who graduate, with a Certificate of Graduation, within six years from the first time they enroll in Grade 8, adjusted for migration in and out of British Columbia.
Special Needs Program
A supplemental program provided by schools to assist students, identified as having “special requirements”, in achieving a Certificate of Graduation and/or other outcomes as specified in the student’s Individual Education Plan (IEP).
Page 423 EDU-2013-00071 - PHASE 1
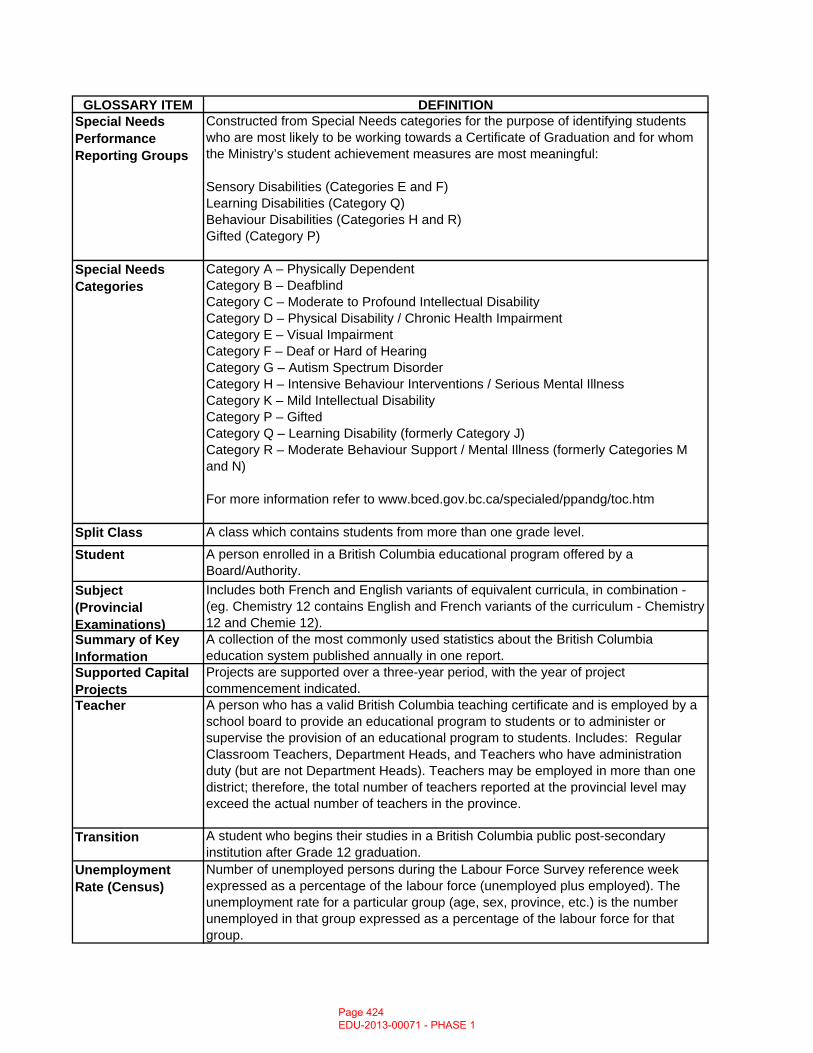
GLOSSARY ITEM DEFINITIONSpecial Needs Performance Reporting Groups
Constructed from Special Needs categories for the purpose of identifying students who are most likely to be working towards a Certificate of Graduation and for whom the Ministry’s student achievement measures are most meaningful:
Sensory Disabilities (Categories E and F) Learning Disabilities (Category Q) Behaviour Disabilities (Categories H and R) Gifted (Category P)
Special Needs Categories
Category A – Physically Dependent Category B – DeafblindCategory C – Moderate to Profound Intellectual Disability Category D – Physical Disability / Chronic Health Impairment Category E – Visual Impairment Category F – Deaf or Hard of Hearing Category G – Autism Spectrum DisorderCategory H – Intensive Behaviour Interventions / Serious Mental IllnessCategory K – Mild Intellectual Disability Category P – Gifted Category Q – Learning Disability (formerly Category J) Category R – Moderate Behaviour Support / Mental Illness (formerly Categories M and N)
For more information refer to www.bced.gov.bc.ca/specialed/ppandg/toc.htm
Split Class A class which contains students from more than one grade level.
Student A person enrolled in a British Columbia educational program offered by a Board/Authority.
Subject(Provincial Examinations)
Includes both French and English variants of equivalent curricula, in combination - (eg. Chemistry 12 contains English and French variants of the curriculum - Chemistry 12 and Chemie 12).
Summary of Key Information
A collection of the most commonly used statistics about the British Columbia education system published annually in one report.
Supported Capital Projects
Projects are supported over a three-year period, with the year of project commencement indicated.
Teacher A person who has a valid British Columbia teaching certificate and is employed by a school board to provide an educational program to students or to administer or supervise the provision of an educational program to students. Includes: Regular Classroom Teachers, Department Heads, and Teachers who have administration duty (but are not Department Heads). Teachers may be employed in more than one district; therefore, the total number of teachers reported at the provincial level may exceed the actual number of teachers in the province.
Transition A student who begins their studies in a British Columbia public post-secondary institution after Grade 12 graduation.
Unemployment Rate (Census)
Number of unemployed persons during the Labour Force Survey reference week expressed as a percentage of the labour force (unemployed plus employed). The unemployment rate for a particular group (age, sex, province, etc.) is the number unemployed in that group expressed as a percentage of the labour force for that group.
Page 424 EDU-2013-00071 - PHASE 1
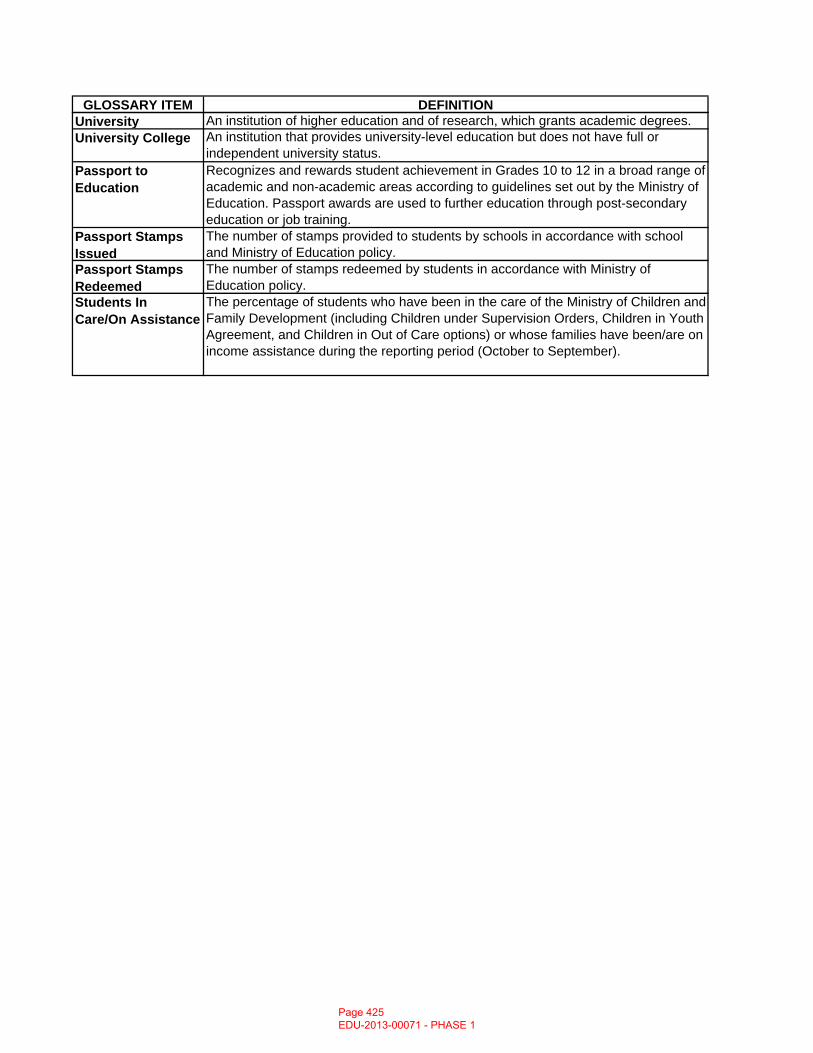
GLOSSARY ITEM DEFINITIONUniversity An institution of higher education and of research, which grants academic degrees.University College An institution that provides university-level education but does not have full or
independent university status.Passport to Education
Recognizes and rewards student achievement in Grades 10 to 12 in a broad range of academic and non-academic areas according to guidelines set out by the Ministry of Education. Passport awards are used to further education through post-secondary education or job training.
Passport Stamps Issued
The number of stamps provided to students by schools in accordance with school and Ministry of Education policy.
Passport Stamps Redeemed
The number of stamps redeemed by students in accordance with Ministry of Education policy.
Students In Care/On Assistance
The percentage of students who have been in the care of the Ministry of Children and Family Development (including Children under Supervision Orders, Children in Youth Agreement, and Children in Out of Care options) or whose families have been/are on income assistance during the reporting period (October to September).
Page 425 EDU-2013-00071 - PHASE 1
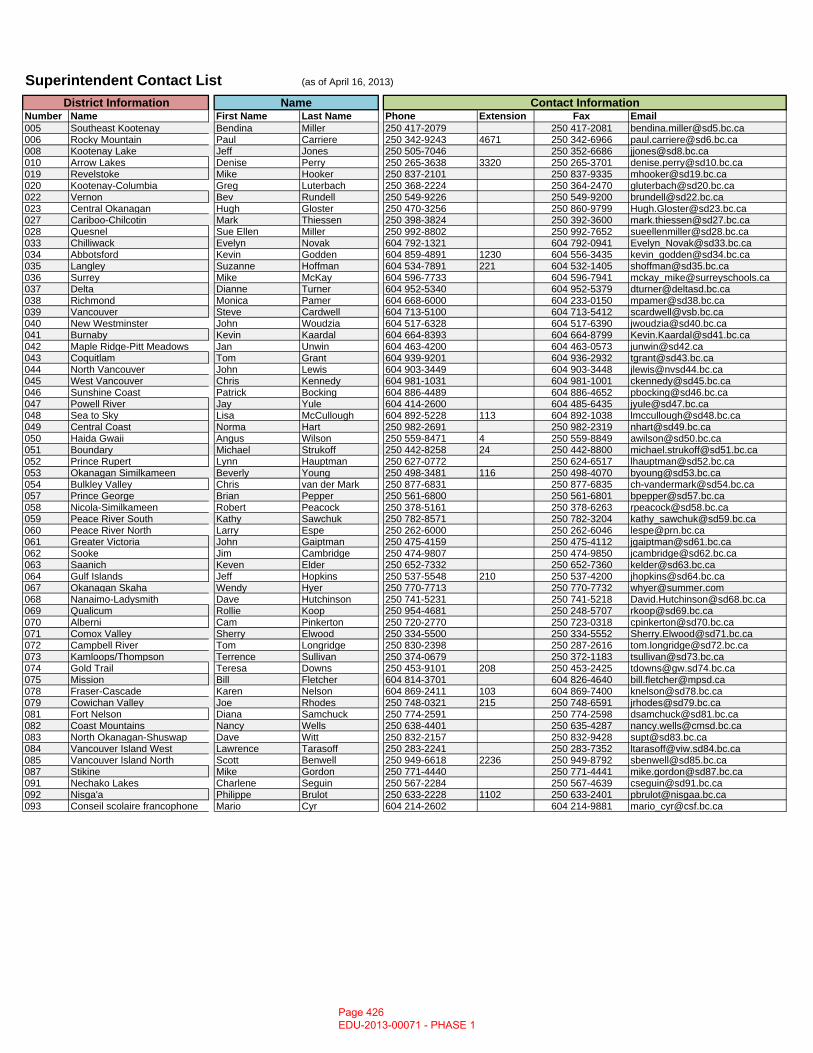
Superintendent Contact List (as of April 16, 2013)
Number Name First Name Last Name Phone Extension Fax Email005 Southeast Kootenay Bendina Miller 250 417-2079 250 417-2081 [email protected] Rocky Mountain Paul Carriere 250 342-9243 4671 250 342-6966 [email protected] Kootenay Lake Jeff Jones 250 505-7046 250 352-6686 [email protected] Arrow Lakes Denise Perry 250 265-3638 3320 250 265-3701 [email protected] Revelstoke Mike Hooker 250 837-2101 250 837-9335 [email protected] Kootenay-Columbia Greg Luterbach 250 368-2224 250 364-2470 [email protected] Vernon Bev Rundell 250 549-9226 250 549-9200 [email protected] Central Okanagan Hugh Gloster 250 470-3256 250 860-9799 [email protected] Cariboo-Chilcotin Mark Thiessen 250 398-3824 250 392-3600 [email protected] Quesnel Sue Ellen Miller 250 992-8802 250 992-7652 [email protected] Chilliwack Evelyn Novak 604 792-1321 604 792-0941 [email protected] Abbotsford Kevin Godden 604 859-4891 1230 604 556-3435 [email protected] Langley Suzanne Hoffman 604 534-7891 221 604 532-1405 [email protected] Surrey Mike McKay 604 596-7733 604 596-7941 [email protected] Delta Dianne Turner 604 952-5340 604 952-5379 [email protected] Richmond Monica Pamer 604 668-6000 604 233-0150 [email protected] Vancouver Steve Cardwell 604 713-5100 604 713-5412 [email protected] New Westminster John Woudzia 604 517-6328 604 517-6390 [email protected] Burnaby Kevin Kaardal 604 664-8393 604 664-8799 [email protected] Maple Ridge-Pitt Meadows Jan Unwin 604 463-4200 604 463-0573 [email protected] Coquitlam Tom Grant 604 939-9201 604 936-2932 [email protected] North Vancouver John Lewis 604 903-3449 604 903-3448 [email protected] West Vancouver Chris Kennedy 604 981-1031 604 981-1001 [email protected] Sunshine Coast Patrick Bocking 604 886-4489 604 886-4652 [email protected] Powell River Jay Yule 604 414-2600 604 485-6435 [email protected] Sea to Sky Lisa McCullough 604 892-5228 113 604 892-1038 [email protected] Central Coast Norma Hart 250 982-2691 250 982-2319 [email protected] Haida Gwaii Angus Wilson 250 559-8471 4 250 559-8849 [email protected] Boundary Michael Strukoff 250 442-8258 24 250 442-8800 [email protected] Prince Rupert Lynn Hauptman 250 627-0772 250 624-6517 [email protected] Okanagan Similkameen Beverly Young 250 498-3481 116 250 498-4070 [email protected] Bulkley Valley Chris van der Mark 250 877-6831 250 877-6835 [email protected] Prince George Brian Pepper 250 561-6800 250 561-6801 [email protected] Nicola-Similkameen Robert Peacock 250 378-5161 250 378-6263 [email protected] Peace River South Kathy Sawchuk 250 782-8571 250 782-3204 [email protected] Peace River North Larry Espe 250 262-6000 250 262-6046 [email protected] Greater Victoria John Gaiptman 250 475-4159 250 475-4112 [email protected] Sooke Jim Cambridge 250 474-9807 250 474-9850 [email protected] Saanich Keven Elder 250 652-7332 250 652-7360 [email protected] Gulf Islands Jeff Hopkins 250 537-5548 210 250 537-4200 [email protected] Okanagan Skaha Wendy Hyer 250 770-7713 250 770-7732 [email protected] Nanaimo-Ladysmith Dave Hutchinson 250 741-5231 250 741-5218 [email protected] Qualicum Rollie Koop 250 954-4681 250 248-5707 [email protected] Alberni Cam Pinkerton 250 720-2770 250 723-0318 [email protected] Comox Valley Sherry Elwood 250 334-5500 250 334-5552 [email protected] Campbell River Tom Longridge 250 830-2398 250 287-2616 [email protected] Kamloops/Thompson Terrence Sullivan 250 374-0679 250 372-1183 [email protected] Gold Trail Teresa Downs 250 453-9101 208 250 453-2425 [email protected] Mission Bill Fletcher 604 814-3701 604 826-4640 [email protected] Fraser-Cascade Karen Nelson 604 869-2411 103 604 869-7400 [email protected] Cowichan Valley Joe Rhodes 250 748-0321 215 250 748-6591 [email protected] Fort Nelson Diana Samchuck 250 774-2591 250 774-2598 [email protected] Coast Mountains Nancy Wells 250 638-4401 250 635-4287 [email protected] North Okanagan-Shuswap Dave Witt 250 832-2157 250 832-9428 [email protected] Vancouver Island West Lawrence Tarasoff 250 283-2241 250 283-7352 [email protected] Vancouver Island North Scott Benwell 250 949-6618 2236 250 949-8792 [email protected] Stikine Mike Gordon 250 771-4440 250 771-4441 [email protected] Nechako Lakes Charlene Seguin 250 567-2284 250 567-4639 [email protected] Nisga'a Philippe Brulot 250 633-2228 1102 250 633-2401 [email protected] Conseil scolaire francophone Mario Cyr 604 214-2602 604 214-9881 [email protected]
District Information Name Contact Information
Page 426 EDU-2013-00071 - PHASE 1


![Outline Product Liability Riina Spr2009 Outline[1]](https://img.pdfslide.us/doc/110x75/54fbf0ed4a795937538b4ab9/outline-product-liability-riina-spr2009-outline1.jpg)