Embed Size (px)
Citation preview
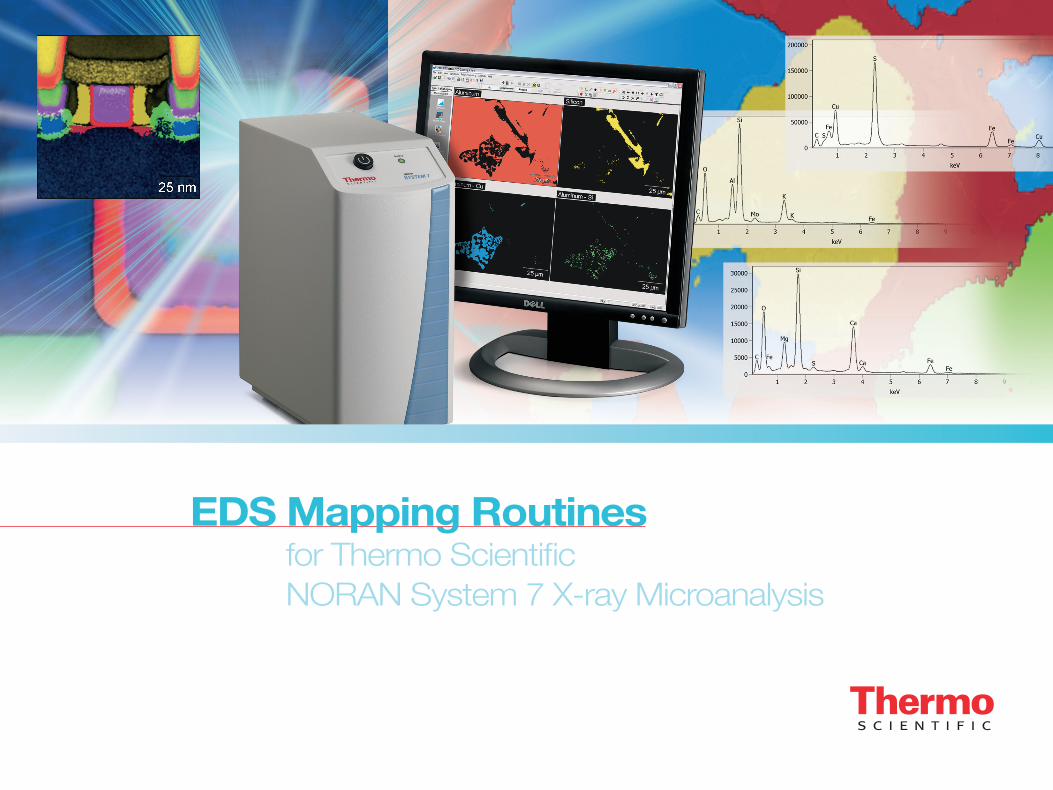
EDS Mapping Routines for Thermo Scientific
NORAN System 7 X-ray Microanalysis
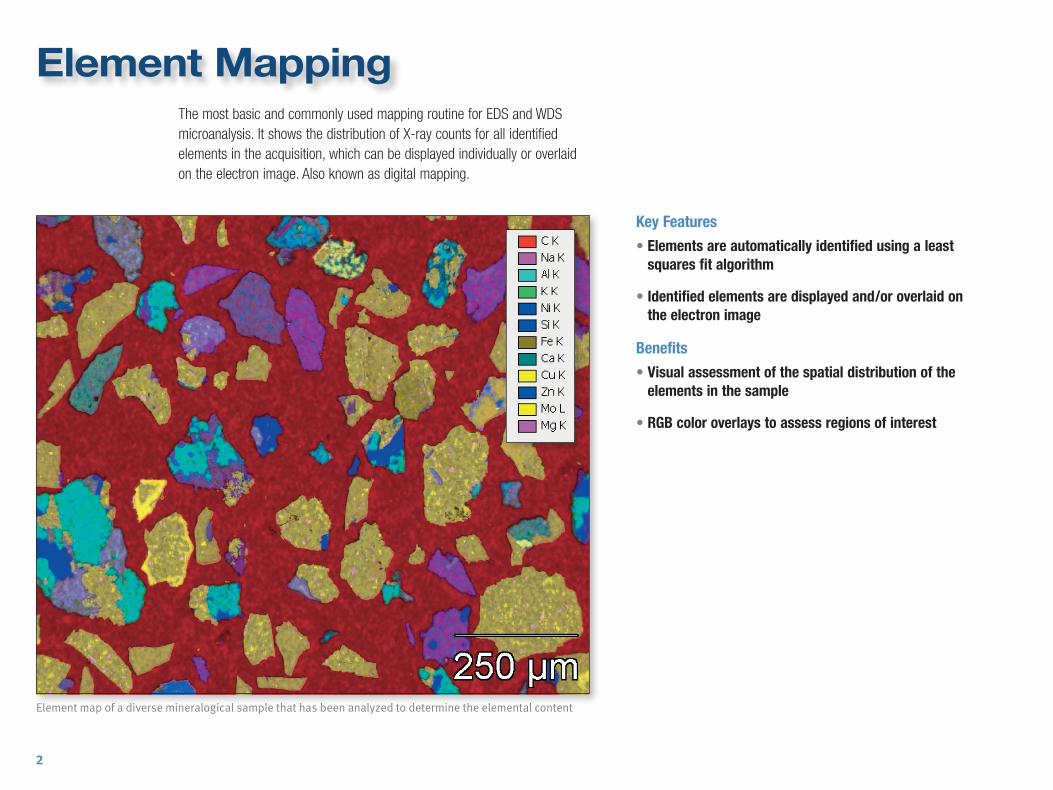
Element Mapping The most basic and commonly used mapping routine for EDS and WDS microanalysis. It shows the distribution of X-ray counts for all identified elements in the acquisition, which can be displayed individually or overlaid on the electron image. Also known as digital mapping.
Element map of a diverse mineralogical sample that has been analyzed to determine the elemental content
Key Features
• Elements are automatically identified using a least squares fit algorithm
• Identified elements are displayed and/or overlaid on the electron image
Benefits
• Visual assessment of the spatial distribution of the elements in the sample
• RGB color overlays to assess regions of interest
2
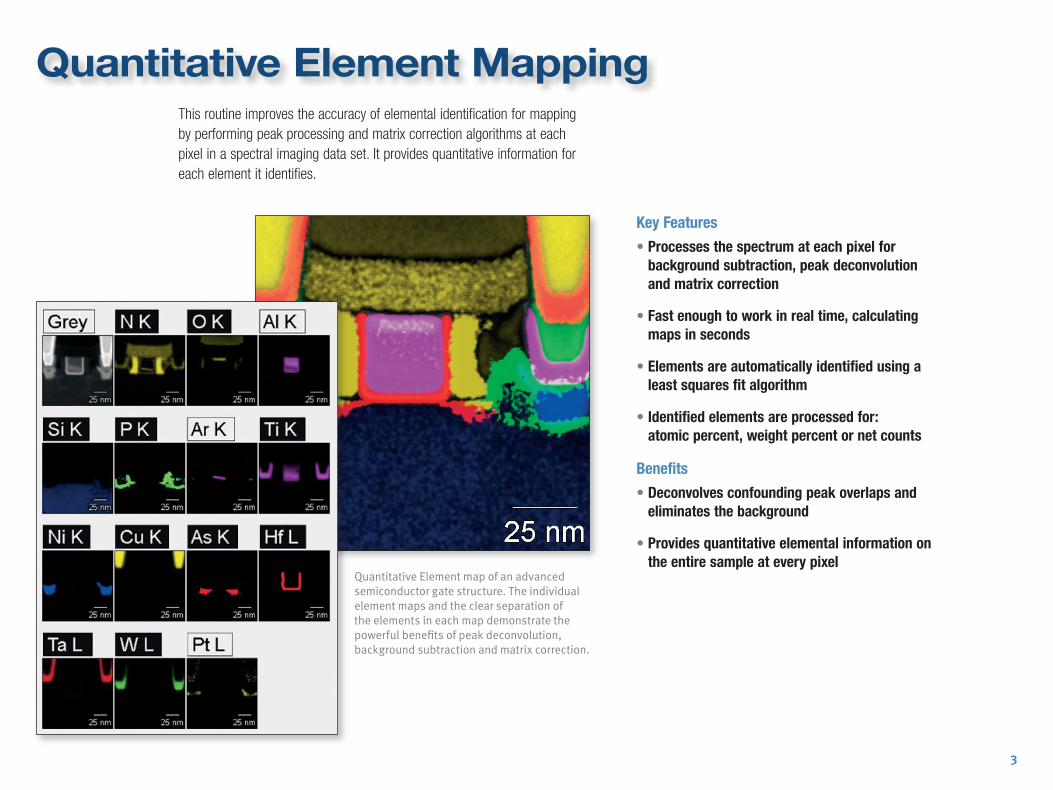
This routine improves the accuracy of elemental identification for mapping by performing peak processing and matrix correction algorithms at each pixel in a spectral imaging data set. It provides quantitative information for each element it identifies.
Quantitative Element Mapping
Key Features
• Processes the spectrum at each pixel for background subtraction, peak deconvolution and matrix correction
• Fast enough to work in real time, calculating maps in seconds
• Elements are automatically identified using a least squares fit algorithm
• Identified elements are processed for: atomic percent, weight percent or net counts
Benefits
• Deconvolves confounding peak overlaps and eliminates the background
• Provides quantitative elemental information on the entire sample at every pixel
Quantitative Element map of an advanced semiconductor gate structure. The individual element maps and the clear separation of the elements in each map demonstrate the powerful benefits of peak deconvolution, background subtraction and matrix correction.
3
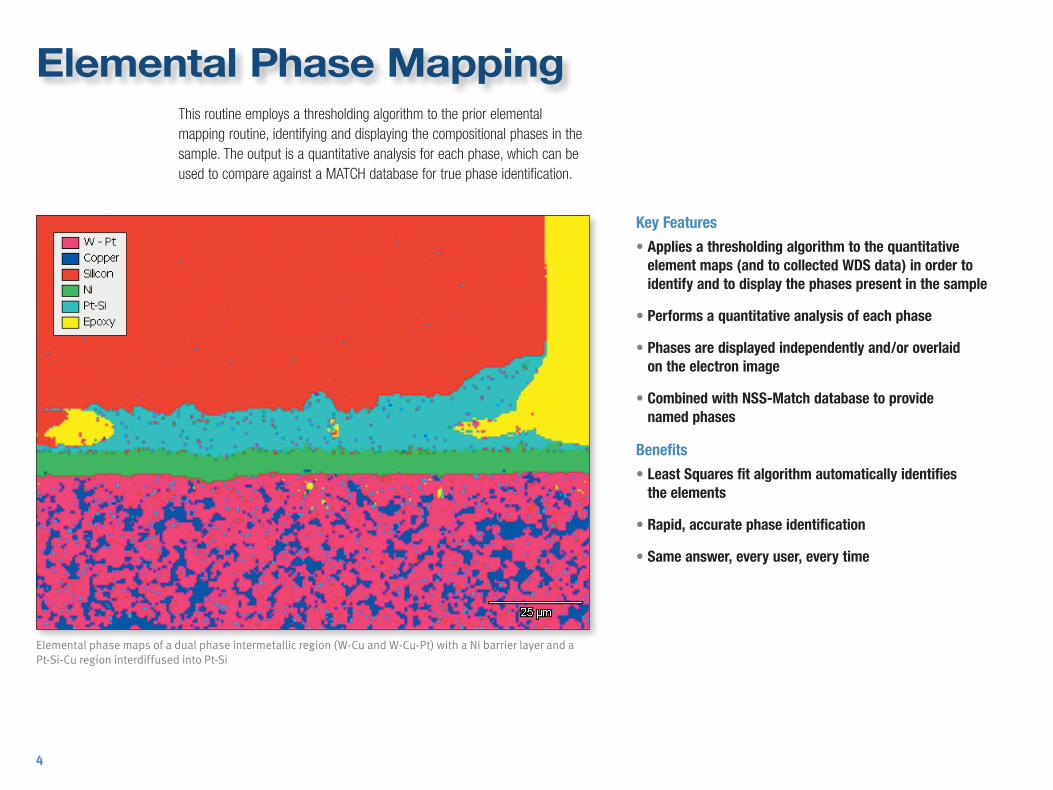
Elemental Phase MappingThis routine employs a thresholding algorithm to the prior elemental mapping routine, identifying and displaying the compositional phases in the sample. The output is a quantitative analysis for each phase, which can be used to compare against a MATCH database for true phase identification.
Key Features
• Applies a thresholding algorithm to the quantitative element maps (and to collected WDS data) in order to identify and to display the phases present in the sample
• Performs a quantitative analysis of each phase
• Phases are displayed independently and/or overlaid on the electron image
• Combined with NSS-Match database to provide named phases
Benefits
• Least Squares fit algorithm automatically identifies the elements
• Rapid, accurate phase identification
• Same answer, every user, every time
4
Elemental phase maps of a dual phase intermetallic region (W-Cu and W-Cu-Pt) with a Ni barrier layer and a Pt-Si-Cu region interdiffused into Pt-Si
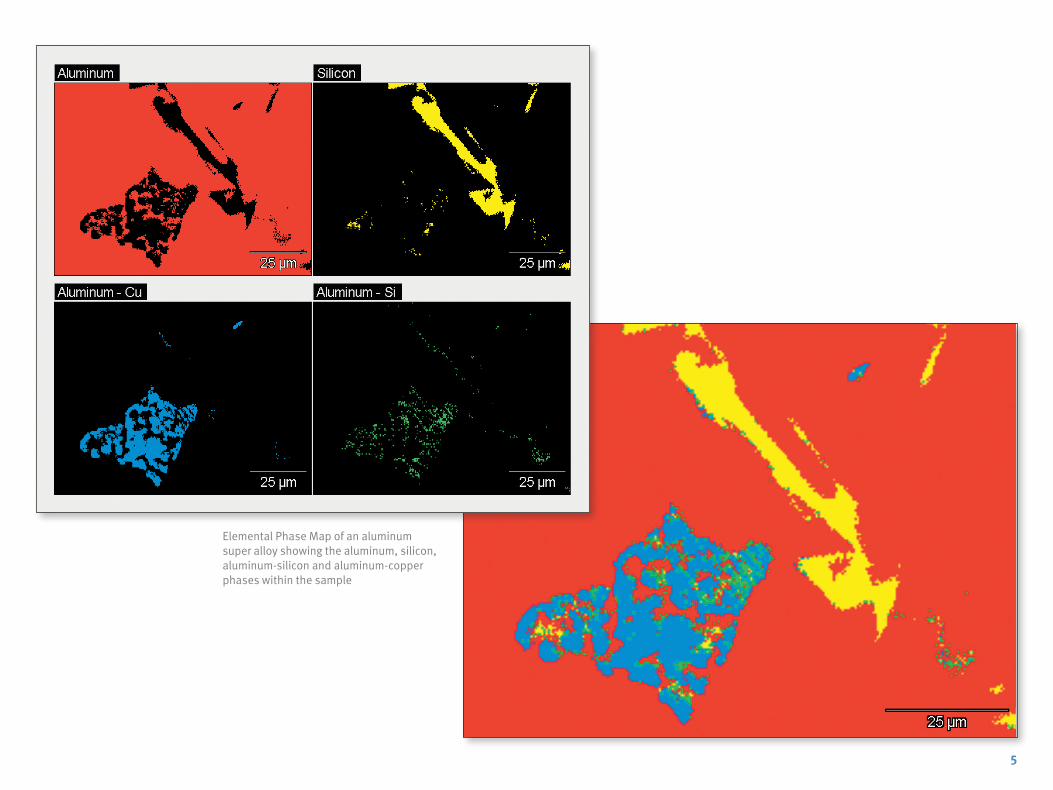
Elemental Phase Map of an aluminum super alloy showing the aluminum, silicon, aluminum-silicon and aluminum-copper phases within the sample
5
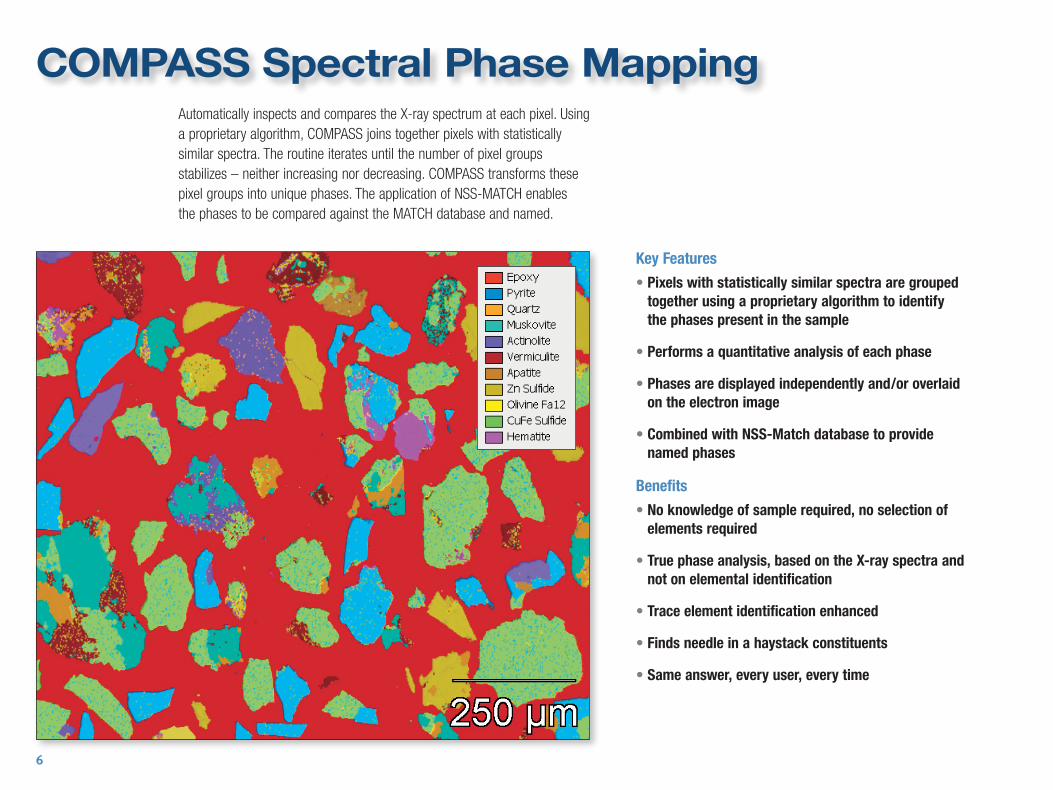
COMPASS Spectral Phase MappingAutomatically inspects and compares the X-ray spectrum at each pixel. Using a proprietary algorithm, COMPASS joins together pixels with statistically similar spectra. The routine iterates until the number of pixel groups stabilizes – neither increasing nor decreasing. COMPASS transforms these pixel groups into unique phases. The application of NSS-MATCH enables the phases to be compared against the MATCH database and named.
Key Features
• Pixels with statistically similar spectra are grouped together using a proprietary algorithm to identify the phases present in the sample
• Performs a quantitative analysis of each phase
• Phases are displayed independently and/or overlaid on the electron image
• Combined with NSS-Match database to provide named phases
Benefits
• No knowledge of sample required, no selection of elements required
• True phase analysis, based on the X-ray spectra and not on elemental identification
• Trace element identification enhanced
• Finds needle in a haystack constituents
• Same answer, every user, every time
6
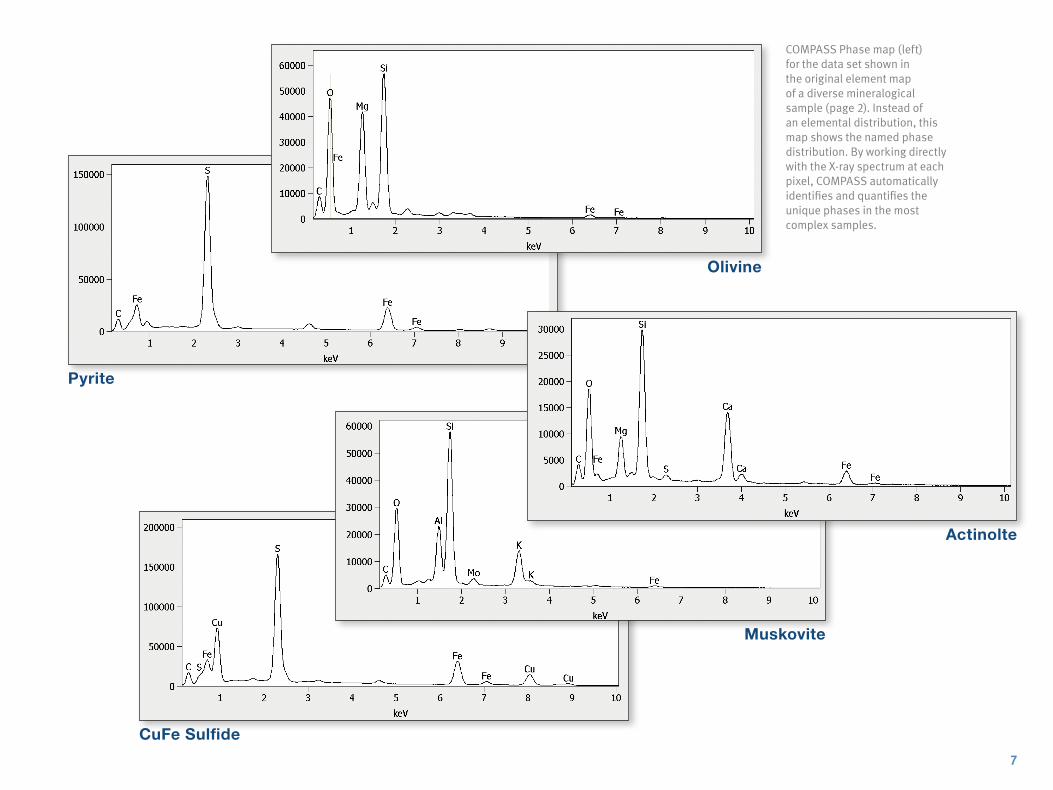
COMPASS Phase map (left) for the data set shown in the original element map of a diverse mineralogical sample (page 2). Instead of an elemental distribution, this map shows the named phase distribution. By working directly with the X-ray spectrum at each pixel, COMPASS automatically identifies and quantifies the unique phases in the most complex samples.
Pyrite
Olivine
CuFe Sulfide
Muskovite
Actinolte
7
BR52529_E 07/13M
Africa +27 11 822 4120
Australia +61 3 9757 4300
Austria +43 1 333 50 34 0
Belgium +32 53 73 42 41
Canada +1 800 530 8447
China +86 10 8419 3588
Denmark +45 70 23 62 60
Europe-Other +43 1 333 50 34 0
Finland/Norway/Sweden +46 8 556 468 00
France +33 1 60 92 48 00
Germany +49 6103 408 1014
India +91 22 6742 9434
Italy +39 02 950 591
Japan +81 45 453 9100
Latin America +1 561 688 8700
Middle East +43 1 333 50 34 0
Netherlands +31 76 579 55 55
New Zealand +64 9 980 6700
Russia/CIS +43 1 333 50 34 0
Spain +34 914 845 965
Switzerland +41 61 716 77 00
UK +44 1442 233555
USA +1 800 532 4752
www.thermoscientific.com©2013 Thermo Fisher Scientific Inc. All rights reserved. COMPASS software was developed at Sandia National Laboratories and is licensed to Thermo Fisher Scientific. All trademarks are the property of Thermo Fisher Scientific Inc. and its subsidiaries. This information is presented as an example of the capabilities of Thermo Fisher Scientific Inc. products. It is not intended to encourage use of these products in any manners that might infringe the intellectual property rights of others. Specifications, terms and pricing are subject to change. Not all products are available in all countries. Please consult your local sales representative for details.
Spectral Imaging X-ray Microanalysis
Spectral Imaging has revolutionized X-ray microanalysis. With a complete spectrum acquired at every point it is the centerpiece for all imaging, X-ray mapping, linescan and advanced automated analysis. With one click, the Thermo Scientific™ NORAN™ System 7 collects data that can be analyzed repeatedly without the need for re-acquiring or changing acquisition parameters. Once the data is collected, you may choose to analyze it locally at the microscope or take the data offline to a different computer for report preparation.
Point & Shoot
Quality Control
Chemical Typing
Spectral Match
Full Standards Quantification
Qualitative Identification
Failure Analysis
Linescan
Profiling
Interface Measurement
Quant Mapping
True Elemental Distributions
Quantitative Phase Mapping
COMPASS
Absolute Phase Mapping
Trace Element Mapping
Subtle Phase Discrimination
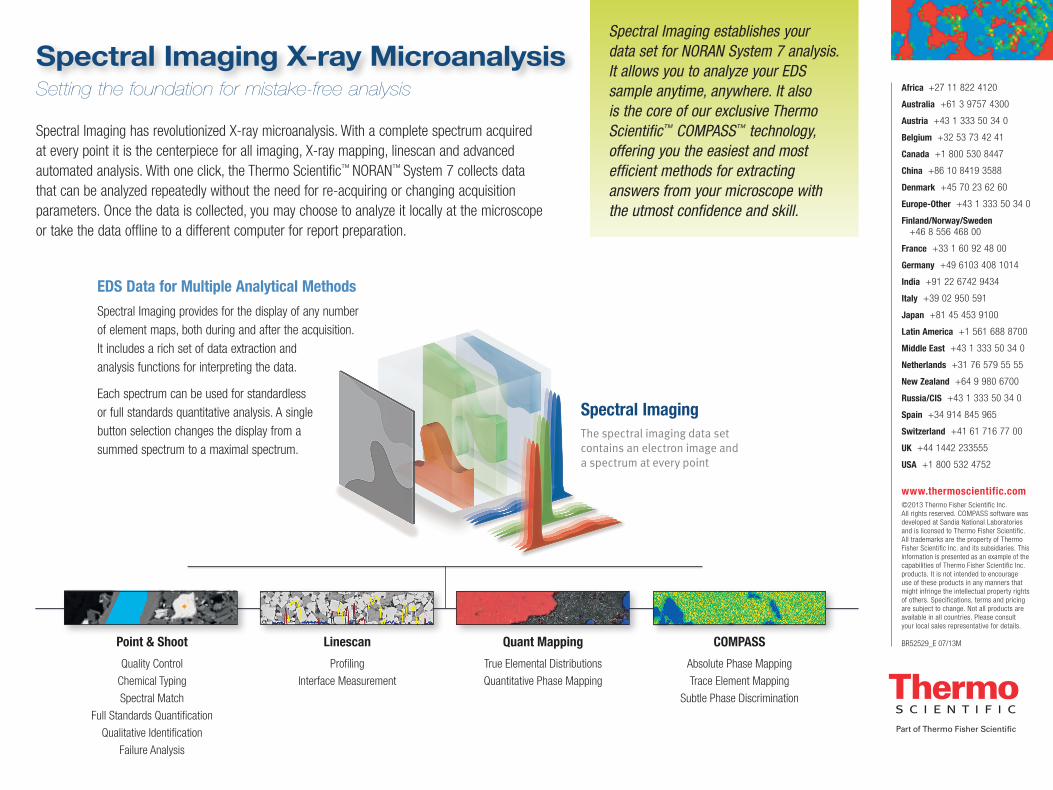
Spectral ImagingThe spectral imaging data set contains an electron image and a spectrum at every point
EDS Data for Multiple Analytical Methods
Spectral Imaging provides for the display of any number of element maps, both during and after the acquisition. It includes a rich set of data extraction and analysis functions for interpreting the data.
Each spectrum can be used for standardless or full standards quantitative analysis. A single button selection changes the display from a summed spectrum to a maximal spectrum.
Spectral Imaging establishes your data set for NORAN System 7 analysis. It allows you to analyze your EDS sample anytime, anywhere. It also is the core of our exclusive Thermo Scientific™ COMPASS™ technology, offering you the easiest and most efficient methods for extracting answers from your microscope with the utmost confidence and skill.
Setting the foundation for mistake-free analysis