Embed Size (px)
Citation preview
EDORA:European Development Opportunities
for Rural Areas
How does Cohesion Policy Support Rural Development?DG Regio Seminar Brussels, 1st October 2009

The Overall Objectives (Specification)
…to describe the main processes of change which are resulting in the increasing differentiation of rural areas.
…to identify development opportunities and constraints for different kinds of rural areas…
…to consider how such knowledge can be translated into guiding principles to support the development of appropriate cohesion policy.
The EDORA Approach
• A very wide-ranging task…• Rural data availability is strongly influenced by the
agrarian rural development tradition.• Being driven by the data availability risks “slipping
into well-trodden paths…” • A hybrid “deductive/inductive” approach – first
establish territorial concepts and theory, then empirical analysis and assessing policy implications.
• Work so far has been mainly conceptual and empirical… have not yet considered policy implications in any detail.
Why a typology of Intermediateand Predominantly Rural Regions?
• Wished to review explanatory potential of the Dijkstra-Poelman version of the OECD typology.
• Explore potential to elaborate it; add structure and performance aspects to U-R dimension.
• Elaborated typology might then serve as a framework for analysis of recent trends, consideration of future perspectives, and policy implications.
N.B. It cannot be a typology of Rural Areas – two reasons:(a)Rural areas do not function separately from adjacent
urban areas – they are connected by a dense web of interactions.
(b)Smallest practicable data units are NUTS 3(2), most of these contain sizable towns/cities.
It is a typology of Intermediate and Predominantly Rural Regions.
The art of the possible…
• Typology should help us to understand the process of regional differentiation.
• Methodology and structure of the typology should not be driven by data availability or agrarian RD traditions.
• Nevertheless, need to work within the limits set by data availability.
• “Meta-Narratives” identified by EDORA highlighted various dimensions of change, only some of them can be “mapped” with existing data, e.g.:– commodification – “consumption countryside”– economic diversification – “restructuring”

The EDORA “Typology”
…more of a three-dimensional framework for analysis, rather than a one-dimensional classification.
The three dimensions are:• Urban-Rural
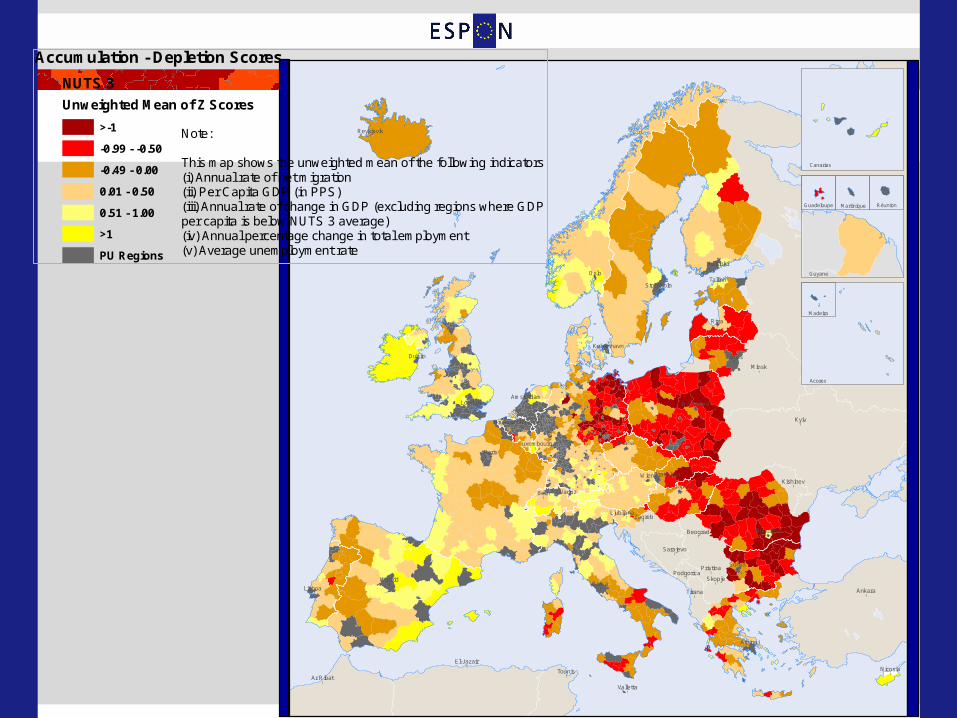
(remote/accessible)• Accumulation –
Depletion (performance).
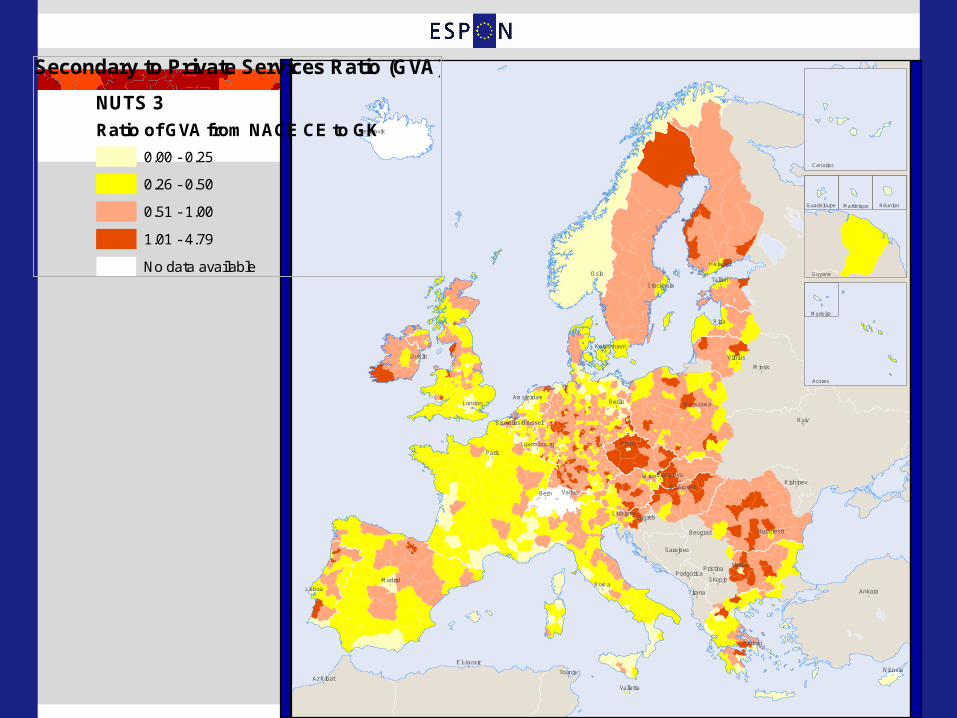
• Economic structure (diversification).
!
!
!
!!
!!
!!
!
!
!
!
!
! !
!
!
!
!
!
!
!
!
!
!
!
!
!
!
!
!
!
!
!
!
!
!
!
!
!
!
!
!
!
Roma
Riga
Oslo
Bern
Wien
Kyiv
Vaduz
Paris
Praha
Minsk
Tounis
Lisboa
Skopje
Zagreb
Ankara
Madrid
Tirana
Sofiya
London Berlin
Dublin
Athinai
Tallinn
Nicosia
Beograd
Vilnius
Pristina
Ar Ribat
Valletta
Kishinev
Sarajevo
Helsinki
Budapest
Warszawa
Podgorica
El-Jazair
Ljubljana
Stockholm
Reykjavik
København
Bucuresti
Amsterdam
Bratislava
Luxembourg
Bruxelles/Brussel
Acores
Guyane
Madeira
Réunion
Canarias
MartiniqueGuadeloupe
Note:
This map shows the unweighted mean of the following indicators:(i) Annual rate of net migration(ii) Per Capita GDP (in PPS)(iii) Annual rate of change in GDP (excluding regions where GDPper capita is below NUTS 3 average)(iv) Annual percentage change in total employment(v) Average unemployment rate
Accumulation - Depletion Scores
NUTS 3
Unweighted Mean of Z Scores
>-1
-0.99 - -0.50
-0.49 - 0.00
0.01 - 0.50
0.51 - 1.00
>1
PU Regions

!
!
!
!!
!!
!!
!
!
!
!
!
! !
!
!
!
!
!
!
!
!
!
!
!
!
!
!
!
!
!
!
!
!
!
!
!
!
!
!
!
!
!
Roma
Riga
Oslo
Bern
Wien
Kyiv
Vaduz
Paris
Praha
Minsk
Tounis
Lisboa
Skopje
Zagreb
Ankara
Madrid
Tirana
Sofiya
London Berlin
Dublin
Athinai
Tallinn
Nicosia
Beograd
Vilnius
Pristina
Ar Ribat
Valletta
Kishinev
Sarajevo
Helsinki
Budapest
Warszawa
Podgorica
El-Jazair
Ljubljana
Stockholm
Reykjavik
København
Bucuresti
Amsterdam
Bratislava
Luxembourg
Bruxelles/Brussel
Acores
Guyane
Madeira
Réunion
Canarias
MartiniqueGuadeloupe
Note:
This map shows the number of the following indicators exceedingthe NUTS3 mean:(i) Percentage of Private Sector GVA from Primary Industries.(ii) Percentange of Private Sector Employment in Primary Industries.(iii) AWU as a percentage of Total Private Sector Employment.
Agrarian Rural Economy Indicators
NUTS 3
Number of Indicators exceeding the NUTS 3 Mean
0
1
2
3
PU Regions

!
!
!
!!
!!
!!
!
!
!
!
!
! !
!
!
!
!
!
!
!
!
!
!
!
!
!
!
!
!
!
!
!
!
!
!
!
!
!
!
!
!
!
Roma
Riga
Oslo
Bern
Wien
Kyiv
Vaduz
Paris
Praha
Minsk
Tounis
Lisboa
Skopje
Zagreb
Ankara
Madrid
Tirana
Sofiya
London Berlin
Dublin
Athinai
Tallinn
Nicosia
Beograd
Vilnius
Pristina
Ar Ribat
Valletta
Kishinev
Sarajevo
Helsinki
Budapest
Warszawa
Podgorica
El-Jazair
Ljubljana
Stockholm
Reykjavik
København
Bucuresti
Amsterdam
Bratislava
Luxembourg
Bruxelles/Brussel
Acores
Guyane
Madeira
Réunion
Canarias
MartiniqueGuadeloupe
Note:This map shows the number of the following indicator groups withat least one indicator exceeding the Rural NUTS3 mean:(i) Tourism capacity and intensity(ii) Proximity of natural public goods(iii) Peri-productivist agriculture
Consumption Countryside Indicators
NUTS 3
Number of Indicators exceeding the NUTS 3 mean
0
1
2
3
PU Regions
!
!
!
!!
!!
!!
!
!
!
!
!
! !
!
!
!
!
!
!
!
!
!
!
!
!
!
!
!
!
!
!
!
!
!
!
!
!
!
!
!
!
!
Roma
Riga
Oslo
Bern
Wien
Kyiv
Vaduz
Paris
Praha
Minsk
Tounis
Lisboa
Skopje
Zagreb
Ankara
Madrid
Tirana
Sofiya
London Berlin
Dublin
Athinai
Tallinn
Nicosia
Beograd
Vilnius
Pristina
Ar Ribat
Valletta
Kishinev
Sarajevo
Helsinki
Budapest
Warszawa
Podgorica
El-Jazair
Ljubljana
Stockholm
Reykjavik
København
Bucuresti
Amsterdam
Bratislava
Luxembourg
Bruxelles/Brussel
Acores
Guyane
Madeira
Réunion
Canarias
MartiniqueGuadeloupe
Secondary to Private Services Ratio (GVA)
NUTS 3
Ratio of GVA from NACE CE to GK
0.00 - 0.25
0.26 - 0.50
0.51 - 1.00
1.01 - 4.79
No data available
!
!
!
!!
!!
!!
!
!
!
!
!
! !
!
!
!
!
!
!
!
!
!
!
!
!
!
!
!
!
!
!
!
!
!
!
!
!
!
!
!
!
!
Roma
Riga
Oslo
Bern
Wien
Kyiv
Vaduz
Paris
Praha
Minsk
Tounis
Lisboa
Skopje
Zagreb
Ankara
Madrid
Tirana
Sofiya
London Berlin
Dublin
Athinai
Tallinn
Nicosia
Beograd
Vilnius
Pristina
Ar Ribat
Valletta
Kishinev
Sarajevo
Helsinki
Budapest
Warszawa
Podgorica
El-Jazair
Ljubljana
Stockholm
Reykjavik
København
Bucuresti
Amsterdam
Bratislava
Luxembourg
Bruxelles/Brussel
Acores
Guyane
Madeira
Réunion
Canarias
MartiniqueGuadeloupe
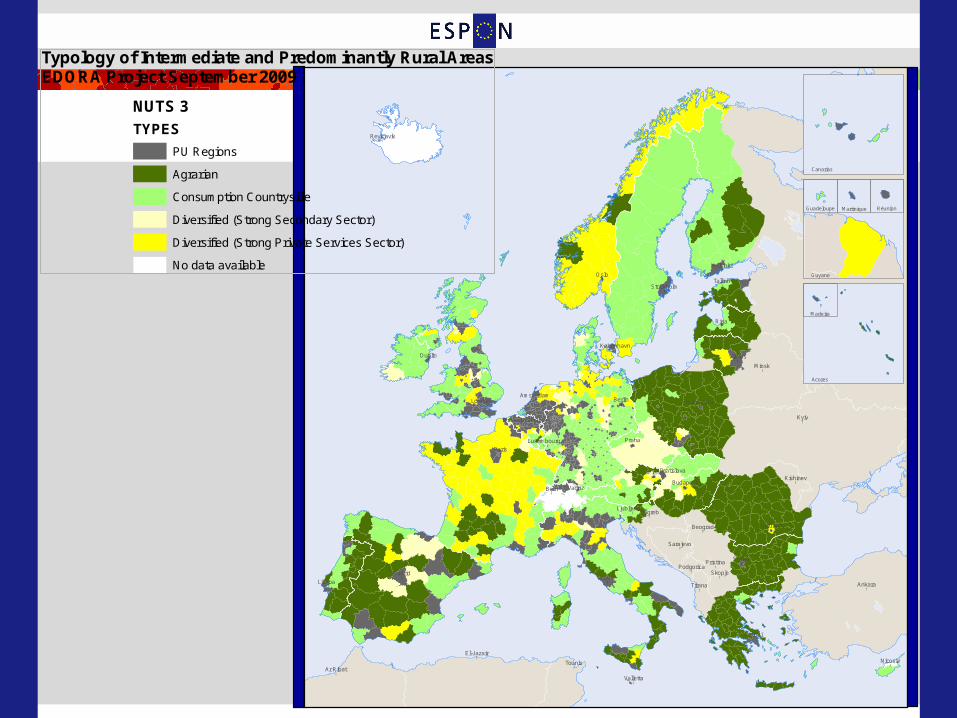
Typology of Intermediate and Predominantly Rural AreasEDORA Project September 2009
NUTS 3
TYPES
PU Regions
Agrarian
Consumption Countryside
Diversified (Strong Secondary Sector)
Diversified (Strong Private Services Sector)
No data available
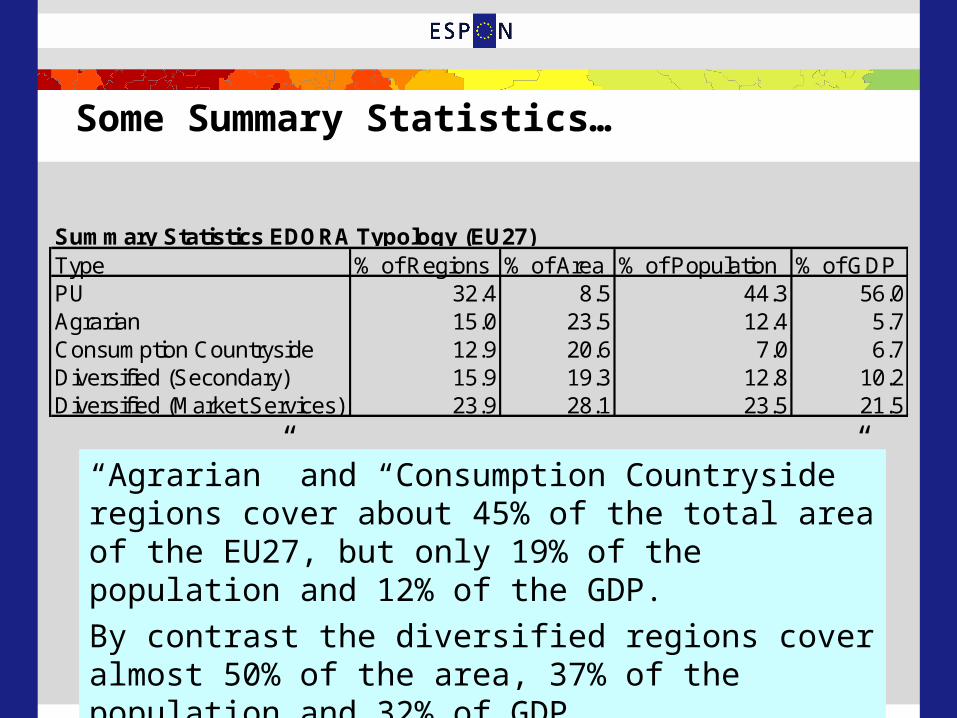
Some Summary Statistics…
“Agrarian” and “Consumption Countryside” regions cover about 45% of the total area of the EU27, but only 19% of the population and 12% of the GDP. By contrast the diversified regions cover almost 50% of the area, 37% of the population and 32% of GDP.
Summary Statistics EDORA Typology (EU27)Type % of Regions % of Area % of Population % of GDPPU 32.4 8.5 44.3 56.0Agrarian 15.0 23.5 12.4 5.7Consumption Countryside 12.9 20.6 7.0 6.7Diversified (Secondary) 15.9 19.3 12.8 10.2Diversified (Market Services) 23.9 28.1 23.5 21.5
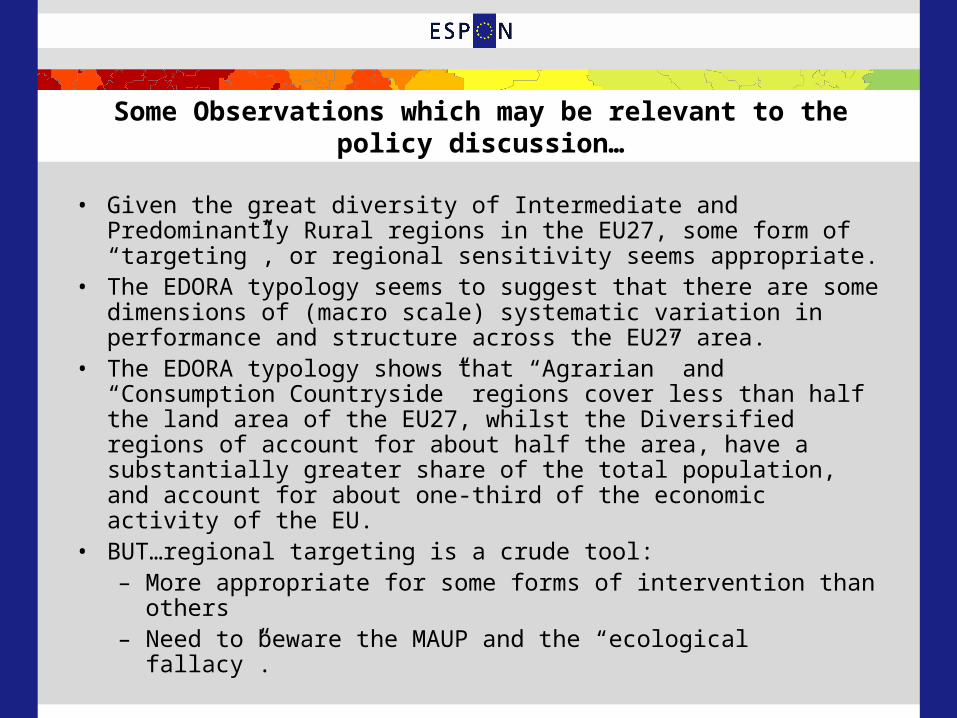
Some Observations which may be relevant to the policy discussion…
• Given the great diversity of Intermediate and Predominantly Rural regions in the EU27, some form of “targeting”, or regional sensitivity seems appropriate.
• The EDORA typology seems to suggest that there are some dimensions of (macro scale) systematic variation in performance and structure across the EU27 area.
• The EDORA typology shows that “Agrarian” and “Consumption Countryside” regions cover less than half the land area of the EU27, whilst the Diversified regions of account for about half the area, have a substantially greater share of the total population, and account for about one-third of the economic activity of the EU.
• BUT…regional targeting is a crude tool:– More appropriate for some forms of intervention than
others– Need to beware the MAUP and the “ecological
fallacy”.

Thank you for your attention….