Embed Size (px)
Citation preview

EdLink Strategic Training
Module 7
July 26, 28, 29
2
Objectives
• Understand where to locate legacy reports that are now located in EdLink
• Understand the purpose of Reporting dashboards and where to locate them
• Understand the functionality of Reporting dashboards
3
Agenda
•Review Usage and Data section - Data Reports dashboards to help validate and determine completeness of data
•Review Data Reporting dashboard in EdLink
•Review list of future dashboards
•Next Steps
Data Report Dashboards in Usage and Data Section of Dashboard
5
Data Reports DashboardsData Reports dashboards are previous SIS reports now located in EdLink.
Data Reports can be used to:• Validate data submitted to EdLink• Check to make sure data is reasonable and complete• Export aggregated data to provide to school systems
to verify accuracy of data
6
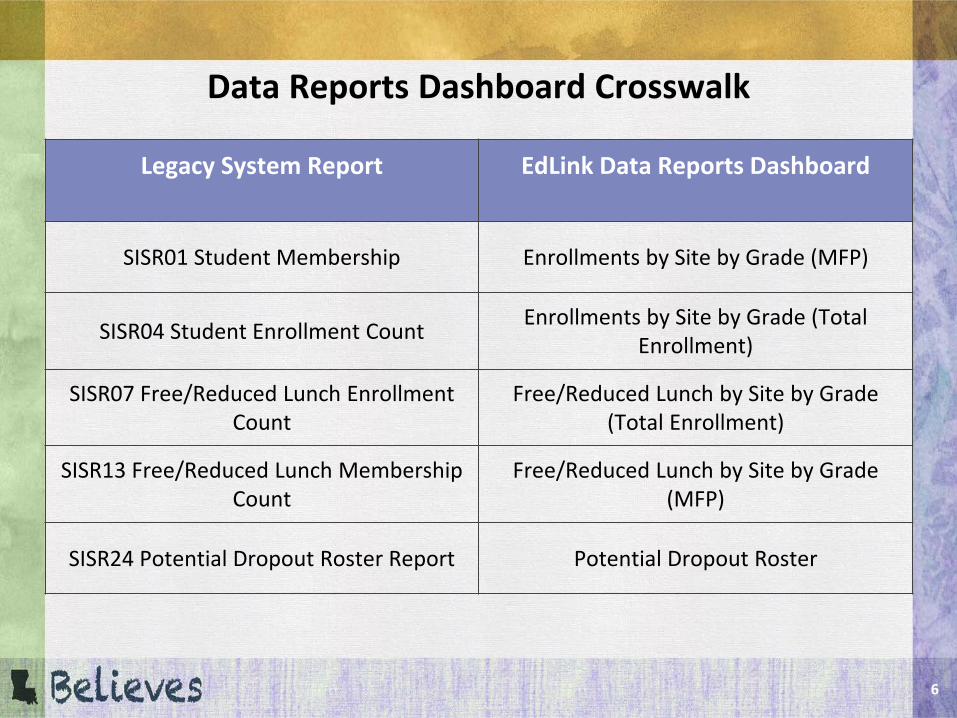
Data Reports Dashboard Crosswalk
Legacy System Report EdLink Data Reports Dashboard
SISR01 Student Membership Enrollments by Site by Grade (MFP)
SISR04 Student Enrollment Count Enrollments by Site by Grade (TotalEnrollment)
SISR07 Free/Reduced Lunch Enrollment Count
Free/Reduced Lunch by Site by Grade (Total Enrollment)
SISR13 Free/Reduced Lunch Membership Count
Free/Reduced Lunch by Site by Grade (MFP)
SISR24 Potential Dropout Roster Report Potential Dropout Roster

7
SISR01 Student Membership ExampleAggregated enrollment data by site by grade

8
Navigating to Data Reports Dashboards
EdLink 360 URL: https://reports.edlink.la.gov/Dashboard
1. Enter your User Name and Password
2. Navigate to “Usage and Data” in the “waffle”
3. Click on the Data Reports category: We will talk today about the Data Reports (previously SIS reports) dashboards

9
Enrollment and Free/Reduced Counts Dashboard
What information can I get from the filter?
● School Year = can choose any school
year that you want to display this
data
● School System = required to select
your LEA before dashboard loading
● Snapshot & Count = Oct MFP or Total
Enrollment, Feb MFP or Total
Enrollment, EOY Total Enrollment
10
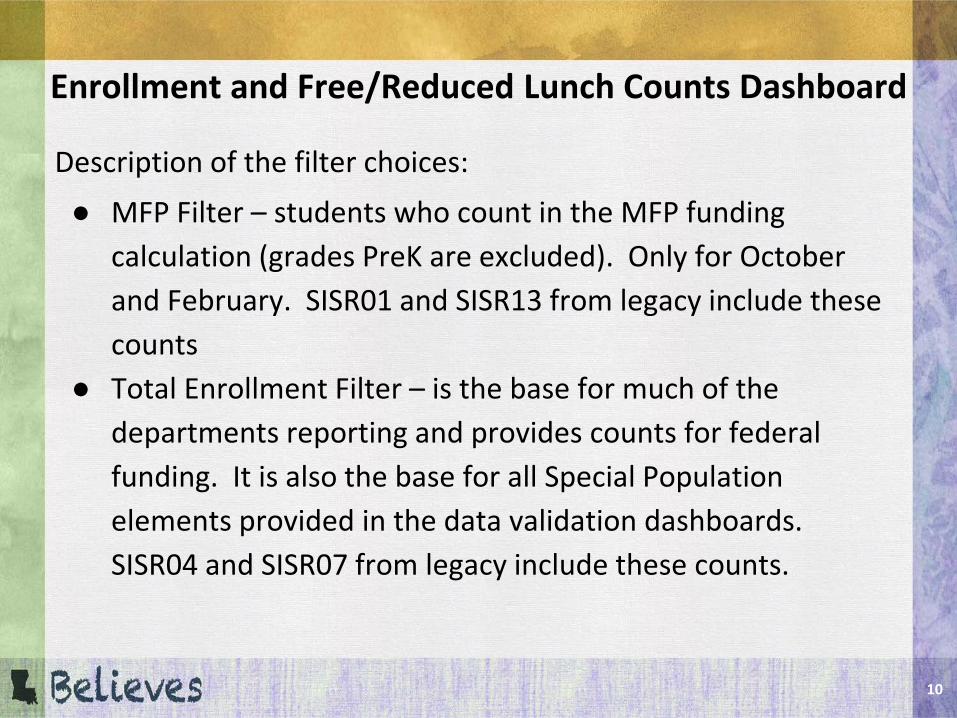
Enrollment and Free/Reduced Lunch Counts Dashboard
Description of the filter choices:● MFP Filter – students who count in the MFP funding
calculation (grades PreK are excluded). Only for October and February. SISR01 and SISR13 from legacy include these counts
● Total Enrollment Filter – is the base for much of the departments reporting and provides counts for federal funding. It is also the base for all Special Population elements provided in the data validation dashboards. SISR04 and SISR07 from legacy include these counts.

11
Enrollment and Free/Reduced Lunch Counts Dashboard Demo
12
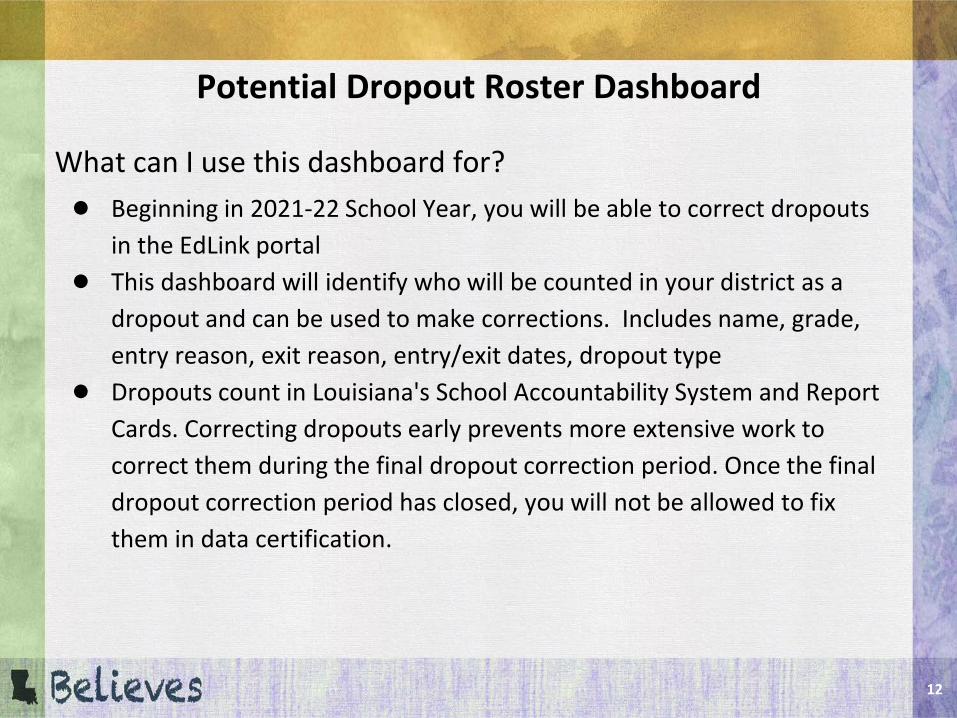
Potential Dropout Roster Dashboard
What can I use this dashboard for?● Beginning in 2021-22 School Year, you will be able to correct dropouts
in the EdLink portal● This dashboard will identify who will be counted in your district as a
dropout and can be used to make corrections. Includes name, grade, entry reason, exit reason, entry/exit dates, dropout type
● Dropouts count in Louisiana's School Accountability System and Report Cards. Correcting dropouts early prevents more extensive work to correct them during the final dropout correction period. Once the final dropout correction period has closed, you will not be allowed to fix them in data certification.
13
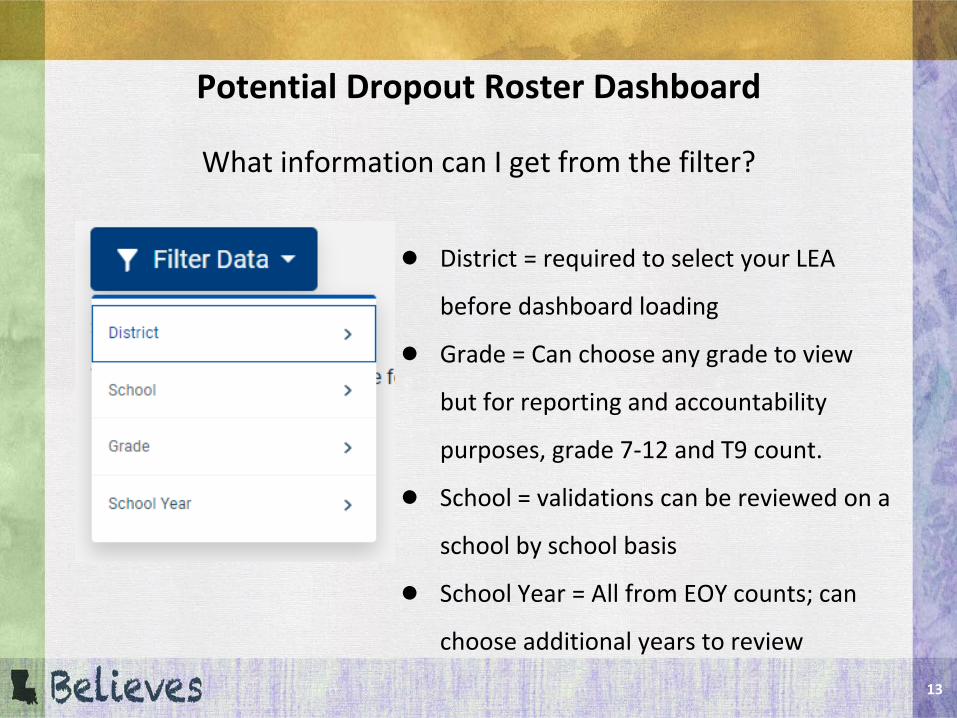
Potential Dropout Roster Dashboard
What information can I get from the filter?
● District = required to select your LEA
before dashboard loading
● Grade = Can choose any grade to view
but for reporting and accountability
purposes, grade 7-12 and T9 count.
● School = validations can be reviewed on a
school by school basis
● School Year = All from EOY counts; can
choose additional years to review

14
Potential Dropout Roster Dashboard Example
Reporting Dashboards

16
Navigating to Reporting Dashboards
EdLink 360 URL: https://reports.edlink.la.gov/Dashboard
1. Enter your User Name and Password
2. Navigate to “Essentials” in the “waffle”
3. Click on the category that you’re interested in viewing.
17
Enrollment Overview DashboardsLocated at: Essentials/Enrollments/Enrollment Overview
What data can I find here?• Enrollment Overview by subgroup – actively enrolled students for current
school year – total, by gender, by race, EL, SPED• How many students have been enrolled or exited each year – year over
year data• October & February student enrollment – year over year of students
enrolled on the count date• How many students are currently in each grade – actively enrolled
students for current school year• How has out student gender, diversity, SPED, EL, homeless changed –
year over year data• What is the current enrollment in each of our schools – actively enrolled
students for current school year

18
Enrollment Overview Dashboard
What information can I get from the filter?
● District = required to select your
LEA before dashboard loading
● School = dashboard can be
reviewed on a school by school
basis
19
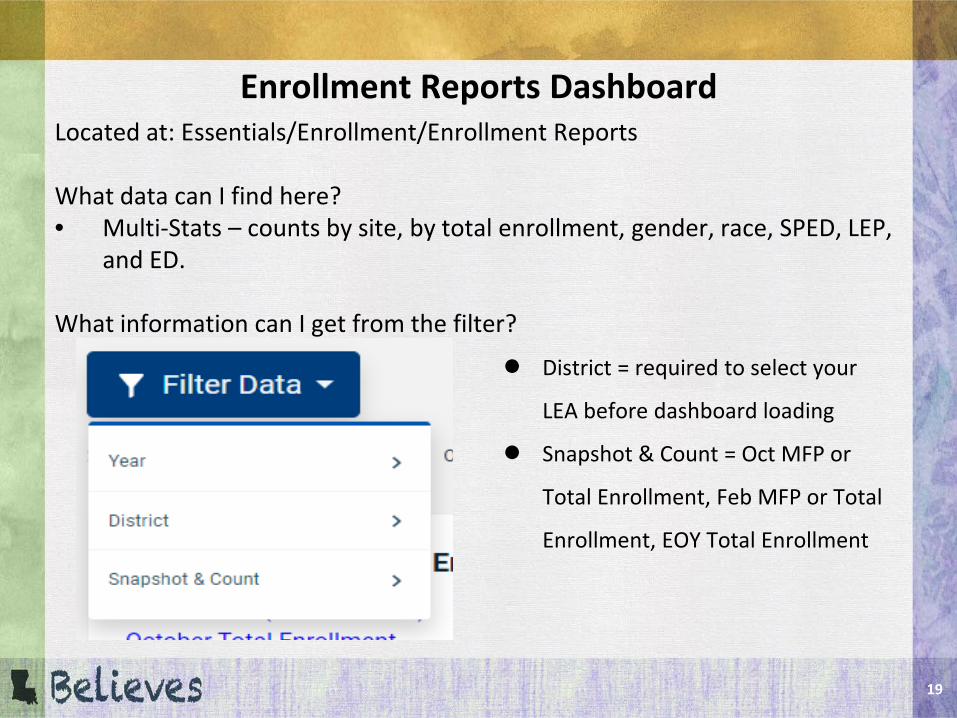
Enrollment Reports DashboardLocated at: Essentials/Enrollment/Enrollment Reports
What data can I find here?• Multi-Stats – counts by site, by total enrollment, gender, race, SPED, LEP,
and ED.
What information can I get from the filter?
● District = required to select your
LEA before dashboard loading
● Snapshot & Count = Oct MFP or
Total Enrollment, Feb MFP or Total
Enrollment, EOY Total Enrollment

20
Enrollment Overview and Enrollment Reports Dashboard Demo
21
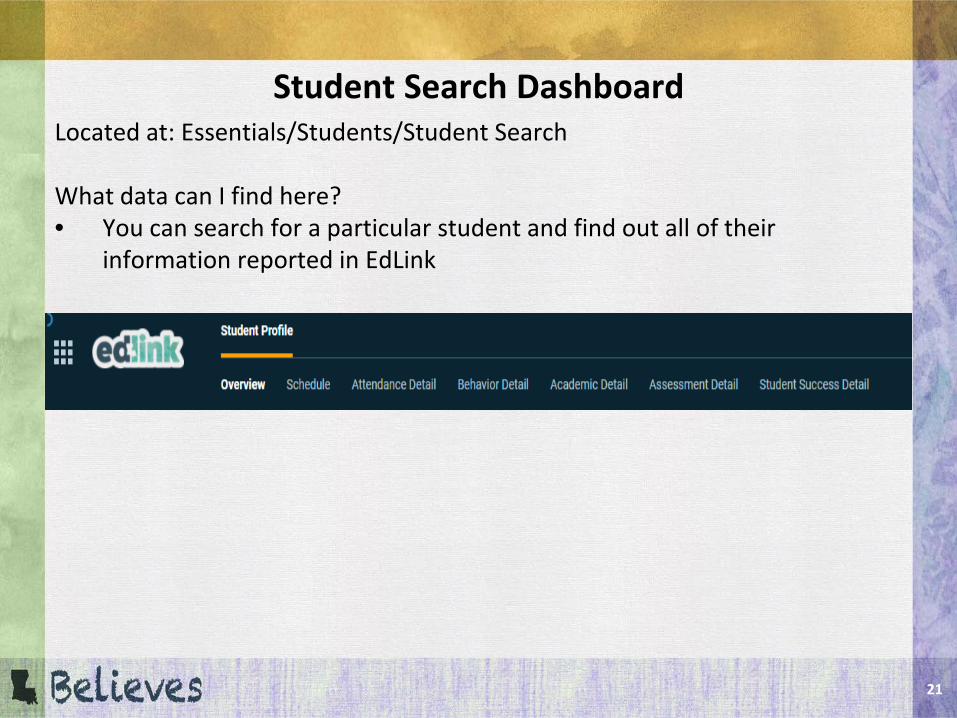
Student Search DashboardLocated at: Essentials/Students/Student Search
What data can I find here?• You can search for a particular student and find out all of their
information reported in EdLink
22
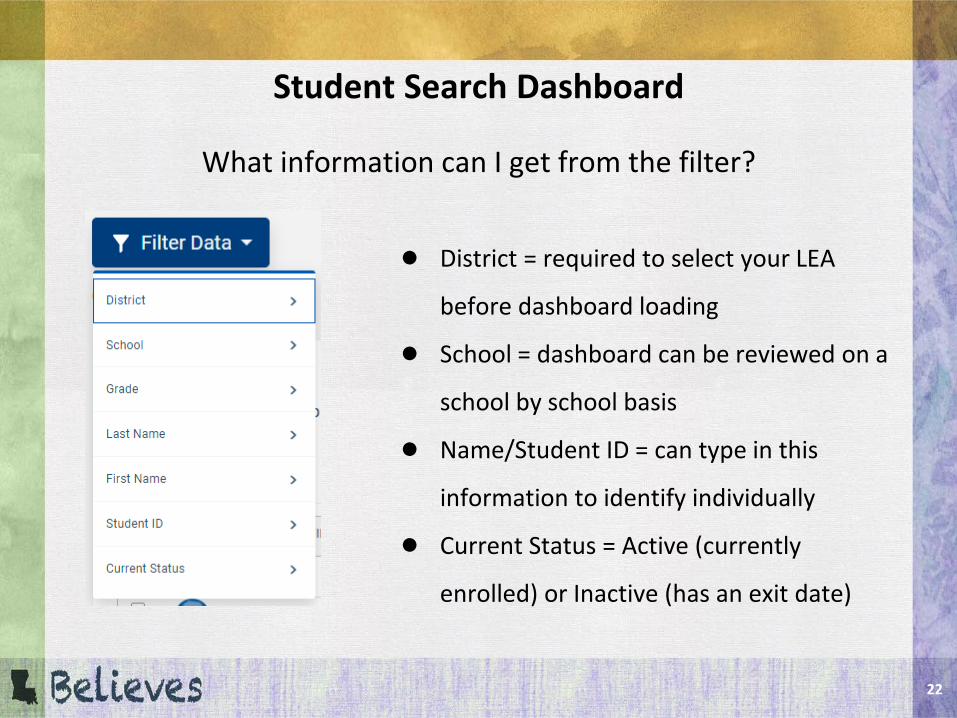
Student Search Dashboard
What information can I get from the filter?
● District = required to select your LEA
before dashboard loading
● School = dashboard can be reviewed on a
school by school basis
● Name/Student ID = can type in this
information to identify individually
● Current Status = Active (currently
enrolled) or Inactive (has an exit date)
23
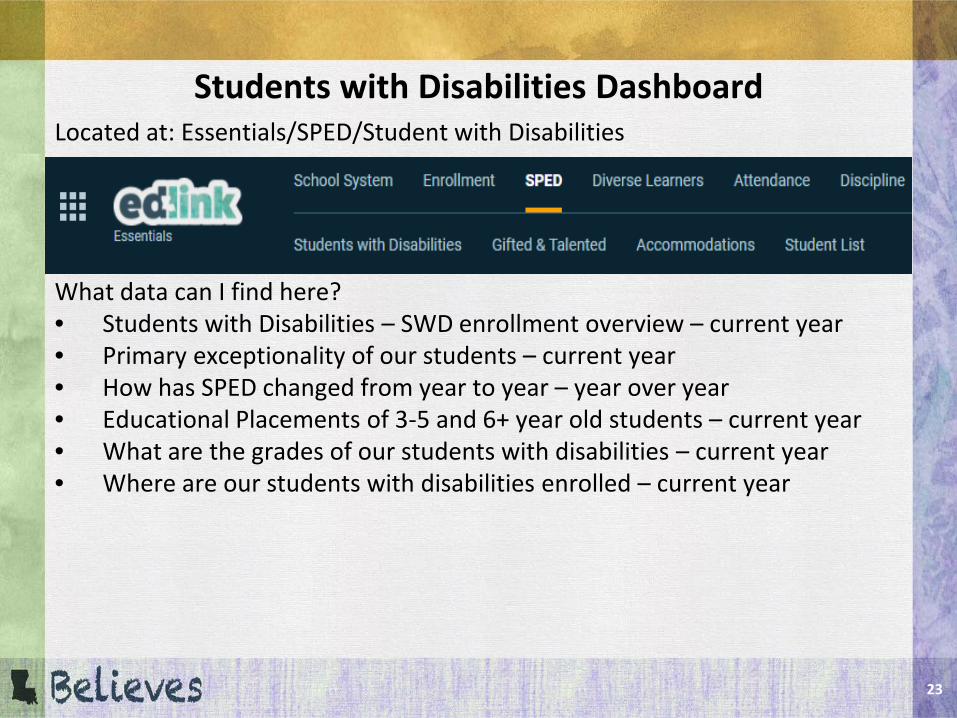
Students with Disabilities DashboardLocated at: Essentials/SPED/Student with Disabilities
What data can I find here?• Students with Disabilities – SWD enrollment overview – current year• Primary exceptionality of our students – current year• How has SPED changed from year to year – year over year• Educational Placements of 3-5 and 6+ year old students – current year• What are the grades of our students with disabilities – current year• Where are our students with disabilities enrolled – current year
24
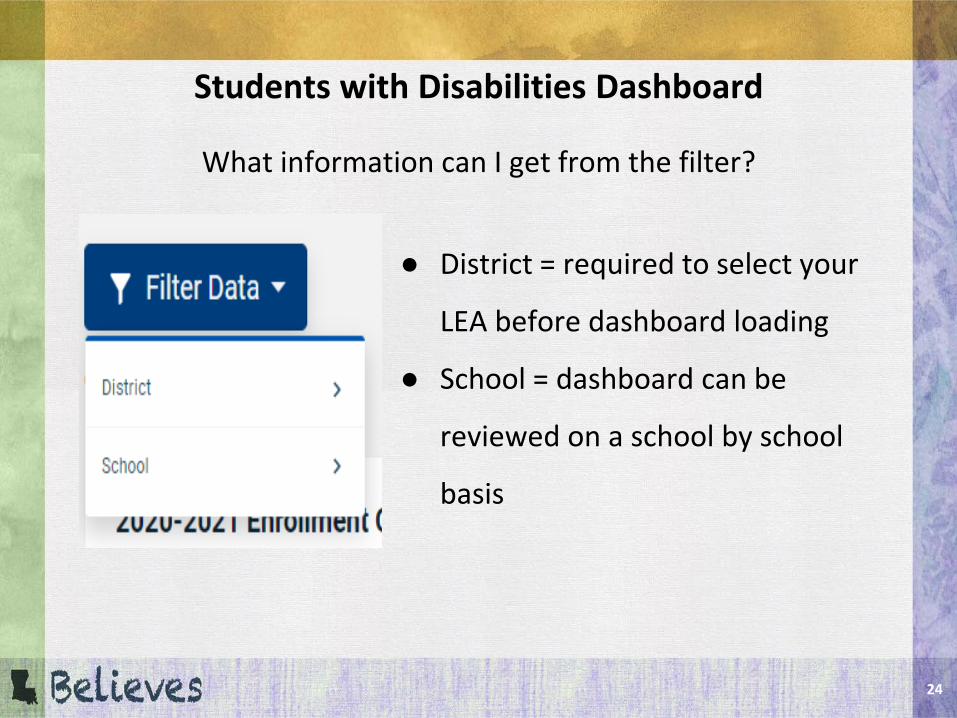
Students with Disabilities Dashboard
What information can I get from the filter?
● District = required to select your
LEA before dashboard loading
● School = dashboard can be
reviewed on a school by school
basis
25
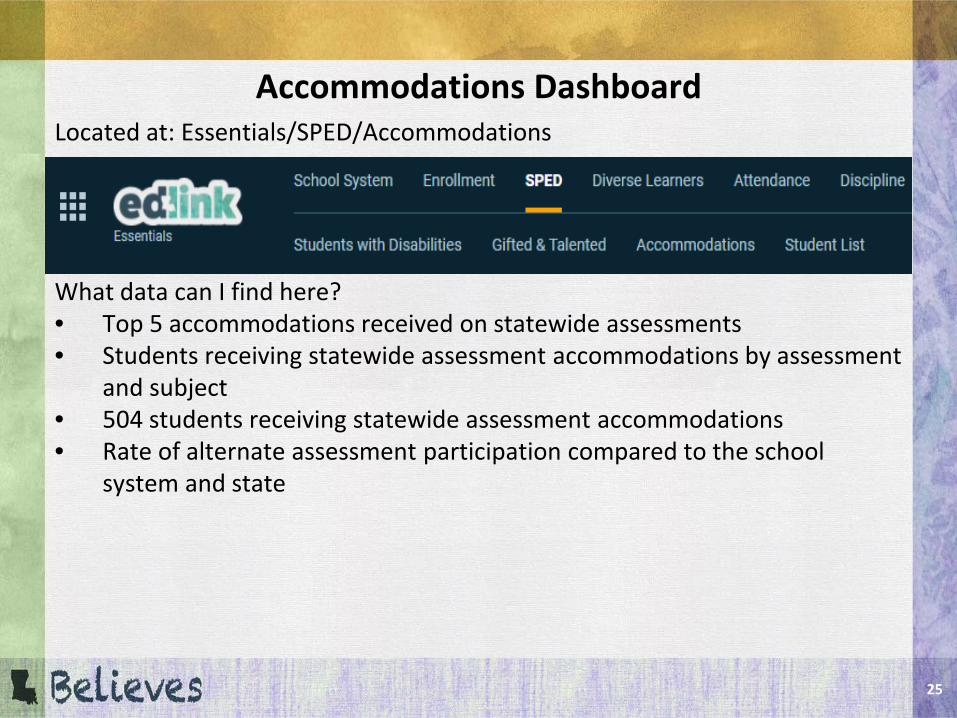
Accommodations DashboardLocated at: Essentials/SPED/Accommodations
What data can I find here?• Top 5 accommodations received on statewide assessments• Students receiving statewide assessment accommodations by assessment
and subject• 504 students receiving statewide assessment accommodations• Rate of alternate assessment participation compared to the school
system and state

26
Students with Disabilities and Accommodations Dashboard Demo
27
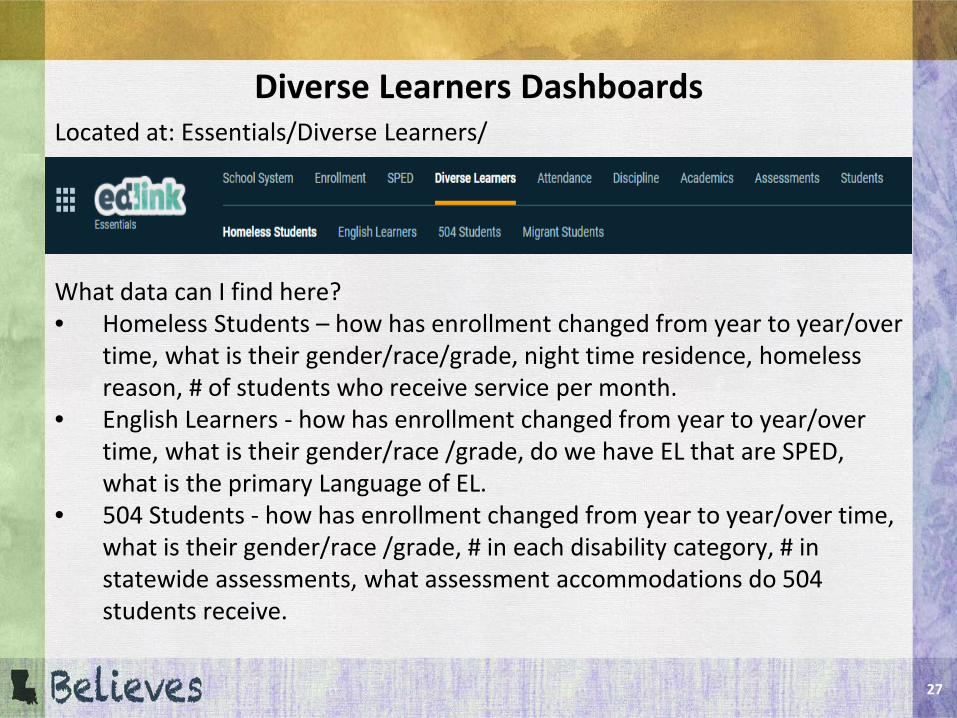
Diverse Learners DashboardsLocated at: Essentials/Diverse Learners/
What data can I find here?• Homeless Students – how has enrollment changed from year to year/over
time, what is their gender/race/grade, night time residence, homeless reason, # of students who receive service per month.
• English Learners - how has enrollment changed from year to year/over time, what is their gender/race /grade, do we have EL that are SPED, what is the primary Language of EL.
• 504 Students - how has enrollment changed from year to year/over time, what is their gender/race /grade, # in each disability category, # in statewide assessments, what assessment accommodations do 504 students receive.
28
Diverse Learners Dashboard Demo
29
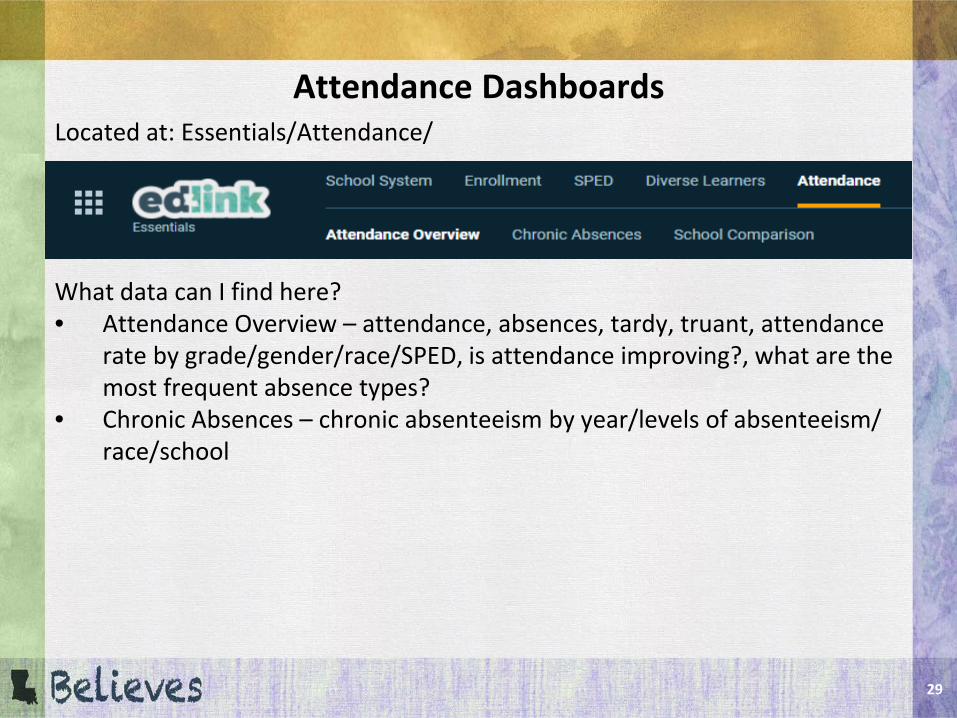
Attendance DashboardsLocated at: Essentials/Attendance/
What data can I find here?• Attendance Overview – attendance, absences, tardy, truant, attendance
rate by grade/gender/race/SPED, is attendance improving?, what are the most frequent absence types?
• Chronic Absences – chronic absenteeism by year/levels of absenteeism/ race/school
30
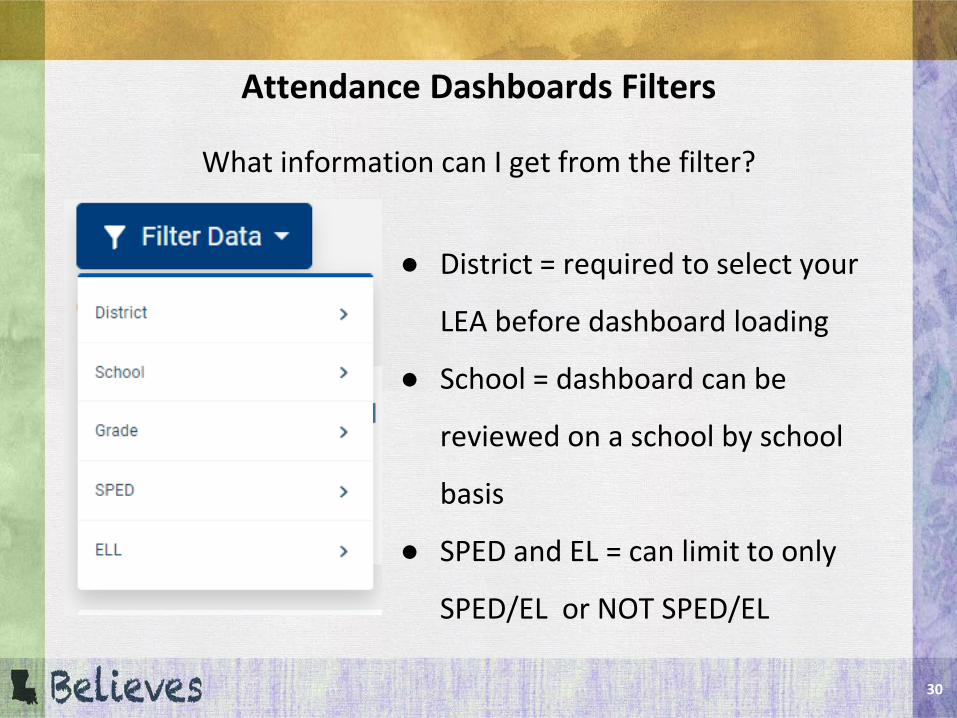
Attendance Dashboards Filters
What information can I get from the filter?
● District = required to select your
LEA before dashboard loading
● School = dashboard can be
reviewed on a school by school
basis
● SPED and EL = can limit to only
SPED/EL or NOT SPED/EL

31
Attendance Dashboard Demo
32
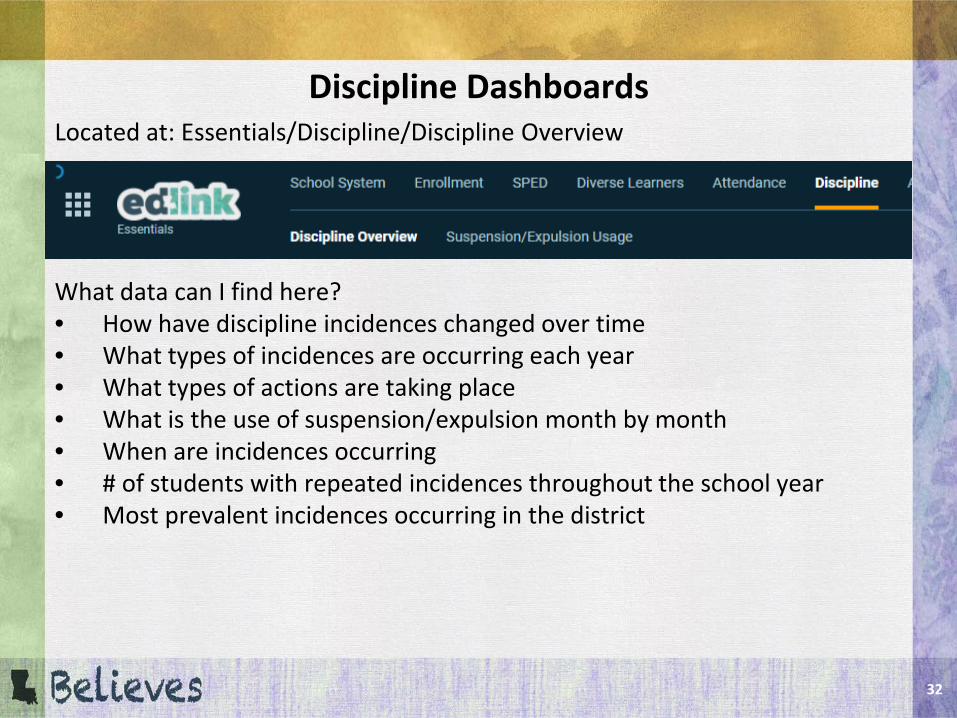
Discipline DashboardsLocated at: Essentials/Discipline/Discipline Overview
What data can I find here?• How have discipline incidences changed over time• What types of incidences are occurring each year• What types of actions are taking place• What is the use of suspension/expulsion month by month• When are incidences occurring• # of students with repeated incidences throughout the school year• Most prevalent incidences occurring in the district
33
Discipline Dashboard Demo
34
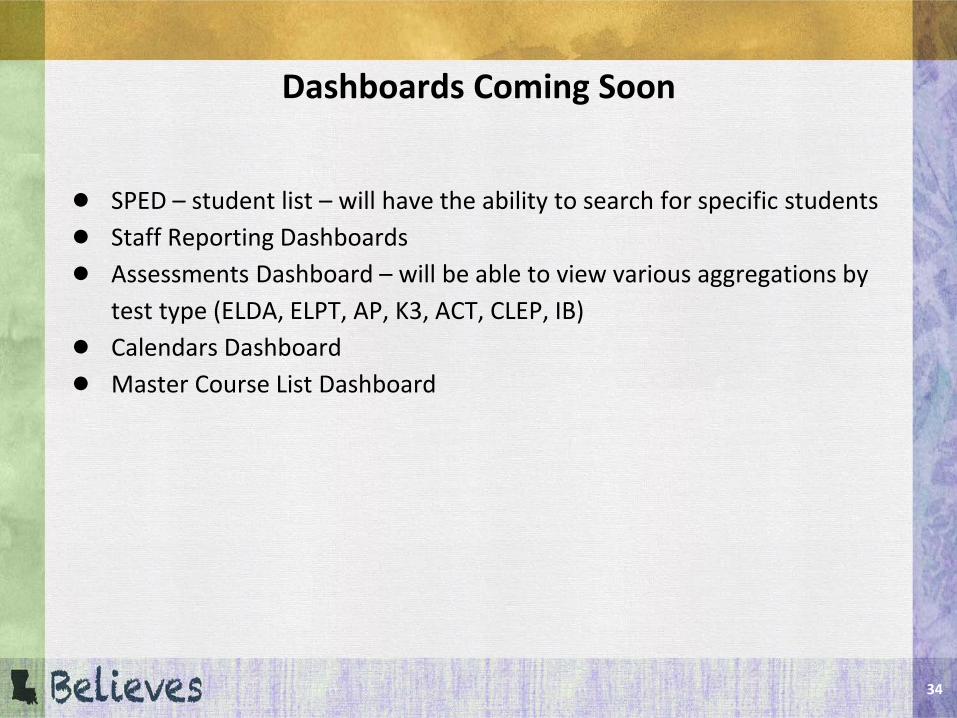
Dashboards Coming Soon
● SPED – student list – will have the ability to search for specific students● Staff Reporting Dashboards● Assessments Dashboard – will be able to view various aggregations by
test type (ELDA, ELPT, AP, K3, ACT, CLEP, IB)● Calendars Dashboard● Master Course List Dashboard

EdLink Training Reminders

36
7-Week EdLink Training
Data Systems & User Support team will be offering a 7 week training series designed to get LEAs ready for EdLink Go Live in August. Weekly training topics and the invitation for the weekly meeting was sent to all data managers on Thursday June 9th.
• Group 1: Monday's 2:00pm 6/14 - 7/26 Facilitator: Jamie Ridge
• Group 2: Thursday’s 2:00pm 6/17 - 7/29 Facilitator: Sherry Randall
• Group 3: Monday's 1:00 pm 6/14 - 7/26 Facilitator: Crystal Wilkinson
• Group 4: Wednesday's 10:00 am 6/16 - 7/28 Facilitator: Crystal Wilkinson