Embed Size (px)
Citation preview


CONTENTS
Editor’s Note 3
Culturally Designed Pedagogy in India 5Need for Skill DevelopmentChandra B. P. Singh
Vedic Science-based Education, 16Poverty Removal and Social Well-being:A Case History of Cambodia from 1980 to 2015Lee FerguSSon
Impact Analysis of the NPEGEL: 46A Study of Udalguri District of the State of Assam anita nuna
Factors Affecting Academic Performance of the Girl Students 65Evidence from West BengalSujata Bera and Soumita daSguPta
Learning Achievement in Mathematics and Hindi 83Language in Municipal Corporation Schools of DelhiraShmi diwan
Personality as Predictor of Students’ Science Achievement 104K. S. miSra and Stuti SrivaStava
A Study of Convergent Thinking and Divergent 111Thinking among the Secondary School Students in Relation to Ethnicity, Locale, Types of Institutions and SexLaLit Kumar and PuSPLata Kumari
JOURNAL OF
INDIANEDUCATION
Volume XXXXI Number 4 February 2016
Chapters.indd 1 10/13/2016 2:58:25 PM

Dr. Ambedkar: A Universal Educator 125riteSh Singh tomer
Education and its Political Context for the Marginalised: 132A Study based on Ambedkar Nagar DistrictdivyanShu PateL
Guidelines for In-service Training Program 144for Need-based Integration of ICT in SchoolsZaFar iqBaL
Chapters.indd 2 10/13/2016 2:58:25 PM

Editor’s NotE Education has continued to evolve, diversify and extend its reach since the dawn of human history. Every country develops its system of education to explore and promote its unique socio-cultural identity and meet the challenges of the times. Needless to say that the socio-cultural context and education are complementary, inclusive of each other’s essential components. Culture paves the way for education and is responsible for the flow of cultural values in a society. Life survives under balanced conditions. The interlinkage between culture and education is the very essence of life, its existence and continuity.
In his article, Chandra B.P. Singh highlights the need to design culture specific pedagogy keeping in view our multicultural context. India has a long history of traditional system of education which is relevant in present context also. Vedic science propagated by Maharishi Mahesh Yogi has its source in ancient India. It brings together the ancient Indian traditional knowledge (Vedas) and discoveries of modern science to understand fundamental questions about life. Lee Fergusson, in his article examines the role of Vedic Science based education for socio-economic and educational developments in Cambodia.
The government of India initiated several schemes and programmes to improve the education of girls. Anita Nuna in her research based paper traced the contribution of one such scheme namely, ‘National Programme for Education of Girls at the Elementary Level’ (NPEGEL) for the education and overall development of tribal girls of Assam.
Sujata Bera and Soumita Dasgupta in their joint paper analyse some of the factors influencing the academic performance of girls studying at the senior secondary level. The findings supports the positive affect of private tutors on academic performance of girls which needs to be further explored as suggested by the authors.
The National Policy on Education (1986) visualises Mathematics as the vehicle to prepare children to think, reason, analyse and articulate logically. Rashmi Diwan’s paper presents achievements of children in Mathematics along with Hindi in Municipal Corporation Schools of Delhi. Some concerns which need to be addressed include fear of failure, curriculum catering to both talented and non participating learners, assessment methods beyond mechanical computation, teacher preparation and support teaching of Mathematics.
Researches show that personality traits play an important role in facilitating academic success in various subjects. K.S. Misra and Stuti Srivastava identify the relationship of some personality traits and achievements of students in
Chapters.indd 3 10/13/2016 2:58:25 PM

Science. Lalit Kumar and Pusplata Kumari in their research paper reveal that convergent and divergent thinking of science students has its bearing on ethnicity, gender and types of institutions.
The Constitution of India guarantees equality of status and opportunity to all its citizens. Continued exclusion of vast number of children from education and the disparities caused through school system challenge the efforts towards achieving equality. Two articles address this issue. Ritesh Singh Tomar highlights the role of Dr. Ambedkar in expanding the domain of education from few privileged section of the Indian society to the most backward classes and Divyanshu Patel analyses the linkages between educational development and social mobility in marginalised section of our society.
The present issue concludes with Zafar Iqbal’s article which presents suggestive guidelines to organise training for school teachers for ICT integration in teaching learning process.
We wish a very happy 2016 to all our readers.Academic Editor
Chapters.indd 4 10/13/2016 2:58:25 PM

5 5
Culturally Designed Pedagogy in India Need for Skill Development
Chandra B. P. Singh*
AbstractAdequate education and skills can improve the employability of workers, the productivity of enterprises and the inclusiveness of economic growth. This realisation has led to redesign pedagogy introduced at the school level and has also increased interest in the formulation of skills development policies to drive the change necessary to meet development challenges. To visualise a functional relationship between culture and pedagogy in the labour market it is desirable to ascertain pedagogy ingrained in secondary school education system. Reform efforts based on an ideal model of rationality assume that teachers would be receptive to scientific knowledge about pedagogy. They would directly apply it to their teaching. This model is etic (universal) by nature and known as process product paradigm. The lack of acknowledgement and appropriation of universal best practices of instruction by teachers led to indigenous pedagogical approach which is more contextual and local. This conceptual paper attempts to capture cultural realities in the context of skill development programme.
* Professor of Psychology, T M Bhagalpur University, Bhagalpur, 812002.
iNtroductioN
At the global level neo-liberal policies and neo-conservative values have reinforced the class character of education. The schools have
witnessed dichotomy in pedagogy designed separately for the elite and non-elite children. The society has also experienced culture-fair not culture-specific pedagogy for children of marginalised group. Inequality in
Chapters.indd 5 10/13/2016 2:58:25 PM

6 Journal of Indian Education February 2016
education is a reflection of power game the elite maintain in the society by restructuring the need for education in the labour market. Neo-liberal policies, indeed, do not convert learners into ‘human capital’. It transforms learners into ‘fixed assets’. Adequate education and skills can improve the employability of workers, the productivity of enterprises and the inclusiveness of economic growth. This realisation has led to redesign pedagogy introduced at the school level and has also increased interest in the formulation of skill development policies to drive the change necessary to meet development challenges. Many of these policies, increasingly broad in scope and outreach, are underpinned by efforts to bring the world of education and training and the world of work closer together. An ILO review of country experiences (ILO, 2008) shows that countries that have succeeded in linking skills development to improved employability, productivity and employment growth have directed their skills development policies towards meeting three objectives:• matching demand and supply of
skills;• maintaining the employability of
workers and the sustainability of enterprises; and
• sustaining a dynamic process of development.The key message is that skills
development should not be seen, or provided, in isolation. It is a means to promoting decent work, improving
productivity, generating employment growth, and promoting economic and social development. Coordination with other policies and strategies (e.g. national development strategies, sector growth strategies) is therefore critical. Development strategy based on improved quality and availability of education and training can engender a virtuous circle in which skills development fuels innovation, productivity increase and enterprise development, technological change and competitiveness that are needed to sustain and accelerate the creation of more and better jobs (ILO, 2008).
India lags far behind in imparting skill training as compared to other countries. Only 10 per cent of the total workforce in the country receives some kind of skill training (2 per cent with formal training and 8 per cent with informal training). Further, 80 per cent of the entrants into the workforce do not have the opportunity for skill training. The accelerated economic growth has increased the demand for skilled manpower that has highlighted the shortage of skilled manpower in the country. India is among the top countries in which employers are facing difficulty in filling up the jobs. The problem to fill up the available jobs is 48 per cent in India which is above the global standard of 34 per cent in 2012. The lack of available applicants, shortage of hard skills and shortage of suitable employability, including soft skills, is some of the key reasons in finding a suitable candidate for available
Chapters.indd 6 10/13/2016 2:58:25 PM
7Culturally Designed Pedagogy in India: Need for Skill Development
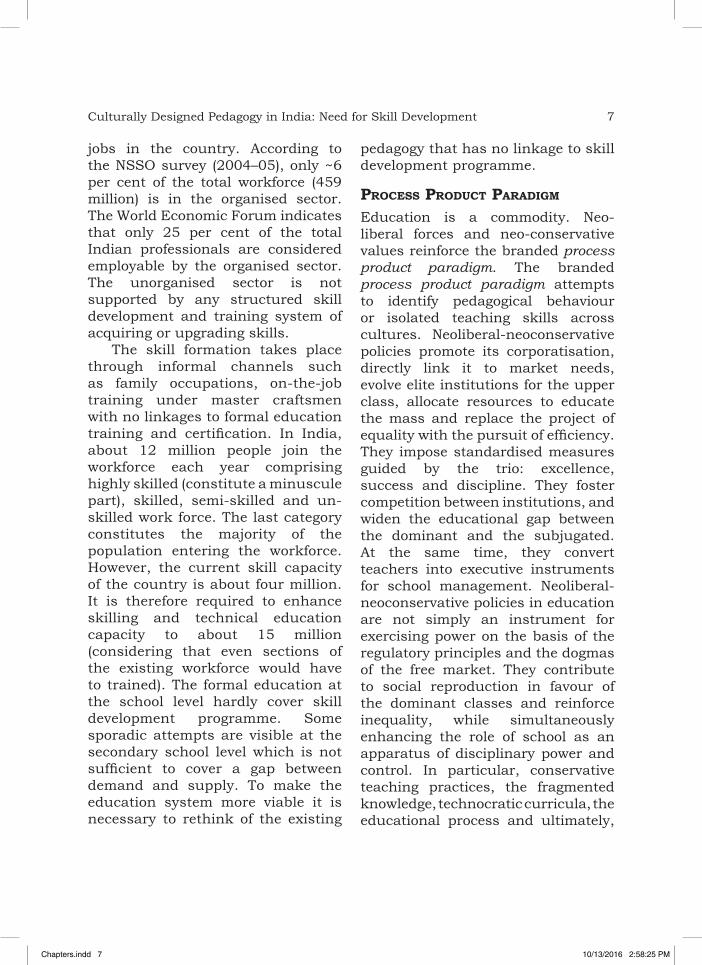
jobs in the country. According to the NSSO survey (2004–05), only ~6 per cent of the total workforce (459 million) is in the organised sector. The World Economic Forum indicates that only 25 per cent of the total Indian professionals are considered employable by the organised sector. The unorganised sector is not supported by any structured skill development and training system of acquiring or upgrading skills.
The skill formation takes place through informal channels such as family occupations, on-the-job training under master craftsmen with no linkages to formal education training and certification. In India, about 12 million people join the workforce each year comprising highly skilled (constitute a minuscule part), skilled, semi-skilled and un-skilled work force. The last category constitutes the majority of the population entering the workforce. However, the current skill capacity of the country is about four million. It is therefore required to enhance skilling and technical education capacity to about 15 million (considering that even sections of the existing workforce would have to trained). The formal education at the school level hardly cover skill development programme. Some sporadic attempts are visible at the secondary school level which is not sufficient to cover a gap between demand and supply. To make the education system more viable it is necessary to rethink of the existing
pedagogy that has no linkage to skill development programme.
ProcEss Product Paradigm Education is a commodity. Neo-liberal forces and neo-conservative values reinforce the branded process product paradigm. The branded process product paradigm attempts to identify pedagogical behaviour or isolated teaching skills across cultures. Neoliberal-neoconservative policies promote its corporatisation, directly link it to market needs, evolve elite institutions for the upper class, allocate resources to educate the mass and replace the project of equality with the pursuit of efficiency. They impose standardised measures guided by the trio: excellence, success and discipline. They foster competition between institutions, and widen the educational gap between the dominant and the subjugated. At the same time, they convert teachers into executive instruments for school management. Neoliberal-neoconservative policies in education are not simply an instrument for exercising power on the basis of the regulatory principles and the dogmas of the free market. They contribute to social reproduction in favour of the dominant classes and reinforce inequality, while simultaneously enhancing the role of school as an apparatus of disciplinary power and control. In particular, conservative teaching practices, the fragmented knowledge, technocratic curricula, the educational process and ultimately,
Chapters.indd 7 10/13/2016 2:58:25 PM

8 Journal of Indian Education February 2016
the entire school culture are traversed and reconfigured by the market logic. Neoliberal-neoconservative policies attempt to shape the personality of students and teachers, making them susceptible to the propaganda of the dominant social classes. Education is reduced to a traded object, a process akin to banking, whereby knowledge is deposited into students.
iNdigENous PEdagogy To visualise a functional relationship between culture and pedagogy in the labour market it is desirable to ascertain pedagogy ingrained in secondary school education system. Reform efforts based on an ideal model of rationality assume that teachers would be receptive to scientific knowledge about pedagogy. They would directly apply it to their teaching. This model is etic (universal) by nature and known as process product paradigm (Gage and Needels, 1989). The lack of acknowledgement and appropriation of universal best practices of instruction by teachers led to indigenous pedagogical approach which is more contextual and local. This model is emic (culture-bound) and termed cognitive process product (Ross, et al., 1992). Cognitive process product contradicts teacher thinking research which is primarily located in the Anglo-European world and rarely deals with how teachers from different cultures especially developing countries, structure their actions in the classroom and the related frameworks and worldviews
that underlie these actions. Teacher education within the large contemporary Indian socio-political context speaks dualism of etic and emic cultural frame. Within the dominant culture (Hindu culture) a good number of satellite cultures exist. The strain prevails in the education system when the neoliberal economic and social engineering approach to education adopts branded process product and largely ignores emic pedagogy (culture-specific education).
Two parallel strands of thought can be discerned within the current policy discourse: the neo-liberal frame of standardisation, teacher accountability and learning outcomes that regards education as an enterprise of efficient delivery; and the academic-led perspective that emphasises radical change in the preparation of teachers as agents of social transformation. The agenda is to create knowledge workers for a service system not an active citizenry. In this frame the pedagogic enterprise is to prepare human capital for the labour market and the central thrust of pedagogic policy is to supply labour forces in the market for development (Batra, 2012, p.5). Pedagogy, which includes the way in which teachers think and act, differs across the world. Clarke’s (1995) review of teacher thinking literature identifies variation between teachers located in different parts of the world. Variations exist in the way teachers relate to their student; in the goals that teachers have for student learning; in the way
Chapters.indd 8 10/13/2016 2:58:25 PM

9Culturally Designed Pedagogy in India: Need for Skill Development
teachers view the curriculum and the textbook; in the way knowledge is communicated to student and in the way teachers interact with their students. Alexander’s (2000) study of classroom from five countries (USA, UK, Russia, India and France) reflects variation in culture. India had little in common with classroom of USA and UK. Knowledge communicated in the classroom was generally procedural and most tasks given in classrooms were characterised by revision, generating ritual understanding. The study further revealed that teachers used their lifelong experiences to construct their thinking and action in the classroom. Pedagogy that teachers hold is retained not only during the professional training but also through being a child, student and parent in a particular culture. In this socialization process, a teacher thus becomes both recipients and sustainers of culturally-defined model of pedagogy. Teacher thinking embodies several categories of cultural ingredients (Clarke, 2001). Elbaz’s work (1990) highlights the tacit nature of teachers’ thinking. Tabachnick and Zeichner (1986) place coherence and consistency in teachers’ thought and action. Despite the use of cultural frame in teaching a large framework of meaning or symbolic systems (Lisovskaya and Karpov, 1999) of teacher thought and action is left unexamined. Teacher thinking research, while recognising the cultural construct gives rise to the differences in what occurs in
classrooms. It rarely includes analyses of how culture shapes teachers’ thought and action. The location of teacher thinking and teaching in a larger meaning system and the implication of this embeddedness for reform in instruction have received limited attention. At least five cultural constructs representing the broader meaning system underlie pedagogical practices in classroom in India (Clarke, 2003, p. 29; Mendonca and Kanungo, 1990). These constructs bear a relationship with instructional teaching and also have an impact on performance management process. The first construct is high uncertainty avoidance where a person is unwilling to take risks and accepts organizational change which is manifested in an individual’s reluctance to take personal initiatives outside of the prescribed roles. As a result, individuals tend to be dependent and to develop an external locus of control (a belief that the external agency controls them).The second construct-relatively low individualism implies that family concerns and group attainments take precedence over the work concerns and attainment of the individual. Unlike in the western cultures, work to the individual is not an act of self fulfillment or self-expression, but to primarily a means to maintain his family to provide for the well being of aged parents, spouse and children. High Power distance reflects a vertical position in the organisational hierarchy. This power distance
Chapters.indd 9 10/13/2016 2:58:25 PM

10 Journal of Indian Education February 2016
makes an undisputed structural relationship between teachers and students in terms of sneh-shradha (affection-deference). Teachers give knowledge and students receive it. Teachers being more knowledgeable than their counterpart show cognitive dominance in the classroom. Hence, the process of feeding to the students continues without any resistance. Low masculinity is the fourth construct of culture in developing countries. Teacher orientation centres on personalised relationship rather than performance. Affiliation need takes precedence over satisfaction derived from achieving job objectives. Job performance can set aside in order to discharge socially approved duties in the interpersonal contexts. And finally, context sensitive thinking has led to an emphasis on the
context determined rather than principle-dominant behaviour among teachers in India. Context thinking always decides the present which is constantly changing. Teachers show their unpredictable behavior with regard to performing uniformly. Further, Clarke (2003) has added one more construct to culture known as collectively accumulated knowledge that can be attested and transferred. An individual’s decisions and choices made are often constructed by the community rather than by individual experience and perception. In this process an individual constructing his or her knowledge becomes less significant (Derne, 1995; Kurtz, 1992; Kakar, 1979).
tEachEr thiNkiNg
Teachers thinking and teaching as culturally constituted captures the
Table: Impact of Culture on Performance Management Process
Cultural Construct Manifested behavioural ImpactHigh uncertainty avoidance ● Foster dependency
● Discourage personal initiative ● Inculcate external locus of control
Low individualism ● Job as means ● Group concerns task accomplishment
High power distance ● Hierarchical authority structure● Acceptance of new ideas solving and personal
initiativeLow masculinity ● High affiliation needs hinders task and goals
● Personalised relationship and work action planHigh context thinking ● Context dominant not followed org. standards
● Low principle-dominant behaviour and guidelines
Chapters.indd 10 10/13/2016 2:58:25 PM

11Culturally Designed Pedagogy in India: Need for Skill Development
unconscious but constructive nature of pedagogy. On the other hand, pedagogy alludes to the ingrained and implicit dimensions of culture. Teachers’ underlying knowledge and belief on instructional teaching reflect preparation of teachers and action research in ongoing professional development (Griffiths, 2000; Rearick and Feldman, 1999). Both teachers’ preparation for classroom teaching and action research for professional development and shooting out contextual problems focus on cultural construct that shapes teachers’ mind set towards teaching. Teacher thinking is directed towards either reform or resistance to change in pedagogy. Getting a cue from the cultural constructs discussed earlier two cultural entities-teachers’ openness to regulation and the perception of task as duty enable teachers to appropriate the new method of pedagogy (Clarke, 2003). High uncertainty avoidance leads to discourage personal initiative on one hand but allows acceptance of regulation for new ideas. When combined with low individualism job become a means to continue in the system. These features seem conducive to reform in pedagogy. Further, two cultural entities– the hierarchical structure as a regulative social framework (high power distance) and knowledge as discovered and attested collectively (low) individualism are barriers to teachers’ appropriateness of a meaningful activity (Clarke, 2003).
The question of whether teachers perceive the new method of teaching and learning as different from the traditional method and the acceptance of the new method as viable are important, indicating initial conditions for teachers’ appropriation of the reform in instruction. Previous studies in India (Singh, 2009) illustrate that in-service training and other short-term development programmes have supported the pedagogical reform process. Acceptance of authority, openness to regulation and job as a means to work with the system and possibly the vertical social framework allows teachers to be receptive to reform programmes. The impact of both in-service and professional development right from DPEP to SSA is evident in the fairly consistent use of instructional-aids and activities in the classroom. Teachers who formerly used only the textbook for instruction are now employing a variety of objects and activities to help their students learn. In fact, the use of teaching-aids and activity appears to dominate teachers’ thinking and action almost to the point that teachers feel understanding can only be successfully brought about by performing an activity or by looking at a chart or object.
The other aspect of cultural impact on instructional teaching cannot be denied that teachers’ use of instructional-aids, activities and demonstration during instruction have not integrally transformed teaching
Chapters.indd 11 10/13/2016 2:58:25 PM

12 Journal of Indian Education February 2016
and learning in the classroom. They have skillfully integrated ‘activity and joyful learning’ into their traditional rote method of instruction where knowledge is transferred en bloc and memorized. Knowledge continues to be given in demonstration and activity and learning continues to be based on repetition. During instruction, though transformed with activity and demonstration, teachers remain primary players in the classroom. They define parameters for participation as portrayed especially in their interrogation and enabling of student learning (Clarke, 2003; Singh, 2009). Teachers tended to begin the class by asking the whole class questions and then moved on to directing questions to individual students. Their questions were usually how, when and what. Teachers’ interactions with students rarely contained why questions. They responded to students’ answers by saying whether it was correct or incorrect. Hardly any teacher justified his or her answer for why he had said something incorrect. Teachers kept asking questions implying the importance of teachers’ authority and command over all valid knowledge. Teachers sometimes used experience as an introduction to the lesson. However, appropriate students’ knowledge as an integral part of instruction was missing (Clarke. 2003; Singh, 2009). Similar incorporation was evident in Osborn et al.’s (1997) study of teachers’ belief and goals in France (universalistic)
and in England (differential). French teachers tended to incorporate the importance given to the individual child into their framework of universalism while English teachers stressed on specific problems of child. Cohen’s (1990) study revealed that teachers skillfully blended practices with traditional methodology in California. The limited impact of new ideas about teaching and learning can be attributed to the influence of culture on the teacher trainers and the training modules. Trainers appeared to select dimensions of the reform that they understood and could fit easily into their own worldviews. Hierarchy in the society of Indian culture caused trainers to adopt knowledge dominance communication to their recipients. The notion of collective decision led to a restrictive view of the students (Alexander, 2000). “Teacher trainers guided teachers with the contents of pedagogy using traditional instructional methods. Teachers rarely asked questions, nor did they engage trainers in discussion or argument. Most importantly, teachers’ experiences in the classroom were not validated and unpacked with reference to the new instructional methodology. In a similar way to teachers’ limited perception of children as learners, teachers’ capacities and experiences were not considered during training” (Clarke, 2003, p. 38).
In short, teachers were able to reflect more effectively on their attempts at reforming practice.
Chapters.indd 12 10/13/2016 2:58:25 PM

13Culturally Designed Pedagogy in India: Need for Skill Development
The reflective dimension got rarely nurtured and strengthened during visits by coordinators to the schools or during teachers’ monthly visit to the Cluster Resource Centers (CRC). Though a good number of researches in the west on reflection and action research (Griffiths, 2000; Rearick and Feldman, 1999; Zeichner, 1994) have been documented, reflective practices in developing countries need to be addressed under emic frame. Teaching and learning embody particular institutional cultures. Teachers also embody dimensions of local micro-culture in addition to institutional culture. Development of education in different countries follows a linear or cyclical linear pattern or parallel cyclical. Whether cyclical or linear, educational reform that deals with teaching and learning, must take into consideration the cultural patterning of how teachers teach and students learn. How does culture within teacher education institutions– contiguous and remote give rise to patterns of engagement in the teaching-learning enterprise that shapes pedagogy?
duality iN EducatioN Two assumptions need to be examined in the process. First, to consider educational practice from the viewpoint of culture and not from the perspective of the knowledge domain that is being taught. Second, the premise that curriculum changes alone cannot have a significant impact if cultural, social and political
expectations are not challenged and alternative envisioned. Why learning is perceived as acquisition of knowledge rather than as understanding and conceptual change? Teacher education in the light of culture and pedagogy wraps itself in dualities, thus getting circumscribed and resistant to meaningful interrogation. The duality of acceptance and resistance reflects mind set of teachers in the education system. It is further argued that dualities around the child and the curriculum, the teacher and the curriculum, pedagogy and the curriculum, theory and practice are reinforced and even extended by the very processes that seek to train teachers to transact curriculum. Designing teacher training modules need to consider how the cultural dimensions of teacher thinking and teaching relate to the intended objectives of the training and to revise training accordingly. Future efforts are expected to embody cultural constructs into pedagogy and action research programmes. Drawing inspiration and principles from Paulo Freire’s liberation pedagogy and the perspectives of critical pedagogy (insights of the Marxist tradition) critical educators need to struggle to preserve the free and public character of education, and advance holistic and humanistic contents that combine theoretical and practical learning. They should endeavor to establish their connections with alternative educational networks; recognise the value of the experienced
Chapters.indd 13 10/13/2016 2:58:25 PM

14 Journal of Indian Education February 2016
world of students coming from the oppressed and exploited social classes, understand its historical and social relevance and make use of it in their teaching, which, in turn, must inextricably interweave theoretical knowledge, knowledge of practice and
critical understanding. In the context of counter-hegemonic pedagogy, which they advocate, critical educators humanise the pedagogical relationship and expose the normative discourse of the school embedded in the culture of the school apparatus.
rEfErENcEs
aLexander, r. 2000. Culture and Pedagogy: International comparisons in primary education. Oxford University Press, Blackwell.
Batra, P. 2012. Transforming classroom practice: Teacher education and pedagogy in India. Downloaded study materials from http://episteme4.hbcse.tifr.res.in/proceedings/abstracts-of-review-talks/batra-abstract
CLarKe, P. 1995. Cultural models of teacher thinking and teaching. Qualifying paper, Harvard University, Cambridge, MA.
CLarKe, P. 2001. Teaching and learning : The culture of pedagogy. Sage publications, New Delhi.
CLarKe, P. 2003. Culture and classroom reform: The case of District Primary Education Project India. Comparative Education. 39 (1), 27-44.
Cohen, d. 1990. Revolution in one classroom: The case of Mrs. Oubiler, Educational Evaluation and Policy Analysis. 12 (3). 327-345.
derne, S. 1995. Culture in action, family life, emotion, and male dominance in Banaras, India. New York University Press, New York.
eLBaZ, F. 1990. Knowledge and discourse: the evolution of research on teacher thinking, In C. Day, M. Pope & P. Denicolo (eds.) Insights into teachers’ thinking and practice. The Falmer Press, New York.
gage, n., and m. needeLS. 1989. Process product research on teaching: A review of criticisms, Elementary School Journal. 89, 253-300.
griFFithS, v. 2000. The reflective dimension in teacher education, International Journal of Educational Research. 33,539-555.
iLo .2008. Skills for employment. Report, Switzerland.KaKar, S. 1979. Indian childhood: Cultural ideas and social reality. Oxford University
Press, Delhi.KurtZ, S. 1992. All mothers are one. Columbia university press, New York.LiSovSKaya, e. and v. KarPov. 1999. New ideologies in post communist Russian textbooks,
Comparative Education Review. 43(4), 522-543. mendonCa m. and r. n. Kanungo. 1990. Work culture in developing countries: Implication,
Psychology and Developing Society. 2(2), 37-65.oSBorn m., P. BroadFoot, C. PLaneL and a. PoLLard. 1997. Social class, education
opportunity and equal entitlement: Dilemmas of Schooling in England and France, Comparative Education. 33(3), 375-393.
Chapters.indd 14 10/13/2016 2:58:26 PM
15Culturally Designed Pedagogy in India: Need for Skill Development
reariCK m. and a. FeLdman. 1999. Orientations, purposes and reflection: A framework for understanding action research. Teaching and Teacher Education. 15. 333-349.
roSS e. w., j. Cornett and g. mC CutCheon. 1992. Teacher personal theorizing. New York University Press, New York.
Singh, C.B.P. 2009. Classroom proceedings in primary schools: An appraisal. The Social Engineer. 12 (1-2), 65-77.
taBaChniCK, B., and K. ZeiChner. 1986. “Teacher beliefs and classroom behavior: Some teacher responses to inconsistency”. In M. Ben-Peretz, R, Bromme & R. Halkes (eds.) Advances of research on teacher thinking. Lisse, Swets and Zeitlinger, New York.
ZeiChner, K. 1994. Research on teacher thinking and different views of reflective practice in teaching and teacher education. In I. Carlgren, G. Handal. and S. Vaage (eds.) Teachers’ minds and actions: Research on teachers’ thinking and practice. The Falmer Press, Washington.
Chapters.indd 15 10/13/2016 2:58:26 PM

Vedic Science-based Education, Poverty Removal and Social well-being
A Case History of Cambodia from 1980 to 2015Lee FerguSSon*
AbstractPrior research has suggested the programs of Vedic Science can play a part in personal, social and educational renewal and in the removal of poverty. In Cambodia, ranked the poorest country in the world in 1992, the contribution of Vedic Science-based education has been significant, not only in the lives of thousands of students but also in the welfare of the broader economic community. This paper explores the economic and social dimensions of this phenomenon. Specifically, the long-term impacts of a social renewal and healthcare program initiated in 1992 and the establishment of an innovative university, called Maharishi Vedic University at the beginning of 1993, are considered using the Social Impact Assessment model, with data on gross domestic product, gross national income, inflation, poverty, health and education analysed to assess the influence of a “coherence-creating” group of meditating students on poverty removal rates and social well-being.
* Director, Maharishi Vedic Research Institute, P.O. Box 1620, Oxenford, Queensland 4210, Australia. T. +61-7-5546-6977.
iNtroductioN
In the post-colonial years between 1953 and 1970 Cambodia enjoyed a period of relative social expansion under the stewardship of Prince
Norodom Sihanouk (1994). Under his Sangkum reastr niyum, Cambodia’s education spending rose from 15.5% of the national budget in 1953 to 22.5% in 1959 before settling to 19.2% by 1966 (Bureau regional de
Chapters.indd 16 10/13/2016 2:58:26 PM

17Vedic Science-based Education, Poverty Removal and Social...
l’Unesco, 1965), with the number of schools, colleges and universities expanding rapidly to meet a growing demand for education (Minson, et al., 1968). During these years, primary education enrolments increased from 217,000 in 1954 to 1.0 million by 1970, and high schools and institutions of higher education were flushed with enrolments: in 1953 only 200 students were enrolled in higher education, but by 1970 this number had swelled to 10,000 (Vickery, 1984).
The economy also grew during this time, although more spasmodically. For example, gross national product (GNP) increased by 5% per year between 1959 and 1962 (Ross, 1987), but was lower in the 1960s as the threat of war and civil unrest loomed, and rice production increased from 1.4 Mt in 1955 to 2.4 Mt by 1960, where it remained throughout the 1960s. To a large extent during this period Cambodia was reliant on foreign aid, with development projects attracting $22.4 million from China in 1955 and $350 million from the U.S. between 1955 and 1962, most of it going to education, healthcare and agriculture.
This phase of opportunity in Cambodia came to an abrupt end in the early 1970s, first with expanded regional military operations, aerial attacks from carpet-bombing B-52s, a U.S.-backed coup (Kosut, 1971), and then victory by the Khmer Rouge (KR) over the Lon Nol government in 1975 (Shawcross, 1979). The KRs murderous rule ended with the
“liberation” of Cambodia by 100,000 Vietnamese forces in early 1979.
One of the unfortunate consequences of twentieth-century geopolitics has been the need to rebuild the economies and infrastructures of many countries after war, and in this sense the developmental arc of Cambodia is not especially unique, given the all-too-typical tragic loss of life and property, mass transmigrations, and destruction of infrastructure caused by war (Institute for International Cooperation [IIC], 2002). However, Cambodia’s trajectory is uncommon in that its development was off a low base: in the 1980s, in addition to rebuilding the country’s infrastructure after U.S. aerial bombardment which almost completely destroyed its roads, bridges and schools, and after a protracted civil war and genocide of about a quarter of its population, Cambodia was among the poorest in the world. As a result, the government sought ways in the late 1980s to accelerate its recovery by securing financial aid and harnessing the intellectual capital of educators and scientists from around the world.
In this context, the government entered into an alliance with Maharishi European Research University, an institution of higher learning specialising in the Vedic Science-based education and healthcare programs of Maharishi Mahesh Yogi, an eminent teacher of Vedic knowledge. Maharishi promoted the experience and knowledge of
Chapters.indd 17 10/13/2016 2:58:26 PM
18 Journal of Indian Education February 2016
Veda and the Vedic Literature as a means to realising greater health and prosperity for individuals and nations and to creating a more balanced, progressive and peaceful world. His initiatives included the implementation of educational and healthcare programs (Maharishi Vedic University [MVU], 1985), corporate development programs (Swanson & Oates, 1989), rehabilitation programs (Ellis, 1979), governmental programs, including poverty removal initiatives, to promote social and national balance and economic well-being (King, 1987), and programs to create world peace and prosperity in the family of nations (MVU, 1991). Maharishi even influenced the conversation surrounding some of the world’s great religions and cultural traditions (Smith, 1980).
Maharishi and his worldwide programs have as a consequence been recognised by governments and leaders around the world since the 1950s, including citations in the record of the U.S. Congress (MVU, 1985), the Government of Madhya Pradesh (Maharishi Mahesh Yogi, 1996), and the Government of Mozambique, whose then President Joaquim Chissano stated Maharishi’s programs resulted “in political peace and balance in nature in my country” (Calder, 2010).
In 1991, Maharishi turned his attention to Cambodia. At this time, Maharishi Vedic University (1991) published Maharishi’s global vision for creating economic and
social well-being, outlining what he envisioned as the destiny of the world if enough individuals practiced his Transcendental Meditation and TM-Sidhi program―two related technologies derived from the Vedic tradition for developing the intelligence, creativity and energy of individuals and for enlivening progressive social trends―based on the premise that:
Life everywhere is naturally and spontaneously governed by Natural Law, which governs the infinite diversity of the universe with perfect orderliness, and without a noise. As national law, the man-made law, is the projection of national consciousness, and, as national consciousness is the sum total of the consciousness of all the individuals in the nation, it is obvious that the quality of national consciousness and the effectiveness of national law—the effectiveness of the government—depend upon the quality of individual consciousness. Therefore, for any government to be really effective and successful, it is vital that the consciousness of the individual is always in alliance with the evolutionary power of Natural Law.
(Ibid, p. 127)Natural Law, according to
Maharishi, is the unmanifest home of all the laws of nature which gives
Chapters.indd 18 10/13/2016 2:58:26 PM

19Vedic Science-based Education, Poverty Removal and Social...
rise to the forms and phenomena experienced as the manifest, physical universe. He therefore organised his program to into two categories: glorification of inner life, including the development of “higher states of consciousness”, blossoming of noble qualities, as well as “developing inner happiness, peace and fulfilling progress”; and glorification of outer life, including building ideal towns and cities, developing agriculture, promoting rural development, eradicating global poverty through “economic self-sufficiency”, achieving perfect health, and creating balance and harmony in nature. At the time, Maharishi stated:
Scientific research has repeatedly proved that life can be lived in full accord with Natural Law through the practice of my Transcendental Meditation, that positivity and harmony can be created and negative trends can be completely eliminated throughout society; [therefore] this is the opportune time for us now to launch a global initiative to create Heaven on Earth in a scientific way and accomplish real Heaven on Earth in this generation, so that perfection is a reality of the daily life of everyone for all generations to come.
(Ibid, p. 1) The purpose of this research
paper is to examine this proposition by asking: 1) was the introduction
of Vedic Science-based education associated with improvements in the quality of life and social well-being of Cambodia; 2) was the introduction of Vedic Science-based education associated with a reduction in poverty; and 3) did Cambodia’s progress during this period compare favorably to the economic and social development of its nearest neighbors, Vietnam, Lao PDR and Thailand?
The methodology employed does not attempt to establish a statistically significant causal link between the introduction of Vedic Science-based education and changes in economic and social parameters, but rather strives to document the developmental arc of Cambodia from 1980 to 2015. This research therefore draws from descriptive and quantitative data using the Social Impact Assessment (SIA) model to investigate whether the country was on a more sustainable trajectory between 1993 and 2008 when Vedic Science-based education was applied, and when comparing Cambodia’s development to other countries in its region. In accordance with standard practice guidelines (e.g., Department State Development, Infrastructure and Planning, 2013), the SIA covered the entire lifecycle of the period using best available information for Cambodia and its nearest neighbors, and where possible establish baseline data; however, it should be noted that a significant amount of historical educational and economic data is missing for Cambodia.
Chapters.indd 19 10/13/2016 2:58:26 PM

20 Journal of Indian Education February 2016
VEdic sciENcE aNd EducatioN
It is not within the scope of this paper to document in detail all the principles of Vedic Science; indeed other researchers have done so more thoroughly elsewhere (Chandler, 1989; Fergusson & Bonshek, 2015). However, a summary of its basic tenets is relevant in the context of orienting a general understanding of its relationship to education.
In the 1960s Maharishi recognised that despite the discovery of fundamental laws of nature and the technological advances afforded by modern science, the creation of balanced societies had not been achieved. He noted that modern education lacked both the ability to apply the knowledge of the laws of nature as discovered by science and the means to develop the full potential of human life and to thereby create a better world. His fundamental point was that “all weakness and problems in society have their basis in a lack of culture of the human mind, and this in turn is the result of incomplete education. Education is incomplete when it fails to develop the full creativity of the individual and fails to nurture his ability to act in accordance with all the laws of nature” (Morris, 1981, p. 7).
For this reason, Maharishi introduced his Science of Creative Intelligence (SCI) in the early 1970s and encouraged its incorporation into the educational systems of the world (Maharishi Mahesh Yogi,
1974). SCI, by “opening one’s awareness to the infinite, unbounded value of intelligence, broadens the awareness and makes it permanently unbounded, so that no area of life remains foreign. This is the ground of all knowledge—complete knowledge—and therefore is the basis of complete fulfillment. We will count ourselves successful only when the problems of today’s world are substantially reduced and eventually eliminated and the educational institutions of every country are capable of producing fully developed citizens” (Maharishi International University, 1981, p. 5). During this time, Maharishi worked directly with some of the world’s most eminent educators and theorists, including Buckminster Fuller and Nobel Prize winners Melvin Calvin, Ilya Prigogine and Brian Josephson, in formulating the applicability of SCI to contemporary education and the modern scientific disciplines (Fergusson & Bonshek, 2015).
Maharishi went on in the 1980s to locate the source of SCI in the ancient Vedic tradition of knowledge preserved in India, which he called Vedic Science, a science that provides a systematic and comprehensive understanding of the home of all laws of nature and its relationship to consciousness, along with the technologies for enlivening its potential for bettering human life. Vedic Science can therefore be described as a complete science of consciousness and its expressions as the laws of nature, the knowledge and
Chapters.indd 20 10/13/2016 2:58:26 PM

21Vedic Science-based Education, Poverty Removal and Social...
experience of which create fulfilment in individual and social life. The meaning of the term Vedic, Maharishi explained, incorporates:
the whole path of knowledge from the knower to the known—the whole field of subjectivity, objectivity, and their relationship; the whole field of life, unmanifest and manifest; the whole field of ‘Being’ and ‘Becoming’; the whole range of knowledge from its source to its goal—the eternal source, course, and goal of all knowledge. The word ‘Vedic’ [therefore] encompasses the whole unbounded field of space and time from point to infinity. (Maharishi Mahesh Yogi, 1994, pp. 5-6)One of the primary experiential
aspects of both SCI and Vedic Science, particularly as described in the four primary Vedas — Rig Veda, Sama Veda, Yajur Veda and Atharva Veda, is the Transcendental Meditation and TM-Sidhi program. This program provides each individual with the direct experience of unbounded consciousness, the field of pure creative intelligence as the home of all the laws of nature (described above as the home of “Natural Law”), and furnishes the means whereby this field of infinite creativity and energy may be harnessed for personal, social and environmental benefit (Gelderloos & van den Berg, 1989).
It can therefore be said the practice of Vedic Science by enough people in society harnesses and enlivens the home of all the laws of nature, putting these laws spontaneously to work for social benefit. [For analyses of how these principles apply to individual life, society and government, see Wells & Boothby (1995) on the Bhagavad-Gita and Sands (1998) on the Valmiki Ramayana.]
A Vedic Science-based approach to education is founded on this ancient science of knowledge and utilises a number of principles for teaching and learning. One of the primary principles states that knowledge should be unfolded according to a proper sequence, namely: first study the “wholeness of unified knowledge” and then study the “diversified parts of knowledge” (MVU, 1985). At its most basic level, this principle is applied in a student’s practice of Transcendental Meditation, which identifies the wholeness of unified knowledge on the level of personal experience, on the level of her own consciousness, prior to studying diversified disciplines or parts of knowledge. Experiencing this wholeness of knowledge within one’s own consciousness can be likened to gaining the tree of knowledge in its seed form prior to studying branches, leaves and fruit; without this experience, Maharishi maintains gaining total knowledge through studying the parts of a discipline will be impossible and education will always remain fragmented and unsatisfying.
Chapters.indd 21 10/13/2016 2:58:26 PM

22 Journal of Indian Education February 2016
Research suggests that this experience of “wholeness” in Transcendental Meditation is associated with maximum coherence and integration in brain functioning. High levels of coherence in the frontal area of the brain seen during Transcendental Meditation and carrying over into activity are significant because it is the executive frontal cortex which, on the basis of information from other areas of the brain, supports higher order cognitive abilities such as decision-making and moral reasoning. This holistic style of brain functioning gives insight into the meaning of the phrase “all knowledge in one brain” and how this phenomenon can be cultured through Vedic Science-based education.
On the level of intellectual knowledge and academic study, a student also first gains experience of the most expanded level of knowledge before studying its specific parts. In this way, she is oriented to the broadest and most comprehensive level of knowledge prior to studying the specialized parts of knowledge, a process which exposes her consciousness to the foundational elements of a discipline before focusing on narrower values of information, thereby developing a comprehension of the whole tree of knowledge before focusing on individual branches. Maharishi describes this level of education as the “fountainhead of all streams of knowledge” (MVU, 1991, p. 15).
According to Maharishi, the
ancient Vedic records explain why this approach to education is important. He points, by way of example, to the phrase Brahmā bhavati sārathih (Rig Veda, 1.158.6), which translates as: “He who thinks from this holistic field of consciousness…is naturally served in daily life by the infinite organizing power of pure knowledge” (Ibid, p. 9). Therefore, harnessing the field of pure consciousness first and then applying it in daily life for greater achievement is the path to more success. For this reason, Maharishi maintains that research in consciousness through the Transcendental Meditation and TM-Sidhi program is the “most vital aspect of a university, which fulfils the true meaning of the word ‘university” (Ibid, p. 9). From his perspective, a university is only significant if it offers every student the complete theoretical and practical knowledge of the wholeness of life, an approach to higher education resulting in “all knowledge in one brain” rather than the more commonly advanced purpose of a university as “all knowledge in one campus”.
VEdic sciENcE-basEd EducatioN iN cambodia
In 1990, Maharishi insisted that a program of education, healthcare, agricultural reform and food self-sufficiency be launched in Cambodia (Ibid, 1991). He noted that Cambodia had a population of 7.4 million people but at least 6.0 million of them were poor, had 8.0 Mha of cultivable land but only 1.4 M of them were actually
Chapters.indd 22 10/13/2016 2:58:26 PM

23Vedic Science-based Education, Poverty Removal and Social...
being farmed, and per capita income was reported to be just US$50 per year (compared to $100 in Lao PDR and $130 in Vietnam). Maharishi therefore invited the government of Cambodia to start a program of educational and economic recovery by implementing his programs to improve the lives of every Cambodian through a variety of Vedic Science-based initiatives, including the eradication of poverty through agriculture. He stated that “the natural beauty of Cambodia—its lakes and rivers, mountains, slopes, and plains—can really be converted into a lively Heaven on Earth; [the beauty of Cambodia] will invite any lover of life to come, live and enjoy Heaven on Earth in Cambodia” (Ibid, p. 92).
To this end, Samdech Tep Vong, then Supreme Patriach of Cambodia, visited Maharishi in 1991 to discuss creating lasting peace and prosperity (Australian Aid for Cambodia Fund [AACF], 1992). [Tep Vong, who is widely recognized as the first person to rejoin the monkhood after the fall of the KR, was subsequently elevated to Samdech Preah Agga Mahā Sangharājādhipati or Great Supreme Patriarch in 2006, the first monk in over 150 years of Cambodian history to receive this title; he stated publicly: “we have the same feelings and aspirations, most importantly the establishment of lasting peace in Cambodia” (Fergusson & Bonshek, 2013, p. vi).] As a sign of goodwill, and given that Cambodia only had a handful of qualified doctors, Maharishi immediately deputed four
Ayur-Vedic doctors (or Vaidyas) from India to begin treating patients in Phnom Penh, a practice that would see an outpouring of need rise to 5,000 patients treated each day for basic as well as advanced diseases, with a total of 300,000 people treated in a two-month period in 1991 (AACF, 1992).
Maharishi had, in fact, had a long-standing concern for the plight of Cambodia. In November 1978 he had launched an initiative to bring peace to Cambodia during the KR reign as part of his global World Peace Project (Orme-Johnson & Dillbeck, 1987) by sending 200 experts in the Transcendental Meditation and TM-Sidhi program to Thailand, including to an area close to its border with Cambodia, to bring an influence of balance and peace through meditation. Within two months ex-patriot Cambodians and the Vietnamese army overthrew the KR in January 1979, beginning the current period of stability in Cambodia. In this one example, evidence suggests the implementation of Vedic Science-based programs impacted the future of Cambodian society.
In 1983, Maharishi also initiated a large-scale cultural exchange and meditation program in Vietnam (the program was originally slated for Cambodia, but the borders were still closed) by sending a group of 100 experts to create coherence in the collective consciousness of Southeast Asia (AACF, 2000). This program consisted of the largest group of
Chapters.indd 23 10/13/2016 2:58:26 PM

24 Journal of Indian Education February 2016
Westerners allowed to visit Vietnam after the Vietnam War, with the group practicing their peace-creating techniques in a location close to Vietnam’s border with Cambodia.
The principles and mechanics of how a group of meditation practitioners contribute to changes in the fortune of a country by alleviating political and social tension have been discussed elsewhere by Davies and Alexander (2005) and Orme-Johnson and Dillbeck (1987), and these are fundamental to an understanding of what prompted the research questions under consideration in this study. The “action-at-a-distance” phenomenon of groups of meditating experts having an effect on economic and social outcomes has been described by sociologists as the Maharishi Effect (e.g., Cavanaugh et al., 1990) because Maharishi predicted in the 1960s that coherence in individual life will affect the order, harmony and progress of a nation, a phenomenon posited by this research in Cambodia.
As a result of Maharishi’s
insistence that a university be established in Cambodia, a group of Australian well-wishers, medical doctors and educators constituted a non-governmental organisation (NGO) called the Australian Aid for Cambodia Fund in 1991. AACF (1991) began a threefold initiative to raise funds to support the new university (Soltau, 1994), to cultivate self-sufficiency in healthcare and agriculture, and to send qualified individuals to Cambodia to begin working with the Ministry of Education, Youth and Sport (MoEYS) to locate land, design and build a new MVU and healthcare center, recruit and enroll students, and to begin classes as soon as possible.
By November 1991, AACF and MoEYS had identified 70 ha of land 140 km east of Phnom Penh. The land (plus an additional 80 ha for later agricultural development) was subsequently donated to MVU by His Excellency (now the late) Samdech Chea Sim, then President of the National Assembly (AACF, 1996, p. 1). By late 1992, the buildings and
basic infrastructure for MVU (Sakal Vichealay Vedic Maharishi in Khmer) and the healthcare center had been constructed with the support of AACF (Fergusson & Bonshek, 2013).
Site preparation included the
Fig.1: First MVU cohort studying Vedic Science, January 1993 (left); faculty housing in the Khmer style (right).
Chapters.indd 24 10/13/2016 2:58:26 PM

25Vedic Science-based Education, Poverty Removal and Social...
basic infrastructure for MVU (Sakal Vichealay Vedic Maharishi in Khmer) and the healthcare center had been constructed with the support of AACF (Fergusson & Bonshek, 2013).
Site preparation included the
Fig.1: First MVU cohort studying Vedic Science, January 1993 (left); faculty housing in the Khmer style (right).
installation of roads, wells, fencing, and power generation, as well as an assembly hall to seat 600 students, four classrooms for 40 students each (designed using principles from traditional Khmer architecture), student housing for 450 students, administrative facilities and faculty housing for 35 foreign and local staff, and playing fields, gardens and landscaped areas (these were later expanded to house up to 1,000
Fig. 3: Students practicing the Transcendental Meditation and TM-Sidhi program in 2002 (left); learning centre and library in 2002 (right).
Fig. 2: MVU healthcare centre in 1993 (left); Ayurvedic doctor consulting with local patient (right).
on-campus students, along with improved sports, recreational and library facilities, see Figures 1-3).
In October 1992, MoEYS announced that MVU would begin
classes on January 1st, 1993, and issued application forms to potential students; with more than 5,000 applicants in November 1993, MVU and MoEYS selected 550 high school graduates. Therefore, beginning in 1993 Vedic Science-based education was implemented at MVU with the express purpose of improving the lives of students as well as affecting the quality of life of Cambodia as a whole.
Chapters.indd 25 10/13/2016 2:58:27 PM

26 Journal of Indian Education February 2016
As a consequence, between 1993 and 2008 a group of about 500-700 university students each year practiced Transcendental Meditation and subsequently the TM-Sidhi program together twice a day (see Figure 3, left). [As part of a national reorganization, the curriculum and name of MVU were changed in 2008 to Chea Sim University of Kamchaymear (CSUK) (see Figure 4) and the coherence-creating programs of Vedic Science ended at that time. For a more complete description of the lifecycle of MVU and its evolution into CSUK, see Fergusson & Bonshek, 2013.]
Research conducted during 1993 suggested Vedic Science-based education had a salutary effect on
Fig. 4: Adminstration building in the Kmer style at CSUK in 2013 (left); main adminstration building and classrooms at CSUK in 2013 (right).
student intelligence, general health, anxiety and other characteristics of post-traumatic stress disorder. For example, Fergusson et al. (1996a) found the curriculum contributed to increased non-verbal intelligence of MVU students when compared to other Cambodian students, and Fergusson et al. (1995) reported
declines in anxiety and depression, improvements in mental and physical health, and increased sociability of MVU students compared to students at two other universities. MVU students also reported they found the practice of Transcendental Meditation helped them retain knowledge, improved their memory, self-confidence, and comprehension of difficult subject matter, and decreased their levels of worry about the future (Fergusson, et al., 1994).
These findings suggest Vedic Science-based education laid the personal foundations of peace and orderliness which subsequently contributed to the broader social and economic benefits described in this research paper and support
Maharishi’s claim that his programs result in the “glorification of inner life”.
EcoNomic aNd social dEVEloPmENt iNdicators
By any standard the growth of Cambodia’s economy since 1980 can
Chapters.indd 26 10/13/2016 2:58:27 PM
27Vedic Science-based Education, Poverty Removal and Social...
be described as “remarkable” (World Bank, 2014, p. xiv), with a surge in growth being particularly pronounced when MVU students practiced the Transcendental Meditation and TM-Sidhi program together between 1993 and 2008.
Whereas, Cambodia was the poorest country of the 42 poorest countries in the world in 1990 (MVU, 1991) and was the poorest of 152 countries (Economic Institute of Cambodia, 2008), after implementation of Vedic Science-based education Cambodia’s gross domestic product (GDP) annual growth rates averaged 9.6% between 2004 and 2009, the World Bank (2014) reported Cambodia’s industrial sector growth rates equaled as much as 30% of GDP after the late 1990s, and per capita GDP grew 54.5% between 2004 and 2011, placing it 15th among 174 countries. As a consequence, by 2010 Cambodia ranked 63rd out of 152 countries on a standardised poverty scale; the World Bank’s (2014) expression “where have all the poor gone?” sums up Cambodia since the early 1990s.
gross domEstic Product
Table 1 presents a variety of economic data for Cambodia between 1974 and 2014. Cambodia’s GDP generally accelerated in the years following the establishment of MVU, achieving its highest annual growth rate between 1994 and 2006. For example, in 1980 Cambodia’s GDP equaled $769 million while the average for least developed
countries (LDCs) in Asia was $31,563 million, meaning Cambodia’s GDP was 2.5% of the average. In 1990, Cambodia’s GDP equaled $1,698 million, a 120% increase over 1980, and its GDP equaled 3.5% of the average; by 2000, GDP was $3,667 million, a 115% increase over 1990 and 45% over 1993, equaling 4.5% of the average. However, by 2005 GDP was $6,293 million, a 70% increase over 2000, equaling 6.3% of LDCs average. Therefore, between 1990 and 2005, Cambodia’s GDP as a proportion of LDCs increased by 152%.
Five years later, Cambodia’s 2010 GDP equaled $11,242 million, a 79% increase over 2005, equaling 5.0% of LDC average; by 2014, GDP was $16,700 million, which represented a 14% increase over 2000, with Cambodia’s GDP representing 5.0% of the LDC average. While GDP levels increased throughout the period, with the highest annual rates of change being 1994, 2000, 2004 and 2006, their relation to the LDC average was also higher during the 1990s and early- to mid-2000s when compared to the periods before or after MVU (i.e., 4.5% versus 3.5% and 6.3% versus 5.0%).
Cambodia’s annual per capita GDP growth rates between 1996 and 2012 with trend lines for 1996-2007 and 2008-2012 are presented in Figure 5. The impact of the global financial crisis (GFC) is evident between 2007 and 2009, but Cambodia’s economy recovered by
Chapters.indd 27 10/13/2016 2:58:27 PM

28 Journal of Indian Education February 2016
2010 showing similar, albeit lower, trend growth.
This data indicate growth of the economy as a function of population
starting three years after the establishment of MVU (World Bank, 2015; National Institute of Statistics [NIS], 2010). The World Bank
Fig. 5 : Combodia annual per capita GDP grwoth rates between 1996 and 2012 with trend lines between 1996 and 2007 and between 2008 and 2012
Year GDP (in billions
$)
Annual Change in GDP (%)
Per Capita GDP ($)
Average GDP for Asian LDCs (in
billions $)
GDP as a Percentage of the Average GDP for
Asian LDCs1974 0.56† ― 77 ― ―1980 0.77† ― ― 31.6† 2.51990 1.7† ― ― 47.5† 3.51992 2.5 ― ― ― ―1994 2.8 9.0 269 ― ―1996 3.5 5.4 318 ― ―1998 3.1 5.0 268 ―2000 3.6 8.7 299 78.6† 4.52002 4.3 6.7 337 ― ―2004 5.3 10.3 407 ― ―2005 6.2 ― ― ― ―2006 7.2 10.7 537 113.3† (2005) 6.32008 10.3 6.7 742 ― ―2010 11.2 6.0 782 222.8† 5.02012 14 7.3 947 ― ―2014 16.7 7.0 1090 ― ―
Source: The World Bank, 2015, except † United Nations Conference on Trade and Development [UNCTD], 2013, pp. 418-422.
Table 1 Cambodia’s GDP, per cent increase of GDP, GDP for Asian LDCs, and Cambodia’s GDP as a percentage of least developed Asian countries
between 1974 and 2014.
Source : World Bank, 2014 p. xiv
Chapters.indd 28 10/13/2016 2:58:27 PM

29Vedic Science-based Education, Poverty Removal and Social...
reported that Cambodia’s per capita GDP growth between 1994 and 2008 was 179%; this is considerably higher than Thailand’s growth of 70% and roughly the same as Lao PDR’s rate of 200%, but less than Vietnam’s per capita GDP growth of 400%, which was $230 in 1994 and grew to $1,164 by 2008.
Gross National Income and InflationThe sum of Cambodia’s GDP plus net income received from overseas is the
gross national income (GNI). Table 2 presents the annual GNI, annual per cent change in GNI, per capita GNI, growth rates of GNI and annual change in consumer price index (CPI) for Cambodia between 1974 and 2014. While GNI and per capita GNI both increased steadily throughout the period, the annual percentage change in GNI and the annual per capita change of GNI were greatest between 2000 and 2006. The annual percentage changes in GNI from 1996 to 2014 with trend lines between
Year GNI (in
billions $)
Annual Change in
GNI (%)
Per Capita GNI ($)
Annual Per Capita Change
in GNI (%)
Annual CPI Change (%)†
1974 0.59 ― ― ― ―1989 ― ― ― ― 63.81990 ― ― ― ― 141.81991 ― ― ― ― 1911992 ― ― ― ― 751993 ― ― 253 ― 114.31994 ― ― 269 ― 10.41995 3.3 ― 260 ― 10.01996 3.4 4.6 264 1.5 7.11998 3.0 4.4 279 1.7 12.92000 3.5 8.1 319 5.7 -0.82002 4.1 5.6 349 3.6 -0.32004 5.3 10.1 406 8.3 3.92006 6.9 11.0 492 9.3 6.12008 9.9 6.1 560 4.6 24.92010 10.7 5.5 574 3.9 3.92012 13.4 7.7 644 5.9 2.92014 15.9 6.7 712 ― 3.8
Source: World Bank, 2015 (note, no GNI records kept between 1974 and 1995), except † International Monetary Fund [IMF], 2015.
Table 2 Cambodia’s GNI, annual change in GNI, per capita GNI, annual change in
per capita GNI, and annual change in CPI between 1974 and 2014.
Chapters.indd 29 10/13/2016 2:58:27 PM
30 Journal of Indian Education February 2016
CPI data for the intervention period show a striking effect beginning immediately after the establishment of MVU. Table 2 and Figure 7 present the rates of inflation in Cambodia between 1989 and 2014. This data indicate inflation rates decreased sharply in 1994, dropping from a five-year average of 119% and 114.3% in 1993 to 10.4% immediately after the establishment of MVU.
Inflation rates remained at or close to zero through to 2008 when they increased to 24.9% before settling down again to under 4%. This finding suggests that not only did the Cambodian economy improve significantly between 1994 and 2008, but consumers’ ability to pay for goods and services also improved
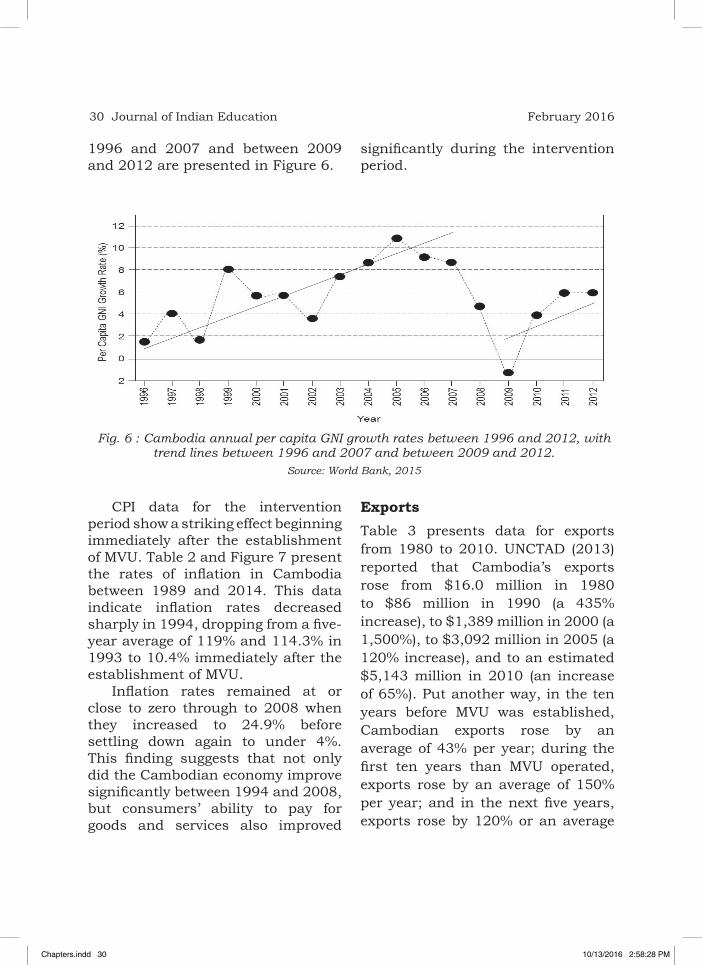
1996 and 2007 and between 2009 and 2012 are presented in Figure 6.
significantly during the intervention period.
ExportsTable 3 presents data for exports from 1980 to 2010. UNCTAD (2013) reported that Cambodia’s exports rose from $16.0 million in 1980 to $86 million in 1990 (a 435% increase), to $1,389 million in 2000 (a 1,500%), to $3,092 million in 2005 (a 120% increase), and to an estimated $5,143 million in 2010 (an increase of 65%). Put another way, in the ten years before MVU was established, Cambodian exports rose by an average of 43% per year; during the first ten years than MVU operated, exports rose by an average of 150% per year; and in the next five years, exports rose by 120% or an average
Fig. 6 : Cambodia annual per capita GNI growth rates between 1996 and 2012, with trend lines between 1996 and 2007 and between 2009 and 2012.
Source: World Bank, 2015
Chapters.indd 30 10/13/2016 2:58:28 PM

31Vedic Science-based Education, Poverty Removal and Social...
of 24% per year. During these years, total debt service as a percentage of exports fell from 3.8% in 1990 to 1.1% by 2001 (United Nations Development Programme [UNDP], 2003, p. 230).
Similarly, Cambodia’s exports to average exports for all LDCs indicate that Cambodia out-performed many of its neighbors (UNCTAD, 2013, p. 20). As reported above, in 1980 Cambodia exported goods valued at $16 million when the LDC average was $2,129 million; Cambodia’s exports represented just 0.8% of the average. In 1990, Cambodia’s exports represented 2.5% of the average, a ranking gain of 1.7% and a percentage gain of 210% or 21% per year. However, by 2000 Cambodia’s exports represented 9% of the average, for a ranking gain of 6.5% but a percentage gain of 260% or
26% per year. In 2005, again exports represented 13% of the average, another ranking gain of 4%, but by 2010 represented 12% of the average, a decline of 1%. It can therefore be concluded that Cambodia’s greatest export gains as a percentage of the LDC average were between 1990 and 2005. From this data it can also be seen between 1990 and 2005 the value of Cambodia’s exports increased more significantly as a percentage of the average either before or after the intervention period.
This same general trend in relation to Cambodia’s export contribution to the Asian region can be seen in Table 3. Cambodia’s percentage contribution to total regional exports was 0.001% in 1980, 0.002% in 1990 (a 100% increase over ten years), 0.17% in 1995 (a 750% increase over five
Fig. 7 : Source: IMF, 2015, p. 179.Fig.7 : Cambodia annual per cent change in consumer price index between
1990 and 2001.
Chapters.indd 31 10/13/2016 2:58:28 PM

32 Journal of Indian Education February 2016
years), 0.22% in 2000 (a 30% increase over five years), 0.29% in 2005 (a 32% increase over five years), and 0.34% in 2010 (a 20% increase over five years). The obvious surge in Cambodia’s export contribution to Asian exports after 1995 is pronounced.
PovertyData on poverty since 1981 are presented in Table 4, although a significant amount of data is missing from the historical record. The percentage of undernourished people in Cambodia fell from 30% of the population in 1994 when MVU was established to 18% by 2008, a 40% reduction. The percentage of the population living in poverty also fell from 45% to 21% during the same period.
The poverty gap ratio is the mean shortfall of the total population from
the poverty line (counting the non-poor as having zero shortfall), expressed as a percentage of the poverty line; this measure reflects the depth of poverty as well as its incidence, and shows that poverty decreased by 63% between 1994 and 2008 from 12% to 4.4%. During roughly the same period, the percentage of the population with access to sanitation facilities and clean water increased from 3% to 30% and 28% to 60% respectively. The World Bank (2014) reported that Cambodia’s poverty rate decreased by 63.3% between 2004 and 2011 (from 41.6% to 15.3%) and wealth rose inversely on an indexed scale from 1.6 to 2.3 (or 45.6%) during the same period.
Data for even the poorest rural population indicate that poverty decreased from 59% in 2004 to 24% in 2011 (World Bank, 2015). The
Year
Cambodian Exports (in million $)
and change to previous reporting period (%)
Average Exports for
Asian LDCs (in million $)
Cambodian Exports as
Percentage of Exports for Asian
LDCs (%)
Cambodian Exports as Share of
Exports for Asian Countries
(%)
1980 16 2,129 0.8 0.0011990 86 (435) 3,334 2.5 0.0021995 ― ― ― 0.172000 1,389 (1,500) 14,852 9.0 0.222005 3,092 (120) 23,868 13 0.292010 5,143 (65) 43,031 12 0.34
Source: UNCTAD, 2013.
Table 3 Cambodian exports and relationship to exports for Asian LDCs and total
Asian export averages between 1980 and 2010.
Chapters.indd 32 10/13/2016 2:58:28 PM

33Vedic Science-based Education, Poverty Removal and Social...
international community’s definition of “poverty” has changed over time, and is classified differently in some countries and in some economic settings, but the phenomenon of declining poverty in Cambodia is relatively uniform regardless of definition. The trend for poverty reduction in Cambodia is not dissimilar to other Asian countries, and many of the gains in poverty removal were occurring prior to the United Nations’ millennium development goals of 2000 (World Bank, 1990, 2014).
Food poverty also declined significantly in Cambodia between
2004 and 2011: in Phnom Penh, it declined from 15.8% in 2004 to 1.3% in 2011; in other urban areas it declined from 39.6% to 16.1%, and in rural Cambodia food poverty declined from 58.9% to 23.7% (World Bank, 2014). The percentage of household budgets dedicated to purchasing food declined from 68% of the household budget in 1993 to 54% in 2008, but remaining at 51% ever since (World Bank, 2014, p. 108), and undernourished people as a percentage of the population decreased from 43% in 1990-1992 to 36% in 1998-2000 (UNDP, 2003).
Table 4 Cambodian poverty metrics between 1981 and 2012
Year
Population Undernouri-
shed (%)
`Population Living in Poverty (% living on less
than $1.25 per day)
Poverty Gap
Ratio (%)
Slum Population
(as a % of urban popula-
tion)
Access to Sanitation
(% of population)
Access to Clean
Water (% of population)
1981 ― 86 ―1990 32 77 ― ― 3 231992 30 ― ― ― ― 241994 30 45 12 ― ― 281996 32 ― ― ― ― 331998 37 ― ― ― ― 372000 32 ― ― ― 16 422002 26 ― ― ― ― 462004 22 (16†) 33 (53.3†) 7.8 79 ― 512006 20 31 7.2 ― 27 552008 18 21 4.4 ― 30 602010 17 (3.8†) 11 (20.5†) 1.7 ― 34 642012 16 10 1.4 55 37 69
Source: United Nations, 2013 and Asian Development Bank, 2014, except † derived from the World Bank, 2014, p. 105.
Chapters.indd 33 10/13/2016 2:58:28 PM

34 Journal of Indian Education February 2016
HealthAnother cornerstone of social well-being is health because there is a direct link between poverty and health. Cambodia has made impressive advances in health care since the early 1990s when there were virtually no doctors or hospitals in the country; by 2011 there were six national hospitals, 83 referral hospitals and 1,024 health centers, and the Ministry of Health alone now employs a staff of 19,700, including 3,200 doctors, 9,000 nurses and 4,600 midwives (World Bank, 2014).
Table 5 presents data related to health trends in Cambodia, including infant mortality rates of 86 babies per 1,000 live births in 1992 prior to the establishment of MVU decreasing to 42 by the time it closed in 2008, (a 50% reduction in mortality). Infant mortality rates of 118 children per 1,000 live births for 1-5 year-olds in 1992 also decreased to 50 by 2008 (a 57% reduction), maternal mortality rates decreased by 1,200 per 100,000 births in 1990 to 200 by 2010 (an 83% reduction), and the number of adolescents giving birth declined from 90 per 1,000 women before
MVU began to 48 women by 2008 (a 46% reduction).
According to the IIC (2002), the maternal mortality rate in Cambodia in 2000 was 470, compared to 650 in Lao PDR, 160 in Vietnam, and 44 in Thailand, and from 1960 the infant mortality rate in Cambodia was 146 compared to 155 in Lao PDR, 147 in Vietnam, and 103 in Thailand, but these rates only declined to 104 in Cambodia compared to 96 in Lao PDR, 31 in Vietnam, and 30 in Thailand by 1998. Similarly, in 1960 the infant mortality rate for children between 12 months and five years of age in Cambodia was 217 compared to 235 in Lao PDR, 219 in Vietnam, and 148 in Thailand, but these rates had declined to 163 in Cambodia compared to 116 in Lao PDR, 42 in Vietnam, and 37 in Thailand by 1998. The World Bank (2014) reported that the percentage of pregnant women receiving prenatal care in Cambodia grew from 34.3% in 1998 to 89% by 2010, a 160% improvement.
The IIC (2002) also reported on immunization rates for all diseases of children up to the age of two between 1988 and 1999, and found rates were 40% in 1988, 34% in 1990, 32% in 1992, 54% in 1994, 70% in
Year Infant Mortality
(0-1 years per 1,000 live
births)
Infant Mortality (1-5 years per 1,000 live births)
Maternal Mortality
(per 100,000
live births)
Adolescent Birth Rate (per 1,000 women)
Immunization Against Measles (% children ages
1-24 months)
Per capita Spending
on Healthcare
($)
1960 146† 217† ― ― ― ―1990 86 118 1,200 ― 34 ―
Table 5 Cambodian infant and maternal mortality rates, adolescent birth rate and
immunization rates between 1960 and 2012.
Chapters.indd 34 10/13/2016 2:58:28 PM

35Vedic Science-based Education, Poverty Removal and Social...
1992 86 118 ― 90 ― ―1994 87 120 ― ― ― ―1996 88 123 860 52 ― 22.81998 89 122 (168†) 500† 51 ― 15.8
2000 82 111 540 (470†) ― 65 17.4
2002 69 90 ― 52 ― 19.92004 57 71 ― ― ― 25.72006 48 58 320 ― 78 22.52008 42 50 ― 48 89 40.92010 37 44 200 ― 93 45.52012 34 40 170 30 93 69.4
Source: World Bank, 2014, except † IIC, 2002, pp. 67 and 221.
1996, 62% in 1998 and 1999. Table 6 indicates that immunization rates against measles increased from 34% of children in 1990 to 89% by 2008, a 160% increase in rates over 18 years.
The impact of war and social neglect on life expectancy can be seen in Figure 8. Life expectancy was 41.2
years and 41.8 years respectively in 1960 to 1970, but by 1974, at the onset of KR rule, this figure had dropped to 28.1 years in 1974 and to 24.1 years after the KR period in 1979. However, by 1993 life expectancy had risen to 56.4, rising steadily to 71.7 by 2013.
Fig. 8 : Cambodian life expectancy between 1960 and 2013Source: World Bank, 2015.
Chapters.indd 35 10/13/2016 2:58:28 PM

36 Journal of Indian Education February 2016
Data much more nuanced than are provided here, for example providing poverty information on a province-by-province basis with poverty predictors and vulnerability markers, is available but from this data it can reasonably be concluded that overall health trends are largely consistent across parameters and that general health has improved significantly since the early 1990s.
EducationThe United Nations Educational, Scientific and Cultural Organisation (UNESCO, 2011) has documented the relationship between armed conflict and education in five countries, including Mozambique, between 1990 and 2008 finding that in conflict zones children are less likely to be in school, child mortality rates are higher, youths and adults are less likely to be literate, children are more likely to be malnourished, and girls are left behind. However, UNESCO goes on to state that entry into the last grade of primary school in Cambodia increased from 41% in 1999 to 79% in 2008 due to a decline in civil unrest.
Moreover, as a result of generally improved conditions Cambodia has experienced significant expansion is education. A variety of indices can be used to measure educational development, including literacy rates, female participation rates, intake ratios, and enrolments and completion rates, and UNESCO (2011) points to correlations between
maternal education and infant mortality (i.e., each year of maternal education reduces the risk of infant mortality by between 7-9%) and between maternal education and immunization which goes directly to relationship between child mortality and education enrolments.
UNESCO therefore speaks about an “education dividend” in which larger investments in education result in significantly reduced loss of life (it claims that education of 100% of women in sub-Saharan Africa would result in saving 1.4 million lives), and a “seizing the peace” dividend (i.e., investing in the right areas of the economy, including health and education), which has paid off handsomely for Cambodia because it made these priority areas after the period of conflict. UNESCO (2011) maintains that where many countries do not learn from history and view education as just another “social sector” to be reconstructed, the Cambodian government viewed it as an integral part of a peace-building initiative and sought “quick wins and a new start”. The origins of MoEYS’s effort to found MVU in Cambodia has its roots in this stratagem.
Table 6 presents school enrolments, staff and expenditure data for Cambodia between 1980 and 2010. Primary school enrolments increased from 1.3 million students in 1990 before MVU and increased to 2.65 by 2006, a 105% increase; when compared to Lao PDR, whose primary enrolments barely changed over the
Chapters.indd 36 10/13/2016 2:58:28 PM

37Vedic Science-based Education, Poverty Removal and Social...
same period, the growth is significant (UNESCO, 2011, p. 33). Similarly, secondary school enrolments increased from 300,000 children in 1990 to 800,000 children in 2006, a 160% increase over 16 years.
According to UN (2012), Cambodia spent 10.9% of its budget on education in 1994 growing to 20.8% by 2010. These data compare favorably to Vietnam, which only spent 5.7% of its budget on education in 2008. UNESCO maintains the Cambodian annual education budget
grew by 17% between 1999 and 2008, whereas the growth in the education budgets of Thailand was 7% and Lao PDR was 18%. Even after the GFC, the Cambodian government increased education spending, according to UNESCO (2011).
Persistence to attend the last grade of primary school with your cohort is negatively correlated with poverty (UNESCO, 2011), and in Cambodia persistence was 35% for girls and 44% for boys in 1995, increasing to 57% for girls and 52%
Year Primary School
Enrolments (millions)
Primary School
Attendance (% of
school-age children)
Primary School
Teaching Staff
(thousands)
Secondary School
Enrolments (thousands)
SecondarySchool
Attendance (% of
school-age children)
Secondary School
Teaching Staff
(thousands)
Percent of National Budget
Spent on Education
(%)
1980 1.3 ― 30 ― ― ― ―1985 1.3 ― 35 ― ― ― ―1990 1.3 70 40 300 ― ― ―1992 ― ― 40.8 260 ― ― ―1994 ― ― 37.6 ― ― ― 10.9#
1996 1.65 (1995) ― ― 350 ― 20 11.2#
1998 2.1† 84.5 43.2 310 16.3 19 9.4#
1999 2.2† 86.4 44.5 310 14.6 17.9 13.22000 2.25 91.9 44.8 350 15.3 20 16.0#
2001 2.8† 97.3 45.9 390 16.6 20.2 14.7#
2002 ― ― 48.4 470 22.0 21 18.4#
2004 ― ― 50.1 630 27.3 27 19.8
2006 2.65 (2005) 95.2 51.2 811 31.9 30 19.2#
2008 ― 98.1 48.2 930 38.1 ― ―2010 ― 98.1 46.9 ― ― ― 20.8#
Source: UNESCO Bangkok, 2008, except † World Bank, 2002, p. 2, World Bank, 2015, and # Un, 2012, pp. 44-45.
Table 6 Primary and secondary student enrolment rates, number of teachers, and percentage of national budget spent on education between 1980 and 2010.
Chapters.indd 37 10/13/2016 2:58:28 PM

38 Journal of Indian Education February 2016
for boys by 2008 (World Bank, 2015). Primary school completion rates also increased from 43% in 2000 to 83% by 2005. UNESCO (2011, p. 55) indicates that secondary education completion rates also increased in Cambodia from 18% in 1999 to 42% by 2008 (a 130% increase), a change somewhat observed in Lao PDR, which increased completion rates from 32% to 44% (a 40% increase) over the same period. This finding further confirms that as poverty rates declined in Cambodia, persistence and completion rates increased inversely.
As a consequence, youth literacy rates in Cambodia increased from 73.5% in 1990 to 79.7% in 2001 (UNDP, 2003), and UNESCO (2011) maintains that Cambodia will achieve its millennium development adult literacy target of 97% by 2015, unlike both Thailand and Lao PDR. Prior to the establishment of MVU, adult literacy rates were 38% in 1980 and 46% in 1990, and these increased from 61.5% in 1998, 68.7% in 2000, 64% in 2002, 74% in 2004, 84.7% in 2006, and 78% in 2008 to reach 90% by 2012, a 95% improvement over 22 years.
The Ministry of Women’s Affairs (2004) also reported that the number of girls completing lower secondary school jumped from 55.3% in 2002 to 75% in 2003, and the number of girls completing the last three years of secondary school rose from 13.9% to 23.3% during the same period; the overall number of children enrolled in primary, lower secondary and higher
secondary education also rose in both rural and remote areas between 1998 and 2003.
War and DemocracyThe IIC (2002) has documented the many dimensions of social reconstruction that have taken place in Cambodia since 1980. However, it can be argued that perhaps the most relevant and far-reaching event related to social reconstruction and well-being is the incidence of war.
Hatchard and Cavanaugh (2009) showed that from 1990 to 1998 a total of 70 nations sought to change their system of government to a multi-party democracy. Of these, 33 nations did not experience war either before or after their transition to democracy, nine had civil war both before and after elections, and 26 nations had no war prior to democratic elections but bloody civil conflict soon thereafter. Only three nations out of 70 during this period had war before, but peace after, democratic elections—Cambodia, Mozambique and Namibia. The authors note that all three nations benefited from the intervention of Vedic Science-based educational, health and social welfare programs. As a result, since the introduction of Vedic Science-based education in Cambodia deaths related to war declined from 268 per year in 1993 to 14 in 2011 (World Bank, 2015).
[The impact of Vedic Science-based programs in Mozambique has been documented elsewhere (Astill,
Chapters.indd 38 10/13/2016 2:58:28 PM

39Vedic Science-based Education, Poverty Removal and Social...
2001), and other published sources documented similar outcomes for 48 cities in the US (Dillbeck, et al., 1981), Lebanon (Abou Nader, et al., 1989), and Holland, India, Puerto Rico and the Philippines (Burgmans, et al., 1989).]
discussioN aNd coNclusioN
This study has not attempted to statistically control for all possible compounding variables (indeed an SIA does not allow for such dependence), however a brief consideration of obvious compounding factors is warranted. For example, the United Nations Transitional Authority in Cambodia (UNTAC) was established in February 1992 under UN Security Council Resolution 745 to implement the Paris Peace Accords of October 1991 and oversee the country’s first “free and fair” elections (IIC, 2002). UNTAC was headed by Yasushi Akashi of Japan, Lieutenant-General John Sanderson of Australia, and Brigadier-General Klaas Roos of the Netherlands, who led approximately 22,000 military and civilian personnel. An argument may be made that UNTAC was responsible for Cambodia’s subsequent economic and social revival, although most impartial observers are circumspect about its long-term role (e.g., Findlay, 1995).
While it is indisputable that UNTAC affected 1990s Cambodia, it would be foolhardy to lay praise for economic progress and social well-being at the feet of UNTAC: while the
Authority “satisfactorily” achieved some of its goals, it cannot reasonably be claimed that it helped create favourable conditions in Cambodia during the early 1990s, particularly as it was directly responsible for the introduction AIDS into the country, caused highly inflated property prices in Phnom Penh during the early 1990s, had to remove its own Bulgarian military contingent because they threatened to kill Lieutenant-General Sanderson, and “failed to bring peace to Cambodia” (Ibid, p. 106). The least parsimonious conclusion would be to say UNTAC partially contributed to political stability upon which future development might be realised.
Other possible factors include the transition from a centralized, planned economy to a market-driven economy in 1995 and integration into international markets thereafter, and the role of NGOs and foreign investment in Cambodia’s development, however many of these occurred after the observed phenomena described herein and may have been caused by it. There can be no doubt the GFC adversely affected the economies of many countries (e.g., growth in Cambodia’s garment sector dropped from 10% in 2007 to 2.2% in 2008 [NIS, 2010]); that it occurred at a time coincidentally with the conclusion of MVU’s operation and influence of coherence generated by group meditation in 2008 means it is not reasonably possible to isolate the impact of one from the other on post-2008 Cambodian data. The most
Chapters.indd 39 10/13/2016 2:58:28 PM

40 Journal of Indian Education February 2016
reasonable interpretation suggests that on some economic measures, Cambodia’s rate of growth returned to trend three years after the GFC, but at significantly lower levels of performance.
There can, however, be no doubt that Cambodia’s development after the early 1990s is “remarkable”, and the data indicate Cambodians’ quality of life generally and significantly improved after 1993. While many governmental and non-governmental initiatives may have contributed to this trend, and some changes may not be attributed solely to the implementation of Vedic Science-based education, it should be remembered that Maharishi established MVU and implemented his programs for social welfare in Cambodia expressly to achieve these economic and social outcomes and predicted their occurrence prior to implementation in 1991 and prior to most of the growth trends reported by this research. His prognoses included the development of agriculture, promotion of rural development, and eradication of poverty through “economic self-sufficiency”, all of which have been either partially or fully accomplished since the introduction of Vedic Science-based education. As a consequence, research question 1) can be answered in the affirmative.
Similarly, several factors may have contributed to the reduction of poverty in Cambodia (for example, the millennium development
goals of the United Nations [2013] have been central to a successful worldwide effort to reduce poverty), but the international focus on and momentum for poverty removal in Cambodia occurred mostly after 2000, i.e., well after the beneficial trends reported herein began. While a causal link between the introduction of Vedic Science-based education and a reduction in poverty after 1993 cannot be established by an SIA, enough data have been presented to indicate the two are correlated, and therefore research question 2) can also be answered in the affirmative.
Finally, in answering research question 3), it is clear from the data that Cambodia more often than not out-performed its nearest regional neighbors on several scales, and generally out-performed Asian LDCs, thereby answering the question affirmatively. Further time-series analyses, meta-analyses, and other quantitative measures (if possible on the limited data available) and other quantitative measures and methods may later confirm these conclusions.
Therefore, while collectively the factors described above may have contributed to an improved Cambodia, it is reasonable to conclude that Vedic Science-based education played a significant role in this process because virtually all other inputs were generally directed at impacting policy and procedural development, law and order, and human rights, whereas Vedic Science-based education was directed specifically at developing
Chapters.indd 40 10/13/2016 2:58:29 PM

41Vedic Science-based Education, Poverty Removal and Social...
the inner aspects of life, such as intelligence, creativity, happiness and peace, and from there change on the more outward aspects of social behavior and the environment were impacted.
In this sense, Vedic Science-based education represents a new approach to social change: it specializes in developing the inner, holistic values of life by reducing individual and collective stress and fostering human growth, and thereby changes the way outer life is practiced. Vedic Science-based education thus creates what Maharishi calls the “ideal of government” (MVU, 1991, p. 45), because it supports the goals of government from within by developing the consciousness of individuals and the collective consciousness of society as a whole. For this reason, Maharishi maintains that through experience and research “we have
proved we have the ability to create a new sunshine for all mankind” (Ibid, p. 28).
In support of this claim, Long Narith, one of MVU’s students, stated that Vedic Science-based education helped “bestow on us physical, moral, mental and spiritual strength to plunge into the modern world” (Fergusson & Bonshek, 2013, p. 195), Cambodian Ambassador to Australia, Chheang Vun, said “the Royal Government of Cambodia is extremely pleased with the success of Maharishi Vedic University” (Ibid, p. vi), and King Norodom Sihanouk concluded: “Maharishi Vedic University is playing an important role in human resource development and in [the] restoration of peace and expansion of prosperity throughout the country” (Hatchard & Cavanaugh, 2009).
rEfErENcEs
aBou nader, t.m., C.n. aLexander and j.L. davieS. 1989. The Maharishi Technology of the Unified Field and reduction of armed conflict: A comparative, longitudinal study of Lebanese villages. In R.A. Chalmers, G. Clements, H. Schenkluhn, and M. Weinless (eds.). Scientific Research on the Transcendental Meditation and TM-Sidhi Program: Collected Papers, Volume 4. [pp. 2623-2633]. Maharishi Vedic University Press, Vlodrop, Netherlands.
aSian deveLoPment BanK. aPriL. 2014. Asian Development Bank and Cambodia: Fact sheet. Asian Development Bank, Metro Manilla.
aStiLL, j. Meditation is path to peace, Mozambique leader says. The Guardian. September 23, 2001.
auStraLian aid For CamBodia Fund. Cambodia report: Newsletter of the Australian Aid for Cambodia Fund. Australian Aid for Cambodia Fund. 1 November 1991.
_____. Cambodia report: Newsletter of the Australian Aid for Cambodia Fund. Australian Aid for Cambodia Fund, 2, November 1992.
Chapters.indd 41 10/13/2016 2:58:29 PM

42 Journal of Indian Education February 2016
_____. Cambodia report: Newsletter of the Australian Aid for Cambodia Fund. Australian Aid for Cambodia Fund, 6, November 1996.
_____. Cambodia report: Newsletter of the Australian Aid for Cambodia Fund. Australian Aid for Cambodia Fund, 9, July 2000.
BurgmanS, w.h.P.m., a.t. van den Burgt, F.P.t. LangenKamP and j.h. verStegen. 1989. Sociological effects of the group dynamics of consciousness. In R.A. Chalmers, G. Clements, H. Schenkluhn, and M. Weinless (eds.), Scientific Research on the Transcendental Meditation and TM-Sidhi Program: Collected Papers, Volume 4 [pp. 2566-2582], Maharishi Vedic University Press, Vlodrop, Netherlands.
Bureau régionaL de i’uneSCo Pour L’éduCation en aSie. Projections a long-terme de I’éducation au Royaume du Cambodge: Rapport de la mission consultative régionale de I’Unesco pour la planification de l’éducation en Asie. Bureau régional de I’Unesco pour l’éducation en Asie, Bangkok, 1965.
CaLder, S. All you need is love, as holiday firms set their sights on Mozambique. The Independent. 9 October, 2010.
Cavanaugh, K.L., K.d. King and B.d. tituS. 1990. Improving the national economy through alliance with nature’s government: Effects of the group practice of Maharishi’s Transcendental Meditation and TM-Sidhi program. Modern Science and Vedic Science. 4(1), 2-41.
ChandLer, K. 1989. Modern science and Vedic Science: An introduction. Modern Science and Vedic Science. 1(1), 3-26.
davieS j. and C.n. Alexander, 2005. Alleviating political violence through reducing collective tension: Impact assessment analyses of the Lebanon war. Journal of Social Behavior and Personality. 17(1), 289.
dePartment State deveLoPment, inFraStruCture and PLanning. Social impact assessment guideline. Department State Development, Infrastructure and Planning, Government of Queensland, Brisbane, July 2013.
diLLBeCK, m.C., g. Landrith and d.w.orme-johnSon. 1981. The Transcendental Meditation program and crime rate change in a sample of forty-eight cities. Journal of Crime and Justice. 4, 25-45.
eConomiC inStitute oF CamBodia. 2008. Cambodia: Economic watch. Economic Institute of Cambodia, Phnom Penh.
eLLiS, g. 1979. Inside Folsom prison: TM and TM-Sidhi program. ETC Publications, Palm Springs, Florida.
FerguSSon, L.C. and a.J. Bonshek. 2013. Maharishi Vedic University in Cambodia: Educational reconstruction and social renewal. Prana World Publishing, Australia.
FerguSSon, L.C. and a.j. BonSheK. 2015. The unmanifest canvas: Maharishi Mahesh Yogi on the arts, creativity and perception. Maharishi University of Management Press, Fairfield, Iowa.
FerguSSon, L.C., a.j. BonSheK and j.m. BoudigueS. 1995. Personality and health characteristics of Cambodian undergraduates: A case for student development. Journal of Instructional Psychology. 22(4), 308-319.
Chapters.indd 42 10/13/2016 2:58:29 PM

43Vedic Science-based Education, Poverty Removal and Social...
FerguSSon, L.C., a.j. BonSheK and m. BoudigueS. 1994. Transcendental Meditation and five factors relevant to higher education in Cambodia. College Student Journal. 28(1). 103-107.
FerguSSon, L.C., a.j. BonSheK and g. Le maSSon. 1996. Vedic Science-based education and nonverbal intelligence: A preliminary longitudinal study in Cambodia. Higher Education Research and Development. 14(1). 73-82.
FerguSSon, L.C., g. Le maSSon and a.j. BonSheK. 1996. A descriptive analysis of Cambodian higher education and teacher education from 1979 to the present. Education Research and Perspectives. 22(2). 132-148.
FindLay, t. 1995. Cambodia: The legacy and lessons of UNTAC. Stockholm International Peace Research Institute. SIPRI Research Report No. 9. Oxford University Press, United Kingdom.
geLderLooS P. and w. van den Berg. 1989. Maharishi’s TM-Sidhi program: Participating in the infinite creativity of nature to enliven the totality of the cosmic psyche in all aspects of life. Modern Science and Vedic Science. 2(4). 372-412.
hatChard, g. and K. Cavanaugh. 29 novemBer, 2009. The peace and well-being of nations: An analysis of improved quality of life and enhanced economic performance through the Maharishi Effect in New Zealand, Norway, USA, Cambodia, and Mozambique—A longitudinal, cross-country, panel-regression analysis of the IMD index of national competitive advantage. Canadian Centers for Teaching Peace, Hamilton, Ontario.
inStitute For internationaL CooPeration. marCh 2002. The Kingdom of Cambodia: From reconstruction to sustainable development. Country Study for Japan’s Official Development Assistance to Kingdom of Cambodia. Japan International Cooperation Agency, Tokyo.
internationaL monetary Fund. aPriL 2015. World economic outlook: Uneven growth, short- and long-term factors. International Monetary Fund, Washington, D.C.
King, m.S. 1987. Transcendental Meditation, consciousness and government. Gantheaume Press, Perth.
KoSut, h. (ed.) 1971. Cambodia and the Vietnam War. Facts on File. New York.mahariShi internationaL univerSity. 1981. Education for enlightenment: An introduction to
Maharishi International University. Maharishi International University. Fairfield, Iowa.mahariShi maheSh yogi. 1974. Alliance for knowledge. MIU Press. Publication No. G-50.
Seelisberg, Switzerland._____. 1994. Maharishi Vedic University: Introduction. Maharishi Vedic University Press.
Vlodrop, Netherland. _____. 1996. Inaugurating Maharishi Vedic University. Maharishi Mahesh Yogi Vedic
Maharishi Mahesh Yogi Vishwavidyalaya Press. India.mahariShi vediC univerSity. 1985. Maharishi Vedic University: Inauguration. Maharishi
Vedic University Press. Washington, D.C. _____. 1991. Maharishi’s master plan to create heaven on earth: Reconstruction of the
whole world. Maharishi Vedic University Press. Vlodrop, Netherlands.
Chapters.indd 43 10/13/2016 2:58:29 PM

44 Journal of Indian Education February 2016
miniStry oF eduCation, youth and SPort. 2011. 2003-2007: Education indicators. Ministry of Education, Youth and Sport, Royal Government of Cambodia, Phnom Penh.
miniStry oF women’S aFFairS. oCtoBer 2004. The progress report of implementation of Beijing platform for action on women’s issues 1995-2004. Ministry of Women’s Affairs. Royal Government of Cambodia. Phnom Penh,
minSon, F.P., K.w. martindaLe, d.S. mCmorriS, K.e. ParaChi, w.n. raiFord and C. townSend. 1968. Area handbook for Cambodia. DA Pamphlet 550-50, U.S. Government, Washington, D.C.
morriS, B. meSSage From the PreSident. 1981. In Education for enlightenment: An introduction to Maharishi International University [pp. 6-7]. Maharishi International University Press, Fairfield, Iowa.
nationaL inStitute oF StatiStiCS. 2010. Labor and social trends in Cambodia 2010. National Institute of Statistics, Ministry of Planning, Phnom Penh, Cambodia and International Labor Organisation, United Nations, New York.
orme-johnSon d.w. and diLLBeCK. 1987. M.C. Maharishi’s program to create world peace: Theory and research. Modern Science and Vedic Science. 1(2). 207-259.
roSS, r.r. (ed). 1987. Cambodia: A country study. Library of Congress. Washington, D.C.
SandS, w.F. 1998. Natural law in the Valmiki Ramayan in the light of Maharishi Vedic Science and technology. Modern Science and Vedic Science. 8(1). 3-35.
ShawCroSS, w. 1979. Sideshow: Kissinger, Nixon and the destruction of Cambodia. Pocket Books, New York,
SihanouK, n. 1994. Cambodge: Sangkum reastr niyum, education nationale. 1955-1969. Présente au XVe Congres National. Phnom Penh.
Smith, a. 1980. TM: An aid to Christian growth. Mayhew McCrimmon. Great Wakering, Essex.
SoLtau, a. 1994. The killing stops at last. Parramatta Advertiser. 74(38).SwanSon, g. and oateS, r. 1989. Enlightened management: Building high-performance
people. Maharishi International University Press, Fairfield, Iowa.un. L. 2012. A comparative study of education and development in Cambodia and Uganda
from their civil wars to the present. Ph.D. thesis, Faculty of Social and Behavioral Sciences, Amsterdam Institute for Social Science Research (AISSR), Amsterdam.
uneSCo BangKoK. 2008. Secondary education regional information base: Country profile Cambodia. UNESCO Bangkok, Bangkok.
united nationS eduCationaL, SCientiFiC and CuLturaL organiSation. 2011. The hidden crisis: Armed conflict and education. United Nations Educational, Scientific and Cultural Organisation [UNESCO], Paris.
united nationS. 2013. Millennium development goals. United Nations, New York.united nationS ConFerenCe on trade and deveLoPment. 2013. UNCTAD Handbook of
Statistics 2013. United Nations Publication, New York.united nationS deveLoPment Programme. 2003. Human development report 2003―
Millennium development goals: A compact among nations to end human poverty. Oxford University Press, New York.
Chapters.indd 44 10/13/2016 2:58:29 PM

45Vedic Science-based Education, Poverty Removal and Social...
viCKery, m. 1975-1982. Cambodia. South End Press, Boston, Massachusetts, 1984.weLLS, g. and S. Boothby. 1995. Absolute principles of society in Maharishi’s commentary
on the Bhagavad-Gita. Modern Science and Vedic Science. 6(1), 3-30. worLd BanK. 1990. The World development report. Poverty. Oxford University Press. New
York, 1990.______. 2002. The Education Notes: Achieving Education for All in Post-conflict Cambodia.
The World Bank. Washington, D.C.______. 2013. The Cambodia Poverty Assessment. Where have all the poor gone?
Cambodia Socio-Economic Survey. World Bank Country Study ACS4545. Second Edition, Washington, D.C., April 2014.
______. 2015. The World Development Indicators. The World Bank, Washington, D.C., 2015.
Chapters.indd 45 10/13/2016 2:58:29 PM

Impact Analysis of the NPEGEL A Study of Udalguri District of the State of Assam
anita nuna*
AbstractThis paper presents the contribution of initiatives undertaken under the National Programme for Education of Girls at the Elementary Level (NPEGEL) for the educational and overall development of tribal girls in two model cluster schools of Udalguri District of Assam. The analysis of initiatives focused on tracing out of the contribution of the NPEGEL programme in the educational improvement of tribal girls and also in raising their level of awareness and knowledge on three indicators concerning the issues of personal health and hygiene, self-esteem and self-confidence, and of girl child’s rights and some social issues associated with it. The efforts initiated in the field under the NPEGEL programme also revolved around these aspects. The empirical evidences reflected a significant contribution of two major action-oriented initiatives carried out by the implementing agency with the support of the NPEGEL fund i.e.: (i) development of ambience that promote gender-inclusive environment in the local community through community mobilization, and (ii) capacity-building programmes for girls in the educational and overall development of tribal girls. With regard to the aspects associated with the issue of overall development of tribal girls, it contributed significantly in raising their level of awareness on issues related to personal health and hygiene, self-esteem and self-confidence, and of girl child’s rights and some social issues associated with it. However, the study found that the targeted tribal girls were not using this awareness and knowledge into practice fully. With regard to the question of gender sensitivity among teachers, the study observed a misconceived notion of gender and issues associated with it in the minds of the targeted teachers in spite of being they exposed to the nuances of gender sensitivity in especially conducted sessions.
* Associate Professor, Department of Gender Studies, NCERT, New Delhi.
Chapters.indd 46 10/13/2016 2:58:29 PM

47Impact Analysis of the NPEGEL...
iNtroductioN
This paper is an outcome of a study undertaken to assess the contribution of the National Programme for Education of Girls at the Elementary Level (NPEGEL) in the educational and overall development of tribal girls of Bhergaon block, Udalguri district in Assam. The assessment has been done by analysing the field evidences collected through survey method from two model cluster schools based on indictors representing the educational and overall development of tribal girls. An attempt has also been made to find out the role of the NPEGEL programme in gender sensitization of school teachers of two model cluster schools under study.
thE NPEgEl schEmE In the recent past, the country adopted two major programmes: the District Primary education Programme (DPEP), 1993 and the Sarva Shiksha Abhiyan (SSA), 2001. These programmes focus on the achievement of Universalization of Primary Education (UPE) up to class V and the achievement of Universalization of Elementary Education (UEE) up to class VIII. With regard to the issue of women’s equality and empowerment, the system of education must provide extra input to meet the specific socio-educational needs related to better schooling, necessary facilities, health and hygiene, sanitation, self- esteem, poverty, etc. of girls.
It is in this context that the government of India launched the National Programme for Education of Girls at the Elementary Level (NPEGEL) in 2003 as a 'gender component plan’ with specific budgetary provisions and integrated it into the Sarva Shiksha Abhiyan (SSA) to cater to the specific socio-educational needs of girls for their overall development. Under this programme, provisions were made for additional financial support to states for enhancing girl’s education from class I-VIII and also for providing facilities to promote retention of girls in schools, ensure their greater participation in school activities, improve the quality of their social life, including their educational status, stress upon the relevance of quality education for their empowerment and for ensuring their overall development, particularly girls belonging to the disadvantaged and underprivileged groups, living in risk prone difficult circumstances. This was done through intensive community mobilisation, development of ‘model cluster schools’ as the girl-child friendly schools, development of gender sensitive need-based teaching-learning materials and provisions of need-based interventions like escorts, availability of need-based books, uniforms and stationery, gender sensitization of teachers etc.
The NPEGEL programme covered Educationally Backward Blocks (EBB) in which the rural female literacy rate was less than the national average and the gender gap in the literacy
Chapters.indd 47 10/13/2016 2:58:29 PM

48 Journal of Indian Education February 2016
was above the national average as per 2001 census data. EBB blocks should have at least 5 per cent SC/ST population and below 10 per cent female literacy. The NPEGEL was also applicable to some selected urban slums.
The development of Model Cluster Schools (MCSs) for girls was one of the specifically proposed measures to achieve the improvement in the educational status of girls for their overall development. The MCSs are the girl-child friendly schools which are provided financial assistance under the NPEGEL for facilities like teaching-learning equipment, books, sports materials etc. The model clusters schools were proposed to be opened in areas having density of SC/ST/OBC/ minority population. According to the joint review mission report of the SSA 2013, there were 637 blocks of 161 districts across the country where the programme was intended to achieve the improvement in girl’s education. A total of 8473 schools were developed into ‘model cluster schools’ under the programme and the total coverage of girl children under this programme was about 4.12 crore (JRM, SSA, 2013). It is crucial to understand whether the NPEGEL has played a role in the educational improvement of girls? If yes, in what way. How the NPEGEL has benefited in girls’ overall development? To what extent the NPEGEL has proved beneficial in gender sensitisation of teachers?
Over the last decade, few studies have focused on studying the
educational status of girls in the north east region of the country, particularly Assam but none of them has examined the functions of the NPEGEL programme and its impact on school girls in the state of Assam. However, a few studies have been conducted in some states of the country. The study by Roul (2011) in the context of Odisha found out positive impact of the programme on the educational status of tribal girls. Mention may be made of the report of the Joint Review Mission Report (2011) of Uttrakhand that has come out with appreciation of the initiatives undertaken by the Uttrakhand state under the NPEGEL. It found satisfactory results of different skill-oriented activities of the scheme like yoga, judo, karate, painting, computer training meant for the girls. Similarly, the community awareness, as well as, gender-sensitization programmes for the functionaries of school managements of the Mahila Samakhya, Karnataka found satisfactory results (www.schooleducation .kar.nic.in/ssa/pdfdocs/npegel.pdf) of the initiatives of the NPEGEL programme in the state. Since, there is no study in the context of Assam, it was felt to take up the study to examine how far the gender-component plan under the umbrella of the NPEGEL has succeeded in bringing about changes in the educational status and the overall development of the tribal girls in Assam. It is felt that this kind of study would be of research value and
Chapters.indd 48 10/13/2016 2:58:29 PM

49Impact Analysis of the NPEGEL...
also contribute to inputs that would help in policy formulation for the upliftment of girls, particularly tribal girls of the state of Assam. With this backdrop, this study was carried out in 2011 with three fold objectives. These objectives were: (i) to study the contribution of the NPEGEL in the educational improvement of tribal girls in the elementary education; (ii) to assess the impact of activities carried out under the NPEGEL in the educational and overall development of targeted tribal girls; and (iii) to examine the role of the NPEGEL in sensitizing teachers with regard to issues concerning gender and gender sensitivity.
ProcEssEs aNd samPlE of thE study The study was confined to two model cluster schools located in Bhergaon community development block which is also identified as one of the educationally backward block of Udalguri district of Assam. The study district is one of the districts of Assam with a large proportion of tribal population. It has a total of 2, 67,372 (32.10 per cent) tribal population (Census of Assam, 2011) and the female literacy rate of 59.17 per cent with gap in gender literacy rate (gaps between male and female literacy rates) of 14.62 per cent, being much higher than the state average of 11.54 per cent as per 2011 Census.
In Udalguri, the NPEGEL scheme was implemented during 2007-08 by the Assam Mahila Samata
Society (AMSS), a registered society functioning under the Mahila Samkhya, Assam. During 2009-10, AMSS organized 18 life skill training programmes in all the 9 clusters of the study block (2 training programme per cluster in the block). Each programme was of two days duration. In two clusters that come under the study area, a total of 243 girls were covered in the life skill training programme. The total sample size of the study consisted of 150 tribal girls for face-to face interaction, selected randomly from 243 tribal girls who received life skill training. The girls who were selected for face-to-face interview were those who were not attending schools but traced out by AMSS and mainstreamed after the bridge course training as well as those who were in formal schools and got benefitted under the NPEGEL programme in some other ways. The sample area and sample size of the study is given in Table-1.
The Table-2 shows the school-wise and class-wise distribution of tribal girls who received life skill training and number of girls selected for face-to-face interaction in the study.
Besides, in-depth focus group discussions were held with 60 members randomly selected representing the management of the model cluster schools and the local community. In addition, some case studies with targeted girls were also done. The randomly selected sixty members belonged to a homogeneous background in terms of their literacy
Chapters.indd 49 10/13/2016 2:58:29 PM

50 Journal of Indian Education February 2016
Table 1Sample Area and Sample Size
SampleState
SampleDistrict
SampleBlock
Name of Cluster
Sample Model Cluster
Schools
Number of Girls who received Life Skill Training
Programme
Number of Girls In-
terviewed under the
Study
Assam Udalguri Bhergaon1 Bhergaon2 Ghorasal
i) Bhergaon Girls ME School
(ii) Khagrabari Janata ME School
158
85
80
70
Total= 243 150Source: School records obtained during field visit in 2011
levels and occupational activities. The average age of the selected members/ representatives was around 38 years. Most of them came from rural and illiterate backgrounds; only 6, out of 60 with ‘matriculation’ and ‘graduation’. Most of them as shown
in Table- 3 belonged to vulnerable social background and the girls who were exposed to the activities of the model cluster schools also were from the same, vulnerable parental background.
Table 2School-wise and Class-wise distribution of Girls Interviewed
Model Cluster Schools
From Class VI to Class VIIIClass VI Class VII Class VIII
Total ST girls enrolled
Total ST girls received life skill training
Total ST girls inter-viewed under the
study
Total ST girls enrolled
Total ST girls received life skill training
Total ST girls inter-viewed under the
study
Total ST girls enrolled
Total ST girls received life skill training
Total ST girls inter-viewed under the
study Bhergaon Girls ME School
50 32 20 40 30 29 54 30 26
Khagrabari Janata ME
School49 40 29 63 50 24 62 50 22
Total 99 72 49 103 80 53 116 80 48Source: School records obtained during field visit in 2011
Chapters.indd 50 10/13/2016 2:58:29 PM

51Impact Analysis of the NPEGEL...
The AMSS also appointed gender coordinator at the cluster level to orient teachers on gender issues. Since the cluster school teachers were given gender sensitization training, we intended to test the level of their gender sensitivity. A total of 30 school teachers who attended the gender sensitization sessions organized by the gender coordinator were part of the sample of the study.
(i) Tools The study used five sets of semi-structured interview schedules in order to obtain an understanding of the contribution of the activities carried out under the programme. One set of schedule was used to understand the nature of activities carried out by the AMSS for the assigned task. Impact assessment was made by
measuring the level of awareness of targeted girls about different aspects of three indicators i.e. personal health and hygiene, self-esteem and self-confidence, and girl child’s rights and some social issues associated with it, together with their level of practice of the indicator of personal health and hygiene. Each of these indicators is qualitative and, therefore, cannot be directly measured. It was therefore, necessary to develop a set of items which are amenable to quantification. Each selected indictor, therefore, was transformed into item-statements. In all 25 items were prepared. Each item was prepared using a four-point rating system with responses like greatly aware, moderately aware, somewhat aware, and not aware at all. With this tool, the study conducted face-to-face interviews
Table 3 Socio-economic Background of the Members of School Management
Committee and Local Community who participated in the Focus Group Discussion
SL.No.
Socio-Economic Background of Respondents No. of Participants
1 Members, illiterate, working as labour in tea gardens 102 Member, illiterate, working as labour in road construction 203 Members, literate, engaged in service sector 10
4 Members, barely illiterate, working as members of Village Panchayat ( all men) 6
5
Members, literate, working as members of Village Panchayat, as Labourer in Tea Garden, as Aganwadi Workers, as School Teachers and as Housewives ( all women)
14
Total 60Note: information was collected from them during the field survey in 2011
Chapters.indd 51 10/13/2016 2:58:29 PM

52 Journal of Indian Education February 2016
with 150 targeted girls. The third one helped in carrying out in-depth focus group discussions with members randomly selected representing the management of the cluster schools and the local community. Case studies of five girls were also carried out with the help of semi-structured schedule. To test the level of gender sensitivity of the targeted teachers, a semi-structured schedule that included 10 items related mainly to test teacher's understanding of the concept of gender, roots of gender inequality, gender discrimination, gender relations, gender bias, gender stereotypes and the manner in which they can build a gender-friendly environment in the schools was used. Each item was prepared using a four-point rating system with responses strongly agree, moderately agree, somewhat agree, and don’t agree.
(ii) Database and Methodology The study used a blend of secondary as well as primary data which was collected from the sample population by the researcher herself in collaboration with the AMMS functionaries. The secondary data with regard to the nature of activities carried out by the AMSS under the NPEGEL for the improvement of educational status of targeted tribal girls and their overall development was collected from the field office of the implementing agency during the field survey. The primary data was collected through different methods. In order to understand
the impact of activities carried out under the programme, data was collected through face-to-face interaction with sample girls through personally canvassed schedule. The schedule included in the first part socio demographic details of sample girls and in the second part it included questions covering 25 item-statements associated with different aspects of three indicators included in the study, together with their level of practice of the indicator of personal health and hygiene using a three-point rating system with responses always, often and sometimes. Face-to-face interaction was carried out with the targeted girls in both the cluster schools under study. Interaction with sample girls lasted for 60-70 minutes and data collected through interaction was systematized and quantified. Item wise analysis of girls’ responses was done in respect of these indicators. Analysis was done manually using a frequency method. The frequencies were undertaken. The frequency tables were used to quantify the amount of girls' level of awareness of different aspects of three indicators mentioned above. The qualitative data collected through focus group discussions and selected case studies was analyzed and presented in the form of statements in the study. The frequency analysis was done to quantify the amount of teachers' understanding about gender, gender relations and gender sensitivity.
Chapters.indd 52 10/13/2016 2:58:29 PM

53Impact Analysis of the NPEGEL...
fiNdiNgs aNd discussioN
The evidences collected from the field indicate that the AMSS as a nodal agency traced 67 out of school girls in the age group 6-14 in a block under the study during 2007-08 and got tehm enrolled in the bridge course programme carried out by the AMSS. The nodal agency organised two bridge courses: one at the Bartangla cluster school and the other at Nizgaruajhar cluster school. The out of school girls were first enrolled in the ‘bridge-course’ to upgrade their understanding of subjects upto the standard of class V. The duration of each bridge course was three months (90 days). The teachers who were assigned the task of teaching the courses were paid Rupees 2000/- per month from the fund of the scheme. After the completion of classes in bridge course, all the girls who attended were mainstreamed into the school and placed in various classes as per their academic ability and understanding. In addition to the exercise of the bridge courses, the implementing agency carried out community mobilization campaigns with the help of a student unit of Bodoland Territorial Council. The community mobilisation reached to more than 20,000 community people during the years 2009-11 and the AMSS succeeded in mobilising community to join hands in the efforts of the AMSS in identifying issues girls confront in the area and also helped in developing strategies
for the improvement of educational status of girls in their areas. The AMSS gender coordinators took an initiative to celebrate National and the International ‘Girl Child Day’ on January 24th and September 24th respectively every year wherein they invited community members to participate in the interaction. The analysis of information ascertained through focus group discussion with the members associated with the school management and the representatives of the local community indicate that the interaction gave people an opportunity to know and understand about various initiatives launched by the government for the promotion of educational and overall development of girls in general and of tribal girls in particular. The community mobilization coupled with other measures like support for running sibling care services etc. under the programme motivated the community to send their daughters to schools. An in-depth interview with Nilima Bhagwati (name changed), a school teacher working in an elementary school attached to the Bhergaon Girls ME School, a model cluster school, shows that the support provided by the AMSS in running sibling care centre in her village proved beneficial in the improvement of educational status of those girls belonged to families living in scattered habitations around the tea gardens. She narrated as under ‘many parents in her village were not sending their daughters to schools
Chapters.indd 53 10/13/2016 2:58:29 PM

54 Journal of Indian Education February 2016
regularly as they go to tea gardens for work and keep daughters at home to look after their younger siblings. The agency on behalf of the programme provided financial support to villagers to appoint a lady who can look after their siblings during school hours so that girls can be relieved from the responsibility of sibling care. The lady was paid an honorarium of rupees 500/- per month for her services. This effort proved beneficial in providing opportunities to those girls to attend school regularly who were irregular in school.’
Further, the analysis revealed that the AMSS hired community volunteers to impart remedial teaching to those girls whom performance was poor in the previous year’s academic evaluation. The remedial teaching programme was run in the month of February. Community volunteers engaged in this task were paid an amount of rupees 2000/- from the NPEGEL fund. The remedial teaching proved beneficial not only in addressing the issue of drop out among those tribal girls who were at the risk of dropping out of school because of their low academic performance but also contributed in enhancing their academic achievements.
Similarly, the initiatives taken up under the scheme to set up 'mobile’ library at the level of model cluster schools contributed in the educational development of tribal girls positively. The ‘mobile’ library contained short story books, school
books, periodicals and biographies of eminent scholars. The model cluster schools received financial grant under the programme for the initiative. The facility of ‘mobile library’ available in the model cluster schools rotates from one school to another alongwith the gender coordinator. Library books were kept for a week’s time in one school. The gender coordinator holds the responsibility of issuing books to girls and getting them back. An interview with the mother of a tribal girl studying in class VIII in Bhergaon Girls ME School reflected that the concept of ‘mobile library’ helped in the improvement of girl’s educational understanding. She narrated that 'setting of a ‘mobile library’ is a gift in such remote places of the state and this initiative has promoted a healthy reading habit among girls. She hoped that this would further help in enriching children's knowledge and understanding.' The other initiative taken up under the NPEGEL i.e. the 'best school award' is also worth mentioning. The selection of a school for the 'best school award' was done on the basis of performance of a school in getting girls enrolled in schools and also initiating efforts to promote retention and quality education in schools. It was found from the records of the sample schools under study that the implementing agency had given one dictionary, grammar books, short stories books, reading materials upto worth rupees 5000/- to the school selected for the ‘best school award’.
Chapters.indd 54 10/13/2016 2:58:29 PM

55Impact Analysis of the NPEGEL...
In addition to the initiatives of setting up of ‘mobile library’ and the ‘best school award’, it emerged from the analysis that the AMSS organised various other programmes from the NPEGEL fund like the life skill education, health check up camps, exposure visits and vocational education training etc. for the overall development of targeted girls For the health related aspects, medically trained personnel were invited once in two months on payment basis to organise 'health check up camps' for the targeted girls. The 'exposure visits' were also organized for girls by the AMSS to give them a chance to have an interaction with officials especially women officials working in the education department and also in other departments at the district level. In addition to these, AMSS supported schools to organise Kishoree Samaroh at the cluster level. On the day of samaroh, various cultural programmes were organised. Girls were given an opportunity to take part in these programmes. The girls who got first, second and third positions in a particular programme were awarded. Girls who secured highest attendance in the entire current academic year in class VI, VII and VIII and also those who got first position in class VI, VII and VIII were awarded prizes on the day of the samaroh.
The AMSS also carried out life skill education programme for the targeted girls with the help of volunteers, who were paid honorarium from the NPEGEL fund. Findings of the study
reveals that that life skill education programme contributed significantly in raising the level of girl’s awareness about issues related to personal health and hygiene, self-esteem/self-confidence, and girl child’s rights and some social issues related to it as shown in Tables 4, 5, 6, 7 given below.
(i) PErsoNal hEalth aNd hygiENE The analysis at Table 4 given below revealed that girls underwent life skill education programmes experienced higher level of awareness of different aspects of personal health and hygiene. When we combined the greatly aware and moderately aware responses of the girls, more than 70 per cent of the girls were found highly aware of all the eight aspects/items related to the indicator of personal health and hygiene. It shows an impressive contribution of the programme in raising the level of girl’s awareness of different aspects of personal health and hygiene as shown in Table 4.
However, item wise analysis revealed wide variation in responses of the girls and the variation was between 53 per cent to 65 per cent. The awareness about ‘comprehensive hand cleanliness before every meal’ was ranked on the top with highest value of 65 per cent and ‘protection of body from harmful effects of detergents, powders, sprays, pollution, cosmetics, etc.’ and ‘comprehensive cleanliness of nails’ ranked at the low with values 52.7 and 52 per cent respectively.
Chapters.indd 55 10/13/2016 2:58:29 PM

56 Journal of Indian Education February 2016
If we look further at Table 5 given below showing the extent of girl’s level of practice of various aspects/items of personal health and hygiene, we find an alarming inconsistency
Table 4 Level of Girls’ Awareness of Basic Aspects of the Indicator of Personal
Health and Hygiene
Item statements
Respondent’s Level of Awareness Total Respon-dents
Greatly Aware
Moderately Aware
Somewhat Aware
Not at all Aware
Personal cleanliness is the first step to good health
90(60.0)
50(33.3)
7(4.7)
3(2.0)
150
Personal hygiene is comprehensive dental protection
89(59.3)
29(19.3)
26(17.3)
6(4.0)
150
Personal hygiene is comprehensive environmental cleanliness, including public places
90(60.0)
28(18.7)
30(20.0)
2(1.3)
150
Personal hygiene is comprehensive hand cleanliness before every meal
98(65.3)
13(8.7)
38(25.3)
1(0.7)
150
Personal hygiene is comprehensive hair cleanliness
89(59.3)
23(15.3)
36(24.0)
2(1.3)
150
Personal hygiene is comprehensive personal cleanliness during menstruation
91(60.7)
16(10.7)
26(17.3)
17(11.3)
150
Personal hygiene is comprehensive cleanliness of nails
78(52.0)
29(19.3)
39(26.0)
4(2.7)
150
Personal hygiene is comprehensive protection of body from harmful effects of detergents, powders, sprays, pollution, cosmetics, etc. needed
79(52.7)
29(19.3)
29(19.3)
13(8.7)
150
Note: Figures in parenthesis indicate percentages to the total
between their level of awareness and their level of practices of different aspects of personal health and hygiene. Analysis indicates that only 43 (28.7%) of those 98 girls who were
Chapters.indd 56 10/13/2016 2:58:29 PM

57Impact Analysis of the NPEGEL...
‘greatly aware’ of the item-statement of ‘hand cleanliness before every meal’ stated using the skill ‘Always’. More or less similar trend was found in responses of other aspects/items associated with the indicator. It seems that whatever understanding girls developed during the training that was not transformed in action. This reflected a wide gap between planning level commitments (awareness and practice) and the ground realities.
Table 5Girls’ Level of Practice of Various items of the Indicator
of Personal Health and Hygiene
Item statements Respondent’s Level of
PracticesTotal
Respondents Always Often Sometimes
Ensure personal cleanliness 72
(48.0)37
(24.7)41
(27.3)150
Ensure comprehensive dental protection
49(32.7)
26(17.3)
75(50.0)
150
Ensure comprehensive environmental cleanliness, including public places
68(45.3)
30(20.0)
52(34.7)
150
Ensure hand cleanliness before every meal
43(28.7)
38(25.3)
69(46.0)
150
Ensure comprehensive hair cleanliness
42(28.0)
36(24.0)
72(48.0)
150
Ensure comprehensive personal cleanliness during menstruation
39(26.0)
26(17.3)
85(56.7)
150
Ensure cleanliness of nails 29
(19.3)19
(12.7)102
(68.0)150
Ensure comprehensive protection of body from harmful effects of detergents, powders, sprays, pollution, cosmetics, etc. needed
29(19.3)
17(11.3)
104(69.3)
150
Note: Figures in parenthesis indicate percentages to the total
(ii) Self-esteem and Self-confidenceLike the personal health and hygiene, self-esteem/self-confidence was another indicator included in the analysis to assess the level of awareness of sample girls. Seven item-statements were included in the analysis as given in Table 6. The overall level of awareness of different items associated with the indicator was found comparatively higher among the girls. The highest
Chapters.indd 57 10/13/2016 2:58:29 PM
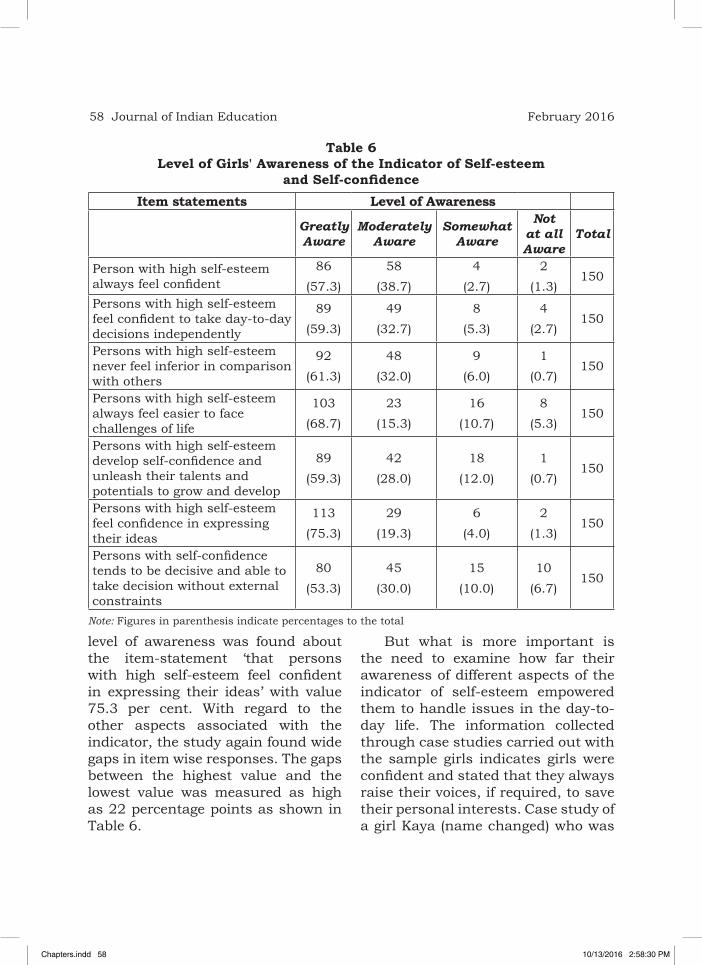
58 Journal of Indian Education February 2016
level of awareness was found about the item-statement ‘that persons with high self-esteem feel confident in expressing their ideas’ with value 75.3 per cent. With regard to the other aspects associated with the indicator, the study again found wide gaps in item wise responses. The gaps between the highest value and the lowest value was measured as high as 22 percentage points as shown in Table 6.
But what is more important is the need to examine how far their awareness of different aspects of the indicator of self-esteem empowered them to handle issues in the day-to-day life. The information collected through case studies carried out with the sample girls indicates girls were confident and stated that they always raise their voices, if required, to save their personal interests. Case study of a girl Kaya (name changed) who was
Table 6Level of Girls' Awareness of the Indicator of Self-esteem
and Self-confidenceItem statements Level of Awareness
Greatly Aware
Moderately Aware
Somewhat Aware
Not at all Aware
Total
Person with high self-esteem always feel confident
86(57.3)
58(38.7)
4(2.7)
2(1.3)
150
Persons with high self-esteem feel confident to take day-to-day decisions independently
89(59.3)
49(32.7)
8(5.3)
4(2.7)
150
Persons with high self-esteem never feel inferior in comparison with others
92(61.3)
48(32.0)
9(6.0)
1(0.7)
150
Persons with high self-esteem always feel easier to face challenges of life
103(68.7)
23(15.3)
16(10.7)
8(5.3)
150
Persons with high self-esteem develop self-confidence and unleash their talents and potentials to grow and develop
89(59.3)
42(28.0)
18(12.0)
1(0.7)
150
Persons with high self-esteem feel confidence in expressing their ideas
113(75.3)
29(19.3)
6(4.0)
2(1.3)
150
Persons with self-confidence tends to be decisive and able to take decision without external constraints
80(53.3)
45(30.0)
15(10.0)
10(6.7)
150
Note: Figures in parenthesis indicate percentages to the total
Chapters.indd 58 10/13/2016 2:58:30 PM

59Impact Analysis of the NPEGEL...
studying in class VIII in Bhergaon Girls ME School of Udalguri is a good example of the contribution of training she received in school under the NPEGEL programme. Kaya said “there are 4 children including me in my family: two brothers and one sister. I am the fourth born in my family of four children. My sister who is older to me in age completed class twelve the year 2011 from the same school in which I am studying. My sister is also one of the beneficiaries of the NPEGEL prorgramme and as a beneficiary she underwent vocational training courses in the school. After the completion of school education, my sister wanted to join course in fashion designing. Since there is no institute that imparts such courses in the district, my sister wanted to join course outside the district we live in. My sister asked my father to get her admitted either in Guwahati or in Delhi. My sister was more interested in getting admission in Delhi as one of our brothers was already studying in Delhi. My father was not interested in her higher studies. My father resisted upon her decision. We have learnt from the life skill training programme that no one can discriminate between boys and girls in matters of opportunities. The only thing is girls must have high self-esteem and confidence to take care of day-to-day challenges they confront in the society. We also learnt that girls should raise voices against any injustice, if required. I and my sister realized this is injustice. The confidence developed among me and
my sister through the training gave us a ray of hope to convince our father. We talked to our father and made him understand that education is everyone's right. We convinced our father that if he can send his son to Delhi for higher studies, he can also allow us to continue higher studies. Finally, the exercise emerged fruitful and my sister got admission in Guwahati. The school training made us aware of life situations; and my sister’s admission empowered her to aspire for the future”.
She was feeling very confident and happy. This is an idea of self-assertion which developed among girls after the exposure to the activities carried out by the nodal agency of the scheme. The case study shows a move among girls from a passive acceptance of their situation, to looking beyond and being assertive.
(iii) Girl Child’s Rights and some Social Issues Associated with itA total of 10 items were included in the analysis of assessing the level of awareness of the targeted girls about girl child’s rights and some social issues associated with it. The analysis suggested though the girls were highly aware of the different aspects associated with the indicator, a significant difference found in item wise analysis of responses. The responses varied within range of 13.3 per cent to 82 per cent. The response to item of every child irrespective of sex has right to education emerged at the top with highest value of 82
Chapters.indd 59 10/13/2016 2:58:30 PM

60 Journal of Indian Education February 2016
per cent followed by the item of no one can discriminate between boys and girls in matters of opportunities (75.3%), every child irrespective of
sex has right to free and compulsory education upto the age of fourteen (68.7%), child abuse is against Indian law (59.3%). The level of
Table 7 Level of Girls’ Awareness of Girl Child’s Rights and Some Social issues
Associated with it
Item statements
Level of Awareness
Greatly Aware
Moderately Aware
Somewhat Aware
Not at all Aware
Total Respondents
Every child irrespective of sex has right to free and compulsory education upto the age of fourteen
103(68.7)
16(10.7)
23(15.3)
8(5.3)
150
Every child irrespective of sex has right to education
123(82.0)
19(19.3)
6(4.0)
2(1.3)
150
Every one irrespective of sex has right to freedom of expression
42(28.0)
89(59.3)
1(0.7)
18(12.0)
150
No one can discriminate between boys and girls in matters of opportunities
113(75.3)
29(19.3)
2(1.3)
6(4.1)
150
Sex based discriminatory social practices must come to an end
92(61.3)
48(32.0)
9(6.0)
1(0.7)
150
Child abuse is against law in India
98(65.3)
13(8.7)
38(25.3)
1(0.7)
150
Child labour is against law in India
89(59.3)
39(26.0)
21(14.0)
1(0.7)
150
Female feticide is against law in India
42(28.0)
46(30.7)
40(26.7)
22(14.7)
150
Traditional tribal social practices favour gendered division of labour
29(19.3)
12(8.0)
19(12.7)
90(60.0)
150
Everybody has the right to live in dignity and enjoy all the rights guaranteed to them
20(13.3)
22(14.7)
18(12.0)
90(60.0)
150
Figures in parenthesis indicate percentages to the total
Chapters.indd 60 10/13/2016 2:58:30 PM

61Impact Analysis of the NPEGEL...
awareness among the girls was found very low on items associated with the awareness of child’s right to live in dignity and enjoy all the rights guaranteed to them (13.3 %) followed by traditional tribal social practices favour gendered division of labour (19. 3%), every one irrespective of sex has right to freedom of expression (28 %), and female feticide is against Indian law (28%). It depicts less gain of the activities carried out under the umbrella of the NPEGEL in creating awareness and knowledge of those issues that may be not much in practice in the local society in which the sample girls live in.
(iv) Gender Sensitivity Analysis of Targeted Teachers The targeted teachers were those who were exposed to the gender sensitization programmes organized by the AMSS. We interacted with 30 targeted teachers to ascertain their responses of understanding of the concept of gender, roots of gender inequality, gender discrimination, gender relations, gender bias, gender stereotypes and the manner in which they can build a gender-friendly environment in the schools was used. The item-wise analysis of teachers’ responses indicated that all the beneficiary teacher-respondents had agreement on the first item that terms ‘sex’ and ‘gender’ are the same and interchangeable with 76.7% of them having strong agreement. There was no teacher who did not disagree with the item statement. It was surprising
to learn from their responses that in spite of capacity building enrichment programme for the teachers, almost all the teachers had the misconceived notion of the term ‘sex’ and ‘gender’ as indicated in Table 8. This shows their stereotype mind-set manifesting into their responses, although 50 per cent of the teacher respondents strongly agreed and favoured gender-parity and 60 per cent favoured the need of interrogating teaching-learning from a gendered perspective. Hence, findings of the study tell us a mixed story with greater stress on the misconceived notion of gender and gender related issues.
Conclusion Findings emerged from the analysis reveals that the programme overall has made a significant contribution in the improvement of educational status of tribal girls in the study area. Agency’s effort in creating an ambience that promote gender-inclusive environment in the local community through community mobilization and organisation of various capacity-building activities for the educational improvement and overall development of tribal girls emerged is worth mentioning. Agency mobilized more than 20,000 community people in just three years times from 2009-11. According to the responses emerged through focus group discussions, community awareness programmes really contributed significantly in the improvement of girls’ education
Chapters.indd 61 10/13/2016 2:58:30 PM

62 Journal of Indian Education February 2016
and their overall development in the study areas. Findings emerged from the focus group discussion with community people indicate that community mobilisation coupled
with other measures like support for running sibling care services initiated under the programme also motivated many parents to send their daughters to schools regularly. Besides, ‘mobile
Table 8Level of Awareness of Gender Sensitivity of Targeted Teachers
Item statements Level of Awareness Total
Respondents Strongly agree
Moderately agree
Somewhat agree
Don't agree
Terms sex and gender the same and interchangeable
23(76.7)
5(16.7)
2(6.7)
0(0)
30
Gender a biological construct
20(66.7)
6(20.0)
2(6.7)
2(6.7)
30
Gender a cultural construct
10(33.3)
5 (16.7)
7(23.4)
8(26.6)
30
Patriarchal values integral parts of Indian tradition
23(76.7)
4(13.3)
1(3.3)
2(6.7)
30
Patriarchal values acceptable to India people
22(73.3)
3(10.0)
4(13.3)
1(3.3)
30
Gender- parity needed in the society 15
(50.0)4
(13.3)6
(20.0)5
(16.7)30
Male dominated society to continue in the society
19(63.3)
5(16.7)
3(10.0)
3(10.0)
30
Education teaches social selectivity and patriarchal values
20(66.7)
3(10.0)
5(16.7)
2(6.7)
30
Contents of schooling need to be interrogated from a gendered perspective
18(60.0)
4(13.3)
2(6.7)
6(20.0)
30
Gendered division of labour to exist in the society
20(66.7)
2(6.7)
2(6.7)
6(20.0)
30
General consensus to be evolved on basic issues of the society
20(66.7)
4(13.3)
3(10.0)
3(10.0)
30
Figures in parenthesis indicate percentages to the total
Chapters.indd 62 10/13/2016 2:58:30 PM

63Impact Analysis of the NPEGEL...
library’ and ‘best school award’ contributed in improvement of girl’s education in the study area.
With regard to the issue of overall development of tribal girls, it seems that the awareness level of the targeted tribal girls has strengthened although, it has own limitations, contradictions and inconsistencies. The assertion of economically poor tribal girls for continuing their higher studies is pertinent, as they exemplify voice against violation of their educational rights being daughters in the family. This result has been supported by various studies also. There are researches indicating that teaching skills in this way, as part of teaching-learning process, is an effective approach for empowering children, especially girls. Cutinha (2012) and Srikala and Kishore (2010) found that the life skill education of school children improves adjustment of the adolescents with teachers, and school, increases pro-social behavior, coping with stress and self-esteem. Rajib Acharya et. al. in 2009 found a positive and net effect in the study on impact of the life skills based training in the attitude of adolescents girls. An interventions study for providing life skill education to girls in tribal community in Gujarat in 2005 by Bharath and Kumar also found that the programme helped students and empowered them in a better manner about their physical changes, build self-confidence and understand gender related issues. In fact, findings of the study suggest
that these kinds of interventions may bear fruit gradually and can prove to be sustainable solutions in the empowerment of girls living in remote tribal areas, as more positive responses have come from comparatively large number of the sample girls.
Experiences gained through interaction with teacher-respondents suggested that interventions of the programme in creating gender awareness and gender sensitisation have not found much satisfactory results. Continuous efforts are required in this direction, as gender issues are deeply rooted in the minds of people. Hence, the findings of the study recommend continuous efforts in this direction which need to be taken up seriously as the study felt the need to equip the teachers’ understanding of gender and gender issues regularly to be enable them to deal with the ideologies behind gender representation in class rooms’ situations. The study also highlights the need for the government to support such programmes with zeal of more pro-active role in the release of fund in time.
In the light of above discussion, it could be said that such programmes are of great value as they can specifically address the needs of girls growing up in disadvantaged environments that lack opportunities provided programmes are sustained for a long period by providing regular and in-time financial support to the authorities concerned.
Chapters.indd 63 10/13/2016 2:58:30 PM

64 Journal of Indian Education February 2016
rEfErENcEs
Cutinha, j. 2012. Impact of Life Skill Education on Academic Performance of Adolescents. Souvenir XXX Annu. Nation. Conference of ISPSW on Emerging Trends in Professional Social Work. 5-7, January, 2012. Department of Psychiatric Social Work, Bangalore.
government oF aSSam. 2011. Guidelines for Implementation of the National Programme for Education of Girls at Elementary Level (unpublished report).
government oF india. 2005. Guidelines for Implementation of the National Programme for Education of Girls at Elementary Level. Ministry of Human Resource Development, New Delhi.
______. 2013. Sarva Shiksha Abhiyaan. 18th Joint Review Mission. January. 13-27. New De lhi.
______. 2011. Sarva Shiksha Abhiyaan. 13th Joint Review Mission. January. 19-24. Uttrakhand.
______. 2010. Sarva Shiksha Abhiyaan. 12th Joint Review Mission. Karnataka.nuna, anita. 2011. Education of Girls: A Study of the National Programme for Education
of Girls at Elementary level (NPEGEL) in Assam and Arunachal Pradesh (Unpublished report). NCERT. New Delhi.
rajiB aCharya. 2009. et aL. Broadening Girl’s Horizons: Effects of a Life Skill Education. www.goggle.co.in/webhp?nord
rouL, KartiKeShwar. 2011. "Impact of NPEGEL on Girl's Education at Elementary Level in Tribal District of Odisha". Journal of Indian Education. Vol. XXXVII, No. 1, May, New Delhi.
SriKaLa, B. and KiShore, K.v. 2005. Activity Manual for the Teachers on Health Promotion using Life Skill Approach. NIMHANS, Bangalore.
Chapters.indd 64 10/13/2016 2:58:30 PM
Factors Affecting Academic Performance of the Girl Students
Evidence from West BengalSujata Bera*
Soumita daSguPta**
AbstractThe importance of academic performance at each education level is well recognised by the researchers as it helps the people to achieve various positive outcomes of what they value. This paper aims to give some insights about the factors influencing academic performance of the girl students of their XII Grade. For this purpose, the information has been collected from the girl students of East and West Midnapore district who appeared in their XII standard Board exam in 2013. Apart from using various statistical tools, it has applied multi-regression modes to assess the impact of the various socio-economic factors on academic performance of the girl students. The study shows that the students who belong to APL families, who are Hindus, who stayed at home, who have minor children in their families are more likely to perform better in their examination of XII Grade. Moreover, daughter of higher educated women, regular attendance also positively affects the academic performance of the students. The most influencing factor in this study is the support from private tutor. It is found that the students taking private coaching from hired tutor have been awarded higher marks in their examination. However, women of socially disadvantaged group who use technology are less likely to achieve better academic scores in their examination of XII Grade. Further research
* Assistant Professor of Economics, Raja N L Khan Women’s College, Midnapore (West), West Bengal 721102.
** Research Scholar, Raja N L Khan Women’s College, Midnapore (West), West Bengal 721102.
Chapters.indd 65 10/13/2016 2:58:30 PM

66 Journal of Indian Education February 2016
is needed to explore the students’ high dependence of private tutor for their academic achievement. It might be due to the poor quality of teaching, higher student strength in a class or students’ attitude to follow short cut policy to achieve better score rather than to gather knowledge.
Academic achievement is one in all the necessary social indicators that is connected with a range of positive outcomes what people value. The students having poor academic record are more likely to be denied with access to higher education as well as to enter the reputed schools which further enhance the educational performance gap. The academically successful persons are more likely to be employed in the modern sector and have better earnings which determine their social identity and status. Moreover, the employers in the labour market are more likely to choose the academically successful individuals in a situation of excess supply of labour.
Except these tangible benefits, individuals having higher academic performance have higher self-esteem, lower level of depression and anxiety which are again considered to be crucial inputs in commitment to academic success. Therefore, the academic performance gap is growing with the ages, which is coined as ‘Cumulative Advantage Process (CAP)’ by Merton (1973). The current level of accumulation affects future level of accumulation and an inequality at any stage produces inequality in the later stage (Bast & Reitsma 1998).
The nation/society that aims to bring equality among individuals,
irrespective of different socio-economic and cultural environment they belong, try to reduce the academic performance gap by adopting/introducing various programmers/Acts. In India, such programmers/Act are Right to Education Act (2009), Sarba-Siksha Abhizan (2000-2001), Mid-day meal scheme (1995), reservation in the academic institution for the socially backward students etc. The objective of these programmes is not only to the educational attainment of the individuals, but to reduce educational performance gap among individuals. The success of the programme could only be achieved through proper identification of the factors that lead to this academic performance gap.
As per the National Achievement Survey (2014) conducted by the National Council of Educational Research and Training (NCERT), at all India level, class III children were able to answer 64 per cent of language items, whereas for Mathematics the corresponding figure is 66 per cent. A state wise wide variation has been observed in this regard. The performance scores for language items vary from 74 per cent in Daman and Diu to 51 per cent in Chhattisgarh. Like language items, in Mathematics the highest performing union territories is Daman and Diu and lowest performing state is Chhattisgarh.
Chapters.indd 66 10/13/2016 2:58:30 PM

67Factors Affecting Academic Performance of the Girl Students ...
As regards average scores of language items Tripura ranked first and its average score is 23 point higher than the national average (257). Most of the southern states and the union territories have been performed better both in language group as well as in Mathematics. The maximum average score in Mathematics has been achieved by Daman and Diu (279), whereas, Chhattisgarh has the lowest average scores in Mathematics. Analysis of academic scores by social groups reveals that there are no significant differences in average scores between boys and girl students for both the language items and Mathematics at the national level, though in few states, namely, Madhya Pradesh, Kerala and Pondicherry have experienced significant differences in average scores between boys and girl students for language items. For Mathematics, only in Kerala, the average score of girl students is found to be higher than the boy students.
As regards rural-urban academic performance gap in language items, in some states and union territories, namely, Maharashtra and Dadra and Nagar Haveli, rural students performed better than the urban students, whereas, in Jammu and Kashmir, Mizoram, Tripura, Jharkhand, Daman and Diu, the urban students performed better than the rural students in this regard. For Mathematics, no significant differences in Rural-urban academic performance have been observed for
neither in all India level nor in any state or union territories.
For schedule caste students, the average score for language items vary from 292 in A and N Island to 216 points in Chhattisgarh, whereas for schedule tribe students, the Pondicherry ranked first and Chandigarh is the lowest performing state. The state wise variations appear to be less for the students belonging to the OBC and other category. Same scenario has also been observed in case of Mathematics. Again variations in academic performance by social groups in each state have also been observed.
From the above report it can be concluded that variations in academic performance by social group, by region and also by gender in some extent exists in spite of introducing several education programme in India. In order to understand the impact of various factors on academic performance of the girls’ students, some scholars examined the relationship between the socio-economic-institutional environment and the students’ academic performance.
According to Todaro (1977), various individual characteristics and household and non-household environment can determine whether or not the child will perform well in school and in later life. These factors include the health and feeding habits of mothers during pregnancy, the Childs’ own health and nutritional status during his/her first few
Chapters.indd 67 10/13/2016 2:58:30 PM

68 Journal of Indian Education February 2016
years of life, the family’s income and living conditions, income level of the family, parents’ education, housing conditions, number of children in households, etc. Smith, Fagan and Ulvund (2002) had asserted that the parental socio-economic status (SES) is a significant contributor of intellectual performance of minor students. In the same vein, other researchers had posited that parental SES could affect school children to adjust to the different school schedules (Guerin et al., 2001). In a study in Nigeria, Oni (2007) and Omoegun (2007) had averred that there is significant difference in behaviour among students from high and low socio-economic status. The health status of the children which could also be connected to parental socio-economic background can be another factor to affect the academic performance of the students (Adewale, 2002; Eze, 2002).
The empirical literature, among other things, have highlighted the different aspect of students’ academic performance such as their social and economic status etc. but in Indian context, the issue of various factors affecting the academic performance of the students has hardly been explored. Moreover, the individual characteristics, which affected the students’ academic performance, have been emphasised in most of the studies. On the other hand, the household characteristics are relatively less explored. Household level characters are important in
assessing the academic performance of the girls’ students as it often reflects the unobserved attitude of other family members towards their girl children whereas, some other factors exhibit the opportunities available to them. The present paper considered all these factors in explaining the academic performance of the girl students. In this process, some important questions are answered here: how far the academic performance of the girl students is affected by their socio-economic environment? Have household level factors influenced the academic performance of the girl students? What is the contribution of other opportunities like number of private tutor, residential school, uses of modern information system in determining academic performance of the student? To obtain answer to above questions, we have collected primary data from the undivided Midnapore district of West Bengal. Before doing so, we have briefly discussed the present status of the academic performance of the students of grade III by using the secondary data.
The paper is divided in five sections. The sources of secondary data and methodology followed for collection of primary data are reported in section II. In Section III, we discuss the socio-economic characteristics of the girls’ students and econometrically examine the importance of various factors in determining the academic performance of the girl students. The final section IV provides main conclusions of this study.
Chapters.indd 68 10/13/2016 2:58:30 PM

69Factors Affecting Academic Performance of the Girl Students ...
data basE aNd mEthodology
The present study is based on both the secondary and the primary data. We analyzed the academic performance of the children of class three in different states and in all India level with the help of secondary data collected from the report of National Council of Educational Research and Training (National Achievement Survey- 2014). However, as the objective of our study is to obtain an in-depth understanding of the academic performance of the girls students in East and West Midnapore districts, we supplemented our secondary data based analysis with the analysis of primary data. The analysis of primary data helps us to understand the social, economic and institutional contexts in ensuring the academic performance of the girl students.
To study the above objective we have collected the data from the students who appeared their XII grade examination from different schools situated in East Midnapore, West Midnapore districts. They appeared in the examination under the same board and in the year 2013. We have collected data from 278 students, out of which 188 from Arts stream and remaining from science stream. Information regarding their social, cultural, economic status, education level of parents, distance of residence from school, uses of technology etc. has collected to explain the variability of academic performance of the students. Simple statistical tools like
percentage, correlation coefficients’‘t’ test for differences in mean have been used to analyse the above said objectives. Apart from this, we have used the multi-variable regression model to analyse the effects of a particular factor on academic performance of the girl students.
dEtErmiNaNts of thE acadEmic PErformaNcE of thE girls The academic performance of the girl students depends on a number of factors that represent their economic and social status. In this study, the social-economic status of the respondents is captured in terms of their caste, poverty status, religion, academic performance of the parents, presence of minor children, engagement in formal sector by the household members, level of education of mother, employment status, family income group and educational expenditure. The institutional factors that we captured in this study are provision of stipend, attendance, library visit. The other factors that we considered here are uses of digital gadgets (technological factors), members of other organisations. Here the academic performance of the girl students is measured by the average marks they obtained in their XII standard and information is collected from the 1st year college students who have admitted in their U.G course.
Table 1 presents the academic performances of the girl students by their poverty status. It appears from
Chapters.indd 69 10/13/2016 2:58:30 PM
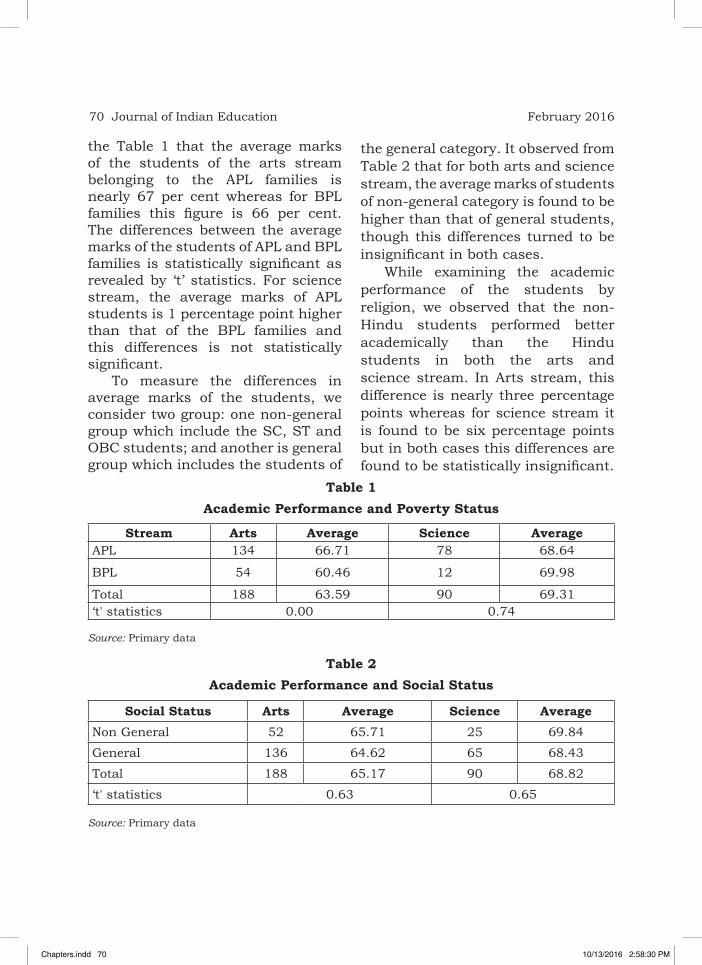
70 Journal of Indian Education February 2016
the Table 1 that the average marks of the students of the arts stream belonging to the APL families is nearly 67 per cent whereas for BPL families this figure is 66 per cent. The differences between the average marks of the students of APL and BPL families is statistically significant as revealed by ‘t’ statistics. For science stream, the average marks of APL students is 1 percentage point higher than that of the BPL families and this differences is not statistically significant.
To measure the differences in average marks of the students, we consider two group: one non-general group which include the SC, ST and OBC students; and another is general group which includes the students of
Table 2Academic Performance and Social Status
Social Status Arts Average Science AverageNon General 52 65.71 25 69.84
General 136 64.62 65 68.43
Total 188 65.17 90 68.82
‘t' statistics 0.63 0.65
Source: Primary data
Table 1Academic Performance and Poverty Status
Stream Arts Average Science AverageAPL 134 66.71 78 68.64
BPL 54 60.46 12 69.98
Total 188 63.59 90 69.31‘t' statistics 0.00 0.74
Source: Primary data
the general category. It observed from Table 2 that for both arts and science stream, the average marks of students of non-general category is found to be higher than that of general students, though this differences turned to be insignificant in both cases.
While examining the academic performance of the students by religion, we observed that the non-Hindu students performed better academically than the Hindu students in both the arts and science stream. In Arts stream, this difference is nearly three percentage points whereas for science stream it is found to be six percentage points but in both cases this differences are found to be statistically insignificant.
Chapters.indd 70 10/13/2016 2:58:30 PM

71Factors Affecting Academic Performance of the Girl Students ...
There are not so much differences in academic performance in both the stream by their family size.
Relationship between the family size and the academic performance of the students in the arts as well as in the
Table 3Distribution of Students by Stream and by religion
Stream Arts Average Science AverageHindu 169 61.94 83 68.32Non-Hindu 19 65.26 7 74.79
‘t’ statistics 0.32 0.21
Source: Primary data Table 4Academic Performance and Family Size
Family sizeNo. of
students in Arts
Average marks
No. of students in
Science
Average marks
0-3 20 66.56 10 67.45(4-5) 118 64.28 57 69.74(6-7) 37 66.78 16 69.748 and above 13 63.18 7 61.17Total 188 65.2 90 67.02Correlation coefficient -0.04 -0.06
Source: Primary data Table 5Academic Performance and presence of Minor Children
No. of minor children
No. of students in Arts
Average MarksNo. of
students in Science
Average Marks
0 80 66.99 46 67.19
1 82 66.78 32 69.69
2 20 66.64 11 72.05
3 4 62.08 1 80.00
4 2 53.07 0 0.00Total 188 64.93 90 68.82
Correlation coefficient 0.08 0.16
Source: Primary data
Chapters.indd 71 10/13/2016 2:58:30 PM
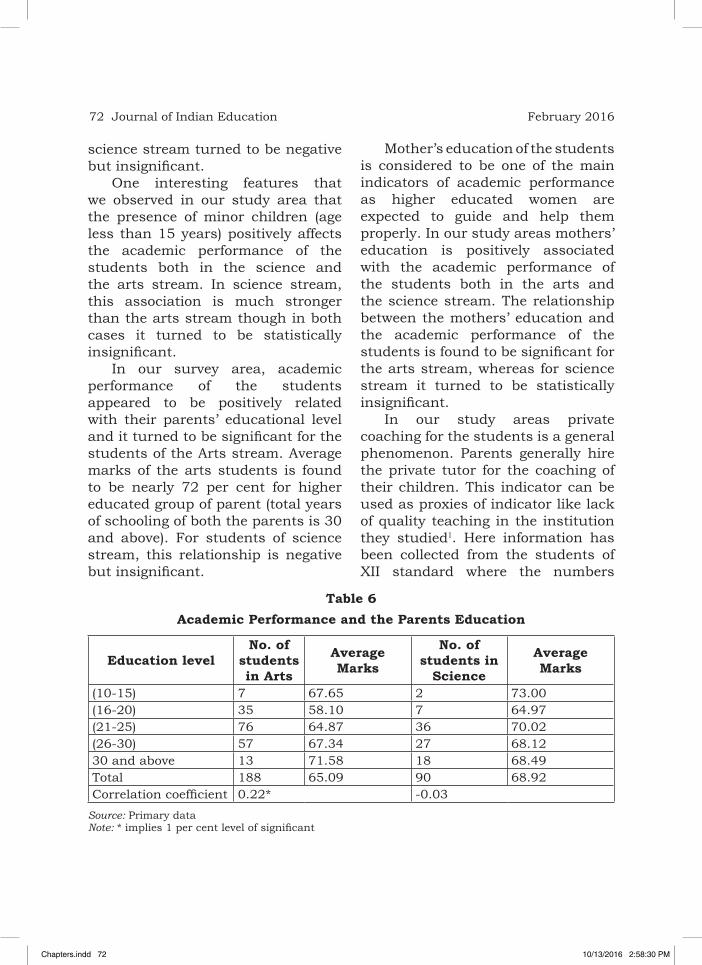
72 Journal of Indian Education February 2016
science stream turned to be negative but insignificant.
One interesting features that we observed in our study area that the presence of minor children (age less than 15 years) positively affects the academic performance of the students both in the science and the arts stream. In science stream, this association is much stronger than the arts stream though in both cases it turned to be statistically insignificant.
In our survey area, academic performance of the students appeared to be positively related with their parents’ educational level and it turned to be significant for the students of the Arts stream. Average marks of the arts students is found to be nearly 72 per cent for higher educated group of parent (total years of schooling of both the parents is 30 and above). For students of science stream, this relationship is negative but insignificant.
Table 6Academic Performance and the Parents Education
Education levelNo. of
students in Arts
Average Marks
No. of students in
Science
Average Marks
(10-15) 7 67.65 2 73.00(16-20) 35 58.10 7 64.97(21-25) 76 64.87 36 70.02(26-30) 57 67.34 27 68.1230 and above 13 71.58 18 68.49Total 188 65.09 90 68.92Correlation coefficient 0.22* -0.03
Source: Primary data Note: * implies 1 per cent level of significant
Mother’s education of the students is considered to be one of the main indicators of academic performance as higher educated women are expected to guide and help them properly. In our study areas mothers’ education is positively associated with the academic performance of the students both in the arts and the science stream. The relationship between the mothers’ education and the academic performance of the students is found to be significant for the arts stream, whereas for science stream it turned to be statistically insignificant.
In our study areas private coaching for the students is a general phenomenon. Parents generally hire the private tutor for the coaching of their children. This indicator can be used as proxies of indicator like lack of quality teaching in the institution they studied1. Here information has been collected from the students of XII standard where the numbers
Chapters.indd 72 10/13/2016 2:58:30 PM

73Factors Affecting Academic Performance of the Girl Students ...
of subjects they have chosen in XII standard are the same.
The Table 8 presents the academic performance of the students and the number of private tutor offer private tuition to them. It is found from the table that the students taking private coach from hired tutor have awarded higher marks in their examination both in the arts stream and the science stream. Moreover, the association between these two variables is found to be positive and statistically significant for both the stream.
Other some indicators like their residence during study, uses of digital gadgets, regular attendance in the school, library visit, student scholarship etc. may have some influence on academic performance of the students. In this section, we try to give some insights on these variables.
Table 9 present the academic performance of the students by their
Table 7Academic Performance and the Mothers’ education
Mother education Arts Average Marks Science Average
Marks 0 7 67.64 1 68.8
(1-10) 121 62.58 44 69.28
(11-12) 27 67.66 18 66.73
13-15 28 71.06 21 69.19
16 and above 5 68.76 6 70.43
Total 188 67.54 90 68.8
Correlation coefficient 0.21* 0.01
Source: Primary data
Note: * implies 1 per cent level of significant
type of residence. It is found that the student, who stayed in home during study, performed well that the students staying outside home, i.e. in hostel, mess etc. The differences in average academic scores between the students who have stayed in home and the student, who did not, appeared to be statistically significant for the science stream but turn to be insignificant for the arts stream.
Uses of phone, internet etc. is assumed to be enhanced access to information and thereby affect the academic performance of the users of this informational asset. In our study area the uses of informational asset adversely affects the academic performance of the students both in the science and the arts stream. In the arts stream, the average academic score of non-users of informational asset is found to be nearly 66 per cent as compared to the 64 per cent
Chapters.indd 73 10/13/2016 2:58:30 PM

74 Journal of Indian Education February 2016
of the users of the same. However, for science stream, this differences is
appeared to be very high (nearly 10 percentage points) and statistically
Table 8
Academic Performance and Number of Private Tutor
No. of private tutorNo. of
students in Arts
Average MarksNo. of
students in Science
Average Marks
0 9 63.03 15 61.16(1-2) 75 57.72 19 65.96(3-4) 66 69.21 24 67.79(5-6) 30 70.95 26 75.207 and above 8 76.64 6 73.49Total 188 64.93 90 68.82Correlation coefficient 0.41* 0.37*
Source: Primary dataNote: * implies 1 per cent level of significance
Table 9Academic Performance and type of Residence
Type of residence Arts Average Science AverageHome 160 65.46 57 70.62Outside home 28 61.87 33 65.7Total 188 64.93 90 68.82
‘t' statistics -1.29 -1.75***
Source: Primary dataNote: ** *implies 10 level of significance
Table 10Academic Performance and Uses of Digital Gadgets
Use of digital gadgets Arts Average Science AverageYes 55 64.42 42 63.99No 133 66.14 48 74.32
Total 188 64.93 90 68.82‘t' statistics 0.79 4.09* -1.75***
Source: Primary dataNotes: * implies 1 per cent level of significant
Chapters.indd 74 10/13/2016 2:58:30 PM

75Factors Affecting Academic Performance of the Girl Students ...
significant. This result might be due to the misuse/or the lack of capacity to use it for academic purposes by the students.
Regular school attendance of the students is expected to help students to grab in-depth knowledge about their subjects and thereby improve their academic performance. In our study areas, school attendance does not make any significant differences in achieving academic performances in both the stream. However, in the arts stream, performance of the students having regular school attendance, performed poorly as compared to the students who did not attend the school regularly whereas, the situation is reversed for the science stream.
The above analysis shows how different socio-economic and institutional factors are associated with the academic performance of the students. But the magnitude of these differences cannot be assessed with above analysis. The magnitude of different factors affecting academic performance of the students is
analysed with the help of multi-variable regression model. To avoid the problem of multi co-linearity we used two different models for arts stream, science stream and the combined group.
In the first model we considered the poverty status (PSTATUS, value ‘1’ is assigned to the APL students and ‘0’otherwise), Caste (CASTE, value ‘1’ is assigned to the general category students and ‘0’ for otherwise), Religion (RELIGION, value ‘1’ is assigned to the Hindu students and ‘0’ for otherwise), Presence of minor children in the family (CHILDREN, value ‘1’ is assigned to the student whose family have minor children and ‘0’ for otherwise) and where they stayed during their in XII standard (RESIDENCE, value ‘1’ is assigned to the students who stayed home and ‘0’otherwise). The other model consists of five variables, namely, Education of the mother (M_EDUCATION , the variable is measured in terms of years of schooling), number of private tutor taught them (P_TUTOR), distance of the school from their residence
Table 11Academic Performance and School Attendance of the Students
Regular AttendanceNumber of students in
ArtsAverage
Number of students in
ScienceAverage
Yes 167 64.49 72 69.74No 21 68.37 18 65.13Total 188 64.93 90 68.82‘t' statistics 1.23 -1.35
Source: Primary data
Chapters.indd 75 10/13/2016 2:58:31 PM

76 Journal of Indian Education February 2016
(measured in terms of kilometer), usage of digital gadgets like mobile, internet etc (D_GADGET, value ‘1’ is assigned to the students who use these and ‘0’ otherwise, regular attendance (R_ATTENDENCE, value ‘1’ is assigned to those students who regularly attend class and ‘0’ for otherwise).
rEsults of thE rEgrEssioN modEls The results of the regression models are presented in Table 12, Table 13 and Table 14. For students of arts stream and combined group, it is found that the students of better-off families are more likely to receive better academic score in their XII grade. This variable is turned to be significant (Model I of Table 12). However, for students of science stream, the effect of this
variable is negative but does not have any significant effects on academic performance of the students (Model I of Table 13).
As regards to caste, students hailed from the socially backward section of the society are more likely to achieve better academic score in their XII grade, for both the students of science, arts stream and combined group, though the effects of this variable are not significant in all the three cases. Students belonging to the Hindu communities performed well if they choose the arts stream. However, for science stream, the non-Hindu students performed better than the Hindu students. In both cases, this variable turned to be insignificant.
Presence of other children of age group of 0-15 years in the family has a positive effect on academic performance of the students of both
Table 12
Result for Regression Models for Arts Stream
Model-I Model-IIVariables Co-efficient Standard t Variables Co-efficient Standard t
PSTATUS 5.90 2.17 2.72* M_EDUCATION 0.30 0.28 1.08CASTE -0.34 2.23 -0.15 P_TUTOR 2.79 0.54 5.16*RELIGION 2.93 3.24 0.93 DISTANCE 0.02 0.10 0.19CHILDREN 3.52 2.00 1.75** D_GADGET -1.90 2.05 -0.93RESIDENCE 3.07 2.78 1.10 R_ ATTENDANCE -2.37 2.95 -0.80Constant 53.63 4.69 11.43* Constant 56.94 3.81 14.95*No of observation 188 No of observation 188
R2 0.07 R2 0.18F (5, 182) 2.71** F(5, 282) 8.15*
Sources: Primary dataNote: * and ** imply 1 per cent and 5 per cent level of significance
Chapters.indd 76 10/13/2016 2:58:31 PM
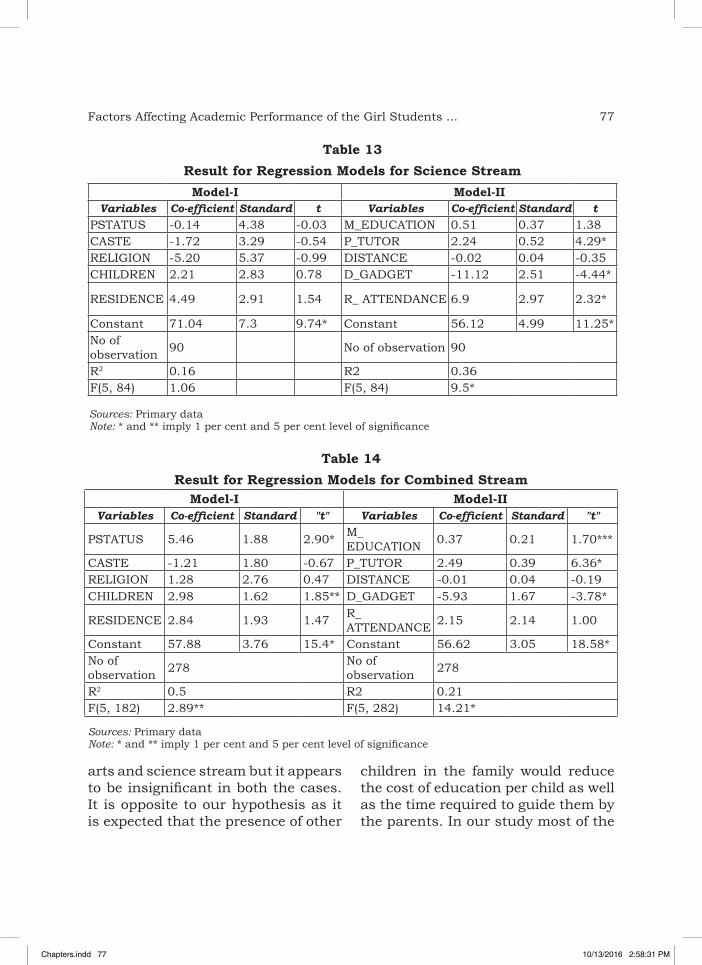
77Factors Affecting Academic Performance of the Girl Students ...
arts and science stream but it appears to be insignificant in both the cases. It is opposite to our hypothesis as it is expected that the presence of other
children in the family would reduce the cost of education per child as well as the time required to guide them by the parents. In our study most of the
Table 13Result for Regression Models for Science Stream
Model-I Model-IIVariables Co-efficient Standard t Variables Co-efficient Standard t
PSTATUS -0.14 4.38 -0.03 M_EDUCATION 0.51 0.37 1.38CASTE -1.72 3.29 -0.54 P_TUTOR 2.24 0.52 4.29*RELIGION -5.20 5.37 -0.99 DISTANCE -0.02 0.04 -0.35CHILDREN 2.21 2.83 0.78 D_GADGET -11.12 2.51 -4.44*
RESIDENCE 4.49 2.91 1.54 R_ ATTENDANCE 6.9 2.97 2.32*
Constant 71.04 7.3 9.74* Constant 56.12 4.99 11.25*No of observation 90 No of observation 90
R2 0.16 R2 0.36F(5, 84) 1.06 F(5, 84) 9.5*
Sources: Primary dataNote: * and ** imply 1 per cent and 5 per cent level of significance
Table 14Result for Regression Models for Combined Stream
Model-I Model-IIVariables Co-efficient Standard "t" Variables Co-efficient Standard "t"
PSTATUS 5.46 1.88 2.90* M_EDUCATION 0.37 0.21 1.70***
CASTE -1.21 1.80 -0.67 P_TUTOR 2.49 0.39 6.36*RELIGION 1.28 2.76 0.47 DISTANCE -0.01 0.04 -0.19CHILDREN 2.98 1.62 1.85** D_GADGET -5.93 1.67 -3.78*
RESIDENCE 2.84 1.93 1.47 R_ ATTENDANCE 2.15 2.14 1.00
Constant 57.88 3.76 15.4* Constant 56.62 3.05 18.58*No of observation 278 No of
observation 278
R2 0.5 R2 0.21F(5, 182) 2.89** F(5, 282) 14.21*
Sources: Primary dataNote: * and ** imply 1 per cent and 5 per cent level of significance
Chapters.indd 77 10/13/2016 2:58:31 PM

78 Journal of Indian Education February 2016
families have either no children or one children besides the respondents and this might be contributed to this positive association between the academic performance of the students and the number of children presence in their families.2
Another factor that affects the academic performance of the students of both the arts and science stream is the students’ residence i.e. where they stay. In our study, it is found that the students who stayed home are more likely to perform better in their academic scores. Family environment as well as parent’s guidance etc. might contribute to achieve better scores. Though, the effect of this variable is turned to be insignificant.
In this analysis, for Model-I, the co-efficient of determination (R2 value) is 0.07 for the Arts stream and 0.16 for the science stream, which means 7 per cent and 16 per cent of the total variation of academic performance of the arts and science students respectively can be explained by the above said variables. The illustrative R2 values highlight very weak linear reliability between academic performance of the students and these socio-economic variables and family structures.
We also run another sets of regression model separately for arts, science and combined group. In this analysis, we have considered five variables, namely, education of the mother, number of private tutor taught them, distance of the school
from their residence, usage of digital gadgets like mobile, internet etc. and regular attendance.
Mothers’ education which is measured in terms of years of schooling of mother is positively associated with the academic performance of the students and it turned to be statistically significant for the combined group. The effect of this variable is higher for the students of the science stream than the arts stream. Higher educated mother might be more capable to guide their daughter, which in turn, helps to achieve better academic scores.
In our study areas, the prevalence of private tutor for guiding students is a very common phenomenon. Number of teachers has been considered as a variable to explain the differences in academic scores of the students. The result shows that the students taking help from private tutor are more likely to perform better in their XII grade. Taking help from one private tutor would help to get higher marks by nearly three percentage points for the arts students and the nearly 2 percentage points for the science students. It is also found from the results that this variable significantly affects the academic performance of the students as revealed by the value of the ‘t’ statistics.
Distance of the academic institution from the residence of the students is appeared to be negatively associated for the students of the arts stream and the combined group, however for arts students, this association is found to be negative.
Chapters.indd 78 10/13/2016 2:58:31 PM

79Factors Affecting Academic Performance of the Girl Students ...
In all the cases, this variable does not have any significant effect on academic performance of the student.
The access to digital gadgets like mobile, internet etc. is expected to enhance the students’ accessibility of the information, which in turn helps them to achieve better academic scores. In our study area, the result does not support this argument. The access to digital techniques reduces the academic scores of the science students by more than 11 percentage points and for combined group the corresponding figure is nearly 6 percentage points. In both the cases this association turned to be statistically significant, whereas for arts students this association turned to be insignificant.
Regular attendance in the class by the students is used in this study as a variable to explain the differences in academic scores. It affects the academic performance of the students in two ways. Quality of teaching in the school, students’ motivation to attend class etc. could be reflected by this variable. More value the students attach in schooling, the more will be their attendance and vice versa. However, this value attachment is argued to be associated with quality teaching. High quality teaching is expected to motivate the students to attend the class regularly and thereby affects their academic performance. In our study, regular attendance of the students is positively and significantly associated with the academic performance of the science
students. For arts students, this relationship is found to be negative and insignificant. For science stream, students’ lab-based practical assignment might lead to their higher attendance in the school which led to the higher academic scores.
The above said five factors explained 18 per cent of total variations of the academic performance of the arts students, whereas for science students, these variables explain 36 per cent of total variations. For combined group, the corresponding figure is found to be 21 per cent. The values of ‘F’ statistics indicate the overall significance of the Models for the entire three respective groups.
coNclusioN
The importance of academic performance at each education level is well recognised by the researchers as it help the people to achieve various positive outcome what they value. However it is well recognised that the academic performance of the students at various education levels are influenced by various social, economic, institutional and cultural factors. In India, NCERT and ASER (Annual Status of Education Report) regularly publish the reports regarding the academic performance of the students of Grade-III and Grade-VIII where the concerned agencies formulated the tools for performance tests. But the report regarding the academic performance of the students of the XII grade, who appeared in the examination
Chapters.indd 79 10/13/2016 2:58:31 PM

80 Journal of Indian Education February 2016
under the same education Board, is hardly assessed. Moreover, most of the study deals with the gender gap in academic performance, but the variations in academic performance among the students of same gender are rarely documented. In this context, this study aims to give some insights about the factors influencing academic performance of the girl students of their XII Grade.
To study the above objective we have collected the data from the students of East and West Midnapore district in West Bengal who passed their XII grade examination in 2013 and now studied in 1st year under graduate course. They appeared in the examination under the same board and in the same year. We have collected data from 278 students, out of which 188 from Arts stream and remaining from science stream. Information regarding their social, cultural, economic status, education level of parents, distance of residence from school, uses of technology etc. has collected to explain the variability of academic performance of the students. Percentages, correlation coefficient ‘t’ test for differences in mean have been used to analyse the above said objectives. Apart from this, we have used the multi-variable regression model to analyse the effects of a particular factor on academic performance of the girl students.
Regarding the socio-economic status of the students, the study reveals that most of the students
belong to APL families, general caste category and Hindu family. Regarding household level characters, most of the students belong to medium size families and where presence of minor children is less. As regards parents education, maximum parents jointly have schooling more than 20 years and above, whereas the mothers of the students, especially in arts stream is X standard and below.
Many past scholars have argued that some person specific characteristics as well as their households’ characteristics affect the academic performance of the students. To analyse the factors affecting the students’ academic performance in our study areas, which is measured in terms of percentage of marks they received in their examination of XII grade, we estimated some multi-variable regression models. The individual as well as family characteristics of the respondents namely, poverty status, caste, religion, presence of children belonging to age group 0-15 years old, whether the students stays at home or not, education level of the mother, number of private tutors taught them, distance of their residence from school, uses of technology, regular attendance in the school are used as explanatory variables in this analysis. Our main finding from the regression exercises for the combined group is that the students who belong to APL families, who are Hindus, who stayed at home, who have minor children in their
Chapters.indd 80 10/13/2016 2:58:31 PM

81Factors Affecting Academic Performance of the Girl Students ...
families are more likely to perform better in their examination of XII grade. Moreover, daughter of higher educated women, no of private tutor, regular attendance also positively affects the academic performance of the students. Moreover, women of socially disadvantaged group and who uses the technology are less likely to achieve better academic scores in their XII grade. Among these, poverty status, presence of minor children, mother’s education level, number of private tutor, uses of technology turned to be statistically significant. The effects of above such variables on academic performance of the girl students vary across different streams. Stream-wise analysis reveals that, number of private tutor positively affects the academic performance of the students of both the stream.
Whereas, regular attendance in the school positively and significantly affects the academic performance of the students of the science stream only, not the academic performance of the students of the arts stream.
Policy PrEscriPtioN
Further research is needed to explore the students’ high dependence on private tutors for their academic achievement. It might be due to the poor quality of teaching, higher student strength in a class or students’ attitude to follow short cut policy to achieve better score rather than to gather knowledge. Further study of effects of academic performance on future achievements might be explaining the students’ attitude towards acquiring knowledge.
Endnotes1. This cannot be interpreted as lack of efficiency of the teachers of academic institutions as in maximum cases teachers are involved in private coaching. Analysis of other factors like high student strength in a class, involvement in mid-day meal preparation, casual attitude of the teacher and the perception of the parents towards teaching practices in the academic institution may offer some insights on this high dependence on private tutor.2. In our study area, we find a negative relationship between the family size and the academic performance of the students (r = -.04 for the Arts stream and r =.06 for the science students.
Chapters.indd 81 10/13/2016 2:58:31 PM

82 Journal of Indian Education February 2016
rEfErENcEs
adewaLe, a.m. 2002. ‘Implication of parasitic infections on school performance among school-age children’. Ilorin Journal of science education. Vol. 2pp. 78-81.
BaSt, janwiLLem, reitSma, P. 1998. ‘Analyzing the development of individual differences in terms of Matthew effects in reading: Results from a Dutch longitudinal study’. Developmental Psychology. Vol 34(6). 1373-1399.
eZe, o.m. 2002. ‘The effects of parental economic status and pupil sex on school achievement in English language’, Journal of vocational and Technical Education in Nigeria. A.B.U. Zaria. Vol. 3(3)
guerin, n. , a. Reinberg, F. Testu, S. BouLenguieZ, m. meChKouri and y. touitou. 2001. Role of School schedule, age and parental socio-economic status on sleep duration and sleepiness of Parisian children. Chronobio. Int. 2001; 18(6): 1005-17.
merton, r. K. 1973. The Matthew effect in science in N. W. Storer (Ed.), The sociology of science: Theoretical and empirical investigations (pp. 439–459).Chicago: University of Chicago Press.
nCert. 2014. National Achievement Survey, Educational Survey Division, New Delhi, India.
omoegun, m. 2007.‘Effect of parental socio–economic status on parental care and social adjustment in the UBE programme in Lagos State: Implication for counseling’, International Journal of Educational Research. Vol. 3(2) 2007 pp.81 – 87.
oni a.a. 2007. ‘Socio – economic status as predictor of deviant behaviours among Nigeria Secondary School Students’. International Journal of Educational Research. Vol. 3(2) 2007 pp. 225-236.
Smith, L. Fagan, j.F and UIvund, S.E . 2002. ‘The relation of cognition memory in infancy and parental socio–economic status to later I intellectual competence’, Intelligence, 30, 247-259.
todaro, m. P. 1977. Economic Development in the Third World. Orient Longman.
Chapters.indd 82 10/13/2016 2:58:31 PM

Learning Achievement in Mathematics and Hindi Language in Municipal
Corporation Schools of DelhiraShmi diwan *
AbstractThe research paper is an outcome of an exploratory study to assess learning levels of children in Mathematics and Hindi as a language in Municipal Corporation schools of Delhi. The two tests were administered on 1668 pupils of Grades II, III and IV across 16 corporation schools in the West District of Delhi. The study brings out evidences to show that in almost all corporation schools, 95 per cent pupils in Grades II, III and IV obtained a percentage between 43.85 and 68.43 in Mathematics. Overall Grade IV pupils in all schools needed improvement as the average performance came to 46.72 per cent with 95 per cent scoring between 43.40 per cent and 50.05 per cent. The school and grade wise analysis in Hindi language test reveals that the learners in Grades II, III and IV performed well in Hindi. The study found girls to be showing better performance than boys in both the subjects. The study also revealed that performance of pupils is largely dependent on family size and occupation of parents than the distance travelled to school. Few schools showing low performance in both or a single subject were also identified. The recommendations in the paper centre on building enabling conditions in primary schools to facilitate improved performance of pupils.
* Professor and Head, National Centre for School Leadership, National University of Educational Planning and Administration, 17-B, Sri Aurobindo Marg, New Delhi110016.
Chapters.indd 83 10/13/2016 2:58:31 PM

84 Journal of Indian Education February 2016
iNtroductioN
A large quantum of research produced in the western world largely centers around standards and benchmarking student performance. Most empirical studies in India focus on determinants of learning achievement in measurable terms relating to school, student and family background characteristics. The research base on determinants of learning spans a broad range of content grade levels and research methodologies. Indian concern are high about incidences of silent exclusion or children who are in school, but do not learn enough. But there are no concerted efforts of research to understand the dynamics of school, push out factors or children and family characteristics, the pull- out factors that have led to such situations.
Overall the studies indicate to the poor learning levels in Mathematics and languages at primary stages, though the research base spans a broad range of content, grade levels and methodologies. This study gives an insight into the achievement levels of learners in Mathematics and Hindi as a language in Municipal Corporation schools in urban Delhi, the capital of India.
rElatEd studiEs
Substantial studies in India have been focusing on instruction, curriculum, textbook analysis, instructional time devoted, teaching methodology, and problem solving teaching strategies,
clarification of basic concepts and a range of factors associated with levels of learning of Mathematics education.
studiEs oN mathEmatics aNd sciENcE Despite research studies in Mathematics education over the past three decades has increased dramatically (Kilpatrick, 1992), the scope of research on learning levels of Mathematics in government schools is limited.
Husen T (1967) conducted the first International Study on Mathematics in 1967. The teachers were asked to rate the extent of student exposure to particular mathematical concepts and skills. Strong correlations were found between students ‘opportunity to learn’ (OTL) scores and mean student achievement scores in Mathematics, with high OTL scores associated with high achievement. The link between outcomes in students Mathematics and opportunity to learn was also found in subsequent international studies, such as the Second International Mathematics Study (McKnight et al., 1987) and the Third International Mathematics and Science Study (TIMSS) (Schmidt, McKnight & Raizen, 1997). There is also a positive relationship between total time allocated to Mathematics and general Mathematics achievement. Suarez et al. (1991), in a review of research on instructional time, found strong support for the link between allocated instructional time and student performance. A
Chapters.indd 84 10/13/2016 2:58:32 PM

85Learning Achievement in Mathematics and Hindi Language...
set of studies have shown that the extent of the students’ opportunity to learn Mathematics content bears directly and decisively on students’ Mathematics achievement. If the teachers allocate sufficient time for Mathematics instruction at every grade level, student attainment goes up. Short class periods in Mathematics say for 35-40 minutes being implemented generally hardly leave impact. Studies by Grouws and Cabula (UNESCO, 2000) also suggest that textbooks address little new content each year, and therefore, should be avoided, or their use should be heavily supplemented in appropriate ways. Teachers should not use textbooks as a single instructional tool. Internationally, Keeves (1976) in his paper “Curriculum factors influencing school learning”, found a significant relationship across Australian States between achievement in Mathematics and total curriculum time spent on Mathematics.
The studies by Brownwell (1945) have consistently emphasized on meaningful teaching as having positive effects on student learning, specifically in high-poverty areas. Few research studies have also drawn inferences to show that learners can learn both concepts and skills by solving problems. Heid’s research (1988) showed that the procedural skills taught to learners through conceptual understanding significantly outperformed those taught through a traditional approach.
Mack (1990) demonstrated that learners’ rote (and frequently faulty) knowledge often interfered with their informal (and usually correct) knowledge about fractions. She successfully used learners’ informal knowledge to help them understand symbols for fractions and develop algorithms for operations.
Fawcett’s research as early as in 1938 with geometry learners suggests that learners can learn basic concepts, skills and the structure of geometry through problem-solving. In the classrooms, researches point out that there is evidence that students can learn new skills and concepts while they are working out solutions to problems.
Qualitative investigations have shown that other important and often unmeasured outcomes beyond improved general achievement can result from small group work. In one such investigation in 1991, Yackel, Cobb and Wood studied a small group of second-grade pupils to examine problem solving strategies in Mathematics. They reported that small-group problem solving followed by whole-class discussion was the primary instructional strategy for the entire school year. They found that this approach created many learning opportunities that do not typically occur in traditional classrooms, including opportunities for collaborative dialogue and resolution of conflicting points of view. Slavin’s research (1990) showed positive effects of small group work
Chapters.indd 85 10/13/2016 2:58:32 PM

86 Journal of Indian Education February 2016
on cross-ethnic relations and student attitudes towards school.
Another set of studies indicate that whole-class constructive discussion on each other’s ideas and reasoning, following individual and group work, leads to improvement in student achievements when carefully managed by the teacher. Wood (1999) found that it works best when discussion expectations are clearly understood. Learning enhances as the arrangement becomes more like a collaborative problem-solving exercise by working together to resolve differences in thinking or confusions in reasoning.
Teaching Mathematics with a focus on number sense encourages learners to become problem solvers in a wide variety of situations, and to view Mathematics as a discipline in which thinking is important. Markovits and Sowder (1994) studied seventh-grade classrooms to understand number sense in Grade VII where special units on number magnitude, mental computation and computational estimation were taught. They determined that after this special instruction, learners were more likely to use strategies that reflected sound number sense, and that this was a long-lasting change.
Cobb and other associated researchers (1991) developed a variety of strategies to involve students of Grade II as problem solvers to a wide range of problems, with a focus on number sense. It was found that the treatment group demonstrated
a greater autonomy, conceptual understanding of place value, and ability to do estimation and mental computation, than did students in comparison classrooms.
Studies on Mathematics education and languages are limited in Indian school contexts. A set of studies indicate differences in types of schools that influence learning levels of children in different subjects. Empirical evidences show that schools under different managements, government, and private-aided or private-unaided are significant predictors of educational outcomes. Khadi and Sunitha (2006) refer to the study of Kundu (1977) quite often which revealed that home learning environment, school learning environment and academic outcomes are influenced by socio-economic status and cultural patterns of the family. Parents have become the most potent force in shaping the overall personality of children in such studies. Looking at different social strata, Dreze and Kingdon (2001), Aggarwal (2000) and Filmer et al. (1997) have found that boys and children belonging to the upper castes perform better.
Studies focusing on learning achievement levels in mother tongue, mostly in Hindi are limited to Indian school contexts. One such study by Shukla (1974) on achievement levels of Indian students in mother tongue, Hindi and Science, brings to the fore that privileged children in private high fee charging institutions did
Chapters.indd 86 10/13/2016 2:58:32 PM

87Learning Achievement in Mathematics and Hindi Language...
better in both Hindi and Science, than the regular Indian International Association for Evaluation of Educational Achievement. Sample, Yadav and Mandal quote the work of Srivastava et al. (1986) on the comparative aspect of mother tongue and English as medium on subjects of study and attainment of learners longitudinally. The study concludes that among the different factors responsible for better achievement, English medium improves mother tongue too because of better teaching methods, materials in English and media the students are exposed to.
Anand (1985) indicated that it was the quality of instruction which accounted for spelling errors by Class V students of Hindi medium schools of Delhi. The study revealed that the largest number of mistakes were made in the use of matras due to inadequate mastery of the most basic tasks in the process of spelling, the sound-letter associations required for correct spelling and the absence of oral-aural-visual and motor experience. Goyal (2007), in the survey conducted on approximately 6000 students in 200 schools in three tests – two language tests (Reading Comprehension and Word Meaning) and one test in Mathematics in Grades IV and V of government private-aided and private-unaided schools in Orissa showed that overall learning levels were low absolutely and relatively in government schools. The average percentage of correct scores in government schools ranged
from 30 to 40 percentage points, half or a third below the average scores in private-unaided schools.
The study of Tooley Dixon (2005) draws a comparative picture on pupil outcomes in primary government and private schools using tests in English and Mathematics. The results showed that children in unrecognized private schools on an average scored 72 per cent higher in Mathematics, 83 per cent higher in Hindi and 246 per cent higher in English than government school students. Wessels (2011) compared and analyzed examination results of Grades V and VII in recognized and unrecognized schools of Punjab in 2005. The study revealed significant differences in learning levels of private-unaided school children, who had excelled private- aided school children. Kingdon (2007) examined 902 students of Grade VIII in 30 schools from government, private-aided and private-unaided schools in urban Lucknow. The results revealed that private-unaided schools scored almost twice as high as the government and private-aided schools in both Mathematics and reading. With scores additionally corrected to account for social and personal factors, private-unaided schools still triumphed with a 27 per cent higher teaching success rate in Mathematics than government and private-aided schools.
thE PrEsENt study The present study attempts to examine achievements in Hindi, the mother
Chapters.indd 87 10/13/2016 2:58:32 PM

88 Journal of Indian Education February 2016
tongue of most children in Delhi, and Mathematics for Grades III, IV and V in the Municipal Corporation schools of Delhi.
These children belong to low income families; most of them are first generation learners and whose parents work as vendors or domestic help in houses or shops (Diwan,1995). The parents do not have high aspirations for their children, but do value minimum education for them.
Description and Administration of TestsTwo sets of tests, Hindi Language and Mathematics were developed by the investigator for Grades II, III and IV in Municipal Corporation schools of Delhi. The validity of the tests were assessed by organizing a one-day workshop for select group of Municipal Corporation schools in June, 2011. The description of test items grade-wise in each of the tests is as follows:
Two sets of schools were taken as the unit of study. The sets of schools, on the basis of proximity, were divided into two Sites. Site 1 consisted of three schools and Site 2 of 13 schools.
Table 1Number of items in Hindi Language
and Mathematics Test
Stream Grade II
Grade III
Grade IV
Hindi Language Test 9 8 9
Mathematics Test 16 14 15
The details of administration of the two tests on the number of pupils in Grades II, III and IV are as follows:
PrEsENtatioN of data aNd iNtErPrEtatioN
The study presents a comparative performance between schools and grades, and the interactions between schools and grades using the Analysis of Variance technique, besides studying the average level of performance using means and percentages. The related confidence interval of per cent performance was obtained school and grade-wise and also interactions between the two. Correlation of performance in Mathematics and Hindi with factors like gender, number of family members (NOFM), distance from
Table 2Total Scores in Hindi Language and
Mathematics Test
Stream Grade II
Grade III
Grade IV
Hindi Language Test 9 8 9
Mathematics/ Numerical Ability Test
16 14 15
Table 3Administration of Two Tests
Stream Grade II
Grade III
Grade IV
Site 1 84 104 124
Site II 424 457 475
Total 508 561 599
Chapters.indd 88 10/13/2016 2:58:32 PM

89Learning Achievement in Mathematics and Hindi Language...
school (DIST) and parents occupation (OCCUP) were examined. A regression model, depicting linear relationship between performance as dependent variable and gender, number of family members, distance from school and parents occupation as independent variables was also obtained. A graphical display of performance is also shown.
Learning Achievement in Mathematics in Site 1 Schools In order to test the significance of difference among schools and grades in Site 1 schools, ANOVA
reveals significant difference in the performance of Mathematics between three Site 1 schools and also between Grades II, III and IV.
Examining school and grade-wise mean per cent performance and 95 per cent confidence intervals, the school that has shown poorest performance has achieved average per cent marks of 0.3482 (34.82%), 0.4827 (48.27%), 0.5432 (54.32%) in Grade IV, Grade III , Grade II, respectively, and 95 per cent of its learners of Grade IV scoring between 28.97 per cent and 40.67 per cent in Mathematics. The learners of other schools in Site 1
Graph 1: School-wise and Grade-wise Comparative Performance in Mathematics in SITE 1
Chapters.indd 89 10/13/2016 2:58:33 PM

90 Journal of Indian Education February 2016
have performed better with average per cent performance of 60.17 – 61.61 for Grade II, 51.69- 62.22 for Grade III and 49.48 – 55.86 for Grade IV. 95 per cent of the students in Grades II, III and IV have obtained a percentage between 43.85 and 68.43 in Mathematics, except one poor school wherein performance is much below the required standards. School wise analysis also reveals that overall this school is a borderline case in Mathematics as pupils have secured 45.80 per cent on the average and 95 per cent of them have scored between 41.96 per cent and 49.65 per cent. The other two schools are performing satisfactorily with an average score more than 56 per cent with 95 per cent of learners scoring between percentages 52.92 and 61.10 in Mathematics.
The grade-wise analysis reveals that students in general need improvement in Mathematics as the average performance of Grade IV students is 46.72 per cent with 95 per cent scoring between 43.40 per cent and 50.05 per cent. Overall Grade II and III students have performed better with 58.70 per cent and 54.08
per cent, respectively. 95 per cent of learners of Grade II have scored between 54.58 per cent and 62.81 per cent, while 95 per cent learners of Grade III have scored between 50.44 per cent and 57.77 per cent.
(ii) Learning Achievement in Hindi Language in Site 1 The analysis of variance proves that there is a highly significant difference in performance in Hindi language between the grade interactions, and also among schools. The school and grade-wise analysis reveal average per cent score or schools in all grades between 47.79 per cent and 74.90 per cent, with 95 per cent learners scoring between 43.83 per cent and 79.76 per cent.
An overall grade-wise analysis of schools reveals the performance in Hindi as satisfactory as the average performance for all grades between 50.68 per cent and 59.03 per cent. Moreover, confidence intervals shows that 95 per cent of the learners have scored between 47.62 per cent and 62.49 per cent in Hindi which is also quite satisfactory. The overall
Table 4Differences in the Performance in Mathematics in Site 1
SS Degree of Freedom MS F pIntercept 84.51091 1 84.51091 2390.403 0.000000
School 0.78098 2 0.39049 11.045 0.000023
Grade 0.74873 2 0.37437 10.589 0.000036
School*Grade 0.45120 4 0.11280 3.191 0.013746
Error 10.71234 303 0.03535
Chapters.indd 90 10/13/2016 2:58:33 PM

91Learning Achievement in Mathematics and Hindi Language...
school-wise performance in Hindi shows satisfactory performance as the average scores for all the schools is above 50.94 per cent. Moreover 95 per cent of the learners in these
Graph 2: School and Grade-wise Comparative Performance in Hindi in Site 1
Table 5Differences in Performance in Hindi Language in Site 1
SS Degree of Freedom MS F pIntercept 93.77552 1 93.77552 3753.421 0.000000
School 0.97397 2 0.48699 19.492 0.000000
Grade 0.43197 2 0.21598 8.645 0.000223
School*Grade 0.88153 4 0.22038 8.821 0.000001
Error 7.57016 303 0.02498
schools are scoring between 47.77 per cent and 66.64 per cent in Hindi.
The family size does matter in the performance of learners. The table highlights a significant
Chapters.indd 91 10/13/2016 2:58:33 PM

92 Journal of Indian Education February 2016
positive correlation between number of family members and performance in Mathematics and Hindi language. On the other hand, a significant negative correlation was seen between the number of family members and distance travelled to school. Therefore, it may be interpreted that distance travelled to school does not matter, but large families do. Rest of the correlations was insignificant or unimportant.
Gender appears to be the most dominant factor to show differences in performance of boys and girls in
Site 1. The table shows that girls have performed better than boys in Mathematics. Through regression analysis, it may be interpreted that looking at other factors, there is no significant impact of number of family members, distance from school and occupation of parents on performance in Mathematics, but performance depended more on gender, where girls have excelled boys.
The table highlights that all factors - gender, number of family members, and the distance travelled
Table 6Significance of Correlation between Number of Family Members and
Distance Travelled to School in Site 1
Correlations in Site 1 Schools Marked correlations are significant at p<.05000, N=303NOFM DIST Grade Math P1 Hindi P2
No. of Family Members (NOFM) 1.00 -0.37 0.47 0.15 0.28
Distance travelled to school -0.37 1.00 -0.43 0.05 0.17
Grade 0.47 -0.43 1.00 -0.24 -0.01
Math P1 0.15 0.05 -0.24 1.00 0.46
Hindi P2 0.28 0.17 -0.01 0.46 1.00
Table 7Factors Affecting Performance in Mathematics in Site 1
Regression Summary for Dependent Variable: MathematicsBeta Std. Error. B Std. Error t (298) p-level
Intercept 13.32969 3.331743 4.00082 0.000080
Gender -0.320573 0.072086 -0.14048 0.031590 -4.44710 0.000012
NOFM 0.085083 0.064072 0.00680 0.005122 1.32793 0.185219Distance travelled to school
0.089426 0.061249 0.01120 0.007669 1.46003 0.145334
Occupation 0.126005 0.070090 0.00221 0.001227 1.79777 0.073226
Chapters.indd 92 10/13/2016 2:58:34 PM

93Learning Achievement in Mathematics and Hindi Language...
Table 8Factors Affecting Performance in Hindi Language in Site 1
Regression Summary for Dependent Variable: HindiBeta Std. Error B Std. Error t(298) p-level
Intercept 3.087815 2.817210 1.09605 0.273940
Gender -0.158681 0.068542 -0.061840 0.026712 -2.31510 0.021286
NOFM 0.346944 0.060922 0.024664 0.004331 5.69492 0.000000Distance travelled to school
0.306262 0.058238 0.034103 0.006485 5.25882 0.000000
Occupation 0.067233 0.066644 0.001047 0.001037 1.00884 0.313869
Graph 3: School-wise and Grade-wise Comparative Performance in Mathematics in Site 2
Chapters.indd 93 10/13/2016 2:58:34 PM

94 Journal of Indian Education February 2016
to school does make a difference in the performance in Hindi. The regression analysis through all the variables shows significant dependence of gender, number of family members and distance from school on Hindi performance. One common strong finding seen in both the tables is that girls are performing better in Hindi and Mathematics, irrespective of all other factors that may affect performance of both boys and girls.
(iii) Learning Achievement in Mathematics in Site 2 Schools There exists a significant difference in the performance of students in Mathematics in thirteen schools of Site 2. ANOVA performed to test the significance of difference in the performance in Mathematics between schools and grades II, III and IV, and interaction between the two proves that there is a significant difference in the performance (p =0.00) between schools and between grades (p= 0.00) and between schools and Grade interaction ( p=0.00) in the same Site. The analysis of school and grade-wise
mean per cent performance and 95 per cent confidence interval suggests the average score of low performing schools as significantly below 40 per cent , wherein 95 per cent of the learners score between 26.76 per cent and 44.04 per cent. Other students of these schools perform satisfactorily with students of Grade II in one school that tops the list with average performance score of 77.60 per cent in Mathematics.
For overall performance in Mathematics, the border line school shows average score for all the grades as 40.99 per cent and 95 per cent of its learners who have secured a percentage between 37.69 and 44.29. Other schools still show a better performance with scoring at least 43.84 per cent in Mathematics. The school that has shown the best performance shows overall average of 63.21 per cent.
Overall performance of all grades seems satisfactory with Grade IV learners (44.96%) performing poorer than Grade II (55.81%) and Grade III (62.05%) under study. Moreover,
Table 9Differences in Performance in Mathematics in Site 2 Schools
SS Degree of freedom MS F PIntercept 381.4619 1 381.4619 15328.76 0.00
SCHOOL 7.8926 12 0.6577 26.43 0.00
GRADE 6.6024 2 3.3012 132.66 0.00
SCHOOL*GRADE 3.5924 24 0.1497 6.01 0.00
Error 32.6247 1311 0.0249
Chapters.indd 94 10/13/2016 2:58:34 PM

95Learning Achievement in Mathematics and Hindi Language...
95 per cent confidence interval for marks reveal best performance by Grade II students and performance dips as level of grade increased.
(iv) Hindi Language in Site 2 SchoolsA highly significant difference is seen in the achievement levels in
Graph 4: School and Grade-wise Comparative Performance in Hindi in Site 2 Schools
Table 10 Differences in Performance in Hindi in Site 2
SS Degree of Freedom MS F pIntercept 432.4563 1 432.4563 19991.26 0.00
School 5.2862 12 0.4405 20.36 0.00
Grade 3.2063 2 1.6032 74.11 0.00
School*Grade 3.8840 24 0.1618 7.48 0.00
Error 28.3599 1311 0.0216
Chapters.indd 95 10/13/2016 2:58:34 PM

96 Journal of Indian Education February 2016
Hindi in Site 2 schools. The table depicts a marked difference through ANOVA between the schools and grades and between school and grade interactions. One may also however contend from school and grade-wise mean per cent performance and 95 per cent confidence intervals that on an average, the schools are performing well in Hindi.
The low performing school in Hindi has attained the average score of 31.68 per cent, and 95 per cent of the learners have obtained between 27 and 36.36 per cent, which may be attributed as unsatisfactory. Overall performance score in better
performing schools is above 50 per cent, wherein 95 per cent of the learners are scoring between 50 per cent and 60 per cent in Hindi.
The grade-wise comparison in the performance in Hindi for all the schools in Site 2 shows a good performance on an average, scoring more than 50 per cent and 95 per cent learners obtaining between 49.34 per cent and 63.51 per cent.
An examination of the correlation of performance with number of family members, distance from schools, occupation depicted in Table 11 shows a significant positive correlation (0.42) between
Table 11Comparison of Performance with other correlates in Site 2
Marked correlations are significant at p < .05000 N=1342 (Case-wise deletion of missing data)
NOFM DFS OCCUP Math M Hindi MNOFM 1.00 0.07 0.02 -0.05 -0.02Distance from school 0.07 1.00 0.02 -0.15 -0.04
Occupation 0.02 0.02 1.00 0.02 -0.07
Mathematics -0.05 -0.15 0.02 1.00 0.42
Hindi -0.02 -0.04 -0.07 0.42 1.00
Table 12Factors Affecting Performance in Mathematics in Site 2
Regression Summary for Dependent Variable: MathematicsBeta Std. Error B Std. Error t (1337) p-level
Intercept 4.445110 1.151125 3.86154 0.000118
Gender -0.089653 0.029744 -0.034888 0.011575 -3.01416 0.002625
NOFM -0.071325 0.028038 -0.006623 0.002603 -2.54390 0.011074
DFS -0.143827 0.028807 -0.003527 0.000706 -4.99286 0.000001
OCCUP 0.091928 0.026685 0.000406 0.000118 3.44494 0.000589
Chapters.indd 96 10/13/2016 2:58:34 PM

97Learning Achievement in Mathematics and Hindi Language...
Mathematics and Hindi performance in Site 2 group of schools. In fact, the negative significant correlation (0.15) indicates that performance in both the subjects do not, however, get affected by distance travelled to school. Rest of the correlations were insignificant.
Table 13Factors Affecting Performance in Hindi in Site 2
Regression Summary for Dependent Variable: HindiBeta Std. Error B Std. Error t(1337) p-level
Intercept 144.3129 37.71392 3.82652 0.000136
Gender -0.099696 0.030276 -1.2487 0.37921 -3.29287 0.001018
NOFM -0.041169 0.028540 -0.1230 0.08529 -1.44253 0.149388
DFS -0.002130 0.029322 -0.0017 0.02314 -0.07262 0.942116
OCCUP -0.064806 0.027163 -0.0092 0.00386 -2.38585 0.017178
There is a significant degree of dependence of gender and occupation of parents on performance in Mathematics and Hindi. The difference in performance between boys and girl students was significant with girls performing better.
major fiNdiNgs
Site 1 Schools 1. The school showing the poorest
performance needs support for provision of remedial teaching sessions at least in Mathematics.
2. Students of Grade IV need special attention in Mathematics.
3. While school-wise and grade-wise performance in Hindi is satisfactory, there is visibly a marked difference in the overall
performance of students in Site 1 schools when compared with students in Site 2 schools.
4. Performance of children is greatly influenced by the number of members in the family, while distance travelled to school does not matter much to them.
5. The performance of girls in Mathematics was found to be much better than that of boys.
Site 2 Schools1. A significant difference in the
performance was noticed between grades and schools among the group of Site 2 schools
2. Overall, the achievement level of Grade IV has been seen to be poor as compared to Grade III.
3. The low performance in Hindi and Mathematics necessitates remedial teaching and extra time by the teacher for improving attainment levels of its students. A significant dependence of gender,
number of family members, distance from the school and occupation of
Chapters.indd 97 10/13/2016 2:58:35 PM

98 Journal of Indian Education February 2016
parents was found on the performance in Mathematics and Hindi language.
Improving Learning Achievements: Practical Tips for School PractitionersThe most current debate on how to improve learning levels has become a major concern in India. Learning achievements in Site 1 and Site 2 schools suggest that there is a need to address this vital issue seriously. The situation calls for a review of four major domains in the schools: (i) classroom interaction (ii) utilization of teaching-learning materials (TLM), (iii) curriculum transaction and (iv) creation of an environment conducive to learning. This move makes it imperative to develop an understanding on design and development of textbooks, curriculum review and quality of in-service teacher training (Sheshagiri, 2009). This raises a pertinent question: What can be done to schools and classroom processes to ensure that they perform better? Research suggests that much would depend on the professional judgment of school heads working on strategies in accordance to the teaching resources available. Therefore, it is more a question of context-specific reform strategies. The present study draws few guidelines to facilitate the teachers and school heads to chalk out workable teaching plans for improving the learning levels of children.
(i) Rethinking Mathematics Education at the Primary LevelNational Policy on Education 1986 visualizes Mathematics as the vehicle to prepare a child to think, reason, analyze and articulate logically. Apart from being a specific subject, it should be treated as a concomitant to any subject involving analysis and reasoning. The National Curriculum Framework for School Education (NCF, 2005) echoes Mathematics education to be accorded importance than any other content discipline. Mathematics education relies very heavily on the preparation that the teacher has, in her own understanding of Mathematics and the nature of pedagogic techniques in its transaction. Textbook-centered pedagogy dulls the teacher’s own Mathematics activity. Most teachers at this stage assume that they know all the Mathematics needed, and in the absence of any specific pedagogic training, simply try and uncritically reproduce the techniques they experienced in their school days. Compartmentalization of the teacher has added to another systemic flaw. There is total absence or very little communication between primary and high school teachers of Mathematics, and none at all between high school and college teachers of Mathematics. Most school teachers have never even seen, let alone interacted with or consulted, research mathematicians. Those involved in teacher education are again typically outside the realm
Chapters.indd 98 10/13/2016 2:58:35 PM

99Learning Achievement in Mathematics and Hindi Language...
of college or research Mathematics. Often this ends up with perpetuating problems of resonating Mathematics pedagogy with the findings of children’s psychology. Any curriculum for primary Mathematics must incorporate the progression from the concrete to the abstract and subsequently a need to appreciate the importance of abstraction in Mathematics. In the lowest classes, especially, it is important that activities with concrete objects form the first step in the classroom to enable the child to understand the connections between the logical functioning of their everyday lives to that of mathematical thinking. Mathematical games, puzzles and stories involving numbers are useful to enable learners to make these connections and to build upon their everyday understanding. Games and play can become a part of soliciting non-didactic teaching and feedback mechanism with a minimum amount of teacher intervention. Certainly emphasis needs to be attached to factual knowledge, procedural fluency and conceptual clarity and understanding. New knowledge is to be constructed from experiential learning and prior knowledge using conceptual elements. The core areas of concern for promotion of Mathematics education that needs immediate attention include (i) overcoming fear of failure, (ii) introducing curriculum catering to both talented and non-participating learners, (iii) more sophisticated assessment methods
beyond mechanical computation, and (iv) teacher preparation and support in the teaching of Mathematics.
(ii) Improving Classroom InstructionStudent – enhanced outcomes is completely reliant on the ability of the teacher to change conventional teaching-learning practices in classrooms. Some of the strategies for the teacher to follow are: • Take out material that is not
important for understanding certain concepts. Here, it becomes important for a teacher as articulated in NCF (2005) to sift knowledge from a large pool of information available on the internet and other sources.
• Take out words that repeat information.
• Replace a list of things with the word that describes the things in the list
• Find or invent a sentence as per capability and comprehension of children and as per the grade and age–specific understanding.
• Summarizing of teaching notes is important to help retention of concepts in Mathematics to enhance numerical abilities of learners and the content taught to them in all subjects, including Hindi language.A teacher in such an arrangement
is more likely to work as a facilitator to give maximum opportunities to learners to examine, explore and understand concepts from a variety
Chapters.indd 99 10/13/2016 2:58:35 PM
100 Journal of Indian Education February 2016
of teaching-learning materials (TLMs). During teaching sessions, a shift from teacher-led to student-talk has worked well in bringing verbal fluency and confidence among children, which in turn, has also enhanced learning among them. One of the propositions is that for every ten minutes of teacher–centered talk, there must be two minutes of student talk. Next important point to be kept in mind is that teaching that trains the mind to think creatively, reinforces the will to learn, and this is what gives positive results in return.
(iii) Building Teaching Teams Building teams of teachers teaching the same subjects in schools located in the neighborhood or the school head teacher forming school-based teams to discuss the ways of improving classroom instructions to create understanding on what works best in what situations. The team plans and shares the workable teaching strategies, content and pedagogical approaches to address diversity among students, their learning needs, potentials and interests. These teams make important contributions to school culture, learning environment and other priority issues. They meet almost every day, and concern themselves with practical ways to improve teaching and learning. The strongest possibility of improving student-learning emerges where schools implement multiple changes in the teaching and learning activities
in daily school life. There is a collective responsibility for the learning of all students by examining competencies the students are required to master, planning more effective lessons, critiquing student work, and solving the common problems of teaching. Together when these ideas are shaped, classroom instructions and the core elements for improving student learning will get reinforced. There is a need to address every aspect of the school, encompassing all grades and key subjects (primarily English, Hindi and Mathematics curricula and instructional practices) including assessment, classroom management and processes, and parental involvement that enables a child to learn.
The success stories drawn from such experiences will be a rich resource. There is also a need for recognizing the necessity of joint responsibility of school heads and systemic administrators to allow autonomy to schools for replicating successful experiments, particularly in the municipal corporation schools that have a large network in the capital.
thE fiNal Word
It is for the teacher to review the classroom routine, and adapt tactics leading to improved learning, as children are made to proceed through the beginnings and endings of syllabus. This is the stage of reflection and resolving issues to fill
Chapters.indd 100 10/13/2016 2:58:35 PM

101Learning Achievement in Mathematics and Hindi Language...
up learning gaps often found in our schools.
Maintain momentum in sustaining learning climate and bring life in schools leading to improved learning outcomes.
rEfErENcEs
aggarwaL, y. 2000. Primary Education in Delhi: How Much Do The Children Learn? NIEPA, New Delhi.
anand, v. S. 1985. A Study of the Factors that Affect the Orthography in Hindi and Diagnosis of Spelling Mistakes in the Writing of Class V Students of Hindi Medium Schools of Delhi, along with a Remedial Programme, Ph.D. Edu., SNDTU.
BrowneLL, w.a. 1945. When is arithmetic meaningful? Journal of Educational Research. Washington, DC. vol. 38. pp. 481–98.
––––––1947. The place of meaning in the teaching of arithmetic. Elementary School Journal Chicago, IL. vol. 47. pp. 256–65.
CoBB, P. yaCKeL, e. Wood,T. 1992. A constructivist alternative to the representational view of mind in Mathematics education, Journal for Research in Mathematics Education. Reston, VA. vol. 23, pp. 2–23.
CoBB, P., et aL. 1991. Assessment of a problem-centered second-grade Mathematics project, Journal for Research in Mathematics Education. (Reston, VA), vol. 22, p. 3–29.
daS, jiShnu, PriyanKa Pandey and triStan ZajonC. 2006. Learning Levels and Gaps in Pakistan. World Bank Policy Research Working Paper #4067. The World Bank. Washington D.C.
diwan, raShmi. 1995. Quality of Primary Education in Municipal Corporation Schools of Delhi, NIEPA-Financed research study. Unpublished
dreZe, jean and geeta g. Kingdon. 2001. Schooling Participation in Rural India. Review of Development Studies. 5(1), February. pp 1-24.
FawCett, h. P. 1938. The nature of proof: a description and evaluation of certain procedures used in senior high school to develop an understanding of the nature of proof. 1938 Yearbook of the National Council of Teachers of Mathematics. New York. Columbia University, Teachers College.
FiLmer, deon, King, eLiZaBeth m and Lant PritChett. 1997. ‘Gender Disparity in South Asia: Comparison Between and Within States.’ World Bank Policy Research Working Paper No. 1867. The World Bank. Washington D.C.
grouwS, dougLaS a. and CeBuLLa KriStin j. 2000. Improving student outcomes in Mathematics. Educational Practices. Series IV. UNESCO: International Academy of Education. International Bureau of Education.
goyaL, S. 2007. Learning Achievements in India: A Study of Primary Education in Rajasthan. South Asia Human Development. World Bank.
ackNoWlEdgEmENt I deeply acknowledge Prof Rahul Gupta, Head, Department of Statistics, University of Jammu for his contribution on statistical analysis carried out in this paper.
Chapters.indd 101 10/13/2016 2:58:35 PM

102 Journal of Indian Education February 2016
heid, m.K. 1988. Resequencing skills and concepts in applied calculus using the computer as a tool. Journal for Research in Mathematics Education. Reston, VA. vol. 19. pp. 3–25.
huSén, t. 1967. International study of outcomes in Mathematics. Vol. 2. New York,Wiley.Kamii, C. 1985. Young children reinvent arithmetic: Implications of Piaget’s theory.
Teachers College Press. New York.Kingdon, g. 2007. The Progress of School Education in India, Oxford Review of Economic
Policy. Vol. 23. Number 2. pp. 168-195.
––––––.1989. Young children continue to reinvent arithmetic: Implications of Piaget’s theory. Teachers College Press. New York.
––––––. 1994. Young children continue to reinvent arithmetic in 3rd grade: Implications of Piaget’s theory. Teachers College Press. New York.
KeeveS, j.P. 1976. Curriculum factors influencing school learning. Studies in Educational Evaluation. Kidlington, UK. Vol. 2. pp. 167–84.
––––––. 1994. The world of school learning: selected key findings from 35 years of IEA research. The Hague, Netherlands, International Association for the Evaluation of Educational Outcomes (IEA).
Lavy, viCtor and joShua angriSt. 1999. Using Maimonides’ Rule to Estimate the Effect of Class Size on Scholastic Achievement. Quarterly Journal of Economics. 114(2). pp. 533-575.
maCK, n.K. 1990. Learning fractions with understanding: building on informal knowledge. Journal for Research in Mathematics Education. Reston, VA. vol. 21. pp. 16–32.
marKovitS, Z.; Sowder, j. 1994. Developing number sense: an intervention study in grade 7. Journal for Research in Mathematics Education. Reston, VA. 25. pp. 4–29.
mCKnight, C.C., et aL. 1987. The Underachieving Curriculum. Champaign, IL, StipesSChmidt, w.h.; mCKnight, C.C.; raiZen, S.a. 1997. A splintered vision: an investigation
of U.S. science and Mathematics education. Kluwer Academic Publishers. Dordrecht, Netherlands.
SLavin, r.e. 1990. Student team learning in Mathematics. In:Davidson, N., ed. Cooperative learning in math: A Handbook for Teachers. pp. 69–102. Reading, MA, Addison-Wesley.
SuareZ, t.m., et aL. 1991. Enhancing effective instructional time: a review of research. Policy brief. vol. 1. No. 2. Chapel Hill, NC, North Carolina Educational Policy Research Center.
wood, t. 1999. Creating a context for argument in Mathematics class. Journal for Research in Mathematics Education. Reston, VA. vol. 30.
wood,t.; CoBB, P.;Yackel, E. 1995. Reflections on learning and teaching Mathematics in elementary school. In: Steffe, L.P.
yaCKeL, e., P. Cobb, T. Wood. 1991. Small-group interactions as a source of learning opportunities in second-grade Mathematics, Journal for Research in Mathematics . Reston, VA. vol. 22. pp. 390–408.
ShuKLa, S. 1974. Achievements of Indian Children in Mother Tongue Hindi and Science. Comparative Education Review. vol.18. No.2. June. What do children know?
Chapters.indd 102 10/13/2016 2:58:35 PM

103Learning Achievement in Mathematics and Hindi Language...
urqioLa m. 2006. Identifying Class Size Effects in Developing Countries: Evidence from Rural Bolivia. The Review of Economics and Statistics. 88(1), pp. 171-177.
govinda. r, n.V. Varghese. 1993. Quality of Primary Schooling in India: A Case Study of Madhya Pradesh. IIEP, UNESCO.
nCert. 2005. National Curriculum Framework. New Delhi
Chapters.indd 103 10/13/2016 2:58:35 PM

Personality as Predictor of Students’ Science Achievement
K. S. miSra*Stuti SrivaStava**
AbstractThe present paper is an attempt to explore science achievement in relation to personality. It was hypothesised that there is no significant relationship between science achievement and Twenty-two personality traits; personality traits do not significantly contribute to prediction of science achievement. Participants were 579 ninth grade students (289 boys and 290 girls) of Allahabad city. Self- constructed ‘science achievement test’ and ‘neo- personality questionnaire’ by K. S. Misra were used as tools for the study. The findings of the study revealed that science achievement is positively related to nine personality traits namely-self-sufficient, sociable, analytical, independent, perseverant, inquisitive, motivated, divergent and adaptable and negatively related to five personality traits-crooked, alienated, group-dependent, rest-loving and pessimist. Personality traits such as motivated, crooked, adaptable, pessimist, disturbed and dominant emerged as the best predictors of science achievement. Teachers should plan the diverse learning environment consciously, keeping in mind the development of those personality traits which positively influence science achievement and inhibition of traits which negatively influence science achievement among students.
* Professor, Department of Education, University of Allahabad- UP 211002.
** Junior Project Fellow, Tata Institute of Social Sciences, Mumbai 400088.
iNtroductioN
In high school, students plan to study science-oriented subjects
and choose science-related careers. Personality traits have an important role in facilitating academic success
Chapters.indd 104 10/13/2016 2:58:35 PM

105Personality as Predictor of Students’ Science Achievement...
in science. Previous researches have shown that high achievers were more intelligent, less excitable, tough-minded, self-reliant and realistic than low achievers in biological sciences. High achievers were more intelligent and tranquil, exhibit a high level of self-conflict, and are less excitable, undisciplined and un-frustrated than low achievers in natural science (Sonatkey, 1986). By using the international personality item pool (IPIP), Goldberg, Heaven and Ciarrochi (2012) attempted to study the relationship between achievement in science subject and big-five personality traits namely-openness to experience, conscientiousness, extroversion, agreeableness and neuroticism, and revealed that conscientiousness is one of the important predictors of achievement in science subject among high school students. According to Barton et. al. (1972), ‘being socially bold’ was found to be the predictor of performance in science as a subject. The aim of the present study is to find out the relationship between personality traits and achievement in science among secondary students. It is also attempted to examine the predictors of achievement in science.
Objectives1. To study the relationship between
IX grade students’ science achievement and personality.
2. To find out the extent to which personality traits contribute to the prediction of scientific achievement.
hyPothEsEs
The null hypotheses for the present study are as follows:1. There is no significant relationship
between science achievement and personality traits.
2. Personality traits do not significantly contribute to prediction of science achievement.These hypotheses have been
tested with reference to twenty-two personality traits namely-planned, crooked, self-sufficient, reticent, egoist, sociable, disturbed, analysis, alienated, hesitant, independent, group-dependent, perseverant, rest-loving, dominant, inquisitive, motivated, pessimist, anxious, divergent, adaptable and tolerant.
mEthod
Sample: The population of this study comprises of male and female students studying in Class IX in U.P. Board schools of Allahabad city. Ten schools (five boys and five girls) were randomly selected from different regions of Allahabad city. The researcher then randomly selected two sections of Class IX from each school. 30 students studying in each section were randomly selected for inclusion in the sample. Thus, multistage random sampling was adopted to select the sample for the present study. The sample for the present study, thus, consisted of 600 students.Tools Used: ‘Science Achievement Test (Form A)’ constructed by
Chapters.indd 105 10/13/2016 2:58:35 PM

106 Journal of Indian Education February 2016
S. Srivastava (2015) has been used to measure science achievement of students. It had 50 multiple choice questions which covered all the six chapters of the syllabus prescribed by the Madhyamik Shiksha Board. The reliability for SAT has been calculated by split-half method, and it was found to be 0.67 (N= 200) and parallel form reliability was found to be 0.59 (N= 50). Content and criterion related validity has been established.
Twenty-two personality traits namely- planned, crooked, self- sufficient, reticent, egoist, sociable, disturbed, analytical, alienated, hesitant, independent, group dependent, perseverant, rest- loving, dominant, inquisitive, motivated, pessimist, anxious, divergent, adaptable and tolerant have been measured by using ‘neo- personality questionnaire’ by K. S. Misra. All the items use a five point scale response format. A score of 5, 4, 3, 2 and 1 awarded to responses namely- ‘nearly always, mostly, many times, sometimes, nearly never’ respectively. Scores on each of the four questions belonging to each personality trait were added together to find a score for each dimension of the personality trait. Split half reliability was calculated for various personality traits. It was found to be 0.69 for planned, 0.78 for crooked, 0.48 for self- sufficient, 0.37 for reticent, 0.39 for egoist, 0.58 for sociable, 0.26 for disturbed, 0.53 for analytical, 0.51 for alienated, 0.66 for hesitant, 0.47
for independent, 0.63 for group- dependent, 0.64 for perseverant, 0.64 for rest- loving, 0.77 for dominant, 0.60 for inquisitive, 0.49 for motivated, 0.72 for pessimist, 0.52 for anxious, 0.65 for divergent, 0.27 for adaptable and 0.64 for tolerant. Factorial validity has been determined by using varimax rotated factor analysis. Percentile norms have been calculated. Product-moment correlation technique and step-wise multiple regression techniques were used for the analysis of data.
rEsults
Table 1 shows that out of twenty-two values of correlation between science achievement and various personality traits, three values are significant at .05 level and eleven values are significant at 0.01 level. It means that science achievement is positively related to nine personality traits namely- self- sufficient (= 0.134), sociable (= 0.170), analytical (= 0.095), independent (= 0.096), perseverant (= 0.121), inquisitive (= 0.202), motivated (= 0.213), divergent (= 0.149) and adaptable (= 0.204) and negatively related to five personality traits namely- crooked (= -0.183), alienated (= -0.095), group-dependent (= - 0.119), rest- loving (= -0.125) and pessimist (= -0.177) among students. Eight correlations are not significant at .05 levels. They point to existence of no relationship between science achievement and eight personality traits namely- planned, reticent, egoist, disturbed,
Chapters.indd 106 10/13/2016 2:58:35 PM

107Personality as Predictor of Students’ Science Achievement...
hesitant, dominant, anxious and tolerant.
Observation of table 2 shows that personality traits motivated, crooked,
Table 1Correlation between science achievement and various personality
traits for students
S. No. Personality Traits Science Achievement1 Planned 0.06
2 Crooked -0.183**
3 Self-sufficient 0.134**
4 Reticent -0.007
5 Egoist -0.056
6 Sociable 0.170**
7 Disturbed -0.024
8 Analytical 0.095*
9 Alienated -0.095*
10 Hesitant -0.081
11 Independent 0.096*
12 Group dependent -0.119**
13 Perseverant 0.121**
14 Rest-loving -0.125**
15 Dominant -0.071
16 Inquisitive 0.202**
17 Motivated 0.213**
18 Pessimist -0.177**
19 Anxious 0.024
20 Divergent 0.149**
21 Adaptable 0.204**
22 Tolerant -0.001
*/**significant at .05/ 0.01 level
adaptable, pessimist, disturbed and dominant emerged as the best predictors of science achievement. R² value is 0.125. It means that
Chapters.indd 107 10/13/2016 2:58:35 PM

108 Journal of Indian Education February 2016
these variables explain 12.5 % of the variance in science achievement.
Science achievement = 17.31+0.30 motivated – 0.28 crooked + 0.36 adaptable – 0.34 pessimist - 0.20 disturbed - 0.18 dominant.
discussioN
The Personality trait, ‘self-sufficient’, is positively related to science achievement among students. This reflects that the tendency to feel no need of others may promote the level of science achievement among students. The trait, ‘sociable’ is positively related to science achievement among students. This means the students’ inclination to maintain good relation with elders and friends and tendency to make socially appropriate actions increases their science achievement. Students are encouraged to follow parents’ and teachers’ direction at young age.
In this environment, students pay more attention to classroom tasks (Gilbert, 2003); consequently, more sociable students have a high level of science achievement. Findings of Barton et. al. (1972) supports
this finding. ‘Analytical’ personality trait is positively related to science achievement among students. This indicates that increase in the tendency to examine phenomena, problems, ideas or behaviours to know about them promote science achievement among students. ‘Independent’ is positively related to science achievement among students. It means that students’ tendency to be self-governed and acting or thinking on their own lines positively influence their science achievement. ‘Perseverant’ is positively related to science achievement. This means that the tendency to make constant
Table 2Results of step-wise multiple regression analysis for predicting science
achievement for students
S. No.
Independent variables
Un-standardized β coefficient Constant F-ratio R-square
1. Motivated 0.30 17.31 13.46 0.125
2. Crooked -0.28
3. Adaptable 0.36
4. Pessimist -0.34
5. Disturbed 0.20
6. Dominant -0.18
Chapters.indd 108 10/13/2016 2:58:35 PM

109Personality as Predictor of Students’ Science Achievement...
efforts to achieve something promotes science achievement. The trait ‘inquisitive’ is positively related to science achievement. This indicates that inquisitiveness is crucial in order to promote science achievement among students. It can be said that if students are curious to know about a situation or solve the problem, they can achieve high in school science. Curiosity is positively related to science achievement (Alexander, 1995) supports this finding. The personality trait, ‘motivated’ is positively related to science achievement among students. It means that highly motivated students may exhibit science achievement. Due to this high motivation, students are encouraged to learn science to develop science achievement. Motivation for learning science positively influences achievement in science (Mehna, 1986). Personality trait, ‘divergent’ is positively related to students’ science achievement. This means students’ willingness to think of many different and novel situations for problems may positively influence science achievement. Personality trait, ‘adaptable’ is positively related to science achievement. This means that students’ ability to make necessary interpersonal and intrapersonal adjustments increases the tendency to increase science achievement. This finding draws as indirect support from the finding that emotional maturity is positively related to science achievement (Sabapathy,
1986). The trait ‘adaptability’ seems to be related to emotional maturity.
‘Crooked’ personality trait is negatively related to science achievement in students. This means that the more students are crooked , less will they exhibit science achievement. A person who is not straight forward, and is willing to do harm to others in order to be successful, may not be honest towards his/ her study; this may negatively influence his/her achievement. ‘Alienated’ personality trait is negatively related to science achievement among students. It means that students’ tendency to avoid company of others can adversely influence science achievement among them. ‘Group-dependent’ personality trait is negatively related to science achievement among students. This indicates that tendency to act or think, depending on other persons, might inhibit science achievement of students. ‘Rest-loving’ trait is negatively related to science achievement among students. This means the tendency of ‘rest-loving’ negatively influences the development of science achievement. ‘Pessimist’ personality trait is negatively related to science achievement among students. This reflects that science achievement increases as tendency to be distressed or disappointed decreases among students. A counsellor may test students’ personality to identify the traits which may be responsible for their low science achievement, and then he can encourage them to increase their science achievement.
Chapters.indd 109 10/13/2016 2:58:35 PM

110 Journal of Indian Education February 2016
rEfErENcEs
aLexander, B. 1995. A study of development of scientific attitude through the teaching of science in secondary schools. Unpublished Doctoral Thesis, Bangalore University, 330- 340.
Barton, K., t. e. Dielman and r. B. CateLL. 1972. Personality and IQ measures as predictors of school achievement. Journal of Educational Psychology, 63, 398- 404.
heaven, P. C. L. and CiarroChi, j. 2012. When IQ is not everything: Intelligence, personality and academic performance at school. Personality and Individual Differences, http://dx.doi.org/10.1016/j.paid.2012.04.024
mehna, v. h. 1986. An investigation into some factors affecting academic achievement in science of standard IX students of Greater Bombay. Unpublished Doctoral Thesis. Bombay University.
miSra, K. S. 2012. Neo Personality Questionnaire. Sangyanalaya.SaBaPathy, t. 1986. A Study of the Relationship of Manifest Anxiety Emotional Maturity and
Social Maturity of Standard X Students to Their Academic Achievement. Unpublished Doctoral Thesis. Bangalore University
SonatKey, v. v. 1986. A comparative study of personality factors and achievement motivation of high and low achievers in natural and biological sciences. Unpublished Doctoral Thesis, Nagpur University.
SrivaStava, S. and K.S. Misra. 2015. Science Achievement Test. National Psychological Corporation. Agra.
Personality traits — motivated, crooked, adaptable, pessimist, disturbed and dominant — emerged as the best predictors of science achievement. These variables explain 12.5 per cent of the variance in science achievement. Teacher should plan a diverse learning environment consciously, keeping in mind the development of personality traits, namely — self-sufficient, sociable,
analytical, independent, perseverant, inquisitive, motivated, divergent and adaptable — which positively influence science achievement and inhibit traits, namely — crooked, alienated, group-dependent, rest- loving and pessimist, disturbed and dominant — which negatively influence science achievement among students.
Chapters.indd 110 10/13/2016 2:58:35 PM
A Study of Convergent Thinking and Divergent Thinking among Secondary
School Students in relation to Ethnicity, Locale, Types of Institutions and Sex
LaLit Kumar*PuSPLata Kumari**
AbstractJoy Paul Guilford identified two types of thinking as convergent thinking and divergent thinking. Convergent thinking was named as intelligence and divergent thinking as creativity. The researchers in the present study have tried to find out a relationship between convergent and divergent thinking. They have further investigated bearing of variables like ethnicity, locale, types of institutions and sex on both these thinking types. The study has employed descriptive survey method and has taken 600 secondary school students of Jharkhand State (Ranchi district only) as sample by using stratified random sampling technique. Verbal group test of R.K. Tandon has been used to measure convergent thinking. To measure divergent thinking, Baquer Mehdi verbal test has been used. Mean, standard deviation, t and r statistics have been employed to analyse the data. Major objectives of the study are : (i) to identify convergent and divergent thinking of secondary school students, (ii) to ascertain a relationship between convergent and divergent thinking, (iii) to study the bearing of ethnicity, locale, types of institutions and sex on convergent thinking and divergent thinking. Major hypotheses of the study are: (H1) there is no significant relationship between convergent and divergent thinking and
* Faculty of Education, Patna University, Patna, Bihar 800 005** Assistant Professor of Education, Vinoba Bhave University, Hazaribag 825301.
Chapters.indd 111 10/13/2016 2:58:35 PM

112 Journal of Indian Education February 2016
(H2) ethnicity, locale, types of institutions and sex does not influence convergent thinking and divergent thinking significantly. The study concludes that (i) there is significant relationship between convergent and divergent thinking and (ii) ethnicity, locale, types of institutions and sex influences convergent thinking significantly.
Guilford identified two types of thinking – convergent and divergent. Both these have their relative importance. Convergent thinking is commonly known as intelligence where as divergent thinking as creativity. Convergent thinking is important for the success of any individual in her/his future life and that is why General Mental Ability Test is part of almost all competitive exams. Convergent thinking is a term coined by Joy Paul Guilford as the opposite to divergent thinking. It generally means the ability to give a correct answer to standard questions that do not require significant creativity, for instance, in most tasks in school and on standardised multiple choice tests for intelligence. A critical aspect of convergent thinking is that it leads to a single best answer, leaving no room for ambiguity. In this view, answers are either right or wrong. The solution that is derived at the end of the convergent thinking process is the best possible answer majority of the time. Divergent thinking is a thoughtful process or method used to generate creative ideas by exploring many possible solutions. Divergent thinking typically occurs in a spontaneous, free-flowing manner, such that many ideas are generated in. Many possible solutions are
explored in a short amount of time, and unexpected connections are drawn. After the process of divergent thinking has been completed, ideas and information are organized, and structured using convergent thinking. Educationists and psychologists recognize convergent thinking as intelligence and divergent thinking as creativity. In the present study, both these thinking have been used in the same way.
The researchers have gone through different research findings related to convergent and divergent thinking. They have also reviewed research studies related to the relationship between both these thinking B.K. Passi, (1982) has reviewed research studies based on the relationship of intelligence and creativity and has concluded that, “Majority of studies reviewed under this heading have reported a positive and significant relationship between intelligence and creativity (Pathak, 1961, 1962; Raina, 1968; Trivedi, 1969; Pasi, 1971; Sharma, 1971; Sharma, 1972, 1974; Azmi, 1974 …… Chadha and Sen, 1981)”. The correlation between creativity and intelligence, in the above mentioned studies, ranged from 0.10 to 0.44 with a median around 0.30. Passi has again concluded that Badrinath and Satyanarayan, 1979
Chapters.indd 112 10/13/2016 2:58:35 PM

113 Study of Convergent Thinking and Divergent Thinking...
found that non-verbal creativity was not related to intelligence, whereas verbal creativity was positively and significantly related to it. Passi has again reviewed that Mehdi, 1977 reported a negative correlation between creativity and intelligence for students coming from an urban locality while it was positive in the rural locality. Passi, on the basis of a series of studies has finally concluded that, “intelligence and creativity have a positive but low correlation and a creative person is, normally, above average in intelligence.” These studies, and a few other studies have motivated the researchers to undertake a study to find out the relationship between convergent and divergent thinking. Since both these traits of human personality are important in the process of teaching and learning, these traits have their bearing on the entire system of education. The researchers are of the opinion that the study will serve the cause of education in some way or the other.
Bhoodev Singh, (2003) has review several studies related to Mathematics and has concluded, “personal characteristics such as personality, intelligence, attitude, self-concept, etc. of mathematical creative children are of monumental importance. Special attention has been focused on personality and attitudinal characteristics of mathematically gifted children who are our important resource.” What Lalit Kumar (2012) has concluded
with respect to mathematical creativity is true for general creativity and also for convergent thinking (intelligence), “As creative abilities may be increased through training, it is one of the legitimate functions of the education system to provide such training to foster creativity. A certain type of training to foster creativity needs to be given to parents, teachers and other related persons so that they could make the product, process and environment creative.”
The study related to divergent thinking (creativity) and convergent thinking (intelligence) is important as they are important human traits. Their inter-relation is even more important. Studies to find their relationship are few in number and this aspect of research needs to be exhaustive. O. P. Sharma, (1994) has found that intelligence and its different levels have positive correlation on creativity. Lalit Kumar, (1993) in his thesis has reviewed studies related to creativity and intelligence, and has found that most of the studies show positive correlation between these two traits.
Besides establishing a type of relationship between divergent and convergent thinking, the researchers have also tried to study both these thinking in relation to ethnicity, locale, types of institutions and sex and have concluded that this area needs to be given due attention it deserves. Girishwar Misra, (2007) has reviewed psychological researches and discussed studies related to
Chapters.indd 113 10/13/2016 2:58:35 PM

114 Journal of Indian Education February 2016
intelligence and creativity. He has concluded, “The Indian researchers have also shown interest in assessing intelligence and relating it to many variables and processes. A sizable number of studies have attempted to examine the relationship between intelligence and various background variables.” In this regard, he suggests to explore the area, “Looking at the theoretical and empirical work in this field, it is important that concerted efforts should be undertaken to go beyond the geographical metaphor of intelligence and look for the multi-factorial intellectual abilities, and evolve strategies to understand the processes in a culturally contextualised manner.”
Reviewed by G. Misra, under the head, creativity says, “It is evident from the fact that maximum number of studies during the period under review have been conducted in this area. These studies can be broadly grouped into three sub-categories: (a) demographic and personality correlates of creativity, (b) characteristics of creative people, and (c) interventions for the enhancement of creativity.” Mishra has further concluded, “It is clear that creativity as a disposition has been linked with a number of other dispositions and educationally relevant outcomes. The focus has largely been on the ways on how high and low creative pupils differ.”
Misra, referring to some studies related to the relationship of creativity and intelligence concludes,
“The studies suggest that intelligence is positively related to creativity (Agarwal and Agarwal, 1999). In particular, fluency and flexibility have been studied. Pradhan, Akhani and Janbandhu (1997) found a positive relationship of intelligence with verbal fluency among girls studying in Grades VI to IX. After examining secondary school studies in Kerala, Raj (1994) reported that flexibility was related to verbal and non-verbal intelligence.”
Besides finding a relationship between convergent and divergent thinking, the researchers have further studied both these variables in relation to ethnicity, locale, types of institutions and sex. The statement of the problem is “A study of Convergent Thinking and Divergent Thinking among Secondary School Students in Relation to Ethnicity, Locale, Types of Institutions and Sex.”
Objectives1. To identify convergent thinking
and divergent thinking of secondary school students.
2. To ascertain a relationship between convergent thinking and divergent thinking.
3. To compare non-tribal and tribal students in their convergent thinking and divergent thinking.
4. To compare urban and rural students in their convergent thinking and divergent thinking.
5. To compare private and government school students in
Chapters.indd 114 10/13/2016 2:58:35 PM

115 Study of Convergent Thinking and Divergent Thinking...
their convergent thinking and divergent thinking.
6. To compare female and male students in their convergent thinking and divergent thinking.
hyPothEsEs 1. There is no significant relationship
between convergent thinking and divergent think.
2. Non-tribal and tribal students do not differ significantly in their convergent thinking and divergent thinking.
3. Urban and rural school students do not differ significantly in their convergent thinking and divergent thinking.
4. Private and government school students do not differ significantly in their convergent thinking and divergent thinking.
5. Female and male students do not differ significantly in their convergent thinking and divergent thinking.
mEthodology In the present study, the researchers have employed the descriptive survey method to establish a type of relationship between convergent and divergent thinking.
samPlE
In the present study, six hundred (600) secondary school students of Jharkhand State (Ranchi district only) have been selected as sample using stratified random sampling technique.
tools usEd Verbal test of creative thinking, standardized and developed by Baquer Mehdi, has been used to measure divergent thinking. To collect data regarding convergent thinking, verbal group test of intelligence, standardised and developed by R.K. Tandon, has been employed.
Definitions of the Terms used in the Study• Convergent Thinking: Convergent
thinking has been taken as intelligence, as defined by the psychologists.
• Divergent Thinking: Creativity is divergent thinking as perceived by Guilford and other psychologists.
• Types of Institutions: Private and government schools have been identified under types of institutions.
• Ethnicity: Tribal and non-tribal students have been taken as two ethnic groups under the variable, ethnicity.
• Locale: Locale has been used to identify urban and rural students.
• Sex: Male and female students account the variable, sex.
Statistical Treatment of the dataThe conversion table was used from the manual of the intelligence test to find out the score of convergent thinking. Obtained score on creativity
Chapters.indd 115 10/13/2016 2:58:35 PM

116 Journal of Indian Education February 2016
test was converted into T-Score to find the fluency, flexibility, originality and ultimately, the composite divergent thinking score (Flu + Flex + Orig).
Mean, S.D. t-value and coefficient of Correlation (r) were computed to analyse the data.
Analysis and InterpretationTable 1
Correlation(r) between convergent thinking and different dimensions of divergent thinking
Divergent Thinking Dimensions
Convergent Thinking
Number of Students
Level of Significance
Fluency + 0.27 600 0.01
Flexibility + 0.24 600 0.01
Originality + 0.22 600 0.01
Divergent Thinking + 0.11 600 0.01
Table 1 reveals that the obtained coefficient of correlation (r) between convergent thinking and fluency, flexibility and originality dimensions of divergent thinking are + 0.27, + 0.24 and +0.22 respectively. The coefficient of correlation (r) between
convergent thinking and divergent thinking is + 0.11. All these values are significant at 0.01 level of significance (df = 598).
It indicates that convergent thinking and different dimensions of divergent thinking are significantly
Table 2Mean SD and t-value between non-tribal and tribal school students on
convergent thinking and on divergent thinking
Thinking Groups Mean SD N t-value Level of Significance
ConvergentNon-Tribal 116.38 18.46 300
7.83 0.01Tribal 104.05 20.09 300
Divergent Non-Tribal 156.74 29.36 300 5.37 0.01Tribal 144.03 28.59 300
related. It means there is a significant relationship between convergent thinking and different dimensions of divergent thinking (fluency, flexibility, originality and composite, i.e. divergent thinking).
Chapters.indd 116 10/13/2016 2:58:35 PM

117 Study of Convergent Thinking and Divergent Thinking...
Table 2 reveals that the obtained t-value between non-tribal and tribal school students on convergent thinking is 7.83, which is significant at 0.01 (df=598) level of significance. It indicates that non-tribal and tribal school students differ significantly in their convergent thinking. Non-tribal group is higher on mean value (M1=116.38) in comparison to tribal group (M2=104.05), and so it can be concluded that non-tribal students’ group is significantly superior in their convergent thinking in comparison to tribal students, group.
Table 3 Mean SD and t-value between urban and rural school students on
convergent thinking and on divergent thinking
Thinking Groups Mean SD N t-value Level of Significance
ConvergentUrban 119.07 18.09 300
11.800.01
Rural 101.55 18.28 300
Divergent Urban 158.68 30.96 300
7.840.01
Rural 141.30 22.77 300
Table 2 also reveals that the obtained t-value between non-tribal and tribal school students on divergent thinking is 5.37, which is significant at 0.01 (df = 598) level of significance. It indicates that non-tribal and tribal school students differ significantly in their divergent thinking. Non-tribal group is higher on mean value (M1=156.74) in comparison to tribal group (M2 = 144.03), and so it can be concluded that non-tribal students, group is significantly superior in their
divergent thinking in comparison to tribal student’s group.
Table 3 reveals that the obtained t-value between urban and rural school students on convergent thinking is 11.80, which is significant at 0.01 (df = 598) level of significance. It indicates that urban and rural school students’ differ significantly in their convergent thinking. Urban group is higher on mean value (M1=119.07) in comparison to rural group (M2=101.55), and so it can be concluded that urban students’ group is significantly superior in their
convergent thinking in comparison to rural students’ group.
Table 3 also reveals that the obtained t-value between urban and rural school students on divergent thinking is 7.84, which is significant at 0.01 (df = 598) level of significance. It indicates that urban and rural school students differ significantly in their divergent thinking. Urban group is higher on mean value (M1=158.68) in comparison to rural group (M2=141.30), and so it can
Chapters.indd 117 10/13/2016 2:58:35 PM

118 Journal of Indian Education February 2016
be concluded that urban students’ group is significantly superior in their divergent thinking in comparison to rural students’ group.
Table 4 reveals that the obtained t-value between government and private school students on convergent thinking is 8.28, which is significant at
Table 4Mean, SD and t-value between government and private school students on
convergent thinking and divergent thinking
Thinking Groups Mean SD N t-value Level of Significance
ConvergentGovernment 116.78 20.10 300
8.28 0.01Private 103.85 18.09 300
Divergent Government 160.61 31.20 300
5.09 0.01Private 139.38 25.43 300
0.01 (df = 598) level of significance. It indicates that government and private school students differ significantly in their convergent thinking. Government school students’ group is higher on mean value (M1=116.78) in comparison to private school students’ group (M2=103.85), and so it can be concluded that government school students’ group is significantly superior in their convergent thinking
Table 5Mean, SD and t-value between female and male school students on
convergent thinking and divergent thinking
Thinking Groups Mean SD N t-value Level of Significance
Convergent Female 113.83 19.83 300 4.33 0.01Male 106.80 19.93 300
Divergent Female 153.95 31.76 3003.43 0.01
Male 146.03 24.25 300
in comparison to private school students’ group.
Table 4 reveals that the obtained t-value between government and private school students on divergent thinking is 5.09, which is significant at 0.01 (df = 598) level of significance. It indicates that government and private
school students differ significantly in their divergent thinking. Government school students’ group is higher on mean value (M1=160.61) in comparison to private school students’ group (M2=139.38), and so it can be concluded that government school students’ group is significantly superior in their divergent thinking in comparison to private school students’ group.
Chapters.indd 118 10/13/2016 2:58:36 PM

119 Study of Convergent Thinking and Divergent Thinking...
Table 5 reveals that the obtained t-value between female and male students on convergent thinking is 4.33, which is significant at 0.01 (df = 598) level of significance. It indicates that female and male students differ significantly in their convergent thinking. Female students’ group is higher on mean value (M1=113.83) in comparison to male students’ group (M2=106.80), and so it can be concluded that female students’ group is significantly superior in their convergent thinking in comparison to male students’ group.
Table 5 also reveals that the obtained t-value between female and male students on divergent thinking is 3.43, which is significant at 0.01 (df = 598) level of significance. It indicates that female and male students differ significantly in their divergent thinking. Female students’ group is higher on mean value (M1=153.95) in comparison to male students’ group (M2=146.03), and so it can be concluded that female students’ group is significantly superior in their divergent thinking in comparison to male students’ group.
fiNdiNgs of thE study
(i) Convergent thinking and different dimensions of divergent thinking are significantly related.
Torrance (1962), Yamamoto (1963, 1964), Cropley (1967) and Lynch (1980) found a significantly high positive relationship between creativity and Intelligence. Guilford
(1950) and Mackinnon (1962) found a low positive relation. Rawat and Agarwal (1993) found in their study that high achievers in intelligence were not the high achievers in creativity.(ii) (a) Non-tribal and tribal school
students differ significantly in their convergent thinking. Non-tribal group is higher on mean value in comparison to tribal group showing non-tribal students’ group significantly superior to tribal students’ group.
P Annaraja and A.P. Thiagarajan, (1993) found regarding intelligence that Non-ST adolescents were better than STs. (b) Non-tribal and tribal school
students differ significantly in their divergent thinking. Non-tribal group is higher on mean value in comparison to tribal group showing non-tribal students’ group significantly superior to tribal students’ group.
Lalit Kumar, (1993) found non-tribal students superior to tribal students in their creativity.(iii) (a) Urban and rural school
students differ significantly in their convergent thinking. Urban group is higher on mean value in comparison to rural group showing that urban students’ group is significantly superior to rural students’ group.
Sudhir and Khiangti (1997) found that high creative girls
Chapters.indd 119 10/13/2016 2:58:36 PM

120 Journal of Indian Education February 2016
from urban areas turned out to be more intelligent, emotionally stable, conscientious and apprehensive than high creative girls from rural background.
(b) Urban and rural school students differ significantly in their divergent thinking. Urban group is higher on mean value in comparison to rural group showing that urban students’ group is significantly superior to rural students’ group.
Shukla and Sharma (1986) found rural students superior in their creativity. Seghal (1978) found no significant difference between creative potential of urban and rural students. Andal, Krishanan and Stephen (1996) found urban students superior in their creativity.(iv) (a) Government and private school
students differ significantly in their convergent thinking. Government school students’ group is higher on mean value in comparison to private school students’ group showing that government school students’ group significantly superior to private school students’ group. Showing environment positively related to intellectual ability, Behera (1993) observed that urban students of Navodaya Vidyalayas scored significantly higher on verbal intelligence, but not on non-verbal measures of intelligence.
(b) Government and private school students differ significantly in their divergent thinking. Government school students’ group is higher on mean value in comparison to private school students’ group showing government school students’ group significantly superior to private school students’ group.
Kumar (1994) found private school students superior over government school students in creativity. Gupta (1978) also found private school students superior. L. Kumar and E. Alam (2014) have found significant difference between the creative ability of private and government school students on the originality dimension of creativity. Private school students were found superior.(v) (a) Female and male students
differ significantly in their convergent thinking. Female students’ group is higher on mean value in comparison to male students’ group showing female students’ group significantly superior to male students’ group.
C. Thanavathi and V. Thamodharan (2012) have found significant difference in cognitive intelligence of male and female students. Female students were found superior. K.V. Sridevi and L. Parveen (2008) found significant difference in emotional intelligence among higher
Chapters.indd 120 10/13/2016 2:58:36 PM

121 Study of Convergent Thinking and Divergent Thinking...
secondary students with respect to their gender. The study found female students superior.
(b) Female and male students differ significantly in their divergent thinking. Female students’ group is higher on mean value in comparison to male students’ group showing female students’ group significantly superior to male students’ group.
Mishra (1986), Rawat and Garg (1993) and S.K. Singh (2011) have also found female students superior to male students in their creativity. Jarial and Sharma (1993), Ahmed, A (1993), Hussain and Sinha (1995) and Agarwal and Agarwal (1999) have found male students superior in their creativity. Bhaskar and Sharma (1993), Tiwari and Sharma (1993) and Kapoor (1996) have found no significant difference between the creative potential of male and female students. Gakhar and Lata (2010) have not found difference in the creative ability of delinquent and normal students among both male and female students.
gENEral coNclusioNs
(1) Convergent and Divergent thinking are significantly related.
(2) (a) Non-tribal students’ group is significantly superior in their convergent thinking in comparison to tribal students’ group.
(b) Non-tribal students’ group is significantly superior in their divergent thinking in comparison to tribal students’ group.
(3) (a) Urban students’ group is significantly superior in their convergent thinking in comparison rural students’ group.
(b) Urban students’ group is significantly superior in their divergent thinking in comparison to rural students’ group.
(4) (a) Government school students’ group is significantly superior in their convergent thinking in comparison to private school students’ group.
(b) Government school students’ group is significantly superior in their divergent thinking in comparison to private school students’ group.
(5) (a) Female students’ group is significantly superior in their convergent thinking in comparison to male students’ group.
(b) Female students’ group is significantly superior in their divergent thinking in comparison to male students’ group.
EducatioNal imPlicatioNs
As known to us, two major traits of human personality – convergent and divergent thinking, have its bearing on the other related personality traits
Chapters.indd 121 10/13/2016 2:58:36 PM

122 Journal of Indian Education February 2016
on one hand, and its wider influence on the entire process of teaching and learning on another. The study reveals that convergent and divergent thinking are significantly correlated to each other. It clearly indicates that if intelligence (convergent thinking) of learners are sharpened, the creativity (divergent thinking) of the learners will automatically be taken care of. The study also suggests to investigate the relationship in wider perspectives to establish a more generalised nature of relationship between the discussed variables.
Study again reveals that convergent and divergent thinking has their bearing on ethnicity, locate, types of Institutions and sex. The findings of the study are in accordance with some previously done research, and simultaneously, there are some differences in the light of another few findings. It is difficult in behavioural science to find the same result every time, but generalisation can be approached by making the sample size sufficiently large and conducting research work in groups.
The study further suggests to exhaust the field to find something in a more general form. It is one of the important aspect of the study that every chosen independent variable behaves in the same manner to both the dependent variables – convergent and divergent thinking. In brief, ethnicity, locale, types of institution and sex have the same result with both variables. Is the same trend of behaviour with respect to convergent and divergent thinking an issue to be investigated further? The study has answered many questions in some way or the other, but the important aspect of the study is the raised questions to be investigated or to be answered. Findings of the study and raised questions will certainly lead the researchers, teachers, policy makers and other practitioners of education in the desired direction. To generate issues for investigation is one of the purposes of every kind of research and the present study has also tried to do so in this way.
rEfErENcEs
agrawaL Sweta and Suman agrawaL. 1999. “Creativity and Intelligence: Exploration with Sex Difference”. Psycho-lingua, 29, 127-132.
ahmed, a. 1993. “Sex and Community as the Determinants of Creativity” in Status of Indian Research in Creativity. Edited by Tiwari and Pal, Agra, 294-297.
andaL, KriShnan and StePhen. 1996. “Creative thinking in relation to Sex, Socio-economic-status and Location”. International Educator. 11 (1 and 2).
annaraja, P and a. P. thiagarajan.1993. “Academic Achievement of Scheduled Tribe Adolescents in Salem District of Tamil Nadu: A Psycho-socio Study”, Journal of Indian Education. XVIII (6), 50-55.
Behera, a. P. 1993. “Rural-Urban Differences in Intelligence”. The Primary Teacher. 18, 40-48, reviewed in Sixth Survey of Educational Research. Vol. II. NCERT. 312.
Chapters.indd 122 10/13/2016 2:58:36 PM

123 Study of Convergent Thinking and Divergent Thinking...
BhaSKar and Sharma. 1993. “Creativity in relation to Intelligence, Sex and SES” in Status of Indian Research in Creativity. Agra. 259-267.
CroPLey, a. j. 1967. “Research on Measuremnet of Creativity” in Creativity Research International Perspective. Edited by M.K. Raina. NCERT. 1980. 45-54.
gaKhar and Lata. 2010. “Intelligence, Creativity, Self Concept and Personality Characteristics of Delinquent and Non-delinquent”, Teacher Education, IATE Journal, 44 (1-2), 73-78.
guiLFord, j.P. 1950. “Creativity: Dispositions and Processes” in Creativity Research International Perspectives. Edited by M.K. Raina, NCERT, 1980, 218-235.
guPta, a.K. 1978. “A Study of Pupil Creativity in two institutional Setting”. Creativity News Letter, vol 7, No.1.
huSSain, S and r. Sinha. 1995. “A Comparative Study of Creativity among male and female students of industrial and Non-industrial belts of Bihar”, Praachi Journal of Psycho-cultural Dimensions, 11, 1-8.
jariaL, d.g.S. and a.K. Sharma. 1993. “Sex and Academic Subject of the Students as the Determinants of their Creative Thinking Abilities” in Status of Indian Research in Creativity, Edited by Tiwari and Pal. Agra. 290-294.
KaPor, K. 1996. “A study on creative thinking ability of high school pupils of Arunachal Pradesh in relation to their sex and academic achievement, Progress of Education. 30, 172-175.
Kumar, LaLit. 1993. “A Study of Creativity Among Secondary School Students in Relation to Sex, Types of Schools and Ethnicity”. Unpublished Ph.D. Thesis submitted to Patna University, Patna.
Kumar, LaLit. 1994. “Ethnicity, Types of Schools and Sex Variation as Correlates of Creativity among Secondary School Pupils”. Indian Psychological Review. 42 (9-10), Agra Psychological Research Cell, 25-33.
Kumar, LaLit. 2012. “Fostering Mathematical Creativity”, www.ncert.nic.in (pdf). Kumar, LaLit and emteyaZ aLam. 2014. “Ucchatar Madhaymik Stariye Vidyarathiyon Ki
Srijanatamak Kshamata ka Gender. Vidyalay ke Prakar, Adhyayan Ke Vishay Avam me Sthan ke Sandarbh Men Adhayayan”. Bhartiye Adhunik Shiksha. 35(01), 84-93.
LynCh, P.m. 1980. “Creativity in Irish Children”, Creativity Research International Perspective, Edited by M.K. Raina, NCERT, 1980, 159-167.
maCKinnon, d.w. 1962. “Research in Creativity”, Creativity Research International Perspective. Edited by M.K.Raina. NCERT. 236-251.
miSra, giriShwar. 2000. “Psychological Dimensions of Educational Research in India”.Sixth Survey of Educational Research. NCERT, 301-337.
miShra, K. S. 1986. “Effect of Home and School Environment on Scientific Creativity”. Published by Sangyanalaya, Kanpur.
PaSSi, B. K. 1982. “Creativity in Education.” National Psychological Corporation. Agra.rawat, m.S. and agrawaL, S. 1993. “Study of Creative Thinking with special reference to
Intelligence, Age, Sex, Committee and Income Groups” in Status of Indian Researches in Creativity, Edited by Tiwari and Pal. Agra Psychological Research Cell. Agra, 216-231.
Chapters.indd 123 10/13/2016 2:58:36 PM

124 Journal of Indian Education February 2016
rawat, m.S. and m. K. Garg. 1993. “A study of creativity and Level of Aspiration of High School Students,” in Status of Indian Research in creativity. Edited by Tiwari and Pal Agra. 178-182.
SehgaL, K. 1978. “School System as Related to Creativity of Students”. The Progress of Education. 52 (10 and 11), 207-211, Collected in B. K. Passi edited book, creativity in Education. Agra, 88.89.
Sharma, o. P. 1974. Comparative Study of Intelligence and Creativity Among Girls and Their Matter”. The Educational Review. Triplicane. Madras. 162-166.
ShuKLa and Sharma. 1986. “Sex Differences in Scientific Creativity”. Indian Psychological Review. 30(3), 32-35.
Singh, Bhoodev. 2003. “Mathematical Creativity Research in India A Review”. Indian Educational Review. 39 (02), NCERT, 3-21.
Singh, S. K. 2011. “A Study of Creativity, Sex and Birth order of School Students”. Behavioural Research Review. 3 (1), Patna, 162-165.
Sridevi K.v. and L. Parveen. 2008. Relationship of Emotional Intelligence, Adjustment, Self Concept and Scholastic Achievement of Higher Secondary Students”. Journal of Educational Research and Extension. 45(2), April-June. Sri Ramkrishna Mission Vidyalaya College of Education. Coimbatore. 38-49.
Sudhir and Kaiangte. 1997. “Personality and Creativity among Secondary School Students: A Study in Talent Development”. Indian Educational Review. 7-10.
thanavathi, C and thamodharan, v. 2012. “Cognitive Intelligence of Graduate and Post Graduate History Students in Thoothukundi District”. Journal of Educational Research and Extension. 49(3). July-September. Sri Ramkrishna Mission Vidyalaya College of Education. Coimbatore. 10-18.
tiwari and Sharma. 1993. “A Study of Sex Difference in Creative Thinking” in Status of Indian Researches in Creativity. Edited by Tiwari and Pal. Agra Psychological Research Cell. Agra. 271-280.
torrenCe, e. P. 1962. “Georgia Studies of Creative Behaviour: A Brief Summary of Activities and Results”. in Creativity Research International Perspective. Edited by M.K.Raina. NCERT. 1980. 253-267.
yamamoto, K. 1963. 1964. “Creativity: A Blind Man’s Report on the Elephant” in Creativity Research International Perspective. Edited by M.K. Raina. NCERT. 1980, 295-305.
Chapters.indd 124 10/13/2016 2:58:36 PM

Dr. AmbedkarA Universal Educator
riteSh Singh tomer*
Abstract Although Ambedkar, who spent more than forty years of his life in association with different educational institutions, holding disparate positions, has never been given the status of a mainstream educator, he has done work that is of fundamental importance in this regard. When India was in the process of becoming a modern nation state and universalisation of education was the task at stake, Ambedkar made sure that those who had remained ignored in the realm of education for centuries, no longer remained so. The role that Ambedkar played in the upliftment of Dalits of Hindu social order is an apparent example, but his efforts extended far beyond.
iNtroductioN Born in a poor family of Mahar caste, which was designated impure and untouchable in Hinduism, Ambedkar reached the highest stage of educational distinction from the most renowned institutions of the time such as Columbia University, America and London School of Economics, London. However, his educational journey, unlike that of many of the contemporary scholars of his time (most of whom belonged to upper castes), was not smooth due
to the caste status. He came across caste based discriminations for the first time in his school where he, along with one of his brothers, was made to sit in the corner of the class room1. They were not allowed to touch the water tap and pour water from the water tank that was close to their school when they were thirsty and desired to drink water. He could not earn the desirable support from his teachers and fellows only because of the stigma of untouchability that his caste prescribed in Hindu social order.
*Assistant Professor, Shyama Prasad College for Women, University of Delhi, Punjabi Bagh (West), New Delhi-110026.
Chapters.indd 125 10/13/2016 2:58:36 PM

126 Journal of Indian Education February 2016
Even after receiving education from the west, when Ambedkar returned home, he again faced caste based austerities. He could not arrange shelter for himself and was forced to spend nights on railway stations. He encountered similar humiliations in the office where he was a military secretary, but was being treated as a lapper. Even poor illiterate peons considered it sinful to hand over office papers and files to Ambedkar and used to throw them on his table from a distance2. Drinking water, like in his childhood, was not available for him even in the office where he held a reputed position3.
He applied for the post of professorship of political-economy in the famous, Sydenham College and got selected in November 1918. He also worked as a professor of Mercantile law on a part-time basis for three years at Batliboy College Accountancy Institute, and later appointed as a full time professor at law college in Bombay. However, his Gujarati Brahmin fellows were unable to except him as equal to their status, and objected to his drinking water from the pot reserved for the professorial staff in the college premises.
Despite all, Ambedkar, who faced immense discriminations in educational institutions due to his low caste status, became a founder of several educational institutions and organisations in his later life. The institutions that he established for promoting education were fundamentally different from the
ones that he had attended.This paper aims to study those
institutions which Ambedkar had himself established for the purpose of the emancipation of Dalits. It argues that Ambedkar had universalised education by providing access of educational institutions to those sections of the society which were considered unfit to acquire knowledge. The sections of the society include not only schedule castes of Hindu social order, with upliftment of whom Ambedkar is often associated, but rather all those who were marginalised under the traditional stratification of Indian society. In a way, he used education as a modernist project to launch counter-hegemony against traditionally dominant castes who claimed their absolute right on education.
ambEdkar's iNstitutioNs aNd his EducatioNal agENda
Right from the origin of the Indian civilization, education remained the monopoly of Brahmins4. It is mentioned in the Purushsukta that the right of reading and writing would be reserved for the Brahmins who originated from the head of the divine body. Shudras, who originated from the feet of divinity, were denied access to any kind of knowledge, particularly that which pertained to the study of religious scriptures5. This trend continued for centuries without any resistance.
As far as the education of the socially marginalised sections in
Chapters.indd 126 10/13/2016 2:58:36 PM

127Dr. Ambedkar: A Universal Educator
modern India is concerned, colonial state showed reluctance in this regard due to its non-interference policy in the social issues of Indians. British East India company was busy in expansion and consolidation of Indian state in the first half of the nineteenth century6. This was the reason why the institutions that were established by the British East India Company in the beginning were mostly established, keeping in line with the institutions that had been already present in the sub-continent for centuries. Later, the same policies were followed by the British crown. Missionaries formed the first non-governmental organisations that worked for the cause of upliftment of weaker sections. However, their work failed to leave remarkable imprints in the realm of education since their primary goal was religious proselytisation. The task was taken up by Indian reformers, and Ambedkar was primary amongst them.
It must be recalled here that Ambedkar, who had faced immense discriminations in educational institutions due to his low caste status, grew up to become the founder of several educational institutions and organisations. He had worked as a teacher, principal and professor with several educational institutions in different regions of pre-independent India during the early period of his career. He first worked as a professor of political-economy at the famous Sydenham College, and later as a professor of mercantile law on a part-
time basis for three years at Batliboy College Accountancy Institute. He was appointed as a full time professor at law college of Bombay and later, was honoured as the principal of the college as well. But the efforts that he made to start educational institutions for the purpose of spreading education among the masses deserve special attention.
In the course of his public career which lasted more than thirty years, Ambedkar was fully convinced that organisations are key instruments that can sustain the fight for liberation of backward communities. In other words, he wanted his ideas to be promoted by an institutional mechanism since he believed that the progress of a community lies in the strong hands of the organisations which devote themselves completely for the cause of the community. In this context, he believed that organisations must be governed by the same group of people that it represents. As early as 1940, he had started contesting the need of establishing a central organisation for the backward classes of the Indian society7. He stated that there must be some sort of harmony in different organisations working for the same cause and even smallest of the organisations must be tied to powerful organisations working in the field. In this context, he seemed to be of the opinion that the spread of education in the backward classes can be successfully delivered by constituting interconnected organisations that
Chapters.indd 127 10/13/2016 2:58:36 PM

128 Journal of Indian Education February 2016
strove for the purpose. Therefore, he constituted many organisations and institutions with the aim to uplift backward classes educationally. Although some of the organisations were not established specifically for educational purposes, but education was certainly an important agenda for them.
It was in 1924 when Ambedkar founded an institution named ‘Bhahishkrit Hitkarini Sabha’ which worked exclusively for fulfilling educational desires of backward classes. Opening-up educational institutions like boarding schools, hostels, libraries for backward classes’ education was one of the main agenda of this organisation. Subsequently, another organisation that was similar to ‘Bhahishkrit Hitkarini Sabha’ was established by Ambedkar and named as ‘Samta Sainik Dal’. One of the important aims of this ‘Dal’ was to unite the youth of the backward classes under a single banner. All India Depressed Class Student Organisation, which was established in 1928, was also founded under the leadership of Ambedkar. The aim of this organisation, like previously established institutions, was to organise the people of backward classes as a single and united front. Under one of the objectives of this organisation, Ambedkar wanted the students of depressed castes to discard caste consciousness, and develop the culture of studying, like other castes. Safeguarding the interests of backward classes, coordinating with
the students of backward classes for the welfare of schedule caste people, and also taking all of these issues to the working committee for the purpose of approval were some the other goals of the organisation8.
During the early 1940s, Ambedkar worked with labour classes, and started a political front to flag their demands. The organisation was named ‘Independent Labour Party’. This was the only political party of the time which included education in its agenda. It aimed to increase the efficiency and productivity of the labour class by educating them into newly developed technical skills. The party also undertook analysis of important issues such as compulsory primary education and adult education. It had been declared in the party’s agenda that the party will endeavour to provide facilities for the improvement of higher education in India and as well as abroad, in order to aid the deserving persons from communities that are socially backward. He also began the ‘All India Schedule Caste Federation’ in 1942. This federation undertook the task of opening schools for backward classes and taught them art and craft.
Ambedkar engaged with a bigger educational project in the later phase of his public life. On 8 July 1945, he established the famous ‘People Educational Society’ with the purpose of encouraging people of depressed sections of the society to acquire higher education. The aim of the society, as stated by Ambedkar
Chapters.indd 128 10/13/2016 2:58:36 PM

129Dr. Ambedkar: A Universal Educator
himself, was not merely to educate people, but to inculcate intellectual and moral habits in them. While addressing a conference for the students of depressed class in Pune, he stated that their role in life was of tremendous consequence and, was bound to contribute to the progress of destiny of the depressed classes9.The society focused upon opening public institutions like colleges, libraries, play-grounds, Buddhist seminaries and Viharas in Maharastra and various other parts of India. An interesting fact about the educational aim of this society is that it included both religious and scientific education in its agenda10. In 1952, Ambedkar established ‘Buddhist Society of India’ in which more or less similar goals, such as promotion of higher education, opening colleges for religious and scientific education, were to be fulfilled. In 1956, he founded the ‘Republican Party of India’. Although it was a purely political front, education occupied some space in the agenda of this party. Promoting secular political values by education was one of its important goals.
One of the life-long missions of Ambedkar was the organisation of backward classes as a single and united front. He seemed to be recognizing the fact that educational institutions like ‘hostels and libraries’ will not only help people of backward classes to acquire appropriate information, but they will also promote in them, a sense of belongingness to a group or community. Ambedkar’s aim was not
limited to unite the backward classes as a single and coherent front; he wanted to educate them in order to ‘agitate’ them for their fundamental rights that were being denied under the caste system. These public institutions may be considered as one of his earnest efforts to agitate the backward classes mentally for their fundamental rights. In his opinion, a group cannot "agitate and organise" for a common mission without being educated. It must get itself educated in order to liberate its thoughts so that it can collectively organise agitated minds. Educated mind, as Ambedkar puts it, would force educated people to form organisations and they would act to fix the problems.
These public institutions can also be interpreted as an effort of Ambedkar to strengthen the common masses to strive for their civil and political rights, in the struggle for social justice. These institutions, as the manifesto of some of these institutions show, were a sincere effort of Ambedkar to involve the youth of backward classes into the larger movements of Dalit emancipation, and also to make these social groups participate actively in the socio-political activities, empowering them with an efficiency in governing and managing skills. Whichever organisation or party Ambedkar founded in the course of his public life, they were administered by the people of backward classes itself. For instance, there were many educated depressed caste intellectuals of
Chapters.indd 129 10/13/2016 2:58:36 PM
130 Journal of Indian Education February 2016
the time, such as Dr. Purushotam Solankey and Shivtarker, who came to actively engage with the ‘All India Depressed Class Association’. These organisations and the active space that they provided to the masses could also be interpreted as the realisation of one of the primary aims of Ambedkar, which was to prepare the masses to participate in political fronts, and which later reflected in the Constitution of independent India, where he gave central importance to the allocation of political and constitutional mechanism into the hands of the people of the country.
After the analysis of the aims and objectives of institutional efforts that Ambedkar had put forth, it can be argued that he played an important role in the upliftment of the backward classes, since he provided these groups a wider access to knowledge and attempted to arrange for them institutions where they could pursue education without facing discriminations. He arranged for them the platforms where they could participate in a common activity, and share and communicate relevant information. These organisations can be interpreted as realisations of one of the dreams of Ambedkar, since he often argued that every social institution in general and educational institution in particular, while being secular in nature, should also be equally accessible to each and every individual, irrespective of their caste and class status.
coNclusioN
The above provided analysis of the educational contributions of Ambedkar must be studied as an effort made by him to universalise education as he strove to expand the domain of education from some privileged sections of the society to the common people of the society. He was amongst the first few educators of the nation who conceptualised education as a wealth which could empower the masses, in the place of a tool that was utilised by a privileged few to control the resources and structure of society. In the orthodox and semi-urbanized nation where interests of common people were not recognised, he ventured to open several organisations which aimed to universalise the right of education by spreading education amongst the masses at the lowest of expenses. The description of the aims and objectives of these organisations and parties clearly shows that each of these organisations were established with the aim to make backward communities equal to the other social groups, with the help of education as a tool for progress. He wanted the people of backward classes to not face the insulting and inconvenient environment in which he himself had studied. Many a times he emphasised that each and every person, particularly those belonging to educationally backward sections, should be given easy access and opportunities to acquire higher
Chapters.indd 130 10/13/2016 2:58:36 PM

131Dr. Ambedkar: A Universal Educator
education. The primary goal of the educational institutions that were established by Ambedkar was to educate those who were forbidden from attaining education in other private and governmental institutions of the society. He wanted the people of the backward classes to experience education and attain enlightenment
without the barriers of caste, creed and race11. His educational aims, hence, were not limited in nature; they extended not only to include Dalits, but all those sections of the society that had remained exploited under the traditional stratification of the Indian society.
Endnotes1 G. Ombvedt, Ambedkar towards an enlightened India, New Delhi: Penguin, 2004, p. 5. 2 D. Keer, Dr. B. R. Ambedkar life and mission, New Delhi: Popular Prakashan, 1977, p. 8. 3 B. R. Ambedkar, Waiting for a visa, Mumbai: Peoples Educational Society, 1999, p. 2.4 E. Zelliott. 2000. ‘Growth of education among the Dalit-Bahujan communities in modern Andhra, 1893-1947’, in Bhattacharya, S. (Ed.), Education and the disprivileged in 19th and 20th century India, New Delhi: Orient Longman, p- 35-49. 5 J.J. Shukla.1998. B.R. Ambedkar, Gandhi, Tagore-A comparative study on education, New Delhi: Karnavati Publication, p- 5.6 J. P. Naik and S. Nurullah, 1974. A student’s history of education in India 1800, New Delhi: Macmillan, p. 5.7 N. C. Rattu. 1967. Dr. Ambedkar: Important messages, sayings, wits and wisdom. Wolverhampton: Dr Ambedkar memorial committee of Great Britain, p. 45.8 Y. D. Sontakke. (Ed.). 2004. Thoughts of Babasaheb Ambedkar, New Delhi, Samyak Prakashan, p. 310. Op.Cit, 95.9 Ibid, 318. 10 N. C. Rattu. 1967. Dr. Ambedkar: Important messages, sayings, wits and wisdom. Wolverhampton: Dr. Ambedkar memorial committee of Great Britain, p. 45.11 K. S. Chalam. 2008. Modernization of Dalit Education: Ambedkar’s Vision, New Delhi: Rawat Publication. p. 49.
Chapters.indd 131 10/13/2016 2:58:36 PM

Education and its Political Context for the Marginalised
A Study based on Ambedkar Nagar DistrictdivyanShu PateL*
AbstractThis research paper attempts to analyse the link between educational development and social mobility in deprived sections of the society. The basic thrust of the paper is to examine the multi-layered correlation between educational development and social and political mobility in society. A corollary to the same is an attempt at understanding how they affect each other. In this context, the central idea that this paper seeks to address and explore is the link that exists between education and social mobility, in light of a comparative framework built upon the ideas of Gandhi, Ambedkar and Lohia. For the same, the district of Ambedkar Nagar, situated in Uttar Pradesh (U.P.) has been chosen as a sample for the study. Data was collected from two schools, established with the cooperation of local people in the district, and interviews were conducted with people who actively participated in the social movements of the region.
iNtroductioN
From the adoption of the Five Year Plan (FYP) model of development, the LPG era to the PURA approach1, India’s developmental process has been phenomenal and has witnessed several phases. But there
is one factor which has posed to be a major constraint in the path of development, that is, the caste system in India. Despite consistent efforts being made for ridding the society of caste-based discrimination, constitutional provisions being made;
* Ph.D Scholar, CSSS, JNU, New Delhi, C/o- 4A/45 Riviera Apartments, Mall Road, Delhi 110054.
Chapters.indd 132 10/13/2016 2:58:36 PM

133Education and its Political Context for the Marginalised...
it continues to remain a dominant factor that affects the initiatives for development. Quite interestingly, at the dawn of independence, caste-based discrimination and the problem of untouchability were major issues of concern for all the leaders, and Gandhi himself declared that, without eliminating caste, freedom will have no meaning. However, caste as a constraint in social mobility and as a prominent factor in politics was not recognised.
In this context, the central idea that this paper seeks to address and explore is the link that exists between education and social mobility. For the same, the district of Ambedkar Nagar, situated in U.P. has been chosen as a sample for the study. Data was collected from two schools, established with the cooperation of local people in the district. Interviews were conducted with people who actively participated in the social movements of the region and were associated with Jai Ram Verma.
This paper consists of four sections. In the aforementioned context of caste, the first section deals with a theoretical understanding of the dynamics of politicization of education and how education can play an enabling role. This is based on a comparative framework built upon the ideas of Gandhi, Ambedkar and Lohia. The second section begins with a brief introduction of the Ambedkar Nagar district, highlighting the reason why this particular geographical location was chosen
for our analysis. The third section forwards an interpretation and analysis of the data collated in light of the theoretical framework developed and with respect to the socio-political dynamics and historicity of the region. A comparative analysis of caste politics and the role of education have been attempted, with particular salience being accorded to local bodies of governance — Gram Sabha, Gram Panchayats etc. — which have played a vital role for establishing the schools by providing land and other necessities in a cooperative manner. The paper ends with a brief analysis of the movement which was garnered towards the social and political upliftment of the downtrodden. It also seeks to delve into the social phenomena of the emergence of the concept of social justice among the OBCs and Dalits as a consequence of this movement in the region chosen for the study.
triad of castE, Politics aNd EducatioN In India’s developmental process, the triad of caste, politics and education has been an important one. Though consistent efforts have been directed at development, it has failed to address the objective of being wholly inclusive in nature. One reason for this lack has been the undermining of the correlation between caste and education, and how it acts as a deterrent in the developmental process. In order to attain the vision
Chapters.indd 133 10/13/2016 2:58:36 PM

134 Journal of Indian Education February 2016
of an egalitarian society, both during the struggle for independence and in post-independent India, three leaders who advocated education as a way of achieving equality were Gandhi, Ambedkar and Lohia. Though their methods were different, but the idea was same in spirit.
In the trio, Gandhi was the first to realise that in the ongoing struggle for independence, without eliminating untouchability from India, both from being practiced in day-to-day life as well as from the minds of people, freedom will have no meaning, and a society based on the concept of equality cannot be established. It can be stated that Gandhi took forward the legacy of Phule and Periyar and linked the removal of caste-based discrimination with education. He proposed a formula for basic education, known as Buniyadi Talim, at Wardha in 1937. It was based on the concept of ‘learning by doing’ and it reflects Gandhi’s attempt to hit upon the psychological barriers which tend to view manual work as menial and substandard2. Gandhi, through this process, was unleashing a social experiment and he was quite sure about its success. He supported the view that the problem of caste must be resolved within the society and not by a reactionary approach. Though extremely critical of the rigidities of the caste system, this approach seems to emanate from a relatively tolerant attitude evident in his statements about the Varna system.
In an issue of Young India, December 1920, he writes, “Like every other institution, it (caste) is also fighting with its excrescences. I consider these four divisions as fundamental, natural and necessary. I am against any kind of attempt to end this traditional division.” However, it is pertinent to note that such statements only give an overview about what was Gandhi thinking at that particular phase of time. His ideas transformed with the passage of time. Thus, there is a need to understand Gandhi’s views in the context within which he was expressing them. Only then we can arrive at a holistic understanding of his thoughts and ideas.
While Gandhi was trying to deal with the issues of untouchability and caste discrimination in a systematic and moderate way, there was a similar assertion from another part of the country; voiced by Dr. Ambedkar, who wanted a more direct solution to this malady. In comparison to Gandhi, he gave a totally different view on the caste system. He placed himself outside the sphere of Hindu religion in order to investigate the reason for this malaise. In his essay, The Annihilation of Caste, written in 1936, he stated that inequality was inherent in the Hindu social system. Ambedkar too followed Gandhi’s footsteps to fight against the problem of caste discrimination; but failure of the Satyagraha of Parvati and Kalaram temples proved to be catalysts in bringing about a shift in his ideology.
Chapters.indd 134 10/13/2016 2:58:36 PM

135Education and its Political Context for the Marginalised...
The similarity in the views of Ambedkar and Gandhi on the link between educational development and eradication of caste cannot be overlooked; but the approach adopted by the former was totally different. Unlike Gandhi, Ambedkar declared that education in English medium and knowledge of English language was vital for upliftment. Like Gandhi, he too emphasised upon the salience of primary education and regarded it as the most important need for empowerment of untouchables in India3. But it is the idea that aimed to use education as a means of political upliftment, which brings to fore the differences in the ideological stand points of Ambedkar and Gandhi. The former linked the question of ‘self’ among Dalits with education and always recognised it as a political affair. He encouraged Dalit students to establish student organisations which could help raise the voice of the marginalised in universities and colleges. In fact, his focus was always centred at gaining political power for wider social interests, mobilised through the development of education among the Dalits.
While Gandhi and Ambedkar were making efforts with their own specific ideas and concepts; it was Ram Manohar Lohia who analysed this problem with an even broader perspective. It involved expanding the idea of empowerment to other horizons and he sought to rid the society of discrimination on the basis of gender, language etc. He considered
all kinds of discrimination as a social malaise and a major obstacle for development.
While Gandhi failed to extricate himself from the structure of a Hindu ‘self,’ Lohia analysed the discriminatory nature of the Hindu society by looking at it as an outsider. He attacked the injustices of the caste system in an aggressive, yet logical manner. For him, caste was the primary reason for social exclusion, disregarding the merit of the individual and enslaving the mind. He shares the views of Gandhi and Ambedkar on the subject of caste eradication from the Indian society. Amongst these luminaries, Lohia was the first one who advocated, socio-political upliftment of the ‘Backward Castes. Like Ambedkar, he also considered politics as a means of establishing equality, but he also supported the politicisation of OBC in order to attain an egalitarian society.
In Lohia’s concept of equality women also found an important place. He advocated that all efforts for equality are useless if they cannot give equal rights to women. Drawing a link between caste and gender discrimination, he voiced the idea that a major reason for the decline of ‘self’ in society, both caste and gender-based differentiation are responsible4. Drawing on the mythological character of ‘Draupadi’5, he sought to spread his message that women in India must be independent and should be empowered to take their own decisions. On the question
Chapters.indd 135 10/13/2016 2:58:36 PM

136 Journal of Indian Education February 2016
of education and the medium of instruction, Lohia had quite similar views like his mentor, Gandhi. He advocated education to be imparted in the mother tongue and criticised the unnecessary burden of English on education. He recognised the latter as a primary factor that promoted class division in India.
Lohia’s side was close to the ideological constructions of Gandhi and Ambedkar. Like Ambedkar, he protested against caste-based discrimination and wanted that the unjust system must be ended. However, the latter also considered it necessary to give special rights or opportunities to the backward castes. The link between Gandhi and Lohia was that of guru-shishya. Though Lohia was in agreement with the ideas of Gandhi yet he forged an opinion of his own that was distinctive in nature. Though he disagreed and differed from Gandhi on the issue of caste, he supported Gandhi’s ideas on education and language. Gandhi considered Lohia’s ideas to be inevitable for independent India. In an issue of Dharmayug (1967), Lohia wrote,“… there have been only two forces which can unite India; first one is Gandhi and other is cinema.”
Traditionally, Gandhi, Ambedkar and Lohia have been seen as separate on the issue of equality. In a very dramatic way, their endeavours, directed at achieving social equality, have been accorded separate political affiliations. This has happened in total negation of the fact that there
might be a certain degree of basic similarity in their thoughts! This is replicated and manifested even in the school textbooks. Also, pertinent to consider is the fact that often Lohia’s ideas are mentioned only as a passing reference in textbooks.
Therefore, when we talk about equality, it is necessary to consider the fact that the ideas of these three thinkers on equality are complementary to each other. According to D.R Nagraj (2008), “Gandhi and Ambedkar had transformed or modified each other’s ideas. While Gandhi extricated the issue of upliftment of Harijans from the limitations of untouchability, Ambedkar accepted the role of dharma in elimination of caste from society6.”
ambEdkar Nagar: aN iNtroductioN
District Ambedkar Nagar, situated between 26, 26’ north and 82, 82’ east, is one of the districts among those that were created in Uttar Pradesh in the 90s. The district is named after Dr. Ambedkar, a Dalit icon, by the then Chief Minister of Uttar Pradesh, Ms. Mayawati, on 29 September 1995. It is spread across an area of 2496 km square and has a population of 23, 98,709 approximately according to 2011 census. Quite interestingly, in the town Akbarpur, one of the nine blocks of the district, is the birth place of Lohia7, of who hailed as the founder of socialism in India; and Jai Ram Verma8, one of most influential leader of the Congress party in the 60s and 70s.
Chapters.indd 136 10/13/2016 2:58:36 PM

137Education and its Political Context for the Marginalised...
Two blocks, Akbarpur and Jalalpur, have been chosen for this micro study. Two schools, situated in these two blocks were selected for data collection. This study seeks to probe into how education has played an empowering role and contributed to the dynamics of socio-political development of weaker sections. This has been analysed in the context of two schools situated in Ambedkar Nagar district. The history of their establishment and development over the past few decades have added to their significance. They are an important aspect of the local history of Ambedkar Nagar; and the people who were actively involved in this indigenous movement have been recognized in the local history as heroes.
While conducting this study, the basic focus was, to analyse the relationship between education and socio-political mobility in society. They are interdependent in nature and impact each other significantly. The changes manifested in one domain, regardless of whether they are positive or negative in nature, have a far-reaching influence on the other. These changes have an important place in channelling the course of history, or rather, people’s history. A steady rise has been witnessed in the study of local history/narratives and it has aided in bringing to the fore, through research, the unique character of development and changes experienced in particular regions. And a distinct aspect that
characterizes local history is the overwhelming presence of oral narratives, folklore etc as potential sources. Often it does not follow a scientific method, scriptural evidence and documentation. Local stories and associated myths are valued by the people and thus, they must be accorded an appropriate place.
aNalysis9
Education has been often seen as an index of development; and within its ambit is included the idea of forwarding education as a means of enabling socio-political mobility. Further, educational development, it must be recognized, is an indirect process and has a long term impact on the different dimensions of the society.
In the Indian context, after gaining independence, a great challenge before the leaders of the nation was to diminish the barriers of caste and class in India. Numerous attempts were made in this regard and several evidences of affirmative action and reforms are available where education has been mobilized as a medium of social and political upliftment.
Taking into consideration the aforementioned context, the first section of the analysis gives a brief insight into the history of the establishment of the two schools, chosen for the study:
Jai Ram Verma Bapu Inter CollegeThe concerted efforts made by Jairam Verma, a leader with Gandhian
Chapters.indd 137 10/13/2016 2:58:36 PM

138 Journal of Indian Education February 2016
ideology, for establishing this school in Ambedkar Nagar (then Faizabad) are of seminal importance. In the beginning of 1949, he started this school at a ground, next to the road connecting Akbarpur to Iltifatganj, near the village Badagaon, Ibrahimpur. Initially, the school consisted of only four rooms, made with mud and kaashehari- a kind of grass which is used for making roof of huts in rural areas, with the help of local people. When it started, there were 25 students in the school and three teachers were appointed by Jairam Verma. The inhabitants of the local villages contributed a lot to the school as there was no other school where their children could get education upto the senior secondary level.
The process of how funds were collected for the school is quite interesting. Jairam Verma initiated a contributory collaborative effort where one ser (6 kg) grain was collected from each house; and by selling those collected grains, material for the school building was bought. He was recognised as a prominent OBC leader, and it helped in garnering support and motivating contribution from the nearby villages, which were primarily dominated by the OBC’s and Dalits. Jairam Verma envisioned that these schools will produce at least one teacher in each house and will aid in the assertion of the OBC’s and Dalits at the social as well as political front, both at the local and state levels. It appealed to the masses. It gives a glimpse of the visionary thinking of
Jairam Verma who, recognising the salience of education, made a great attempt in this regard. He adopted a bottom-up-approach and, with the help of education, was successful in challenging the social hierarchy in the area.
Sardar Patel Smarak Inter College: The foundation of this school was laid down in 1965 by the then head of Jalalpur Block, Ramnarayan Verma. Once again, the contributions of Jairam Verma for the establishment of this school, obtaining certification from the commission for starting secondary education etc. cannot be overlooked. Though the school was opened quite late, in comparison to the first one, the idea and methods were the same for collecting aids from the local villagers. This school has also contributed immensely to raising the educational level of OBC’s and Dalits.
In the next section, data collated through interviews and documentation from the school gazetteer has been interpreted. Data from the schools has been collected on decadal basis, and the founding year has been taken as base year for each school. Interviews done were primarily thematic in nature, and can be referred to as ‘long conversations’.
The first school has witnessed a steep rise in the total strength of students from the year of its establishment. As mentioned above, there were only 25 students in the founding year (1949); but in the next
Chapters.indd 138 10/13/2016 2:58:36 PM

139Education and its Political Context for the Marginalised...
decade, the numbers rose to 156 students, with a prominent number of OBC and S.C. students in the school. The total number of students and overall popularity of the school increased with each passing year (Table 1) as the prominence of Jairam Verma in local as well as in state politics rose.
Table 1
Number of Students in Jai Ram Verma Bapu Inter College
General OBC S.C. S.T. Muslim Total Grand Total
1949Boys 4 16 2 - 3 25
25Girls - - - - - -
1959Boys 40 83 16 - 17 156
156Girls - - - - - -
1969Boys 149 453 117 - 51 772
772Girls - - - - - -
1979Boys 161 610 167 - 46 984
984Girls - - - - - -
1989Boys 182 892 78 - 103 1255
1546Girls 48 157 43 - 43 291
1999Boys 202 985 254 - 88 1529
2046Girls 66 351 99 - 01 517
2009Boys 106 671 204 - 62 1043
1490Girls 35 234 151 - 27 447
From 1959 to 1969, the number of students increased from 156 to 772 in the school, and in 1979, it was 984. Also, another important feature was that the school obtained a sanction for girl education, and the number of students increased to 1546. An all-time high in the strength of the
school was when the total enrolment went up to 2046 in 1999.This data is potently reflective of the socio-political changes which were taking place, especially amongst those who had been deprived. (Graph 1)
In the second school, which was named after Sardar Patel, the
strength of the school in its founding year (1965) was 65 students, with 10 girls and more than fifty per cent of the students belonging to the OBC section. As the school is situated near OBC-dominated villages, especially kurmis – a dominant peasant community of Eastern U.P. - a visible
Chapters.indd 139 10/13/2016 2:58:37 PM

140 Journal of Indian Education February 2016
presence of student’s hailing from this community is there. The total strength of the school rose steeply in the following decade, and in 1975,
Table 2
Number of Students in Sardar Patel Smarak Inter College
Decade General OBC S.C. S.T. Muslim Total Grand Total
1965Boys 6 30 12 - 7 55 65
Girls 1 5 2 - 2 10
1975Boys 10 245 155 - 15 425 605
Girls 11 105 60 - 14 180
1985Boys 54 1075 451 - 95 1675 2225Girls 21 310 190 - 20 550
1995Boys 60 1510 870 - 90 2530 3240Girls 27 451 202 - 30 710
2005Boys 55 1765 855 - 75 2750
4280Girls 30 910 530 - 56 1530
the number of students in the school was 605, of which 180 were girls. (Table 2)
Graph 1: Number of Students in Jai Ram Verma Bapu Inter College
Chapters.indd 140 10/13/2016 2:58:38 PM

141Education and its Political Context for the Marginalised...
Jairam Verma, an inspirational figure for establishing this school, always emphasized that this school should emerge as a centre for forwarding the cause of education of girls. In the following decades, 1985 and 1995, the strength of the school made an impressive increase
Graph 2: Number of Students in Sardar Patel Smarak Inter College
and was recorded as 2225 and 3240, in which the number of girls was 550 and 710 respectively. In 2005, the total number of students continued to increase and went up to 4280, in which 1530 were girls. (Graph 2)
The motive behind establishing the school was to promote education in the area and by that, to elevate the standard of the downtrodden in the socio-political structure of the district. These two schools successfully fulfilled the motive, and provided a platform for political assertion and social mobilisation of the deprived
community. The most distinguishing part of this whole movement was that it involved local people in making of the school building. These two schools bear testimony to the significant role played by the Gram Sabha and Panchayats in the developmental
process, as both the schools got land for establishing schools from the Gram Sabha only. It was quite obvious that being a Gandhian, Jairam Verma actively involved the Gram Sabha in this movement. Gandhi himself advocated that development at the grassroot level involves the active involvement of the local governing bodies. These two schools exemplify that any movement based on strong ideological standpoints, with the help of local governing bodies and people, can immensely contribute to the development of the area.
Chapters.indd 141 10/13/2016 2:58:38 PM

142 Journal of Indian Education February 2016
coNclusioN
‘Where there is no scope for dialogue, the structure must be changed, and education, we believe, provides the opportunity to change the structure. In the context of Ambedkar Nagar, education has emerged as a primary source of change. People as a collective, with leaders such as Jairam Verma, successfully forwarded the legacy of Gandhi, Ambedkar and Lohia, and used education as primary resource for development. It illustrates how the ideas of Gandhi, Ambedkar and Lohia can be actively used to for democratization, social equality and upliftment of those who have been suppressed and exploited by the dominant in the power matrix. It is only then the constitutional provision of ‘right to equality’ can be
implemented in its true spirit. The data shows that these schools not only helped in raising the literacy rate of Ambedkar Nagar, but also played a vital role in empowering the weaker sections.
The efforts directed at achieving social equality, in India have yielded positive results; but still a lot needs to be done in order to achieve this goal. In order to attain equality in society, there has to be adequate and active representation of the Dalit and backward classes, from the grass root level, which is the Panchayat, to the highest representation of political power, the parliament. This is the reason why the ideas of Gandhi, Ambedkar and Lohia — on four main factors of caste, class, gender and language — hold relevance and are significant even today.
End Notes1Liberalisation, Privatisation and Globalisation (LPG): The year 1991 marked the ushering in of the neo-liberal reforms in India. Providing Urban Amenities to Rural Areas (PURA) is a strategy for rural development in India. The concept was given by former president, Dr. A.P.J. Abdul Kalam. It proposes that urban infrastructure and services be provided in rural hubs to create economic opportunities outside of cities. And the Indian central government has been running pilot PURA programs in several states since 2004. Source: Ministry of Rural Development, Government of India.2Krishna Kumar, Shsiksha Aur Gyan, 2002.3Meshram Mukesh, 2010, Aur Baba Saheb Ne Kaha……, pp.144-45.4Ram ManoharLohia, 2008, Lohia Ke Vichar.5Ram Manohar Lohia, Draupadi, 2008.6Abhay Kumar Dube, Aadhunikta Ke Aaine Me Dalit.7Indumati Kelkar, Dr. Rammanohar Lohia.8Christophe Jaffrelot. India’s Silent Revolution, pp 282-84.9Interviews were conducted on 2-5 October 2010 and 4-5 April 2011 at Ambedkar Nagar and Lucknow.
Chapters.indd 142 10/13/2016 2:58:38 PM

143Education and its Political Context for the Marginalised...
rEfErENcEs duBey, a. K. 2007. Aadhunikta ke Aaine Me Dalit. Vani Prakashan, Delhi.jaFFerLot, C. 2003. India’s Silent Revolution. Permanent Black. Delhi.Kothari, r. 2008. Caste in Indian Politics. Orient Black Swan, Delhi. Kumar, anand. 2010. Understanding Lohia’s Political Sociology: Intersectionality of Caste,
Class, Gender and Language. Economic & Political Weekly. 45 (40), pp. 64- 70.Kumar, K. 2006. Gulami Ki Shiksha Aur Rashtravad. Granth Shilpi Prakashan,
New Delhi. ____. 2002. Shiksha Aur Gyan. Granth Shilpi, Delhi.meShram, m. 2010.Aur Baba Saheb Ne Kaha…(vol.1-5). Rajkamal Prakashan, Delhi. PareL, a. 2009. Hind Swaraj and other writings. Cambridge University Press, New Delhi. SrinivaS, m.n. 2008.Caste: It’s Twentieth Century Avatar. Penguin Publication. Delhi.Sharad, o. 2009. Lohia. Lokbharti Paperback, Delhi.____.2009. Lohia ke Vichar. Lokbharti Paperback, Delhi. yadav, yogendra. 2010. What is Living and What is Dead in Rammanohar Lohia? Economic
& Political Weekly. 45 (40), pp. 92-107.
Chapters.indd 143 10/13/2016 2:58:38 PM

Guidelines for In-service Training Program for Need-based Integration of
ICT in SchoolsZaFar iqBaL*
AbstractFor the purpose of quality education in primary schools, Municipal Corporation of Delhi had initiated ‘Sharda’ Project for Computer Aided Learning Program (CALP). Besides, in order to empower primary teachers of MCD Schools with ICT skills, MCD initiated ‘Shiksha’ project, in collaboration with the Microsoft Corporation (India) Ltd under its program named ‘Partners in Learning’. A 12 days In-Service Training Program on ICT, at its six science centers under the ICT trainers of Microsoft Corporation (India) Ltd (CALP-MCD, 2006) was organized under this programme. Investigator studied the extent of training in ICT, the availability of ICT to the teachers in MCD School. Evaluation of the training in ICT in terms of attainment of competencies conducted a need assessment in further ICT training for the teachers and prepared four phased guidelines for future ICT in-service training for school teachers.
IntroductionTechnical innovation is a continuous process and inventions always remain never ending so tremendous use of ICT is in every sphere of life. A huge amount of ICT is going to be accessed and invented in the next decade (2020-2030). In first decade
of the 21st century, rapid changes in ICT and by ICT have taken place in teaching methods and learning styles with the integration of ICT in teaching-learning. ICT has become, within a very short time, one of the basic building blocks of modern society.
*II Floor, Fatima Apartment, B-9/4, Lane-6, Okhla Vihar, Jamia Nagar, New Delhi-110025.
Chapters.indd 144 10/13/2016 2:58:38 PM

145Guidelines for In-service Training Program for Need...
For changing school practices to provide quality education to every child, the Department of Education of the NCT of Delhi initiated the Computer Education Project in 2000, and later on CALtoonZ, a specialized Computer Aided Learning Program (CALP) was introduced in 2005 in all its schools to ensure that learning in schools is joyful, interesting and meaningful (DOE-GNCT). Some other efforts to bring changes in the schools of Delhi, including those run by the Municipal Corporation of Delhi (MCD); that has become a trifurcated local body, can be observed through the introduction of the use of ICT e.g. use of radio for English conversation, T.V., Computer and at Science centers through Community ICT mode, KYAN.
For the purpose of quality education in primary schools, Municipal Corporation of Delhi had initiated the ‘Sharda’ Project for Computer Aided Learning Program (CALP). Besides, in order to empower primary teachers of MCD Schools with ICT skills, MCD had initiated the ‘Shiksha’ project in collaboration with Microsoft Corporation (India), and a 12 day In-Service Training Program named, ‘Partners in Learning’ at its six Science centers under the ICT trainers of Microsoft Corporation (India) Ltd (CALP-MCD, 2006) was organised under this project.
NEEd of furthEr iN-sErVicE traiNiNg oN ictInvestigator conducted a need assessment of teachers in further
ICT training. Hence, the investigator systematically endeavoured to go through the program objectively. It was also important to bring forward the in-service teachers’ felt needs of further training in ICT.
Investigator observed in-service teachers’ computer operational skills in the CAL Lab of the selected ten schools for observation. It was observed that they were quite unsuccessful due to lack of practice in operation of the computer. In-service teachers’ ICT performance was unsatisfactory. There were computer related problems in the school regarding improper training of teachers, inappropriate number of computers, dysfunctional computers, softwares, educational packages and so on.
Besides, in-service training was perceived in effective to a significant number of the in-service teachers because in-service computer training was either very little useful or not useful for in-service teachers, and in-service teachers could not do project work independently. It was found that in-service teachers had gaps, and these gaps were the same needs that were assessed through the interview. There were substantial number (87.25 per cent) of in-service teachers who were ready to undergo further training under the in-service training in ICT for their own reasons such as they were excited to overcome difficulties, improving and clearing doubts, if the department provided opportunity further. Some
Chapters.indd 145 10/13/2016 2:58:38 PM

146 Journal of Indian Education February 2016
teachers brought out the issues of resistance among teachers about the uses of computer. They said that the computer was introduced in school and became very evident in the last five years, hence, older teachers did not have computer training during that time.
guidEliNEs for futurE ict iN-sErVicE traiNiNg
Eventually, the investigator came up with some useful guidelines for future ICT in-service training program because all working teachers have to undergo in-service training in ICT in the future as bringing quality improvement in education. The National Policy on Information and Communication Technology in School Education-2012. (NPIACTSE) has now become reality with widespread vision from students, teachers, and school management.
Hence, In-service Teacher Training in ICT has become the policy matter at the national level, and all States will have to adopt the policy in future, not as compulsion or trend, but seeing its significance also. Gradually, in-service teachers of all levels will have to undergo the INSET program in ICT. Thus, investigator asked-1. What should be the content of
training on computer?2. How should teachers be trained?3. How should they be evaluated or
assessed whether they have been trained? In relation to the first question,
the investigator suggested basic
competencies, which should be attained by teachers to use ICT in their teaching to improve students’ learning. These are based on the analysis of data and need assessment:• understanding his/her role and
the use of ICT in teaching• abilities to use animation,
presentation, and simulation features in teaching
• skills of fundamental operations of computer and other ICT
• good knowledge of basic IT concepts
• teaching plan; how to get support of ICT during the teaching-learning process
• abilities to use technology to enhance own creativity and teaching-learning
• understanding social, ethical and legal concerns in the use of technology in classroom
• ability to identify useful learning materials from ICT sources.There might be so many additional
points to be more proficient, but as per the investigator’s point of view, these were the minimum in which teachers have to be necessarily competent. But, it is only possible when teachers have certain skills of computer such as:• Knowledge of all peripheral
devices, e.g. scanning, OCR, digitizing, parallel, serial, Internet, Intranet, Ethernet, LAN, WAN, Server, TCP/IP, Printer, Hard disk, DVD writer, Keyboard, Output devices, Input devices etc.
• Basic operations on a computer,
Chapters.indd 146 10/13/2016 2:58:38 PM

147Guidelines for In-service Training Program for Need...
and entering password correctly in both networked environments and in individual systems.
• Using anti-virus program to protect the system against viruses.
• Opening and closing files, naming and renaming files and folders, restoring files and folders, copying and deleting files and folders, and printing documents etc.
• Using multimedia resources, educational software, installation and un-installation of the software or programs, run DVDs or flash drive on the machine.
• Communicating electronically- writing sending and receiving electronic mails etc.
• Using digital cameras and scanners to create documents for using in teaching or publishing.
• Using IT tools by using commonly available software tools e.g., printing on paper, stored in electronic media and disseminated through the World Wide Web, importing scanned images, digital photographs, diagrams, graphical representations of data and bringing out materials ready for dissemination, using other IT tools to enrich documents for publication with photographs taken with a digital camera, images reproduced using scanner and pictorial representation of data and using troubleshooting programs of the operating system to solve the hardware, software and connectivity problems
including anti-virus programs to avoid some of the common troubles.
• Making multimedia presentations by creating, selecting, inserting and importing the graphics in presentation slides and presenting the slides using time controlled presentation techniques.
• Using the Internet as a learning resource. In relation to the second question,
the investigator found out three key principals as are cited in the UNESCO planning guide for ICT in teacher-education for effective ICT development in Teacher Education that were put forward by Society for Information Technology and Teacher Education (2004).1. That technology should be infused
into the entire teacher education programme, implying that ICT should not be restricted to a single course, but needs to permeate in all courses in the programmes.
2. That technology should be introduced in content. Accordingly, ICT applications like word-processing, databases, spread-sheets and telecommunications should not be taught as separate topics, rather encountered as the need arises in all courses of teacher-education programmes.
3. That students’ teachers should experience an innovative technology supported learning environment in teacher-education programmes. This requires that
Chapters.indd 147 10/13/2016 2:58:38 PM

148 Journal of Indian Education February 2016
students’ teachers should see their teacher educators engaging in technology to present their subjects utilising powerPoint or simulations in lectures and demonstrations. Students’ teachers should also have the opportunity to use such applications in practical classes, seminars and assignments.The application of these three
principles will be a milestone towards effectively integrating ICT in teacher-education.
On these principals investigator prepared a blue-print of the ICT training program followed like the NCERT split up model of in-service training under SSA. This training program may have four phases, and every teacher will have to pass every phase, and every phase, will be of several days. All four phases will have to be completed at least in twenty five days during school timings only from 8:00 to 12:30 Hrs, for the morning shift and 13:00 to 17:30 Hrs for the second shift schools teachers. This training should be conducted at the nearest venue i.e. a resource centre for every twenty schools, that should be established with all essential ICT tools and equipments. At the resource centre, there should be a conference room, computer lab with all necessary peripheral devices, software and good infrastructure, and an ICT based classroom where teachers may be assessed in real situations of teaching learning. Formative and summative tests have to be
conducted during every phase and on the last day. This training should be given professionally through teachers educators and IT experts, through strategically selecting transactional methodologies such as- project-based, hands-on experience with technologies-practicum, demonstration, simulations, peer discussions, brainstorming, joint planning, and lectures. All four phases should be carried out in at least five days of the breaks between two phases in the following way-
first PhasE — tWo days’ oriENtatioN Program
In this phase, teachers should be made aware of the importance and possibilities of ICT in teaching-learning. Teacher educator himself /herself will use ICT during the two days’ orientation program at the resource centre during his/her delivery of the model lesson teaching. In this phase, interest in the use of ICT should be generated in the teachers by showing them various easy and simple, but effective techniques such as user interface plug in and play techniques etc. The teacher educator will also discuss learning theories and ICT integration during the classroom processes. Finally, every teacher’s opinion about the use of ICT in teaching is very important to know for the purpose of research and development of the program. On the first day of the training, the resource material in printed form and digitized form should be provided to the in-
Chapters.indd 148 10/13/2016 2:58:38 PM

149Guidelines for In-service Training Program for Need...
service teachers so that they study before coming to the next phase.
There may be the trainees, who have already good knowledge of ICT, and they may cause disturbance to beginners. They should be separated from the beginners by keeping them in a separate batch of the second phase. These teachers may be trained easily as Master Trainers or Model Teachers in ICT who can use ICT effectively in the teaching-learning process.
sEcoNd PhasE — EightEEN days’ comPutEr skills Program
In this phase, teachers will develop their skills, and try to be more competent in every component of skills such as basic hardware skills, fundamental operation skills that include understanding the system environment, using applications of the software, using multimedia, and browsing/surfing on the Internet. Before beginning this phase, every in-service teacher will access the computer only through his/her user ID.
During this training phase of the program, first computer literacy should be brought among the teachers through the fundamental operation of the computer and content of training that follow :a. Peripheral Devices and
Functions – Start/ Shut down, On / Off, all applications of the devices.
b. System Environment – (Windows Operating System, others) opening, closing and saving files,
optimising hard disk, managing files, opening and renaming files, viruses etc.
c. Software Applications – MS Office applications such as Word processing (MS Word), Spreadsheet (Excel), Presentation (PowerPoint), Website navigation, and, Internet searching (Internet Explorer) and E-mailing (MS Outlook).
Graphics and drawing, designing print materials, scanning text and graphics, video production and editing, and chatting within teachers’ discussion groups. During this eighteen days’
training in computer, teachers should be assessed through centrally controlling and monitoring the program with the help of necessary software individually through checking his/her progress through his/her user ID anytime.
On the last day, every teacher should be given at least ten different projects based on the practical applications of the training. These projects will have to be prepared by teachers from outside the computer lab or these may be prepared at home. After completion, these will have to be submitted to the coordinator of the program in soft and hard copy. The coordinator will download these projects in their user ID and prepare a report of the trainee about his/her attained competencies. If he/she attains 80 per cent of competencies (Bench Mark), he/she will be allowed the next level of the phase, otherwise
Chapters.indd 149 10/13/2016 2:58:38 PM

150 Journal of Indian Education February 2016
this phase will be repeated by him/ her.
third PhasE — thrEE days’ WorkshoP oN PEdagogical iNtEgratioN of ict tools
Successful in-service teachers of phase two will participate in this workshop to perform on the acquired IT skills which will be integrated with their pedagogy innovatively and creatively. The entire program in this phase will be recorded through a video camera to maintain a record.
During this phase, trainees could learn the specific use of applications of the software and ICT tools, ICT tools integration with the unit plan, approaches to managing ICT-based teaching groups, assessment of students’ learning through the use of ICT and creating teachers and students’ support materials as per the syllabus. Teachers will also learn how ICT is used in administration, record-keeping, reporting and transfer of information, and maintaining their personal teaching records etc. Teachers will also be made aware of social, legal, ethical and health issues regarding the use of ICT. They will have to be trained in integration of ICT into teaching specific subjects, which are taught at the school level, such as- English, Hindi, Urdu, Mathematics, environmental studies, science, social science etc.
After completion of this phase, teachers will have to prepare five lesson plans on five different subjects of different classes that will be taught in the real situation with the help of ICT in the next phase.
fourth PhasE – tEachiNg With ict iN rEal situatioNs
The teacher educator has a very important role because any two lesson plans of the five will have to be observed critically during the model teaching with the use of ICT. His/her critical remarks will depict the specific character of the teacher’s teaching with the use of ICT. Teachers will perform on these two lesson plans selected by the teacher educator in the real classroom situation at the resource centre, where all the necessary ICT tools are already available. All trainees will be passive observers to observe the problems during teaching with the use of ICT and what steps have to be taken to sort out the problems by themselves.
Eventually, after a successful completion of all these phases, all trainees could be expected to teach in the classroom, making use of ICT that will enhance the students’ learning and improve quality of education. But it will be concern that all necessary functional ICT tools should be available in the schools.
Chapters.indd 150 10/13/2016 2:58:38 PM

151Guidelines for In-service Training Program for Need...
rEfErENcEs
CaLP. 2006. Book of Guidelines for Teachers to Use CDs. Department of Education of Municipal Corporation of Delhi and Azeem Prem ji Foundation. Published by Planning, Research and Extension, MCD.
doe. 2008. A Quick Report. Directorate of Education, GNCT-Delhi.gnCt deLhi. ICT Policy, Government of NCT of Delhi. Retrieved July 31, 2007 from
http://delhigovt.nic.in/icetpolicy.pdf iqBaL, Z. and nadeem, S. F. 2013. ‘An Evaluative Study Of In-service Programme on ICT for
Primary Teachers Run by MCD Science Centers’. Department of Teacher Training & Non Formal Education (IASE), Faculty of Education, Jamia Millia Islamia, New Delhi. (Unpublished Ph.D. Thesis)
maLiK, u. 2001. Information and Technology in Schools: Curriculum Guide and Syllabus. NCERT, New Delhi.
mhrd. 2012. National Policy on Information and Communication Technology in School Education. Department of School Education and Literacy, Ministry of Human Resource Development, Government of India, New Delhi.
_____. 2010. Revised ICT @ Schools Scheme. Department of School Education and Literacy, Ministry of Human resource and Development, Government of India.
mPiL. 2004. Microsoft-Partners in Learning. Retrieved, August 15, 2007, from http://www.microsoft.com/india/msindia/msindia_up_partnerslearning.aspx
mPS. 2004. Microsoft’s Project Shiksha. Retrieved August 30, 2007, from http://www.microsoft.com/india/education/pil/shiksha
nCert. 2007. The Reflective Teacher - Organisation of In-Service Training for the Teachers of Elementary Schools under Sarva Shiksha Abhiyan (SSA) - Guidelines, 2006, NCERT, New Delhi.
nPiaCtSe. 2012. National Policy on Information and Communication Technology in School Education 2012. Department of School Education and Literacy, Ministry of Human resource and Development, Government of India. New Delhi.
uneSCo. 2009. Guide to Measuring Information and Communication Technologies (ICT) in Education. UNESCO, Institute for Statistics.
Chapters.indd 151 10/13/2016 2:58:38 PM

Chapters.indd 152 10/13/2016 2:58:39 PM