Embed Size (px)
Citation preview


EDITORIALShri Y.C. NandaChairmanAFC Ltd.
Shri A.K. GargManaging DirectorAFC Ltd.
Shri L.N. Vasudev RaoGeneral ManagerUnion Bank of India
Shri G.C. SharmaGeneral ManagerBank of Baroda
Shri Gobinda BanerjeeGeneral ManagerPunjab National Bank
Shri E. ShivalingamGeneral ManagerUCO Bank
Shri P.C. SrivastavGeneral ManagerCentral Bank of India
Shri N. Narasa ReddyGeneral ManagerCanara Bank
Shri P.M. KshirsagarGeneral ManagerAFC Ltd.
HonoraryAdvisory Board
Views expressed by the authors do notnecessarily reflect those of the AgriculturalFinance Corporation Ltd. No permission isnecessary to reproduce contents except
for the copyright text.
Global warming or global cooling?
The climate summit which was held in Copenhagen, Denmark from Dec 7-18, 2009was watched with great expectations as 192 countries participated to tackle theproblem of climate change. The Copenhagen Accord sets the goal of limiting globaltemperature increases to 2 degree celsius though it does not set any binding targetsfor emission reduction. Both developing and developed countries will have to informUNFCCC of its commitment to reduce emission of greenhouse gases to mitigate theeffects of climate change. The rich countries have pledged to contribute US$30billion between 2010 and 2012 and $100 billion by 2020 for developing countries,particularly vulnerable countries and small island states, to help adapt to and mitigatethe effects of climate change.
There is another viewpoint as promoted by Shri Janardhan Negi, an Indian geophysicistthat the global warming phase will change to global cooling and the temperatureanomaly will decline substantially by the year 2030. Some effects of the process arealready evident in the cold wave of 2010 which has brought about widespreadsnowfall in almost the entire northern hemisphere. According to Shri Janardhan Negi,there is a strong global cyclic weather phenomenon which is independent of thegreenhouse gas emissions.
In July 2008, some leading climatologists and meteorologists met in New York at theEnergy Business Watch Climate and Hurricane Forum. The forum strongly suggestedthat a period of global cooling is emerging, but what restrained them from spelling itout categorically was a possible concern of a political backlash.
This theory is also backed by Intergovernmental Panel on Climate Change (IPCC)scientist Mojib Latif, who in an article in Daily Mail in January this year wrote “we’rein for 30 years of cooler temperatures” which he calls it a “mini ice age”. His theoryis based on an analysis of natural oscillations in water temperatures in the oceans.However, he believes the current cold weather pattern as a pause, a “30-years-longblip”, in the larger cycle of global warming, which postulates that temperatures willrise rapidly over the coming years.
Whatever be the direction of climate change in the short-run as well as long run,what is of utmost importance is for agricultural scientists to take stock of the situationand maintain sustainability of agriculture so that the food security of the humanpopulace as well other living creatures is not jeopardised.
A.K. GargEditor-in-Chief
I N SAnnual Subscription
India, Nepal andBangladesh Rs. 600/-
Other Countries(By Air Mail) US$70
Single Copy Rs. 50/-
Agricultural FinanceCorporation Limited
Dhanraj Mahal, ChhatrapatiShivaji Maharaj Marg,Mumbai 400 001
Tel: 91-022-22028924Fax: 91-022-22028966Email: [email protected]: www.afcindia.org.in
Role of Greenhouse Technology in
Precision Farming: An Indian
Perspective ....................... 6
Issues on Management of Coastal and
Marine Biodiversity............ 9
Marketing Analysis of Milk Production
in Shirpur Tehsil of Dhule District of
Maharashtra (India) ............ 14
A Road Map to Wholesale Market
Infrastructure -PPP Mode .. 16
By K.S. Kumar and K.N. Tiwari
By K. Venkataraman
By Vijay Gorakh Patil
By Satyaveer Singh and Subah Singh Yadav

I D EEditorial Board
Published byAgricultural FinanceCorporation Ltd.Dhanraj Mahal, ChhatrapatiShivaji Maharaj Marg,Mumbai 400 001
Produced byL.B. Associates Pvt Ltd.H-108, Sector 63, Noida - 201301Tel: 91-120-2427280/82,Fax: 91-120-2427108Email: [email protected]: www.lbassociates.com
Editor-in-ChiefShri A.K. Garg
EditorG. Kalyan Kumar
Associate EditorLinda Brady Hawke
Desk EditorManish Sharma
Events & AdvertisingRitu Khanduri91-9891173723
DesignAtul Kumar
Agrarian Crisis: Distress & Suicide .. 22
Real Time Gross Settlement: Need
for Customers .............................. 28
Honesty ki Jhappi Opportunity for India’s
Social Revolution........................... 31
Statistical Overview of Agriculture
Production in India ........................ 33
News ........................................... 37
India’s Fertilizer Capacity to Expand 42
By Dr. B.B. Sahoo
By K. Kannusamy and Sathish Kumar
By Prajapati Sudhirkumar Rameshbhai

COVER STORY
6
By K.S. Kumar and K.N. Tiwari*
Introduction
India has witnessed an increase in foodgrain production from 51 million tonnes(50’s) to 206 million tonnes at the turnof the century and that has helped inachieving self sufficiency. However, quickshrinking of the agricultural landthreatens sustainable production of foodgrains and its ability to feed ever growingmouths. In this context, careful tailoringof soil and crop management practicessuitable to local needs is of greatimportance to keep up the pace ofproduction. Precision Farming otherwisecalled prescription farming or site-specificfarming helps to overcome theseconstraints by accurately assessing thevariability of crop production practices inspace-time continuum by utilizing toolslike Global Positioning System (GPS),Geographical Information System (GIS),Remote Sensing (RS) and Sensors.
Since ancient time, mankind has been
aware of the fact that a wise modification ofthe environment could improve theproductivity of crops. For instance, the factthat light transmitting shelters could createa suitable environment was certainly knownto the Romans, as Emperor Tiberius used toeat a cucumber daily. Infact, the concept ofControlled Environment Agriculture (CEA)was not a novel idea and has been in usesince a long time. Greenhouse Technologyhas been considered as the core part ofprecision farming and has a tremendous roleto play in Indian horticulture by increasingthe availability of fresh vegetables, fruits andflowers and thereby leading to betternutrition and improved standard of living.
A greenhouse can be defined as a “framedor an inflated structure with a transparentor translucent material in which crops couldbe grown under at least partially controlledenvironment and which is large enough topermit persons to work within it to carryout cultural operations”. The greenhouse isnow better understood as a system of
controlled environment agriculture(CEA), with precise control of air,temperature, water, humidity, plantnutrition, carbon dioxide and light.The inside environment(microclimate) of the greenhouse iscontrolled by growth factors likelight, temperature, humidity andcarbon dioxide concentration. Theyare scientifically controlled to anoptimum level throughout thecultivation period, thus increasing theproductivity by several folds.
Greenhouse Production
The liberalized seed policy in the lateeighties, globalization of Indianeconomy and the economic reformsinitiated in the early nineties pavedthe way for the advent of state ofthe art protected cultivationtechnology in India. The use ofgreenhouses for commercialagricultural production in India had
Role of Greenhouse Technologyin Precision Farming:
An Indian Perspective

COVER STORY
7
to wait until the technology becameadvanced enough in late nineties for theproducts to be sold at competitive prices.After the advent of plastics applicationin agriculture, greenhouse technologyevolved as a breakthrough in theagricultural production technology. It hasintegrated market driven qualityparameters with production systemprofits. Today, the expertise is such thatin principle, it is possible to let the climatecontrol computer to produce themicroclimate desired by the groweraccording to the need of a particular cropwith the benefit-cost ratio being morethan one.
Despite its late entry, Indian greenhouseindustry made rapid strides and nearly300 to 500 ha of area has been broughtunder protected cultivation ofhorticultural crops. Abundant sunshinethroughout the year especially in theautumn and winter season is perhaps thefirst blessing for year round productionand that too without depending onartificial light and the related costescalation due to additional energy input.However, necessary steps to reduce thehigh summer temperatures in thegreenhouse by adopting suitable cost-
Sl.No Country Area (ha)
1 Algeria 500
2 Australia 600
3 Belgium 2400
4 Bulgaria 1350
5 Canada 400
6 Chile 1600
7 China 48000
8 Columbia 2600
9 Egypt 1000
10 England 3500
11 France 5800
12 Greece 4240
13 Hungary 5500
14 India 500
Sl.No Country Area (ha)
15 Israel 2200
16 Italy 18500
17 Japan 42000
18 Jordan 450
19 Moracco 3000
20 Netherlands 9600
21 Poland 1500
22 Portugal 2500
23 Romania 3500
24 Spain 25000
25 South Korea 21000
26 Turkey 9800
27 USA 4250
Table1: Area under Greenhouse in Different Countries
Source: Jensen and Malter.1998. ProtectedAgriculture - A global review World BankTechnical Paper No.253.
Design of Greenhouses
India has varied climatic conditions indifferent regions, so the greenhouse andthe supporting facilities have to bedeveloped accordingly. Design of thegreenhouse should vary as per the localagro-climatic conditions keeping in viewthe economic constraint. The southernplateau and the coastal regions neednaturally ventilated polyhouses andnorthern plains with composite climaterequire both cooling and heatingfacilities. The initial cost of thegreenhouse generally depends upon thecost of the structure, cladding andtemperature control mechanism andwhere as the operational cost relies uponmainly upon the maintenance oftemperature and humidity in thegreenhouse.
Low Cost Greenhouses forNursery and Off-SeasonCultivation of Vegetables
Large scale expansion of nursery and off-season cultivation of vegetables undercost-effective greenhouse structures isnecessary to produce healthy seedlingsand for consumption of fresh vegetablesat lesser cost. Greenhouse design,structure and technology for producinghigh quality planting material need to be
effective cooling methods are necessaryto boost up the year round greenhouseproduction in India.
Fig: 1. Greenhouse designs suitable for subtropical India

8
COVER STORY
Crop Greenhouse Open field Hydroponic
Tomato 150 50 187.5
Cucumber 180 8 250
Capsicum 110 100 -
Broccolli 15 7 -
Yield (tonnes/hec)
Table 2: Comparison of yield in open field, greenhouse andhydroponic system
(Source: Chandra et al., (2003)
fine tuned to suit local climatic conditions. Efforts are also needed to develop suitabletechnology for production of healthy and well developed seedlings in plastic perforatedtrays. New growing media like soil less culture need to be standardized for optimumplant growth.
Greenhouse Floriculture Production
In view of the growing international demand for floriculture products, especially cutflowers which have been registering an annual growth of over 11 percent(Anonymous, 1997), floriculture was given a priority status for export oriented marketdevelopment in India. Cut roses accounted for 19 percent of the international cutflower trade and therefore, special attention is required in developing cut roseproduction as the major crop for export in India. However, in order to meetinternational standards for cut flowers, special greenhouse structures equipped withautomatic environmental gadgets are required. However, the promotion of “hi-techfloriculture” as a specialized industry in India requires hand to hand support fromboth greenhouse growers and the government. The state-of-the-art technologyimported from abroad for greenhouse floriculture needs substantial amendment withrespect to the design of greenhouse to achieve cost effective production and becompetitive in the global market.
Greenhouse Cultivation inPrecision Farming DevelopmentCentre, IIT Kharagpur
The precision farming developmentcentre of IIT, Kharagpur has been activelyinvolved in conducting field research,training and dissemination of developedtechnologies on greenhouse cultivationof crops for the benefit of farmers andstate government officials. A briefdescription of concluded researchactivities includes design anddevelopment of low-cost plasticgreenhouses for seedlings and offseasoncultivation of vegetables and their yieldresponses. Estimation of waterrequirement for different vegetable cropshas been documented. Apart from these,the centre has initiated an in depth studyon the design aspects of greenhousefloriculture suitable for eastern climaticconditions of India. Studies on thevariation of microclimate in thegreenhouse coupled with derivingbenefits of cost effective coolingmethods to reduce high summertemperatures for floricultural productionhave also been undertaken.
Conclusions
Greenhouse Technology has got atremendous role in keeping up the paceof precision farming in Indian Agriculture.Protected cultivation of vegetables andflowers not only increases thesustainability of agricultural productionbut also improves the standard of living.Necessary steps to maintain the glory ofthe greenhouse Industry include:
1. Improving the domestic marketsfacilities to offer high prices for theproducts of greenhouse
2. Exploring high value productalternatives such as propagatingmaterials of export oriented crops.
3. Developing vertical integration andjoint ventures that could be adoptedby Indian growers.
4. Establishing a network of supportsystems from the government,universities and the private sector willbe of immense value for growers andthe industry.
* K.S. Kumar and K.N. Tiwari
Agricultural and Food EngineeringDepartment, IIT Kharagpur
Fig: 2. Greenhouse Production of Gerbera in Greenhouse at PFDC, IIT Kharagpur
9
BIODIVERSITY
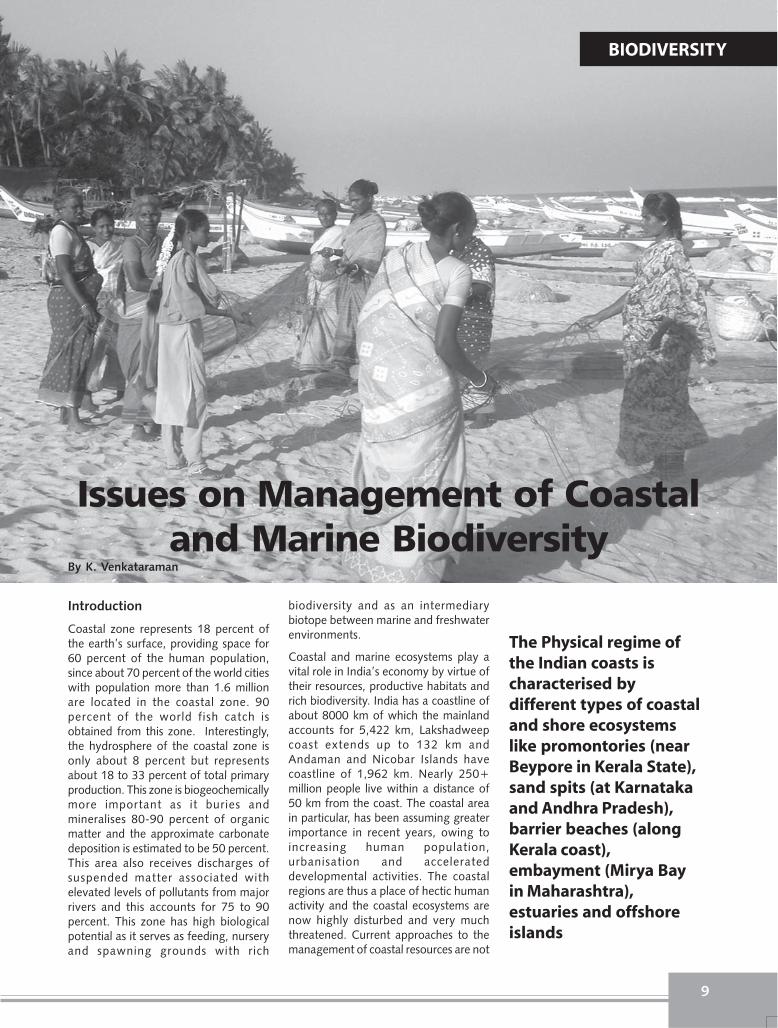
Issues on Management of Coastaland Marine Biodiversity
Introduction
Coastal zone represents 18 percent ofthe earth’s surface, providing space for60 percent of the human population,since about 70 percent of the world citieswith population more than 1.6 millionare located in the coastal zone. 90percent of the world fish catch isobtained from this zone. Interestingly,the hydrosphere of the coastal zone isonly about 8 percent but representsabout 18 to 33 percent of total primaryproduction. This zone is biogeochemicallymore important as it buries andmineralises 80-90 percent of organicmatter and the approximate carbonatedeposition is estimated to be 50 percent.This area also receives discharges ofsuspended matter associated withelevated levels of pollutants from majorrivers and this accounts for 75 to 90percent. This zone has high biologicalpotential as it serves as feeding, nurseryand spawning grounds with rich
biodiversity and as an intermediarybiotope between marine and freshwaterenvironments.
Coastal and marine ecosystems play avital role in India’s economy by virtue oftheir resources, productive habitats andrich biodiversity. India has a coastline ofabout 8000 km of which the mainlandaccounts for 5,422 km, Lakshadweepcoast extends up to 132 km andAndaman and Nicobar Islands havecoastline of 1,962 km. Nearly 250+million people live within a distance of50 km from the coast. The coastal areain particular, has been assuming greaterimportance in recent years, owing toincreasing human population,urbanisation and accelerateddevelopmental activities. The coastalregions are thus a place of hectic humanactivity and the coastal ecosystems arenow highly disturbed and very muchthreatened. Current approaches to themanagement of coastal resources are not
By K. Venkataraman
The Physical regime ofthe Indian coasts ischaracterised bydifferent types of coastaland shore ecosystemslike promontories (nearBeypore in Kerala State),sand spits (at Karnatakaand Andhra Pradesh),barrier beaches (alongKerala coast),embayment (Mirya Bayin Maharashtra),estuaries and offshoreislands

10
BIODIVERSITY
adequate for sustainable developmentand the coastal environments andresources are being rapidly degraded anderoded in India (Whittingham et al.,2003).
The Indian mainland coast is divided intotwo parts: West Coast and East Coast.The West Coast is fronted by the ArabianSea and the East Coast is by the Bay ofBengal. Other than these mainlandcoasts, there are three island groups suchas Lakshadweep in the south ArabianSea, Andaman and Nicobar in the easternBay of Bengal. The east and west coasts
islands.
Further, the coastal zone of India is alsoendowed with a very wide range ofecosystems such as estuaries, lagoons,mangroves, backwaters, salt marshes,rocky coasts, sandy stretches and coralreefs which are characterised by uniquebiotic and abiotic properties andprocesses (Venkataraman and Wafar,2005). Not realising the importance ofthe coastal and marine ecosystems andits multiple uses, the coastal populationexploit the biological resources andinterferes and modifies the basic coastalprocesses (Mehta, 1999). Traditionally,coastal areas of India are highlypopulated and developed because theyare the places where trade, transport,communication and civilisation are welldeveloped. It is estimated that, out ofthe 25 global mega cities, 15 would beon the coast. In India, out of the three
are markedly different in their geo-morphology. The West Coast is generallyexposed with heavy surf and rocky shoresand headlands. The East Coast isgenerally shelving with beaches, lagoons,deltas and marshes. It is also relativelylow lying with extensive alluvial plainsand deltas. The Physical regime of theIndian coasts is characterised by differenttypes of coastal and shore ecosystemslike promontories (near Beypore in KeralaState), sand spits (at Karnataka andAndhra Pradesh), barrier beaches (alongKerala coast), embayment (Mirya Bay inMaharashtra), estuaries and offshore
mega cities with population more than10 million, Delhi (13.2 million), Mumbai(16 million) and Kolkata 16.5 million, twoare coastal cities i.e. Mumbai andKolkata. The population density is alsomuch more in coastal areas than thenational average. For example, in thestate of Tamil Nadu, the populationdensity in coastal areas is 528 per sq kmagainst 372 per sq km which is stateaverage. In parts of coastal metros likeMumbai, Kolkata and Chennai thepopulation density ranges from 20,000to 50,000 per sq km. The increasedpopulation pressure has led to resourcedepletion and environmentaldegradation due to coastal pollution,disposal of domestic wastes and industrialwastes. As in most of the developingnations, the coastal environmentalproblems and issues in India are alsoconcerned with the following three mainconditions: environmental degradation,resources reduction and user conflicts.
The coastal situation in India mirrorsglobal trends where unsustainable use ofnatural resources, pollution and habitatdestruction are resulting in significant, ifnot fully irreversible, loss of the marineand coastal life support systems. Overfishing and the use of destructive fishingpractices and habitat conversion haveresulted in alarming degradation ofcoastal areas.
Coastal regions in India areexperiencing:
• Population growth in the coastal areasis mainly due to migration of job lessvillagers who were once working inagricultural fields.
• Widespread poverty in coastal areasfishers in particular among the poorestof the poor;
• Declining fisheries productivity in Indiais due to over harvesting and loss ofhabitats. Increasing population andpoverty have put additional pressureon resources.
• Fish production has increased over adecade but per capita consumption offish has declined.
• Increasing environmental damagesdue to human induced activities.
Pollution from land-based activities,Industrial and Urban Development:India stands at the threshold of this new
The description of the areas of coastline in different coastal states in India.
The increasedpopulation pressurehas led to resourcedepletion andenvironmentaldegradation due tocoastal pollution,disposal of domesticwastes and industrialwastes

11
BIODIVERSITY
millennium probably with a bleak pictureof the status of coastal resources andmuch to do to reverse the current trend.Without the sincere efforts of managersand scientists this cannot be achieved.In order to sustain and eventuallyimprove the benefits we derive fromcoastal resources, momentouscommitments and investments must bemade by local coastal communities.Government of India, StateGovernments, and Non GovernmentOrganizations should put in additionaleffort in conservation and sustainable useof coastal resources. Furthermore, theseefforts and initiatives must becoordinated and harmonized to achievethe goal of carrying these benefits tofuture generations. Coastal and marinemanagement provides the tools forslowing and hopefully reversing thenegative impacts of uncontrolled use ofthese resources. Coastal and marinemanagement also provides the essentialprocesses for integration of all sectoral,spatial, temporal, policy and institutionalcomponents crucial to achieve the goalof sustainable development.
Resource use Conflicts: Naturalresources are those products readilybestowed to us by nature from whichhumans derive value. Forests, fisheries,minerals, water, and land resources arevaluable commodities in India. Resourceuse conflicts arise when the benefitsderived by one group of people using oneresource have an impact on the benefitsderived by another group using the same
or another resource (Devaraj andVivekanandan, 1999). Similarly, overuseof one resource may affect the relativehealth or abundance of another resourcewithin an environmental system. Suchimpacts are not always obvious and mustbe understood.
Examples of resource conflicts that canbe addressed by coastal and marinemanagement include:
• Siltation from deforestation byresource users in upland areasnegatively impacts coastal habitats andfisheries in coastal areas;
• Intrusion of commercial fishing incontinental shelf regions results inoverexploitation of limited fisheriesresources where relatively fewindividuals benefit; and
• A probable lack of specific regulations(local and national) for fishing activitieswithin known productive fishinggrounds where small-scale fishers aredirectly dependent for livelihood.
Coastal areas all over India aredeveloping rapidly because, people liketo live near the sea. The consequence isthat beaches, coastal land areas, and nearshore coastal habitats are in greatdemand and are being utilized for a widevariety of conflicting human usesincluding industry, construction,dumping, boat landings, tourism, andhabitation. Many user conflicts betweentraditional and mechanized fishers stillpersist within the 10 and 15 km limits.
While commercial fishing is strictlyprohibited within coastal waters bynational laws, intrusion of large, highlyefficient, mechanized fishing boats isprevalent. One result of the conflictbetween the mechanized and traditionalsectors is decreasing catches. Asindicated, catch from the traditionalsector is being overtaken by catch fromthe mechanized and aquaculture sectors;meanwhile, traditional fishers aregrowing in number. The willingness offishers to continue fishing when catchesare declining indicates the relative lackof alternatives and the small value fishersenforcing time. If properly implemented,reserving the use of traditional fishinggrounds by state and central law servesas a strategy for restricting access,reducing fishing pressure, and improvingthe condition of traditional fisheries formore fishers for a longer time. Localmanagement regimes that clarify andlimit user rights will improve sustainabilityof fisheries. An increasingly commonsituation is some of the recentdevelopmental projects. These projectsare encroaching large areas of coastalhabitats, such as seagrass beds, coral reefand mangrove forests, thus permanentlyeliminating nursery grounds for fisherieswithout mitigation measures.
Population growth and Poverty:Population growth in coastal areasintensifies resource use conflicts in many
Fish Production in India (lakh tones)
Coastal areas all overIndia are developing
rapidly because, peoplelike to live near the sea.The consequence is that
beaches, coastal landareas, and near shorecoastal habitats are ingreat demand and are
being utilized for a widevariety of conflicting
human uses includingindustry, construction,
dumping, boat landings,tourism, and habitation

12
BIODIVERSITY
ways. The coastal areas are under increasing pressure fromrapid population growth and the consequent concentration ofdevelopment activities in the coastal strip (Whittingham et al.,2003). More than 25 percent of Indian population lives incoastal areas because all major cities such as Mumbai, Chennaiand Kolkata are situated in the coastal region and most largeindustries are located close to the sea. In addition, the mostproductive natural ecosystems in the country situated alongthe coast and support many people. As the population densityincreases the quality of life and the environment declines forthe average person living in a coastal area.
Illegal Activities: The destruction of coastal habitats and declineof fisheries are to a large extent due to the proliferation ofillegal activities. While national policies and laws existprohibiting a wide range of activities in coastal and marineareas, without swift and enforcement of these laws, illegalactivities still continue. Examples of illegal and damagingactivities that can be addressed by coastal management include:
• Use of destructive and illegal fishing methods such as blastfishing, poisons, super lights, and others such as intrusion ofcommercial fishing into traditional fishing grounds, lack ofregulations resulting in damaging construction anddevelopmental activities in the coastal zone;
• Conversion of mangrove and seagrass habitats to land orother uses resulting in decline of near shore catch;
• Harvesting of banned species including corals, whale sharks,manta rays, giant clams and other endangered marinespecies; and
• Habitat destruction from other sources.
Enforcement of different acts promulgated by the parliamentof India needs to be encouraged and become accepted as animportant means to improve the status and productivity ofcoastal ecosystems. Fisheries will improve significantly if illegalfishing is stopped. Public education and better enforcement
are two strategies that have proven to be effective.
Although it is a fact that the coastal areas from mean high tideto 500 m inland are protected by law and reserved as openaccess space where no building or private ownership is allowed(Coastal Zone Regulation), this law is not being enforced strictlyby many states. Enforcing this law will prevent overcrowdingand environmental degradation in coastal areas. Coastal landuse and coastal areas all over India are being developed rapidlysince people like to live and do business near the sea. Theconsequence is that beaches and coastal land areas are indemand and are being utilized for industry, construction,dumping, boat landings, recreation, habitation, and many otheractivities.
Illegal fishing methods, such as blast fishing that are known todestroy or shatter the physical structure of the coral reef, createconsiderable losses to society (Venkataraman and Wafar, 2005).The impacts of illegal and destructive fishing practices on theenvironment are long term and irreversible, with continuingreductions in net returns for all types of fishing methods.
Aquaculture Development: Aquaculture activity got a boostin the early 1990s in the coastal parts of India on account ofeconomic liberalization policies initiated by the Governmentof India. The increased production was both a result of increasedarea under expansion and increased productivity. Coastalaquaculture in India is mainly related to shrimp farming. Thecontribution of cultured shrimps to the total shrimp exportincreased from 48.78 percent in 1988-89 to 75.07 percent in1998-99. However, it suffered a setback with the SupremeCourt declaring it contrary to the Coastal Regulation Zonenotification and banning all aquaculture activities, excepttraditional and improved traditional within up to 500 m of theHigh Tide Line (HTL) in most coastal areas.
The primary concern in India related to aquaculturedevelopment is the conversion of coastal ecosystems, primarilymangrove, to fish, seaweed or shrimp ponds (Nanda Kumar etal., 2001). This activity has replaced original mangrove forestin the country. Another significant impact results from variouskinds of pollution generated by aquaculture because it isessentially a farming system that uses fertilizer, feeds, andchemicals. In concentrated form, they are detrimental to nearshore water quality, natural fisheries, and human health.Considering the environmental damages of aquaculture

13
BIODIVERSITY
practices, the Supreme Court of Indiabanned aquaculture within CRZ andentrusted the job of issuing clearance tothe farms for the existing/proposed farmsoutside the CRZ to the AquacultureAuthority constituted as per thedirections of the Supreme Court of Indiawith headquarters at Chennai. To assistthe Authority in regularizing shrimpfarming, State level committee andDistrict level committees have beenconstituted in the State.
Inadequately regulated coastaldevelopment has resulted in severalissues: Adequate measures are essentialto create an open space for access, tominimize negative impacts on the nearshore marine systems such as reefs and
or near the beach. Although sandybeaches normally replenish themselvesafter a storm, once a beach wall orperpendicular jetty is in place, the naturalmovement and return of the sand isprevented. Thus there is a need toprevent all construction in the coastalareas. Examples of this problem caneasily be seen along developed shorelinessuch as on Lakshadweep Island or insome islands of Andaman, where naturalbeaches have disappeared; squattingshould also be prevented in the coastalareas. Such settlements are difficult toget rid of. They have the excuse that theyare poor, landless people with fewalternatives. Unfortunately, thecontinued prevalence of squatting onlyencourages more people to do the same,mostly detrimental to coastal and beachareas and any hope of environmentalintegrity.
(To be continued……)
seagrass beds, to minimize erosioncaused by structures on the beach, toeffectively control dumping into the sea,and to create a visually attractive area,uncluttered with haphazard devel-opment. Increased pollution in near shorewaters is often emanated from shorelineareas where there is a lack of control onactivities. Domestic waste generated inshoreline communities enters in to thesea. Septic systems constructed too closeto the beach drain in to the sea andpollute the near shore areas, especiallyin densely populated areas and islandssuch as Lakshadweep and Andaman.Dumping of solid waste in near shoreareas is a related problem. Constructionactivities near the beach and sea oftencause silt to wash into marine waters andsmother reefs and seagrasses or affectnear shore fisheries.
Erosion of beach sand, usually resultsfrom the construction of structures on
Increased pollution innear shore waters is oftenemanated from shorelineareas where there is a lack
of control on activities.Domestic waste
generated in shorelinecommunities enters in to
the sea. Septic systemsconstructed too close tothe beach drain in to thesea and pollute the nearshore areas, especially indensely populated areas
and islands such asLakshadweep and
Andaman

14
ANALYSIS
Marketing Analysis ofMilk Production in
Shirpur Tehsil of Dhule Districtof Maharashtra (India)
By Vijay Gorakh Patil*
Introduction
Dairy farming has been recognized as animportant source of income and is moreremunerative in comparison to cropproduction in India. Milk production inIndia is predominantly the domain ofsmall farmers in mixed farming system.Scientific dairy management helps thefarmer to channelize his limited resourcesto maximize returns from his dairy farm.
The importance of dairying lies not onlyin products but also it brings aboutsignificant changes in socio-economicstructure of rural economy. The NationalCommission on Agriculture (1976)observed dairying as an additionalenterprise for improving the status of
profession of their own choice. Thelargest part of Indian population isengaged in agriculture as a mainoccupation. However, the mainoccupation of agriculture does not seemto meet the need of an individual, as thepressure on land holdings is mountingday-by-day due to population explosion.A subsidiary income source is necessaryto contemplate with the situation, so thatour farmers can achieve enough foodsecurity. Indian farmers have adoptedanimal husbandry as a subsidiaryoccupation. Dairying is recognized as thebest alternative to provide employmentto rural people in order to improve theirliving condition. Dairy enterprise providesready cash in hand to rural householdsfor fulfilling their daily requirements.Therefore, it was essential to bring thecost structure of milk production in frontof dairy farmers enabling them to decideat what price the milk should be sold.The investigator also focused on the factthat the farmers should understand howthe input cost would be reduced and theprofit increased.
Selection of Respondents
Primary data were collected from therandomly selected farmers from eightvillages of Shirpur Tehsil. Thus a sampleof 50 dairy farmers was drawn for thestudy.
The random sample survey study on fifty dairy farmers from eight villages ofShirpur Tehsil of Dhule District of Maharashtra (India) was undertaken to knowthe cost of production of milk in the study area. The total cost of milk productionper cow/buffalo was Rs. 113.87 in which the variable cost was 83.76 percent(Rs. 95.38) and remaining Rs. 16.24 percent (Rs. 18.49) was fixed cost. In variablecost, the cost of feed stuff was 73.39 percent (Rs. 70). Labour cost was 15.73percent (Rs. 15.00), the cost of medical treatment was 2.62 percent (Rs. 2.50)and interest on working capital was 8.26 percent (7.88). Finally it was foundthat the cost of milk was Rs. 9.10 per liter in the study area.
rural masses especially weaker sectionsconsisting of small, medium & landlesslaborers. It is therefore, becomesessential to examine the production costof milk.
Explanation of the problem
In this research the investigator hadstudied the production cost of milk at thefarmer level in Shirpur Tehsil of DhuleDistrict of Maharashtra state (India). Theinvestigator had selected fifty dairyfarmers from eight villages from ShirpurTehsil, District Dhule. In thequestionnaire, questions related to fixedand variable cost were asked. It wasdistributed to dairy farmers for collectingprimary data. The collected data wasanalyzed by using the statistical toolpercentage and conclusions were drawn.
Objectives of Assignment
To estimate the cost of milk production.
Hypothesis
The hypotheses were formulated fortesting through empirical data on theobjectives of the present study.
The cost of milk production would beestimated.
Significance of the Study
Our country being the largest democraticone in the world, any person can have a

15
ANALYSIS
Preparation of InterviewSchedule
A structural interview schedule,consisting of relevant questions relatedwith the objectives of the study wasprepared. Every precaution was taken tokeep the language simple so as to getdesired responses from the respondents.The interview schedule was developedin Marathi (Local Language) for betterunderstanding for the dairy farmers. Itcontained questions related to the costof milk production, cost of feed etc.
Pre-testing of Interview schedule
The Interview schedule so developed waspre-tested for its accuracy, simplicity andpracticability with a group of 10 dairyfarmers in village Dahiwad. Consideringthe experience of pre - testing, relatedquestions were put together to haveconsistency in response. The language ofa few questions was modified for easein understanding and eliciting accurateresponse. Sufficient number of copies ofinterview schedule were then preparedand used for collection of data.
Collection of Data
The primary data were collectedpersonally from the sample respondentby adopting personal interview methodwith the help of interview scheduledeveloped for this purpose. Therespondents were contacted at their timeon farm as per their convenience. Therapport was established by explainingthem the objective of study.
Tabulation and Analysis of data
The data were analyzed on the basis ofspecific objectives of the study andhypothesis formulated for the study. Thedata in the primary table were used forthe categorization of parametersaccording to the objective of the study,preparation of secondary table and theapplication of statistical tools.
The statistical tools used in the presentresearch study were Arithmetic mean,percentage.
Result and Discussion
Research methodology of this study ispresented in the following subheads.
The cost of milk production included
a) Fixed cost as well asb) variable cost.
Fixed cost, includes i) Depreciation onshed ii) Depreciation on Live Stock iii)Depreciation on miscellaneous items andiv) Interest on fixed capital. Variable costincludes. – i) Cost of feed stuff ii) Labourcost iii) Cost of treatment and iv) Intereston working capital. The cost of milkproduction was Rs. 9.10 per liter in thestudy area.
The total cost of milk production per farmwas Rs. 113.87 in which the variable costwas 83.76 percent (Rs. 95.38) andremaining 16.24 percent (Rs. 18.49) wasfixed cost. In variable cost, cost of feedstuff was 73.39 percent (Rs.70), Labourcost was 15.73 percent (Rs. 15.00), thecost of treatment was 2.62 percent (Rs.2.50) and interest on working capital was8.26 percent (Rs. 7.88). From the abovediscussion it was concluded that the costof labour and cost of feed stuff was themain component in the production of milkin the study area. These findings are alsoin conformation to Prashant Khare (2003)
Summary
1) Cost of Milk production- The Costof milk production was 9.10 per liter inthe study area. The total cost of milkproduction per farm was Rs. 113.87 inwhich the variable cost was 83.76percent (Rs. 95.38) and remaining 16.24percent (Rs.18.49) was fixed cost.
S.N. Particulars Milk Production Percentage toCost (Rs.) Total
1 Fixed Cost 16.24
a) Depreciation on cattle shed 1.66 08.98
b) Depreciation on Livestock 8.33 45.05
c) Depreciation on Misc. Expenses 1.00 05.40
d) Interest on Fixed Cost 7.50 40.57
Total Fixed Cost 18.49 100.00
2 Variable Cost 83.76
a) Cost of feed stuff 70.00 73.39
b) Labour Cost 15.00 15.73
c) Cost of treatment 02.50 2.62
d) Interest on working capital 07.88 8.26
Total of Variable Cost 95.38 100.00
Total Cost of Production 113.87 -
Value of dung 10.00 -
Net Cost of Production 103.87 -
Milk Production Per day ( Lit) 12.5 -
Per Liter Cost of Production 9.10 -
Table 1: Cost of milk production
Conclusion and suggestion
The variable cost was the maincomponent of the cost of production. Invariable cost, the cost of feed stuff andthe cost of Labour are the main.Therefore effort should be made toensure that farmers share some of theirland in the cultivation of the fodder andproper management of labour should bethe focus.
Implications
1. The study analyzed the cost of milkproduction which will help the dairyfarmers to minimize the variable costand to increase the profit.
2. The investigation made it clear thatlow price is the major problem of thefarmers. The investigation should helpthe farmers to produce better qualityof milk which will be given high price.
3. The study would be helpful foremployment generation
4. The findings of the study would behelpful in deciding “At what cost themilk should be sold?”.
5. The findings of the study would behelpful in reducing the input cost.
*Vijay Gorakh Patil-Ph. D. ResearchFellow YCMOU, Nashika

16
MARKET
A Road Map to Wholesale MarketInfrastructure – PPP Mode
By Satyaveer Singh* and Subah Singh Yadav**
Background
As per the Census (2001), about 228million people in rural India (equivalentto 56 percent of the total labor force) arefarmers and agricultural laborers. TheNational Sample Survey Organization(NSSO) in 2005 had estimated that whilefarming households accounted for 60percent of households in rural areas, directincome from farming activities accountedfor over 50 percent of farm householdincomes. As agricultural growth appearsto be decelerating, policy makers areconcerned about its impact on theNational economy. The average annualrate of growth of agricultural GDPdeclined from 3.4 percent during 1985/86 - 1994/95 to 1.8 percent in 1995/96- 2002/03.
Need for a Holistic DevelopmentApproach and Significance of Agricultural
Markets
In such a situation a vibrant agriculturalsector is needed not only for raising theincome levels of the people dependanton agriculture but also for acceleratingthe growth of other sectors of theeconomy as both are mutuallyreinforcing. At the current stage of India’sdevelopment, while looking at theoptions for strengthening agriculturalsector, there is a need to addressagriculture in a holistic manner coveringproduction, processing, marketing,distribution, utilization and trade of food,feed and other agricultural products. Theagricultural development strategy mustaddress not only farmers but all otherstakeholders engaged in marketing,trade, processing and agri-business, i.e.total supply chain right from ‘the Farmgate to the Food plate’. In this context,
agricultural marketing system obviouslyassumes added importance.
Agricultural marketing system is thecritical link between farm productionsector on the one hand and non-farmsector, industry, and urban economy onthe other. Apart from performing physicaland facilitating functions of transferringthe goods from producers to consumers,the marketing system also performs thefunction of discovering the prices atdifferent stages of marketing andtransmitting the price signals in themarketing chain. An efficient marketingsystem helps in optimization of resourceuse, output management, increase infarm incomes, widening of markets,growth of agro-based industry, additionto national income through valueaddition, and employment creation. Theissues and concerns in marketing relate

17
MARKET
mainly to the performance (efficiency)of the marketing system, which dependson the structure and conduct of themarket and infrastructure available forperforming marketing functions. These,in turn are influenced by the extent andform of government intervention.
Classification of AgriculturalMarkets
Markets in India can be broadly groupedunder three main categories – primary,secondary and terminal. Markets differconsiderably from one another as regardsthe functions they perform, the facilitiesthey offer and the services they render.
Rural Primary Markets include mainlythe periodical markets known as haats,shandies or painths and fairs which areestimated to be more than 21,000 to amaximum of 47,000 in number. Theseare located in rural and interior areas andserve as focal points to a great majorityof the farmers – mostly small andmarginal for marketing their farmproduce and for purchase of theirconsumption needs. These markets mayalso function as collection canters toadjoining secondary markets and aredevoid of most of the marketing facilitiesand look like strips of land serving asmeeting place between sellers and
buyers. The commodities collected inthese markets find their way to thewholesale assembling markets.
The number of primary rural markets inthe country is more than 21,000.According to the report of Marketing andResearch Team (MART), New Delhi ontraditional Haats and Melas in India, astudy sponsored by the Ministry of RuralDevelopment during 1995, it isestimated that there are 47,000 Haatsof which 75 percent are held once aweek, 20 percent twice a week and 5percent held daily. The study indicatesthat on an average, one haat caters toapproximately 14 villages. Therelationship between the distribution ofvillages according to population or rangeand the availability of haats, smallestvillage (population less than 500) heldthe fewest haats (only 1.6 percent).Majority of haats (47.9percent) are heldin the largest villages (those with apopulation of over 5000 persons). Thestudy reveals that nearly 2/3 of the haatsare held at a distance of 16 kms are more,23 percent are held at 6 to 15 kmsdistance and 9 percent within a distanceof 1 to 5 kms. The amenities and facilitiesavailable in these haats are far fromsatisfactory.
Wholesale/assembling markets or thesecondary markets numbering 6359constitute the cardinal link in the marketstructure in the country. Although betterorganized than the primary markets,these markets present divergent pictureswith regard to facilities offered andservices provided. Most of these arelocated in the district and talukheadquarters, important trade centresand nearby railway stations and performassembling and distribution functions. Inmost of these markets, a number ofcommodities are traded. Specializedsingle commodity markets are not manyexcept a few markets for cotton, jute,oilseeds, fruit and vegetables. The layoutof most of the secondary markets isinconvenient and unsatisfactory. Thebusiness is conducted according tomarket practices established by age oldcustoms, or as per the regulations ofAPM committees wherever regulated.These markets play an important role indetermining the prices of agriculturalproduce assembled there and as suchhave a governing impact on terms oftrade between agriculture vs. othersectors of economy. The users of thesemarkets, either buyers or sellers have topay fee to the managers of the marketplaces. Facilities in the places varyextensively. Nearly 2/3 of market yardsand sub yards were laid out initially onvast land area with such facilities as
Specialized singlecommodity markets arenot many except a fewmarkets for cotton, jute,oilseeds, fruit andvegetables. The layout ofmost of the secondarymarkets is inconvenientand unsatisfactory. Thebusiness is conductedaccording to marketpractices established byage old customs, or as perthe regulations of APMcommittees whereverregulated
18
auction platforms, shops, godowns, resthouses and parking lots. However,studies have shown that facilitiesavailable in these yards are considerablyshort of the requirements and most ofthem have become congested.
Terminal Markets which have becomean important feature in developedcountries, is expected to gain ground inIndia. The Safal complex of NDDB is onesuch format, located at Bangalore.Though they are expected to be locatednearer to big cities and terminal pointsproviding the final link in the marketstructure and sellers are usually thetraders and not the growers in thesemarkets unlike the primary andsecondary markets, the terminal marketconcept promoted in India is expectedto link the farmers to these marketsdirectly through collection centres.Government of India had announced toset up terminal market complexes forperishables at Nagpur, Nashik, Bhopal,Kolkatta, Patna, Rai, Chandigarh andMumbai during 2006-07. Govt of
Karanataka had also advertised RFP forsetting up 4 more terminal markets atKolar, Hassan, Bangalore and Mysoreduring the year 2007-08. The terminalmarket complex is in a “hub and spoke”format, with terminal market as “huband number of collection centres as“spoke” near to the production areas.The terminal markets provide for multipleoptions for farmers for disposal ofproduce. The Central Government isencouraging the set up of these marketson a Public Private Partnership Model toencourage private sector participation inoperations and management of themarkets by announcing an equityassistance scheme upto 49 percentthrough the National HorticultureMission. Such Modern Terminal Marketswith state of the infrastructure andfacilities are expected to reduce postharvest losses and increase farmers’realization besides bringing about a shiftfrom the largely supply driven model toa demand driven model.
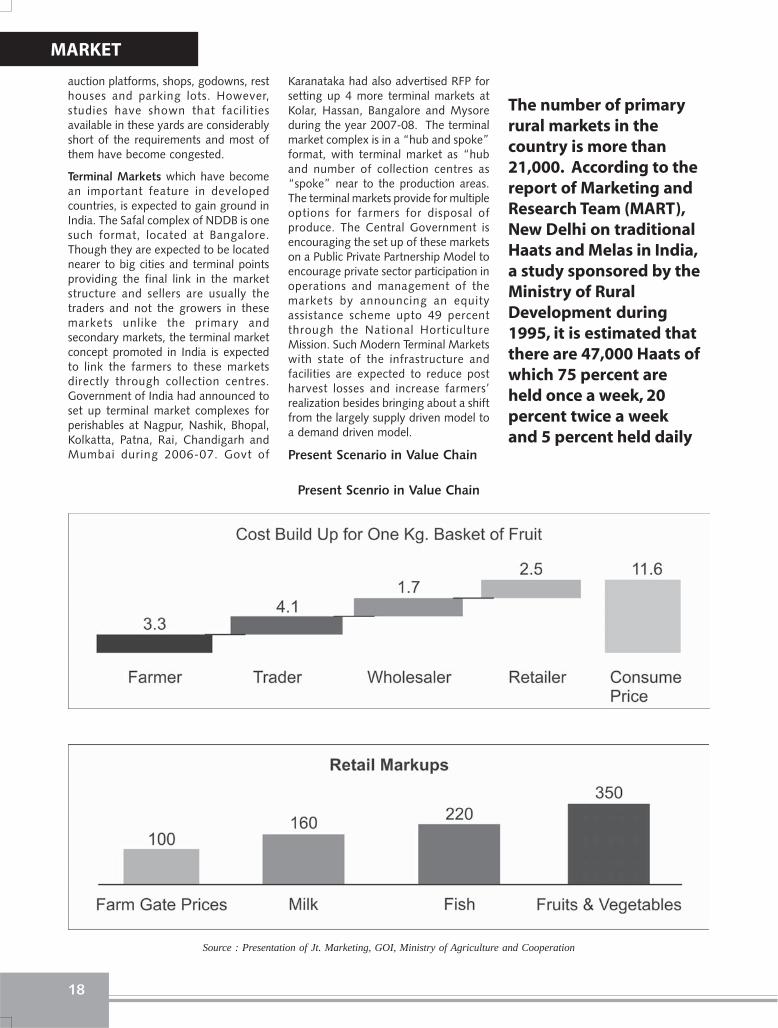
Present Scenario in Value Chain
Source : Presentation of Jt. Marketing, GOI, Ministry of Agriculture and Cooperation
Present Scenrio in Value Chain
The number of primaryrural markets in thecountry is more than21,000. According to thereport of Marketing andResearch Team (MART),New Delhi on traditionalHaats and Melas in India,a study sponsored by theMinistry of RuralDevelopment during1995, it is estimated thatthere are 47,000 Haats ofwhich 75 percent areheld once a week, 20percent twice a weekand 5 percent held daily
MARKET

19
MARKET
Cost-plus model at every stage in terms of share of farmers, trader wholesalers,retailer in consumer’s rupee.
Terminal Market Eligibility
Terminal Market Complex project is built, owned and operated by the selected PrivateEnterprise (PE) through Competitive Bidding process. PE includes individual orconsortium, Group of Farmers/Growers/Consumers/Producer Organisations/ProducerCompany, Partnership/ Proprietary firms, Companies, Marketing Boards, Public SectorUndertaking, Co-operatives, registered NGOs empanelled with GOI/State Govt./Planning Commission, recognized Self Help Groups under the schemes of GOI/StateGovts. and other registered bodies engaged in production and trading of agriculturalproduce. The PE could also be a consortium of entrepreneurs from, inter-alia, agri-business, cold chain, logistics, warehousing, agri-infrastructure and relatedbackground.
Infrastructure at Terminal Markets
Source: Guidelines of Terminal Market, Ministry of Agriculture and Cooperation, GoI
Expected Outcome from the Modern Terminal Markets
Parameters Present Status Expected Outcome
Trade Transparency Non Existing Transparent Auction through Electronic Auction System
Cold Chain Infrastructure Very Poor Setting up of cold storage at each market ranging from 2000 to15000 MT capacity
Backward-forward linkages No Linkages Minimum of 20 collection centers nearer to the farmers field willbe set up. The farmer will have alternative options to supply tothe supply chains, processing, export of commodities etc.
Monopoly of APMC Markets Prevailing Farmer is provided with alternative option of taking his produceto terminal markets
Multiple intermediaries Prevailing Length of the chain of commission agents will substantially bereduced with an ideal situation of eliminating thecommission agents completely
Beneficiary farmers - 16000 to 20000 farmers under each terminal market
Share of the farmer in Varies from 30 to 60% Farmer’s share is expected to increase to 50 tothe consumer price for perishables 70% of the consumer price
depending on thelocation, season,demand and supply etc.
Private Enterpriseincludes individual orconsortium, Group ofFarmers/Growers/Consumers/ProducerOrganisations/ProducerCompany, Partnership/Proprietary firms,Companies, MarketingBoards, Public SectorUndertaking, Co-operatives, registeredNGOs empanelled withGOI/State Govt./PlanningCommission, recognizedSelf Help Groups underthe schemes of GOI/StateGovts. and otherregistered bodiesengaged in productionand trading ofagricultural produce

20
MARKET
Wholesale Facilities:
• Cash and carry
• Transporters shops
• Exporters shops
• ATM Counters
• Price display boards
• Conference rooms
• Multipurpose halls
• Counseling centre
• Laboratories
• Research centre
• Electronic auctioning
• Packaging units
• Electronic grading and sorting lines
• Labeling of produce
• Pre-cooling unit
• Cold storage
• Ripening chambers
• Washing areas
• Quality testing facility
• Temperature controlled warehouses
Non Marketing Services:
• Freight consolidation
• Logistic centres
• Fertilizers and manure shops
• Nurseries/plant shops
• Storage area for plastic crates, trolley/forklifts, wooden palates
• Information cell
• Fire fighting services
• Maintenance and repair shops
• Rain water harvesting
• Garbage composting
• Sewage treatment plant
Expectation from the PrivatePlayer
1. Establish collection centre in thecatchment area of the terminalmarket.
2. Provide cleaning, washing andsorting (Grading) facilities at thecollection centre
3. Provide transportation facilities fromCC to TM or CC to Forward Marketsand Processing Units
4. Provide Transparent Electronic uctionSystem in TM and Electronic Display
Boards at Collection Centre
5. Plastic crates for Fruits and Vegetableon reasonable rent
6. Agri-clinic facilities for goodagriculture practices, input seeds,fertilizer and pesticides etc.
7. Support in crop insurance andfarmers insurance
8. Provide a corpus fund for educationof farmers’ kids (1% less rate ofinterest than to commercial banks)
9. Grading and certification laboratoryfacilities at TM
10. Cold storage and cool chainmanagement at TM
11. Ripening Chambers/VHT plant etc.as per the need of the commodityspecific TM
12. Organic Solid Waste ManagementPlant for de-bio-gradation of wastein organic compost
13. Market Intelligence System at TM fordemand and supply analysts andprice discovery mechanism
14. World class hygienic environment inthe TM
15. E-trading facilities at TM
*Policy Change could delay the project; people may not be so clear with new processes which will affect their ability to utilize the solution;Possibly new process will not be fully integrated initially; Possible void if new process don’t fully cover all contingencies.
Risk Categories Phase of Dominance Allocation of Risk
Land Acquisition Project Development State Govt/Private party
Political and Social Risk Throughout Project Cycle State Govt/Private party
Delays in Project Development Project Development Private Party -Design- Planning Risk
Project Construction Risk Construction Period Private Party
Project Cost risk/Cost Over-Runs Construction Period Private Party
Technology Risk Construction/Operations Period Private Party
Regulatory & Administrative Operation Period State Govt/Private party
Commercial Risk Operation Period Private Party*Business Process and Policies
Operation and Maintenance Operation Period Private party
Financial Risk Operation Period Private PartyInterest Rate, Tax Rate, Inflation
Termination Risk Operation Period Private Party
Environment Risk Construction/Operation Period State Govt/Private party

21
MARKET
Expectation from the Government
1. Single license to operate in the state
2. Autonomy in commercial operation ofTM
3. Single point levy/Collection of Marketfee
Public Private Partnership Model(PPP)
Infrastructure shortages are proving akey constraint in sustaining andexpanding country’s economic growthand ensuring that all citizens are able toshare its benefits. To meet this challenge,the Government is committed to raisinginvestment through Public PrivatePartnership activities in all keyinfrastructure sectors includingagricultural marketing. It is importantthat to understand the PPPs are notcatch-all solutions to the persistentdifficulties of under-investment and lackof resources for development. PPPs areoften complex transactions, needing aclear specification of the services to beprovided and understanding of the wayrisks are allocated between theGovernment and Private Sector. Most ofthe PPPs are in nature of long termproject and therefore, Government hasto develop and manage the relationshipwith the private providers to overcomeunexpected events that can disrupt eventhe best design contracts. And ultimately,PPPs always involve projects for which,in the eyes of the citizens, governmentultimately bears responsibility- even if thetask of delivery has been contacted out.
Project Risks and allocation ofRisks
1. Regulatory
2. Political
3. Commercial
4. Financial Risk
5. Market Risk
6. Land Acquisition Risk
7. Construction Risk
8. Technology Risk
9. Cost Overrun Risk
10. Force Majeure Risk
11. Operation and Maintenance
Risk Mitigation Steps
Identifying the events or actions whichaffect the viability of the project. In caseany such event occurs, the effect of thesame on the cost and time of the project.Identify and allocating the risk to theparty who can manage it best. Steps oractions which can be taking to reducethe chances of the event occurring. Costsof addressing the risk have to bedetermined.
* Satyaveer Singh, MIS Expert, AsianDevelopment Bank, TA-4890 IND,Mainstreaming of Public Private Partner-ships at State Level
** Subah Singh Yadav, Chief Manager,Bank of Baroda, Zonal Officer, Lucknow
PPPs are oftencomplex transactions,needing a clearspecification of theservices to be providedand understanding ofthe way risks areallocated between theGovernment andPrivate Sector. Most ofthe PPPs are in natureof long term projectand therefore,Government has todevelop and managethe relationship withthe private providersto overcomeunexpected eventsthat can disrupt eventhe best designcontracts

22
FOCUS
Agriculture continues to play apredominant role in influencingthe overall performance of the
Indian economy. In spite of theadvancement in chemical, biological andinformation fields, there has been adistinct slowdown in agricultural growthduring the past two decades. By the year2003-04, only 35.3 percent of the netsown area of 140.9 million hectares wasutilized for double cropping. Further,even after five decades of planning, cropdiversification in favour of remunerativecash crops is quite insignificant, whichcan be understood from the highproportion of area under different foodgrain crops1. Between 1990-91 and2006-07, the annual rate of growth offood grains production at 1.2 percentwas lower than that of population at 1.9percent. The share of agriculture in theGDP has registered a steady decline from36.4 percent in 1982-83 to 18.5 percentin 2006-07. Extension and other supportservices to crop cultivation haveweakened. All these have resulted inpoor performance of the sector leadingto agrarian distress, manifested throughmigration, farmers’ suicides and reduced
participation in agricultural activities.Keeping this in view, an attempt has beenmade to focus on the current status offarmers and the likely strategies toaddress the constraints to development.
Agrarian Distress
There are many dimensions of thepresent agrarian crisis. In terms ofpopulation, India stands at number two,but in terms of area, it stands at numberseven in the world. By the year 2003-04, only 67.3 million hectares, which is35.3 percent of the total cropped area,were under non-food grain crops2. Whilethe workforce in agriculture hasremained more or less stagnant3, itscontribution to nation’s GDP has beensteadily declining. It has also resulted ina declining ratio of worker productivityin agriculture to non-agriculture. Onaccount of an increasing number ofholdings and constant, and evendeclining cultivable land area, the burdenof farmers has been increasing4. Theland-to-labour ratio as well as incomegains per capita have been reducingsignificantly.
India, in the second decade of planning,saw the advent of the green revolution.It encouraged undertaking massiveinvestments in the agriculture sector andpursuing policies to accelerate thegrowth process. The expansion inirrigation, impressive technologicaladvances and policies, and institutionalsupport agriculture led to a sustainedoverall increase in agriculturalproduction. The decade of the 1980s sawthe diversification of agriculture fromcereal to cash crops like cotton, oilseedsand also to horticulture and livestock.Thus, the major policy goals during theperiod between the 60s and 80s wereon achieving self-sufficiency in foodgrains production, but it lost its flamestowards the last part of the 80s. Since1982-83 the public investment inirrigation, rural infrastructure andagricultural research has started decliningand this declining trend dampened thegrowth perspective in agriculture sector.As a result, some of the positive gains ofgreen revolution got erased and theconstraints arising from the patterns ofland ownership5 and unequal access toirrigation water began to surface.
Agrarian Crisis:
By Dr. B.B. Sahoo*
Distress & Suicide

23
FOCUS
The crisis has been exacerbated furtherby rapid environmental degradation andplateauing of the existing agriculturaltechnology. These factors impingeadversely on the production potential ofthe agricultural sector. The slowing downand stagnation of agricultural growth hasadversely affected the income andemployment of a vast majority of ruralpeople dependent on agriculture. Scantyirrigation facility for the agriculture sectoris another cause of concern. Out of thetotal 190.6 million hectares of gross sownarea, only 76.8 million hectares of landhave irrigation facilities and theremaining 113.8 million hectares havebeen cultivated in rain-fed conditions bythe year 2003-04. Unlike irrigatedagriculture, rain-fed agriculture ischaracterized by low levels ofproductivity. The existing irrigated areasare also experiencing serious water stressas both reservoir and ground waterresources are depleting in many parts ofthe country. The growing demand fordrinking water and other needsassociated with rapid urbanization andindustrialization further increases stresson available irrigation resources.
Soil erosion, water logging and shiftingcultivation also cause land degradation.Similarly, excessive and unbalanced useof fertilisers and pesticides reduces soilfertility due to soil nutrient depletion.Among states, there are a few peakachievers in agricultural productivity. Forinstance, the worker’s productivity inPunjab at Rs.35,087 during 2004-05 was7.2 times that of Bihar and 5.3 times thatof Madhya Pradesh. The workers’productivities in 11 major states arebelow the national average ofRs.12,3716. Thus, regional disparity isanother factor increasing agrariandistress. This is further exacerbated bythe growing differences in workers’productivity in agricultural activities andnon-agriculture activities. For instance,at an all India level, the workers’productivity in non-agricultural activitiesat Rs.61,432 was 4.96 times higher thanthat of agricultural activities at Rs.12,371in the year 2004-057. All the more,income from agriculture is increasinglybecoming inadequate to meet the basicconsumption requirements of the farmfamily and it is more so for marginalfarmers.
Since the early 90s, in order to benefit
from global trade, some farmers haveembarked on the production ofremunerative cash crops withoutadequate knowledge on grades andstandards. As big farmers are the mostimportant information source for thecommon farmers, some of the smallfarmers are tempted to cultivate highvalued commercial crops. Because of theimplied investment requirements, thesechanges have tended to exclude most ofthe small farmers from participating inmarket growth. It is a fact that everyfarmer wants to sell his produce near thetop price and when he is unable toachieve the goal of selling his produce,he becomes confused and this confusionleads to frustration. Many a time, whenthe prices of his produce sinks8, he findsit difficult to manage the situation.Further, adverse weather conditions,unstable markets and poor profit marginsare weakening the ability of farmers inproducing traditional crops.Inappropriate application of inputs mix,ignorance on technical know-how andspurious use of fertilizer and pesticideadd to farmers’ woes. Inappropriate farmcredit policy, support services andinfrastructure base further accentuate thesituation. As a result, most farmers arelooking for alternatives. As the cost ofcultivation of most of the commercialcrops are relatively high, shortfall in yieldand price of these crops has broughtmisery to the farmers in the form ofincreasing debt burden, distress sale andeven, the extreme step of committingsuicide. Some such incidents have beenrecently witnessed in states likeMaharashtra, Andhra Pradesh andKarnataka. On the overall, agrariandistress is increasing.
Studies on Agrarian Distress
Of late, some studies on agrarian distresshave been conducted in the country.Major factors common to most of thefindings on increasing agrarian distressare the following:
Crop Related: Based on their study, Rao& Suri9 have shown that farmers inAndhra Pradesh, knowing well the risksinvolved in the cultivation of cotton andchillies, had taken up the cultivation ofthese two crops. Every year, they wereloosing one or the other crop either dueto bad monsoon, lack of water or pestattack. They were not able to recovertheir investments in the cultivation of
these crops. Both paddy and cottonshowed negative returns and chillies gavemarginal return. While estimating loss,it was observed that small farmersfollowed by marginal farmers sufferedthe most. As the small and marginalfarmers are more vulnerable to risk anduncertainty, when crop fails, debt burdengets accumulated and they findthemselves in a difficult situation.
Credit Related: Rural areas are lessorganized in terms of available financialproducts. Low demand for credit, no/less documentation of property and smallsized loan demand by the rural customersmake the fund flow costly. A high costof handling transactions by banks andincreased travel requirement bycustomers (bankers also) furtheraggravates the situation. As a result, thenumber of bank branches in rural areashas been declining. For instance, in1991, there were 35,206 rural branches,which was 58.4 percent of the total bankbranches in the country, but in 2006, itsnumber decreased to 30,579, i.e., 44percent of the total bank branches. Inthe present liberalized era, farmers areinfluenced by the market forces ofdemand and supply and have startedcultivating commercial crops. When thecultivation of commercial crops requiresmore investment and bankers have beenshying away from financing agriculture,the farmers are forced to depend oninformal sources. But the high cost ofdebt servicing and harassment forrepayment of loans make the life of thecommon farmer miserable.
Marketing & Price Related: Marketingis another factor increasing farmers’worry. In the absence of secure and readymarkets, farmers are forced to opt fordistress sale. When the cost ofinvestment in producing agriculturalcommodities is rising and the profitmargin is declining, the farmer’s abilityto continue as a farmer gets shattered.In the process, the middlemen reap thebenefit and the common farmers areexploited. The Minimum Support Price(MSP) given to farmer is also found tobe inadequate. In some cases, farmerssell their produce to middlemen at lowerprices than the MSP.
Extension Services Related: Theextension services provided to farmersare very poor. They do not get properinformation on package of practices,

24
FOCUS
demand for their produces and benefitsof crop diversification. In a piece-mealmanner, they get the technical advicefrom the local input dealers, who are nottechnically qualified, and theirprescriptions are guided by the availablestock of seeds, fertilizers and pesticideswith them.
Other Factors: Besides cultivation, thesmall and marginal farmers do not haveany other option for earning theirlivelihood. Although from time to time,the Government has taken manydevelopmental initiatives, they areinsufficient to provide meaningful livingto the commoners. Many times, the realrecipients are not necessarily those whoactually require it. Other factors, whichadversely impact on the small farmers,are the following:
• No supplementary livelihood optionsin non-farm sector;
• Absence of safety nets for the smalland marginal farmers;
• Increasing expenditure on marriageand other social functions;
• Increasing expenditure on illness; and,
• Inadequate risk mitigation measures
State Causes
Andhra Pradesh Monsoon failure, increasing cost of cultivation, mono-cropping1, lower yield and non-remunerativeprices2
Punjab Crop failure, lower yield, mounting debt burden, alcoholism, domestic discord, drug addiction3
Maharashtra Crop failure, indebtedness, price fluctuation, poor extension network, decline in social position, conflicts,drug addiction, alcoholism and health problems4
Kerala Crop failure, drought, flood, water logging, deficit rainfall, pest attack, decline in yield, increase inexpenditure on fertilizer and pesticide, sharp drop in price of crops and decline in the quantity exported5
Table 1: Causes of agrarian distress and farmers’ suicides
Table 1 presents the major findings ofsome studies on increasing agrariandistress and farmers’ suicides in someselected states like Andhra Pradesh,Punjab, Maharashtra and Kerala.
Farmers’ Suicides
Suicides are normally influenced bystrains on an individual due to a varietyof psychological, social and economicreasons. The number of suicides in thecountry during the decade 1996-2006increased from 88,241 in 1996 to1,18,112 in 2006, which was 33.8percent. During 2006, collectively 7states, i.e., West Bengal, Maharashtra,Andhra Pradesh, Tamil Nadu, Karnataka,Kerala and Madhya Pradesh, witnessed71.4 percent of the total suicides in thecountry. Family problems and illness werereported as the main causes of suicide.While studying suicides by profession, itis observed that 41 percent of the totalsuicide victims were self-employedfollowed by housewives at 21.2 percent.Similarly, 69.9 percent of the total suicidevictims had an education up to themiddle level1.
Table 2 presents year-wise farmers’suicide rates during the period between2001 and 2006 in the top five states in
Year Chhatisgarh Maharashtra Andhra Pradesh Karnataka Madhya Pradesh
2001 6.97 3.65 1.98 4.74 2.27
2002 5.83 3.76 2.46 4.21 2.25
2003 4.93 3.84 2.31 4.58 2.46
2004 6.33 4.10 3.39 3.21 2.83
2005 6.29 3.82 3.13 2.94 2.19
2006 6.49 4.28 3.24 2.57 2.45
the country. It is observed from the tablethat during the period, farmers’ suiciderate was the highest in Chhatisgarh,followed by Maharashtra and AndhraPradesh. Experts say that rising cost ofinvestment, repetitive crop failure, highindebtedness, price volatility and distresssale are some of the factors increasingagrarian distress.
Table 2: Top five states with year-wise figure on farmers’ suicide(Farmer suicide rate per one lakh farmer population)
Source: National Crime Records Bureau; Sourced from the website
Soil erosion, waterlogging and shiftingcultivation also causeland degradation.Similarly, excessive andunbalanced use offertilisers andpesticides reduces soilfertility due to soilnutrient depletion.Among states, there area few peak achievers inagriculturalproductivity

25
FOCUS
A State-Wise Analysis
In order to understand the drivers ofagrarian distress and farmers suicides, 20major states are selected and based onthe incidence of farmers’ suicides, theyare divided into ‘distressed states’ and‘non-distressed states’. As the highestnumber of farmers’ suicides (in terms ofthe farmers’ suicide rate) has beenreported in the states of Chhatisgarh,Maharashtra, Andhra Pradesh,Karnataka, Madhya Pradesh, Punjab andKerala during 2001 and 2006, these 7states have been categorized as‘distressed states’ (DS). The remaining13 states have been considered as ‘non-distressed states’ (NDS).
While analysing area and productivity offood grain crops, it is observed that botharea and productivity have beendeclining in distressed and non-distressed
states. However, the decline in distressedstates is relatively high1. Similarobservations were seen in the case of theproductivity of food grain crops2. Table 3presents some selected parametersrelating to agriculture in both ‘distressed’and ‘non-distressed’ states. To avoidirregularities, three year average data, i.e.,from 2001-02 to 2003-04, has been usedfor the analysis. While analyzing perhousehold data, it is observed that in spiteof comparatively lower irrigated area,farmers in distressed states producerelatively more non-food grain crops.Further, the households in distressed stateshave the maximum increment in credit.When the situation is analysed from perhectare of land, it is observed that in spiteof lower area under non-food grain cropsand farm credit disbursement, the farmersin ‘non-distressed’ states could increasethe crop output.
Table 3: Selected parameters relating to agriculture in ‘Distressed’and ‘Non-Distressed’ states.
In order to understand the relativeimportance of factors influencingagricultural income of the farmers’households, a regression equation hasbeen fitted. In the absence of relevantinformation on value of crop output, thenet state domestic product (NSDP) atfactor cost from agriculture has beentaken as the proxy for the value ofoutput. Further, to arrive at the value ofcrop output per household, the NSDPfrom agriculture has been divided withthe total farmers’ household. Althoughthere are a large number of variables,which influence the value of crop output,in the present exercise, four variables,i.e., gross sown area, gross irrigated area,area under non-foodgrain crops andinstitutional credit, which impact the cropoutput the most, are considered as theindependent variables and a linearequation1 has been used for the analysis.
In the case of ‘distressed states’, all theselected variables, except amount ofcredit disbursed, are found to havesignificant association with the value ofoutput and collectively they explain 99percent of the variations in thedependent variable. While the grosssown area and area under non-food graincrops are found to be significant at 10percent level, gross irrigated area is foundto be significant at 5 percent level2.When all other factors are constant, anincrease in gross sown area by onehectare increases the value of agricultural
Per household
Value of crop output (Rs.000) 17.28 14.65 15.22
Gross Sown Area (Hectare) 1.51 1.09 27.81
Gross Irrigated Area (Hectare) 0.48 0.52 -8.33
Area under non-food grain crops 0.60 0.36 40.00(Hectare)
Institutional credit (Rs.000) 7.10 3.78 46.76
Per hectare
Value of crop output (Rs.000) 11.42 13.49 -18.13
Gross Sown Area (Hectare) 1.28 1.39 -8.59
Gross Irrigated Area (Hectare) 0.32 0.48 -50.00
Area under non-food grain crops 0.40 0.33 17.50(Hectare)
Institutional credit (Rs.000) 4.69 3.47 26.01
Particulars DistressedStates1
Non-Distressed
States2
% Change
As the highest numberof farmers’ suicides (interms of the farmers’
suicide rate) has beenreported in the states
of Chhatisgarh,Maharashtra, AndhraPradesh, Karnataka,
Madhya Pradesh,Punjab and Kerala
during 2001 and 2006,these 7 states have
been categorized as‘distressed states’ (DS)

26
FOCUS
output by Rs.720. Similarly, keepingother factors constant, when irrigatedarea increases by one hectare, the valueof agricultural output increases byRs.11,940. It is disturbing to note thatinstitutional credit, which is alwaysconsidered to be an important factorinfluencing output, has turned out to beinsignificant in influencing agriculturalincome. The inferences of such findingsare that either the farmers have beeninfluenced by a handful of progressivefarmers for the cultivation of cash cropsor they are influenced by the marketforces of demand and supply. Theinferences regarding credit may be thatfarmers in ‘distressed states’ are eitherproducing high valued non-food grainsin the land, which are not fit for theircultivation or not making proper end useof the credit. As a result, benefit-costratios in the cultivation of non-food graincrops are not remunerative. However,these observations are based on statelevel analysis. Location specific studiesin areas like the Vidarbha region inMaharashtra and the Telengana regionin Andhra Pradesh could throwmeaningful insight into these issues.
In ‘non-distressed states’ all the selectedindependent variables are found to havesignificant association with the value ofoutput and collectively they explain 74percent of the variations in thedependent variable. While gsa, gia andcrd are found to have positive associationwith the dependent variable, anfc isfound to have negative association.Keeping other factors constant, when thegross sown area is increased by onehectare, the agricultural income increasesby Rs.2,140 and when irrigated areaincreases by one hectare, value ofagricultural output would increase byRs.9,100. Similarly, when credit foragricultural purposes increases byRs.1,000, value of output increases byRs.2,100. However, the variable anfc isfound to have negative association withoutput, which infers that farmers in ‘non-distressed states’ may be producing non-food grain crops in the land, which arenot fit for the production of food grains.As a result, non-food grains cultivatedin non-distressed states are notprofitable. Further, the value of theelasticity for anfc is found to be (-) 0.04,which is very insignificant. When bothdistressed and non-distressed states arecompared in terms of productivity, it is
observed that per hectare yield in non-distressed states is 18.1 percent higherthan that in the distressed states. Table4 presents the details of the regressionresult.
Particulars Distress States Non-Distress States
Coefficient Std. Error Coefficient Std. Error
Intercept 2.26 9.20
Gross Sown Area 0.72*** 3.04 2.14*** 7.65
Gross Irrigated Area 11.94** 3.53 9.10*** 8.43
Area under non-food 2.34*** 6.74 -1.49*** 11.94grain crops
Credit disbursed 0.92 0.47 0.21*** 1.11
R2 99% 74%
Table 4: Results of Regression Analysis
* 1%, ** 5% and *** 10% degree of significance
Conclusions
The basic conclusion that emerges fromthe analysis is that there are threesignificant factors influencing cropoutput: (a) gross sown area; (b) irrigationfacilities; and (c) level of farmers’education. In the absence of the requiredinfrastructure and support services likeirrigation and extension services, farmersin distressed states were found to divertrelatively more land in favour of differentnon-food grain crops. The finding ofcredit as an insignificant factorinfluencing crop output goes in a badtaste, which needs to be examined underlocal condition. The farmers may beimparted education on crop husbandry,i.e., suitability of land and climate forspecific crops, costs and benefits, sourcesof credit, input-mix, availability ofbackward and forward linkages,marketing facilities/services, etc.
Although gross sown area is found to bean important factor increasing cropproductivity and output, the scope forits expansion is limited1. Therefore, it isnot advisable to bring more land underplough because it may endanger the
space for other uses. However, grosssown area can be increased by increasingirrigation facilities. The Ninth Five YearPlan assessed the ultimate irrigationpotential of the country at 140 millionhectares2, and by the year 2003-04, only76.8 million hectares3 have the benefitof irrigation. Therefore, ample scopeexists for increasing irrigation facilities.Irrigation facilities can not only increasearea under double crops but also offeropportunities for crop diversification andincrease crop productivity. As the presentlevel of investment in agriculture is notvery significant, public policy may begeared up for providing irrigation facilityfor the additional 63.2 million hectares.Watershed projects may also be initiatedon a priority basis. Further, the extensionsystem is weak and the link betweenresearch and extension is found to bebroken. As crop productivity dependsnot only on crop management and pricepolicy but also on research activities likeinventing, experimenting andpopularizing higher yield potentials ofdifferent varieties, emphasis needs to begiven on Research and Development(R&D)4.
In ‘non-distressed states’ all the selectedindependent variables are found to have
significant association with the value of outputand collectively they explain 74 percent of the
variations in the dependent variable

27
FOCUS
* The author is an Assistant General
Manager in National Bank for Agriculture
and Rural Development (NABARD),
Head Office, Mumbai. The views
expressed by the author in the paper are
of his own and not of the institution he
belongs to. E-mail:
1 64.7 percent of the total gross cropped
area of 190.6 million hectares was under
different food grain crops during the year
2003-04.
2 Centre for Monitoring Indian Economy
Pvt. Ltd. (CMIE), Mumbai, April 2007
3 In the year 2004-05, nearly 64 percent
of the rural persons were from
households whose major activity status
was either self-employed in agriculture
or agricultural labour.
4 During 1960-61 and 2003, while the
number of holdings had been increased
from 50.77 million to 101.27 million, the
area operated declined from 133.48
million hectares to 107.65 million
hectares. As a result, the average size of
holding has declined from 2.63 hectares
in 1960-61 to 1.06 hectares in 2003.
5 Out of the total 89.3 million farmer
households in the country, small and
marginal farmers constituted 75.0 million
households (84.0 percent). Source:
Situation Assessment Survey of Farmers,
2003, 59th Round, NSSO (January-
December 2003)
6 The states are Andhra Pradesh, Assam,
Bihar, Himachal Pradesh, Karnataka,
Madhya Pradesh, Maharashtra, Orissa,
Rajasthan, Tamil Nadu and Uttar Pradesh.
(Source: NSSO, Employment and
Unemployment Situation in India, 2004-
05 and CSO, Gross State Domestic
Product, 2004-05)
7 Report of the Expert Group on
Agricultural Indebtedness, Ministry of
Finance, Government of India, July 2007
8 High cotton prices of cotton during mid
1990s attracted many to shift from the
cultivation of food grains to cotton.
However, collapse of world cotton prices
in late 1990s brought material distress
for the farmers.
9 Rao, P. Narasimha & Suri, K. C. –
“Dimensions of Agrarian Distress in
Andhra Pradesh”, Economic and Political
Weekly, April 22-28, 2006, Vol.XLI
No.16, Page 1546-52 (The study covers
75 farmer households in two villages, i.e.,
Nadendla and Karalapadu, of Guntur
district)
10 In Anantapur district, where 450
peasants have committed suicide since
2000, it was found that farmers were
depending on single groundnut crop for
their living. The groundnut is grown in
90 percent of the total cultivable land in
the district. (Source: Why do Farmers
commit suicide? The case of Andhra
Pradesh, V.Sridhar, Economic and Political
Weekly, April 22-28, 2006, Vol.XLI
No.16, Page 1559-65
11 Study conducted by the National
Institute of Agriculture Extension
Management, Hyderabad)
12 H.S.Shergill: Rural Credit and
Indebtedness in Punjab, Institute for
Development and Communication,
1998, monogram series IV, Singh, B.P.:
Punjab Peasantry in Turmoil, Unpublished
Seminar Paper, Punjab University, Patiala,
2005, The Tribune, October 21, 2000
13 IGIDR, Mumbai, 2005 (covers 111
suicide cases) and TISS, Mumbai, 2005
(covers 36 suicide cases)
14 Analysis of Farmer Suicides in Kerala,
S.Mohan Kumar, R.K.Sharma, EPW, April
22-28, 2006, Page 1553-58
15 The Registrar General of India, Sourced
from the website
16 In distressed states, area under food
grain crops increased at an annual
compound growth rate of 0.17 during
1980-81 and 1990-91 and it declined
at an annual rate of 0.50 during 1990-
91 and 2003-04. However, in non-
distressed states, annual increase under
food grain crops, which was 0.16 percent
during 1980-81 and 1990-91, was (-)
0.28 percent during 1990-91 and 2003-
04.
17 In distressed states, the annual increase
during 1980-81 and 1990-91 was 2.77
percent, and during 1990-91 and 2003-
04, it was 1.58 percent. However, in the
case of non-distressed states, the
increase was 2.95 percent during 1980-
81 and 1990-91 and 2.32 percent during
1990-91 and 2003-04.
18 Chhatisgarh, Maharashtra, Andhra
Pradesh, Karnataka, Madhya Pradesh,
Kerala and Punjab
19 Assam, Bihar, Gujarat, Haryana,
Himachal Pradesh, Jammu & Kashmir,
Jharkhand, Orissa, Rajasthan, Tamil
Nadu, Uttar Pradesh, Uttaranchal and
West Bengal
20 The linear equation of the form: VOhh
=á +â1 gsa+ â
2 gia + â
3 anfc + â
4 crd +
Ut has been considered for the per
hectare analysis.
21 That means, we reject Ho with 90%
confidence for gsa and anfc respectively
and reject Ho with 95% for gia and
conclude that gsa, anfc and gia have
significant effect on crop output.
22 The net sown area at 140.9 million
hectares is 46.1 percent of the reporting
area and this is higher than that in most
of the countries of the world.
23 Ninth Five Year Plan Document
24 Centre for Monitoring Indian Economy
Pvt. Ltd (CMIE), Mumbai, April 2007
25 Sahoo, B. B. - Indian Agriculture:
Retrospect & Prospects, Kurukshetra,
May 2008

28
POLICY
Real Time Gross Settlement:
Need for CustomersBy K. Kannusamy* and Sathish Kumar**
Real time gross settlement systems (RTGS) are a funds transfer mechanism where transfer of money takes place from onebank to another on a ‘real time’ and on ‘gross’ basis. Settlement in ‘real time’ means payment transaction is not subjectedto a waiting period. The transactions are settled as soon as they are processed. ‘Gross settlement’ means the transaction issettled on one-to-one basis without bunching with any other transaction. Once processed, payments are final and irrevocable.The RTGS system is suited for low-volume, high-value transactions. It lowers settlement risk, besides giving an accuratepicture of an institution’s account at any point of time.
The implementation of RTGS systems by Central Banks throughout the world is driven by the goal to minimize risk in high-value electronic payment settlement systems. In an RTGS system, transactions are settled across accounts held at a CentralBank on a continuous gross basis. Settlement is immediate, final and irrevocable. Credit risks due to settlement lags areeliminated.
Introduction
RTGS does not require Core Banking tobe implemented across participatingbanks. Any RTGS would employ two setsof queues: one for testing fundsavailability, and the other for processingdebit/credit requests received from theIntegrated Accounting System. Alltransactions would be queued andsubmitted for funds availability testingon a First in First Out (FIFO) + Prioritybasis. With the rapid increase incompetition amongst the numerousplayers in the financial area and changinggovernment policies and financialinnovations, it has become increasinglyimportant that financial institutions havesystems which are robust and up to themark to support the demandingtransaction levels. Some such systems arethe Clearing, Payment and settlementSystems which take care of large-valueinter-bank payments, foreign exchangeclearing and settlements, securitiesclearing and settlements and derivativeclearings.
Definition
RTGS (Real Time Gross Settlement): Asystem that streamlines that settlementof large-value transactions betweenbanks and other financial institutions.Instead of moving physical cash, thebanks transfers funds electronically.When one bank transfers money to
another, the funds are immediatelycredited to the second bank anddebited to the first.
What is RTGS?
Real Time Gross Settlement System(RTGS) is the ultimate in thepayment and settlementarchitecture in any country primarilyfor online, real time inter bank paymentand settlement of large value funds. Inother words, this is an electronic paymentprocessing environment where paymentinstructions are processed on continuous/on real time basis and settled on gross/individual transaction basis with outnetting the debits against credits.
RTGS payment system can also be calledas one in which payment instructionbetween banks are processed, settledindividually and continuously throughoutthe day as per the timings fixed from timeto time. (Between 9.00 a.m and 3.00 p.mdaily and 9.00 a.m and 12.30 p.m. onSaturdays as of now) RTGS works on alldays except on Sundays and Nationalholidays across states.
Working of RTGS System
Each participant (here the Bank) of theRTGS will be required to open adedicated settlement account for puttingthrough its RTGS transactions. Thisaccount will be an intra day account, i.e,it would be operational only during the
The proposed RTGSsystem provides forthe maintenance ofparticipant wisepayment queues inwhich paymenttransactions will beheld in first-in-first-outbasis at RTGS Branchof our bank

29
POLICY
duration of RTGS day. The account willbe funded at the start of the day (SOD)from a current account the participantholds under the present system atDeposit Account Department, RBI, andMumbai. Balances in the RTGSsettlement account at the end of the day(EOD) of the RTGS day are swept backto the participants current account andthere by zeroing the balance in RTGSsettlement account. The system enablesthe participants to place standinginstructions with DAD (Deposit AccountDepartment) , Mumbai to fund theirRTGS settlement account each morningduly specifying amount or percentage ofbalance to be transferred to the RTGSsettlement account every day at SOD.The system also provides to fund theRTGS settlement account during the dayfrom the participant’s current account.
Transactions emanating from aparticipant are ordinarily expected to besettled within two hours after it isreceived by beneficiary bank, which isthe essence of the real time system. Theproposed RTGS system provides for themaintenance of participant wise paymentqueues in which payment transactionswill be held in first-in-first-out basis atRTGS Branch of our bank (LiquidityManager). However, to enable theparticipants to take care of the urgenttime critical payments and to enablemore effective funds management, thesystem allows the participant to assignpriories to their payment messages andthere by, enabling a particular transactionto be processed before anothertransaction which was submitted earlier.
The system, Liquidity Manager, alsoprovides for facilities to the participantsto view their respective transactions heldin their payment queues, cancel suchtransactions and even change theirpriorities. However, participants can onlyview out going transactions on their ownpayment queues. They can not viewother participant’s queues or their ownpending incoming payment transactions.The proposed RTGS system provides forwide array of transaction types which canbe flexibly deployed to meet varyingrequirements.
Benefits of RTGS
To the Economy: RTGS will reduce thesystemic risk that exists in the presentsettlement systems like cascading affect
on banks due to failure of one bank tomeet it’s settlement commitments. Itimproves confidence of outside agencieslike the World Bank in the Indianeconomy. It enables efficient settlementsand avoids settlement delays
To the Banks: It offers immediate andirrevocable settlement. It provides forhigh value inter bank funds transfer. Ithas the potential to formulate newproducts by individual banks based onRTGS.
To Customers: They can get newbanking services based on reliable highvalue funds transfer system. The RTGSsolution provides for a separatetransaction type which can be used totransmit the customer information alongwith the payment message to thebeneficiary’s bank in a structured format.
RTGS – Salient Features
RTGS is a payment gateway under theclose supervision of RBI, working on theelectronic message communicatingsystem. Each bank will have a centralhub, which is connected to RTGS. Insideeach branch the message communicationtakes place through individual Wide AreaNetwork. RTGS will use the securedINFINIT network of RBI.
It uses the Secured Financial MessagingService (SFMS) message for thecommunication between Internal Corebanking solutions (for us AnywhereBanking) and the RTGS application.Participants will have to maintain adedicated RTGS settlement account withRBI for outward and inward RTGSpayments. This account will be an intraday account. The account will be fundedat the start of day from a current accountheld with RBI, Mumbai.
The balance in this account at the end ofday is swept back to the current accountand thereby zeroing the RTGS settlementaccount. Payment transactionsemanating from a participant areprocessed by the RTGS strictly on First inFirst Out (FIFO) basis.
However to enable the participants totake care of urgent or time criticalpayments and to enable more effectivefund management, the system allows theparticipants to assign priorities to theirpayment messages and thereby enablinga particular transaction to be processedbefore other transactions, which was
submitted earlier to the system. Paymenttransactions emanating from aparticipant are to be settled immediatelywhen it is received. However thepossibility of some transactions not beingimmediately settled cannot be completedruled out. To meet such exigencies, theproposed RTGS system provides formaintenance of payment queues inwhich payment transactions will be heldin FIFO order within priority pendingsettlement. In order to meet intra dayliquidity, RBI at its discretion and underterms and conditions to be specified fromtime to time will provide liquidity againstfully collateralized assets (Govt. Secs) ata charge per transactions.
Implementation of RTGS
An RTGS branch with Code 1250commenced operations as Nodal Officefor RTGS transactions under Funds &Forex Department, Mumbai. All inter-bank and Customer Paymenttransactions from RTGS enabledbranches shall be routed through thisRTGS Nodal Office. All CustomerPayment transactions emanating fromthe identified RTGS branches and InwardRemittances to identified RTGS Brachesare centralized at RTGS Branch (1250),Mumbai. The interface between thebank’s software and RTGS software areprovided by our vendors M/s Laser Soft(Branch software) and are operationalzed.
The following types of CustomerTransactions are being routed throughRTGS system by Fort and Opera Housebranches LIVE:
• All Inter bank transactions
• Customer Payment transactions
• Own Account Transfers
• Net Clearing
We have also implemented RTGS branchsoftware for effecting RTGS CustomerPayment and Inter-bank Paymenttransactions from 521 identifiedbranches with nominal charges. RTGSSystem has already attained the statusof the largest electronic fund transfersystem in the country and 85 banks areoffering RTGS based Customer servicesfrom 13,348 branches covering all mostcities/towns across the country. Oncebranches are identified andcommunicated to RBI, each branch will

30
POLICY
be allotted with IFSC (Indian Financial System Code) by RBI,which is an 11 character code (Example ANDB0001028, firstfour digits, ANDB, will be Bank Identification and the last fourdigits represents branch code).
As per the Business Schedule of RTGS transactions the timingsare as under with banks Cut-off time
Day Cut-Off time at Hrs for CustomerPayment
Week Days 16.00(Monday to Friday)
Saturdays 11.30
Conclusion
The RTGS is a system, which provides real-time onlinesettlement of payments among banks and financial institutions.In this system payment instructions between banks areprocessed and settled individually and continuously throughoutthe day. A lag between the time at which information is madeavailable to receiving banks and the time at which settlementtakes place may have important risk implications in large fundstransfer system. This is in contrast to net settlements wherepayment instructions are processed throughout the day butinter-bank settlement takes place only afterwards typically atthe end of the day. Payee banks and their customers receivefunds with certainty, or so-called finality, during the day,
enabling them to use the funds immediately without exposingthemselves to risk.
To initiate a funds transfer, the sending bank dispatches apayment message, which is subsequently routed to the centralbank and to the receiving bank as the system process and settlesthe transfer. RTGS system settles payments on a transaction-by-transaction basis as soon as they are accepted by the system.RTGS system does not create credit risk for the receivingparticipant because the settlement takes place individually.RTGS system can require relatively large amounts of intra-dayliquidity because participants need sufficient fund in thesettlement account to cover their outgoing payments. The costof intra-day liquidity depends on variables such as amountrequired, the opportunity cost of maintaining liquid balancesand the cost of intra-day credit. Once RTGS is implemented allthe inter-bank settlement will be done on a real time basis.
* Lecturer, PG & Research Department of Commerce, GobiArts & Science College, Gobichettipalayam - 634 453.
** Research Scholar, PG & Research Department of Commerce,Gobi Arts & Science College, Gobichettipalayam - 634 453.
References:
www.rbi.orgwww.indiabudget.nic.inwww.sbi.co.inwww.unionbank.co.inwww.google.com

31
PERSPECTIVE
Honesty ki JhappiOpportunity for India’s SocialRevolution
Background
In Gujarat an excellent proverb goes likethis “Medicine may be provided free ofcost but liquor must not” Free medicinemay bring back the life of a patient andfree liquor may ruin the whole life ofhealthy person, his family and harm thesocial structure. And therefore no one inthe world has built a free liquor shop butthere are millions of hospitals in the worldwhich are charging nothing fortreatment. The Central Government’sdebt waiver and debt relief scheme -2008 for farmers, though well-intentional, is ill-targeted and halfheartedly managed, thus encouragingdishonest people to remain dishonest andhonest people to become dishonest. Thisway it is going to do more harm thangood.
Real experience the in wake of the recentannouncement by the centralgovernment’s scheme for debt waiverand debt relief to the farmer has broughtgreat relief to millions of farmers acrossthe country who in any case are on theverge of collapse under vicious circles ofdebts. This will give them a secondchance to start their lives.
There are certain groups and schools ofthought showing apprehension that thismay lead to higher NPAs and may inflictculture of dishonesty. There is noempirical evidence available to supporttheir arguments as the Indian farmer andthe Indian middleclass who are strugglingeveryday to earn their livelihoods haveshown a higher repayment ratecompared to other classes of borrowers.The sum of non performing assets of allfarmers at the National level would notbe anywhere near to the sum ofsettlement made by FinancialInstitutions/Banks for commerciallending in a particular year. One shouldalso not forget that there is a sizable
amount of subsidy that people in metrosand semi metros are enjoying everyday.The examples are cooking gas, petrol,electricity, roads, higher educations,medical facilities and almost all theessentials services which are eitherprovided by Government directly orthrough its Public Sector Undertakings.On the other hand farmers have verylittle access to all the above statedessential services. Except fertilizer, asizable chunk of the total subsidy bill iscornered away by metro and semi-metroresiding Indians, who otherwise canafford full cost of services.
The detail analysis of composition of classof borrowers has revealed very darkpictures, in terms of pricing of productsand services provided by FinancialInstitutions. Big industrial houses aregetting loans at less than deposit cost. Itmay be a wise decision on the part offinancial institutions to ensure the safetyof the money and that it is also costeffective, as transaction costs are verynegligible. But banks are not there to justlend to big fish and thus make them evenbigger day-by-day at the cost ofdepositors. The small and marginalborrowers like farmers, artisans and self-help groups must be given their dueshare as they are providing more selfemployment and direct employment. Inmany parts of the country whereeducation and economic development islow, people are not willing to visit banksdue to very low levels of awareness andvery strong presence of local moneylenders who run in parallel with thebanking system. Farmers feel more athome with local money lenders, thanwith finance which includes long formsand many documents etc. This easyfinance comes at very high cost, but theIndian Farmer is well enough educatedin order to to understand the cost ofcapital or even rates of interest terms.
Issues
Having said that, the major concern forall concerned i.e. Banks, FinancialInstitutions, Government and Policymakers, is the growing culture ofdishonesty? Are small borrower’s alwaysexpecting a waiver scheme instead ofputting their borrowed money in asset-creation and returning it to Banks/Lending institutions?
There are many borrowers who arefeeling fooled by paying debt regularlyand then there are dishonest people whoare moving around with their head heldhigh claiming themselves as smartpeople. The honest borrowers are nowseriously thinking to have maximum debt(agriculture related) and not to return it,more as part of psychology revenge thaneconomy difficulties. It is well establishedand well documented fact that ruralpeople are taking decisions by thecollective consultation process andimplementing that decision collectively,be it negative or positive, and thereforeit is likely that the social atmosphere atthe village level is going to downgrade.No healthy society can afford to let thishappen. It seems the whole society atthe village level would spend more timein planning dishonesty rather than ontheir farming requirements.
Prajapati Sudhirkumar Rameshbhai
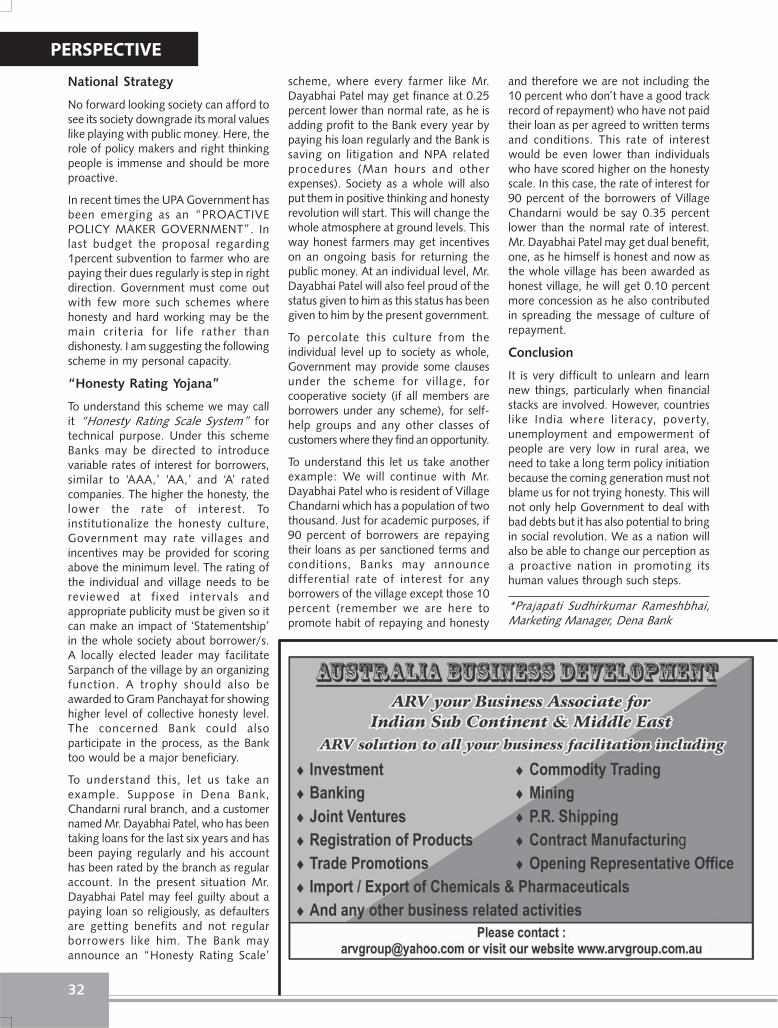
32
PERSPECTIVE
National Strategy
No forward looking society can afford tosee its society downgrade its moral valueslike playing with public money. Here, therole of policy makers and right thinkingpeople is immense and should be moreproactive.
In recent times the UPA Government hasbeen emerging as an “PROACTIVEPOLICY MAKER GOVERNMENT”. Inlast budget the proposal regarding1percent subvention to farmer who arepaying their dues regularly is step in rightdirection. Government must come outwith few more such schemes wherehonesty and hard working may be themain criteria for life rather thandishonesty. I am suggesting the followingscheme in my personal capacity.
“Honesty Rating Yojana”
To understand this scheme we may callit “Honesty Rating Scale System” fortechnical purpose. Under this schemeBanks may be directed to introducevariable rates of interest for borrowers,similar to ‘AAA,’ ‘AA,’ and ‘A’ ratedcompanies. The higher the honesty, thelower the rate of interest. Toinstitutionalize the honesty culture,Government may rate villages andincentives may be provided for scoringabove the minimum level. The rating ofthe individual and village needs to bereviewed at fixed intervals andappropriate publicity must be given so itcan make an impact of ‘Statementship’in the whole society about borrower/s.A locally elected leader may facilitateSarpanch of the village by an organizingfunction. A trophy should also beawarded to Gram Panchayat for showinghigher level of collective honesty level.The concerned Bank could alsoparticipate in the process, as the Banktoo would be a major beneficiary.
To understand this, let us take anexample. Suppose in Dena Bank,Chandarni rural branch, and a customernamed Mr. Dayabhai Patel, who has beentaking loans for the last six years and hasbeen paying regularly and his accounthas been rated by the branch as regularaccount. In the present situation Mr.Dayabhai Patel may feel guilty about apaying loan so religiously, as defaultersare getting benefits and not regularborrowers like him. The Bank mayannounce an “Honesty Rating Scale’
scheme, where every farmer like Mr.Dayabhai Patel may get finance at 0.25percent lower than normal rate, as he isadding profit to the Bank every year bypaying his loan regularly and the Bank issaving on litigation and NPA relatedprocedures (Man hours and otherexpenses). Society as a whole will alsoput them in positive thinking and honestyrevolution will start. This will change thewhole atmosphere at ground levels. Thisway honest farmers may get incentiveson an ongoing basis for returning thepublic money. At an individual level, Mr.Dayabhai Patel will also feel proud of thestatus given to him as this status has beengiven to him by the present government.
To percolate this culture from theindividual level up to society as whole,Government may provide some clausesunder the scheme for village, forcooperative society (if all members areborrowers under any scheme), for self-help groups and any other classes ofcustomers where they find an opportunity.
To understand this let us take anotherexample: We will continue with Mr.Dayabhai Patel who is resident of VillageChandarni which has a population of twothousand. Just for academic purposes, if90 percent of borrowers are repayingtheir loans as per sanctioned terms andconditions, Banks may announcedifferential rate of interest for anyborrowers of the village except those 10percent (remember we are here topromote habit of repaying and honesty
and therefore we are not including the10 percent who don’t have a good trackrecord of repayment) who have not paidtheir loan as per agreed to written termsand conditions. This rate of interestwould be even lower than individualswho have scored higher on the honestyscale. In this case, the rate of interest for90 percent of the borrowers of VillageChandarni would be say 0.35 percentlower than the normal rate of interest.Mr. Dayabhai Patel may get dual benefit,one, as he himself is honest and now asthe whole village has been awarded ashonest village, he will get 0.10 percentmore concession as he also contributedin spreading the message of culture ofrepayment.
Conclusion
It is very difficult to unlearn and learnnew things, particularly when financialstacks are involved. However, countrieslike India where literacy, poverty,unemployment and empowerment ofpeople are very low in rural area, weneed to take a long term policy initiationbecause the coming generation must notblame us for not trying honesty. This willnot only help Government to deal withbad debts but it has also potential to bringin social revolution. We as a nation willalso be able to change our perception asa proactive nation in promoting itshuman values through such steps.
*Prajapati Sudhirkumar Rameshbhai,Marketing Manager, Dena Bank

33
PRODUCTION
Year Area Production Yield% CoverageunderIrrigation
1997-98 26.12 21.32 816 24.3
1998-99 26.23 24.75 944 23.2
1999-00 24.28 20.72 853 25.2
2000-01 22.77 18.44 810 23.0
2001-02 22.64 2.066 913 24.3
2002-03 21.49 14.84 691 22.7
2003-04 23.66 25.19 1064 24.5
2004-05 27.52 24.35 885 26.6
2005-06 27.86 27.98 1004 28.0
2006-07 26.51 24.29 916 NA
2007-08* 26.54 28.83 1086 NA
Area-Million Hectare; Production - Million Tonnes Yield - Kg./Hectare* Advance Estimates as released on 09.07.2008Note: 1. The yield rates given above have been worked out on the basisof production & area figures taken in ‘000 units.2. Date for 1950-51 to 1969-70 relate to total of five major oilseeds viz.groundnut, castorseed, sesamum, rapeseed & mustard and linseed.
All-India area, Production and Yield of NineOilseeds from 1997-98 to 2007-08 alongwithpercentage coverage under irrigation
Year Marine Inland Total
1997-98 29.50 24.36 53.88
1998-99 26.96 26.02 52.98
1999-00 28.52 28.23 56.75
2000-01 28.11 28.45 56.56
2001-02 28.30 31.26 59.56
2002-03 29.90 32.10 62.00
2003-04 29.41 34.58 63.99
2004-05 27.79 35.25 63.05
2005-06 28.16 37.56 65.72
2006-07(P) 30.24 38.45 68.69
(P) ProvisionalSource: Department of Animal Husbandry & Dairying, New Delhi
Fish production in India in 1997-98 to 2006-07
Year Milk Eggs Wool(Million (Billion (Million
tonnes) Nos.) Kgs.)
1997-98 72.1 28.7 45.6
1998-99 75.4 29.5 46.9
1999-00 78.3 30.4 47.9
2000-01 80.6 36.6 48.4
2001-02 84.4 38.7 49.5
2002-03 86.2 39.8 50.5
2003-04 88.1 40.4 48.5
2004-05 92.6 45.2 44.6
2005-06 97.1 46.2 44.9
2006-07(P) 100.9 50.7 45.1
All-India production of Milk, Eggs and Wool from1997-98 to 2006-07
Source:Department of Animal Husbandry & Dairying, New Delhi
Statistical Overview ofAgriculture Production
in India

34
Year Area Production Yield
1997-98 1.11 11.02 1702
1998-99 1.03 9.81 1722
1999-00 1.04 10.56 1836
2000-01 1.02 10.56 1837
2001-02 1.05 11.68 2007
2002-03 1.04 11.28 1960
2003-04 1.00 11.17 2008
2004-05 0.92 10.27 2019
2005-06 0.90 10.84 2173
2006-07 0.94 11.27 2170
2007-08* 0.96 11.18 2093
All-India production and yield of jute and mestafrom 1997-98 to 2007-08
Note: figures for 1950-51 & 1951-52 relate to jute crop only.* Advance estimates as released on 09.07.2008Note: The yield rates given above have been worked out on the basis ofproduction & area figures taken in ‘000 units.
Year Area Production Yield % Coverage
under irrigation
1997-98 3.93 279.54 71134 91.3
1998-99 40.5 288.72 71203 91.7
1999-00 4.22 299.32 70935 92.0
2000-01 4.32 295.96 68577 92.1
2001-02 4.41 297.21 67370 91.6
2002-03 4.52 287.38 68576 91.3
2003-04 3.93 233.86 59880 90.7
2004-05 3.66 237.38 59380 90.7
2005-06 4.20 281.17 66928 92.5
2006-07 5.151 355.52 69022 NA
2007-08* 5.04 340.56 67531 NA
All-India area, production and yield of sugarcanefrom 1997-98 to 2007-08 alongwith percentagecoverage under irrigation
* Advance estimates as released on 09.07.2008Note: The yield rates given above have been worked out on the basis ofproduction & area figures taken in ‘000 units.
Targets and achivement of production of Major Crops during Tenth (Xth) Five Year Plan (2002-03 to 2006-07) and 2007-08
* Advance Estimates as released on 09.07.2008# Million Bales of 170 kg each; @: Million Bales of 180 kg. each
Crop Target Achivements Target Achivements Target Achivements Target Achivements Target Achivements Target Achivements
Rice 93.00 71.82 93.00 88.53 93.50 83.13 87.80 91.79 92.80 93.35 460.10 428.62
Wheet 78.00 65.76 78.00 72.15 79.50 68.64 75.53 69.35 75.53 75.81 396.56 351.71
Coarse 33.00 26.07 34.00 37.60 36.80 33.46 36.52 34.06 36.52 33.92 176.84 165.11Cereals
Pulses 16.00 11.13 15.00 14.91 15.30 13.16 15.15 13.39 15.15 14.20 76.00 66.76
Foodgrains 220.00 174.77 220.00 213.19 225.10 198.36 215.00 18.06 220.00 217.28 1100.10 1012.20
Oilseeds 27.00 14.84 24.70 25.29 26.20 24.35 26.58 27.98 29.40 24.29 133.88 116.75
Sugarcane 320.00 287.38 320.00 237.31 270.00 237.09 237.50 281.17 270.00 355.52 1417.50 1398.47
Cotton# 15.00 8.62 15.00 13.87 15.00 16.43 16.50 18.50 18.50 22.63 80.00 80.05
Jute & 12.00 11.28 12.00 11.23 11.80 10.27 11.28 10.84 11.28 11.27 58.36 54.89Mesta @
2002-03 2003-04 2004-05 2005-06 2006-07 Xth Plan
PRODUCTION

35
PRODUCTION
Species 1951 1956 1961 1966 1972 1977 1982 1987 1992 1997 2003
Cattle 155.3 158.7 175.6 176.2 178.3 180.0 192.5 199.7 204.6 198.8 185.2
Adult Female 54.4 47.3 51.0 51.8 53.4 54.6 59.2 62.1 64.4 63.6 64.5Cattle
Buffalo 43.4 44.9 51.2 53.0 57.4 62.0 69.8 76.0 84.2 89.9 97.9
Adult Female 21.0 21.7 24.3 25.4 28.6 31.3 32.5 39.1 43.8 46.8 51.0Buffalo
Total Bovins 198.7 203.6 226.8 229.8 235.7 242.0 262.4 275.8 289.0 289.0 283.4
Sheep 39.1 39.3 40.2 42.4 40.0 41.0 48.8 45.7 50.8 57.5 61.5
Goats 47.2 55.4 60.9 64.6 67.5 75.6 95.3 110.2 115.3 122.7 124.4
Horses & Ponies1.5 1.5 1.3 1.1 0.9 0.9 0.9 0.8 0.8 0.8 0.8
Camels 0.6 0.8 0.9 1.0 1.1 1.1 1.1 1.0 1.0 0.9 0.6
Pigs 4.4 4.9 5.2 5.0 6.9 7.6 10.1 10.6 12.8 13.3 13.5
Mules 0.1 0.0 0.1 0.1 0.1 0.1 0.1 0.2 0.2 0.2 0.2
Donkeys 1.3 1.1 1.1 1.1 1.0 1.0 1.0 1.0 1.0 0.9 0.6
Total Livestock 292.8 306.6 335.4 344.1 353.6 369.0 419.6 445.3 470.9 485.4 485.0
Poultry 73.5 94.8 114.2 115.4 138.5 159.2 207.7 275.3 307.1 347.6 489.0
Dogs NC NC NC NC NC NC 18.5 18.0 21.8 25.6 29.0
Livestock Population in India
NC: Not CollectedNote: Total Bovins include Yaks and MithansSource: Department of Animal Husbandry, Dairying & fishries, New Delhi.
Year Area Production Yield % Coverage
under irrigation
1997-98 43.45 82.53 1900 50.8
1998-99 44.80 86.08 1921 52.3
1999-00 45.16 89.68 1986 53.9
2000-01 44.71 84.98 1901 53.6
2001-02 44.90 93.34 2079 53.2
2002-03 41.18 71.82 1744 50.2
2003-04 42.59 88.53 2077 52.6
2004-05 41.91 83.13 1984 54.7
2005-06 43.66 91.79 2102 56.0
2006-07 43.81 93.35 2131 NA
2007-08* 43.77 96.43 2203 NA
* Advance estimates as released on 09.07.2008Note: The yield rates given above have been worked outon the basis ofproduction & area figures taken in ‘000 units.
All-India Area, Production and Yield of Rice from1997-98 to 2007-08 alongwith percentagecoverage under Irrigation

36
PRODUCTION
Year Area Production Yield % Coverage
Million Million kg./ under
hectare Tonnes Hectare irrigation
1997-98 22.87 12.98 567 11.3
1998-99 23.50 14.91 634 12.1
1999-00 21.12 13.42 635 16.1
2000-01 29.35 11.08 544 12.5
2001-02 22.01 13.37 607 13.3
2002-03 20.50 11.13 543 14.4
2003-04 23.46 14.91 635 13.6
2004-05 22.76 13.13 577 13.9
2005-06 22.39 13.39 598 15.0
2006-07 12.19 14.20 612 NA
2007-08* 28.86 15.12 638 NA
* Advance estimates as released on 09.07.2008Note: The yield rates given above have been worked outon the basis ofproduction & area figures taken in ‘000 units.
All-India Area, Production and Yield of Total Pulsesfrom 1997-98 to 2007-08 alongwith percentagecoverage under Irrigation
Year Area Production Yield % Coverage
Million Million kg./ under
hectare Tonnes Hectare irrigation
1997-98 30.83 30.40 988 11.0
1998-99 29.34 31.34 1068 12.0
1999-00 29.34 30.33 1034 12.6
2000-01 30.26 31.06 1027 12.5
2001-02 29.52 33.36 1181 11.3
2002-03 26.99 26.07 966 11.0
2003-04 30.80 37.60 1221 6.6
2004-05 29.03 33.47 1153 6.6
2005-06 29.01 34.07 1172 13.0
2006-07 28.71 33.92 1182 NA
2007-08* 28.72 40.73 1418 NA
* Advance estimates as released on 09.07.2008
All-India Area, Production and Yield of coarsecereals from 1997-98 to 2007-08 alongwithpercentage coverage under Irrigation
Year Area Production Yield % Coverage
Million Million kg./ under
hectare Tonnes Hectare irrigation
1997-98 1.74 0.89 548 21.6
1998-99 1.82 0.94 517 20.1
1999-00 1.29 0.69 538 23.5
2000-01 1.07 0.65 602 27.6
2001-02 1.18 0.68 577 24.1
2002-03 1.64 0.87 531 22.9
2003-04 2.01 0.93 464 15.4
2004-05 2.17 1.19 549 26.0
2005-06 2.34 1.44 615 24.9
2006-07 2.16 1.23 567 NA
2007-08* 1.88 1.44 694 NA
All-India Area, Production and Yield of Sunflowerfrom 1997-98 to 2007-08 alongwith percentagecoverage under Irrigation
Area-Million Hectares; Production - Million Tonnes Yield-Kg./Hectare* Advance estimates as released on 09.07.2008Note: The yield rates given above have been worked out on the basis ofproduction & area figures taken in ‘000 units.

37
NEWS
“Release of Bt Brinjal would be the beginning of the end ofIndian agriculture.” This voice against genetically-modifiedfood got louder with acclaimed scientist Shiv Chopra, whofought against bovine growth hormone in Canada and got itbanned, supported the cause of rejecting “the poisoned food.”
Speaking at a public seminar on the adverse impact ofgenetically modified food on health, Chopra said that amajority of people who will be eating Bt Brinjal would beoblivious of the fact that they are feeding on poison.
”Bt is toxic and there are serious questions being raised onthe long term implications of genetically modified foodproducts. The government is bowing to the pressure of foreigncompanies who are offering to set up base in the country andpromising in return to feed poison to the masses,” he said.
Trashing the claims of GM food as safe food, Chopra said,“The company Monsanto which is promoting Bt Brinjal has ahistory of bad ethics. The company has been fined severaltimes in developed countries because of its practices but theIndian government is willing to give a red carpet welcome.”
AGRI NEWS
Chopra, who has lived in Canada since 1960, had refused toapprove various harmful drugs intended for meat and milkproduction. Due to his work, bovine growth hormone wasbanned in Canada in 1999 and in the European Union.
He has a literary streak as well and has authored books like“Corrupt to the Core” which details a full account of howgovernment corruption endangers public food supply.
Umendra Dutt, heading Kheti Virasat Mission, which has beenwaging a war against GM foods, said, “There is a very strongnexus among politicians, bureaucrats and market forces whichare allowing the release of Bt Brinjal.”
A resolution was mooted on the occasion by PUTA president,Mandeep Singh, who called upon state governments ofPunjab, Himachal Pradesh and Haryana to ban BT Brinjal.
Already governments of Kerala, Karnataka, Andhra Pradesh,Orissa, Bengal, Bihar, Madhya Pradesh and Chattisgarh havebanned BT Brinjal due to serious health concerns.
Source: The Times of India
‘Reject Bt Brinjal as Poison’
Bharti-Walmart opens firstagricultural co-operative centrein Punjab
Bharti-Walmart Pvt. Ltd, ajoint venture between BhartiEnterprises and WalmartStores Inc. for wholesalecash and carry and back-endsupply chain managementoperations, has launched itsfirst agricultural co-operative centre in Sirhind,Punjab.
The centre aims to build a robust aggregating, handling,packaging and delivering system of fresh produce to Best Priceand Bharti Retail’s easyday stores.
This initiative is part of Bharti-Walmart’s direct farmprogramme in partnership with 100 small and marginal farmersnear Ludhiana. The farmers will be paid for their produce within24 hours post delivery. All legalities including APMC tax willbe fully complied with, the company informed in a pressrelease.
Speaking about the initiative, Raj Jain, MD and CEO, Bharti-Walmart said, “At Bharti Walmart, it is our constant endeavorto develop and work with local suppliers to develop an efficientand robust supply chain by reducing waste and ensuringqualitative, fresh produce for customers at easyday and BestPrice Modern Wholesale stores. To meet these objectives, ourassociates, in partnership with Bayer CropScience will sharebest practices with small and marginal farmers to improvethe quality and quantity of their yield.”
For the company’s first co-operative centre partner BayerCropScience has also designed a scientific solution for thefarmers through their “5P” process that underscores bestpractices in production, protection, programme monitoring,passport and post-harvest.
”Through these, Agriculture Centre will provide manifoldbenefits for farmers, including 7-10% higher price realizationvis-à-vis open markets and additional incentives for betterquality produce. The Centre will provide farmers with expertadvice on crop planning and management, furtherstrengthening Bharti Walmart’s initiative to support farmersand small manufacturers who have limited infrastructure anddistribution strength,” the company added.
Source: www.fnbnews.com

38
NEWS
World-Class Research Centre Mooted
Agricultural scientist M S Swaminathan has said that a world-class research and training centre should be set up in Kuttanadfor preserving and promoting the agricultural activities ofKuttanad and studying the impact of climate changes on theagricultural sector of Kuttanad.
He was speaking to newsmen after inaugurating a workshopon ‘Healthy wetlands, sustainable development and climatechange,’ organised by the Kuttanad Vikasana Samiti (KVS),led by Fr Thomas Peelianickal, in association with theEnvironment Management Agency of Kerala and the StatePollution Control Board.
The centre will be set up this year under the M S SwaminathanResearch Foundation (MSSSRF), and 10 to 15 acres of landwill be identified for the centre, said foundation chairman M SSwaminathan.
Kuttanad is the only place of agriculture which is below thesea level in the country.
The farmers here have been contributing a major portion ofpaddy for the last 150 years and the farmers are applying theirown techniques for the agricultural production.
So, one of the main purposes of the centre will be thepreservation and promotion of such techniques scientificallyand necessary steps should be taken for preserving Kuttanadas a globally important agricultural heritage site, he said.
The centre will give awareness to the farmers for meeting thechallenges owing to the impact of global warming and climatechange, he said. Answering a query, Swaminathan said thatthe present move of both the Centre and the State Governmentfor executing the much awaited package are satisfactory.
Speaking to Express, Swaminathan said that the growth oftourism in Kuttanad was essential but it should be eco-friendly.“The tour operators should take necessary steps for avoidingpollution of the backwaters by houseboats and other boats inKuttanad, he said.
Source: www.expressbuzz.com
Bio-technology major, Biocon Ltd’s chairman and managingdirector Kiran Mazumadar Shaw has extended her strongsupport for introduction of Bt Brinjal for commercial cultivationin the country as “biotechnology is a safe science and regulatedtechnology.’’
Addressing a news conference to announce the three-dayBangalore India Bio event, a Karnataka government initiativeto be held from June 2 to 4, she said the introduction of BtBrinjal must be viewed on a scientific basis and not governedby unfounded fears as it would lead to creating needless fearpsychosis among the people.
The Bicon chief, who is regarded for her pioneering role inpromoting biotechnology on a big scale in the country, saidthe mass hysteria sparked off by ill-informed people without
proper understanding of the various issues was a matter ofdeep concern.
“We are one of the leading producers of Bt Cotton globallyand I think farmers have benefited significantly from thistechnology,’’ she said.
Biocon CMD said Bt is an optional technology and there is nocompulsion for farmers to use this technology.
“The farmers stand to gain by using modern technology. Btcotton has been a very clear case that farmers have really startedincreasing the cultivation as and when they found it to be usefuland it’s about discovering the use and benefit of this newtechnology,’’ Mazumdar-Shaw added.
Source: www.daijiworld.com
Biocon Chief Kiran Mazumdar Shaw Bats for Bt Brinjal
Bihar Seeks Ban on Casein, Milk PowderExport
In view of Union Agriculture Minister Mr. Sharad Pawar’s remarkson milk shortage in North India, the Bihar State Government onSaturday appealed to the Centre to ban the exports of milk-based products, especially Casein, which accounts for nearly 80per cent of the protein content in cow milk and cheese.
Speaking to newsmen, Deputy Chief Minister and State FinanceMinister, Mr. Sushil Kumar Modi said, “the Centre must imposerestrictions on the export of Casein, which was widely exportedto international markets, and had a myriad uses in foodproducts, medicines, plastic and paper. We also request thatthe export duty on Casein and milk powder be accordinglyraised to check the dairy price rise.”
Saying that the export of milk and milk-based products wouldresult in price rise Mr. Modi added, “Bihar is at present supplyingnearly One lakh litres of milk per day to Delhi, Orissa andWest Bengal to tide over the dairy shortage.”
Mr. Modi also said as cattle feed prices had dramatically shot upin the last few days, the Centre should wake up to the fact andaccordingly stop the exports of cattle feed raw material as well.
Mr. Modi stated that the price of de-oiled rice husks had shotup from Rs. 3,125 per metric tonne in January 2009 to Rs.5,625 per metric tonne in January 2010, while the per metrictonne cost of rice bran for the same period had soared fromRs.5,899 to Rs.8,825 per metric tonne.
Earlier on Friday, Chief Minister Nitish Kumar, while assuringthat the State was not facing any shortage in the milk supplycurrently had said that “the State’s popular milk brand ‘Sudha,’and its regulating body, Bihar State Cooperative Milk ProducersFederation (COMFED) had decided not to raise milk prices asof now.
“On our part, we are diligently following the Centre’s directivesto curb the skyrocketing prices of essential commodities,” saidMr. Kumar, adding “Bihar had already done away with theprocess of levying 4per cent VAT on sugar prior to the Centreissuing that directive to the states.”
Source: The Hindu (beta.thehindu.com)
39
NEWS
While Punjab remains, in popularperception, the land of plenty, a groupof economists at Punjab AgricultureUniversity (PAU) has revealed that thepicture isn’t rosy at all — in fact it’s grim.
Rural indebtedness has touched Rs35,000 crore and, worse, 3,000 debt-ridden farmers have committed suicidein the last eight years. Economists are alsorelating the suicides with high illiteracyamong the poor farmers and say Punjabneeds to increase expenditure oneducation.
”Rural debts are mounting rapidly andhave touched Rs 35,000 crore in the year2009-2010 as against Rs 21,640 crore in2007,” said Sukhpal Singh, senior PAUeconomist in Ludhiana. In the first suchsurvey commissioned by the Punjabgovernment, door-to-door survey of two
‘3,000 farmer suicides in 8 years’
In order to boost agricultural productivity in the state, the BiharGovernment has launched an exclusive school for farmers tosharpen their agricultural skills.
The state government has launched ‘Kisan Pathshala’ (farmerschool) - a programme that will teach farmers about moderntechnology to increase farm produce.
With diminishing land resources and ever-growing humanconsumption, this unique move is expected to sharpen theproduction skills of farmers.
Agricultural experts are teaching farmers the use of scientifictechniques to increase their productivity on smaller plots of land.
As of now, there are over 3,000 farmer schools in operationwithin the state wherein the agricultural scientists are educatingthe farmers about the judicial use of soil, fertilizers, water,sowing and harvesting.
Farmers expressed happiness with the initiative, as it helpedthem to understand the balanced use of insecticides andpesticides.
”Earlier, I could not differentiate between friendly insects andthe harmful pests. But after being taught about the same inthe farm school, it has benefited me immensely. Initially, withthe use of chemical fertilizers, I used to kill the useful soil insectsalong with the pests. But now I can differentiate,” said RamSingh Yadav, a farmer.
”The main objective of the government behind starting theseschools is to teach the farmers the scientific methods of farming.The farmers here, in general, are involved in traditionalagricultural practices. But in the school they are given practicaltraining on how to sow the seeds, and the adequate amountof seeds to be used for a good yield,” said Ganesh Ram,Agricultural Consultant, Patna.
Each school has about 25 farmers of both sexes learning variousaspects of systematic and scientific farming.
Bihar is currently ranked third in the country in terms vegetableproduction and seventh in fruit production. This initiative aims attargeting over five lakh farmers who will be trained in these schools.
Source: ANI/news.oneindia.in
Bihar farmers return to school to learn newagricultural skills
AGRI TECH NEWS
districts indicated that nearly 3,000farmers had killed themselves in the lasteight years. “About 38% of these were20 to 30 years old and 60% had unpaiddebts. Significantly, 47% suicides wereby illiterate,” said Sukhpal Singh.
It’s the small farm holdings, of two acresor less, which have made farmingeconomically unviable and driven farmerswho took debts to keep their crop aliveto kill themselves. “A follow up at thehomes of suicides have shown that nearly25% of such families sold off their landafter the death,” said Sukhpal.
Inderjit Singh Jaijee, who launchedMovement Against State Repression,blamed the government for keepingfarmers’ suicides under wraps. “Most ofthese suicides are unreported becausesuicide is a criminal offence and families
avoid going to the police. This helps thestate to go into denial about these tragicdeaths at the grassroots,” Jaijee said.
Linking the suicides to not just farmindebtedness but also to lack ofeducation, R S Ghuman, professor andhead of Economics, Punjabi University,said, “The state budget on education andits infrastructure is mere 11% and just3.7% of children in Punjab are gettinginto professional education.”Emphasizing on the need for bettereducation infrastructure, Ghuman said,“The drop out rate in schools isunacceptably high at 60% until class X.This is making the farmers, especiallythose holding small farms, completelydependent on farming as a source ofraising money to support their families.
Source: The Times of India

NEWS
40
That’s the surprising claim made by wind expert Mark Newtonas Farming Futures launches a free guide to wind energy forfarmers, smallholders and land managers today.
With 75% of the UK’s land in the agricultural sector, on-farmwind power can represent a significant business opportunityfor farmers and land managers, as well as reducing greenhousegas emissions, which contribute to climate change. The UKGovernment is committed to producing 15% of all our energyfrom renewable sources by 2020, and wind is expected to makea sizeable contribution towards that goal. As a result, financialincentives such as the new Feed-in Tariffs currently underconsultation for April 2010 are making the business case forinvestment stack up for those with the right resources.
Mark Newton from Fisher German is one of the country’sleading experts in wind energy. He says, “I believe that everyfarm in the UK will have a wind turbine in five years’ time.”
On-farm wind generation can range in size from small systemsthat power remote farm buildings, through to medium-sizedturbines that power local buildings and sell to the Grid, up tomulti-million-pound wind farm developments. Turbines mustbe well sited and have a consistent and adequate wind speedif they are to be a good investment.
This free Farming Futures guide outlines how you can assessyour wind resource, what you need to consider when puttingtogether a planning proposal, and where you can go for furthersources of information and advice.
Madeleine Lewis from Farming Futures said, “Farmers withthe right resources can do well out of renewable energyproduction. Producing energy on-farm can turn a profit, cushionyou against rising oil and gas prices, and provide the UK with asecure, clean and renewable energy supply. It can also giveaccess to new and better markets due to growing consumerinterest in ‘low-carbon’ food.” “In our 2009 survey, 50% offarmers said they were taking action to reduce greenhousegas emissions from their farm, and we believe that on-farmenergy generation could become the norm in the not-too-distant future.”
Dr Jonathan Scurlock, the NFU’s Chief Adviser on renewableenergy and climate change said, “The NFU’s aspiration is thatevery farmer should have the opportunity to be a net exporterof low-carbon energy. National targets and governmentincentives for renewable energy are creating significant newbusiness opportunities
Source: newsroom - meattradenewsdaily.co.uk
Rising temperatures in the next 15 years will lead to a hugedrop in global farm production, anything between 20 and 40percent, and the policy-makers are looking up to the breedersto find a solution to that.
Arguing that new plant varieties and high quality seeds have acritical role in providing a dynamic and sustainable agriculture,Agriculture Minister, Shri Sharad Pawar, called for all-outencouragement to this sector. He said the key to success in thefarm sector is seed security: the availability of the appropriatevariety at the right place and time, in sufficient quantity andquality
Inaugurating the National Seed Congress, the Minister said,‘Governments need to develop and maintain an enablingenvironment to encourage plant breeding and the productionand distribution of high quality seed. Increased public andprivate investment in the seed sector is required for the longterm if agriculture is to meet the challenges of food security.’
Shri Pawar emphasized that modern biotechnology andmolecular breeding and associated methods for attainingincreased production and productivity must be harnessed. Apartfrom genetic enhancement, other technologies related toquality seed production and quality enhancement techniquescontribute substantially to improved seeds. Capacity buildingin all these areas has been supported by the Government andwill continue to be a priority area. Simultaneously theestablishment and maintenance of an appropriate infrastructure
on the scientific as well as technical level is consideredimportant, he said.
The Agriculture Minister also stressed on the role the privatesector can play in seed production. He said: ‘We need torecognize the benefits in developing complementarity andsynergy between the two sectors. The Indian Sub-Continentand South East Asia are considered to have experienced a highergrowth rate in agriculture mainly because of the goodcooperation between the public and private sectors.Government is interested to develop appropriate policies andinvestment-friendly legal and regulatory framework to facilitateprivate sector investment in the seed and agro-industries.’
Seed exports, the Minister said, present a great potential.‘Global seed market has grown rapidly in recent years and iscurrently estimated at about 37 billion US dollars. India is ranked6th with a market size of 1,300 million US dollars. The NewPolicy on Seed Development of 1988 has stimulated majorgrowth in the industry as it attracted a lot of investment inseed business from seed companies. Given the growth of theseed sector in recent years, India has the potential to becomethe foremost player in the seed export business in thedeveloping world with prospective markets in Asia, Africa andSouth America. But India’s present share is less than 2% in theinternational market. I hope that with our enabling environmentthe seed trading export share will increase and we must lookto achieve at least 10% share.’
UK - Wind power for all farms
Government To Develop Policies & Framework To Facilitate Private Sector InvestmentIn The Seed And Agro-industries: National Seed Congress Inaugurated


India’s Fertilizer
Gas supply commitment is the lone hitch for new investors
India’s fertlizer industry is on a roll.Several fertilizer industry units havescripted plans to ramp up capacity. Six
closed units of Hindustan FertiliserCorporation Ltd and FertiliserCorporation of India Ltd are on therevival path. Union Fertiliser ministerM.K. Alagiri is active with a plan to getlong-term commitment of gas suppliesfrom Reliance Industries Ltd’s Andhraoffshore for these expansion plans.
Six firms have come forward to set upfertiliser plants besides ramping up theirexisting units. The total investment willbe in the region of Rs 24,000 crore. Allthese companies are ready with technicaland financial plans but the work on theprojects cannot progress in the absenceof firm commitment of gas supplies froma future date.
So the capacity expansion ultimatelyhinges on the firm commitment on fuelsupply. The promoters of these projectsare facing difficulty in extracting a firmcommitment of fuel/feedstock supplieseffective from a future date, to tie upfunds for the projects. Without such acommitment from the government, thepromoters cannot sign a bankable GSPA(gas sales & purchase agreement) andarrange funds from any lender.
The ministerial panel that was set up to
distribute 40 million cubic metres per day(mcmd) of incremental gas for variousindustries arising from the Andhraoffshore did not make any commitmenton prior allocation of gas to any industryjust to enable financial closure ofinvestments.
In September 09, the ministerial panelallocated firm supplies to existingfertilizer companies at 17 mcmd.
Balanced Application
Fertilizer demand in India will accelerateand there will be an increased focus onbalanced fertilizer application. Says U.S.Awasthi, Managing Director of theIndian Farmers Fertiliser Co-operativeLimited (IFFCO), “It is our firm belief thatIndia’s soil needs rejuvenation, alongwith soil management to cater to itsmicro nutrient and macro nutrientneeds,” IFFCO, formed in 1967produced fertilizer for the cooperativesector in India.
IFFCO today produces more than 7million tonnes of fertilizer annually andis tied up with 40,000 cooperativesocieties across India. The assets areworth more than US$10 billion. Themanufacturing facilities are spread acrossthe country along with a series of jointventures and overseas investments. The
government’s restructuring of fertilizersubsidy regime is expected to enhanceapplication of phosphate and potash-based fertilizers for boosting productivity.IFFCO is expanding its capacity toproduce nitrogen-based urea fertilizerand has made investments in phosphateassets abroad to lock in supply.
Phosphate Up
India’s fertilizer subsidy more thandoubled in the 2008-2009 fiscal year tomore than US$25 billion with high rawmaterial prices and tight nutrient suppliesjacking up fertilizer costs. The sharpdecline in Nitrogen and Phosphatefertilizer pricing has allowed the Indiangovernment to slash the size of thesubsidy this fiscal year. India securedmajor price cuts on its annual potashimports. Nitrogen, phosphate and potashare the three main macro nutrients infarming.
Over-application of nitrogen fertilizerand under-usage of phosphate andpotash resulted from the skewed subsidyregime. In the future, demand for potashand phosphate will outpace the demandfor nitrogen-based fertilizers. “If there is3.2 percent average annual growth forother fertilizers, potash/phosphatedemand is likely to grow around 4percent on average,” Awasthi said.
Capacity to Expand
INFRASTRUCTURE
42

Horticulture, which includes fruits, vegetables, tubers,ornbamental plants, medicinal and aromatic plants, spices,plantation crops has made rapid stride during the last twodecades owing to technical inputs and incentives. However,availability of quality seeds and planting material, a basic toany technology led development, continue to be a limitingfactor. Seed replacement rate is still very low. Indian Council ofAgricultural Research, through the network of its researchinstitutes has made significant contribution by way ofdeveloping technologies for propogation/seed production andalso disease disgnostics which can facilitate the production andavailability of quality seeds and planting materials. Thesetechnologies have been adopted in potato, citrus and bananabringing about a consciousness for quality planting material.One of the approaches adopted is in-vitro production of plants,which has been successfully adopted in production of Bananaplants. For the development of horticulture in the right direction,adequate availability of quality planting material to the farmersis of utmost importance.
The government also encourages policies for ensuringavailability of quality seed and planting material. To provideprotection to the cultivators, PVP authority is also serving inthe country. Advent of Biotechnical tools and transgenic havebecome a reality. A four day National Conference on Productionof Quality Seeds and Planting Material-Health Managementin Horticulture Crops is proposed. On this occasion, to showcasethe technological advancement, an exhibition shall be organized.
Exhibition:
A world class exhibition to be organized at National AgriculturalScience Centre Complex, NASC located at the Pusa Campus,New Delhi, will offer an excellent platform for scientists,corporate and farming community to come together at thismega event to negotiate business deals and secure marketlinkages. The events will be visited by participants and largenumber of farmers of horticulture background. The exhibitionwill portray the technological strength of Indian horticulturefrom farm to fruit basket.
India- A land of abundant opportunities for Horticulture growersand Food Industry.
• Ranked among top five in horticulture produce.• Availability of large inexpensive and disciplined labour force
with the best IR track record.• IIHR, NHM and NHB are working with prime thrust on
promoting horticulture and utilization.• Elaborate infrastructure, special economic zones, horti export
zones, Food Park and wide range of R&D institutions.• Special incentives for food processing in order to provide
linkages between the farm produce and industry.• Large untapped market and fast growing consumer base and
is also the largest market for seeds, Fertilizers, farm Credits,farm machinery and consumer products.
Profile:
Indian Council of Agricultural Research, ICAR: The IndianCouncil of Agricultural Research (ICAR) is an autonomousorganization under the Department of Agricultural Research
and Education, Ministry of Agriculture, Government of India.Formerly known as Imperial Council of Agricultural Research,it was established on 16 July, 1929 as a registered society underthe Societies Registration Act, 1860 in pursuance of the reportof the Royal Commission on Agriculture. The ICAR has itsheadquarters at New Delhi. The Council is the apex body forcoordinating, guiding and managing research and education inagriculture including horticulture, fisheries and animal sciencesin the entire country. With 97 ICAR institutes and 45 agriculturaluniversities spread across the country this is one of the largestnational agricultural systems in the world.
Centre for Agriculture and Rural development, CARD:Established in the year 2000 under the societies act 1860, CARDis a national level non-governmental organization, focusing onorganizing, mobilizing communities and local as well as externalresources for social, educational, environmental, technologicaland developmental interventions. CARD undertakes training,capacity building and technology exposure by organizingbusiness and technical seminars, workshops and technologyfairs. CARD monitors trends in agriculture and environmentsector and advises Central and State Governments and variousbodies on appropriate policies and actions for the developmentof agriculture, environment and the rural economy.
Expected outcome of the event:
• Business and financial tie-ups, experts and official links,
investment commitments and creation of future
opportunities.
• Improvement in production of quality seeds and planting
material for health management in horticultural crops.
• Improvement in technology, quality, value addition, marketing
and export of horticulture produce.
• Awareness creation about the role of quality planting material
in the health management of horticultural crops.
• Identification of potential market for export and device
specific strategies to horticultural trade.• Increase awareness about the quality seeds and planting
material for horticultural crops.
Exhibitor’s Profile
• Seed and biotechnology• Pesticides and PGR• Fertilizers and micro nutrients• Food processing• Horticulture publications• Horticulture research and extension• Banks and Financial Sectors• Rural Institutions and NGO• Farm Machinery• Agri/Horti Retail companies• Horti inputs• Educational Institutions
State Government
• NHM and TMNE states would like to avail this opportunityto showcase there strength and major achivements madeunder the said scheme.
HortiSeed Expo 2010 and National Conference onProduction of Quality Seeds and Planting Material-Health
Management in Horticulture Crops