Embed Size (px)
Citation preview

Edition 25
Transactions QuarterlyA perspective on the Indian transactions market
July - September 2016

Tran
sact
ions
Qua
rter
ly –3
Q16
2
Edition 25
July-September 2016
In this edition
Foreword ................................................................3
Mergers and Acquisitions (M&A) ..............................4
Key sector highlights ...............................................7
Cross-border activity .............................................10
Global M&A activity ...............................................11
Outlook ................................................................13
Transactions Quarterly –3Q
16
3
Welcome to the 25th edition of Transactions Quarterly — our quarterly review of India’s M&A landscape. The global economy remained tepid, impacted by an uncertain political and economic scenario. In the aftermath of Brexit that continues to unfold, other developments contributed to a dampening of the sentiments that are centered around the outcome of the U.S. presidential election in November, French and German elections next year, terrorism and challenges around the euro zone growth.
On the global M&A front, as organic growth stays slow, companies are evaluating inorganic options with a view to improving their market position. Deal fundamentals that are essential to drive M&A activity still exist —low financing costs, availability of credit, strong cash balances, the need for growth and high equity valuations (which should support share-based transactions). Other factors, such as disruptive forces, including digital, globalization and sector blurring, may also help support deal markets through the remainder of 2016.
In India, the M&A activity remained soft during the quarter. The moderation in deal count mirrored a subdued global M&A market. However, the disclosed deal value improved considerably as compared to the same quarter last year, on the back of select large-sized deals (US$500 million and above). Domestic M&A was more pronounced owing to confidence in macro-economic indicators and a continuing focus by companies to acquired capabilities to help augment growth in an environment that’s embracing digital at a fast pace. Cross-border activity during the quarter registered a comparative decline, impacted as it was due to global uncertainties, reflecting in a relatively low inbound deal activity.
From a sector point of view, the financial services sector dominated the deal activity, both in terms of deal value and volume. The deal activity across the sector was widely scattered with microfinance and fintech deals taking the lead. The technology sector continued to fare well, on account of businesses’ focus to adapt to innovative technologies in response to imperatives stemming from digital disruption.
Global M&A activity is expected to remain low-key in the immediate future due to persisting volatility in the global markets, which could also potentially impact the M&A prospects in India in the short term. Investors will remain cautious with regard to engaging transactions opportunities, leading to a possible delay in planned deal-making.
Fore
wor
d
Amit Khandelwal Partner and National Director, Transaction Advisory Services, Ernst & Young LLP
Tran
sact
ions
Qua
rter
ly –3
Q16
4
deal-making as a result of volatility in the global markets making investors cautious. Nevertheless, the inbound deal market is expected to improve once the ambiguity stemming from Brexit and the presidential elections in the US subsides.
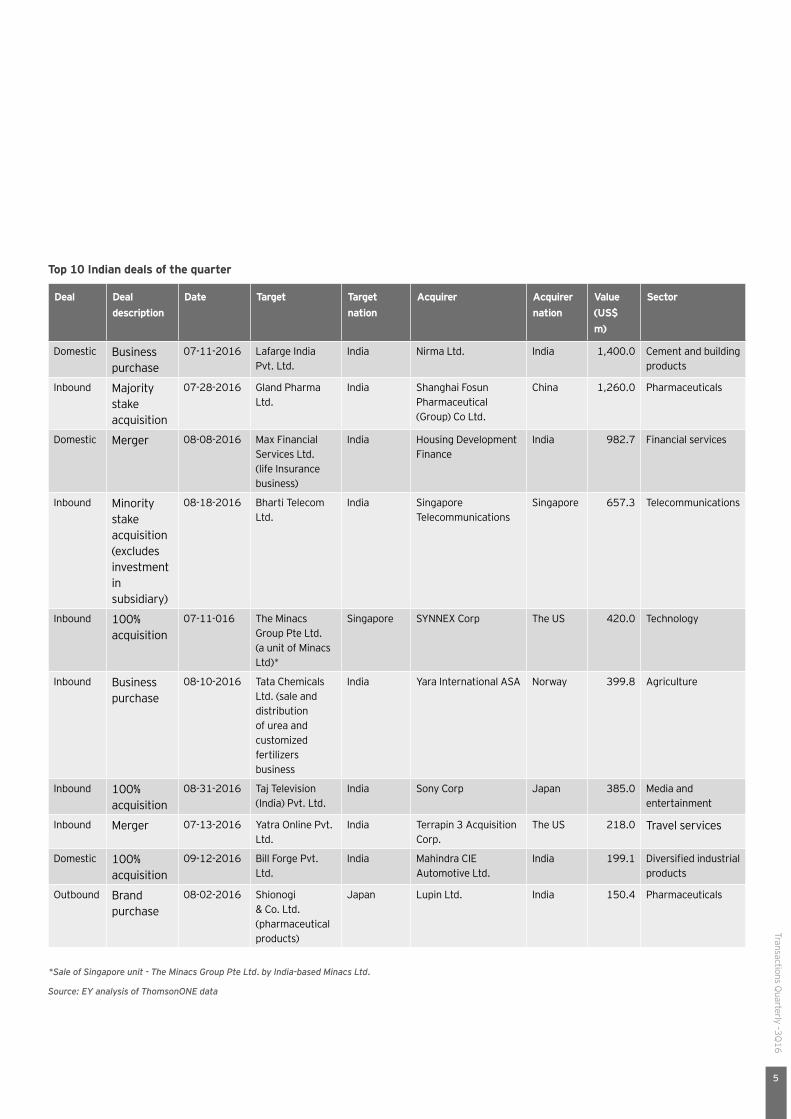
The largest inbound deal, which was also the third largest deal during the quarter, was the agreement to acquire an 86% stake in Gland Pharma Limited by China-based Shanghai Fosun Pharmaceutical (Group) Co. Limited for up to US$1.26 billion. The transaction, when completed, will be one of the largest purchases of an Indian asset by a Chinese company. It will enable the buyer to its expand presence in the injectable medicines space.
From a sector perspective, financial services topped the list with deals worth US$4.7 billion, followed by pharmaceuticals with US$1.5 billion. In terms of volume, financial services led with 28 deals, closely followed by the technology sector, which recorded 26 deals.
strategic acquisition was the US$1.4 billion agreement to acquire the India cement business of LafargeHolcim by Nirma Limited.
Cross-border activity moderated during 3Q16, recording 73 deals as compared to 114 in the corresponding quarter last year. This reduction was due to lower inbound deal activity. On the value front, cross-border activity declined by 33% as compared to 3Q15. The decline in inbound deal activity is expected to be a temporary blip, resulting from delays in planned
Section 2: M&A highlights
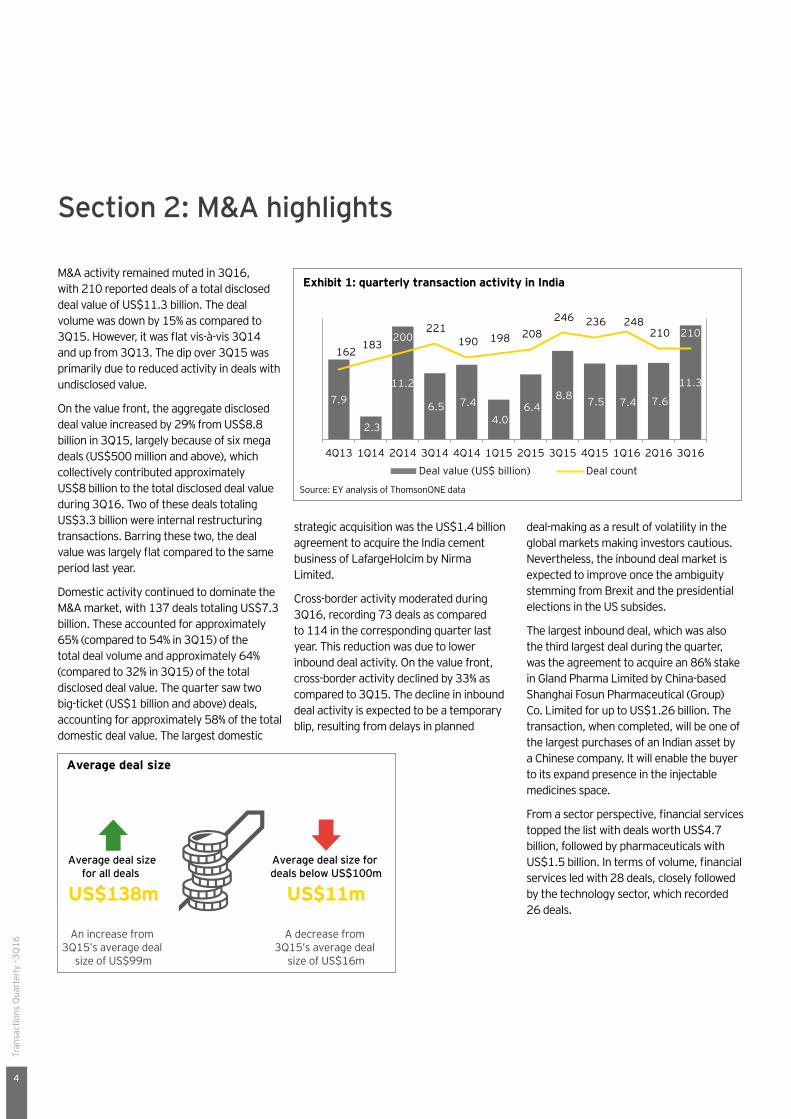
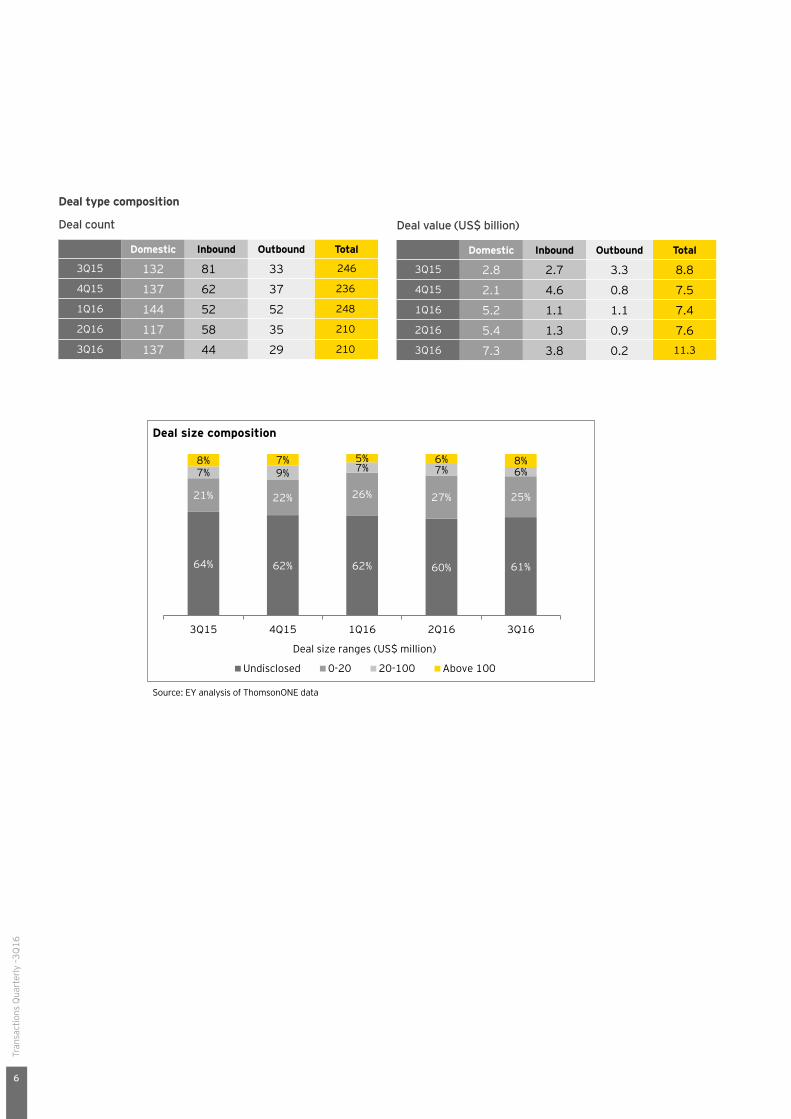
M&A activity remained muted in 3Q16, with 210 reported deals of a total disclosed deal value of US$11.3 billion. The deal volume was down by 15% as compared to 3Q15. However, it was flat vis-à-vis 3Q14 and up from 3Q13. The dip over 3Q15 was primarily due to reduced activity in deals with undisclosed value.
On the value front, the aggregate disclosed deal value increased by 29% from US$8.8 billion in 3Q15, largely because of six mega deals (US$500 million and above), which collectively contributed approximately US$8 billion to the total disclosed deal value during 3Q16. Two of these deals totaling US$3.3 billion were internal restructuring transactions. Barring these two, the deal value was largely flat compared to the same period last year.
Domestic activity continued to dominate the M&A market, with 137 deals totaling US$7.3 billion. These accounted for approximately 65% (compared to 54% in 3Q15) of the total deal volume and approximately 64% (compared to 32% in 3Q15) of the total disclosed deal value. The quarter saw two big-ticket (US$1 billion and above) deals, accounting for approximately 58% of the total domestic deal value. The largest domestic
Exhibit 1: quarterly transaction activity in India
Source: EY analysis of ThomsonONE data
7.9
2.3
11.2
6.5 7.4 4.0
6.4 8.8 7.5 7.4 7.6
11.3
162 183
200 221
190 198 208 246 236 248
210 210
4Q13 1Q14 2Q14 3Q14 4Q14 1Q15 2Q15 3Q15 4Q15 1Q16 2Q16 3Q16
Deal value (US$ billion) Deal count
Average deal size
Average deal size for all deals
US$138m
Average deal size for deals below US$100m
US$11m
An increase from 3Q15’s average deal
size of US$99m
A decrease from 3Q15’s average deal
size of US$16m
Transactions Quarterly –3Q
16
5
Deal Deal description
Date Target Target nation
Acquirer Acquirer nation
Value (US$ m)
Sector
Domestic Business purchase
07-11-2016 Lafarge India Pvt. Ltd.
India Nirma Ltd. India 1,400.0 Cement and building products
Inbound Majority stake acquisition
07-28-2016 Gland Pharma Ltd.
India Shanghai Fosun Pharmaceutical (Group) Co Ltd.
China 1,260.0 Pharmaceuticals
Domestic Merger 08-08-2016 Max Financial Services Ltd. (life Insurance business)
India Housing Development Finance
India 982.7 Financial services
Inbound Minority stake acquisition (excludes investment in subsidiary)
08-18-2016 Bharti Telecom Ltd.
India Singapore Telecommunications
Singapore 657.3 Telecommunications
Inbound 100% acquisition
07-11-016 The Minacs Group Pte Ltd. (a unit of Minacs Ltd)*
Singapore SYNNEX Corp The US 420.0 Technology
Inbound Business purchase
08-10-2016 Tata Chemicals Ltd. (sale and distribution of urea and customized fertilizers business
India Yara International ASA Norway 399.8 Agriculture
Inbound 100% acquisition
08-31-2016 Taj Television (India) Pvt. Ltd.
India Sony Corp Japan 385.0 Media and entertainment
Inbound Merger 07-13-2016 Yatra Online Pvt. Ltd.
India Terrapin 3 Acquisition Corp.
The US 218.0 Travel services
Domestic 100% acquisition
09-12-2016 Bill Forge Pvt. Ltd.
India Mahindra CIE Automotive Ltd.
India 199.1 Diversified industrial products
Outbound Brand purchase
08-02-2016 Shionogi & Co. Ltd. (pharmaceutical products)
Japan Lupin Ltd. India 150.4 Pharmaceuticals
Top 10 Indian deals of the quarter
Source: EY analysis of ThomsonONE data
*Sale of Singapore unit - The Minacs Group Pte Ltd. by India-based Minacs Ltd.
Tran
sact
ions
Qua
rter
ly –3
Q16
6
Domestic Inbound Outbound Total
3Q15 132 81 33 246
4Q15 137 62 37 236
1Q16 144 52 52 248
2Q16 117 58 35 210
3Q16 137 44 29 210
Domestic Inbound Outbound Total
3Q15 2.8 2.7 3.3 8.84Q15 2.1 4.6 0.8 7.51Q16 5.2 1.1 1.1 7.42Q16 5.4 1.3 0.9 7.63Q16 7.3 3.8 0.2 11.3
Deal type composition
Deal count Deal value (US$ billion)
Deal size composition
Source: EY analysis of ThomsonONE data
64% 62% 62% 60% 61%
21% 22% 26% 27% 25%
7% 9% 7% 7% 6%8% 7% 5% 6% 8%
3Q15 4Q15 1Q16 2Q16 3Q16
Deal size ranges (US$ million)
Undisclosed 0-20 20-100 Above 100
Transactions Quarterly –3Q
16
7
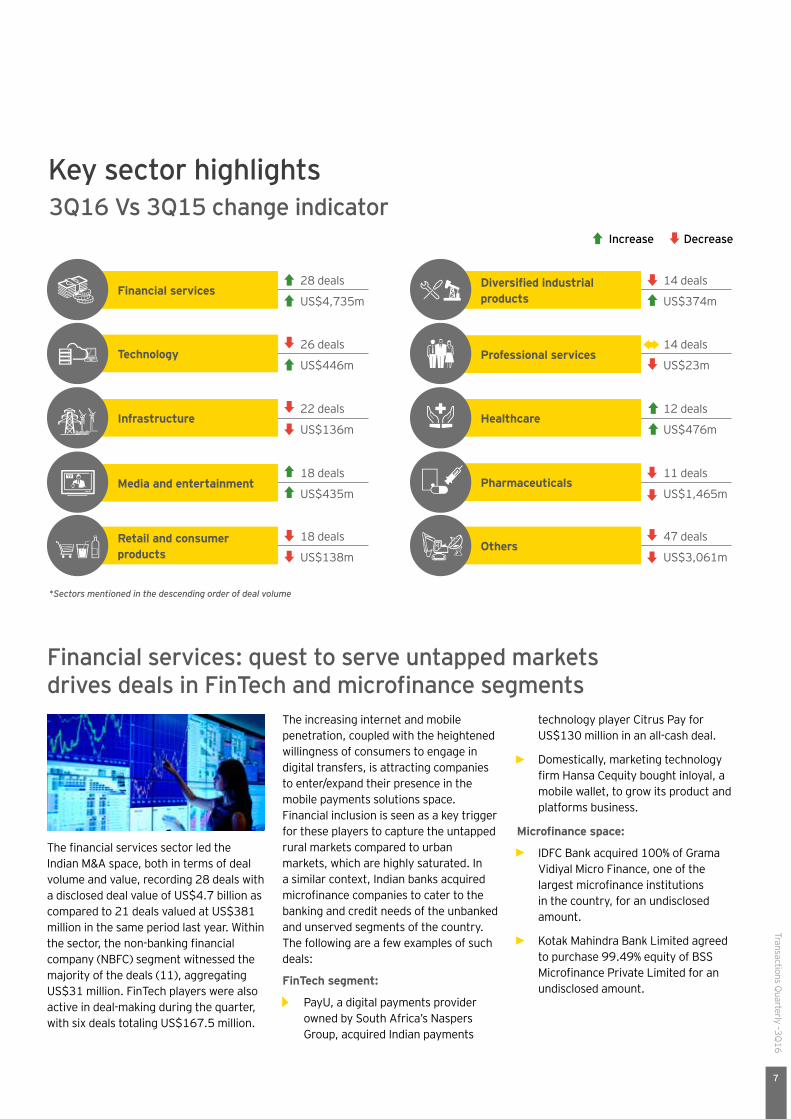
Key sector highlights
*Sectors mentioned in the descending order of deal volume
3Q16 Vs 3Q15 change indicator
Financial services
Retail and consumer products
28 deals
18 deals
US$4,735m
US$138m
Media and entertainment18 deals
US$435m
Infrastructure22 deals
US$136m
Technology26 deals
US$446m
Increase Decrease
Diversified industrial products
Professional services
Others
Healthcare
Pharmaceuticals
14 deals
14 deals
12 deals
11 deals
47 deals
US$374m
US$23m
US$476m
US$1,465m
US$3,061m
technology player Citrus Pay for US$130 million in an all-cash deal.
• Domestically, marketing technology firm Hansa Cequity bought inloyal, a mobile wallet, to grow its product and platforms business.
Microfinance space:
• IDFC Bank acquired 100% of Grama Vidiyal Micro Finance, one of the largest microfinance institutions in the country, for an undisclosed amount.
• Kotak Mahindra Bank Limited agreed to purchase 99.49% equity of BSS Microfinance Private Limited for an undisclosed amount.
The financial services sector led the Indian M&A space, both in terms of deal volume and value, recording 28 deals with a disclosed deal value of US$4.7 billion as compared to 21 deals valued at US$381 million in the same period last year. Within the sector, the non-banking financial company (NBFC) segment witnessed the majority of the deals (11), aggregating US$31 million. FinTech players were also active in deal-making during the quarter, with six deals totaling US$167.5 million.
Financial services: quest to serve untapped markets drives deals in FinTech and microfinance segments
The increasing internet and mobile penetration, coupled with the heightened willingness of consumers to engage in digital transfers, is attracting companies to enter/expand their presence in the mobile payments solutions space. Financial inclusion is seen as a key trigger for these players to capture the untapped rural markets compared to urban markets, which are highly saturated. In a similar context, Indian banks acquired microfinance companies to cater to the banking and credit needs of the unbanked and unserved segments of the country. The following are a few examples of such deals:
FinTech segment:
• PayU, a digital payments provider owned by South Africa’s Naspers Group, acquired Indian payments
Tran
sact
ions
Qua
rter
ly –3
Q16
8
The quarter also witnessed an increasing appetite of Indian players to invest in Israel to expand their traditional outsourcing businesses in Israel’s growing high-tech ecosystem. Transactions that exemplify this focus include the acquisition of an undisclosed minority stake in cloud monitoring solutions startup Cloudyn Software Limited by Infosys Limited for US$4 million as well as another undisclosed minority stake in cybersecurity start-up Intsights Cyber Intelligence Limited by Wipro Limited for US$1.5 million.
The technology sector remained one of the top three sectors during the quarter, recording 26 deals with a total disclosed value of US$446.2 million. Most of the deals were in the software and IT consulting segments, accounting for more than 75% of the deal volume.
Technology: emerging technologies drive momentumThe growing prominence of emerging technologies in business operations, leading to the transformation in traditional IT offerings, is driving transactions. Some examples of such deals are as follows:
• Nihilent Technologies Limited acquired ICRA Techno Analytics for US$10 million to expand its expertise in analytics, data engineering and business process management.
• US-based Boomtrain Inc. entered into an agreement to acquire Nudgespot, a Bengaluru-based artificial intelligence—driven messaging platform, for an undisclosed amount.
On the other hand, there were a few deals driven largely by sellers to divest their assets and procure funds to pare their debt. The following are a few examples:
• Singapore-based Sindicatum Captive Power agreed to acquire a 20 MW biomass plant of Orient Green Power Company for INR810 million (US$12.1 million).
• Greenko Energy Holdings signed an agreement to buy SunEdison’s Indian assets. As a part of the deal, Greenko will take over the outstanding debt of SunEdison in India. SunEdison, the world’s largest renewable energy company, has been looking to divest its global assets ever since it filed for bankruptcy protection in the US in April 2016.
The sector witnessed 22 deals with an aggregate disclosed deal value of US$135.6 million. Compared to the same quarter last year, the deal value declined by 86%, though the deal volume remained the same. This significant drop in value was due to a shift from mid-sized (US$100—US$500 million) to small-sized transactions (less than US$100 million).
Deal activity continued to be skewed toward the cleantech segment, where both indigenous and foreign players made acquisitions of small-sized
Infrastructure: cleantech retains its position with maximum deals in the infrastructure space
domestic players. With rapid growth in the infrastructure sector, large players are planning to scale up their capacities preferably through the inorganic route to avoid the time-consuming pre-development work accompanied by existing competitive bidding for the projects in the market. The following are the key examples of such deals:
• Sembcorp Green Infra Limited, a subsidiary of Singapore-based Sembcorp Industries, acquired a 74% stake in the special purpose vehicle Mulanur Renewable Energy Private Limited for INR1.58 billion.
• ReNew Power Ventures acquired two wind power project — Shruti Power Projects Private Limited and Helios Infratech Private Limited — in separate transactions.
Transactions Quarterly –3Q
16
9
Some such deals were as follows:
• Lupin acquired a portfolio of 21 generic brands of Japan-based Shionogi & Co. for US$150 million to strengthen its presence in the Japanese market.
• Piramal Enterprises Limited agreed to acquire 100% stake in Ash Stevens Inc., a US-based contract development and manufacturing organization (CDMO), for US$52.95 million.
• Granules Pharmaceuticals agreed to buy a 12.5% stake in USpharma, a development-stage pharmaceuticals firm for an undisclosed amount.
• Daily Delite India Private Limited, which runs three supermarkets in Delhi, acquired a fresh fruits and vegetables e-tailer Delhimandi.com for an undisclosed amount.
• Flipkart-owned Myntra bought its rival Jabong in a US$70 million all-cash deal, creating India’s largest online fashion destination.
• Titan Company Limited agreed to purchase a majority stake in online jewelry chain Caratlane.com for US$53 million.
The sector clocked 11 deals in 3Q16 compared to 15 deals in 3Q15, a decline of 27%. However, the disclosed deal value of US$1.5 billion in the current quarter remained almost flat compared to that in the corresponding period last year.
Indian pharma players continued to look for targets abroad with an aim to increase their customer base, gain access to distribution networks and acquire new products and technology. They are also selectively evaluating brand/portfolio opportunities in the domestic market to consolidate and gain scale in a difficult operating business environment.
The sector witnessed 18 deals with a disclosed deal value of US$138 million during the quarter, down substantially by 36% and 80%, respectively, against the same quarter in the previous year. Though the fall in value is substantial, an interesting thing to note is that
Pharmaceuticals: domestic pharma players keen on expanding overseas
Retail and consumer products: e-commerce continues to witness strong M&A activity
The US and Japan remain key target markets for Indian players. The US, being the world’s largest pharma market, provides a strong growth potential for cost-effective Indian generic drugs. Indian players are looking to consolidate in the US market to achieve scale, derive cost synergies and gain access to complex generics portfolios. Consolidation of the US distribution chains too is putting pressure on the Indian companies to achieve scale and remain relevant.
Significant investments could also be seen in Japan, driven by the increasing focus of the Japanese Government to promote the use of generic drugs in order to curb high medical expenses spent on rapidly aging population. The Japanese government aims to raise the share of generic drug prescriptions (among the drugs gone off-patent) to 80% between FY18 - FY20 from about 47% in September 2013.
the previous quarter consisted of one mega deal (US$500 million and above), constituting around 72% of the total deal value.
M&A in the retail sector was dominated by the e-retail space, as domestic offline retail firms tapped the online market to counter increasing competition from e-commerce companies. At the same time, existing online players acquired their rivals to further consolidate their position and derive synergies.
Some of these deals included the following:
Tran
sact
ions
Qua
rter
ly –3
Q16
10
Cross-border activity
Source: EY analysis of ThomsonONE data
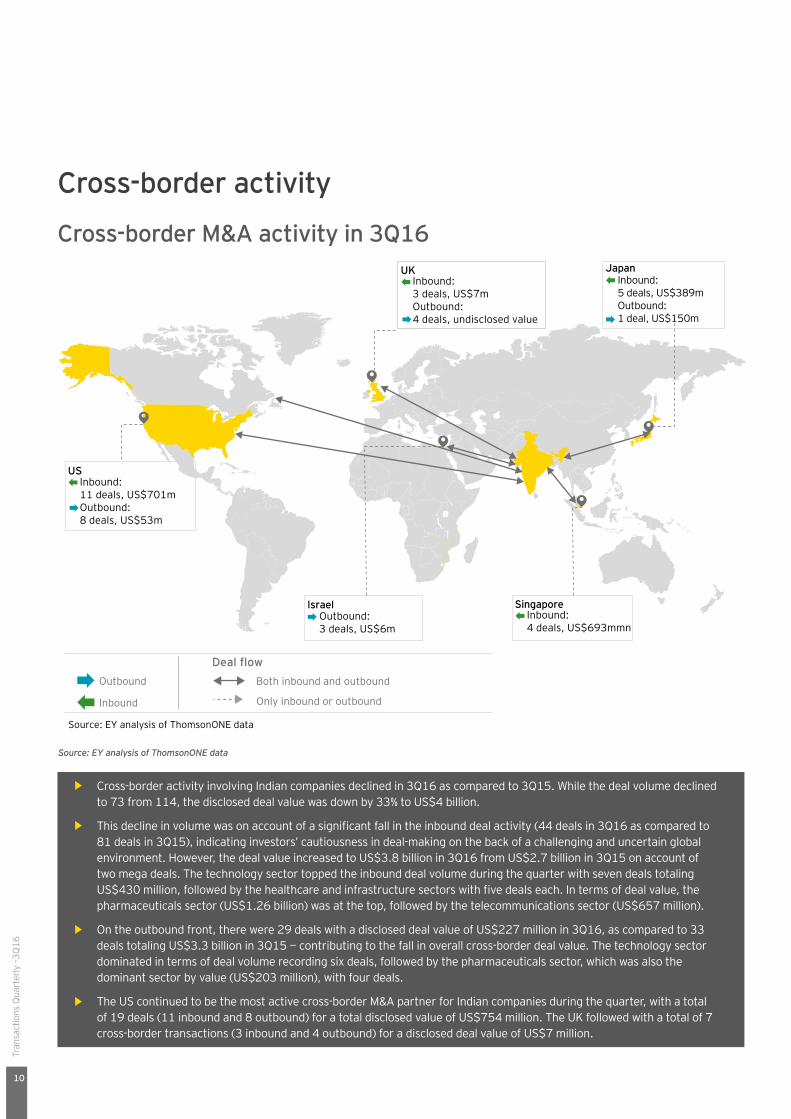
• Cross-border activity involving Indian companies declined in 3Q16 as compared to 3Q15. While the deal volume declined to 73 from 114, the disclosed deal value was down by 33% to US$4 billion.
• This decline in volume was on account of a significant fall in the inbound deal activity (44 deals in 3Q16 as compared to 81 deals in 3Q15), indicating investors’ cautiousness in deal-making on the back of a challenging and uncertain global environment. However, the deal value increased to US$3.8 billion in 3Q16 from US$2.7 billion in 3Q15 on account of two mega deals. The technology sector topped the inbound deal volume during the quarter with seven deals totaling US$430 million, followed by the healthcare and infrastructure sectors with five deals each. In terms of deal value, the pharmaceuticals sector (US$1.26 billion) was at the top, followed by the telecommunications sector (US$657 million).
• On the outbound front, there were 29 deals with a disclosed deal value of US$227 million in 3Q16, as compared to 33 deals totaling US$3.3 billion in 3Q15 — contributing to the fall in overall cross-border deal value. The technology sector dominated in terms of deal volume recording six deals, followed by the pharmaceuticals sector, which was also the dominant sector by value (US$203 million), with four deals.
• The US continued to be the most active cross-border M&A partner for Indian companies during the quarter, with a total of 19 deals (11 inbound and 8 outbound) for a total disclosed value of US$754 million. The UK followed with a total of 7 cross-border transactions (3 inbound and 4 outbound) for a disclosed deal value of US$7 million.
Cross-border M&A activity in 3Q16
Outbound
Inbound
Both inbound and outbound
Only inbound or outbound
Deal flow
USInbound: 11 deals, US$701mOutbound: 8 deals, US$53m
UKInbound: 3 deals, US$7mOutbound:4 deals, undisclosed value
SingaporeInbound: 4 deals, US$693mmn
IsraelOutbound: 3 deals, US$6m
JapanInbound: 5 deals, US$389mOutbound: 1 deal, US$150m
Source: EY analysis of ThomsonONE data
Transactions Quarterly –3Q
16
11
Global M&A activityGlobal M&A activity remained soft in 3Q16
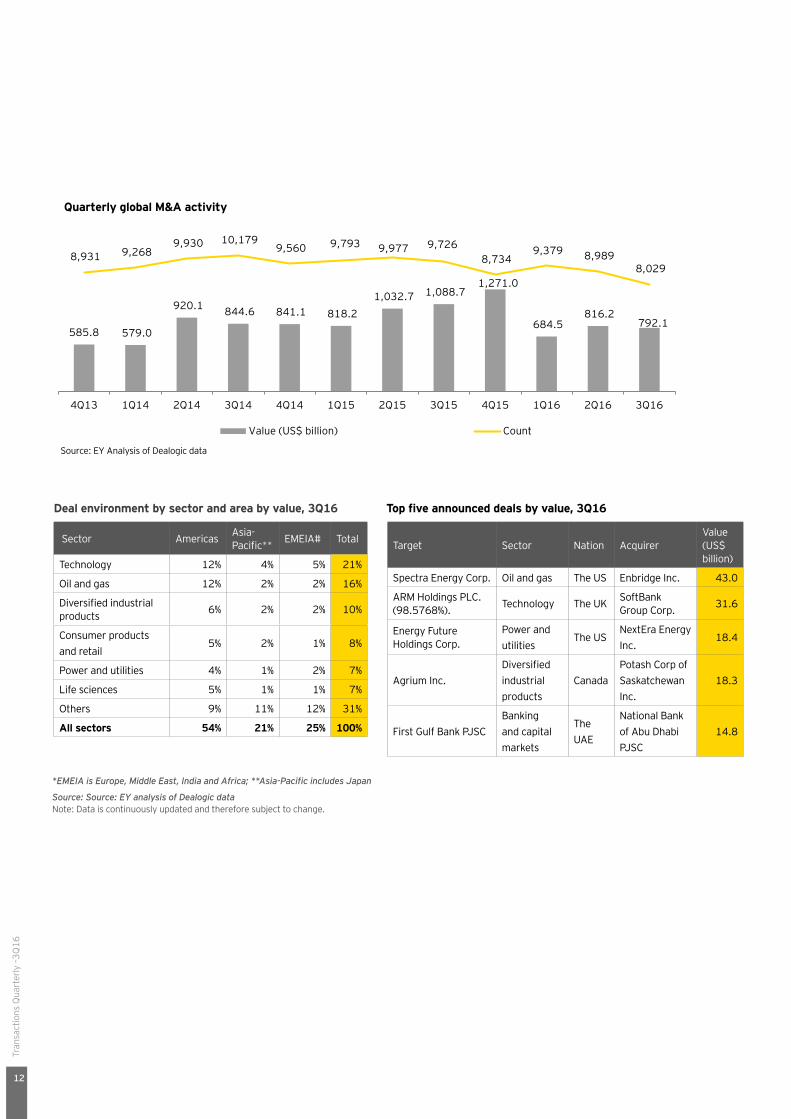
• The global M&A space remained quiet in 3Q16, recording 8,029 deals worth US$792 billion.
• The Americas led the deal activity in terms of value, while Asia-Pacific dominated in terms of deal volume.
• Low economic growth, disruptive technology and sector convergence are the factors fueling M&A activity in 2016.
Current state
• The global M&A deal value in 3Q16 was down 27% (YoY) against 3Q15, flat against 3Q14 and up 12% against 3Q13. The main reason for the dip compared to 3Q15 was fewer megadeals (over US$10 billion) in 3Q16. On the volume front, 3Q16 registered 8,029 deals as compared to 8,384 deals in the same period in 2015.
• The Americas emerged as the most attractive region in terms of deal value in 3Q16, attracting deals valued at US$426 billion (54% of the global total), followed by EMEIA at US$196 billion (25%) and the Asia-Pacific (including Japan) at US$170 billion (21%). On the volume front, Asia-Pacific (including Japan) was the major contributor with 2,793 deals, followed by the Americas with 2,760 deals and EMEIA with 2,476 deals.
• China and Japan were the top acquiring Asian nations in 3Q16. China reached record levels of outbound deal volume, spending US$40 billion through 174 deals, driven by slow domestic growth and the Government’s efforts to support the global expansion plans of domestic companies. Similarly, shrinking domestic demand, an aging population and low cost of borrowing
manage risk. Furthermore, factors such as low organic growth and disruptive forces, including digital, globalization and sector-blurring, may also encourage deal-making globally.
• There were signs of optimism in the UK despite the uncertainty caused by Brexit. The UK economy appears to be stabilizing from the post-Brexit panic better than expected, after economic indicators exhibited growth across the manufacturing sector, job market and consumer spending. Additionally, Brexit could open up M&A opportunities in the UK. Overseas buyers spurred by a weaker currency could evaluate opportunities among UK companies. Although the UK economy is witnessing some green shoots, doubts still remain for corporate dealmakers on whether the devaluation of the sterling will be enough to spark a continued foreign interest in British businesses.
• M&A activity in Asia-Pacific is likely to remain healthy in the long term. The biggest impact on the Asia-Pacific economies is expected to come from subdued global growth, which might cause investors to hold off any investment plans in the near term. However, the overall horizon of M&A activity in Asia-Pacific is expected to remain strong, primarily driven by a surge in M&A activity by Chinese and Japanese buyers.
• Technology should continue to lead the global M&A market. A combination of digital disruption and slow organic growth should drive M&A in the near future. Because the technology sector is witnessing major transformation, we expect M&As in the sector to continue for the foreseeable future. According to EY’s Digital Deal Economy Study, M&A, JVs and alliances can provide the fastest strategic route to digital transformation and growth.
have boosted overseas acquisitions by Japan, which clocked 149 deals worth US$47 billion in 3Q16.
• The technology sector saw the most M&A traction during the current quarter, with 1,888 deals totaling US$168 billion. It witnessed the second-largest deal of the quarter — the announced acquisition of the UK-based semiconductor firm ARM Holdings by Japan’s Softbank for US$32 billion. This is the largest UK technology targeted M&A deal on record and also the biggest deal in Softbank’s history.
• The largest deal of the quarter saw Enbridge Inc. and Spectra Energy Corp (Spectra) entering into a merger agreement to combine in a stock-for-stock transaction, valuing Spectra at approximately US$28 billion (US$43 billion including net debt). The deal would create the largest energy infrastructure company in North America and one of the largest companies globally with an enterprise value of C$165 billion (US$127 billion).
Outlook
• The global economy is stuck in a slow growth phase, coupled with weak growth for trade, investment, productivity and wages. The Organisation for Economic Cooperation and Development (OECD) expects global GDP growth to remain flat around 2.9% in 2016 (compared to 3.1% in 2015) with only a modest improvement to 3.2% projected in 2017. Sustained low and negative interest rates pose an additional challenge, causing significant distortions in financial markets.
• A tough economic environment can still be positive for M&A activity, with companies considering M&A as a preferred route to balance their focus on growth with a need to
Tran
sact
ions
Qua
rter
ly –3
Q16
12
Sector Americas Asia-Pacific** EMEIA# Total
Technology 12% 4% 5% 21%
Oil and gas 12% 2% 2% 16%
Diversified industrial products 6% 2% 2% 10%
Consumer products and retail
5% 2% 1% 8%
Power and utilities 4% 1% 2% 7%
Life sciences 5% 1% 1% 7%
Others 9% 11% 12% 31%
All sectors 54% 21% 25% 100%
Target Sector Nation AcquirerValue (US$ billion)
Spectra Energy Corp. Oil and gas The US Enbridge Inc. 43.0
ARM Holdings PLC. (98.5768%). Technology The UK SoftBank
Group Corp. 31.6
Energy Future Holdings Corp.
Power and utilities
The USNextEra Energy Inc.
18.4
Agrium Inc.Diversified industrial products
CanadaPotash Corp of Saskatchewan Inc.
18.3
First Gulf Bank PJSCBanking and capital markets
The UAE
National Bank of Abu Dhabi PJSC
14.8
Deal environment by sector and area by value, 3Q16 Top five announced deals by value, 3Q16
Source: Source: EY analysis of Dealogic data Note: Data is continuously updated and therefore subject to change.
*EMEIA is Europe, Middle East, India and Africa; **Asia-Pacific includes Japan
Quarterly global M&A activity
Source: EY Analysis of Dealogic data
585.8 579.0
920.1 844.6 841.1 818.2 1,032.7 1,088.7
1,271.0
684.5 816.2
792.1
8,931 9,268 9,930 10,179
9,560 9,793 9,977 9,726 8,734
9,379 8,989 8,029
4Q13 1Q14 2Q14 3Q14 4Q14 1Q15 2Q15 3Q15 4Q15 1Q16 2Q16 3Q16
Value (US$ billion) Count

Transactions Quarterly –3Q
16
13
M&A activity involving Indian companies, which reported marginal moderation in 3Q16, is expected to stay tepid through the remainder of 2016 because of a challenging global business environment. While India has not been impacted by Brexit till now, risks stemming from Brexit could spread as the consequences of that development become clearer. Other factors such as a slowing Chinese economy, apprehensions around the monetary policy in the US and low commodity prices are also making decision-making tough for global businesses, including Indian players.
Nonetheless, M&A prospects still appear positive in the domestic arena, as strong manufacturing activity and consumption levels should keep corporate earnings positive. Moreover, the RBI’s move to ease the monetary policy, on the back of a benign inflation environment, will likely boost private investments, thereby providing additional support to M&A activity. Segments such as retail, publishing and payment solutions will continue to see increased action as companies focus on mobile offerings amid increasing mobile internet penetration and consumers’ growing preference for mobile commerce. Furthermore, the focus of players from several sectors, including infrastructure and retail, on consolidating their domestic operations to gain synergy and economies of scale could add to the momentum behind M&A.
From an inbound perspective, global buyers are expected to adopt a wait-and-watch approach in the short term amid concerns around the persistently low-growth global environment and subdued commodity prices. On the other hand, Indian companies in sectors such as technology and pharmaceuticals will likely continue scouting for selective opportunities abroad, with an eye on technological enhancement and market expansion.
Outlook
M&A activity in India is expected to remain soft in the near term

Tran
sact
ions
Qua
rter
ly –3
Q16
14
© 2
015
EYG
M L
imite
d. A
ll R
ight
s Re
serv
ed. E
D06
17
Is selling the new buying?Find out why divestments are becoming as much of a focus for CEOs as acquisitions. ey.com/tas #BetterQuestions
Transactions Quarterly –3Q
16
15
Methodology
Transactions quarterly is based on EY’s analysis of ThomsonONE’s M&A data.
• Data used in this edition is for the period 1 January 2016 to 31 March 2016.
• Deals have been taken from ThomsonONE.com through the “Advanced M&A” search, where an Indian company was either a target, acquirer, target’s ultimate parent or acquirer’s ultimate parent. The terminated deals have been excluded.
• Deals have been taken where “deal status” as per ThomsonONE.com was either pending, partially complete,
completed, pending regulatory or unconditional.
• Private equity deals or deals with a financial sponsor have been excluded.
• Deal values have been taken as stated in ThomsonONE.com (accessed 4 April 2016) or as per the company press release in certain cases. All amounts are in US$ unless otherwise stated. The conversion rate of non-US$ deals are in accordance with ThomsonONE.com guidelines — the foreign exchange rate as on the deal announcement date.
• For our analysis, deals have been classified into:
• Sectors: based on target’s business
• Inbound, outbound and domestic: based on target/ acquirer/target’s ultimate parent and acquirer’s ultimate parent countries
• Deal size: based on announced deal values
• Average deal size has been calculated as total deal value divided by number of deals with disclosed value.
• The numbers have been rounded off unless otherwise indicated.
• For any further details on the deal inclusion criteria used by ThomsonONE.com, contact us at [email protected].
Ernst & Young LLPEY | Assurance | Tax | Transactions | AdvisoryAbout EYEY is a global leader in assurance, tax, transaction and advisory services. The insights and quality services we deliver help build trust and confidence in the capital markets and in economies the world over. We develop outstanding leaders who team to deliver on our promises to all of our stakeholders. In so doing, we play a critical role in building a better working world for our people, for our clients and for our communities.
EY refers to the global organization, and may refer to one or more, of the member firms of Ernst & Young Global Limited, each of which is a separate legal entity. Ernst & Young Global Limited, a UK company limited by guarantee, does not provide services to clients. For more information about our organization, please visit ey.com.
Ernst & Young LLP is one of the Indian client serving member firms of EYGM Limited. For more information about our organization, please visit www.ey.com/in.
Ernst & Young LLP is a Limited Liability Partnership, registered under the Limited Liability Partnership Act, 2008 in India, having its registered office at 22 Camac Street, 3rd Floor, Block C, Kolkata - 700016
© 2016 Ernst & Young LLP. Published in India. All Rights Reserved.
EYIN1611-106 ED None
This publication contains information in summary form and is therefore intended for general guidance only. It is not intended to be a substitute for detailed research or the exercise of professional judgment. Neither Ernst & Young LLP nor any other member of the global Ernst & Young organization can accept any responsibility for loss occasioned to any person acting or refraining from action as a result of any material in this publication. On any specific matter, reference should be made to the appropriate advisor.
Artwork by: YG
EY refers to the global organization, and/or one or more of the independent member firms of Ernst & Young Global Limited